Women at the tomb: Access to relic shrines in the early Middle Ages

1
Fire Regimes and Forest Reference Conditions for Prescribed Fire Management of Relic Mixed Conifer Forests in Guadalupe Mountains National Park, Texas
Final Report to the Joint Fire Science Program Prepared By Alan H. Taylor and John Sakulich Project # 01C-3-3-25 Local Needs Principal Investigators and contact information Richard Gatewood, Fire Ecologist, National Park Service, PO Box 129, Big Bend National Park, TX 79834, phone 915-477-2369, fax 915-477-2365, [email protected] Dr. Alan H. Taylor, Professor of Geography, The Pennsylvania State University, 302 Walker Building, University Park, PA 16802, phone 814 865-1509, fax 814 863-7943, [email protected] John Sakulich, Tree ring laboratory, Lamont Doherty Earth Observatory, Route 9W, Palisades, New York 10964, phone 845 365-8517, fax 845 365-8512, email, [email protected] John Lujan, Superintendent, Guadalupe Mountains National Park, 400 Pine Canyon Drive, Salt Flat, Texas 79847, phone 915 828-3251,[email protected] Paul Schmidtke, Fire Management Officer, Lincoln National Forest, 1101 New ork Ave., Alamogordo, NM 88310, phone 505 434-7244, [email protected] Fred Armstrong, Natural Resources Program Manager, National Park Service, Guadalupe Mountains National Park, 400 Pine Canyon Drive, Salt Flat, TX 79847, phone 915-828-3251 x 251, fax 915-828-3269, [email protected] Kathy Davis, Superintendent, Montezuma Castle National Monument, P. O. Box 219, Camp Verde, Arizona 86322 (928) 567-5276 [email protected] August 31, 2006

2
Key Findings Fire History
• Mixed conifer forests in Guadalupe Mountains National Park experienced frequent fire before the onset of livestock grazing. Median and mean return intervals for fires that scarred 10% or more of the fire scar samples were 10 years and 11.9 years (range 1-44 years), respectively. Median and mean fire return intervals for larger fires that scarred 25% or more of samples were longer at 22 years and 20.3 years (range 12-30 years), respectively. The median and mean point fire return intervals were 22 years and 27.1 years (range 9-87 years).
• The position of fire scars within tree rings was mainly in early (60.4%) and middle (25.4%) earlywood indicating that fires burned predominantly in the beginning of the growing season.
• Mixed conifer forests experienced a dramatic decrease in the occurrence and
extent of fire with the introduction of livestock in 1922. Fire frequency was similar during the pre-Euro American and settlement period.
• There was little spatial variation in fire frequency on forested sites. Fires burned with similar frequency on different slope aspects and in forests with different composition. This suggests that grass fuels were ubiquitous and the predominant source of fuel on forested sites throughout the study area.
• Fire extent varied among years and both small and widespread fires were recorded in the study area. Moreover, fire frequency and extent varied over time. Prior to 1800 fires were frequent and small but this pattern was not stable over time. After 1800 there were fewer small fires and fires became larger and more synchronized across the landscape.
• Fire severity was inferred from forest age structure and the size of trees when they
were first scarred. Forests where multi-aged and trees were often small (<10 cm dbh) in diameter when they were first scarred. There was no evidence of high severity fire during the reference period in the age structure of forests. Burns were either low or moderate in severity.
• During the last 65 years input of coarse woody fuel and tree mortality was associated with drought. Periods of high tree mortality occurred between 1948-1957 and 1998-2003.

3
• Tree mortality was not simply associated with drought. Tree mortality was only associated with drought when they persisted for multi-year periods.
Stand Structure
• Contemporary forest structure was different than the reconstructed reference forest (AD 1922) due mainly to fire exclusion after the onset of livestock grazing. Overall, the contemporary forest has more trees, more basal area, and trees with smaller quadratic mean diameters.
• Average density of the same species of trees >5 cm dbh in the contemporary forest (923 ha-1, range 0-1750 ha-1) was higher than in the reference forest (463 ha-1, range 0-1000 ha-1).
• Average basal area of the same species of trees >5 cm dbh in the contemporary forest (22.4 m2 ha-1, range 0-45.2 m2 ha-1) was higher than in the reference forest (14.3 m2 ha-1. range 0-36.5 m2 ha-1).
• Quadratic mean diameter of the same species of trees >5 cm dbh in the contemporary forest (15.7 cm, range 8.5-33.3 cm) was smaller than in the reference forest ( 17.2 cm, range 5-31 cm).
• Average structural diversity of the same species of trees >5 (mean Shannon’s Diversity Index) was higher in the reference than contemporary forests (1.5 vs. 1.4)
• Much of the forest change was caused by an increase in establishment of trees after the onset of fire exclusion in 1922, especially by Douglas-fir.
• Forest changes since 1922 altered the shape of the tree diameter distribution of pinyon pine, Southwestern white pine and Douglas-fir in the contemporary forest. There were more trees in smaller size classes. The shapes of the size-class distributions for ponderosa pine and Gambel oak were similar in the contemporary and reference period.
• Overall, forests where multi-aged and there was no evidence that even-aged forests were widespread in the study area prior to fire exclusion.
Implications for Management
• Quantitative data on reference forest structure and fire regimes prior to livestock grazing are sound information for developing restoration plans, management treatments, and evaluation metrics to judge success of fire and resource management programs for mixed conifer forests.
• Reference forest structure data indicate that restoration objectives should emphasize: 1) density and basal area reduction, mainly of small diameter trees. This should increase structural heterogeneity within stands and across the forest landscape.

4
• There was considerable spatial variability in reference forest structure within the study area. Management activities should emphasize variability in outcome across the landscape rather than achieving an average landscape condition.
• Reference fire regime data indicate that re-introducing frequent fire is essential for restoring the functional relationships between fire and forest structure that regulated mixed conifer forests prior to fire exclusion.
• Baring other constraints, burn prescriptions should include a mixture of small and large fires early in the growing season over a period of several decades to be consistent with historical burn patterns.

5
INTRODUCTION
A federal policy of suppressing wildland fire has been in place since 1905 in the United States (Pyne 1982). Removal of fire has caused considerable change in the structure, composition, and spatial patterns of fire-prone forests, including those in the Southwestern United States (Covington and Moore 1994 Kaufmann et al. 1998).
Fire-prone mixed conifer forests in Guadalupe Mountains National Park (GMNP) occupy a high elevation sky-island environment above the Chihuahua desert. Like other fire prone forests in the Southwest, they have undergone change (Ahlstrand 1980). However, these mixed conifer forests are isolated and have a different land use history making extrapolation about the timing and cause of forest change from studies elsewhere in the Southwest problematic. A critical need for knowledge of reference conditions on forest structure and fire regimes for mixed conifer forests was identified by fire and resource managers in developing the GMNP Fire Management Plan (USDI 2005). A thick understory of relatively shade tolerant tree species that are fire sensitive when young appear to be set to replace large diameter overstory Southwestern white pine, Douglas-fir, and ponderosa pine. The quantity and continuity of fuels in today’s forests represent a persistent threat of high severity fire. Three recent wildfires (1990, 1993, 1994) in mountaintop mixed conifer forests in GMNP burned >1000 ha of the sky island mixed conifer forest. Most of the area burned was high severity. The multi-sized nature of the contemporary forest overstory suggests that such high severity fires were historically unusual.
Quantitative reference conditions for fire regimes and forest structure are needed by fire and resource managers in GMNP to both evaluate how existing conditions deviate from those in the pre fire exclusion period and to develop process (fire) and structural objectives for restoration of highly altered mixed conifer forests. Research on fire regimes and forest structure in Southwestern mixed conifer forests suggests that frequent (e.g. 3-20 years) low intensity surface fires maintained relatively open forests with a fine-grained multi-aged forest structure (Ahlstrand 1980; Kaufman et al. 1998, 2000; Brown et al. 2001; Fule et al. 2003). Yet, these studies provide few quantitative reference data on forest structure (species composition, basal area, density) that could be used by managers as a foundation for restoration plans or for developing metrics to evaluate the success of management treatments. Quantitative data on reference fire regimes and forest structure for mixed conifer forests are needed by both GMNP fire and resource managers, and managers in the Lincoln National Forest, for development of cross-agency objectives for prescribed fire use on lands adjacent to GMNP. Knowledge of reference conditions is also essential for building a flexible fire program that can shift from restoration to maintenance burning as its goals are met. In GMNP, prescribed fire is currently the predominant tool used to achieve fire and resource management goals in the highly altered mixed conifer forest zone. This zone is designated as wilderness.
6
SUMMARY OF OBJECTIVES
The objectives of this project were to: 1) Quantify pre fire exclusion and contemporary forest structure (i.e. species
composition, basal area, density, size structure, age structure) in mixed conifer forests in GMNP;
2) Quantify fire regimes (frequency, return interval, size, severity, season) for the pre-
EuroAmerican (pre 1850), settlement (1850-1904), and fire exclusion periods (1922-present) in mixed conifer forests in GMNP at both stand and landscape scales;
3) Quantify spatial and temporal variation in fire regimes and forest structure with
respect to topography and forest composition; An additional objective was approved as a no-cost extension. This objective was to determine if large diameter fuels (dead standing and downed trees) in the contemporary forest were input to the system during an extended period of drought. SUMMARY OF MATERIALS AND METHODS
Study Area
Mixed conifer forests were studied in a 5000 ha area in Guadalupe Mountains National Park (GMNP). Mixed conifer forests occur between the elevations of 2200-2700 m on top of an incised plateau that rises 600 m from the surrounding Chihuahuan Desert. The Guadalupe Mountains are Permian-aged limestone, and soils are mostly shallow, well-drained loam to sandy loam that formed in residuum (Kittams, 1972). There were no perennial streams in the study area but ephemeral streambeds may have acted as fuel breaks and impeded the spread of fire.
The climate is semi-arid with cool winters and hot summers. A 19-year average (1985-2003) of temperatures and precipitation collected at the 2,455 m elevation automated weather station near the Bowl, document average winter lows of -1.7 °C, average summer highs of 23.9 °C, and average annual precipitation of 45.0 cm (NPS, 2005). This precipitation record may actually be low because winter snow may sublimate or blow away before it melts into the unheated collector. Most precipitation (84%) falls from May to October during the Southwest monsoon. Lightning-ignitions peak in mid- to late summer, before the onset of monsoon showers (Ahlstrand, 1980).
Mixed conifer forests in the study area occupy a range of topographic settings and forest composition varies with slope aspect and position. The most xeric sites are not forested. Instead the vegetation is dominated by shrubs, stem succulents, leaf succulents, grasses, and forbs. Forests on south-facing slopes are dominated by ponderosa pine (Pinus ponderosa var. scorpulorum), alligator juniper (Juniperus deppeana var. deppeana), Gambel oak (Quercus gambelii), and pinyon pine (Pinus edulis). Cooler, more
7
mesic sites on north-facing slopes, at higher elevation, or on shaded lower slopes, are dominated by Douglas-fir (Psuedotsuga menziesii var. glauca) and Southwestern white pine (Pinus strobiformis) (Ahlstrand, 1980). Shrubs or small trees such as hophornbeam (Ostrya knowltonii), bigtooth maple (Acer grandidentatum), and serviceberry (Amelanchier utahensis) are common in the forest understory.
People have used lands in or near GMNP for at least 10,000 years (Fabry, 1988). Most recently, GMNP was occupied by the Mescalero Apache. The Mescalero Apache were subjugated in ca. 1870, and permanent European-American settlement at the base of the mountains occurred shortly thereafter. Use of the high-country for livestock grazing did not occur until the 1920s with the establishment of the Guadalupe Mountain Ranch and the installation of a water system. With permanent water, large herds of sheep and goats were grazed year round and grazing ceased when the area became a National Park in 1972 (Jameson, 1994; Fabry, 1988). Fire suppression was implemented when the area became a National Park. Several wildfires and prescribed fires have burned in the study area since establishment of GMNP. Since fires consume evidence (i.e., fire scars and trees) of past forest structure and fire regimes (Swetnam et al., 1999), recently burned areas were avoided for sampling.
Forest Structure and Composition
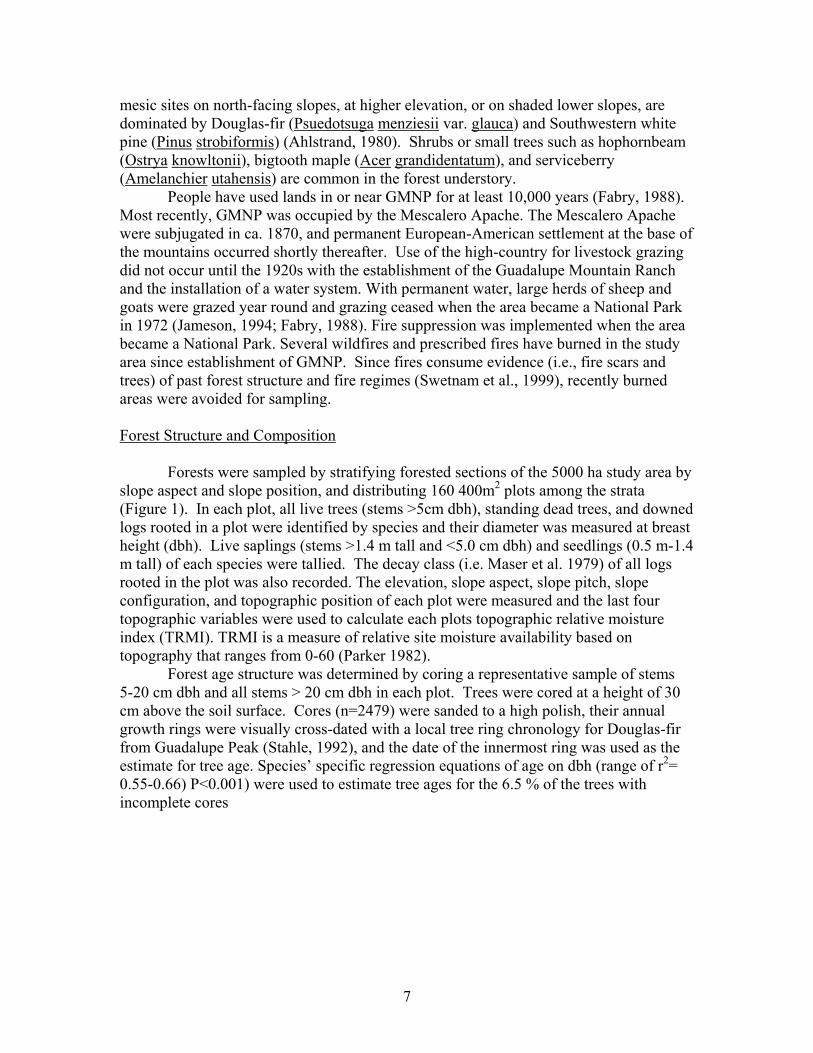
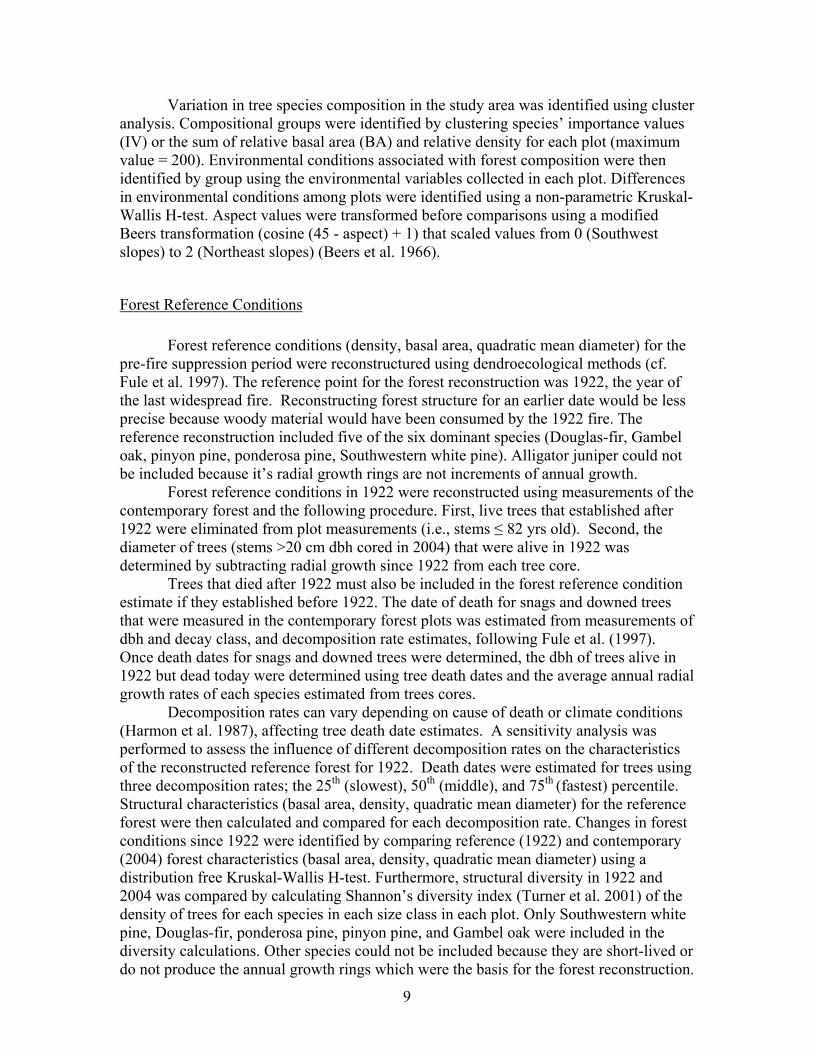
Forests were sampled by stratifying forested sections of the 5000 ha study area by
slope aspect and slope position, and distributing 160 400m2 plots among the strata (Figure 1). In each plot, all live trees (stems >5cm dbh), standing dead trees, and downed logs rooted in a plot were identified by species and their diameter was measured at breast height (dbh). Live saplings (stems >1.4 m tall and <5.0 cm dbh) and seedlings (0.5 m-1.4 m tall) of each species were tallied. The decay class (i.e. Maser et al. 1979) of all logs rooted in the plot was also recorded. The elevation, slope aspect, slope pitch, slope configuration, and topographic position of each plot were measured and the last four topographic variables were used to calculate each plots topographic relative moisture index (TRMI). TRMI is a measure of relative site moisture availability based on topography that ranges from 0-60 (Parker 1982).
Forest age structure was determined by coring a representative sample of stems 5-20 cm dbh and all stems > 20 cm dbh in each plot. Trees were cored at a height of 30 cm above the soil surface. Cores (n=2479) were sanded to a high polish, their annual growth rings were visually cross-dated with a local tree ring chronology for Douglas-fir from Guadalupe Peak (Stahle, 1992), and the date of the innermost ring was used as the estimate for tree age. Species’ specific regression equations of age on dbh (range of r2= 0.55-0.66) P<0.001) were used to estimate tree ages for the 6.5 % of the trees with incomplete cores
8
Figure 1. Location of sample points and forest compositional groups identified by cluster analysis of species importance values in mixed conifer forests, Guadalupe Mountains National Park. Tables 1 and 3 provide additional characteristics for each forest compositional group.
9
Variation in tree species composition in the study area was identified using cluster analysis. Compositional groups were identified by clustering species’ importance values (IV) or the sum of relative basal area (BA) and relative density for each plot (maximum value = 200). Environmental conditions associated with forest composition were then identified by group using the environmental variables collected in each plot. Differences in environmental conditions among plots were identified using a non-parametric Kruskal-Wallis H-test. Aspect values were transformed before comparisons using a modified Beers transformation (cosine (45 - aspect) + 1) that scaled values from 0 (Southwest slopes) to 2 (Northeast slopes) (Beers et al. 1966).
Forest Reference Conditions
Forest reference conditions (density, basal area, quadratic mean diameter) for the pre-fire suppression period were reconstructured using dendroecological methods (cf. Fule et al. 1997). The reference point for the forest reconstruction was 1922, the year of the last widespread fire. Reconstructing forest structure for an earlier date would be less precise because woody material would have been consumed by the 1922 fire. The reference reconstruction included five of the six dominant species (Douglas-fir, Gambel oak, pinyon pine, ponderosa pine, Southwestern white pine). Alligator juniper could not be included because it’s radial growth rings are not increments of annual growth.
Forest reference conditions in 1922 were reconstructed using measurements of the contemporary forest and the following procedure. First, live trees that established after 1922 were eliminated from plot measurements (i.e., stems ≤ 82 yrs old). Second, the diameter of trees (stems >20 cm dbh cored in 2004) that were alive in 1922 was determined by subtracting radial growth since 1922 from each tree core.
Trees that died after 1922 must also be included in the forest reference condition estimate if they established before 1922. The date of death for snags and downed trees that were measured in the contemporary forest plots was estimated from measurements of dbh and decay class, and decomposition rate estimates, following Fule et al. (1997). Once death dates for snags and downed trees were determined, the dbh of trees alive in 1922 but dead today were determined using tree death dates and the average annual radial growth rates of each species estimated from trees cores.
Decomposition rates can vary depending on cause of death or climate conditions (Harmon et al. 1987), affecting tree death date estimates. A sensitivity analysis was performed to assess the influence of different decomposition rates on the characteristics of the reconstructed reference forest for 1922. Death dates were estimated for trees using three decomposition rates; the 25th (slowest), 50th (middle), and 75th (fastest) percentile. Structural characteristics (basal area, density, quadratic mean diameter) for the reference forest were then calculated and compared for each decomposition rate. Changes in forest conditions since 1922 were identified by comparing reference (1922) and contemporary (2004) forest characteristics (basal area, density, quadratic mean diameter) using a distribution free Kruskal-Wallis H-test. Furthermore, structural diversity in 1922 and 2004 was compared by calculating Shannon’s diversity index (Turner et al. 2001) of the density of trees for each species in each size class in each plot. Only Southwestern white pine, Douglas-fir, ponderosa pine, pinyon pine, and Gambel oak were included in the diversity calculations. Other species could not be included because they are short-lived or do not produce the annual growth rings which were the basis for the forest reconstruction.
10
Fire regimes
Fire regime characteristics (i.e., frequency, fire return interval, severity, extent, seasonality) were reconstructed using fire dates from partial cross-sections removed from live (n=43)and dead (n=263) fire scarred trees. Fire scarred trees in the strata sampled with forest plots were located and collected to detect fire occurrence. Partial wood cross sections were removed from fire scarred trees using a chainsaw (Arno and Sneck 1977) and the calendar date each fire scar was formed was determined using standard dendrochronological techniques (Stokes and Smiley 1968).
Fire season-Season of burn was inferred from the relative position of each fire scar within an annual growth ring (Baisan and Swetnam 1990). Seasons were: 1) early (first one-third of earlywood); 2) middle (second one-third); 3) late (last one-third); 4) latewood (in latewood); 5) dormant (at ring boundary). In this spring-fore summer dry and summer wet climate, dormant season fires most likely represent spring burns that occurred before trees started growth for the year, rather than burns in the late fall after trees stopped growth for the year (Caprio and Swetnam 1995).
Spatial variation in fire return intervals - Spatial variation in fire return intervals (FRI) related to slope aspect, slope position, and forest composition was identified by comparing mean FRIs for different slope aspect, slope position, and forest compositional types. Mean composite fire intervals (CFI) and mean point fire intervals (PFI) were calculated for each slope aspect, slope position, and forest compositional group and compared using a distribution free Kruskal-Wallis H test.
Temporal variation in fire return intervals - Temporal variation in fire return intervals that may be related to land use changes was identified by comparing composite FRIs for three time periods: (1) pre-settlement (up to 1850), (2) settlement (1850-1922), and (3) grazing-fire exclusion (1922-2004). A composite fire record was used for temporal comparisons because composite records are more sensitive to changes in ignitions or burning conditions that might influence fire occurrence at landscape scales than are point fire return intervals (Dieterich 1980). Differences in the frequencies of fire between time periods were determined using a t-test.
Fire extent- Fire extent was assessed indirectly using the percentage samples that recorded a fire in a given year. This measure was used to infer the relative importance of small vs. widespread fires in the fire regime. Composite fire chronologies were developed for fires recorded by any sample, 10% or more, or 25% or more of the samples. Fire return interval statistics were then calculated for the different composite fire chronologies for the study area as a whole.
Fire Severity – Fire severity was assessed indirectly by analyzing the age structure of tree populations in plots in each forest compositional group that were identified by cluster analysis of species important value. Since fires burn with variable severity across a landscape, their impact on forest structure can vary from place to place, killing many trees in some stands and few trees in others. Stands that have experienced high severity fires that killed most or all trees are usually even-aged, while stands with a multi-aged structure develop under a regime of moderate severity fires that kill only portions of a stand. Forests that experience mainly low severity fires are also multi-aged, but they may have no distinct age classes related to fire events like those that experience moderate of high severity fire (Agee 1993). Past fire severity in each plot was inferred using the number of 20-year age-classes occupied by trees as an index of fire severity.
11
Presumably, if plots have one or a few age-classes they experienced more severe fire than plots with a larger number of occupied age-classes. The number of 20 yr age classes occupied by each species was tallied for each plot for both all age classes, and for age-classes during the pre-fire exclusion (>80 yrs).
The size of a surviving tree when it is first scarred by fire is an indicator of past fire intensity (Kilgore and Taylor, 1979). If surviving fire scarred trees were small in diameter when first scarred by a fire, then fires must have been low in intensity because they damaged the cambium but did not kill the tree (Agee, 1993). To assess the intensity of past fires we measured the distance from the pith to the juncture of the earliest fire scar on all stem cross-sections that included the pith year (n = 108). Radial distance was then used to estimate the diameter of the tree when it was first scarred by a fire. All fire-scarred cross-sections were extracted from stems at a height of 30-50 cm above the soil surface so measurements of diameter at the time of first fire scaring are below breast height.
Tree death and drought
The structure and composition of recently dead Douglas-fir, Southwestern white pine, and ponderosa pine trees (≥ 5cm DBH) trees was determined on four sites using the point-centered quarter method. Thirty points were sampled at each site along three to six parallel transects with points sampled every 25 m along each transect. Due to the irregular shape of the stands, transect length varied from 100 m to 275 m. All transects were laid parallel to the contour lines, and the first point for a transect was selected randomly. Recently dead trees included any standing stems and downed trees in Maser et al.’s (1979) decay class 1, 2, or 3. At each point, the distance, species, and DBH of the nearest dead Douglas-fir, Southwestern white pine, and ponderosa pine tree in each quadrant was recorded.
Dates of tree death
The year a tree died was determined by identifying the date of the last year of annual growth in partial wood cross-sections removed from each dead tree using a handsaw. If the outermost growth rings were visibly eroded due to weathering, insect galleries or decay, wood from the next nearest dead tree to the sample point was selected for sampling. The wood samples were sanded to high polish and the annual growth rings were visually cross-dated with the Douglas-fir tree-ring chronology from Guadalupe Peak (Stahle, 1992). The date of the last annual growth ring for each sample was used as the year of tree death. The accuracy of the death-date estimate using this method may be influenced by erosion of the outermost ring(s) on a wood sample or by the lack of production of annual growth rings prior to the year of death (Villalba and Veblen, 1998). To account for possible differences in the accuracy of tree-death dates among samples, we classified each sample into one of three categories based on the condition of the wood sample: 3 = visible evidence of ring erosion; 2 = no visible evidence of ring erosion (bark not always present); and 1 = no ring erosion (bark attached). Thus, reported death dates represent the earliest possible death date; actual death dates could be later.
12
Drought and tree mortality The relationship between drought and tree mortality was determined by
comparing tree death dates with the Palmer Drought Severity Index (PDSI). PDSI is a composite climatic index that includes immediate (same month) and lagged (previous month) precipitation and temperature effects on drought (Alley, 1984). Negative PDSI conditions represent drought while the opposite conditions prevail when PDSI is positive. We used PDSI values calculated for Texas Climate Division 5, which includes GMNP. Prolonged drought is often necessary to induce elevated rates of tree mortality, so we calculated contemporaneous (same year) and previous years’ averages (2, 3, 4 and 5 years) (backward moving average) for annual PDSI.
The association between tree-death dates and climate was identified in two ways. First, we calculated Pearson product-moment correlations (Zar, 1999) of the tree death time series with the time series of PDSI. Second, we compared the number of trees that died during periods with above normal, normal, or below normal PDSI. The three climate groups were identified by calculating Z-scores for each variable based on the 1940-2003 record of climate. This standardization procedure involves transforming variables that have different units to make them comparable (Gotelli and Ellison, 2004) and Z-scores ± 0.43 were then used as cut-offs for the three groups (Taylor, 1990). The number of trees dying in each of the three climatic periods was then compared using a Kruskal-Wallis H test. The correlation analysis and paired comparisons between the frequency of tree death dates and climate were conducted only for the period (1940-2003).
Errors in estimating tree-death dates due to ring erosion might influence associations between tree-death date frequency and climate. The actual date a tree died may have occurred later than the identified date. To address possible misinterpretations in the climate tree-death date association we also determined the association between climate, single, and two-year averages of death date frequency for the current and the following year.
SUMMARY OF RESULTS Forest Structure and Composition Five forest compositional groups were identified based on cluster analysis of species importance values (IV). The forest groups are segregated by aspect, percent slope, and potential soil moisture (Kruskal-Wallis H-test, P<0.05) (Table 1).
1) The Douglas-fir/Gambel oak group (Psme-Quga, n=8) is dominated by Douglas-fir and Gambel oak with lesser amounts of Southwestern white pine and ponderosa pine. Most stands in this group occur on middle and upper slope positions on north-facing slopes.
2) The Southwestern white pine/Douglas-fir/Gambel oak group (Pist-Psme-Quga, n=19) is dominated by Southwestern white pine with lesser but equal abundance of Douglas-fir and Gambel oak. Stands in this group occupy lower slopes and valley bottoms on northwest-facing slopes.
3) The ponderosa pine/alligator juniper/Douglas-fir group (Pipo-Jude-Psme, n=22) occupies upper slopes of north east-facing slopes and is strongly dominated by ponderosa pine; alligator juniper and Douglas-fir are important associates.
4) The alligator juniper/ponderosa pine/pinyon pine group (Jude-Psme-Pied, n=61) group is dominated by alligator juniper and Douglas-fir and ponderosa pine are
13
important associations. Stands in this group occupy middle and upper slope positions on north-facing slopes.
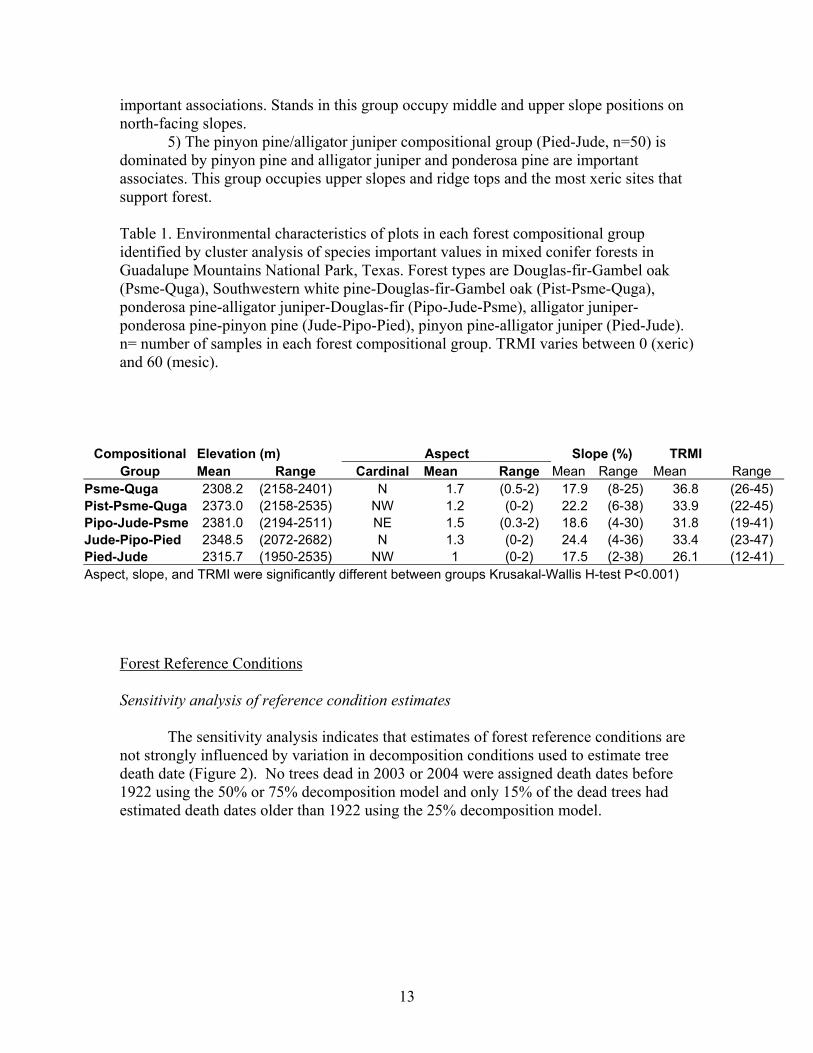
5) The pinyon pine/alligator juniper compositional group (Pied-Jude, n=50) is dominated by pinyon pine and alligator juniper and ponderosa pine are important associates. This group occupies upper slopes and ridge tops and the most xeric sites that support forest. Table 1. Environmental characteristics of plots in each forest compositional group identified by cluster analysis of species important values in mixed conifer forests in Guadalupe Mountains National Park, Texas. Forest types are Douglas-fir-Gambel oak (Psme-Quga), Southwestern white pine-Douglas-fir-Gambel oak (Pist-Psme-Quga), ponderosa pine-alligator juniper-Douglas-fir (Pipo-Jude-Psme), alligator juniper-ponderosa pine-pinyon pine (Jude-Pipo-Pied), pinyon pine-alligator juniper (Pied-Jude). n= number of samples in each forest compositional group. TRMI varies between 0 (xeric) and 60 (mesic).
Compositional Elevation (m) Aspect Slope (%) TRMI
Group Mean Range Cardinal Mean Range Mean Range Mean Range Psme-Quga 2308.2 (2158-2401) N 1.7 (0.5-2) 17.9 (8-25) 36.8 (26-45) Pist-Psme-Quga 2373.0 (2158-2535) NW 1.2 (0-2) 22.2 (6-38) 33.9 (22-45) Pipo-Jude-Psme 2381.0 (2194-2511) NE 1.5 (0.3-2) 18.6 (4-30) 31.8 (19-41) Jude-Pipo-Pied 2348.5 (2072-2682) N 1.3 (0-2) 24.4 (4-36) 33.4 (23-47) Pied-Jude 2315.7 (1950-2535) NW 1 (0-2) 17.5 (2-38) 26.1 (12-41) Aspect, slope, and TRMI were significantly different between groups Krusakal-Wallis H-test P<0.001)
Forest Reference Conditions Sensitivity analysis of reference condition estimates
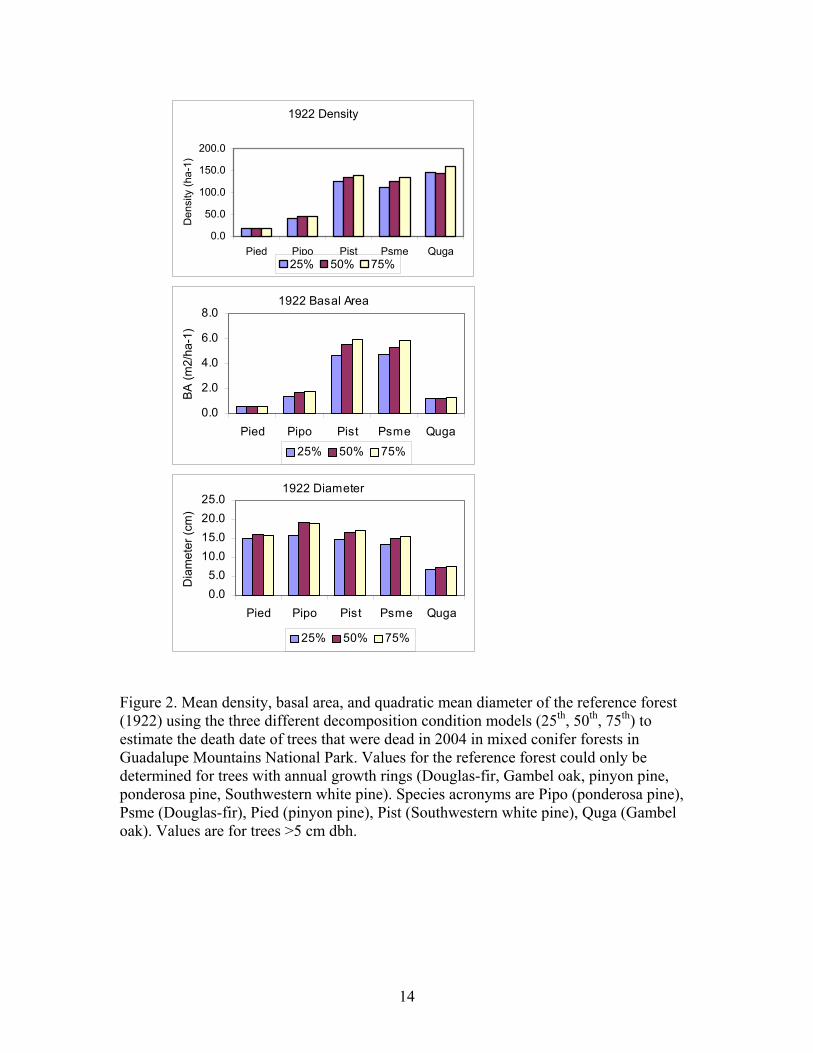
The sensitivity analysis indicates that estimates of forest reference conditions are not strongly influenced by variation in decomposition conditions used to estimate tree death date (Figure 2). No trees dead in 2003 or 2004 were assigned death dates before 1922 using the 50% or 75% decomposition model and only 15% of the dead trees had estimated death dates older than 1922 using the 25% decomposition model.
14
1922 Density
0.0
50.0
100.0
150.0
200.0
Pied Pipo Pist Psme Quga
Den
sity
(ha-
1)
25% 50% 75%
1922 Basal Area
0.0
2.0
4.0
6.0
8.0
Pied Pipo Pist Psme Quga
BA
(m2/
ha-1
)
25% 50% 75%
1922 Diameter
0.05.0
10.015.020.025.0
Pied Pipo Pist Psme Quga
Dia
met
er (c
m)
25% 50% 75%
Figure 2. Mean density, basal area, and quadratic mean diameter of the reference forest (1922) using the three different decomposition condition models (25th, 50th, 75th) to estimate the death date of trees that were dead in 2004 in mixed conifer forests in Guadalupe Mountains National Park. Values for the reference forest could only be determined for trees with annual growth rings (Douglas-fir, Gambel oak, pinyon pine, ponderosa pine, Southwestern white pine). Species acronyms are Pipo (ponderosa pine), Psme (Douglas-fir), Pied (pinyon pine), Pist (Southwestern white pine), Quga (Gambel oak). Values are for trees >5 cm dbh.
15
Differences in reference forest characteristics predicted by the different
decomposition condition models (25th, 50th, 75th) were smaller for tree density and tree diameter than for basal area. For tree density, the difference between the different decomposition rates was 56 trees ha-1 with the 25th percentile estimate 5% lower, and the 75th percentile estimate 7% higher than for the 50th percentile model. For diameter the difference was 1.8 cm. The 25th percentile estimate was 11% lower, and the 75th percentile estimate was 1% higher than for the 50th percentile. Finally, for basal area the difference was 3.0 m2 ha-1. The 25th percentile estimate was 13% lower, and the 75th percentile estimate was 7.7 % higher, than for the 50th percentile. Sensitivity analyses for individual species gave results similar in magnitude to the forest as a whole. Given the relatively small differences in reconstructed forest characteristics and the wide range of differences in decomposition rate percentiles and tree death dates (1901-2004), the reconstruction method is relatively insensitive to imprecision in the decomposition rate models. Consequently, only results from the 50th percentile decomposition model are reported to describe reference forest characteristics in GMNP. Comparison of reference and contemporary forest conditions Forest comparisons
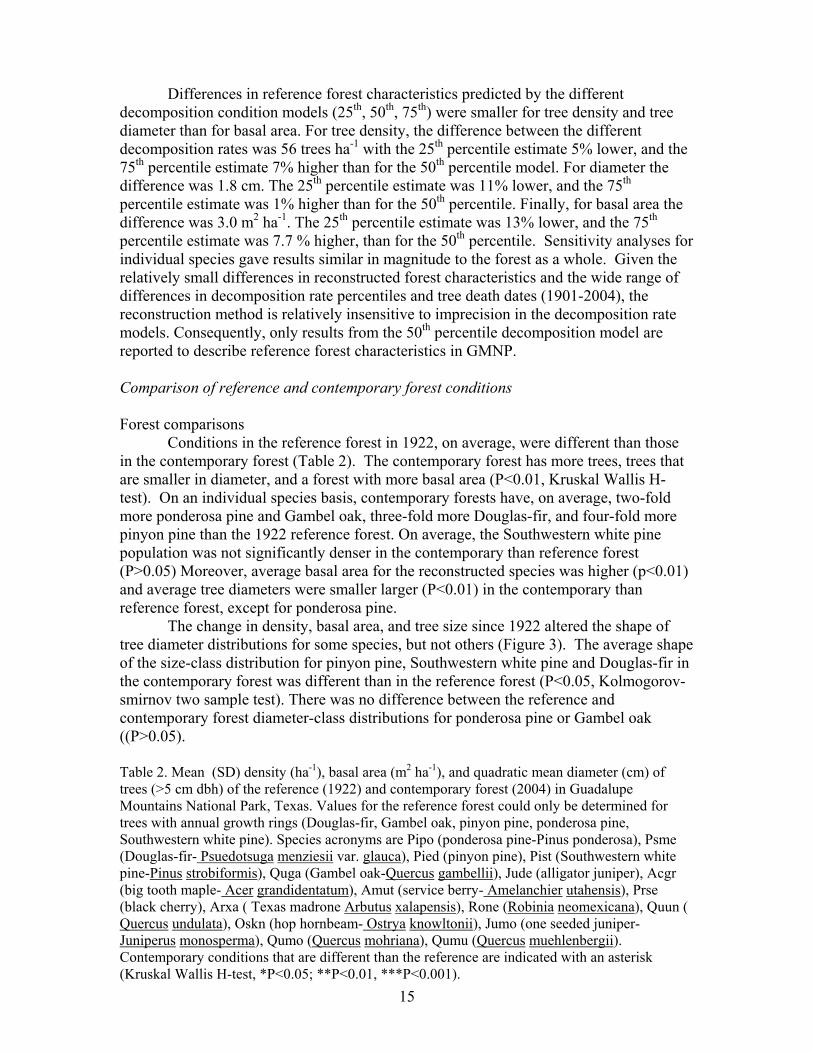
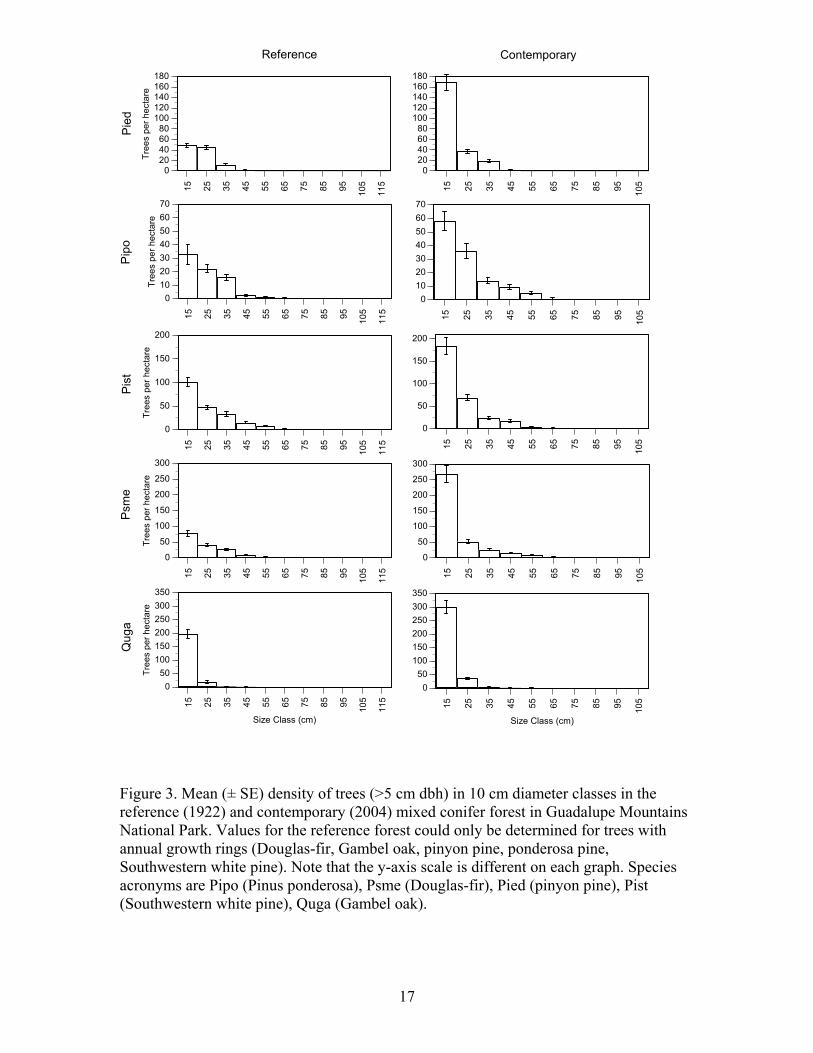
Conditions in the reference forest in 1922, on average, were different than those in the contemporary forest (Table 2). The contemporary forest has more trees, trees that are smaller in diameter, and a forest with more basal area (P<0.01, Kruskal Wallis H-test). On an individual species basis, contemporary forests have, on average, two-fold more ponderosa pine and Gambel oak, three-fold more Douglas-fir, and four-fold more pinyon pine than the 1922 reference forest. On average, the Southwestern white pine population was not significantly denser in the contemporary than reference forest (P>0.05) Moreover, average basal area for the reconstructed species was higher (p<0.01) and average tree diameters were smaller larger (P<0.01) in the contemporary than reference forest, except for ponderosa pine.
The change in density, basal area, and tree size since 1922 altered the shape of tree diameter distributions for some species, but not others (Figure 3). The average shape of the size-class distribution for pinyon pine, Southwestern white pine and Douglas-fir in the contemporary forest was different than in the reference forest (P<0.05, Kolmogorov-smirnov two sample test). There was no difference between the reference and contemporary forest diameter-class distributions for ponderosa pine or Gambel oak ((P>0.05). Table 2. Mean (SD) density (ha-1), basal area (m2 ha-1), and quadratic mean diameter (cm) of trees (>5 cm dbh) of the reference (1922) and contemporary forest (2004) in Guadalupe Mountains National Park, Texas. Values for the reference forest could only be determined for trees with annual growth rings (Douglas-fir, Gambel oak, pinyon pine, ponderosa pine, Southwestern white pine). Species acronyms are Pipo (ponderosa pine-Pinus ponderosa), Psme (Douglas-fir- Psuedotsuga menziesii var. glauca), Pied (pinyon pine), Pist (Southwestern white pine-Pinus strobiformis), Quga (Gambel oak-Quercus gambellii), Jude (alligator juniper), Acgr (big tooth maple- Acer grandidentatum), Amut (service berry- Amelanchier utahensis), Prse (black cherry), Arxa ( Texas madrone Arbutus xalapensis), Rone (Robinia neomexicana), Quun ( Quercus undulata), Oskn (hop hornbeam- Ostrya knowltonii), Jumo (one seeded juniper-Juniperus monosperma), Qumo (Quercus mohriana), Qumu (Quercus muehlenbergii). Contemporary conditions that are different than the reference are indicated with an asterisk (Kruskal Wallis H-test, *P<0.05; **P<0.01, ***P<0.001).
16
Density (# trees/ha) Basal area (m2/ha) Quadratic Mean Diameter (cm)
Mean SD Range Mean SD Range Mean SD Range Pipo
1922 43.9 81.3 0-750 1.7 2.7 0-13.6 21.4 10.4 5-57.5 2004 92.7*** 135.7 0-825 3.7 4.8 0-25.9 22.1 12.3 6.7-66.4
Psme 1922 125.3 148.7 775 5.3 6.6 0-36.5 21.2 9.6 5.2-65.7 2004 312.8*** 343.4 0-1750 8.8*** 9.0 0-45.2 17.5*** 8.6 5.3-51.6
Pied 1922 17.3 51.2 375 0.6 2.0 0-13.9 17.1 5.3 9.4-29.2 2004 67.2*** 158.7 0-850 1.3*** 3.3 0-17.3 11.8*** 5.3 5-30.6
Pist 1922 133.8 170.3 850 5.5 7.4 0-33.3 19.2 6.9 5.8-38.7 2004 204.5 275.4 0-1300 6.0*** 7.8 0-32.1 17.7*** 7.8 5.4-45
Quga 1922 142.5 191.4 1000 1.2 1.9 0-10.1 9.2 2.7 5.1-17.6 2004 245.5*** 278.2 0-1250 2.7*** 3.3 0-16.1 10.9*** 2.9 5.3-20.9
All Reconstructed Trees 1922 462.8 299.3 0-1000 14.3 10.6 0-36.5 17.2 5.2 5-31 2004 922.7*** 583.2 0-1750 22.4*** 11.5 0-45.2 15.7*** 4.3 8.5-33.3
Jude 1922 2004 49.1 78.8 0-350 2.4 4.6 0-21.8 21.3 10.8 5-55.6
Acgr 1922 2004 43.6 113.2 0-600 0.3 1.0 0-7.7 8.4 1.7 5.5-12
Amut 1922 2004 2.2 10.6 0-100 0.02 0.2 0-1.9 8.6 3.5 5.5-14.7
Prse 1922 2004 3.0 12.0 0-75 0.03 0.1 0-0.8 10.8 1.8 7.7-13.3
Arxa 1922 2004 0.8 5.9 0-50 0.01 0.1 0-0.8 14.5 4.4 10.1-18.8
Rone 1922 2004 0.5 3.4 0-25 0.003 0.02 0-0.2 8.8 0.9 8.1-9.8
Quun 1922 2004 1.3 11.5 0-125 0.005 0.04 0-0.5 6.9 0.2 6.8-7.1
Oskn 1922 2004 60.9 114.8 0-500 0.6 1.4 0-13 9.6 2.5 5.1-16.5
Jumo 1922 2004 21.4 129.6 0-1250 0.3 1.2 0-10.3 14.2 7.7 5-37.2
Qumu 1922 2004 10.3 38.1 0-350 0.2 0.8 0-8.1 14.5 4.4 8.3-26.2
Qumo 1922 2004 0.2 2.0 0-25 0.001 0.01 0-0.2 9.7 9.7
All Trees 1922 462.8 299.3 0-1000 14.3 10.6 0-36.5 17.2 5.2 5-31 2004 1115.8 577.6 200-2825 26.3 10.8 4.4-72.5 15.3 4.0 8.5-30.4
17
15 25 35 45 55 65 75 85 95 105
115
020406080
100120140160180
Tree
s pe
r hec
tare
Reference Contemporary
15 25 35 45 55 65 75 85 95 105
020406080
100120140160180
15 25 35 45 55 65 75 85 95 105
010203040506070
15 25 35 45 55 65 75 85 95 105
0
50
100
150
200
250
300
15 25 35 45 55 65 75 85 95 105
115
010203040506070
Tree
s pe
r hec
tare
15 25 35 45 55 65 75 85 95 105
115
0
50
100
150
200
Tree
s pe
r hec
tare
15 25 35 45 55 65 75 85 95 105
0
50
100
150
200
15 25 35 45 55 65 75 85 95 105
115
0
50
100
150
200
250
300
Tree
s pe
r hec
tare
15 25 35 45 55 65 75 85 95 105
115
050
100150200250300350
Tree
s pe
r hec
tare
Size Class (cm)
15 25 35 45 55 65 75 85 95 105
050
100150200250300350
Size Class (cm)
Pie
dP
ipo
Pis
tP
sme
Qug
a
Figure 3. Mean (± SE) density of trees (>5 cm dbh) in 10 cm diameter classes in the reference (1922) and contemporary (2004) mixed conifer forest in Guadalupe Mountains National Park. Values for the reference forest could only be determined for trees with annual growth rings (Douglas-fir, Gambel oak, pinyon pine, ponderosa pine, Southwestern white pine). Note that the y-axis scale is different on each graph. Species acronyms are Pipo (Pinus ponderosa), Psme (Douglas-fir), Pied (pinyon pine), Pist (Southwestern white pine), Quga (Gambel oak).
18
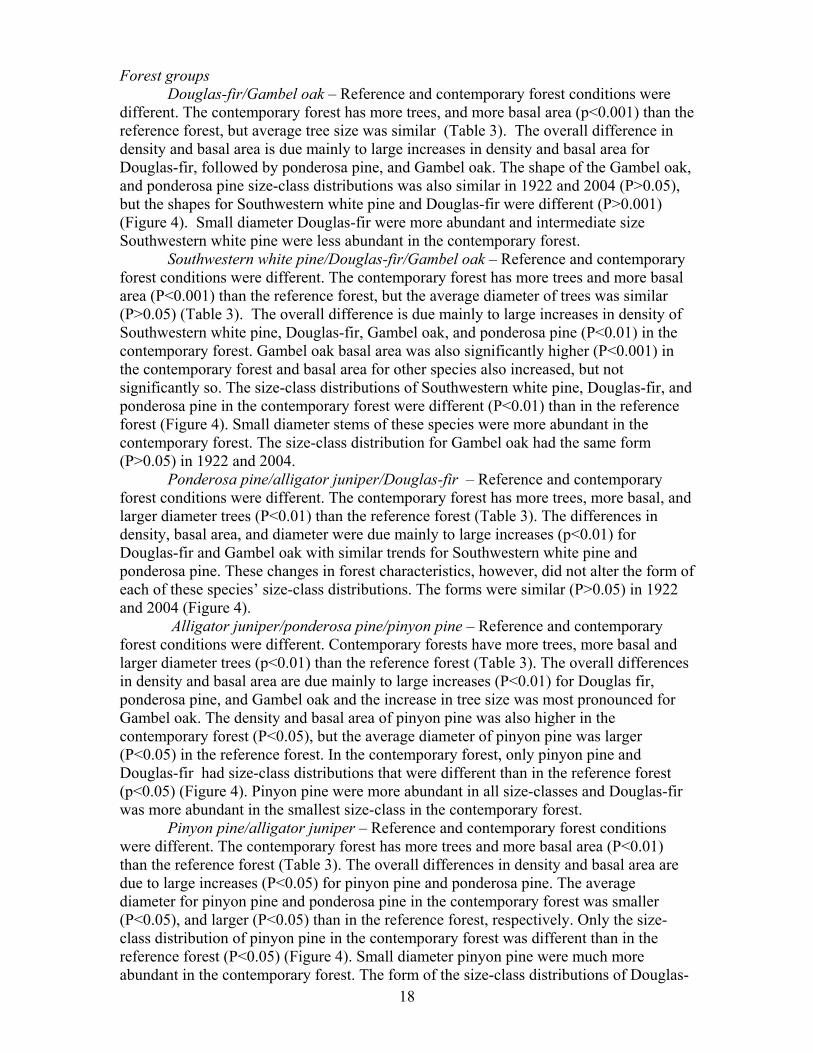
Forest groups
Douglas-fir/Gambel oak – Reference and contemporary forest conditions were different. The contemporary forest has more trees, and more basal area (p<0.001) than the reference forest, but average tree size was similar (Table 3). The overall difference in density and basal area is due mainly to large increases in density and basal area for Douglas-fir, followed by ponderosa pine, and Gambel oak. The shape of the Gambel oak, and ponderosa pine size-class distributions was also similar in 1922 and 2004 (P>0.05), but the shapes for Southwestern white pine and Douglas-fir were different (P>0.001) (Figure 4). Small diameter Douglas-fir were more abundant and intermediate size Southwestern white pine were less abundant in the contemporary forest.
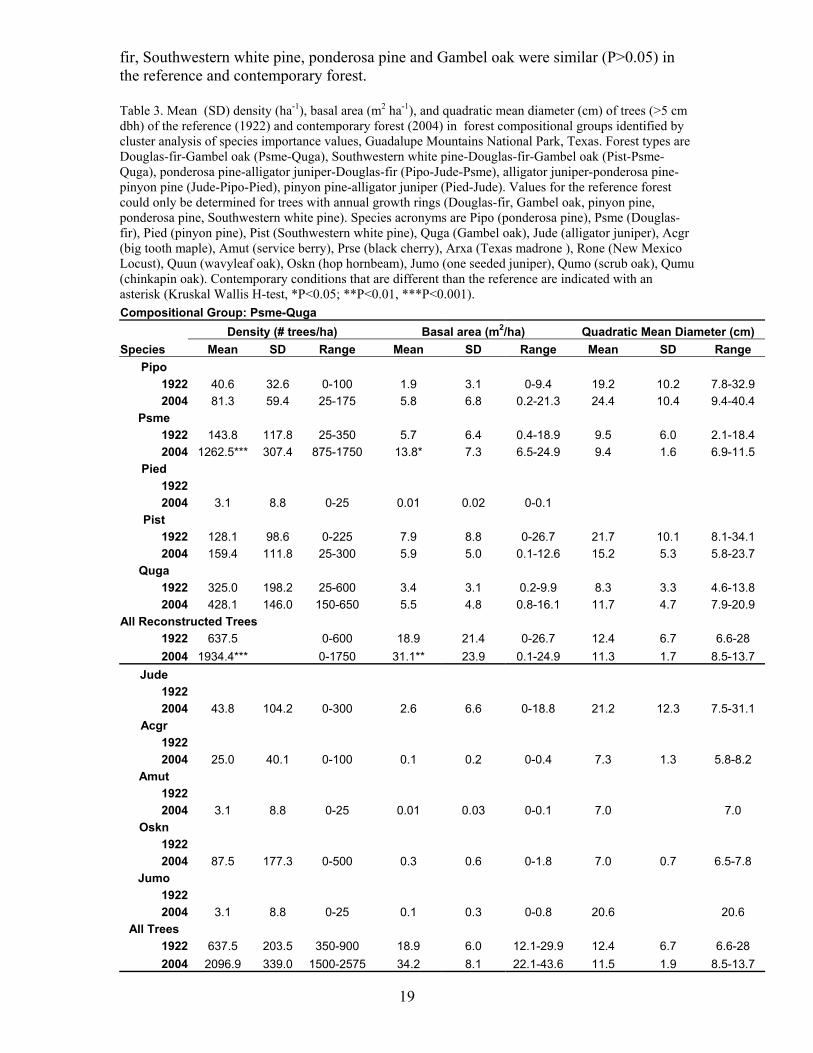
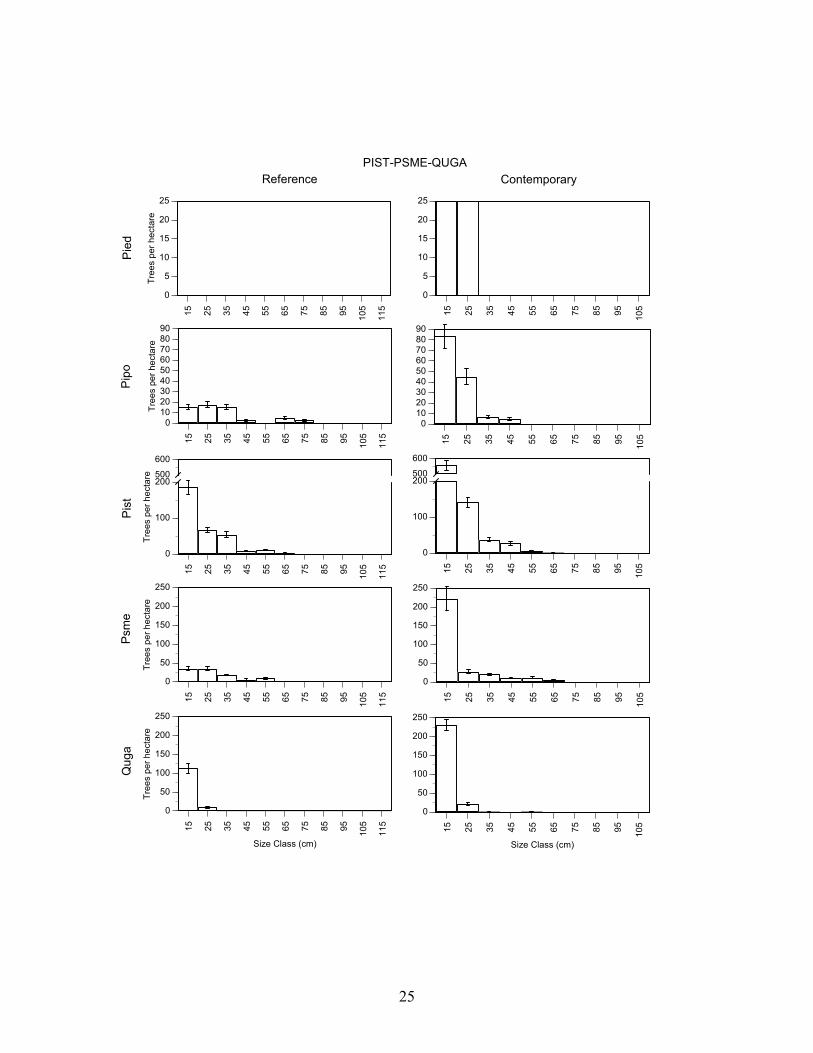
Southwestern white pine/Douglas-fir/Gambel oak – Reference and contemporary forest conditions were different. The contemporary forest has more trees and more basal area (P<0.001) than the reference forest, but the average diameter of trees was similar (P>0.05) (Table 3). The overall difference is due mainly to large increases in density of Southwestern white pine, Douglas-fir, Gambel oak, and ponderosa pine (P<0.01) in the contemporary forest. Gambel oak basal area was also significantly higher (P<0.001) in the contemporary forest and basal area for other species also increased, but not significantly so. The size-class distributions of Southwestern white pine, Douglas-fir, and ponderosa pine in the contemporary forest were different (P<0.01) than in the reference forest (Figure 4). Small diameter stems of these species were more abundant in the contemporary forest. The size-class distribution for Gambel oak had the same form (P>0.05) in 1922 and 2004.
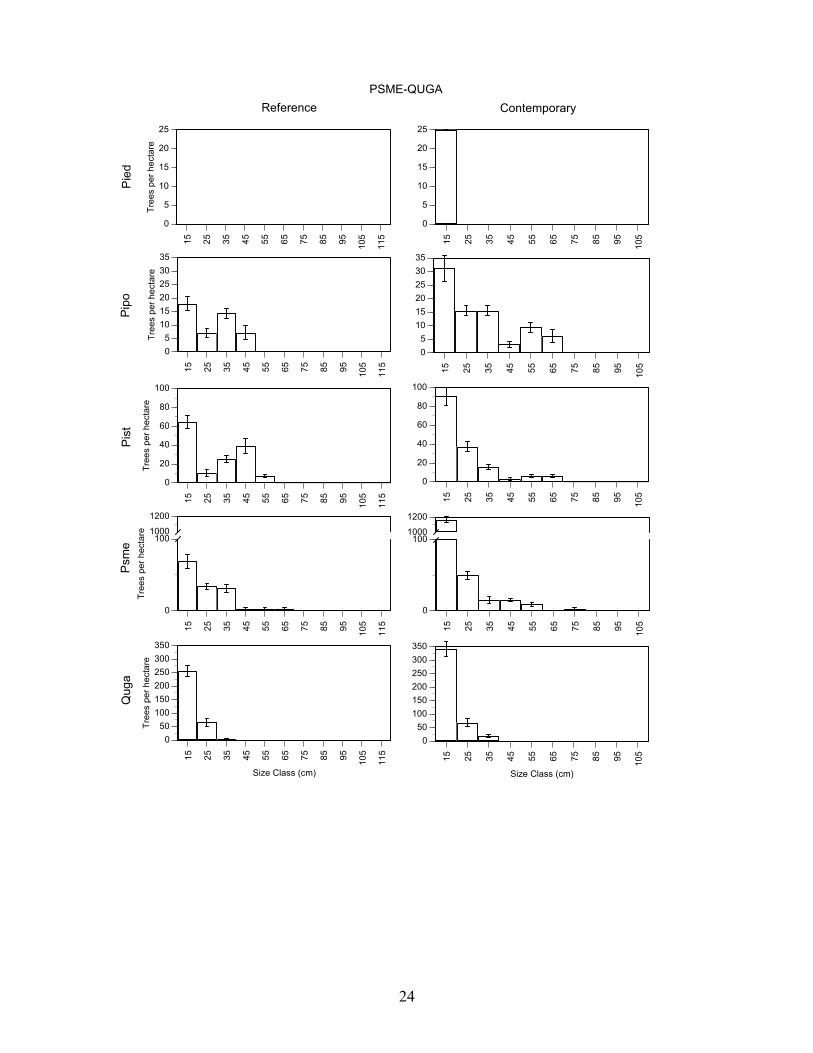
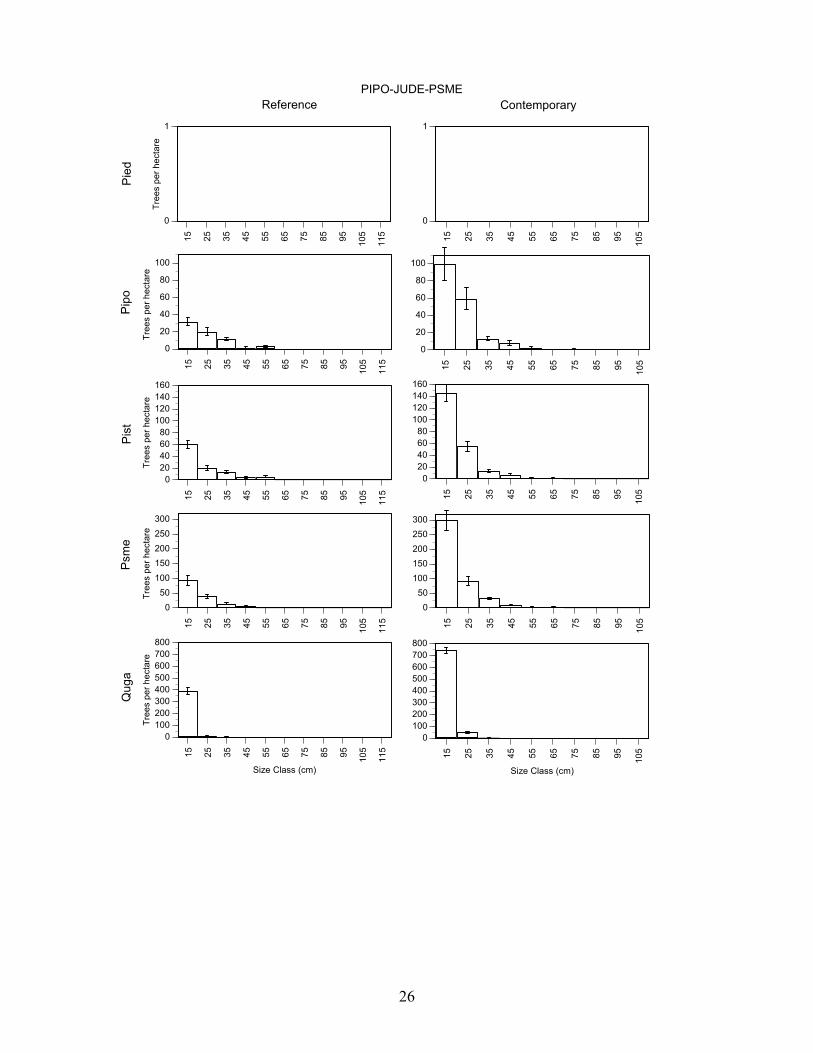
Ponderosa pine/alligator juniper/Douglas-fir – Reference and contemporary forest conditions were different. The contemporary forest has more trees, more basal, and larger diameter trees (P<0.01) than the reference forest (Table 3). The differences in density, basal area, and diameter were due mainly to large increases (p<0.01) for Douglas-fir and Gambel oak with similar trends for Southwestern white pine and ponderosa pine. These changes in forest characteristics, however, did not alter the form of each of these species’ size-class distributions. The forms were similar (P>0.05) in 1922 and 2004 (Figure 4).
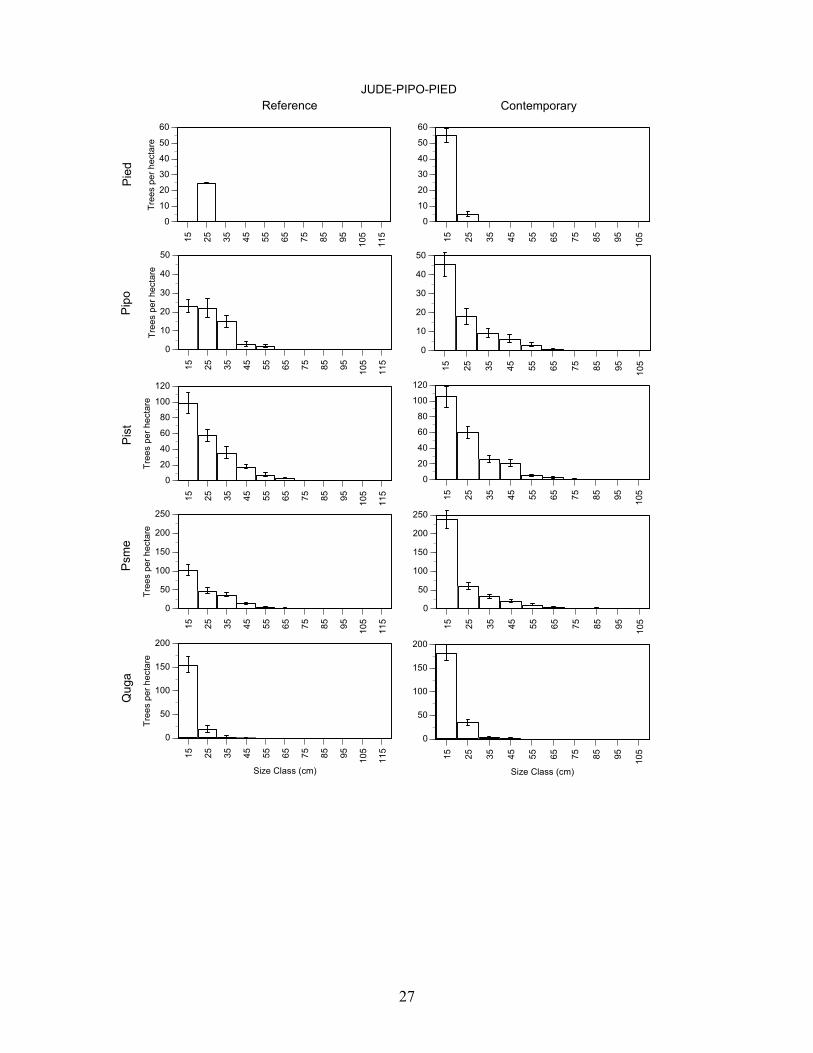
Alligator juniper/ponderosa pine/pinyon pine – Reference and contemporary forest conditions were different. Contemporary forests have more trees, more basal and larger diameter trees (p<0.01) than the reference forest (Table 3). The overall differences in density and basal area are due mainly to large increases (P<0.01) for Douglas fir, ponderosa pine, and Gambel oak and the increase in tree size was most pronounced for Gambel oak. The density and basal area of pinyon pine was also higher in the contemporary forest (P<0.05), but the average diameter of pinyon pine was larger (P<0.05) in the reference forest. In the contemporary forest, only pinyon pine and Douglas-fir had size-class distributions that were different than in the reference forest (p<0.05) (Figure 4). Pinyon pine were more abundant in all size-classes and Douglas-fir was more abundant in the smallest size-class in the contemporary forest.
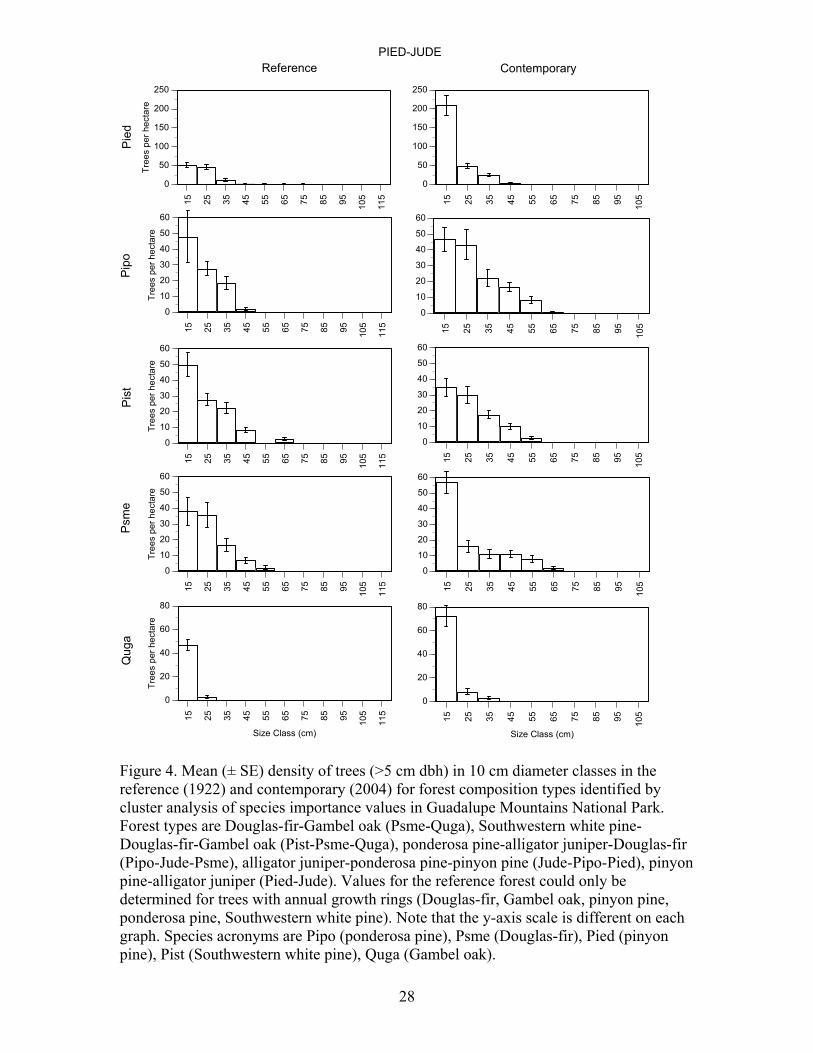
Pinyon pine/alligator juniper – Reference and contemporary forest conditions were different. The contemporary forest has more trees and more basal area (P<0.01) than the reference forest (Table 3). The overall differences in density and basal area are due to large increases (P<0.05) for pinyon pine and ponderosa pine. The average diameter for pinyon pine and ponderosa pine in the contemporary forest was smaller (P<0.05), and larger (P<0.05) than in the reference forest, respectively. Only the size-class distribution of pinyon pine in the contemporary forest was different than in the reference forest (P<0.05) (Figure 4). Small diameter pinyon pine were much more abundant in the contemporary forest. The form of the size-class distributions of Douglas-
19
fir, Southwestern white pine, ponderosa pine and Gambel oak were similar (P>0.05) in the reference and contemporary forest.
Table 3. Mean (SD) density (ha-1), basal area (m2 ha-1), and quadratic mean diameter (cm) of trees (>5 cm dbh) of the reference (1922) and contemporary forest (2004) in forest compositional groups identified by cluster analysis of species importance values, Guadalupe Mountains National Park, Texas. Forest types are Douglas-fir-Gambel oak (Psme-Quga), Southwestern white pine-Douglas-fir-Gambel oak (Pist-Psme-Quga), ponderosa pine-alligator juniper-Douglas-fir (Pipo-Jude-Psme), alligator juniper-ponderosa pine-pinyon pine (Jude-Pipo-Pied), pinyon pine-alligator juniper (Pied-Jude). Values for the reference forest could only be determined for trees with annual growth rings (Douglas-fir, Gambel oak, pinyon pine, ponderosa pine, Southwestern white pine). Species acronyms are Pipo (ponderosa pine), Psme (Douglas-fir), Pied (pinyon pine), Pist (Southwestern white pine), Quga (Gambel oak), Jude (alligator juniper), Acgr (big tooth maple), Amut (service berry), Prse (black cherry), Arxa (Texas madrone ), Rone (New Mexico Locust), Quun (wavyleaf oak), Oskn (hop hornbeam), Jumo (one seeded juniper), Qumo (scrub oak), Qumu (chinkapin oak). Contemporary conditions that are different than the reference are indicated with an asterisk (Kruskal Wallis H-test, *P<0.05; **P<0.01, ***P<0.001). Compositional Group: Psme-Quga Density (# trees/ha) Basal area (m2/ha) Quadratic Mean Diameter (cm) Species Mean SD Range Mean SD Range Mean SD Range
Pipo 1922 40.6 32.6 0-100 1.9 3.1 0-9.4 19.2 10.2 7.8-32.9 2004 81.3 59.4 25-175 5.8 6.8 0.2-21.3 24.4 10.4 9.4-40.4
Psme 1922 143.8 117.8 25-350 5.7 6.4 0.4-18.9 9.5 6.0 2.1-18.4 2004 1262.5*** 307.4 875-1750 13.8* 7.3 6.5-24.9 9.4 1.6 6.9-11.5
Pied 1922 2004 3.1 8.8 0-25 0.01 0.02 0-0.1
Pist 1922 128.1 98.6 0-225 7.9 8.8 0-26.7 21.7 10.1 8.1-34.1 2004 159.4 111.8 25-300 5.9 5.0 0.1-12.6 15.2 5.3 5.8-23.7
Quga 1922 325.0 198.2 25-600 3.4 3.1 0.2-9.9 8.3 3.3 4.6-13.8 2004 428.1 146.0 150-650 5.5 4.8 0.8-16.1 11.7 4.7 7.9-20.9
All Reconstructed Trees 1922 637.5 0-600 18.9 21.4 0-26.7 12.4 6.7 6.6-28 2004 1934.4*** 0-1750 31.1** 23.9 0.1-24.9 11.3 1.7 8.5-13.7
Jude 1922 2004 43.8 104.2 0-300 2.6 6.6 0-18.8 21.2 12.3 7.5-31.1
Acgr 1922 2004 25.0 40.1 0-100 0.1 0.2 0-0.4 7.3 1.3 5.8-8.2
Amut 1922 2004 3.1 8.8 0-25 0.01 0.03 0-0.1 7.0 7.0
Oskn 1922 2004 87.5 177.3 0-500 0.3 0.6 0-1.8 7.0 0.7 6.5-7.8
Jumo 1922 2004 3.1 8.8 0-25 0.1 0.3 0-0.8 20.6 20.6
All Trees 1922 637.5 203.5 350-900 18.9 6.0 12.1-29.9 12.4 6.7 6.6-28 2004 2096.9 339.0 1500-2575 34.2 8.1 22.1-43.6 11.5 1.9 8.5-13.7
20
Compositional Group: Pist-Psme-Quga Density (# trees/ha) Basal area (m2/ha) Quadratic Mean Diameter (cm) Species Mean SD Range Mean SD Range Mean SD Range
Pipo 1922 30.3 38.7 0-125 2.3 3.9 0-13.6 19.6 9.6 2.4-32.1 2004 110.5* 136.8 0-450 2.3 2.6 0-8.3 16.7 10.2 7.4-43.5
Psme 1922 107.9 52.7 50-225 6.9 5.8 0.9-24.2 18.2 11.4 2.6-45.2 2004 298.7** 274.2 25-950 8.8 5.2 0.1-19.2 17.2 9.7 5.3-46.5
Pied 1922 2004 2.6 11.5 0-50 0.05 0.2 0-0.9
Pist 1922 328.9 199.2 75-850 11.3 6.8 0.3-23 12.7 4.9 2.8-23.9 2004 768.4*** 309.6 375-1300 15.0 8.8 5.7-32.1 13.2 3.0 8.3-19.6
Quga 1922 119.7 102.3 0-350 1.1 1.5 0-5.7 7.2 3.4 1.3-14.8 2004 253.9*** 123.1 100-525 2.8*** 2.3 0.6-10.1 10.7** 2.0 8.2-15.5
All Reconstructed Trees 1922 586.8 0-850 21.7 18.0 0-24.2 12.7 3.6 7-20.8 2004 1431.6*** 0-1300 28.8** 18.8 0-32.1 13.4 2.1 9.6-18.7
Jude 1922 2004 10.5 20.9 0-75 0.5 1.9 0-8.3 16.8 15.5 6.4-43.8
Acgr 1922 2004 30.3 65.4 0-250 0.3 0.8 0-3.5 9.4 1.9 6.8-12
Amut 1922 2004 1.3 5.7 0-25 0.003 0.01 0-0.1 5.5 5.5
Prse 1922 2004 3.9 12.5 0-50 0.03 0.1 0-0.3 10.7 2.4 9-12.4
Oskn 1922 2004 92.1 119.3 0-325 0.7 1.0 0-3 9.8 2.0 6.9-13
Qumu 1922 2004 11.8 24.1 0-75 0.2 0.6 0-2.7 14.1 8.2 8.3-26.2
All Trees 1922 586.8 208.9 200-975 21.7 8.0 7.9-37.7 12.7 3.6 7-20.8 2004 1584.2 386.8 1050-2600 30.7 8.0 15.2-43.9 13.0 1.8 9.7-16.6
21
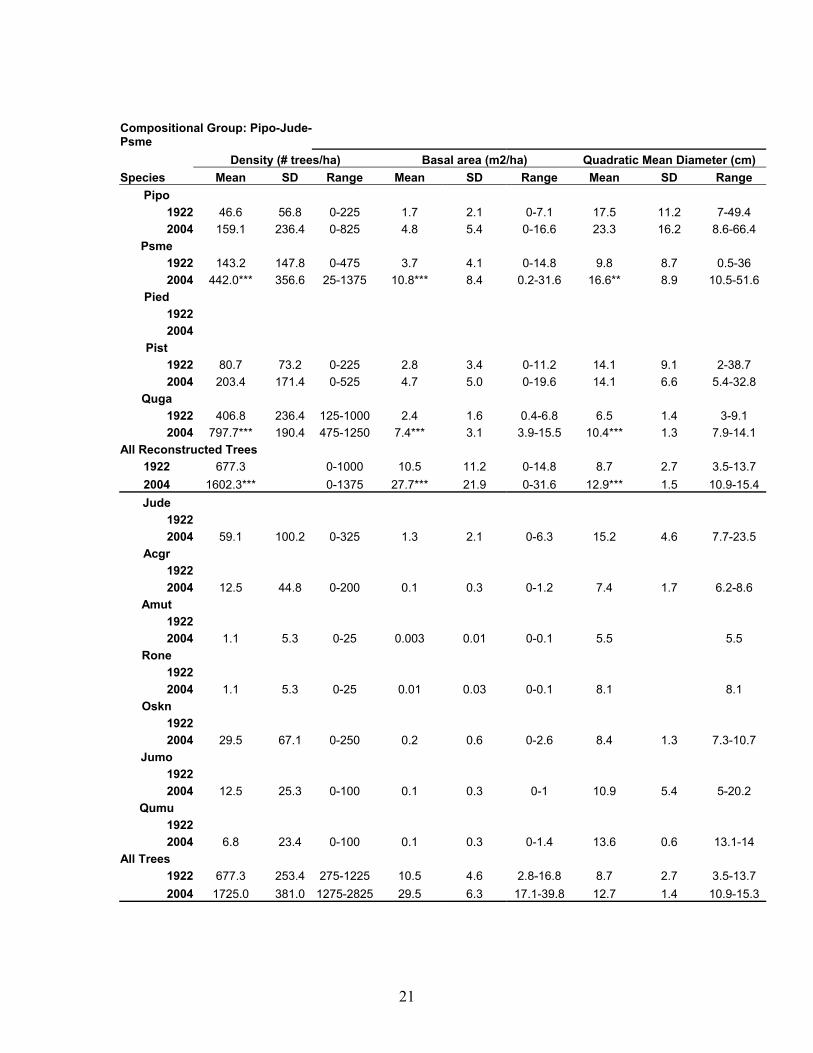
Compositional Group: Pipo-Jude-Psme Density (# trees/ha) Basal area (m2/ha) Quadratic Mean Diameter (cm) Species Mean SD Range Mean SD Range Mean SD Range
Pipo 1922 46.6 56.8 0-225 1.7 2.1 0-7.1 17.5 11.2 7-49.4 2004 159.1 236.4 0-825 4.8 5.4 0-16.6 23.3 16.2 8.6-66.4
Psme 1922 143.2 147.8 0-475 3.7 4.1 0-14.8 9.8 8.7 0.5-36 2004 442.0*** 356.6 25-1375 10.8*** 8.4 0.2-31.6 16.6** 8.9 10.5-51.6
Pied 1922 2004
Pist 1922 80.7 73.2 0-225 2.8 3.4 0-11.2 14.1 9.1 2-38.7 2004 203.4 171.4 0-525 4.7 5.0 0-19.6 14.1 6.6 5.4-32.8
Quga 1922 406.8 236.4 125-1000 2.4 1.6 0.4-6.8 6.5 1.4 3-9.1 2004 797.7*** 190.4 475-1250 7.4*** 3.1 3.9-15.5 10.4*** 1.3 7.9-14.1
All Reconstructed Trees 1922 677.3 0-1000 10.5 11.2 0-14.8 8.7 2.7 3.5-13.7 2004 1602.3*** 0-1375 27.7*** 21.9 0-31.6 12.9*** 1.5 10.9-15.4 Jude
1922 2004 59.1 100.2 0-325 1.3 2.1 0-6.3 15.2 4.6 7.7-23.5
Acgr 1922 2004 12.5 44.8 0-200 0.1 0.3 0-1.2 7.4 1.7 6.2-8.6
Amut 1922 2004 1.1 5.3 0-25 0.003 0.01 0-0.1 5.5 5.5
Rone 1922 2004 1.1 5.3 0-25 0.01 0.03 0-0.1 8.1 8.1
Oskn 1922 2004 29.5 67.1 0-250 0.2 0.6 0-2.6 8.4 1.3 7.3-10.7
Jumo 1922 2004 12.5 25.3 0-100 0.1 0.3 0-1 10.9 5.4 5-20.2
Qumu 1922 2004 6.8 23.4 0-100 0.1 0.3 0-1.4 13.6 0.6 13.1-14
All Trees 1922 677.3 253.4 275-1225 10.5 4.6 2.8-16.8 8.7 2.7 3.5-13.7 2004 1725.0 381.0 1275-2825 29.5 6.3 17.1-39.8 12.7 1.4 10.9-15.3
22
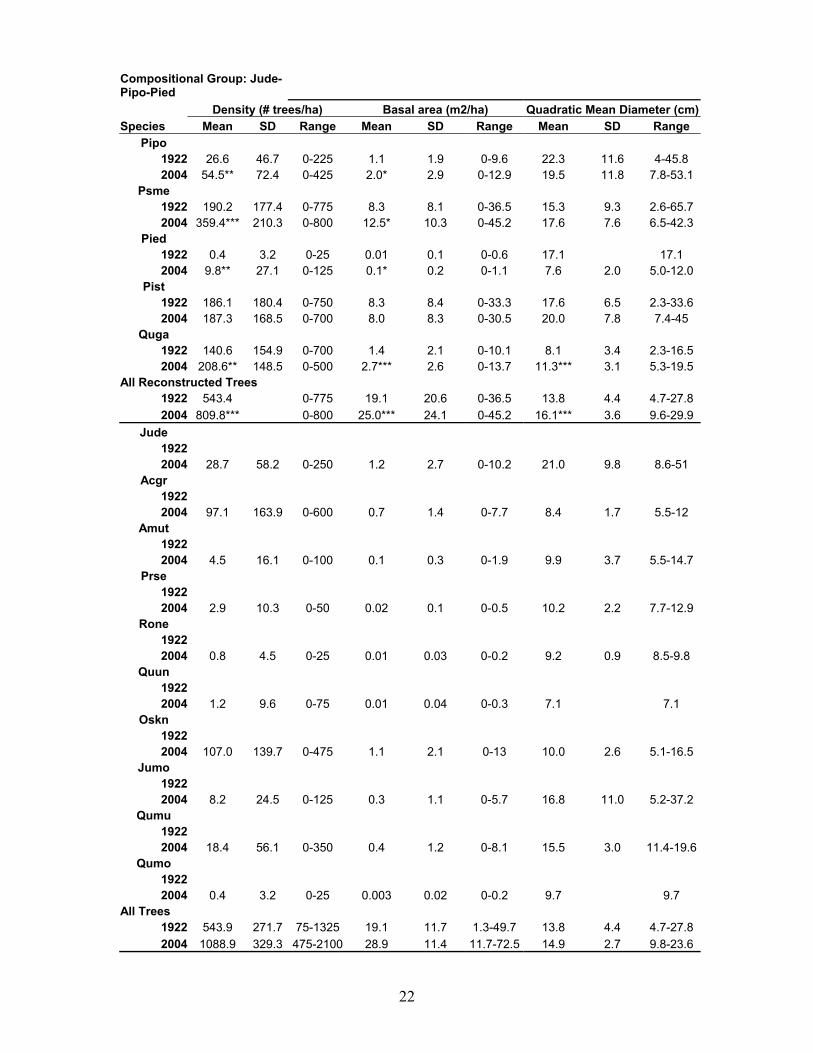
Compositional Group: Jude-Pipo-Pied Density (# trees/ha) Basal area (m2/ha) Quadratic Mean Diameter (cm)Species Mean SD Range Mean SD Range Mean SD Range
Pipo 1922 26.6 46.7 0-225 1.1 1.9 0-9.6 22.3 11.6 4-45.8 2004 54.5** 72.4 0-425 2.0* 2.9 0-12.9 19.5 11.8 7.8-53.1
Psme 1922 190.2 177.4 0-775 8.3 8.1 0-36.5 15.3 9.3 2.6-65.7 2004 359.4*** 210.3 0-800 12.5* 10.3 0-45.2 17.6 7.6 6.5-42.3
Pied 1922 0.4 3.2 0-25 0.01 0.1 0-0.6 17.1 17.1 2004 9.8** 27.1 0-125 0.1* 0.2 0-1.1 7.6 2.0 5.0-12.0
Pist 1922 186.1 180.4 0-750 8.3 8.4 0-33.3 17.6 6.5 2.3-33.6 2004 187.3 168.5 0-700 8.0 8.3 0-30.5 20.0 7.8 7.4-45
Quga 1922 140.6 154.9 0-700 1.4 2.1 0-10.1 8.1 3.4 2.3-16.5 2004 208.6** 148.5 0-500 2.7*** 2.6 0-13.7 11.3*** 3.1 5.3-19.5
All Reconstructed Trees 1922 543.4 0-775 19.1 20.6 0-36.5 13.8 4.4 4.7-27.8 2004 809.8*** 0-800 25.0*** 24.1 0-45.2 16.1*** 3.6 9.6-29.9
Jude 1922 2004 28.7 58.2 0-250 1.2 2.7 0-10.2 21.0 9.8 8.6-51
Acgr 1922 2004 97.1 163.9 0-600 0.7 1.4 0-7.7 8.4 1.7 5.5-12
Amut 1922 2004 4.5 16.1 0-100 0.1 0.3 0-1.9 9.9 3.7 5.5-14.7
Prse 1922 2004 2.9 10.3 0-50 0.02 0.1 0-0.5 10.2 2.2 7.7-12.9
Rone 1922 2004 0.8 4.5 0-25 0.01 0.03 0-0.2 9.2 0.9 8.5-9.8
Quun 1922 2004 1.2 9.6 0-75 0.01 0.04 0-0.3 7.1 7.1
Oskn 1922 2004 107.0 139.7 0-475 1.1 2.1 0-13 10.0 2.6 5.1-16.5
Jumo 1922 2004 8.2 24.5 0-125 0.3 1.1 0-5.7 16.8 11.0 5.2-37.2
Qumu 1922 2004 18.4 56.1 0-350 0.4 1.2 0-8.1 15.5 3.0 11.4-19.6
Qumo 1922 2004 0.4 3.2 0-25 0.003 0.02 0-0.2 9.7 9.7
All Trees 1922 543.9 271.7 75-1325 19.1 11.7 1.3-49.7 13.8 4.4 4.7-27.8 2004 1088.9 329.3 475-2100 28.9 11.4 11.7-72.5 14.9 2.7 9.8-23.6
23
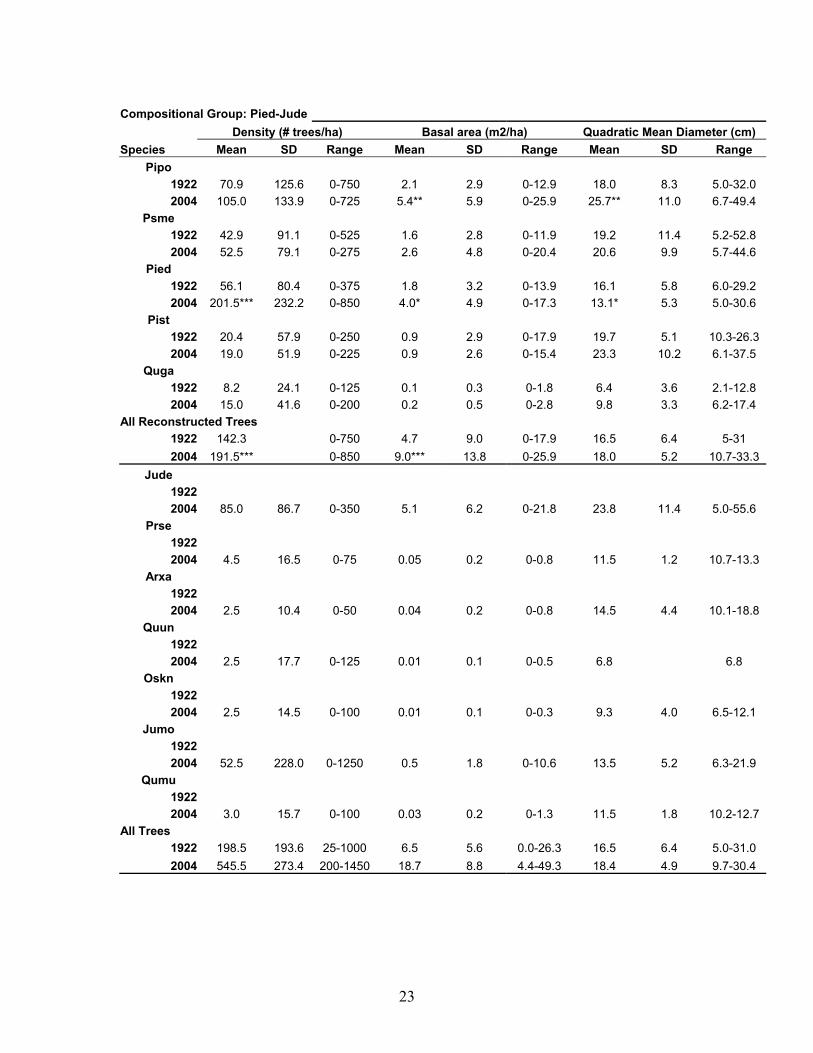
Compositional Group: Pied-Jude Density (# trees/ha) Basal area (m2/ha) Quadratic Mean Diameter (cm) Species Mean SD Range Mean SD Range Mean SD Range
Pipo 1922 70.9 125.6 0-750 2.1 2.9 0-12.9 18.0 8.3 5.0-32.0 2004 105.0 133.9 0-725 5.4** 5.9 0-25.9 25.7** 11.0 6.7-49.4
Psme 1922 42.9 91.1 0-525 1.6 2.8 0-11.9 19.2 11.4 5.2-52.8 2004 52.5 79.1 0-275 2.6 4.8 0-20.4 20.6 9.9 5.7-44.6
Pied 1922 56.1 80.4 0-375 1.8 3.2 0-13.9 16.1 5.8 6.0-29.2 2004 201.5*** 232.2 0-850 4.0* 4.9 0-17.3 13.1* 5.3 5.0-30.6
Pist 1922 20.4 57.9 0-250 0.9 2.9 0-17.9 19.7 5.1 10.3-26.3 2004 19.0 51.9 0-225 0.9 2.6 0-15.4 23.3 10.2 6.1-37.5
Quga 1922 8.2 24.1 0-125 0.1 0.3 0-1.8 6.4 3.6 2.1-12.8 2004 15.0 41.6 0-200 0.2 0.5 0-2.8 9.8 3.3 6.2-17.4
All Reconstructed Trees 1922 142.3 0-750 4.7 9.0 0-17.9 16.5 6.4 5-31 2004 191.5*** 0-850 9.0*** 13.8 0-25.9 18.0 5.2 10.7-33.3
Jude 1922 2004 85.0 86.7 0-350 5.1 6.2 0-21.8 23.8 11.4 5.0-55.6
Prse 1922 2004 4.5 16.5 0-75 0.05 0.2 0-0.8 11.5 1.2 10.7-13.3
Arxa 1922 2004 2.5 10.4 0-50 0.04 0.2 0-0.8 14.5 4.4 10.1-18.8
Quun 1922 2004 2.5 17.7 0-125 0.01 0.1 0-0.5 6.8 6.8
Oskn 1922 2004 2.5 14.5 0-100 0.01 0.1 0-0.3 9.3 4.0 6.5-12.1
Jumo 1922 2004 52.5 228.0 0-1250 0.5 1.8 0-10.6 13.5 5.2 6.3-21.9
Qumu 1922 2004 3.0 15.7 0-100 0.03 0.2 0-1.3 11.5 1.8 10.2-12.7
All Trees 1922 198.5 193.6 25-1000 6.5 5.6 0.0-26.3 16.5 6.4 5.0-31.0 2004 545.5 273.4 200-1450 18.7 8.8 4.4-49.3 18.4 4.9 9.7-30.4
24
15 25 35 45 55 65 75 85 95 105
115
0
5
10
15
20
25
Tree
s pe
r hec
tare
Reference Contemporary
15 25 35 45 55 65 75 85 95 105
0
5
10
15
20
25
15 25 35 45 55 65 75 85 95 105
05
101520253035
15 25 35 45 55 65 75 85 95 105
0
1001000
1200
15 25 35 45 55 65 75 85 95 105
115
05
101520253035
Tree
s pe
r hec
tare
15 25 35 45 55 65 75 85 95 105
115
0
20
40
60
80
100
Tree
s pe
r hec
tare
15 25 35 45 55 65 75 85 95 105
0
20
40
60
80
100
15 25 35 45 55 65 75 85 95 105
115
0
1001000
1200
Tree
s pe
r hec
tare
15 25 35 45 55 65 75 85 95 105
115
050
100150200250300350
Tree
s pe
r hec
tare
Size Class (cm)
15 25 35 45 55 65 75 85 95 105
050
100150200250300350
Size Class (cm)
Pie
dP
ipo
Pis
tP
sme
Qug
a
PSME-QUGA
25
15 25 35 45 55 65 75 85 95 105
115
0
5
10
15
20
25
Tree
s pe
r hec
tare
Reference Contemporary
15 25 35 45 55 65 75 85 95 105
0
5
10
15
20
25
15 25 35 45 55 65 75 85 95 105
0102030405060708090
15 25 35 45 55 65 75 85 95 105
0
50
100
150
200
250
15 25 35 45 55 65 75 85 95 105
115
0102030405060708090
Tree
s pe
r hec
tare
15 25 35 45 55 65 75 85 95 105
115
0
100
200500
600
Tree
s pe
r hec
tare
15 25 35 45 55 65 75 85 95 105
0
100
200500
600
15 25 35 45 55 65 75 85 95 105
115
0
50
100
150
200
250
Tree
s pe
r hec
tare
15 25 35 45 55 65 75 85 95 105
115
0
50
100
150
200
250
Tree
s pe
r hec
tare
Size Class (cm)
15 25 35 45 55 65 75 85 95 105
0
50
100
150
200
250
Size Class (cm)
Pie
dP
ipo
Pis
tP
sme
Qug
a
PIST-PSME-QUGA
26
15 25 35 45 55 65 75 85 95 105
115
0
1
Tree
s pe
r hec
tare
Reference Contemporary
15 25 35 45 55 65 75 85 95 105
0
1
15 25 35 45 55 65 75 85 95 105
0
20
40
60
80
100
15 25 35 45 55 65 75 85 95 105
050
100150200250300
15 25 35 45 55 65 75 85 95 105
115
0
20
40
60
80
100
Tree
s pe
r hec
tare
15 25 35 45 55 65 75 85 95 105
115
020406080
100120140160
Tree
s pe
r hec
tare
15 25 35 45 55 65 75 85 95 105
020406080
100120140160
15 25 35 45 55 65 75 85 95 105
115
050
100150200250300
Tree
s pe
r hec
tare
15 25 35 45 55 65 75 85 95 105
115
0100200300400500600700800
Tree
s pe
r hec
tare
Size Class (cm)
15 25 35 45 55 65 75 85 95 105
0100200300400500600700800
Size Class (cm)
Pie
dP
ipo
Pis
tP
sme
Qug
a
PIPO-JUDE-PSME
27
15 25 35 45 55 65 75 85 95 105
115
0
10
20
30
40
50
60
Tree
s pe
r hec
tare
Reference Contemporary
15 25 35 45 55 65 75 85 95 105
0
10
20
30
40
50
60
15 25 35 45 55 65 75 85 95 105
0
10
20
30
40
50
15 25 35 45 55 65 75 85 95 105
0
50
100
150
200
250
15 25 35 45 55 65 75 85 95 105
115
0
10
20
30
40
50
Tree
s pe
r hec
tare
15 25 35 45 55 65 75 85 95 105
115
0
20
40
60
80
100
120
Tree
s pe
r hec
tare
15 25 35 45 55 65 75 85 95 105
0
20
40
60
80
100
120
15 25 35 45 55 65 75 85 95 105
115
0
50
100
150
200
250
Tree
s pe
r hec
tare
15 25 35 45 55 65 75 85 95 105
115
0
50
100
150
200
Tree
s pe
r hec
tare
Size Class (cm)
15 25 35 45 55 65 75 85 95 105
0
50
100
150
200
Size Class (cm)
Pie
dP
ipo
Pis
tP
sme
Qug
a
JUDE-PIPO-PIED
28
15 25 35 45 55 65 75 85 95 105
115
0
50
100
150
200
250
Tree
s pe
r hec
tare
Reference Contemporary
15 25 35 45 55 65 75 85 95 105
0
50
100
150
200
250
15 25 35 45 55 65 75 85 95 105
0
10
20
30
40
50
60
15 25 35 45 55 65 75 85 95 105
0
10
20
30
40
50
60
15 25 35 45 55 65 75 85 95 105
115
0
10
20
30
40
50
60
Tree
s pe
r hec
tare
15 25 35 45 55 65 75 85 95 105
115
0
10
20
30
40
50
60
Tree
s pe
r hec
tare
15 25 35 45 55 65 75 85 95 105
0
10
20
30
40
50
60
15 25 35 45 55 65 75 85 95 105
115
0
10
20
30
40
50
60
Tree
s pe
r hec
tare
15 25 35 45 55 65 75 85 95 105
115
0
20
40
60
80
Tree
s pe
r hec
tare
Size Class (cm)
15 25 35 45 55 65 75 85 95 105
0
20
40
60
80
Size Class (cm)
Pie
dP
ipo
Pis
tP
sme
Qug
a
PIED-JUDE
Figure 4. Mean (± SE) density of trees (>5 cm dbh) in 10 cm diameter classes in the reference (1922) and contemporary (2004) for forest composition types identified by cluster analysis of species importance values in Guadalupe Mountains National Park. Forest types are Douglas-fir-Gambel oak (Psme-Quga), Southwestern white pine-Douglas-fir-Gambel oak (Pist-Psme-Quga), ponderosa pine-alligator juniper-Douglas-fir (Pipo-Jude-Psme), alligator juniper-ponderosa pine-pinyon pine (Jude-Pipo-Pied), pinyon pine-alligator juniper (Pied-Jude). Values for the reference forest could only be determined for trees with annual growth rings (Douglas-fir, Gambel oak, pinyon pine, ponderosa pine, Southwestern white pine). Note that the y-axis scale is different on each graph. Species acronyms are Pipo (ponderosa pine), Psme (Douglas-fir), Pied (pinyon pine), Pist (Southwestern white pine), Quga (Gambel oak).
29
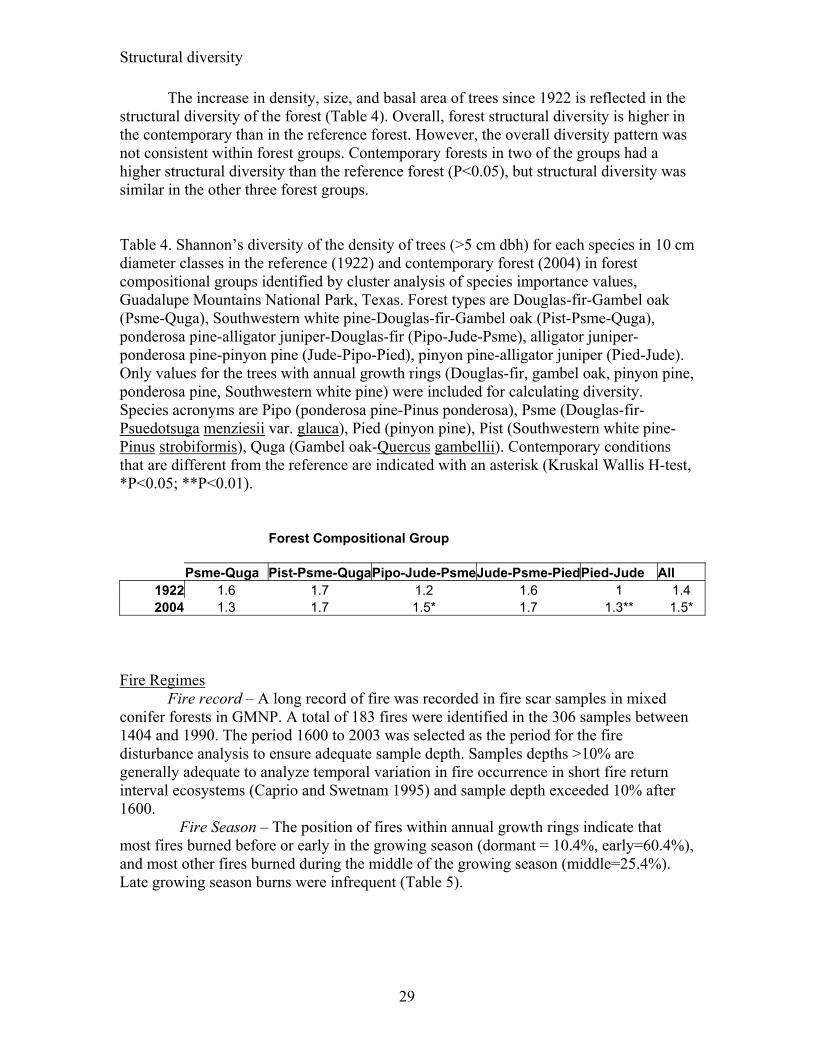
Structural diversity
The increase in density, size, and basal area of trees since 1922 is reflected in the structural diversity of the forest (Table 4). Overall, forest structural diversity is higher in the contemporary than in the reference forest. However, the overall diversity pattern was not consistent within forest groups. Contemporary forests in two of the groups had a higher structural diversity than the reference forest (P<0.05), but structural diversity was similar in the other three forest groups.
Table 4. Shannon’s diversity of the density of trees (>5 cm dbh) for each species in 10 cm diameter classes in the reference (1922) and contemporary forest (2004) in forest compositional groups identified by cluster analysis of species importance values, Guadalupe Mountains National Park, Texas. Forest types are Douglas-fir-Gambel oak (Psme-Quga), Southwestern white pine-Douglas-fir-Gambel oak (Pist-Psme-Quga), ponderosa pine-alligator juniper-Douglas-fir (Pipo-Jude-Psme), alligator juniper-ponderosa pine-pinyon pine (Jude-Pipo-Pied), pinyon pine-alligator juniper (Pied-Jude). Only values for the trees with annual growth rings (Douglas-fir, gambel oak, pinyon pine, ponderosa pine, Southwestern white pine) were included for calculating diversity. Species acronyms are Pipo (ponderosa pine-Pinus ponderosa), Psme (Douglas-fir- Psuedotsuga menziesii var. glauca), Pied (pinyon pine), Pist (Southwestern white pine-Pinus strobiformis), Quga (Gambel oak-Quercus gambellii). Contemporary conditions that are different from the reference are indicated with an asterisk (Kruskal Wallis H-test, *P<0.05; **P<0.01).
Forest Compositional Group Psme-Quga Pist-Psme-QugaPipo-Jude-PsmeJude-Psme-PiedPied-Jude All
1922 1.6 1.7 1.2 1.6 1 1.4 2004 1.3 1.7 1.5* 1.7 1.3** 1.5*
Fire Regimes Fire record – A long record of fire was recorded in fire scar samples in mixed conifer forests in GMNP. A total of 183 fires were identified in the 306 samples between 1404 and 1990. The period 1600 to 2003 was selected as the period for the fire disturbance analysis to ensure adequate sample depth. Samples depths >10% are generally adequate to analyze temporal variation in fire occurrence in short fire return interval ecosystems (Caprio and Swetnam 1995) and sample depth exceeded 10% after 1600. Fire Season – The position of fires within annual growth rings indicate that most fires burned before or early in the growing season (dormant = 10.4%, early=60.4%), and most other fires burned during the middle of the growing season (middle=25.4%). Late growing season burns were infrequent (Table 5).
30
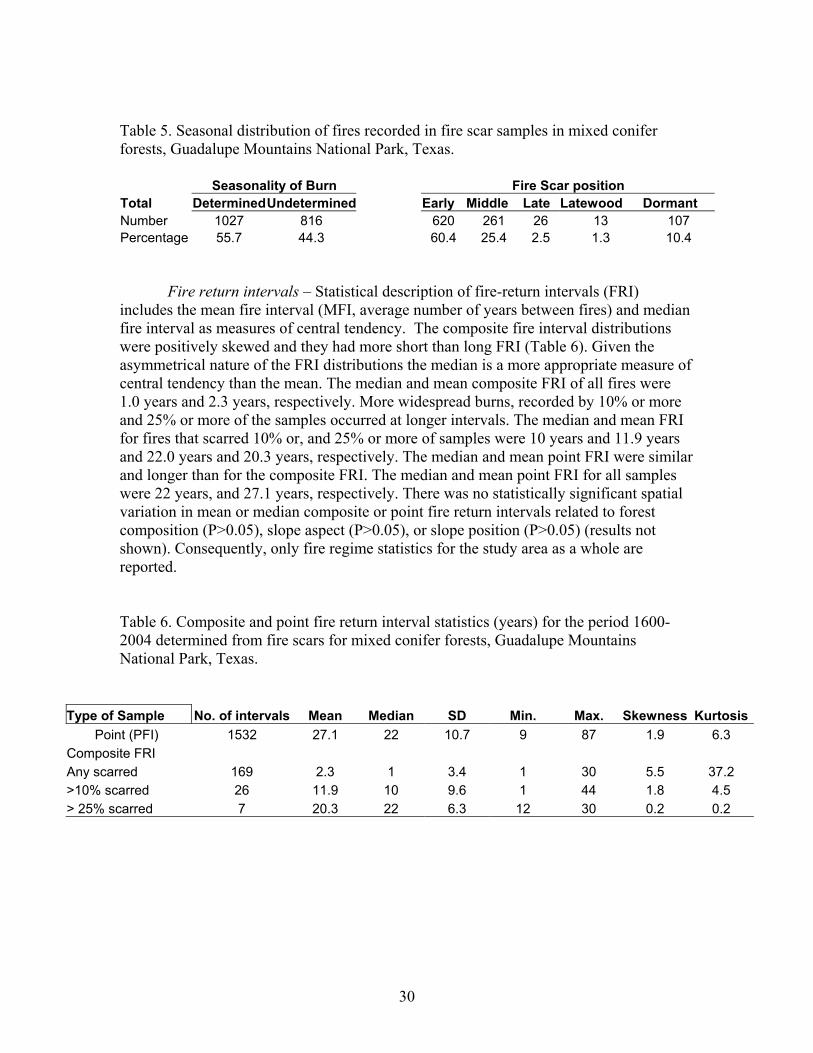
Table 5. Seasonal distribution of fires recorded in fire scar samples in mixed conifer forests, Guadalupe Mountains National Park, Texas. Seasonality of Burn Fire Scar position Total DeterminedUndetermined Early Middle Late Latewood Dormant Number 1027 816 620 261 26 13 107 Percentage 55.7 44.3 60.4 25.4 2.5 1.3 10.4 Fire return intervals – Statistical description of fire-return intervals (FRI) includes the mean fire interval (MFI, average number of years between fires) and median fire interval as measures of central tendency. The composite fire interval distributions were positively skewed and they had more short than long FRI (Table 6). Given the asymmetrical nature of the FRI distributions the median is a more appropriate measure of central tendency than the mean. The median and mean composite FRI of all fires were 1.0 years and 2.3 years, respectively. More widespread burns, recorded by 10% or more and 25% or more of the samples occurred at longer intervals. The median and mean FRI for fires that scarred 10% or, and 25% or more of samples were 10 years and 11.9 years and 22.0 years and 20.3 years, respectively. The median and mean point FRI were similar and longer than for the composite FRI. The median and mean point FRI for all samples were 22 years, and 27.1 years, respectively. There was no statistically significant spatial variation in mean or median composite or point fire return intervals related to forest composition (P>0.05), slope aspect (P>0.05), or slope position (P>0.05) (results not shown). Consequently, only fire regime statistics for the study area as a whole are reported. Table 6. Composite and point fire return interval statistics (years) for the period 1600-2004 determined from fire scars for mixed conifer forests, Guadalupe Mountains National Park, Texas.
Type of Sample No. of intervals Mean Median SD Min. Max. Skewness KurtosisPoint (PFI) 1532 27.1 22 10.7 9 87 1.9 6.3
Composite FRI Any scarred 169 2.3 1 3.4 1 30 5.5 37.2 >10% scarred 26 11.9 10 9.6 1 44 1.8 4.5 > 25% scarred 7 20.3 22 6.3 12 30 0.2 0.2
31
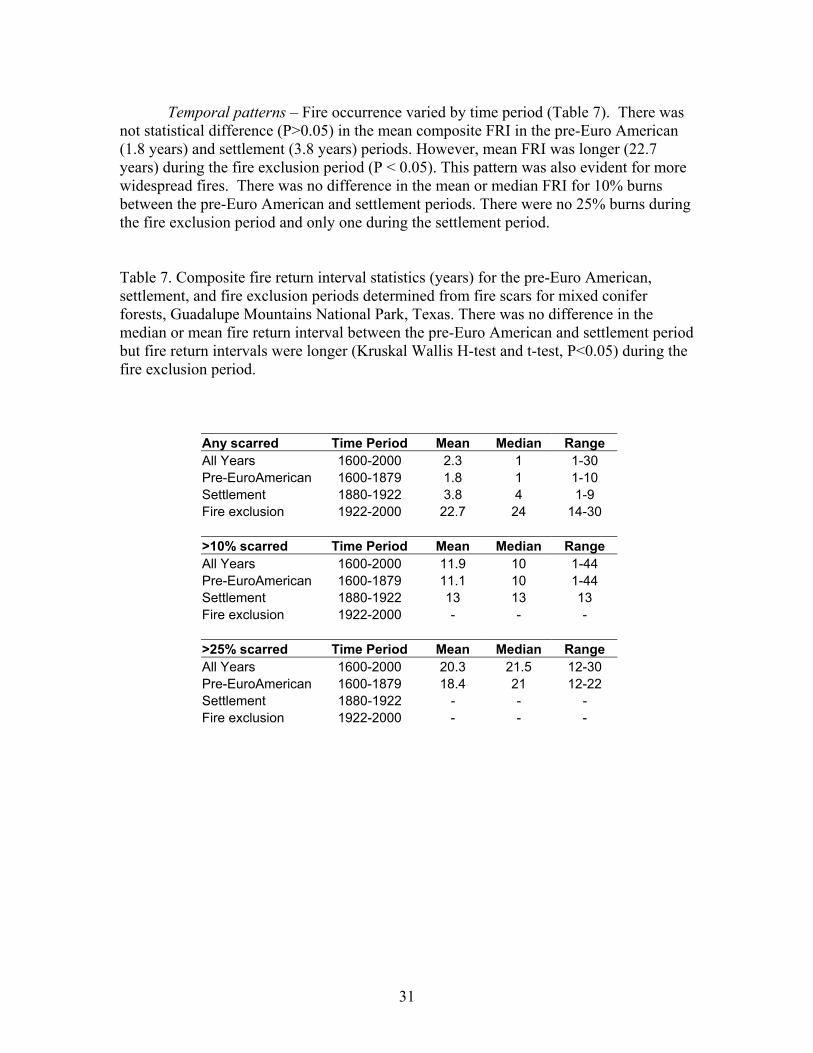
Temporal patterns – Fire occurrence varied by time period (Table 7). There was not statistical difference (P>0.05) in the mean composite FRI in the pre-Euro American (1.8 years) and settlement (3.8 years) periods. However, mean FRI was longer (22.7 years) during the fire exclusion period (P < 0.05). This pattern was also evident for more widespread fires. There was no difference in the mean or median FRI for 10% burns between the pre-Euro American and settlement periods. There were no 25% burns during the fire exclusion period and only one during the settlement period.
Table 7. Composite fire return interval statistics (years) for the pre-Euro American, settlement, and fire exclusion periods determined from fire scars for mixed conifer forests, Guadalupe Mountains National Park, Texas. There was no difference in the median or mean fire return interval between the pre-Euro American and settlement period but fire return intervals were longer (Kruskal Wallis H-test and t-test, P<0.05) during the fire exclusion period.
Any scarred Time Period Mean Median Range All Years 1600-2000 2.3 1 1-30 Pre-EuroAmerican 1600-1879 1.8 1 1-10 Settlement 1880-1922 3.8 4 1-9 Fire exclusion 1922-2000 22.7 24 14-30 >10% scarred Time Period Mean Median Range All Years 1600-2000 11.9 10 1-44 Pre-EuroAmerican 1600-1879 11.1 10 1-44 Settlement 1880-1922 13 13 13 Fire exclusion 1922-2000 - - - >25% scarred Time Period Mean Median Range All Years 1600-2000 20.3 21.5 12-30 Pre-EuroAmerican 1600-1879 18.4 21 12-22 Settlement 1880-1922 - - - Fire exclusion 1922-2000 - - -
32
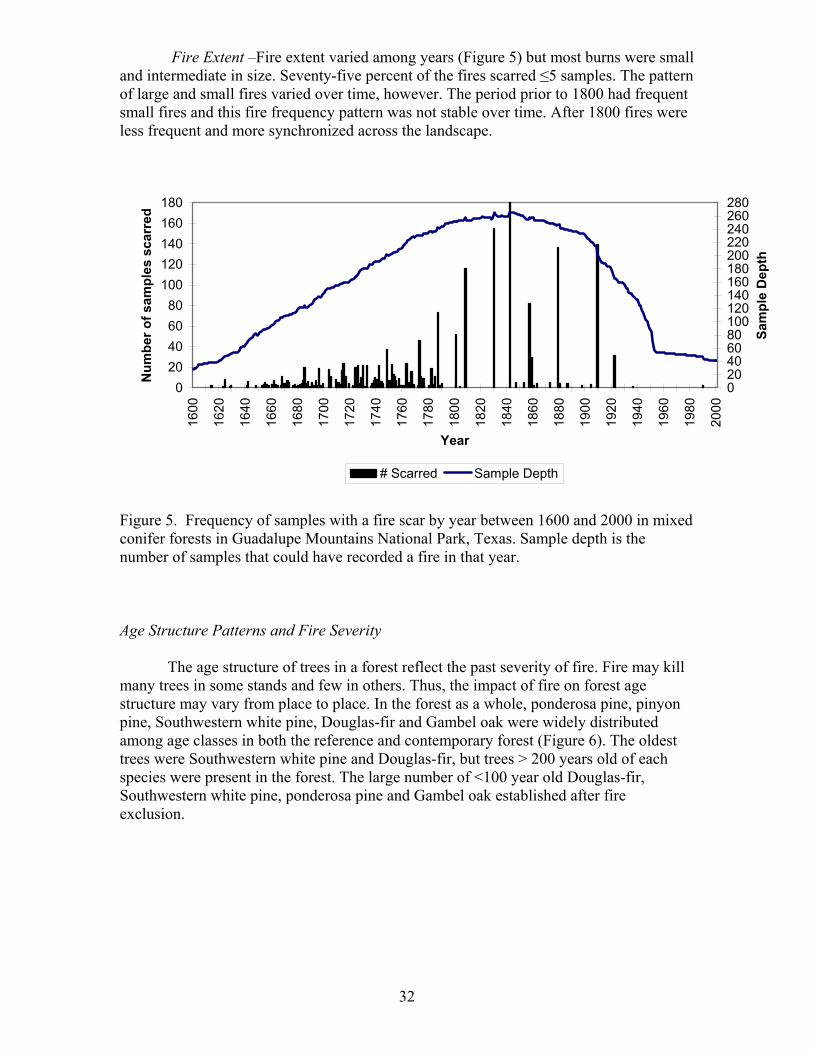
Fire Extent –Fire extent varied among years (Figure 5) but most burns were small and intermediate in size. Seventy-five percent of the fires scarred ≤5 samples. The pattern of large and small fires varied over time, however. The period prior to 1800 had frequent small fires and this fire frequency pattern was not stable over time. After 1800 fires were less frequent and more synchronized across the landscape.
020406080
100120140160180
1600
1620
1640
1660
1680
1700
1720
1740
1760
1780
1800
1820
1840
1860
1880
1900
1920
1940
1960
1980
2000
Year
Num
ber o
f sam
ples
sca
rred
020406080100120140160180200220240260280
Sam
ple
Dep
th
# Scarred Sample Depth
Figure 5. Frequency of samples with a fire scar by year between 1600 and 2000 in mixed conifer forests in Guadalupe Mountains National Park, Texas. Sample depth is the number of samples that could have recorded a fire in that year. Age Structure Patterns and Fire Severity
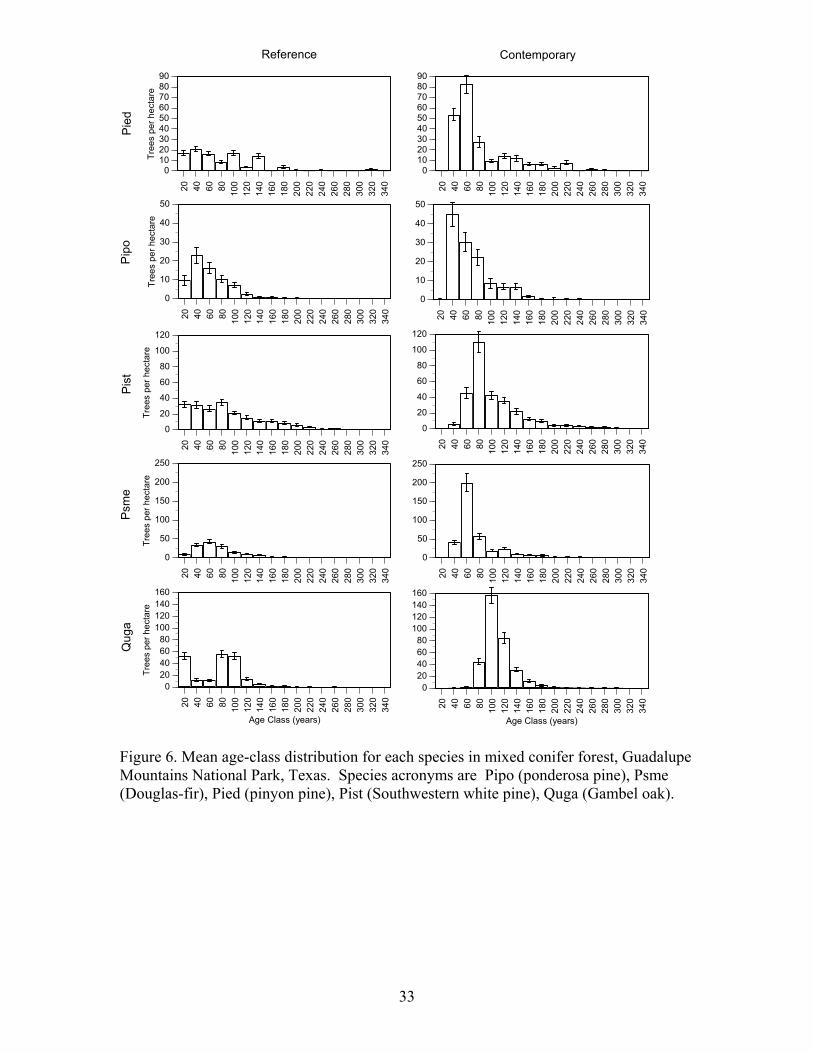
The age structure of trees in a forest reflect the past severity of fire. Fire may kill many trees in some stands and few in others. Thus, the impact of fire on forest age structure may vary from place to place. In the forest as a whole, ponderosa pine, pinyon pine, Southwestern white pine, Douglas-fir and Gambel oak were widely distributed among age classes in both the reference and contemporary forest (Figure 6). The oldest trees were Southwestern white pine and Douglas-fir, but trees > 200 years old of each species were present in the forest. The large number of <100 year old Douglas-fir, Southwestern white pine, ponderosa pine and Gambel oak established after fire exclusion.
33
20 40 60 80 100
120
140
160
180
200
220
240
260
280
300
320
340
0102030405060708090
Tree
s pe
r hec
tare
Reference Contemporary
20 40 60 80 100
120
140
160
180
200
220
240
260
280
300
320
340
0102030405060708090
20 40 60 80 100
120
140
160
180
200
220
240
260
280
300
320
340
0
10
20
30
40
50
20 40 60 80 100
120
140
160
180
200
220
240
260
280
300
320
340
0
50
100
150
200
250
20 40 60 80 100
120
140
160
180
200
220
240
260
280
300
320
340
0
10
20
30
40
50
Tree
s pe
r hec
tare
20 40 60 80 100
120
140
160
180
200
220
240
260
280
300
320
340
0
20
40
60
80
100
120
Tree
s pe
r hec
tare
20 40 60 80 100
120
140
160
180
200
220
240
260
280
300
320
340
0
20
40
60
80
100
120
20 40 60 80 100
120
140
160
180
200
220
240
260
280
300
320
340
0
50
100
150
200
250
Tree
s pe
r hec
tare
20 40 60 80 100
120
140
160
180
200
220
240
260
280
300
320
340
020406080
100120140160
Tree
s pe
r hec
tare
Age Class (years)
20 40 60 80 100
120
140
160
180
200
220
240
260
280
300
320
340
020406080
100120140160
Age Class (years)
Pie
dP
ipo
Pis
tP
sme
Qug
a
Figure 6. Mean age-class distribution for each species in mixed conifer forest, Guadalupe Mountains National Park, Texas. Species acronyms are Pipo (ponderosa pine), Psme (Douglas-fir), Pied (pinyon pine), Pist (Southwestern white pine), Quga (Gambel oak).
34
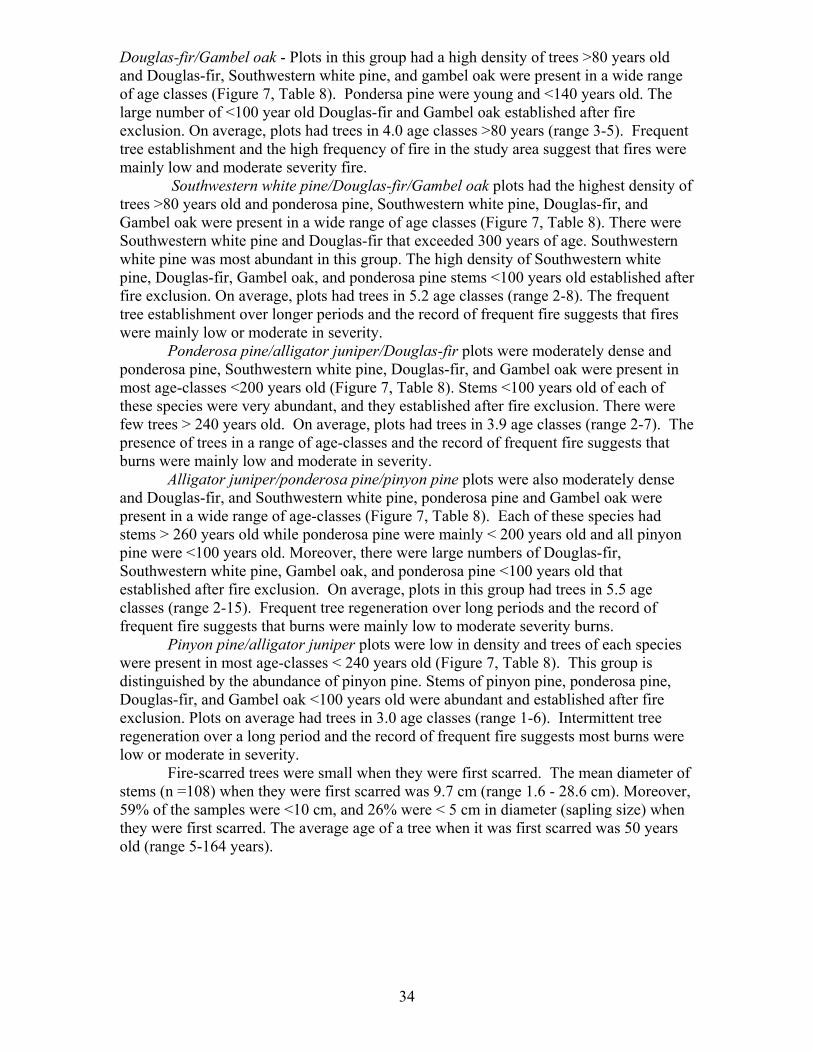
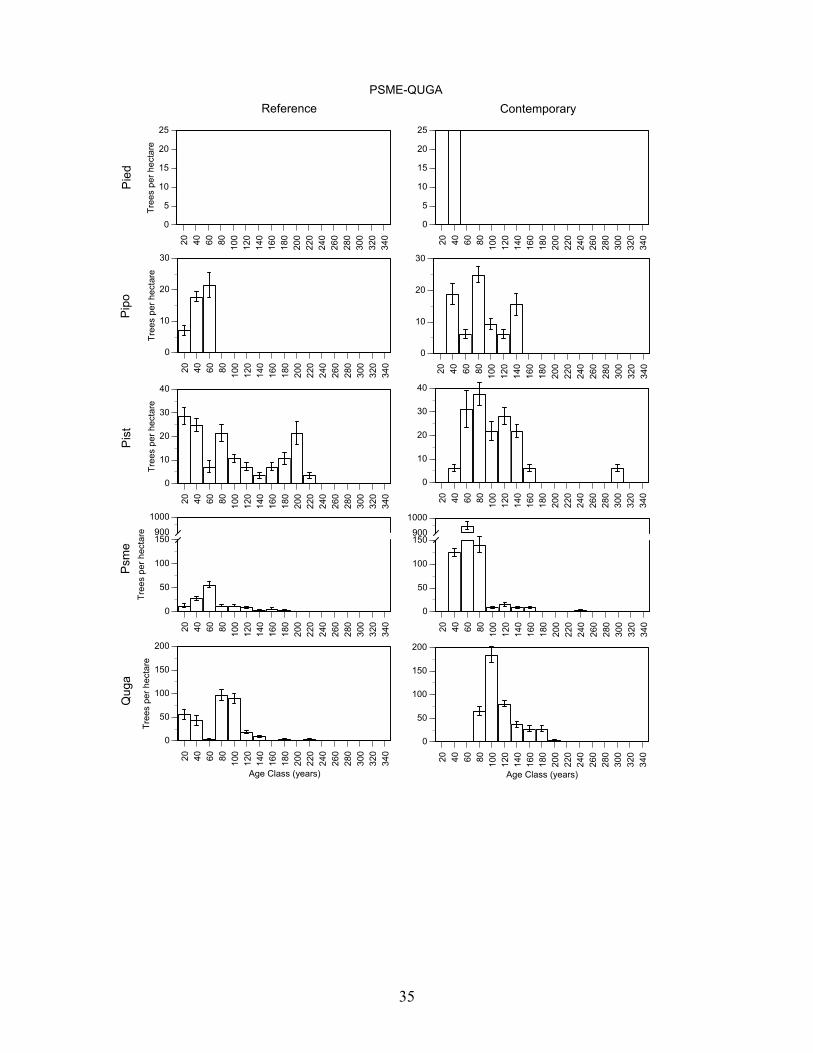
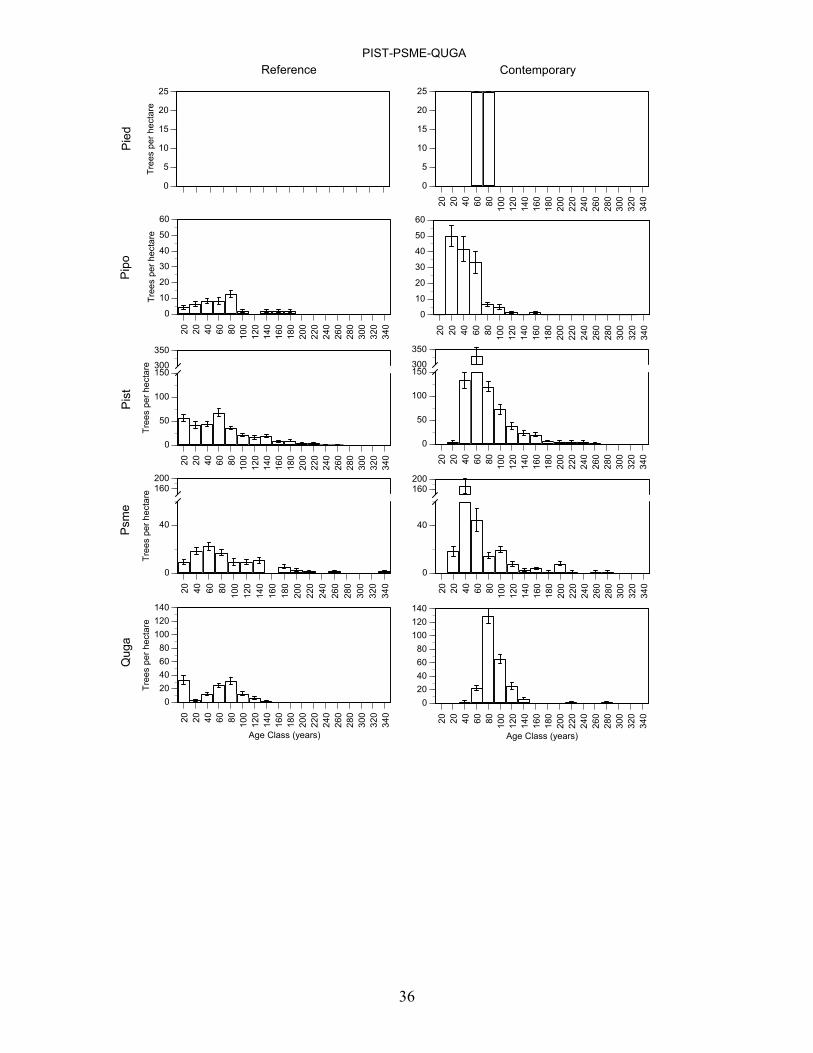
Douglas-fir/Gambel oak - Plots in this group had a high density of trees >80 years old and Douglas-fir, Southwestern white pine, and gambel oak were present in a wide range of age classes (Figure 7, Table 8). Pondersa pine were young and <140 years old. The large number of <100 year old Douglas-fir and Gambel oak established after fire exclusion. On average, plots had trees in 4.0 age classes >80 years (range 3-5). Frequent tree establishment and the high frequency of fire in the study area suggest that fires were mainly low and moderate severity fire. Southwestern white pine/Douglas-fir/Gambel oak plots had the highest density of trees >80 years old and ponderosa pine, Southwestern white pine, Douglas-fir, and Gambel oak were present in a wide range of age classes (Figure 7, Table 8). There were Southwestern white pine and Douglas-fir that exceeded 300 years of age. Southwestern white pine was most abundant in this group. The high density of Southwestern white pine, Douglas-fir, Gambel oak, and ponderosa pine stems <100 years old established after fire exclusion. On average, plots had trees in 5.2 age classes (range 2-8). The frequent tree establishment over longer periods and the record of frequent fire suggests that fires were mainly low or moderate in severity. Ponderosa pine/alligator juniper/Douglas-fir plots were moderately dense and ponderosa pine, Southwestern white pine, Douglas-fir, and Gambel oak were present in most age-classes <200 years old (Figure 7, Table 8). Stems <100 years old of each of these species were very abundant, and they established after fire exclusion. There were few trees > 240 years old. On average, plots had trees in 3.9 age classes (range 2-7). The presence of trees in a range of age-classes and the record of frequent fire suggests that burns were mainly low and moderate in severity. Alligator juniper/ponderosa pine/pinyon pine plots were also moderately dense and Douglas-fir, and Southwestern white pine, ponderosa pine and Gambel oak were present in a wide range of age-classes (Figure 7, Table 8). Each of these species had stems > 260 years old while ponderosa pine were mainly < 200 years old and all pinyon pine were <100 years old. Moreover, there were large numbers of Douglas-fir, Southwestern white pine, Gambel oak, and ponderosa pine <100 years old that established after fire exclusion. On average, plots in this group had trees in 5.5 age classes (range 2-15). Frequent tree regeneration over long periods and the record of frequent fire suggests that burns were mainly low to moderate severity burns. Pinyon pine/alligator juniper plots were low in density and trees of each species were present in most age-classes < 240 years old (Figure 7, Table 8). This group is distinguished by the abundance of pinyon pine. Stems of pinyon pine, ponderosa pine, Douglas-fir, and Gambel oak <100 years old were abundant and established after fire exclusion. Plots on average had trees in 3.0 age classes (range 1-6). Intermittent tree regeneration over a long period and the record of frequent fire suggests most burns were low or moderate in severity.
Fire-scarred trees were small when they were first scarred. The mean diameter of stems (n =108) when they were first scarred was 9.7 cm (range 1.6 - 28.6 cm). Moreover, 59% of the samples were <10 cm, and 26% were < 5 cm in diameter (sapling size) when they were first scarred. The average age of a tree when it was first scarred was 50 years old (range 5-164 years).
35
20 40 60 80 100
120
140
160
180
200
220
240
260
280
300
320
340
0
5
10
15
20
25
Tree
s pe
r hec
tare
Reference Contemporary
20 40 60 80 100
120
140
160
180
200
220
240
260
280
300
320
340
0
5
10
15
20
25
20 40 60 80 100
120
140
160
180
200
220
240
260
280
300
320
340
0
10
20
30
20 40 60 80 100
120
140
160
180
200
220
240
260
280
300
320
340
0
50
100
150900
1000
20 40 60 80 100
120
140
160
180
200
220
240
260
280
300
320
340
0
10
20
30
Tree
s pe
r hec
tare
20 40 60 80 100
120
140
160
180
200
220
240
260
280
300
320
340
0
10
20
30
40
Tree
s pe
r hec
tare
20 40 60 80 100
120
140
160
180
200
220
240
260
280
300
320
340
0
10
20
30
40
20 40 60 80 100
120
140
160
180
200
220
240
260
280
300
320
340
0
50
100
150900
1000
Tree
s pe
r hec
tare
20 40 60 80 100
120
140
160
180
200
220
240
260
280
300
320
340
0
50
100
150
200
Tree
s pe
r hec
tare
Age Class (years)
20 40 60 80 100
120
140
160
180
200
220
240
260
280
300
320
340
0
50
100
150
200
Age Class (years)
Pie
dP
ipo
Pis
tP
sme
Qug
a
PSME-QUGA
36
0
5
10
15
20
25
Tree
s pe
r hec
tare
Reference Contemporary
20 20 40 60 80 100
120
140
160
180
200
220
240
260
280
300
320
340
0
5
10
15
20
25
20 20 40 60 80 100
120
140
160
180
200
220
240
260
280
300
320
340
0
10
20
30
40
50
60
20 20 40 60 80 100
120
140
160
180
200
220
240
260
280
300
320
340
0
40
160200
20 20 40 60 80 100
120
140
160
180
200
220
240
260
280
300
320
340
0
10
20
30
40
50
60
Tree
s pe
r hec
tare
20 20 40 60 80 100
120
140
160
180
200
220
240
260
280
300
320
340
0
50
100
150300
350
Tree
s pe
r hec
tare
20 20 40 60 80 100
120
140
160
180
200
220
240
260
280
300
320
340
0
50
100
150300
350
20 40 60 80 100
120
140
160
180
200
220
240
260
280
300
320
340
0
40
160200
Tree
s pe
r hec
tare
20 20 40 60 80 100
120
140
160
180
200
220
240
260
280
300
320
340
020406080
100120140
Tree
s pe
r hec
tare
Age Class (years)
20 20 40 60 80 100
120
140
160
180
200
220
240
260
280
300
320
340
020406080
100120140
Age Class (years)
Pie
dP
ipo
Pis
tP
sme
Qug
a
PIST-PSME-QUGA
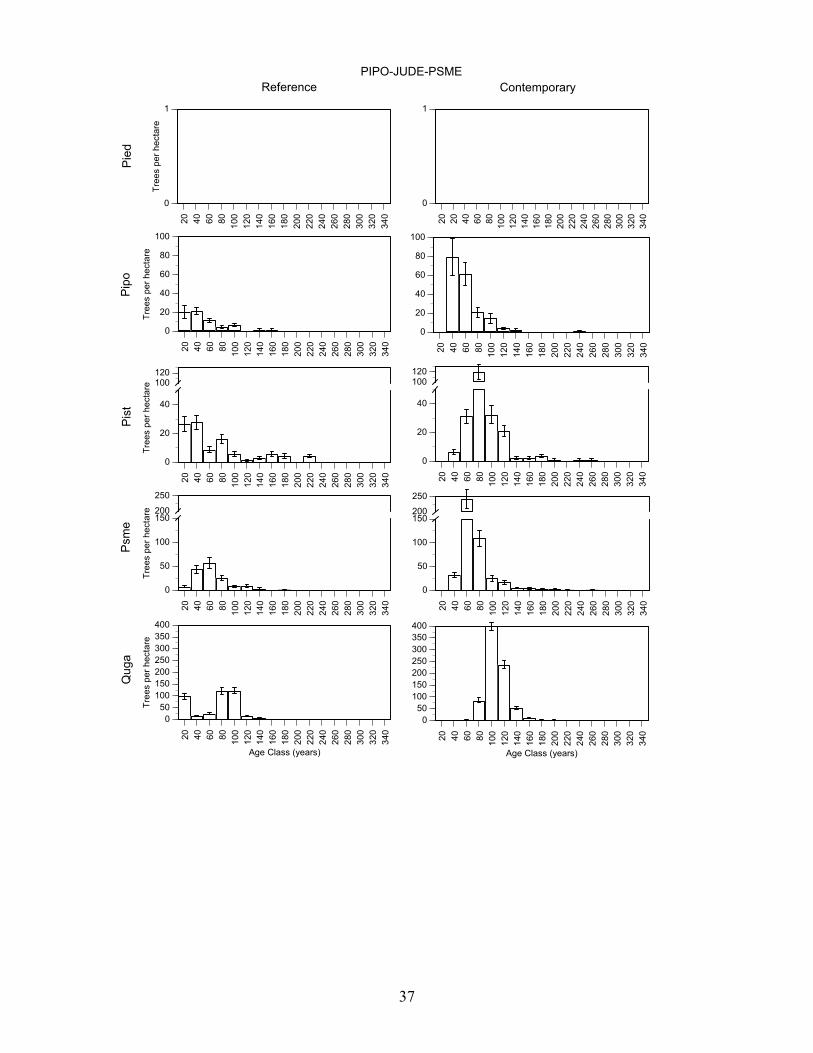
37
20 40 60 80 100
120
140
160
180
200
220
240
260
280
300
320
340
0
1
Tree
s pe
r hec
tare
Reference Contemporary
20 20 40 60 80 100
120
140
160
180
200
220
240
260
280
300
320
340
0
1
20 40 60 80 100
120
140
160
180
200
220
240
260
280
300
320
340
0
20
40
60
80
100
20 40 60 80 100
120
140
160
180
200
220
240
260
280
300
320
340
0
50
100
150200
250
20 40 60 80 100
120
140
160
180
200
220
240
260
280
300
320
340
0
20
40
60
80
100
Tree
s pe
r hec
tare
20 40 60 80 100
120
140
160
180
200
220
240
260
280
300
320
340
0
20
40
100120
Tree
s pe
r hec
tare
20 40 60 80 100
120
140
160
180
200
220
240
260
280
300
320
340
0
20
40
100120
20 40 60 80 100
120
140
160
180
200
220
240
260
280
300
320
340
0
50
100
150200
250
Tree
s pe
r hec
tare
20 40 60 80 100
120
140
160
180
200
220
240
260
280
300
320
340
050
100150200250300350400
Tree
s pe
r hec
tare
Age Class (years)
20 40 60 80 100
120
140
160
180
200
220
240
260
280
300
320
340
050
100150200250300350400
Age Class (years)
Pie
dP
ipo
Pis
tP
sme
Qug
a
PIPO-JUDE-PSME
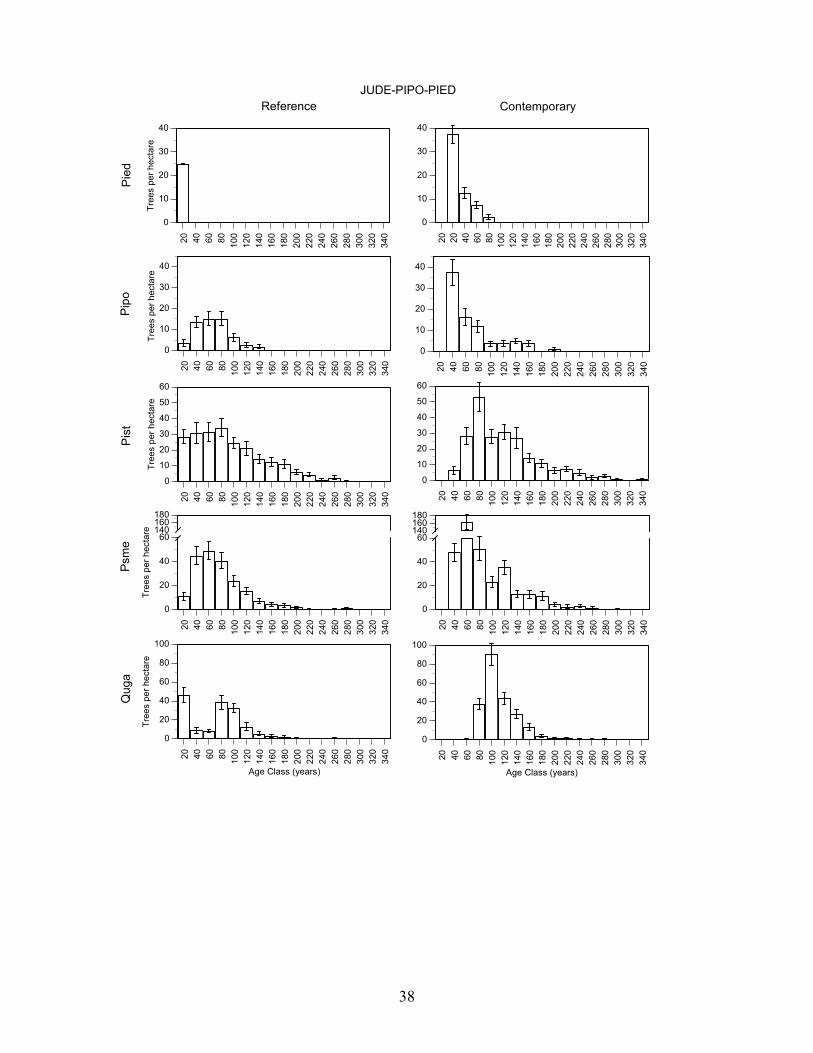
38
20 40 60 80 100
120
140
160
180
200
220
240
260
280
300
320
340
0
10
20
30
40
Tree
s pe
r hec
tare
Reference Contemporary
20 20 40 60 80 100
120
140
160
180
200
220
240
260
280
300
320
340
0
10
20
30
40
20 40 60 80 100
120
140
160
180
200
220
240
260
280
300
320
340
0
10
20
30
40
20 40 60 80 100
120
140
160
180
200
220
240
260
280
300
320
340
0
20
40
60140160180
20 40 60 80 100
120
140
160
180
200
220
240
260
280
300
320
340
0
10
20
30
40
Tree
s pe
r hec
tare
20 40 60 80 100
120
140
160
180
200
220
240
260
280
300
320
340
0
10
20
30
40
50
60
Tree
s pe
r hec
tare
20 40 60 80 100
120
140
160
180
200
220
240
260
280
300
320
340
0
10
20
30
40
50
60
20 40 60 80 100
120
140
160
180
200
220
240
260
280
300
320
340
0
20
40
60140160180
Tree
s pe
r hec
tare
20 40 60 80 100
120
140
160
180
200
220
240
260
280
300
320
340
0
20
40
60
80
100
Tree
s pe
r hec
tare
Age Class (years)
20 40 60 80 100
120
140
160
180
200
220
240
260
280
300
320
340
0
20
40
60
80
100
Age Class (years)
Pie
dP
ipo
Pis
tP
sme
Qug
a
JUDE-PIPO-PIED
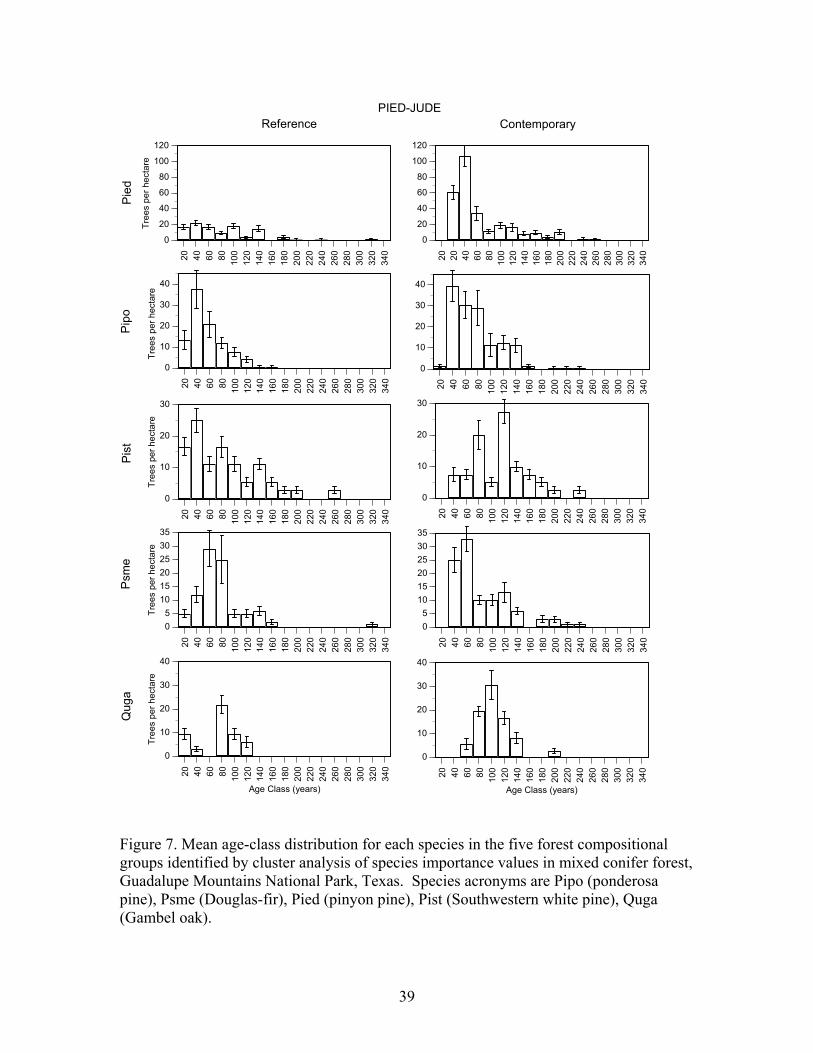
39
20 40 60 80 100
120
140
160
180
200
220
240
260
280
300
320
340
0
20
40
60
80
100
120Tr
ees
per h
ecta
re
Reference Contemporary
20 20 40 60 80 100
120
140
160
180
200
220
240
260
280
300
320
340
0
20
40
60
80
100
120
20 40 60 80 100
120
140
160
180
200
220
240
260
280
300
320
340
0
10
20
30
40
20 40 60 80 100
120
140
160
180
200
220
240
260
280
300
320
340
05
101520253035
20 40 60 80 100
120
140
160
180
200
220
240
260
280
300
320
340
0
10
20
30
40
Tree
s pe
r hec
tare
20 40 60 80 100
120
140
160
180
200
220
240
260
280
300
320
340
0
10
20
30
Tree
s pe
r hec
tare
20 40 60 80 100
120
140
160
180
200
220
240
260
280
300
320
340
0
10
20
30
20 40 60 80 100
120
140
160
180
200
220
240
260
280
300
320
340
05
101520253035
Tree
s pe
r hec
tare
20 40 60 80 100
120
140
160
180
200
220
240
260
280
300
320
340
0
10
20
30
40
Tree
s pe
r hec
tare
Age Class (years)
20 40 60 80 100
120
140
160
180
200
220
240
260
280
300
320
340
0
10
20
30
40
Age Class (years)
Pie
dP
ipo
Pis
tP
sme
Qug
aPIED-JUDE
Figure 7. Mean age-class distribution for each species in the five forest compositional groups identified by cluster analysis of species importance values in mixed conifer forest, Guadalupe Mountains National Park, Texas. Species acronyms are Pipo (ponderosa pine), Psme (Douglas-fir), Pied (pinyon pine), Pist (Southwestern white pine), Quga (Gambel oak).
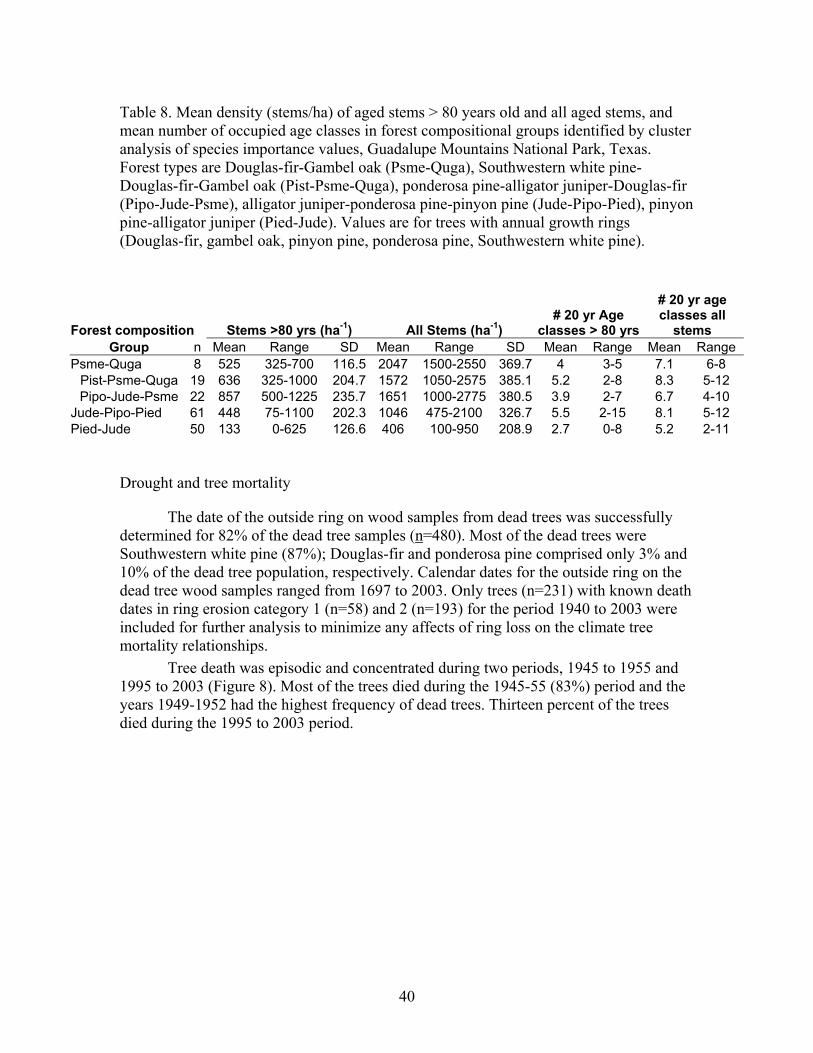
40
Table 8. Mean density (stems/ha) of aged stems > 80 years old and all aged stems, and mean number of occupied age classes in forest compositional groups identified by cluster analysis of species importance values, Guadalupe Mountains National Park, Texas. Forest types are Douglas-fir-Gambel oak (Psme-Quga), Southwestern white pine-Douglas-fir-Gambel oak (Pist-Psme-Quga), ponderosa pine-alligator juniper-Douglas-fir (Pipo-Jude-Psme), alligator juniper-ponderosa pine-pinyon pine (Jude-Pipo-Pied), pinyon pine-alligator juniper (Pied-Jude). Values are for trees with annual growth rings (Douglas-fir, gambel oak, pinyon pine, ponderosa pine, Southwestern white pine).
Drought and tree mortality
The date of the outside ring on wood samples from dead trees was successfully determined for 82% of the dead tree samples (n=480). Most of the dead trees were Southwestern white pine (87%); Douglas-fir and ponderosa pine comprised only 3% and 10% of the dead tree population, respectively. Calendar dates for the outside ring on the dead tree wood samples ranged from 1697 to 2003. Only trees (n=231) with known death dates in ring erosion category 1 (n=58) and 2 (n=193) for the period 1940 to 2003 were included for further analysis to minimize any affects of ring loss on the climate tree mortality relationships.
Tree death was episodic and concentrated during two periods, 1945 to 1955 and 1995 to 2003 (Figure 8). Most of the trees died during the 1945-55 (83%) period and the years 1949-1952 had the highest frequency of dead trees. Thirteen percent of the trees died during the 1995 to 2003 period.
Forest composition Stems >80 yrs (ha-1) All Stems (ha-1) # 20 yr Age
classes > 80 yrs
# 20 yr age classes all
stems Group n Mean Range SD Mean Range SD Mean Range Mean Range
Psme-Quga 8 525 325-700 116.5 2047 1500-2550 369.7 4 3-5 7.1 6-8 Pist-Psme-Quga 19 636 325-1000 204.7 1572 1050-2575 385.1 5.2 2-8 8.3 5-12 Pipo-Jude-Psme 22 857 500-1225 235.7 1651 1000-2775 380.5 3.9 2-7 6.7 4-10
Jude-Pipo-Pied 61 448 75-1100 202.3 1046 475-2100 326.7 5.5 2-15 8.1 5-12 Pied-Jude 50 133 0-625 126.6 406 100-950 208.9 2.7 0-8 5.2 2-11
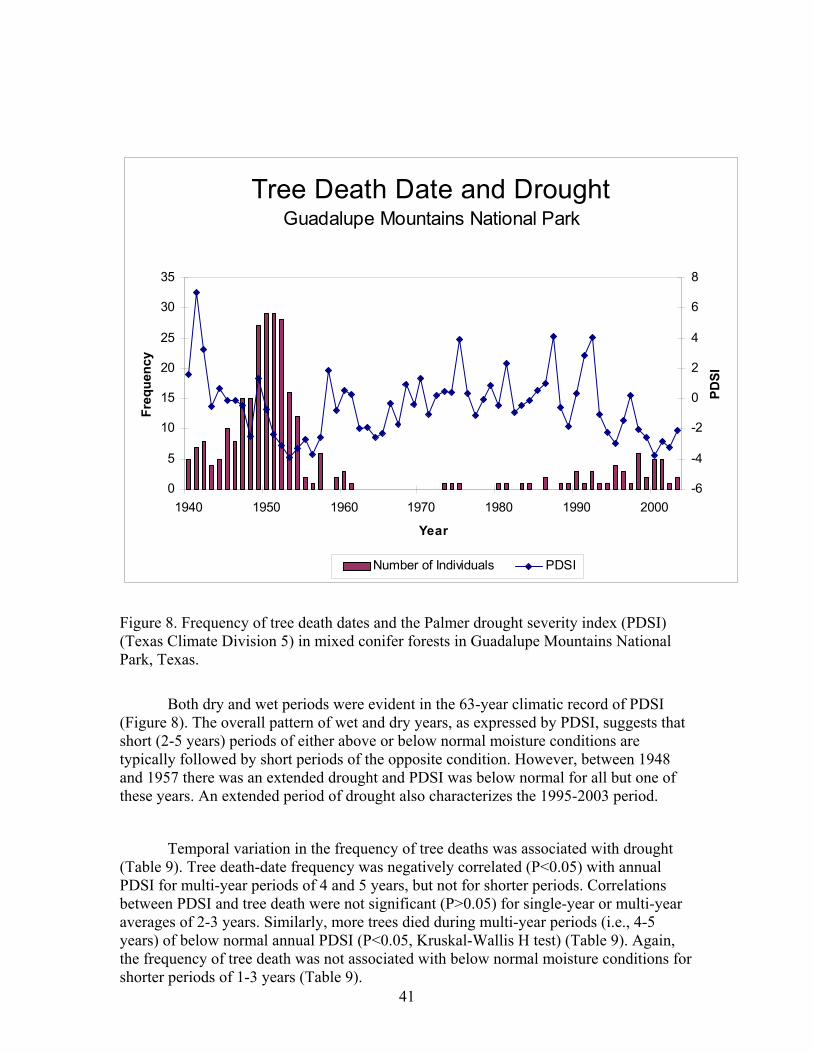
41
Tree Death Date and Drought Guadalupe Mountains National Park
0
5
10
15
20
25
30
35
1940 1950 1960 1970 1980 1990 2000
Year
Freq
uenc
y
-6
-4
-2
0
2
4
6
8
PDSI
Number of Individuals PDSI
Figure 8. Frequency of tree death dates and the Palmer drought severity index (PDSI) (Texas Climate Division 5) in mixed conifer forests in Guadalupe Mountains National Park, Texas.
Both dry and wet periods were evident in the 63-year climatic record of PDSI (Figure 8). The overall pattern of wet and dry years, as expressed by PDSI, suggests that short (2-5 years) periods of either above or below normal moisture conditions are typically followed by short periods of the opposite condition. However, between 1948 and 1957 there was an extended drought and PDSI was below normal for all but one of these years. An extended period of drought also characterizes the 1995-2003 period.
Temporal variation in the frequency of tree deaths was associated with drought (Table 9). Tree death-date frequency was negatively correlated (P<0.05) with annual PDSI for multi-year periods of 4 and 5 years, but not for shorter periods. Correlations between PDSI and tree death were not significant (P>0.05) for single-year or multi-year averages of 2-3 years. Similarly, more trees died during multi-year periods (i.e., 4-5 years) of below normal annual PDSI (P<0.05, Kruskal-Wallis H test) (Table 9). Again, the frequency of tree death was not associated with below normal moisture conditions for shorter periods of 1-3 years (Table 9).
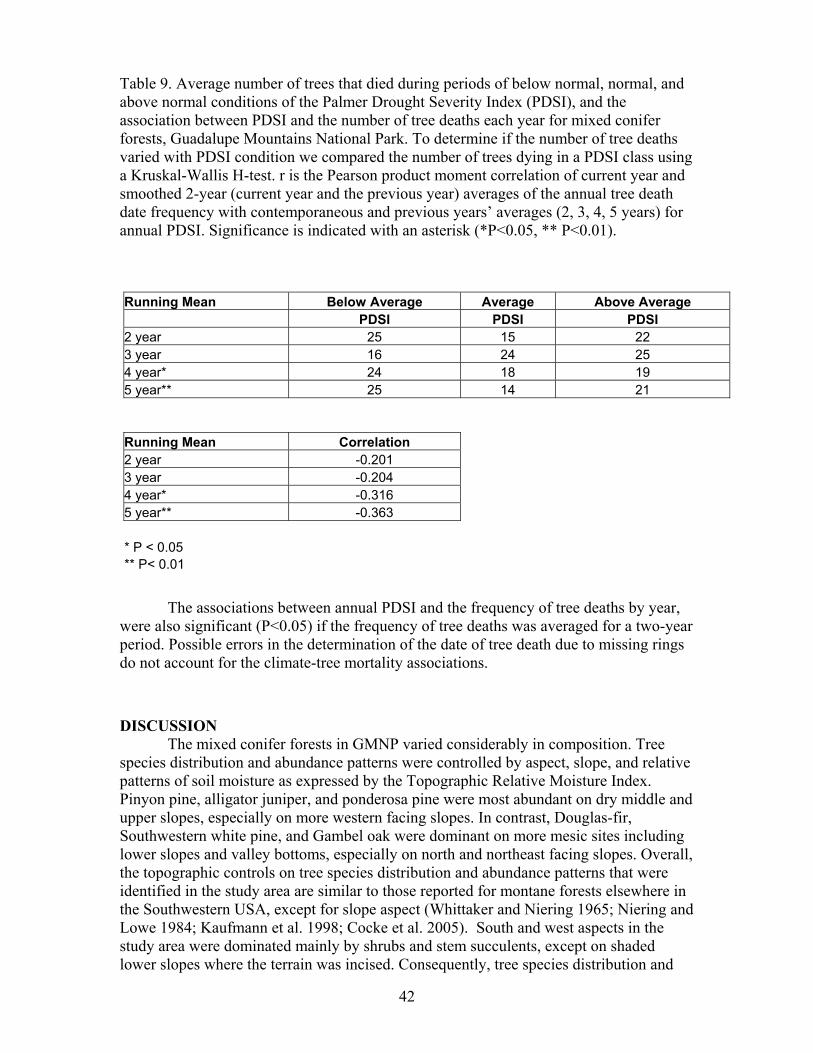
42
Table 9. Average number of trees that died during periods of below normal, normal, and above normal conditions of the Palmer Drought Severity Index (PDSI), and the association between PDSI and the number of tree deaths each year for mixed conifer forests, Guadalupe Mountains National Park. To determine if the number of tree deaths varied with PDSI condition we compared the number of trees dying in a PDSI class using a Kruskal-Wallis H-test. r is the Pearson product moment correlation of current year and smoothed 2-year (current year and the previous year) averages of the annual tree death date frequency with contemporaneous and previous years’ averages (2, 3, 4, 5 years) for annual PDSI. Significance is indicated with an asterisk (*P<0.05, ** P<0.01).
Running Mean Below Average Average Above Average PDSI PDSI PDSI 2 year 25 15 22 3 year 16 24 25 4 year* 24 18 19 5 year** 25 14 21 Running Mean Correlation 2 year -0.201 3 year -0.204 4 year* -0.316 5 year** -0.363 * P < 0.05 ** P< 0.01
The associations between annual PDSI and the frequency of tree deaths by year, were also significant (P<0.05) if the frequency of tree deaths was averaged for a two-year period. Possible errors in the determination of the date of tree death due to missing rings do not account for the climate-tree mortality associations.
DISCUSSION The mixed conifer forests in GMNP varied considerably in composition. Tree species distribution and abundance patterns were controlled by aspect, slope, and relative patterns of soil moisture as expressed by the Topographic Relative Moisture Index. Pinyon pine, alligator juniper, and ponderosa pine were most abundant on dry middle and upper slopes, especially on more western facing slopes. In contrast, Douglas-fir, Southwestern white pine, and Gambel oak were dominant on more mesic sites including lower slopes and valley bottoms, especially on north and northeast facing slopes. Overall, the topographic controls on tree species distribution and abundance patterns that were identified in the study area are similar to those reported for montane forests elsewhere in the Southwestern USA, except for slope aspect (Whittaker and Niering 1965; Niering and Lowe 1984; Kaufmann et al. 1998; Cocke et al. 2005). South and west aspects in the study area were dominated mainly by shrubs and stem succulents, except on shaded lower slopes where the terrain was incised. Consequently, tree species distribution and
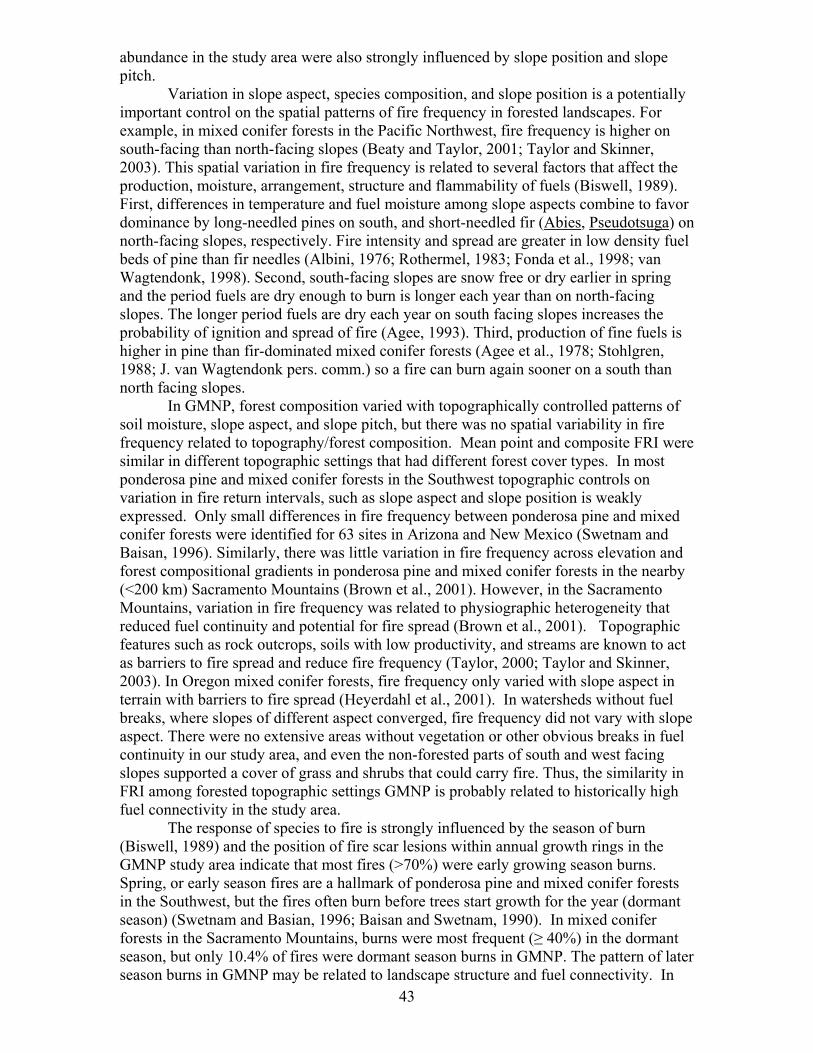
43
abundance in the study area were also strongly influenced by slope position and slope pitch.
Variation in slope aspect, species composition, and slope position is a potentially important control on the spatial patterns of fire frequency in forested landscapes. For example, in mixed conifer forests in the Pacific Northwest, fire frequency is higher on south-facing than north-facing slopes (Beaty and Taylor, 2001; Taylor and Skinner, 2003). This spatial variation in fire frequency is related to several factors that affect the production, moisture, arrangement, structure and flammability of fuels (Biswell, 1989). First, differences in temperature and fuel moisture among slope aspects combine to favor dominance by long-needled pines on south, and short-needled fir (Abies, Pseudotsuga) on north-facing slopes, respectively. Fire intensity and spread are greater in low density fuel beds of pine than fir needles (Albini, 1976; Rothermel, 1983; Fonda et al., 1998; van Wagtendonk, 1998). Second, south-facing slopes are snow free or dry earlier in spring and the period fuels are dry enough to burn is longer each year than on north-facing slopes. The longer period fuels are dry each year on south facing slopes increases the probability of ignition and spread of fire (Agee, 1993). Third, production of fine fuels is higher in pine than fir-dominated mixed conifer forests (Agee et al., 1978; Stohlgren, 1988; J. van Wagtendonk pers. comm.) so a fire can burn again sooner on a south than north facing slopes.
In GMNP, forest composition varied with topographically controlled patterns of soil moisture, slope aspect, and slope pitch, but there was no spatial variability in fire frequency related to topography/forest composition. Mean point and composite FRI were similar in different topographic settings that had different forest cover types. In most ponderosa pine and mixed conifer forests in the Southwest topographic controls on variation in fire return intervals, such as slope aspect and slope position is weakly expressed. Only small differences in fire frequency between ponderosa pine and mixed conifer forests were identified for 63 sites in Arizona and New Mexico (Swetnam and Baisan, 1996). Similarly, there was little variation in fire frequency across elevation and forest compositional gradients in ponderosa pine and mixed conifer forests in the nearby (<200 km) Sacramento Mountains (Brown et al., 2001). However, in the Sacramento Mountains, variation in fire frequency was related to physiographic heterogeneity that reduced fuel continuity and potential for fire spread (Brown et al., 2001). Topographic features such as rock outcrops, soils with low productivity, and streams are known to act as barriers to fire spread and reduce fire frequency (Taylor, 2000; Taylor and Skinner, 2003). In Oregon mixed conifer forests, fire frequency only varied with slope aspect in terrain with barriers to fire spread (Heyerdahl et al., 2001). In watersheds without fuel breaks, where slopes of different aspect converged, fire frequency did not vary with slope aspect. There were no extensive areas without vegetation or other obvious breaks in fuel continuity in our study area, and even the non-forested parts of south and west facing slopes supported a cover of grass and shrubs that could carry fire. Thus, the similarity in FRI among forested topographic settings GMNP is probably related to historically high fuel connectivity in the study area.
The response of species to fire is strongly influenced by the season of burn (Biswell, 1989) and the position of fire scar lesions within annual growth rings in the GMNP study area indicate that most fires (>70%) were early growing season burns. Spring, or early season fires are a hallmark of ponderosa pine and mixed conifer forests in the Southwest, but the fires often burn before trees start growth for the year (dormant season) (Swetnam and Basian, 1996; Baisan and Swetnam, 1990). In mixed conifer forests in the Sacramento Mountains, burns were most frequent (≥ 40%) in the dormant season, but only 10.4% of fires were dormant season burns in GMNP. The pattern of later season burns in GMNP may be related to landscape structure and fuel connectivity. In
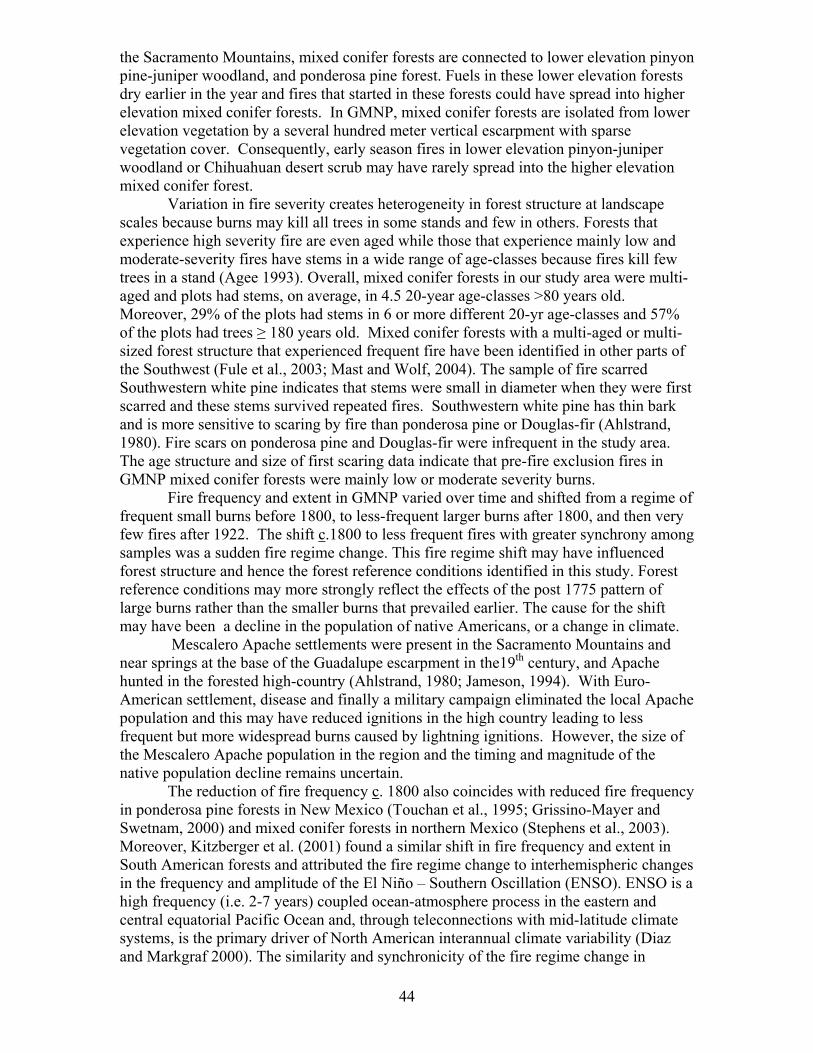
44
the Sacramento Mountains, mixed conifer forests are connected to lower elevation pinyon pine-juniper woodland, and ponderosa pine forest. Fuels in these lower elevation forests dry earlier in the year and fires that started in these forests could have spread into higher elevation mixed conifer forests. In GMNP, mixed conifer forests are isolated from lower elevation vegetation by a several hundred meter vertical escarpment with sparse vegetation cover. Consequently, early season fires in lower elevation pinyon-juniper woodland or Chihuahuan desert scrub may have rarely spread into the higher elevation mixed conifer forest.
Variation in fire severity creates heterogeneity in forest structure at landscape scales because burns may kill all trees in some stands and few in others. Forests that experience high severity fire are even aged while those that experience mainly low and moderate-severity fires have stems in a wide range of age-classes because fires kill few trees in a stand (Agee 1993). Overall, mixed conifer forests in our study area were multi-aged and plots had stems, on average, in 4.5 20-year age-classes >80 years old. Moreover, 29% of the plots had stems in 6 or more different 20-yr age-classes and 57% of the plots had trees ≥ 180 years old. Mixed conifer forests with a multi-aged or multi-sized forest structure that experienced frequent fire have been identified in other parts of the Southwest (Fule et al., 2003; Mast and Wolf, 2004). The sample of fire scarred Southwestern white pine indicates that stems were small in diameter when they were first scarred and these stems survived repeated fires. Southwestern white pine has thin bark and is more sensitive to scaring by fire than ponderosa pine or Douglas-fir (Ahlstrand, 1980). Fire scars on ponderosa pine and Douglas-fir were infrequent in the study area. The age structure and size of first scaring data indicate that pre-fire exclusion fires in GMNP mixed conifer forests were mainly low or moderate severity burns.
Fire frequency and extent in GMNP varied over time and shifted from a regime of frequent small burns before 1800, to less-frequent larger burns after 1800, and then very few fires after 1922. The shift c.1800 to less frequent fires with greater synchrony among samples was a sudden fire regime change. This fire regime shift may have influenced forest structure and hence the forest reference conditions identified in this study. Forest reference conditions may more strongly reflect the effects of the post 1775 pattern of large burns rather than the smaller burns that prevailed earlier. The cause for the shift may have been a decline in the population of native Americans, or a change in climate.
Mescalero Apache settlements were present in the Sacramento Mountains and near springs at the base of the Guadalupe escarpment in the19th century, and Apache hunted in the forested high-country (Ahlstrand, 1980; Jameson, 1994). With Euro-American settlement, disease and finally a military campaign eliminated the local Apache population and this may have reduced ignitions in the high country leading to less frequent but more widespread burns caused by lightning ignitions. However, the size of the Mescalero Apache population in the region and the timing and magnitude of the native population decline remains uncertain.
The reduction of fire frequency c. 1800 also coincides with reduced fire frequency in ponderosa pine forests in New Mexico (Touchan et al., 1995; Grissino-Mayer and Swetnam, 2000) and mixed conifer forests in northern Mexico (Stephens et al., 2003). Moreover, Kitzberger et al. (2001) found a similar shift in fire frequency and extent in South American forests and attributed the fire regime change to interhemispheric changes in the frequency and amplitude of the El Niño – Southern Oscillation (ENSO). ENSO is a high frequency (i.e. 2-7 years) coupled ocean-atmosphere process in the eastern and central equatorial Pacific Ocean and, through teleconnections with mid-latitude climate systems, is the primary driver of North American interannual climate variability (Diaz and Markgraf 2000). The similarity and synchronicity of the fire regime change in

45
GMNP with other sites in the Southwest suggests that climate variation contributed to the fire regime change.
The cessation of fire in GMNP after 1922 coincides with the introduction of livestock. Although Euro-Americans first settled in the area in the late 19th century, use of the high-country was limited until the establishment of the Guadalupe Mountain Ranch in the 1920s when large herds of sheep and goats were grazed in the high country (Jameson, 1994). Livestock grazing eliminates fine fuels (grass, shrubs) that support fire spread and introduction of livestock grazing in the 19th century has been implicated as the initial cause of a decline in fire frequency in ponderosa pine and mixed conifer forests throughout the Southwest (Savage and Swetnam, 1990; Swetnam and Betancourt, 1998; Touchan et al., 1995). Sheep and goats in GMNP maintained low levels of fuels into the 1960’s and then a policy of suppressing forest fires was implemented when the area became a national park in 1972. Forest changes caused by fire exclusion are well documented in Southwestern ponderosa pine forests (Covington and Moore, 1994; Fulé et al., 1997). Forest density began to increase in the late 19th century with elimination of fire, caused mainly by livestock grazing. Mixed conifer forests in GMNP experienced a similar change, but four decades later than in other Southwestern forests. Tree establishment began to increase after fire was eliminated in 1922 and tree establishment peaked in the period (1920-1960) when livestock grazing was most intense (Jameson, 1994). Reduction of competition between grass and tree seedlings caused by livestock grazing can result in high tree seedling establishment (Cooper, 1960). The observed peak in recruitment may have occurred earlier since tree age is reported for age at coring height. The estimated average age to coring height was 17 years (range, 10-29 years) so trees would be unlikely to shift more than one age class if true germination dates could be obtained.
The increase in tree density identified in GMNP is greater than in other mixed conifer forests in the Southwest. For instance, Cocke et al. (2005) recorded tree densities of 820 trees ha-1 for the San Francisco Peaks, Arizona. In GMNP, the average density of the five trees species used in the forest reconstruction was 100 trees ha-1 higher and three of the mixed conifer forest types had densities of 1400-2000 trees ha-1. The density difference may be related to differences in species composition. In the San Francisco Peaks, quaking aspen (Populus tremuloides Michx.) and limber pine (Pinus flexilis James) account for a large percentage of the forest density. In GMNP, small and young Douglas-fir and Gambel oak account for a large percentage of the density. Moreover, the high density of Douglas-fir in the understory will likely shift composition of the overstory from mixed dominance by Southwestern white pine and ponderosa pine to Douglas-fir. The forest density increase caused by elimination of fire may be a key factor contributing to the apparent shift to a regime of more high severity fire regime in GMNP mixed conifer forests. Two wildfires in GMNP (1990, 1994) burned large areas of mixed conifer forest at high severity with near 100% tree mortality in many places. These fires burned under extreme weather in dense surface and aerial fuels. The fire history and forest age structure data indicate that these high severity fires were unusual with respect to the pre-fire exclusion period. The degree to which climate and fuel accumulation each contribute to the occurrence of high severity fire cannot easily be evaluated in GMNP. GMNP and the entire Southwest have experienced some of the hottest and driest years on record in the last decade, but there has also been a dramatic increase in forest fuels since Euro-American use of the land began in the early 20th century. Moreover, drought also contributed to the accumulation of forest fuels in the ranching period by killing trees and this may have contributed to the recent high severity fires.
46
Recent tree mortality that has contributed to fuel accumulation in GMNP mixed conifer forests was associated with sustained periods of drought. High tree mortality occurred between 1945 to 1955 and 1995 to 2003. Tree mortality, however, was not simply associated with dry years. Statistically significant associations between low moisture and high tree mortality were only found for multi-year periods. This indicates that although any annual drought may be severe, elevated tree mortality is mainly associated with dry conditions over extended periods.
Intense competition for water in the dense forests in GNMP probably increased their vulnerability to drought triggered die-back. In dense stands, increased water stress during drought increases the susceptibility of trees to mortality factors (Gerecke, 1990; Ferrell, 1996; Allen and Breshears, 1998). In other parts of the Southwest, ponderosa pine and pinyon-juniper forests experienced similar high levels of tree mortality during the same time periods (Swetnam and Betancourt 1998; Allen and Breshears, 1998; Breshears et al. 2005). In GMNP, Southwestern white pine was probably more affected than other species. Dead standing Southwestern white pine comprised 75% of the dead tree population. Similar droughts were experienced in northern Baja California, but there was lower tree mortality (Savage, 1997; Minnich et al, 2000; Maloney and Rizzo, 2002; Stephens et al. 2004). Fire exclusion, by increasing tree density, may have amplified the effects of drought. The ultimate cause of tree mortality during these drought periods was probably insect attack (i.e. Dendroctonus spp.). Prolonged water stress from drought increases the susceptibility of trees to insect attack (Mattson and Haack, 1987; Ferrell, 1996) and high mortality from bark beetles and other insects have been observed during drought throughout the western U.S. (Ferrel et al., 1994; Swetnam and Betancourt 1998; Breshears et al. 2005).
Fire regimes in the mixed conifer forests varied with historical time period. Fire occurrence and area burned declined dramatically after 1922 when livestock was introduced and then a policy of fire suppression was implemented when the area became a national park. The record of fire scars shows an enormous decline in fire and is a robust indicator of the magnitude of the fire regime change in GMNP. Mixed conifer forests changed after exclusion of fire. Forest density and basal area increased and forest composition has shifted. Ponderosa pine and Southwestern white pine are decreasing relative to pinyon pine and Douglas-fir. The forest change corresponds with the date of onset of fire exclusion. Overall, these forest changes have increased forest density and forest cover at both the stand and landscape scale compared to forest conditions at the end of the pre-fire exclusion period. The temporal coincidence of the fire frequency decline and the large increase in the establishment of fire sensitive trees implicate fire exclusion as being the major cause of forest change during the 20th century GMNP mixed conifer forests. The tree-ring based method used in this study to estimate pre fire exclusion forest conditions has limitations and assumes that evidence of the reference forest was present in the contemporary forest sample. Complete decay or consumption of wood by fire could eliminate the physical legacy of the original forest (Fule et al. 1997; Stephenson 1999). Decay resistance varies with tree size and by species. For example, fir decays more rapidly than pine associates and large trees decay and decompose faster than small ones (Kimmey 1955; Harmon et al. 1987). Therefore, the part of the estimate of pre fire exclusion forest conditions contributed by trees that were dead in 2004 is probably more reliable for large rather than small trees. The sensitivity analysis indicates that estimates of pre-fire suppression tree density and tree size did not vary much (<15 %) under different decomposition conditions and that estimates for these variables are more robust than those for tree basal area.
47
Use of the reconstruction method in GMNP was also restricted to trees that consistently produce annual growth rings. For example, the density, basal area and diameter of alligator juniper in the reference forest could not be reconstructed. Yet alligator juniper is an abundant species in forests that occupy drier sites. Similarly, other trees that were locally abundant (i.e. Ostrya knowltonii; Acer grandidentatum, Quercus muehlenbergii; Juniperus monosperma) were not included. Moreover, understory plants could not be included and forbs and grasses were probably very important historically as fuel for the fire regimes and they were likely an important component of overall species diversity. Despite these limitations the reference forest and fire regime data provide a strong foundation for guiding restoration planning and developing treatment prescriptions for the mixed conifer forests in GMNP.
Conclusions
Restoring and maintaining the highly altered mixed conifer forests to a pre fire exclusion condition is a key objective of GMNP fire and resource managers, and managers in the Lincoln National Forest, who have similar fire management goals for lands adjacent to GMNP. A stumbling block to developing restoration plans for mixed conifer forests has been a lack of quantitative reference data on forest structure and fire regimes. This study fills that gap and provides a foundation for development of structural goals in restoration plans. Reference conditions reconstructed for mixed conifer forests in GMNP suggest that restoration objectives should emphasize: 1) density and basal area reduction primarily of smaller diameter trees (85% or more of pinyon pine <20 cm dbh, ponderosa pine <35 cm dbh, Southwestern white pine <20 cm dbh, Douglas-fir <35 cm dbh, and Gambel oak <10 cm dbh are younger than 100 years old); 2) reintroduction of frequent fire as a process regulating forest structure and dynamics; and 3) increasing structural heterogeneity across the forest landscape.
Given the key role of fire in regulating historic forest structure and a mandate for managers to maintain and/or restore forest conditions to pre fire exclusion conditions reintroducing fire should be a central component of the fire and resource management goals from GMNP mixed conifer forests. However, fire should not be viewed as the only available tool to manipulate forest fuels in highly changed forests, at least in the early stages of restoring forests to conditions similar to those in the pre-fire exclusion period. Combinations of mechanical treatment and prescribed fire that reduce surface fuels, increase height to live crown base, decrease crown density, and keep large diameter trees in the forest will reduce the risk of crown fire (high severity fire) (Agee and Skinner 2005). High severity fire was rare in GMNP mixed conifer forests prior to fire exclusion, but they have occurred recently (1990s). Combinations of pile burning, low thinning and prescribed fire have been observed and modeled to reduce fire behavior in treated Southwestern ponderosa pine forests and mixed conifer forests in California (van Wagtendonk 1997; Finney et al. 2005). Initial efforts should manipulate fuel characteristics that will keep fireline intensity below the critical level, or that associated with crown fire initiation and be placed strategically on the landscape to reduce high continuity of hazardous fuel conditions. Prescriptions should also emphasize what the residual structure will be after treatment, not just what will be removed, so that potential fire behavior can be analyzed (Agee et al. 2000).
Measurements of stand structure indicate that there was a wide range of conditions on the pre fire exclusion landscape. Managers should emphasize development of prescriptions that promote variability in conditions across the landscape rather than average ones. Consequently, the reference estimates for forest structure and fire regimes

48
provided by this study should not be viewed as rigid targets that define an acceptable restoration treatment (Allen et al. 2002). Instead, they represent the foundation for articulating restoration plans and designs to assist managers in meeting management objectives.
49
Acknowledgements We thank the staff at Guadalupe Mountains National Park, especially Fred Armstrong, Tony Armijo, and Jack Kincaid for logistical support. For field assistance we are grateful to Dana Hunting, Mike Kulinski, Emily Oleksiuk, Miles Saunders, Ashley Leisure, Katherine Hess, Adam Edmundson, Derek McGeehan, Devin Yeatman, Irene McKenna and Andy Scholl assisted with lab work. We thank Andy Scholl, Matt Beaty, and Alejandro Guarin and GMNP staff for comments on an earlier draft of the report. LITERATURE CITED Agee, J.K., 1993. Fire Ecology of Pacific Northwest Forests. Island Press, Washington D.C. Agee, J.K., Wakimoto, R.H., Biswell, H.H. 1978. Fire and fuel dynamics of Sierra Nevada conifers. For. Ecol. and Manage. 1, 255-265. Agee, J.K. Bahro, B., Finney, M.A., Omi, P.N., Sapsis, D.B., Skinner, C.N., van Wagtendonk, J.W., Weatherpoon, C.P. 2000. The use of shaded fuel breaks in landscape fire management. For. Ecol. Manage. 127:55-66. Agee, J.K, Skinner, C.N. 2005. Basic principles of forest fuel reduction treatments. For. Ecol. Manage. 211:83-96. Ahlstrand, G. M., 1980. Fire history of a mixed conifer forest in Guadalupe Mountains National Park. In: Stokes, M. A, Dietrich, J. H. (eds.), Proceedings of the Fire History Workshop, General Technical Report RM-81. USDA Forest Service Rocky Mountain forest and Range Experiment Station, Tuscon, Arizona.
Albini, F., 1976. Estimating wildfire behavior and effects. USDA Forest Service, General Technical Report INT-GTR-156.
Allen, C.G., Breshears, D.D., 1998. Drought- induced shift of a forest-woodland ecotone: Rapid landscape response to climate variation. Proc. Nat. Acad. Sci. USA 95, 14839-14842.
Allen, C.D., Savage. M., Falk, D.A., Suckling, K.F., Swetnam, T.W., Schulke, T., Stacey,P.D., Morgan, P., Hoffman, M., Klingel, J.T., 2002. Ecological restoration of southwestern ponderosa pine forests. Ecol. Appl. 12, 1418-1433.
Alley, W. A., 1984. The Palmer Drought Severity Index: limitation and assumptions. J. Clim. Appl. Meteor. 23, 1100-1109. Arno, S. F., Sneck, K. M., 1977. A method for determining fire history in coniferous forests of the mountain west. U.S.D.A. Forest Service Intermountain Forest and Range Experiment Station General Technical Report INT-42.
50
Baisan, C. H., Swetnam, T. W., 1990. Fire history on a desert mountain range: Rincon Mountain Wilderness, Arizona, U.S.A. Can. J. For. Res. 20, 1559-1569. Beaty, R. M., Taylor, A. H., 2001. Spatial and temporal variation of fire regimes in a mixed conifer forest landscape, Southern Cascades, California, USA. J. Biogeogr. 28, 955-966. Beers, T. W., P. E. Dress, and L. C. Wensel. 1966. Aspect transformation in site productivity research. Journal of Forestry 64, 691-692. Biswell, H.H., 1989. Prescribed burning in California wildlands vegetation management. University of California Press, Berkeley, California. Breshears, D.D., Cobb, N.S., Rich, P.M., Price, K.P., Allen, C.D., Ballice, R.G., Romme, W.H., Kastens, J.H., Floyd, M.L., Belnap, J., Anderson, J.J., Myers, O.B., Meyer, C.W. 2005. Regional vegetation die-off on response to global-change-type drought. Proceedings of the National Academy of Science 102, 15144-15148. Brown, P. M., Kaye, M. W., Huckaby, L. S., Baisan, C. H., 2001. Fire history along environmental gradients in the Sacramento Mountains, New Mexico: influences of local patterns and regional processes. Ecoscience 8, 115-126. Caprio, A. C., Swetnam, T. W., 1995. In: Symposium on fire in wilderness and park management. USDA Forest Service Intermountian Research Station, Missoula, MT. Cocke, A.E., Fule. P.Z., Crouse, J.E., 2005. Forest change on a steep mountain gradient after extended fire exclusion: San Francisco Peaks, Arizona, USA. J. Appl. Ecol. 42, 814-823. Cooper, C. F., 1960. Changes in vegetation, structure, and growth of southwestern pine forests since white settlement. Ecol. Monogr. 30, 129-164.
Covington, W. W., Moore, M. M., 1994. Southwestern ponderosa forest structure. J. For. 92, 39-47. Diaz, H., Margraf V. (eds) 2000. El Nino and southern oscillation: multiscale variability and global and regional impacts. Cambridge University Press, New York. Dietrich, J., 1980. In: Stokes, M. A. and Dietrich, J. H. (eds.). Proceedings of the Fire History Workshop, General Technical Report RM-81.USDA Forest Service Rocky Mountain forest and Range Experiment Station, Tuscon, Arizona.
Fabry, J. K., 1988. Guadalupe Mountains National Park: an administrative history US National Park Service, Southwest Cultural Resources Center, Santa Fe, NM.
Ferrell, G. T., 1996. The influence of insect pests and pathogens on Sierra Forests. In: Sierra Nevada Ecosystem Project: Final report to congress, Vol. II, Assessments and Scientific Basis for Management Options. Centers for Water and Wildland Resources. University of California, Davis, Waters Resources Center Report No. 37, pp 1177-1192.
51
Ferrell, G. T., Otrosina, W. J., Demars, C.J., 1994. Predicting susceptibility of white fir during a drought-associated outbreak of the fir engraver, Scolytus ventralis, in California. Canadian. J. For. Res. 24, 302-305. Finney, M.A., McHugh, C.W., Grenfell, I.C. Stand-and landscape-level effects of prescribed burning on two Arizona wildfires. Canadian Journal of Forest Research 35:1724-1722. Fonda, R., Belanger, L., Burley, L., 1998. Burning characteristics of western conifer needles. Northwest Science 72, 1-9.
Fule, P. Z., Covington, W. W., Moore, M. M., 1997. Determining reference conditions for ecosystem management of southwestern ponderosa pine forests. Ecol. Appl. 7, 895-908. Fule, P.Z., Crouse, J.E., Heinlein, T.A., Moore, M.M, Covington, W.W., Verkamp, G., 2003. Mixed-severity fire regime in a high-elevation forest of Grand Canyon, Arizona, USA. Landscape Ecol. 18, 465-485. Gerecke, K.L. 1990. Tannensterben und Neuartige Waldschaden Eit Beitrag aus der Sicht der Waldwachstunskunde. Allg. Forst. Jagxstg. 161, 81-96. Gotelli, N. J., Ellison, A. M. 2004. A primer of ecological statistics. Sinauer Associates, Inc. Sunderland. Grissino-Mayer, H. D., Swetnam, T. W., 2000. Century-scale climate forcing of fire regimes in the American Southwest. The Holocene 10, 207-214. Harmon, M.E., K. Cromack, and B.G. Smith. 1987. Coarse woody debris in mixed conifer forests, Sequoia National Park, California. Can. J. For. Res. 17, 1265-1272 Heyerdahl, E. K., Brubaker, L. B., Agee, J. K., 2001. Spatial controls of historical fire regimes: A multiscale example from the interior west, USA. Ecol. 82, 660-678.
Jameson, W. C., 1994. The Guadalupe Mountains: Island in the Desert. Texas Western Press, El Paso, TX.
Kaufmann, M.R., Huckalbey, L. Regan, C., Popp, J. 1998. Forest reference conditions for ecosystem management in the Sacramento Mountains, New Mexico. USDA Forest Service General Technical Report RMRS-GTR-19.
Kaufmann, M.R., Reagan, C.M., Brown, P.M., 2000. Heterogeneity in ponderosa pine/Douglas-fir forests: age and size structure in unlogged and logged landscapes of central Colorado. Can. J. For. Res., 30, 698-711.
Kilgore, B.M., Taylor, D., 1979. Fire history of a sequoia-mixed conifer forest. Ecol. 60, 129-142.
Kimmey, J.W. 1955. Rate of deterioration of fire-killed timber in California. USDA Circular No. 962
52
Kittams, W. H., 1972. Effect of fire on vegetation of the Chihuahuan Desert region. In: Komarek, E. V. (ed.) Proceedings of the Tall Timbers Fire Ecology Conference. Lubbock, TX. pp. 427-444.
Kitzberger, T., Swetnam, T.W., Veblen, T.T., 2001. Inter-hemispheric synchrony of forest fires and the El Nino-Southern Oscillation. Global Ecol. Biogeogr. 10, 315-326.
Maloney, P.E., Rizzo, D.M., 2002. Pathogens and insects in a pristine forest ecosystem: the Sierra San Pedro Martir. Baja, Mexico. Can.adian J. For. Res. 32, 448-457.
Maser, C., R. G. Anderson, K. J. Cromack, J. T. Williams, and R. E. Martin. 1979. Dead and down woody material. Pages 78-95 in J. W. Thomas, editor. Wildlife habitats in managed forests - the Blue Mountains of Oregon and Washington. USDA Forest Service, Washington D.C.
Mast, J.N., Wolf, J.J., 2004. Ecotonal changes and altered tree spatial patterns in lower mixed-conifer forests, Grand Canyon National Park, Arizona, U.S.A. Landscape Ecol. 19, 167-180. Mattson, W. J., Haack, R.A., 1987. The role of drought in outbreaks of plant-eating insects. Biosci. 37, 110-118. Minnich, R. A., Barbour, M. G. Burk, J. H., Sosa-Ramírez, J., 2000. Californian mixed-conifer forests under unmanaged fire regimes in the Sierra San Pedro Mártir, Baja California, Mexico. J. Biogeography. 27, 105-129. Niering, W.A., Lowe C.H., 1984. Vegetation of the Santa Catalina Mountains: Community types and dynamics. Vegetatio 58, 3-28 Parker, A. J., 1982. The topographic relative moisture index: an approach to soil moisture assessment in mountian terrain. Physical Geogr. 3, 160-168. Pyne, S.J., 1982. Fire in America. A cultural history of wildland and rural fire. Princeton University Press, Princeton, New Jersey.
Rothermel, R.C., 1983. How to predict the spread and intensity of wildfires. USDA Forest Service General Technical Report INT-GTR-143.
Savage, M., 1997. The role of anthropogenic influences in a mixed conifer forest mortality episode. J. Vegetation Sci. 8, 95-104. Savage, M., Swetnam, T. W. 1990. Early 19th-century fire decline following sheep pasturing in a Navajo Ponderosa Pine forest. Ecology 71, 2374-2378.
Stahle, D. W. 1992. NOAA, International Tree-Ring Data Bank, Guadalupe Peak, Texas Stephens, S.L., 2001. Fire history differences in adjacent Jeffrey pine and upper montane forests in the eastern Sierra Nevada. Int. J. Wildland Fire 10, 161-167.
53
Stephens, S.L., 2004. Fuel loads, snag abundance, and snag recruitment in an unmanaged Jeffrey pine mixed conifer forest in northwestern Mexico. For. Ecol. Manage. 199,103-113. Stephenson, N. 1999. Reference conditions for giant sequoia forest restoration: structure, process, and precision. Ecological Applications 9, 1253-1265. Stohlgren, T.J. 1988. Litter dynamics in two Sierran mixed conifer forests, I. Litterfall and decomposition rates. Can. J. For. Res. 18, 1127-1135. Stokes, M. A., Smiley, T. L., 1968. An Introduction to Tree-Ring Dating. University of Chicago Press, Chicago. Swetnam,T.W., Baisan, C.H., 1996. Historical fire regime patterns in the southwestern United States since 1700. In: C.D. Allend (ed.). Fire effects in southwestern Forests: Proceedings of the 2nd La Mesa Fire Symposium, U.S. Department of Agriculture, Forest Service General Technical Report RM-GTR-286. Los Alamos, New Mexico. Swetnam, T.W., and Betancourt, J.L., 1998. Mesoscale disturbance and ecological response to decadal climatic variability in the American Southwest. J. Clim. 11, 3128-3147. Swetnam, T.W., Allen, C.D., Betancourt, J.L., 1999. Applied historical ecology: Using the past to manage for the future. Ecol. Appl. 9, 1189-1206.
Taylor, A.H., 1990. Tree invasion of meadows in Lassen Volcanic National Park, California. Prof. Geographer 42, 457-470. Taylor, A. H., 2000. Fire regimes and forest changes in mid and upper montane forests of the southern Cascades, Lassen Volcanic National Park, USA. J. Biogeogr. 27, 87-104. Taylor, A. H., Skinner, C. N., 2003. Spatial patterns and controls on historical fire regimes and forest structure in the Klamath Mountains. Ecol. Appl. 13, 704-719. Touchan, R., Swetnam, T.W., Grissino-Mayer H.D., 1995. Effects of livestock grazing in pre-settlement fire regimes in New Mexico. In: J.K. Brown, R.W. Mutch, C.W. Spoon, and R.H. Wakimoto (eds.). Proceedings: Symposium on Fire in Wilderness and Park Management, U.S. Department of Agriculture, Forest Service General Technical Report INT-GTR-320. pp. 268-272. Turner, M. G., R. H. Gardner, and R. V. O'Neill. 2001. Landscape Ecology in Theory and Practice: pattern and process. Springer, New York. USDI 2005. Guadalupe Moutains National Park Draft Fire Management Plan. van Wagtendonk, J.W., 1996. Use of deterministic fire growth model to test fuel treatments. In : Sierra Nevada Ecosystem Project: Final Report ot Congress, vol. II Assessments and Scientific Basis for Management Options. University of California Davis. Centers for Water and Wildland Resoruces, pp. 1155-1165.

54
van Wagtendonk, J.W., 1998. Fuel bed characteristics of Sierra Nevada conifers. Western J. Appl. For. 13, 73-84. Whittaker, R.H., Niering, W.A., 1965. Vegetation of the Santa Catalina Mountains, Arizona: II. A gradient analysis of the south slope. Ecol. 46, 429-452. Zar, J. H. 1999. Biostatistical Analysis. Prentice Hall, Upper Saddle River, New Jersey.
Copyright © 2022 FDOKUMEN