Fine sediment transport and accumulations at the mouth of the Seine estuary (France)
14
950 Q 2001 Estuarine Research Federation Estuaries Vol. 24, No. 6B, p. 950–963 December 2001 Fine Sediment Transport and Accumulations at the Mouth of the Seine Estuary (France) PIERRE LE HIR 1,* ,ANDRE FICHT 2 ,RICARDO SILVA JACINTO 1 ,PATRICK LESUEUR 3 , JEAN-PAUL DUPONT 4 ,ROBERT LAFITE 4 ,ISABELLE BRENON 5 ,BENEDICTE THOUVENIN 6 , and PHILIPPE CUGIER 1 1 Institut Franc ¸ais de Recherche pour l’Exploitation de la Mer, Centre de Brest, BP 70 29280, Plouzane ´, France 2 Service de la Navigation de la Seine, 71 Avenue J. Chastellain, 76100 Rouen, France 3 Laboratoire de Morphodynamique, Universite ´ de Caen, Esplanade de la Paix, 14032 Caen Cedex, France 4 Departement de Ge ´ologie, Universite ´ de Rouen, 76821 Mont-Saint-Aignan Cedex, France 5 Centre Littoral de Ge ´ophysique, Universite ´ de la Rochelle, Avenue Marillac, 17042 La Rochelle, France 6 Institut Franc ¸ais de Recherche pour l’Exploitation de la Mer, centre de Toulon, Zone Portuaire de Bre ´gaillon, B.P. 330 83507 La Seyne sur Mer, France ABSTRACT: A comprehensive study of fine sediment transport in the macrotidal Seine estuary has been conducted, including observations of suspended particulate matter (SPM), surficial sediment, and bathymetric data, as well as use of a three dimensional mathematical model. Tide, river regime, wind, and wave forcings are accounted. The simulated turbidity maximum (TM) is described in terms of concentration and location according to tidal amplitude and the discharge of the Seine River. The TM is mainly generated by tidal pumping, but can be concentrated or stretched by the salinity front. The computed deposition patterns depend on the TM location and are seasonally dependent. The agreement with observations is reasonable, although resuspension by waves may be overestimated. Although wave resus- pension is likely to increase the TM mass, it generally occurs simultaneously with westerly winds that induce a transverse circulation at the mouth of the estuary and then disperse the suspended material. The resulting effect is an output of material related to wind and wave events, more than to high river discharge. The mass of the computed TM remains stable over 6 months and independent of the river regime, depending mainly on the spring tide amplitude. Computed fluxes at different cross-sections of the lower estuary show the shift of the TM according to the river flow and point out the rapidity of the TM adjustment to any change of river discharge. The time for renewing the TM by riverine particles has been estimated to be one year. Introduction With a catchment area of 78,000 km 2 where 40% of the French population and industry is concen- trated, including Paris, the Seine estuary is subject to the discharge of numerous contaminants. Some of them are likely to adsorb to fine particles and then follow pathways determined by sediment transport processes and speciation characteristics; this is the case of cadmium and polychlorobiphen- yl (Abarnou et al. 1987; Gonzalez et al. 2001). In the upper estuary, the residual transit of particles to the mouth varies with river discharge because of different residual flow patterns, but also because of possible trapping on lateral mudflats, the resus- pension of which depends on the tidal amplitude and again on the river discharge. A large part of * Corresponding author; tele: 33(0)2 98 22 43 40; fax: 33(0)2 98 22 45 94; e-mail: [email protected]. the sediment is trapped in the Rouen harbor (Fig. 1) and is annually dredged but not put back in the estuary. These mechanisms, specific for the upper reaches of the Seine estuary, are not considered here. When particles and associated contaminants reach the river mouth, they merge into the turbid- ity maximum (TM). Then the ultimate discharge in the coastal sea is bound to the processes affect- ing the TM, in particular its possible shift outward from the estuary when the river flow is high. As a consequence, the study of contaminant pathways from the catchment area towards the sea requires a good knowledge of geochemical processes within the TM (Gonzalez et al. 2001) and of the behavior of this TM and related deposition patterns. Open to the English Channel (Fig. 1), the Seine estuary is macrotidal with a spring tidal range of 7 m. The tide is characterized by a long high water
-
Upload
independent -
Category
Documents
-
view
1 -
download
0
Transcript of Fine sediment transport and accumulations at the mouth of the Seine estuary (France)
950Q 2001 Estuarine Research Federation
Estuaries Vol. 24, No. 6B, p. 950–963 December 2001
Fine Sediment Transport and Accumulations at the Mouth of the
Seine Estuary (France)
PIERRE LE HIR1,*, ANDRE FICHT2, RICARDO SILVA JACINTO1, PATRICK LESUEUR3,JEAN-PAUL DUPONT 4, ROBERT LAFITE4, ISABELLE BRENON5, BENEDICTE THOUVENIN6,and PHILIPPE CUGIER1
1 Institut Francais de Recherche pour l’Exploitation de la Mer, Centre de Brest, BP 70 29280,Plouzane, France
2 Service de la Navigation de la Seine, 71 Avenue J. Chastellain, 76100 Rouen, France3 Laboratoire de Morphodynamique, Universite de Caen, Esplanade de la Paix,
14032 Caen Cedex, France4 Departement de Geologie, Universite de Rouen, 76821 Mont-Saint-Aignan Cedex, France5 Centre Littoral de Geophysique, Universite de la Rochelle, Avenue Marillac,
17042 La Rochelle, France6 Institut Francais de Recherche pour l’Exploitation de la Mer, centre de Toulon, Zone Portuaire de
Bregaillon, B.P. 330 83507 La Seyne sur Mer, France
ABSTRACT: A comprehensive study of fine sediment transport in the macrotidal Seine estuary has been conducted,including observations of suspended particulate matter (SPM), surficial sediment, and bathymetric data, as well as useof a three dimensional mathematical model. Tide, river regime, wind, and wave forcings are accounted. The simulatedturbidity maximum (TM) is described in terms of concentration and location according to tidal amplitude and thedischarge of the Seine River. The TM is mainly generated by tidal pumping, but can be concentrated or stretched bythe salinity front. The computed deposition patterns depend on the TM location and are seasonally dependent. Theagreement with observations is reasonable, although resuspension by waves may be overestimated. Although wave resus-pension is likely to increase the TM mass, it generally occurs simultaneously with westerly winds that induce a transversecirculation at the mouth of the estuary and then disperse the suspended material. The resulting effect is an output ofmaterial related to wind and wave events, more than to high river discharge. The mass of the computed TM remainsstable over 6 months and independent of the river regime, depending mainly on the spring tide amplitude. Computedfluxes at different cross-sections of the lower estuary show the shift of the TM according to the river flow and point outthe rapidity of the TM adjustment to any change of river discharge. The time for renewing the TM by riverine particleshas been estimated to be one year.
IntroductionWith a catchment area of 78,000 km2 where 40%
of the French population and industry is concen-trated, including Paris, the Seine estuary is subjectto the discharge of numerous contaminants. Someof them are likely to adsorb to fine particles andthen follow pathways determined by sedimenttransport processes and speciation characteristics;this is the case of cadmium and polychlorobiphen-yl (Abarnou et al. 1987; Gonzalez et al. 2001). Inthe upper estuary, the residual transit of particlesto the mouth varies with river discharge becauseof different residual flow patterns, but also becauseof possible trapping on lateral mudflats, the resus-pension of which depends on the tidal amplitudeand again on the river discharge. A large part of
* Corresponding author; tele: 33(0)2 98 22 43 40; fax: 33(0)298 22 45 94; e-mail: [email protected].
the sediment is trapped in the Rouen harbor (Fig.1) and is annually dredged but not put back in theestuary. These mechanisms, specific for the upperreaches of the Seine estuary, are not consideredhere.
When particles and associated contaminantsreach the river mouth, they merge into the turbid-ity maximum (TM). Then the ultimate dischargein the coastal sea is bound to the processes affect-ing the TM, in particular its possible shift outwardfrom the estuary when the river flow is high. As aconsequence, the study of contaminant pathwaysfrom the catchment area towards the sea requiresa good knowledge of geochemical processes withinthe TM (Gonzalez et al. 2001) and of the behaviorof this TM and related deposition patterns.
Open to the English Channel (Fig. 1), the Seineestuary is macrotidal with a spring tidal range of 7m. The tide is characterized by a long high water
Fine Sediment Transport and Accumulations 951
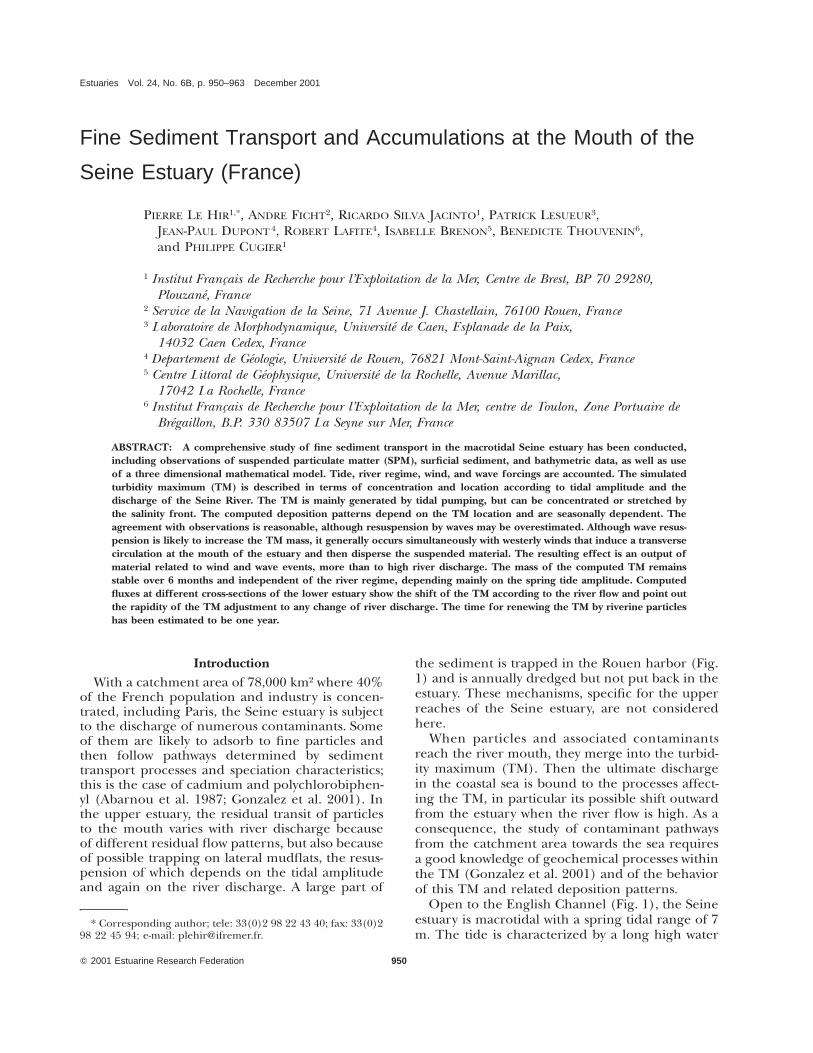
Fig. 1. Location of the Seine estuary and the Eastern Baiede Seine with detail of the Seine estuary mouth.
slack (2 to 3 h) due to an amplification of 4th and6th diurnal harmonic components across the En-glish Channel (Le Provost et al. 1986); the flow isasymmetric in favor of the flood, even in the Baiede Seine. This trend increases when the tide prop-agates up the estuary (e.g., Brenon and Le Hir1999), as in many estuaries. The Seine estuary is160 km long, limited upstream by a weir at Poses.The mean river discharge is 410 m3 s21, with high-est flow rates exceeding 2,200 m3 s21 and a mini-mum of 40 m3 s21 (Guezennec et al. 1999). Themean annual particulate discharge has been eval-uated around 500,000 t (Avoine 1986) as suspend-ed matter.
The mouth of the estuary is shown to be fillingin, and the advance of the estuary into the Baie deSeine has been particularly active between 1972and 1992 (Avoine et al. 1995) corresponding to amean annual sedimentation rate of more than 5 3106 m3. The case of the Seine is specific in thesense that several engineering works have beendone at the mouth for several decades, in order tofacilitate shipping access to Rouen harbor, 110 kmupstream. The navigation channel has been regu-larized and deepened, and two submersible dikeshave been constructed on each side of this mainchannel in order to favor seawards sediment flush-ing by ebb currents.
In the meantime, the TM has shifted down-stream nearly 50 km in 20 years (Avoine et al.1981). Now located at the mouth, the TM is likelyto get out of the estuary during high river runoff,and then decrease in mass or settle on lateral in-tertidal flats that extend along the northern side
of the mouth. In the area of the estuary mouth,the surficial sediment becomes more and moremuddy (Lesourd et al. 2001).
The present paper aims to synthetize the resultsrelated to the TM behavior and its connection withfine sediment deposition patterns from investiga-tions of the Seine Aval project.
MethodsMost results of our study have been produced by
the means of mathematical models, which aremore suitable to integrate components over spaceand/or time and to produce mean quantities andbudgets. Such models have to be first calibratedand then validated, so many measurements wereperformed initially.
FIELD MEASUREMENTS
In the framework of a former planning schemeof the estuary, the Seine estuary SAUM (Schemad’Aptitude et d’Utilisation de la Mer), several hy-drologic campaigns have been performed. On thebasis of surface, mid-depth, and bottom samplingfrom 3 anchored boats during consecutive days,the semi-diurnal evolution of profiles of salinity,suspended particulate matter (SPM), and currentscould be produced for several river regimes andtidal amplitudes during the period 1978–1979(Avoine 1981). These measurements constitute aninvaluable data set which is still used for modelvalidation as justified further.
Within the Seine-Aval project, new campaignswith hourly surface, mid-depth, and bottom sam-pling at anchored stations have been conducted,for several tidal and river flow conditions between1993 and 1995 (Dupont et al. 1996) allowing acomparison with the SAUM measurements.
Monthly hydrologic surveys of the estuary havebeen carried out for more than 30 years. They areall conducted in similar conditions, i.e., startingdownstream of Honfleur just before local low wa-ter, and then following the flooding tide up toRouen. Although sampling only concerns the wa-ter surface, which is not representative of turbiditypatterns, these measurements are quite interestingbecause they constitute long time series and give acontrol of variation (Ficht and Leprince 1991).
More recently, a continuous measurement sta-tion (MAREL device, Woerther 1999) has been setup at Honfleur close to the channel. Conductivity,temperature, and turbidity sensors are fastened toa float, so that sampled waters remain 1.5 m belowthe surface. Since mid-1997, measurements are re-corded every 10 min; they are not effective aroundlow water in spring, when the system is uncovered.
Monthly measurements of the sediment eleva-tion at 10 stations along a cross-section of the in-
952 P. Le Hir et al.
tertidal mudflat south of Le Havre have been madesince 1996. These measurements enable an inter-pretation of sediment movement, in relation towave and river flow climate. Details are given inSilva Jacinto et al. (1998).
MODEL DEVELOPMENT
The model used here is the three-dimensionalversion of the SAM model (simulation d’advectionmultivariable). This model solves the so-called shal-low-water equations to compute hydrodynamics, as-suming a hydrostatic pressure and using the Bous-sinesq approximation on the density variations.The numerical solution is based on the separationof barotropic and baroclinic modes, and uses thefinite differences technique. An ADI scheme isadopted for the depth-averaged computation ofthe external mode, whereas the full three-dimen-sional resolution of the horizontal velocity com-ponents is implicit on the vertical dimension andexplicit in the horizontal plane. Coupling betweenthe two modes is achieved by providing the watersurface level from the 2D code to the 3D code, andthe friction terms (bottom friction 1 vertical dis-persion) as well as the density gradients from the3D code to the 2D code. The turbulence closureis based on the mixing length concept and thestratification-induced turbulence damping is ac-counted by a damping function involving a localRichardson number. Details are given in Cugierand Le Hir (in press).
The water continuity and momentum equationsare completed by a transport equation for any con-stituent, either dissolved or particulate. For in-stance salinity and SPM are systematically comput-ed, from which the water density is estimated, ne-glecting the effect of temperature variations.
For particulate elements, flocculation processesare roughly accounted for by relating the settlingvelocity Ws to the total suspended sediment con-cention in the following manner:
Ws 5 min{Wmax, maxKWmin, W1 3 H}W2SPM
Wmax, Wmin, and W1,2 depend on the type of parti-cles, with the model allowing the simulation of sev-eral classes.
The deposition rate is computed from the Kroneformulation (e.g., in Brenon and Le Hir 1999), butwith a very large critical bottom stress for deposi-tion (equal to 10 N m22), which means that de-position is always possible. This is reasonable aserosion of fluffy deposits can occur instantaneous-ly, when turbulence is high enough.
The erosion is formulated according to the Par-theniades law with a critical shear stress for erosionthat depends on the surficial sediment dry density,according to a power law. In order to account for
the temporal variations in sediment concentration,a consolidation model is coupled to the sedimenttransport model. This consolidation model solvesthe mass conservation of any particulate constitu-ent, assuming that settling rates within the sedi-ment only depend on its local porosity, accordingto a power law. The problem is closed by a rela-tionship between density and porosity that involvesthe grain density. More details can be found inBrenon and Le Hir (1999).
APPLICATION TO THE SEINE ESTUARY
Hydrodynamics
The model has been implemented on the wholeestuary, south of the parallel of Antifer and east ofthe meridian of Ouistreham (Fig. 1). The compu-tation grid is cartesian irregular, of Arikawa C type,with refined meshes (500 3 200 m) in the area ofHonfleur. The water prism is vertically split intohorizontal layers that are 2 m thick in the estuaryand thicker in deeper zones.
Hydrodynamics are forced by the real tide whichis introduced as harmonic compositions at the seaboundary and uniform winds every 3 h. The SeineRiver discharge is specified every day at Poses (Fig.1). The model has been calibrated by adjusting theroughness length distribution, and the tide prop-agation has been validated by means of tidal gaug-es distributed along the estuary, leading to lessthan 5% error in the study area (Brenon and LeHir 1998). Density patterns have been validatedwith SAUM measurements (Avoine 1981) after cal-ibration of turbulence damping functions for vis-cosity and diffusivity (Cugier and Le Hir in press).
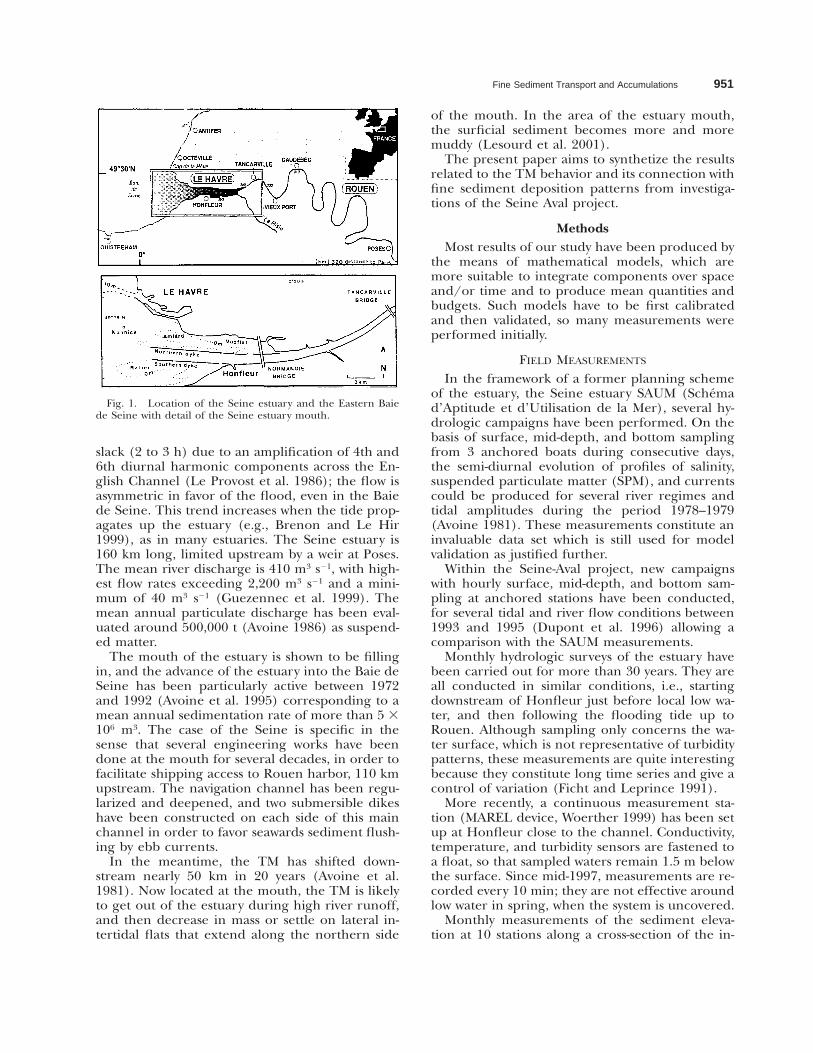
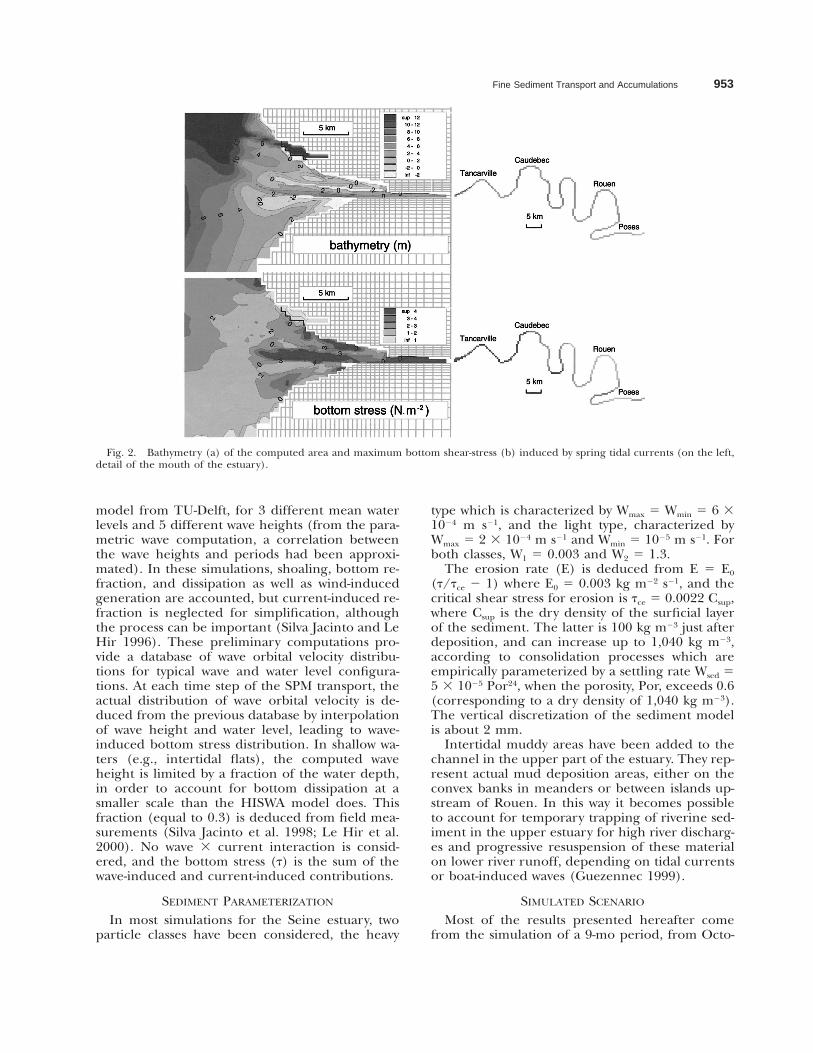
Figure 2 presents bathymetry and computedmaximum bottom shear stress (along a spring tide)in the simulated area. The latter plot exhibitsstrong gradients between the channel and sur-rounding banks, with maximum stresses in deeperareas. Off the mouth, the bottom stress decays (be-low 2 N m22) but then increases again seawardsbecause of strong tidal currents in the northernBaie de Seine and the connected English Channel.The consequence of these features on turbiditypatterns and deposits will be discussed further.
Waves are accounted for by the following pro-cedure. An incident wave (height and period) iscomputed every 3 h by using parametric formula-tions according to the real wind velocity and direc-tion and the fetch characteristics in the Baie deSeine. A previous study had shown that at the es-tuary mouth the offshore swell propagating in theEnglish Channel is strongly refracted and that localwaves are mainly generated by local winds (SilvaJacinto 1997). Wave propagation is simulated inthe study area up to Honfleur, by using the HISWA
Fine Sediment Transport and Accumulations 953
Fig. 2. Bathymetry (a) of the computed area and maximum bottom shear-stress (b) induced by spring tidal currents (on the left,detail of the mouth of the estuary).
model from TU-Delft, for 3 different mean waterlevels and 5 different wave heights (from the para-metric wave computation, a correlation betweenthe wave heights and periods had been approxi-mated). In these simulations, shoaling, bottom re-fraction, and dissipation as well as wind-inducedgeneration are accounted, but current-induced re-fraction is neglected for simplification, althoughthe process can be important (Silva Jacinto and LeHir 1996). These preliminary computations pro-vide a database of wave orbital velocity distribu-tions for typical wave and water level configura-tions. At each time step of the SPM transport, theactual distribution of wave orbital velocity is de-duced from the previous database by interpolationof wave height and water level, leading to wave-induced bottom stress distribution. In shallow wa-ters (e.g., intertidal flats), the computed waveheight is limited by a fraction of the water depth,in order to account for bottom dissipation at asmaller scale than the HISWA model does. Thisfraction (equal to 0.3) is deduced from field mea-surements (Silva Jacinto et al. 1998; Le Hir et al.2000). No wave 3 current interaction is consid-ered, and the bottom stress (t) is the sum of thewave-induced and current-induced contributions.
SEDIMENT PARAMETERIZATION
In most simulations for the Seine estuary, twoparticle classes have been considered, the heavy
type which is characterized by Wmax 5 Wmin 5 6 31024 m s21, and the light type, characterized byWmax 5 2 3 1024 m s21 and Wmin 5 1025 m s21. Forboth classes, W1 5 0.003 and W2 5 1.3.
The erosion rate (E) is deduced from E 5 E0
(t/tce 2 1) where E0 5 0.003 kg m22 s21, and thecritical shear stress for erosion is tce 5 0.0022 Csup,where Csup is the dry density of the surficial layerof the sediment. The latter is 100 kg m23 just afterdeposition, and can increase up to 1,040 kg m23,according to consolidation processes which areempirically parameterized by a settling rate Wsed 55 3 1025 Por24, when the porosity, Por, exceeds 0.6(corresponding to a dry density of 1,040 kg m23).The vertical discretization of the sediment modelis about 2 mm.
Intertidal muddy areas have been added to thechannel in the upper part of the estuary. They rep-resent actual mud deposition areas, either on theconvex banks in meanders or between islands up-stream of Rouen. In this way it becomes possibleto account for temporary trapping of riverine sed-iment in the upper estuary for high river discharg-es and progressive resuspension of these materialon lower river runoff, depending on tidal currentsor boat-induced waves (Guezennec 1999).
SIMULATED SCENARIO
Most of the results presented hereafter comefrom the simulation of a 9-mo period, from Octo-
954 P. Le Hir et al.
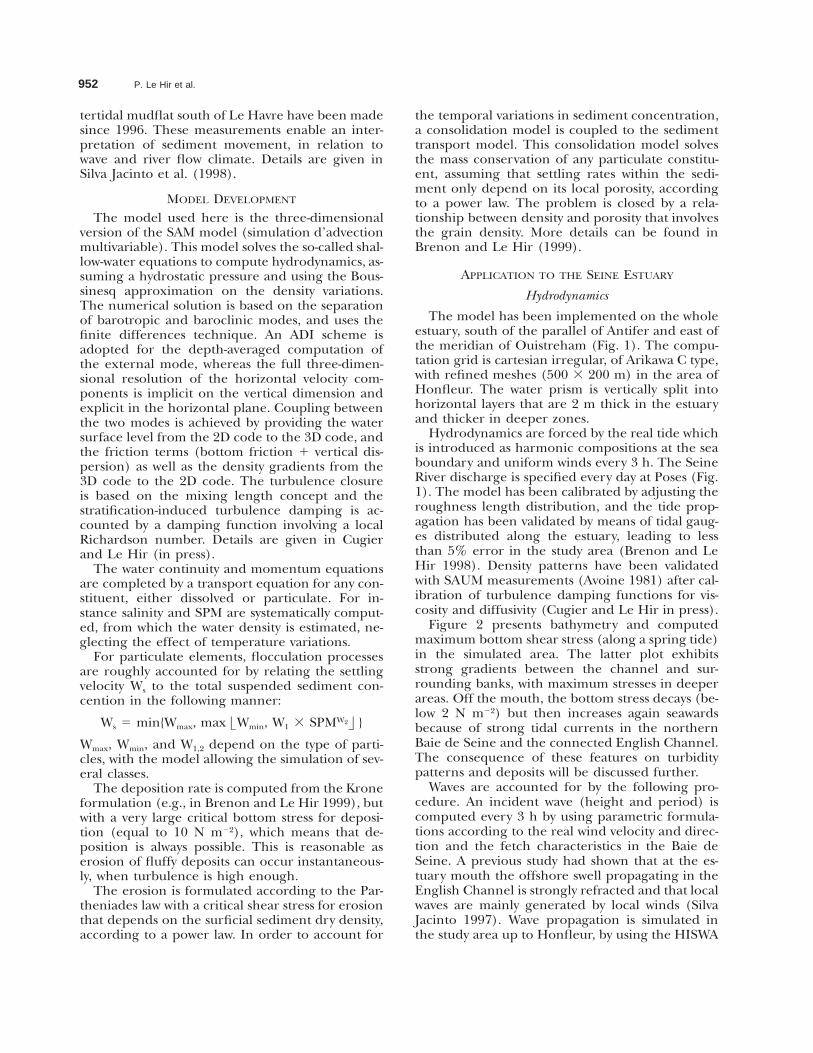
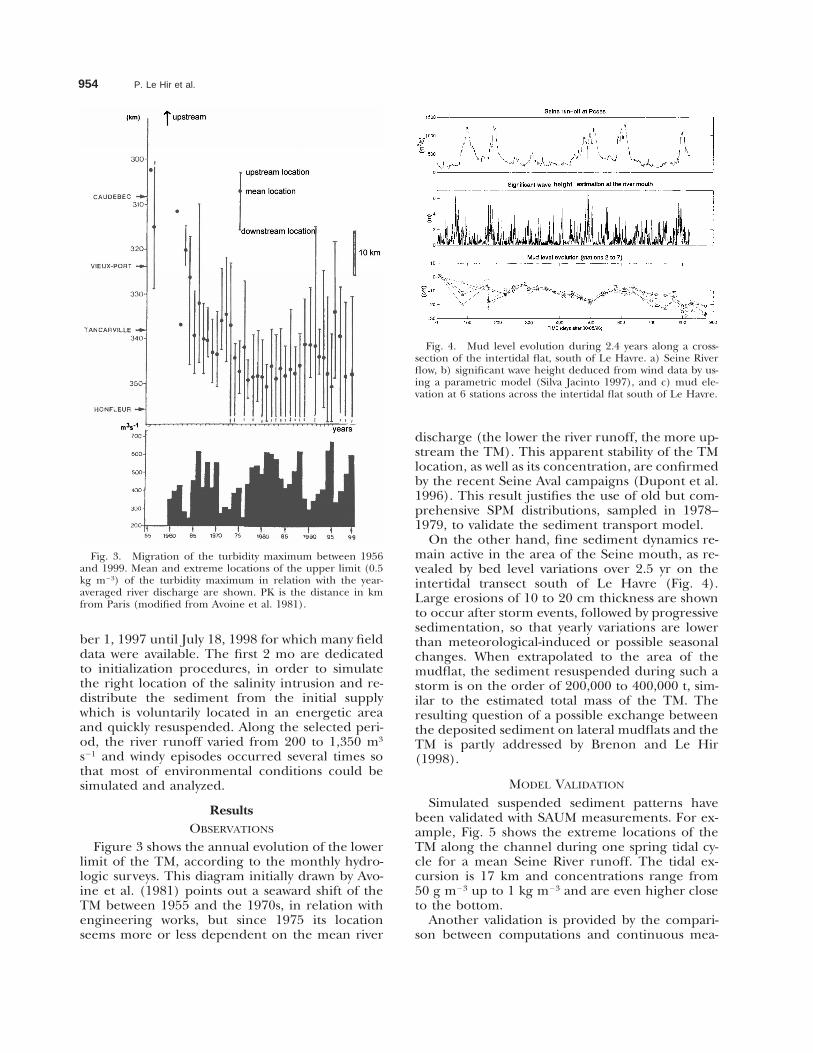
Fig. 3. Migration of the turbidity maximum between 1956and 1999. Mean and extreme locations of the upper limit (0.5kg m23) of the turbidity maximum in relation with the year-averaged river discharge are shown. PK is the distance in kmfrom Paris (modified from Avoine et al. 1981).
Fig. 4. Mud level evolution during 2.4 years along a cross-section of the intertidal flat, south of Le Havre. a) Seine Riverflow, b) significant wave height deduced from wind data by us-ing a parametric model (Silva Jacinto 1997), and c) mud ele-vation at 6 stations across the intertidal flat south of Le Havre.
ber 1, 1997 until July 18, 1998 for which many fielddata were available. The first 2 mo are dedicatedto initialization procedures, in order to simulatethe right location of the salinity intrusion and re-distribute the sediment from the initial supplywhich is voluntarily located in an energetic areaand quickly resuspended. Along the selected peri-od, the river runoff varied from 200 to 1,350 m3
s21 and windy episodes occurred several times sothat most of environmental conditions could besimulated and analyzed.
ResultsOBSERVATIONS
Figure 3 shows the annual evolution of the lowerlimit of the TM, according to the monthly hydro-logic surveys. This diagram initially drawn by Avo-ine et al. (1981) points out a seaward shift of theTM between 1955 and the 1970s, in relation withengineering works, but since 1975 its locationseems more or less dependent on the mean river
discharge (the lower the river runoff, the more up-stream the TM). This apparent stability of the TMlocation, as well as its concentration, are confirmedby the recent Seine Aval campaigns (Dupont et al.1996). This result justifies the use of old but com-prehensive SPM distributions, sampled in 1978–1979, to validate the sediment transport model.
On the other hand, fine sediment dynamics re-main active in the area of the Seine mouth, as re-vealed by bed level variations over 2.5 yr on theintertidal transect south of Le Havre (Fig. 4).Large erosions of 10 to 20 cm thickness are shownto occur after storm events, followed by progressivesedimentation, so that yearly variations are lowerthan meteorological-induced or possible seasonalchanges. When extrapolated to the area of themudflat, the sediment resuspended during such astorm is on the order of 200,000 to 400,000 t, sim-ilar to the estimated total mass of the TM. Theresulting question of a possible exchange betweenthe deposited sediment on lateral mudflats and theTM is partly addressed by Brenon and Le Hir(1998).
MODEL VALIDATION
Simulated suspended sediment patterns havebeen validated with SAUM measurements. For ex-ample, Fig. 5 shows the extreme locations of theTM along the channel during one spring tidal cy-cle for a mean Seine River runoff. The tidal ex-cursion is 17 km and concentrations range from50 g m23 up to 1 kg m23 and are even higher closeto the bottom.
Another validation is provided by the compari-son between computations and continuous mea-
Fine Sediment Transport and Accumulations 955
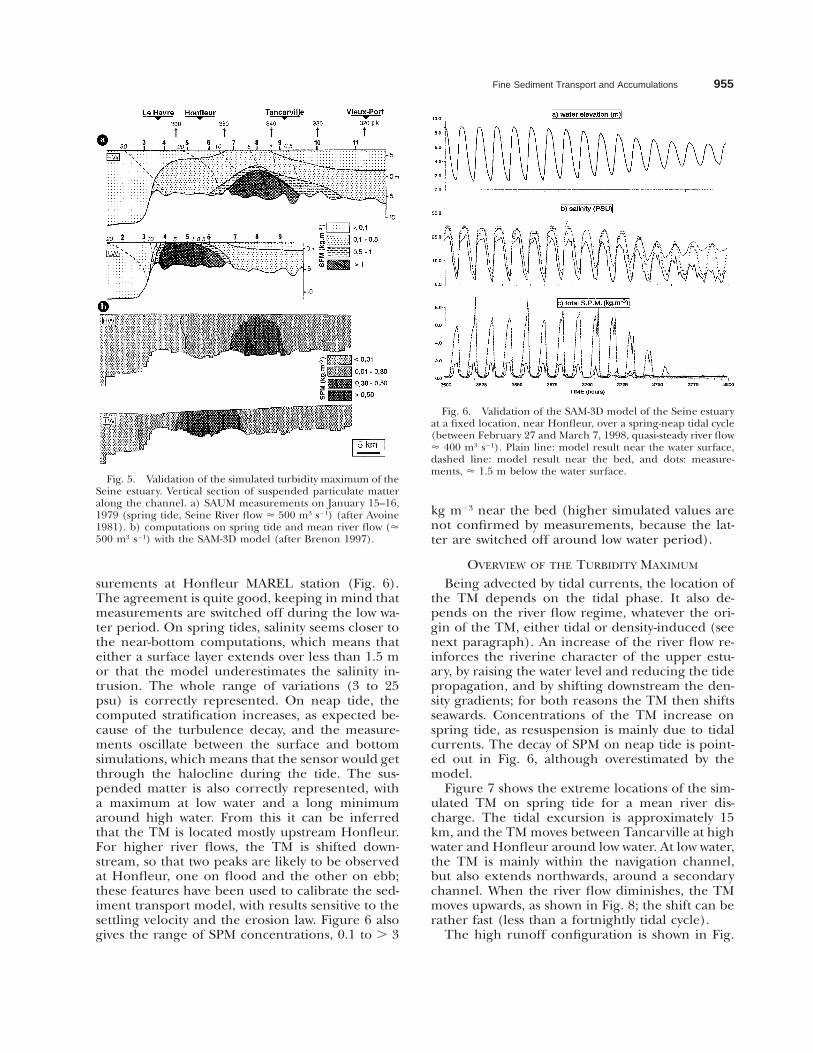
Fig. 5. Validation of the simulated turbidity maximum of theSeine estuary. Vertical section of suspended particulate matteralong the channel. a) SAUM measurements on January 15–16,1979 (spring tide, Seine River flow ø 500 m3 s21) (after Avoine1981). b) computations on spring tide and mean river flow (ø500 m3 s21) with the SAM-3D model (after Brenon 1997).
Fig. 6. Validation of the SAM-3D model of the Seine estuaryat a fixed location, near Honfleur, over a spring-neap tidal cycle(between February 27 and March 7, 1998, quasi-steady river flowø 400 m3 s21). Plain line: model result near the water surface,dashed line: model result near the bed, and dots: measure-ments, ø 1.5 m below the water surface.
surements at Honfleur MAREL station (Fig. 6).The agreement is quite good, keeping in mind thatmeasurements are switched off during the low wa-ter period. On spring tides, salinity seems closer tothe near-bottom computations, which means thateither a surface layer extends over less than 1.5 mor that the model underestimates the salinity in-trusion. The whole range of variations (3 to 25psu) is correctly represented. On neap tide, thecomputed stratification increases, as expected be-cause of the turbulence decay, and the measure-ments oscillate between the surface and bottomsimulations, which means that the sensor would getthrough the halocline during the tide. The sus-pended matter is also correctly represented, witha maximum at low water and a long minimumaround high water. From this it can be inferredthat the TM is located mostly upstream Honfleur.For higher river flows, the TM is shifted down-stream, so that two peaks are likely to be observedat Honfleur, one on flood and the other on ebb;these features have been used to calibrate the sed-iment transport model, with results sensitive to thesettling velocity and the erosion law. Figure 6 alsogives the range of SPM concentrations, 0.1 to . 3
kg m23 near the bed (higher simulated values arenot confirmed by measurements, because the lat-ter are switched off around low water period).
OVERVIEW OF THE TURBIDITY MAXIMUM
Being advected by tidal currents, the location ofthe TM depends on the tidal phase. It also de-pends on the river flow regime, whatever the ori-gin of the TM, either tidal or density-induced (seenext paragraph). An increase of the river flow re-inforces the riverine character of the upper estu-ary, by raising the water level and reducing the tidepropagation, and by shifting downstream the den-sity gradients; for both reasons the TM then shiftsseawards. Concentrations of the TM increase onspring tide, as resuspension is mainly due to tidalcurrents. The decay of SPM on neap tide is point-ed out in Fig. 6, although overestimated by themodel.
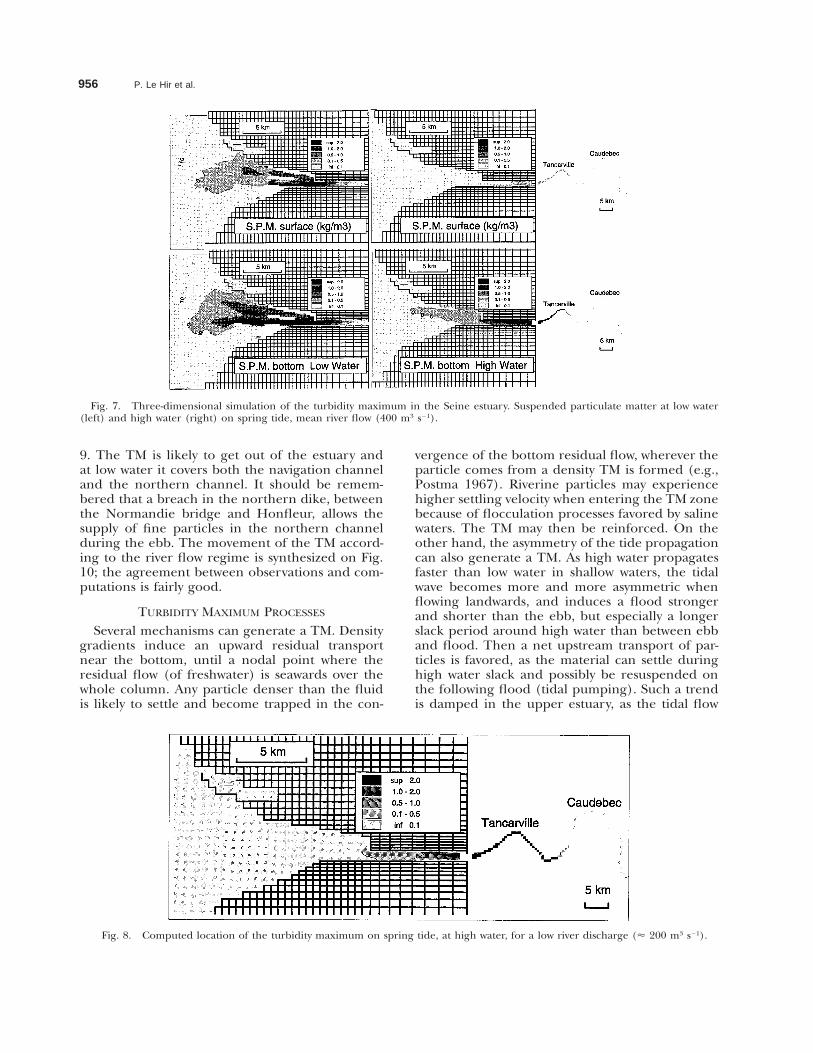
Figure 7 shows the extreme locations of the sim-ulated TM on spring tide for a mean river dis-charge. The tidal excursion is approximately 15km, and the TM moves between Tancarville at highwater and Honfleur around low water. At low water,the TM is mainly within the navigation channel,but also extends northwards, around a secondarychannel. When the river flow diminishes, the TMmoves upwards, as shown in Fig. 8; the shift can berather fast (less than a fortnightly tidal cycle).
The high runoff configuration is shown in Fig.
956 P. Le Hir et al.
Fig. 7. Three-dimensional simulation of the turbidity maximum in the Seine estuary. Suspended particulate matter at low water(left) and high water (right) on spring tide, mean river flow (400 m3 s21).
Fig. 8. Computed location of the turbidity maximum on spring tide, at high water, for a low river discharge (ø 200 m3 s21).
9. The TM is likely to get out of the estuary andat low water it covers both the navigation channeland the northern channel. It should be remem-bered that a breach in the northern dike, betweenthe Normandie bridge and Honfleur, allows thesupply of fine particles in the northern channelduring the ebb. The movement of the TM accord-ing to the river flow regime is synthesized on Fig.10; the agreement between observations and com-putations is fairly good.
TURBIDITY MAXIMUM PROCESSES
Several mechanisms can generate a TM. Densitygradients induce an upward residual transportnear the bottom, until a nodal point where theresidual flow (of freshwater) is seawards over thewhole column. Any particle denser than the fluidis likely to settle and become trapped in the con-
vergence of the bottom residual flow, wherever theparticle comes from a density TM is formed (e.g.,Postma 1967). Riverine particles may experiencehigher settling velocity when entering the TM zonebecause of flocculation processes favored by salinewaters. The TM may then be reinforced. On theother hand, the asymmetry of the tide propagationcan also generate a TM. As high water propagatesfaster than low water in shallow waters, the tidalwave becomes more and more asymmetric whenflowing landwards, and induces a flood strongerand shorter than the ebb, but especially a longerslack period around high water than between ebband flood. Then a net upstream transport of par-ticles is favored, as the material can settle duringhigh water slack and possibly be resuspended onthe following flood (tidal pumping). Such a trendis damped in the upper estuary, as the tidal flow

Fine Sediment Transport and Accumulations 957
Fig. 9. Three-dimensional simulation of the turbidity maximum in the Seine estuary. Suspended particulate matter at low water(left) and high water (right) on spring tide, high river flow (ø 1,000 m3 s21).
Fig. 10. Synthesis on the turbidity maximum location ac-cording to the Seine River discharge. Lines are the extensionof measured turbidities . 0.5 kg m23 (after Avoine 1981) (plain:high water, dashed: low water). Dark circles are the locations ofthe core of the computed turbidity maximum (from the SAM-3D model).
decays in contrast with the river flow. Particles thenaccumulate at the trend inversion (Allen et al.1980; Uncles et al. 1984).
Other mechanisms have been invoked to gen-erate a TM, as for example the variations of tur-bulent mixing according to the tidal phase: stablestratifications on ebb reduce the vertical mixing ofmomentum, whereas advection of denser fluid onflood increases it. This internal tidal asymmetry en-hances the flood dominance in bottom layers andfavors the landward transport of sediment ( Jay and
Musiak 1994). These tidal variations of turbulentmixing modify the vertical distribution of particles,which are likely to settle more easily on ebb. Tur-bulent mixing also decays from the upper estuarydown to the stratified saline intrusion zone, so thatsediment settling (and trapping) is enhanced inthe latter area (Geyer 1993). These processes canbe considered as amplifiers of primary TM mech-anisms, a little like flocculation.
A study of dominant TM mechanisms in theSeine estuary has been undertaken (Brenon 1997;Brenon and Le Hir 1999). A depth-averaged mod-el of the area has been used to simulate the SeineTM in a realistic way, indicating the pre-eminenceof tidal effects (Brenon and Le Hir 1998). Weigh-ing of different processes became affordable byrunning the three-dimensional model with all orpart of them. The dominant role of tidal pumpinghas been confirmed, whereas salinity gradientsmainly act in maintaining fine sediments in the es-tuary and stretch the TM in the direction of thesalinity front (upper location of bottom salinitygradients). In most cases, this salinity front is closeto the core of the tidally-induced TM and thenconcentrates the TM, but in some circumstancesthe theoretical tidal TM is likely to occur upstreamof the salinity front, so that the actual TM isstretched downstream. According to computations,but not validated by measurements, this seems tobe the case of low river runoff, perhaps becausethe adjustment of tidal asymmetry patterns in re-
958 P. Le Hir et al.
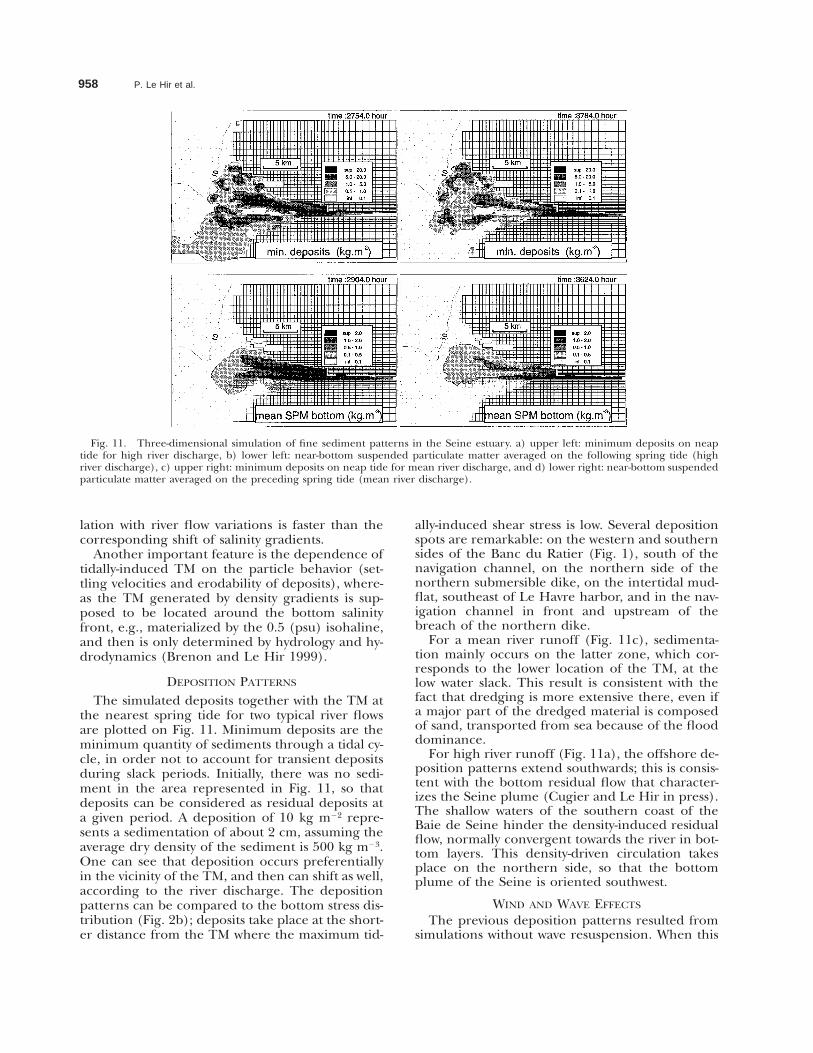
Fig. 11. Three-dimensional simulation of fine sediment patterns in the Seine estuary. a) upper left: minimum deposits on neaptide for high river discharge, b) lower left: near-bottom suspended particulate matter averaged on the following spring tide (highriver discharge), c) upper right: minimum deposits on neap tide for mean river discharge, and d) lower right: near-bottom suspendedparticulate matter averaged on the preceding spring tide (mean river discharge).
lation with river flow variations is faster than thecorresponding shift of salinity gradients.
Another important feature is the dependence oftidally-induced TM on the particle behavior (set-tling velocities and erodability of deposits), where-as the TM generated by density gradients is sup-posed to be located around the bottom salinityfront, e.g., materialized by the 0.5 (psu) isohaline,and then is only determined by hydrology and hy-drodynamics (Brenon and Le Hir 1999).
DEPOSITION PATTERNS
The simulated deposits together with the TM atthe nearest spring tide for two typical river flowsare plotted on Fig. 11. Minimum deposits are theminimum quantity of sediments through a tidal cy-cle, in order not to account for transient depositsduring slack periods. Initially, there was no sedi-ment in the area represented in Fig. 11, so thatdeposits can be considered as residual deposits ata given period. A deposition of 10 kg m22 repre-sents a sedimentation of about 2 cm, assuming theaverage dry density of the sediment is 500 kg m23.One can see that deposition occurs preferentiallyin the vicinity of the TM, and then can shift as well,according to the river discharge. The depositionpatterns can be compared to the bottom stress dis-tribution (Fig. 2b); deposits take place at the short-er distance from the TM where the maximum tid-
ally-induced shear stress is low. Several depositionspots are remarkable: on the western and southernsides of the Banc du Ratier (Fig. 1), south of thenavigation channel, on the northern side of thenorthern submersible dike, on the intertidal mud-flat, southeast of Le Havre harbor, and in the nav-igation channel in front and upstream of thebreach of the northern dike.
For a mean river runoff (Fig. 11c), sedimenta-tion mainly occurs on the latter zone, which cor-responds to the lower location of the TM, at thelow water slack. This result is consistent with thefact that dredging is more extensive there, even ifa major part of the dredged material is composedof sand, transported from sea because of the flooddominance.
For high river runoff (Fig. 11a), the offshore de-position patterns extend southwards; this is consis-tent with the bottom residual flow that character-izes the Seine plume (Cugier and Le Hir in press).The shallow waters of the southern coast of theBaie de Seine hinder the density-induced residualflow, normally convergent towards the river in bot-tom layers. This density-driven circulation takesplace on the northern side, so that the bottomplume of the Seine is oriented southwest.
WIND AND WAVE EFFECTS
The previous deposition patterns resulted fromsimulations without wave resuspension. When this
Fine Sediment Transport and Accumulations 959
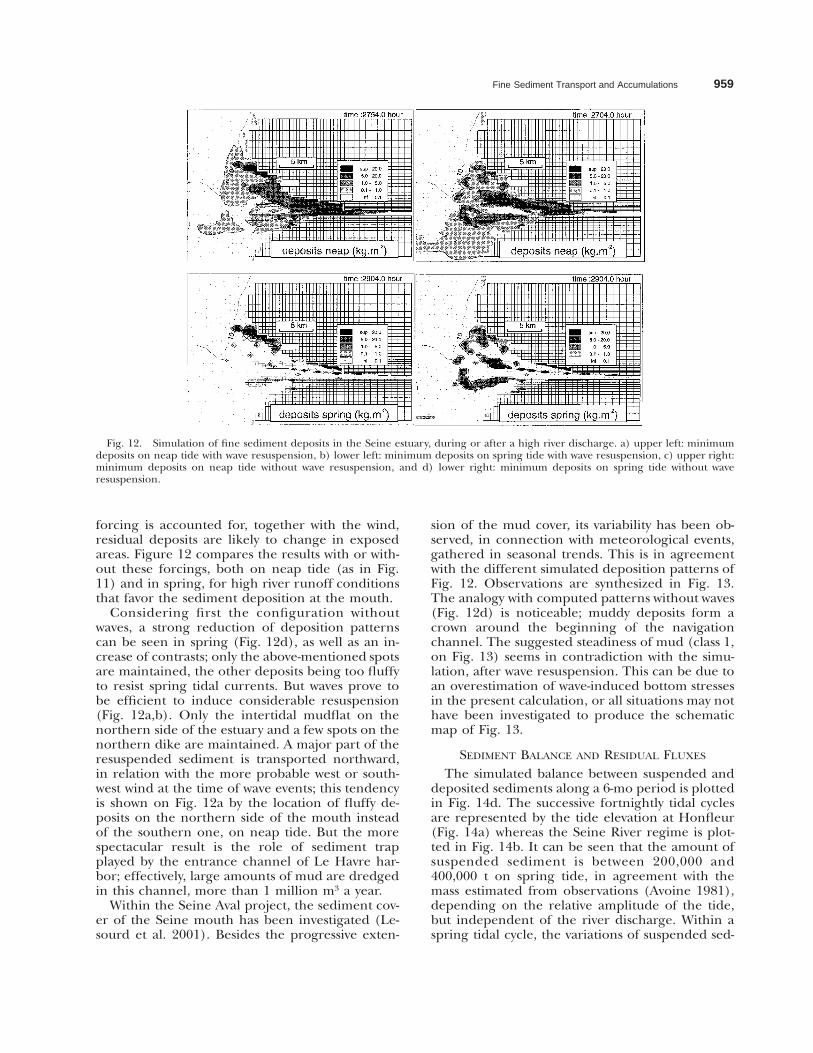
Fig. 12. Simulation of fine sediment deposits in the Seine estuary, during or after a high river discharge. a) upper left: minimumdeposits on neap tide with wave resuspension, b) lower left: minimum deposits on spring tide with wave resuspension, c) upper right:minimum deposits on neap tide without wave resuspension, and d) lower right: minimum deposits on spring tide without waveresuspension.
forcing is accounted for, together with the wind,residual deposits are likely to change in exposedareas. Figure 12 compares the results with or with-out these forcings, both on neap tide (as in Fig.11) and in spring, for high river runoff conditionsthat favor the sediment deposition at the mouth.
Considering first the configuration withoutwaves, a strong reduction of deposition patternscan be seen in spring (Fig. 12d), as well as an in-crease of contrasts; only the above-mentioned spotsare maintained, the other deposits being too fluffyto resist spring tidal currents. But waves prove tobe efficient to induce considerable resuspension(Fig. 12a,b). Only the intertidal mudflat on thenorthern side of the estuary and a few spots on thenorthern dike are maintained. A major part of theresuspended sediment is transported northward,in relation with the more probable west or south-west wind at the time of wave events; this tendencyis shown on Fig. 12a by the location of fluffy de-posits on the northern side of the mouth insteadof the southern one, on neap tide. But the morespectacular result is the role of sediment trapplayed by the entrance channel of Le Havre har-bor; effectively, large amounts of mud are dredgedin this channel, more than 1 million m3 a year.
Within the Seine Aval project, the sediment cov-er of the Seine mouth has been investigated (Le-sourd et al. 2001). Besides the progressive exten-
sion of the mud cover, its variability has been ob-served, in connection with meteorological events,gathered in seasonal trends. This is in agreementwith the different simulated deposition patterns ofFig. 12. Observations are synthesized in Fig. 13.The analogy with computed patterns without waves(Fig. 12d) is noticeable; muddy deposits form acrown around the beginning of the navigationchannel. The suggested steadiness of mud (class 1,on Fig. 13) seems in contradiction with the simu-lation, after wave resuspension. This can be due toan overestimation of wave-induced bottom stressesin the present calculation, or all situations may nothave been investigated to produce the schematicmap of Fig. 13.
SEDIMENT BALANCE AND RESIDUAL FLUXES
The simulated balance between suspended anddeposited sediments along a 6-mo period is plottedin Fig. 14d. The successive fortnightly tidal cyclesare represented by the tide elevation at Honfleur(Fig. 14a) whereas the Seine River regime is plot-ted in Fig. 14b. It can be seen that the amount ofsuspended sediment is between 200,000 and400,000 t on spring tide, in agreement with themass estimated from observations (Avoine 1981),depending on the relative amplitude of the tide,but independent of the river discharge. Within aspring tidal cycle, the variations of suspended sed-
960 P. Le Hir et al.
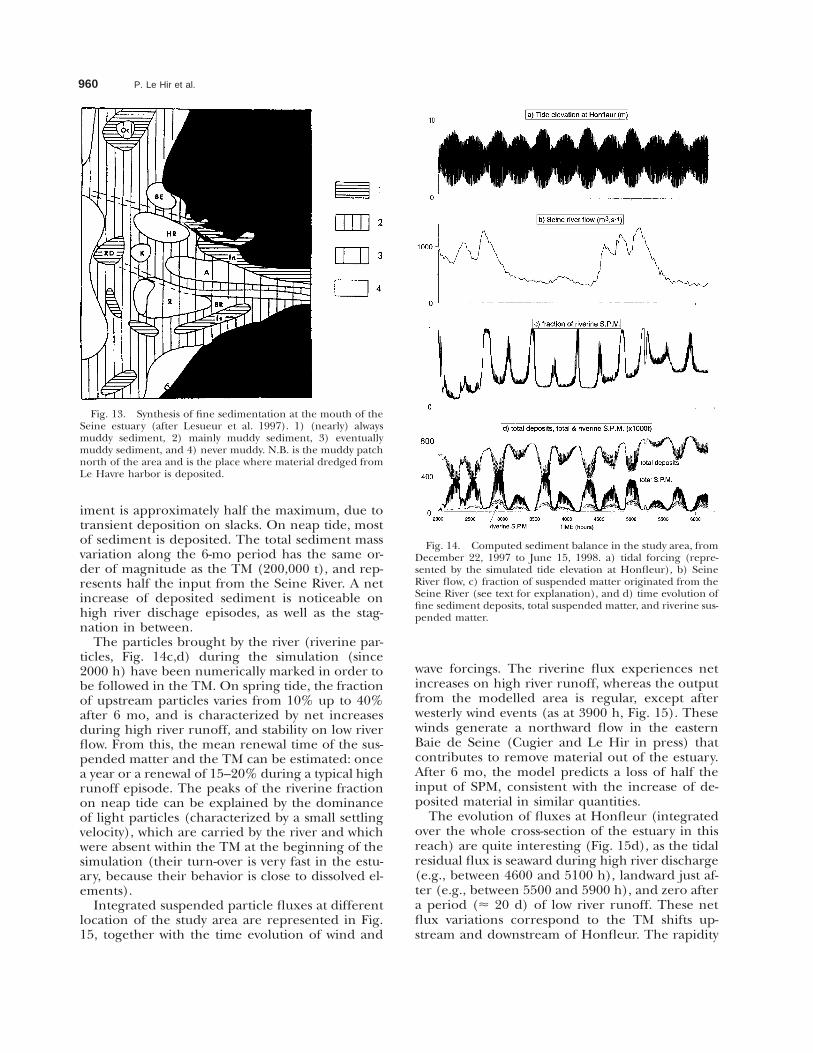
Fig. 13. Synthesis of fine sedimentation at the mouth of theSeine estuary (after Lesueur et al. 1997). 1) (nearly) alwaysmuddy sediment, 2) mainly muddy sediment, 3) eventuallymuddy sediment, and 4) never muddy. N.B. is the muddy patchnorth of the area and is the place where material dredged fromLe Havre harbor is deposited.
Fig. 14. Computed sediment balance in the study area, fromDecember 22, 1997 to June 15, 1998. a) tidal forcing (repre-sented by the simulated tide elevation at Honfleur), b) SeineRiver flow, c) fraction of suspended matter originated from theSeine River (see text for explanation), and d) time evolution offine sediment deposits, total suspended matter, and riverine sus-pended matter.
iment is approximately half the maximum, due totransient deposition on slacks. On neap tide, mostof sediment is deposited. The total sediment massvariation along the 6-mo period has the same or-der of magnitude as the TM (200,000 t), and rep-resents half the input from the Seine River. A netincrease of deposited sediment is noticeable onhigh river dischage episodes, as well as the stag-nation in between.
The particles brought by the river (riverine par-ticles, Fig. 14c,d) during the simulation (since2000 h) have been numerically marked in order tobe followed in the TM. On spring tide, the fractionof upstream particles varies from 10% up to 40%after 6 mo, and is characterized by net increasesduring high river runoff, and stability on low riverflow. From this, the mean renewal time of the sus-pended matter and the TM can be estimated: oncea year or a renewal of 15–20% during a typical highrunoff episode. The peaks of the riverine fractionon neap tide can be explained by the dominanceof light particles (characterized by a small settlingvelocity), which are carried by the river and whichwere absent within the TM at the beginning of thesimulation (their turn-over is very fast in the estu-ary, because their behavior is close to dissolved el-ements).
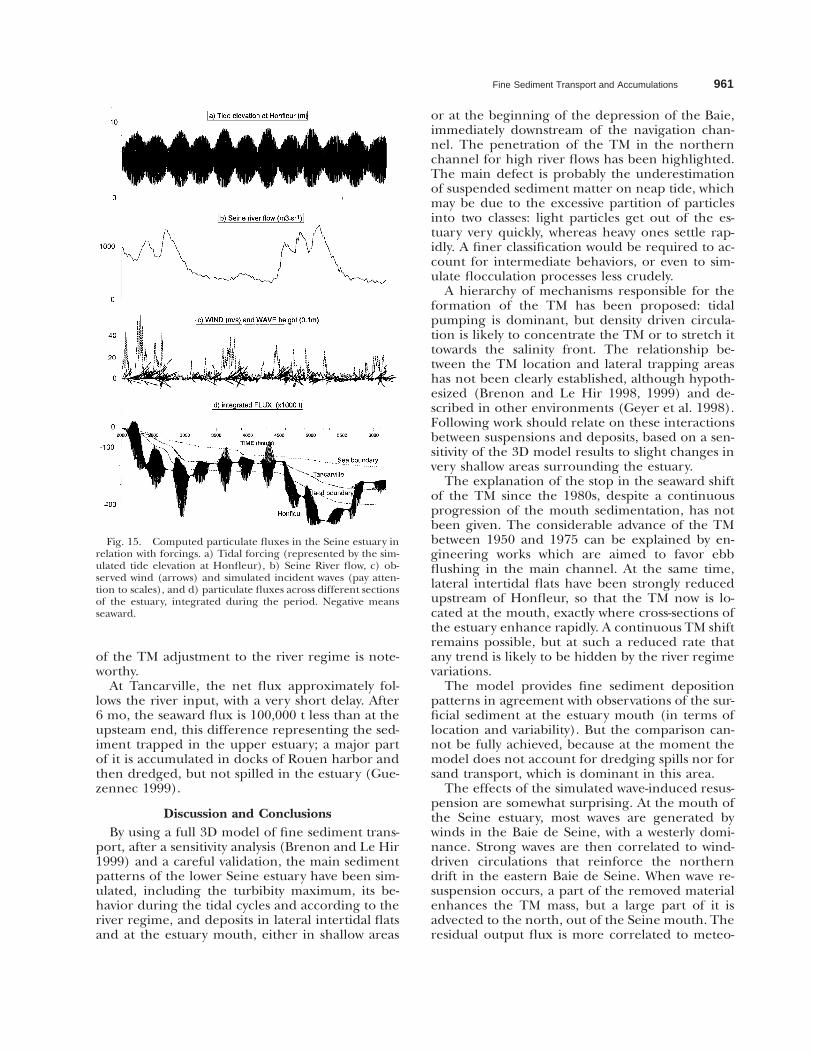
Integrated suspended particle fluxes at differentlocation of the study area are represented in Fig.15, together with the time evolution of wind and
wave forcings. The riverine flux experiences netincreases on high river runoff, whereas the outputfrom the modelled area is regular, except afterwesterly wind events (as at 3900 h, Fig. 15). Thesewinds generate a northward flow in the easternBaie de Seine (Cugier and Le Hir in press) thatcontributes to remove material out of the estuary.After 6 mo, the model predicts a loss of half theinput of SPM, consistent with the increase of de-posited material in similar quantities.
The evolution of fluxes at Honfleur (integratedover the whole cross-section of the estuary in thisreach) are quite interesting (Fig. 15d), as the tidalresidual flux is seaward during high river discharge(e.g., between 4600 and 5100 h), landward just af-ter (e.g., between 5500 and 5900 h), and zero aftera period (ø 20 d) of low river runoff. These netflux variations correspond to the TM shifts up-stream and downstream of Honfleur. The rapidity
Fine Sediment Transport and Accumulations 961
Fig. 15. Computed particulate fluxes in the Seine estuary inrelation with forcings. a) Tidal forcing (represented by the sim-ulated tide elevation at Honfleur), b) Seine River flow, c) ob-served wind (arrows) and simulated incident waves (pay atten-tion to scales), and d) particulate fluxes across different sectionsof the estuary, integrated during the period. Negative meansseaward.
of the TM adjustment to the river regime is note-worthy.
At Tancarville, the net flux approximately fol-lows the river input, with a very short delay. After6 mo, the seaward flux is 100,000 t less than at theupsteam end, this difference representing the sed-iment trapped in the upper estuary; a major partof it is accumulated in docks of Rouen harbor andthen dredged, but not spilled in the estuary (Gue-zennec 1999).
Discussion and ConclusionsBy using a full 3D model of fine sediment trans-
port, after a sensitivity analysis (Brenon and Le Hir1999) and a careful validation, the main sedimentpatterns of the lower Seine estuary have been sim-ulated, including the turbibity maximum, its be-havior during the tidal cycles and according to theriver regime, and deposits in lateral intertidal flatsand at the estuary mouth, either in shallow areas
or at the beginning of the depression of the Baie,immediately downstream of the navigation chan-nel. The penetration of the TM in the northernchannel for high river flows has been highlighted.The main defect is probably the underestimationof suspended sediment matter on neap tide, whichmay be due to the excessive partition of particlesinto two classes: light particles get out of the es-tuary very quickly, whereas heavy ones settle rap-idly. A finer classification would be required to ac-count for intermediate behaviors, or even to sim-ulate flocculation processes less crudely.
A hierarchy of mechanisms responsible for theformation of the TM has been proposed: tidalpumping is dominant, but density driven circula-tion is likely to concentrate the TM or to stretch ittowards the salinity front. The relationship be-tween the TM location and lateral trapping areashas not been clearly established, although hypoth-esized (Brenon and Le Hir 1998, 1999) and de-scribed in other environments (Geyer et al. 1998).Following work should relate on these interactionsbetween suspensions and deposits, based on a sen-sitivity of the 3D model results to slight changes invery shallow areas surrounding the estuary.
The explanation of the stop in the seaward shiftof the TM since the 1980s, despite a continuousprogression of the mouth sedimentation, has notbeen given. The considerable advance of the TMbetween 1950 and 1975 can be explained by en-gineering works which are aimed to favor ebbflushing in the main channel. At the same time,lateral intertidal flats have been strongly reducedupstream of Honfleur, so that the TM now is lo-cated at the mouth, exactly where cross-sections ofthe estuary enhance rapidly. A continuous TM shiftremains possible, but at such a reduced rate thatany trend is likely to be hidden by the river regimevariations.
The model provides fine sediment depositionpatterns in agreement with observations of the sur-ficial sediment at the estuary mouth (in terms oflocation and variability). But the comparison can-not be fully achieved, because at the moment themodel does not account for dredging spills nor forsand transport, which is dominant in this area.
The effects of the simulated wave-induced resus-pension are somewhat surprising. At the mouth ofthe Seine estuary, most waves are generated bywinds in the Baie de Seine, with a westerly domi-nance. Strong waves are then correlated to wind-driven circulations that reinforce the northerndrift in the eastern Baie de Seine. When wave re-suspension occurs, a part of the removed materialenhances the TM mass, but a large part of it isadvected to the north, out of the Seine mouth. Theresidual output flux is more correlated to meteo-
962 P. Le Hir et al.
rological events than to the river flow discharge.Not all simulated features are validated with waveresuspension patterns. The flushing of nearly allfine sediment patterns around the seaward end ofthe navigation channel is overestimated, contra-dicted by the steady presence of mud observed atthese locations. Resuspension of lateral mudflats,southeast of Le Havre, had to be amplified to avoidexcessive sedimentation. This correction is an em-pirical procedure to account for wave-induced liq-uefaction processes that are currently being inves-tigated (Silva Jacinto and Le Hir 2001).
Particulate fluxes have been estimated at differ-ent locations for a realistic 6-mo period. At themouth, their intensity is consistent with the sedi-ment balance within the estuary and their vari-ability expresses the TM movements. The ability ofthe model to transport contaminants and to ac-count for their behavior can be used to estimatethe residual contaminant fluxes (Gonzalez et al.2001).
ACKNOWLEDGMENTS
This work was carried out in the framework of the Seine-Avalscientific program, funded by the French State, the Haute-Nor-mandie Regional Council, the Agence de l’eau Seine-Norman-die, and industrial firms in Haute-Normandie. Hydrographicdata have been provided by the Rouen Port Authority (PAR:Port Autonome de Rouen) and tidal harmonic components inthe Baie de Seine have been computed by the hydrographicdepartment of the French Navy (SHOM: Service Hydrograp-hique and Oceanographique de la Marine). Thanks are givento A. Delouis (PAR) and B. Simon (SHOM). The authors wouldlike to thank their colleagues who contributed to the Seine Avalproject, particularly C. Bessineton (CSLHN), P. Bassoullet andP. Woerther (IFREMER), S. Lesourd and J. C. Brun-Cottan(University of Caen), L. Guezennec (AESN), and J. M. Mouchel(CERGRENE).
LITERATURE CITED
ABARNOU, A., J. AVOINE, J. P. DUPONT, R. LAFITE, AND S. SIMON.1987. Role of suspended sediments on the distribution of PCBin the Seine estuary (France). Continental Shelf Research 7:1345–1350.
ALLEN, G. P., J. C. SALOMON, P. BASSOULLET, Y. DU PENHOAT,AND C. DE GRANDPRE. 1980. Effects of tides on mixing andsuspended sediment transport in macrotidal estuaries. Sedi-mentary Geology 26:69–90.
AVOINE, J. 1981. L’estuaire de la Seine: Sediments et dynamiquesedimentaire. These de Geologie, Universite de Caen, France.
AVOINE, J. 1986. Evaluation des apports fluviatiles dans l’estuairede la Seine, p. 117–124. In GRECO-Manche (eds.), La Baiede Seine. Universite de Caen 24–26 avril 1985. Actes de Col-loques No. 4. IFREMER, Brest.
AVOINE, J., G. P. ALLEN, M. NICHOLS, J. C. SALOMON, AND C.LARSONNEUR. 1981. Suspended sediment transport in theSeine estuary, France: Effect of man-made modifications onestuary-shelf sedimentology. Marine Geology 40:119–137.
AVOINE, J., P. LESUEUR, AND T. ROUAULT. 1995. Evolution mor-phologique et couverture sedimentaire de l’estuaire de laSeine. Actualisation et fluctuations, p. 2–20. In R. Hocde(ed.), Rapport Final du Programme Scientifique Seine Aval,Theme Hydrodynamique et Transport Sedimentaire. Rapport1995/FIN-1. Rouen.
BRENON, I. 1997. Modelisation de la dynamique des sedimentsfins dans l’estuaire de la Seine. These de doctorat, No 501,Universite Bretagne Occidentale, France.
BRENON, I. AND P. LE HIR. 1998. Modelling fine sediment dy-namics in the Seine estuary: Interaction between turbiditypatterns and sediment balance, p. 103–114. In J. Dronkersand M. B. A. M. Scheffers (eds.), Physics of Estuaries andCoastal Seas. Balkema, Rotterdam.
BRENON, I. AND P. LE HIR. 1999. Modelling the turbidity maxi-mum in the Seine estuary (France): Identification of forma-tion processes. Estuarine, Coastal and Shelf Science 49:525–544.
CUGIER, P. AND P. LE HIR. In press. Development of a 3D hydro-dynamic model for coastal ecosystem modelling. Applicationto the plume of the Seine River (France). Estuarine, Coastaland Shelf Science.
DUPONT, J. P., L. GUEZENNEC, R. LAFITE, D. DETHLEFF, M. F.HUAULT, H. Q. WANG, M. LACROIX, AND R. MEYER. 1996. Pro-cessus hydrosedimentaires de l’estuaire, p. 33–64. In R. Hoc-de (ed.), Rapport Final du Programme Scientifique SeineAval, Theme Hydrodynamique et Transport Sedimentaire.Rapport 1995/FIN-1. Rouen.
FICHT, A. AND M. LEPRINCE. 1991. Du barrage de Poses al’estuaire: 30 ans de suivi de la qualite de la Seine. Plaquettede la cellule de lutte contre la pollution. Service de la Navi-gation de la Seine, Rouen.
GEYER, W. R. 1993. The importance of suppression of turbu-lence by stratification on the estuarine turbidity maximum.Estuaries 16:113–125.
GEYER, W. R., R. P. SIGNELL, AND G. C. KINEKE. 1998. Lateraltrapping of sediment in a partially mixed estuary, p. 115–124.In J. Dronkers and M. B. A. M. Scheffers (eds.), Physics ofEstuaries and Coastal Seas. Balkema, Rotterdam.
GONZALEZ, J.-L., B. THOUVENIN, C. DANGE, A. FIANDRINO, AND J.-F. CHIFFOLEAU. 2001. Modeling of cadmium speciation anddynamics in the Seine estuary (France). Estuaries 24:1041–1055.
GUEZENNEC, L. 1999. Hydrodynamique et transport en suspen-sion du materiel particulaire fin dans la zone fluviale d’unestuaire macrotidal: L’exemple de l’estuaire de la Seine(France). These de l’Universite de Rouen, France.
GUEZENNEC, L., R. LAFITE, J.-P. DUPONT, R. MEYER, AND D.BOUST. 1999. Hydrodynamics of suspended particulate matterin the tidal freshwater zone of a macrotidal estuary (the Seineestuary, France). Estuaries 22:717–727.
JAY, D. A. AND J. D. MUSIAK. 1994. Particle trapping in estuarinetidal flows. Journal of Geophysical Research 99:20445–20461.
LE HIR, P., W. ROBERTS, O. CAZAILLET, M. C. CHRISTIE, P. BAS-SOULLET, AND C. BACHER. 2000. Characterization of intertidalflat hydrodynamics. Continental Shelf Research 20:1433–1459.
LE PROVOST, C., M. FORNERINO, AND C. VILLARET. 1986. Surl’hydrodynamique de la baie de Seine. Resultatsd’observations et de modelisations, p. 43–48. In GRECO-Man-che (eds.), La Baie de Seine. Universite de Caen 24–26 avril1985. Actes de Colloques No 4. IFREMER, Brest.
LESOURD, S., P. LESUEUR, J.-C. BRUN-COTTAN, J.-P. AUFFERT, N.POUPINET, AND B. LAIGNEL. 2000. Morphosedimentary evolu-tion of the macrotidal Seine estuary subjected to human im-pact. Estuaries 24:940–949.
LESUEUR, P., S. LESOURD, J.-P. AUFFRET, J. AVOINE, J.-C. BRUN-COTTAN, AND F. LEVOY. 1997. Etat des connaissances sur ladistribution et l’evolution des sediments fins dans l’estuairede la Seine. Programme Scientifique Seine Aval, theme Hy-drodynamique et Transport Sedimentaire, rapport 1996/FIN-1, 82–115. Rouen.
POSTMA, H. 1967. Sediment transport and sedimentation in theestuarine environment, p. 158–179. In G. H. Lauff (ed.), Es-tuaries. American Association of Advanced Sciences, Washing-ton, D.C.
SILVA JACINTO, R. 1997. Action des vagues sur les estrans et va-

Fine Sediment Transport and Accumulations 963
sieres. Application a l’embouchure de la Seine. Rapport pourl’Agence de l’Eau Seine-Normandie. IFREMER, Brest.
SILVA JACINTO, R. AND P. LE HIR. 1996. Simulation des agitationsdans l’embouchure de la Seine: Etude methodologique.24emes Journees de l’Hydraulique, Paris 18–20 sept. 1996.Societe Hydrotechnique de France, Paris.
SILVA JACINTO, R., C. BESSINETON, F. LEVOY, C. VEDIEU, S. LE-SOURD, H. ROUSSET, L. BENOıT, H. JESTIN, AND O. MONFORT.1998. Reponse de la vasiere Nord aux forcages meteo-ocea-niques. Programme Scientifique Seine Aval, theme Hydrodyn-amique et Transport Sedimentaire, rapport 1997/FIN-1. Rou-en.
SILVA JACINTO, R. AND P. LE HIR. 2001. Response of stratifiedmuddy beds to water waves, p. 95–108. In W. H. McAnally and
A. J. Mehta (eds.), Coastal and Estuarine Fine Sediment Pro-cesses, Proceedings in Marine Science No. 3. Elsevier, Am-sterdam.
UNCLES, R. J., J. A. STEPHENS, AND M. L. BARTON. 1984. Obser-vation of fine-sediment concentrations and transport in theturbidity maximum region of an estuary, p. 255–276. In D.Prandle (ed.), Coastal and Estuarine Studies, Dynamics andExchanges in Estuaries and the Coastal Zone. American Geo-physical Union, Washington, D.C.
WOERTHER, P. 1999. Coastal Water Quality of the Seine Bay AreaMonitored by a New French System of Automated Data Buoys.EEZ Technology, 5th edition. ICG Publishing Ltd, London.
Received for consideration, April 17, 2000Accepted for publication, September 13, 2001