financial statements - Fonds de solidarité FTQ
125
AS AT NOVEMBER 30, 2014 FINANCIAL STATEMENTS
-
Upload
khangminh22 -
Category
Documents
-
view
1 -
download
0
Transcript of financial statements - Fonds de solidarité FTQ

AS AT NOVEMBER 30, 2014
FINANCIAL STATEMENTS

FONDS DE SOLIDARITÉ DES TRAVAILLEURS DU QUÉBEC (F.T.Q.) 1
INDEPENDENT AUDITORS’ REPORT
To the Shareholders of the Fonds de solidarité des travailleurs du Québec (F.T.Q.)
We have audited the accompanying financial statements of the Fonds de solidarité des travailleurs du Québec (F.T.Q.), which comprise
the balance sheets as at November 30, 2014, May 31, 2014 and June 1, 2013, and the statements of comprehensive income, changes
in net assets and cash flows for the six-month periods ended November 30, 2014 and 2013, and a summary of significant accounting
policies and other explanatory information.
Management’s Responsibility for the Financial Statements
Management is responsible for the preparation and fair presentation of these financial statements in accordance with International
Financial Reporting Standards (IFRS) issued by the International Accounting Standards Board, and for such internal control as
management determines is necessary to enable the preparation of financial statements that are free from material misstatement,
whether due to fraud or error.
Auditors’ Responsibility
Our responsibility is to express an opinion on these financial statements based on our audits. We conducted our audits in accordance
with Canadian generally accepted auditing standards. Those standards require that we comply with ethical requirements and plan and
perform the audit to obtain reasonable assurance about whether the financial statements are free from material misstatement.
An audit involves performing procedures to obtain audit evidence about the amounts and disclosures in the financial statements. The
procedures selected depend on the auditors’ judgment, including the assessment of the risks of material misstatement of the financial
statements, whether due to fraud or error. In making those risk assessments, the auditors consider internal control relevant to the
entity’s preparation and fair presentation of the financial statements in order to design audit procedures that are appropriate in the
circumstances, but not for the purpose of expressing an opinion on the effectiveness of the entity’s internal control. An audit also
includes evaluating the appropriateness of accounting policies used and the reasonableness of accounting estimates made by
management, as well as evaluating the overall presentation of the financial statements.
We believe that the audit evidence we have obtained in our audits is sufficient and appropriate to provide a basis for our audit opinion.
Opinion
In our opinion, the financial statements present fairly, in all material respects, the financial position of the Fonds de solidarité des
travailleurs du Québec (F.T.Q.) as at November 30, 2014, May 31, 2014 and June 1, 2013, and its financial performance and its cash
flows for the six-month periods ended November 30, 2014 and 2013 in accordance with International Financial Reporting Standards
(IFRS) issued by the International Accounting Standards Board.
------------------------ ----------------------
1 CPA auditor, CA, public accountancy permit No. A110972
2 CPA auditor, CA, public accountancy permit No. A125741
Montréal, December 23, 2014
2

FONDS DE SOLIDARITÉ DES TRAVAILLEURS DU QUÉBEC (F.T.Q.) 2
BALANCE SHEETS
(in millions of Canadian dollars, except net assets per share) Note November 30, 2014 May 31, 2014 June 1, 2013
Assets
Development capital investments 5 5,634 5,444 5,306
Other investments 6 5,196 5,075 4,380
Investment property 11 31 28 25
Accounts receivable 12 164 220 259
Cash 25 16 9
Other assets
Deferred income taxes 24 3 - 1
Property and equipment 13 48 48 49
Intangible assets 14 7 7 5
Refundable taxes on hand 24 - 2 7
Income taxes 4 1 5
Securities purchased under reverse repurchase agreements 216 255 274
Financial instruments related to securities sold under
repurchase agreements 137 101 149
11,465 11,197 10,469
Liabilities
Notes 15 447 452 396
Accounts payable 17 109 180 266
Other liabilities
Net defined benefit liability 25 52 44 45
Share redemptions payable 20 34 30
Securities sold under repurchase agreements 353 356 423
981 1,066 1,160
Net assets 18 10,484 10,131 9,309
Net assets per Class A share 28 31.36 30.31 28.00
Contingencies (Note 20)
The accompanying notes form an integral part of these financial statements.
On behalf of the Board of Directors,
(signed) “Robert Parizeau” (signed) “Gaétan Morin”
Robert Parizeau, Director Gaétan Morin, Director

FONDS DE SOLIDARITÉ DES TRAVAILLEURS DU QUÉBEC (F.T.Q.) 3
STATEMENTS OF COMPREHENSIVE INCOME
FOR THE SIX-MONTH PERIODS ENDED NOVEMBER 30
(in millions of Canadian dollars, except net income per share) Note 2014 2013
Revenues 21
Interest 75 83
Dividends and distributions 71 119
Rental income, fees and other income 8 4
154 206
Gains (losses) on development capital investments, other investments and investment property
Realized 77 24
Unrealized 201 251
Transaction costs (1) (1)
277 274
431 480
Total operating expenses 22
Corporate expenses 31 31
Development capital investment and other investment expenses 16 17
Shareholder Services and Economic Training development and administration expenses 19 20
66 68
Income before income taxes 365 412
Income taxes 24 11 7
Net income 354 405
Item of other comprehensive income that will not be reclassified to net income
Remeasurement of the net defined benefit liability 25 (3) 10
Comprehensive income 351 415
Supplemental information
Net income per Class A share 18 and 28 1.06 1.22
The accompanying notes form an integral part of these financial statements.

FONDS DE SOLIDARITÉ DES TRAVAILLEURS DU QUÉBEC (F.T.Q.) 4
STATEMENTS OF CHANGES IN NET ASSETS FOR THE SIX-MONTH PERIODS ENDED NOVEMBER 30
Share capital – Class A shares (Note 18)
Con-
tributed
surplus
(Note 18)
Retained
earnings
Accumu-
lated other
compre-
hensive
income
Net assets
(Note 18)
(in millions of Canadian dollars) Series 1 Series 2
Sub-
scribed
2014
Balance at beginning of period 7,793 78 1 841 1,417 1 10,131
Net income 354 354
Other comprehensive income (3) (3)
Share issues 253 4 257
Net change in share
subscriptions -
-
Share redemptions (204) (3) (21) (36) (264)
Change in outstanding
redemptions 8 1 -
9
Transfer (Note 18) 75 (75) -
Balance at end of period 7,925 79 1 821 1,660 (2) 10,484
2013
Balance at beginning of period 7,509 80 1 910 809 - 9,309
Net income 405 405
Other comprehensive income 10 10
Share issues 253 3 256
Net change in share
subscriptions -
-
Share redemptions (220) (4) (27) (21) (272)
Change in outstanding
redemptions (7) (1) (1)
(9)
Transfer (Note 18) 70 (70) -
Balance at end of period 7,605 79 1 882 1,122 10 9,699
The accompanying notes form an integral part of these financial statements.

FONDS DE SOLIDARITÉ DES TRAVAILLEURS DU QUÉBEC (F.T.Q.) 5
STATEMENTS OF CASH FLOWS FOR THE SIX-MONTH PERIODS ENDED NOVEMBER 30
(in millions of Canadian dollars) 2014 2013
Operating activities
Net income 354 405
Non-cash items
Interest capitalized on development capital investments (2) (1)
Interest capitalized on notes 9 10
Amortization of premiums and discounts 4 5
Gains (losses) on development capital investments, other investments and
investment property
Realized (77) (24)
Unrealized (201) (251)
Post-employment benefits 4 -
Depreciation of property and equipment and amortization of intangible assets 3 3
Deferred income taxes (2) -
92 147
Changes in non-cash items
Accounts receivable 6 35
Refundable taxes on hand 2 1
Income taxes (3) -
Accounts payable (1) (32)
Other 2 2
98 153
Acquisition of development capital investments (188) (315)
Proceeds of disposal of development capital investments 92 367
Acquisition of other investments (3,917) (4,737)
Proceeds of disposal of other investments 3,957 4,545
Acquisition of investment property (3) -
39 13
Financing activities
Shares issued and subscribed 257 256
Shares redeemed (269) (276)
Issuance of notes 56 124
Repayment of notes (70) (84)
(26) 20
Investing activity
Acquisition of property and equipment and intangible assets (4) (4)
Increase in cash 9 29
Cash at beginning of period 16 9
Cash at end of period 25 38
Supplemental information (amounts included in operating activities)
Interest received 92 103
Dividends and distributions received 70 121
Taxes paid 15 8
The accompanying notes form an integral part of these financial statements.

NOTES TO FINANCIAL STATEMENTS
FONDS DE SOLIDARITÉ DES TRAVAILLEURS DU QUÉBEC (F.T.Q.) 6
1. DESCRIPTION OF THE FONDS
STATUTES AND OBJECTIVES OF THE FONDS
The Fonds de solidarité des travailleurs du Québec (F.T.Q.) (the “Fonds”), incorporated by an Act of the Québec National
Assembly, is a joint-stock company whose principal office is located at 545 Crémazie Boulevard East, Suite 200, Montréal,
Québec, Canada and whose objectives are:
to invest in Québec business entreprises and provide them with services in order to create, maintain or protect jobs;
to promote the training of workers in economic matters to enable them to increase their influence on Québec’s
economic development;
to stimulate the Québec economy by making strategic investments that will be of benefit to Québec workers and
business entreprises;
to promote the development of qualified business enterprises by inviting workers to participate in that development by
purchasing the Fonds’ shares.
To this end, the Fonds endeavours to concentrate most of its development capital investments in unsecured investments, mainly
in small and medium-sized enterprises (“SMEs”) located in Québec. As a general rule, the Fonds will take a minority interest in
the projects in which it invests.
2. SIGNIFICANT ACCOUNTING POLICIES
1. IFRS ADOPTION
These financial statements have been prepared in accordance with International Financial Reporting Standards (“IFRS”). The
Fonds adopted this accounting framework for the year beginning June 1, 2014, as required by Canadian securities laws and
the Accounting Standards Board of Canada. Previously, the Fonds prepared its financial statements in accordance with
Canadian generally accepted accounting principles as defined in Part V of the CPA Canada Handbook — Accounting
(“Canadian GAAP” – Part V). The Fonds used the same accounting policies to prepare its opening IFRS balance sheet as at
June 1, 2013 and throughout all the periods presented, as if such policies had always been effective. Note 28 discloses the
impact of the transition to IFRS on the financial position, financial performance and cash flows reported by the Fonds. It also
presents the nature and impact of the significant changes in accounting policies from the accounting policies used to
prepare the financial statements of the Fonds in accordance with Canadian GAAP – Part V for the period ended November
30, 2013.
2. BASIS OF PREPARATION
These financial statements have been prepared on a fair value basis, except for property and equipment and intangible
assets, which are measured on the historical cost basis, as well as certain financial instruments, as mentioned in Note 2.5.
These separate financial statements are the only financial statements presented by the Fonds. They have been approved for
issue on December 23, 2014 by the Board of Directors.
3. INVESTMENT ENTITY
The Fonds meets the definition of investment entity set out in IFRS 10 Consolidated Financial Statements, as the following
conditions are met:
the Fonds obtains capital from many investors for the purpose of managing their savings;
the Fonds commits to its investors that the purpose of its investments activities is to generate a return and provide
investment income, in accordance with its mission; and
the Fonds measures and evaluates the performance of its investments on a fair value basis.
Consequently, the Fonds does not prepare consolidated financial statements.
4. SUBSIDIARIES AND ASSOCIATES
Investments in subsidiaries and associates are recognized at fair value through profit or loss.

NOTES TO FINANCIAL STATEMENTS
FONDS DE SOLIDARITÉ DES TRAVAILLEURS DU QUÉBEC (F.T.Q.) 7
2. SIGNIFICANT ACCOUNTING POLICIES (CONTINUED)
5. FINANCIAL INSTRUMENTS – RECOGNITION AND CLASSIFICATION
Financial instruments are recognized at fair value at the transaction date, when the Fonds becomes a party to the
contractual provisions of the instrument. The cost presented for development capital investments and other investments
corresponds to the amount paid and is determined based on average cost, excluding transaction costs. Transaction costs
are recognized in net income when incurred. A financial asset is derecognized when the Fonds no longer has the contractual
rights to the cash flows from this asset.
Financial assets and liabilities are classified in various categories based on their characteristics and the Fonds’ intention
upon their acquisition and their issuance. Development capital investments, other investments, accounts receivable relating
to development capital investments and other investments sold, loans included in accounts receivable – other, cash,
securities purchased under reverse repurchase agreements, financial instruments related to securities sold under repurchase
agreements, accounts payable relating to development capital investments and other investments purchased, derivative
financial instruments and securities sold under repurchase agreements are all financial instruments designated as at fair
value through profit or loss. These financial instruments are part of a managed portfolio whose performance is evaluated on
a fair value basis, in accordance with a documented financial asset integrated management strategy, and information is
provided internally on that basis to the Fonds’ key management personnel.
Other accounts receivable are classified in loans and receivables. Notes and other accounts payable are classified in other
financial liabilities. These financial instruments are recognized at amortized cost, which approximates their fair value given
their nature and short-term maturity.
Financial liabilities are derecognized when the obligation is extinguished, which is when the obligation is discharged or
cancelled or expires.
6. FINANCIAL INSTRUMENTS – FAIR VALUE MEASUREMENT
Fair value is the price that would be received to sell an asset or paid to transfer a liability in an orderly transaction between
market participants at the reporting date.
a) Fair value of assets and liabilities traded on active markets
To determine the fair value of financial assets and liabilities that are quoted in an active market, such as listed
shares, bonds, money market instruments and listed derivative financial instruments, the Fonds uses the price
within the bid-ask spread that is most representative of fair value, given the relevant facts and circumstances, at the
reporting date.
b) Fair value of assets and liabilities that are not traded on active markets
The fair value of financial assets and liabilities that are not traded on active markets (including unlisted derivative
financial instruments) is determined using valuation techniques selected based on certain specified criteria and
market conditions prevailing at each reporting date. The valuation techniques used are based on valuation principles
derived from the guidelines that are generally used in the industry by business valuation professionals. These
valuation principles are approved every six months by the Fonds’ Audit Committee. The valuation technique used for
a financial instrument is generally the same from one period to the next, except when a change in valuation
technique results in a more accurate estimate of fair value.
i) Unlisted shares and units
When a yield method is used, the fair value of unlisted shares is mainly determined using the capitalized cash
flow technique. The two main variables used in this technique are maintainable cash flows and the capitalization
rate. To determine maintainable cash flows, recurring cash flows are estimated based on the entity’s historical
results and/or financial forecasts. A weighting factor is applied to each of the cash flows used to reflect its
probability of occurrence. The capitalization rate used to capitalize maintainable cash flows reflects how the
investee could finance its operations and the risks associated with the materialization of these maintainable cash
flows.
When the price of a recent transaction negotiated between unrelated parties on an arm’s-length basis is
available, this valuation technique is used under certain conditions. It may also be appropriate to use a valuation
technique based on a bid from a third party. Using judgment is necessary to determine whether the price in such
recent transaction or bid represents the best evidence of fair value at the reporting date. The period during
which referring to a past transaction or bid is deemed appropriate depends on the circumstances specific to
each situation.
NOTES TO FINANCIAL STATEMENTS
FONDS DE SOLIDARITÉ DES TRAVAILLEURS DU QUÉBEC (F.T.Q.) 8
2. SIGNIFICANT ACCOUNTING POLICIES (CONTINUED)
6. FINANCIAL INSTRUMENTS – FAIR VALUE MEASUREMENT (CONTINUED)
b) Fair value of assets and liabilities that are not traded on active markets (CONTINUED)
i) Unlisted shares and units (CONTINUED)
In certain circumstances or depending on the nature of operations, the future earning potential is better
reflected by the value of the assets, and the adjusted net asset method is used. This method is also used to
determine the fair value of unlisted investment fund units held. In such case, this method entails using the share
of all assets and liabilities appearing on the balance sheet of the investee at their fair value and adjusting it as
necessary. The main adjustments made are related to the fair value of the assets and liabilities, new information
available and significant events that occurred between the investee’s reporting date and the Fonds’ reporting
date.
The fair value of certain unlisted units is determined using the price established by their respective manager.
ii) Hedge fund units
The fair value of hedge fund units is determined using the price established by their respective manager.
iii) Loans and advances
The fair value of secured and unsecured loans and advances is determined by discounting the contractual cash
flows expected to be received by the Fonds using a discount rate that reflects the return that the Fonds would
require given the credit risk of the investee. Certain loans and advances to a wholly-owned company are
considered as quasi-equity, and their fair value is determined using the adjusted net asset technique.
iv) Guarantees and suretyships
When it is likely that the Fonds will have to disburse an amount on a guarantee or a suretyship it granted, an
asset-based approach and a liquidation value technique are used to estimate the amount of the liability to be
recognized.
v) Derivative financial instruments
The fair value of unlisted derivative financial instruments is determined using appropriate valuation techniques,
including discounting future cash flows at the current rate of return.
vi) Accounts receivable relating to development capital investments and other investments sold
The fair value of accounts receivable relating to development capital investments sold that are not traded on
active markets is determined by discounting contractual cash flows. Generally, the estimated amounts to be
received and timing of their collection depend on future events or the satisfaction of certain conditions.
7. SECURITIES LENDING, SECURITIES PURCHASED UNDER REVERSE REPURCHASE AGREEMENTS AND SECURITIES SOLD UNDER
REPURCHASE AGREEMENTS
To generate additional revenues, the Fonds participates in the securities lending program put in place by its depositary for
securities of which it is the custodian. Under this program, the Fonds can enter into securities lending transactions, as well
as short-term purchases and sales of securities with a simultaneous commitment to resell and repurchase them at a
specified price and date. Reverse repurchase agreements and repurchase agreements are recognized as secured lending and
borrowing transactions. Reverse repurchase agreements are recorded on the Balance Sheet at their fair value, while
repurchase agreements are recorded on the Balance Sheet at the repurchase price determined by the commitment, which
approximates their fair value. The revenues resulting from the Fonds’ participation in this program are recorded through net
income under Interest.
8. INVESTMENT PROPERTY
Investment property is property held by the Fonds for renting or value appreciation purposes, or both, or for sale. The
investment property is occupied by several tenants. The Fonds presents its investment property using the fair value model.
Fair value is measured at each reporting date, and any change in fair value is recognized in net income.
The fair value used is determined using the discounted cash flow technique, whereby fair value represents the aggregate of
the present value of projected cash flows and the reversion value at the end of the projection period. To ensure that such
fair value is appropriate, the result is compared with other techniques, such as the direct discounting technique, under
which an overall discount rate is applied to normalized net operating income, and the direct comparison method, under
which the most likely selling price is estimated by comparing and analyzing real estate transactions involving similar
properties.
9. CASH
Cash includes bank accounts used in operating and managing development capital investments and other investments.

NOTES TO FINANCIAL STATEMENTS
FONDS DE SOLIDARITÉ DES TRAVAILLEURS DU QUÉBEC (F.T.Q.) 9
2. SIGNIFICANT ACCOUNTING POLICIES (CONTINUED)
10. PROPERTY AND EQUIPMENT AND INTANGIBLE ASSETS
Property and equipment and intangible assets are stated at cost less any accumulated depreciation or amortization and
accumulated impairment losses. Cost includes items that are directly attributable to the acquisition of the item of property
and equipment or intangible asset. Subsequent costs for an item of property and equipment or an intangible asset are
recognized only if it is probable that future economic benefits associated with it will flow to the Fonds and the cost can be
measured reliably. Repair and maintenance expenses are recognized in total operating expenses through net income when
incurred.
The main property and equipment and intangible asset categories are depreciated or amortized over their estimated useful
life using the following methods, periods and annual rates:
Methods Periods/rates
Property and equipment
Buildings Straight-line 15 to 60 years
Office furniture and equipment Diminishing balance 20.0%
Computer hardware Straight-line 4 years
Intangible assets
Information systems development Straight-line 3 years
The Fonds allocates the amount initially recognized in respect of an item of property and equipment or intangible assets to
its significant parts and depreciates or amortizes them separately. The carrying amount of a replaced part is derecognized
upon replacement. Residual values, depreciation or amortization method and useful life of assets are reviewed at each
reporting date and adjusted if needed.
At each reporting date, property and equipment and intangible assets are tested for impairment when events or changes in
circumstances indicate that their carrying amount may not be recoverable. To determine the recoverable amount, items of
property and equipment and intangible assets are aggregated at the lowest level for which identifiable cash flows are
independent from the cash flows from other groups of items of property and equipment or intangible assets. The Fonds
assesses possible reversals when events or circumstances warrant it.
11. POST-EMPLOYMENT BENEFITS
The cost of earned pension benefits and other employee post-retirement benefits is recognized through net income and
comprises current service cost and net interest on the net defined benefit plan liability.
Remeasurements of the net defined benefit liability are recognized in Other comprehensive income. They are not
reclassified subsequently to net income and are presented separately in the Statement of Changes in Net Assets.
Remeasurements of the net defined benefit liability comprise actuarial gains and losses as well as the return on plan assets,
excluding interest income. Actuarial gains and losses result from changes in the actuarial assumptions used to determine
the defined benefit obligation and from experience gains and losses on such obligation.
The net defined benefit liability corresponds to the present value of the post-employment benefit plan obligation less the
fair value of plan assets.
12. SHARE CAPITAL
The Fonds’ Class A shares are puttable (redeemable at the option of the holder), subject to certain conditions, and are
classified in net assets as they have all the following features:
they entitle the holder to a pro rata share of the Fonds’ net assets in the event of the Fonds’ liquidation;
they are in a class of instruments that is subordinate to all other classes of instruments of the Fonds;
they have features that are identical to those of all the other instruments of this class;
apart from the contractual obligation for the Fonds to repurchase or redeem the instrument for cash or another
financial asset, they do not include any contractual obligation to deliver cash or another financial asset to another
entity, or to exchange financial assets or financial liabilities with another entity under conditions that are
potentially unfavourable to the entity, and they are not a contract that will or may be settled in the Fonds’ own
equity instruments;
the total expected cash flows attributable to the shares over their life are based substantially on the change in net
assets.

NOTES TO FINANCIAL STATEMENTS
FONDS DE SOLIDARITÉ DES TRAVAILLEURS DU QUÉBEC (F.T.Q.) 10
2. SIGNIFICANT ACCOUNTING POLICIES (CONTINUED)
12. SHARE CAPITAL (CONTINUED)
Share issues and redemptions are recognized as transactions on net assets. The consideration received for share issues is
included in share capital. Share redemptions are recognized when the requests are approved under redemption criteria at
the current redemption value, and shares are derecognized based on average cost.
13. FUNCTIONAL CURRENCY AND FOREIGN CURRENCY TRANSLATION
The Canadian dollar is the functional currency and the reporting currency of the Fonds. Transactions in foreign currencies
are translated into the functional currency at the exchange rate prevailing at the transaction date. Assets and liabilities
denominated in foreign currencies are translated into the functional currency at the exchange rate prevailing at the
reporting date. Translation differences related to cash are presented as translation differences on cash, and other
translation differences are presented in net income under Gains (losses) on development capital investments, other
investments and investment property.
14. REVENUE RECOGNITION
a) Interest
Interest revenue is recognized on an accrual basis using the effective rate method. Amortization of premiums and
discounts under this method is recognized under Interest.
b) Dividends and distributions
Non-cumulative dividends are recognized when they are declared, while cumulative dividends are recognized on an
accrual basis. Distributions are recognized when they are received.
c) Rental income, fees and other income
Rental income is recognized on a straight-line basis over the term of the lease, while fees and other income are
recognized on an accrual basis.
d) Gains and losses on development capital investments, other investments and investment property
Realized gains and losses on disposals of development capital investments, other investments and investment
property, including derivative financial instruments, are recognized at the time of sale and presented under Gains
(losses) on development capital investments, other investments and investment property. The amount of such gains
and losses is the difference between the proceeds of disposal and average cost. All unrealized gains and losses on
the measurement to fair value of financial instruments are recognized in net income at the time of measurement to
fair value and presented under unrealized gains (losses).
15. INCOME TAXES
The income tax expense comprises the current tax expense and the deferred tax expense. Income taxes are recognized in
net income unless they relate to items that are recognized directly in Other comprehensive income or net assets; in such
case, income taxes are also recognized directly in Other comprehensive income or net assets, respectively.
Current income tax is the amount of income tax payable in respect of the taxable income for the period, calculated using
the tax rates that have been enacted or substantively enacted by the end of the reporting period, and any adjustments to
income taxes related to prior periods.
Deferred income tax is recognized for the temporary differences between the tax bases of assets and liabilities and their
carrying amounts in the financial statements. Deferred income tax is calculated on a non-discounted basis using the tax
rates and tax laws that have been enacted or substantively enacted by the end of the reporting period and that are expected
to apply to the period when the deferred tax asset is realized or the deferred tax liability is settled. A deferred tax asset is
recognized only to the extent that it is probable that future taxable income will be available against which the deductible
temporary differences can be utilized.
The Fonds is subject to federal and Québec income taxes. It is also subject to the tax rules applicable to mutual fund
corporations. For purposes of the federal income tax, the Fonds can, in particular, receive a refund of the income taxes paid
on its capital gains by redeeming its shares or by transferring amounts from retained earnings to share capital. The Fonds
considers itself, in substance, exempted from federal income tax related to capital gains for purposes of applying IFRS and,
accordingly, does not recognize any deferred tax liability for unrealized net gains on development capital investments, other
investments and investment property nor any corresponding deferred tax asset for unrealized recoveries resulting from the
tax mechanisms related to refundable capital gains tax on hand.

NOTES TO FINANCIAL STATEMENTS
FONDS DE SOLIDARITÉ DES TRAVAILLEURS DU QUÉBEC (F.T.Q.) 11
2. SIGNIFICANT ACCOUNTING POLICIES (CONTINUED)
16. NET INCOME PER CLASS A SHARE
Net income per share is calculated by dividing net income by the weighted average number of Class A shares outstanding
during the period.
17. ACCOUNTING STANDARDS ISSUED BUT NOT YET ADOPTED
As at the date of authorization of these financial statements, new standards and amendments to existing standards had
been issued by the International Accounting Standards Board but were not effective. Information on those that might be
relevant to the financial statements of the Fonds is provided below.
a) IFRS 9 Financial Instruments
The IASB issued the final version of the financial instrument standard dealing with classification, measurement,
impairment and hedge accounting. This standard is effective for annual periods beginning on or after January 1,
2018. The Fonds is currently assessing the impact of applying this standard.
b) IFRS 15 Revenue from Contracts with Customers
The IASB issued IFRS 15, which supersedes IAS 18 Revenue and IAS 11 Construction Contracts. This new standard
establishes a single, comprehensive revenue recognition model for all contracts with customers other than those
that are within the scope of other standards, such as financial instruments. The core principle of this new standard
is that revenue recognition should depict the transfer of goods or services in an amount that reflects the
consideration received or expected to be received in exchange for these goods or services. The new standard also
provides more guidance on certain types of transactions and will result in an increase in disclosures related to
revenue. This standard is effective for annual periods beginning on or after January 1, 2017. The Fonds is currently
assessing the impact of applying this standard.
3. CRITICAL ACCOUNTING ESTIMATES AND JUDGMENTS
The preparation of financial statements in accordance with IFRS requires using accounting estimates and judgment when
applying certain accounting policies. Changes to certain assumptions may have an impact on the financial statements for the
period during which such changes are made. The Fonds believes that the underlying assumptions are appropriate and that,
accordingly, its financial statements present fairly its financial position and performance. The following paragraphs present an
analysis of the most significant critical accounting estimates and judgments made by the Fonds in preparing its financial
statements.
1. FAIR VALUE MEASUREMENT OF FINANCIAL INSTRUMENTS THAT ARE NOT TRADED ON AN ACTIVE MARKET
The Fonds must make assumptions and use estimates in measuring the fair value of financial instruments that are not
traded on an active market. Judgments are made with respect to selecting valuation techniques and with respect to the
assumptions used in these valuation techniques.
Although these techniques use observable inputs to the extent practicable, fair value is also determined using unobservable
market inputs that take into account the specific features of the financial instrument and any factor relevant to the
measurement. Using unobservable inputs requires the Fonds’ qualified valuators to make judgments so that these inputs
reflect the assumptions that market participants would use to determine fair value using the best information possible in
the circumstances.
The Fonds considers observable inputs to be market data that is readily available, regularly distributed and updated, reliable
and verifiable, not proprietary and provided by independent sources that are actively involved in the relevant market. Fair
value reflects market conditions on a given date and, as such, may not be representative of future fair values.
In accordance with the Regulation Respecting Development Capital Investment Fund Continuous Disclosure issued by the
Autorité des marchés financiers, the Fonds implemented various controls and procedures to ensure that financial
instruments are appropriately and reliably measured. To measure financial instruments at fair value in accordance with the
valuation principles adopted by the Fonds, the Fonds’ team of qualified valuators monitor twice a year the performance of
the companies in the portfolio and are continuously looking for information on the business and operations of the
companies being valued. Where appropriate, the qualified valuators monitor data on comparable companies, the results of
recent transactions and the ratings of instruments issued by similar companies.

NOTES TO FINANCIAL STATEMENTS
FONDS DE SOLIDARITÉ DES TRAVAILLEURS DU QUÉBEC (F.T.Q.) 12
3. CRITICAL ACCOUNTING ESTIMATES AND JUDGMENTS (CONTINUED)
1. FAIR VALUE MEASUREMENT OF FINANCIAL INSTRUMENTS THAT ARE NOT TRADED ON AN ACTIVE MARKET (CONTINUED)
Except in the case of listed public companies, any relevant information related to fair value measurements is submitted to
an independent valuation committee composed of a majority of qualified valuators independent from the Fonds, as required
by the Regulation Respecting Development Capital Investment Fund Continuous Disclosure. This committee reviews this
information and submits a written report to the Audit Committee, which must examine the compliance of the financial
statements. The President and Chief Executive Officer as well as the Executive Vice-President, Finance, sign a certification
for the Audit Committee on the valuation of development capital investments that is filed with the Autorité des marchés
financiers. This certification confirms, in particular, the reasonableness of the aggregate fair value of the development
capital investments portfolio.
2. FAIR VALUE MEASUREMENT OF THE INVESTMENT PROPERTY
The Fonds must make assumptions and use estimates in measuring the fair value of its investment property. These
assumptions include the internal rate of return and the capitalization rate. The investment property is measured based on
its highest and best use. The Fonds uses a firm of independent real estate appraisal experts to determine fair value and
approves the reasonableness of the assumptions used.
3. MEASUREMENT OF THE NET DEFINED BENEFIT LIABILITY
The Fonds must make assumptions for using statistical data and other parameters to measure the net defined benefit
liability. These assumptions include the discount rate for the pension obligation and for calculating the expected return on
plan assets, the expected rate of increase in salaries and the mortality table used. Should the actuarial assumptions be
materially different from the actual data observed subsequently, the plan cost recognized in net income under Other
comprehensive income as well as the net defined benefit liability presented on the Balance Sheet could substantially change.
4. FINANCIAL INSTRUMENT RISKS
Risks arising from financial instruments are an integral part of the audited financial statements and are discussed in the audited
“Risk management” section of the Interim Management Discussion and Analysis for the Six-month Period Ended November 30,
2014, which is available at the Fonds’ head office, on its website at fondsftq.com or at sedar.com.
NOTES TO FINANCIAL STATEMENTS
FONDS DE SOLIDARITÉ DES TRAVAILLEURS DU QUÉBEC (F.T.Q.) 13
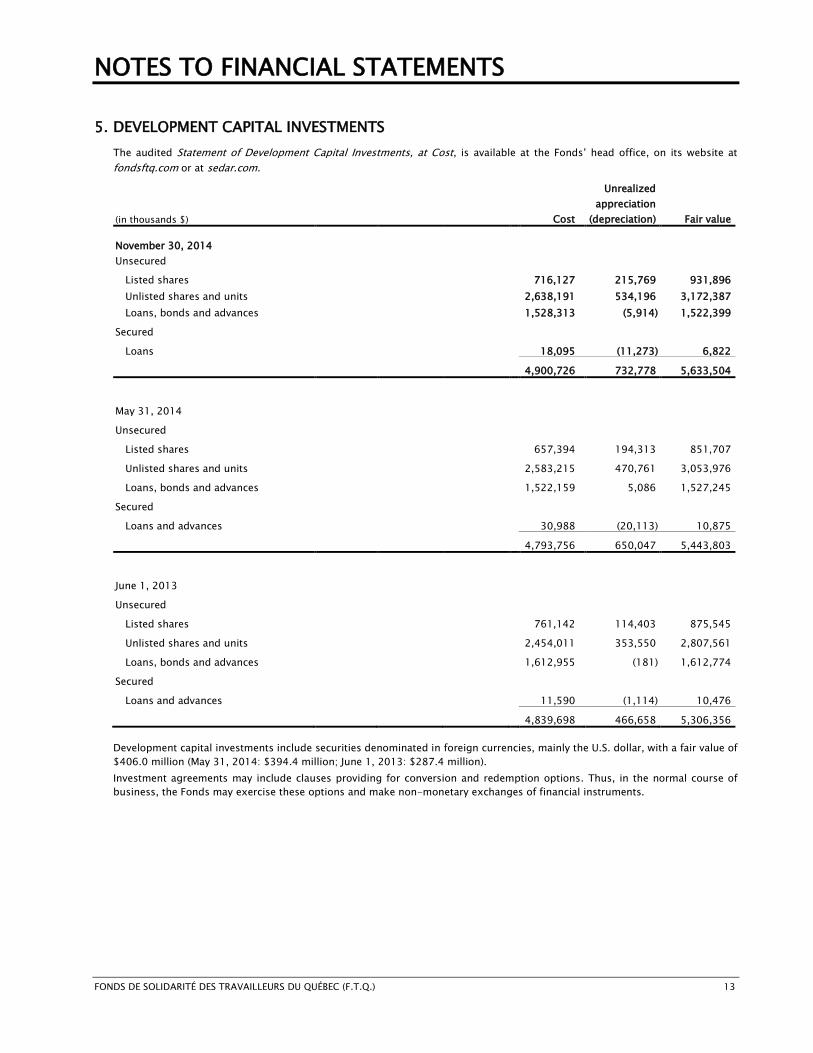
5. DEVELOPMENT CAPITAL INVESTMENTS
The audited Statement of Development Capital Investments, at Cost, is available at the Fonds’ head office, on its website at
fondsftq.com or at sedar.com.
(in thousands $)
Cost
Unrealized
appreciation
(depreciation) Fair value
November 30, 2014
Unsecured
Listed shares 716,127 215,769 931,896
Unlisted shares and units 2,638,191 534,196 3,172,387
Loans, bonds and advances 1,528,313 (5,914) 1,522,399
Secured
Loans 18,095 (11,273) 6,822
4,900,726 732,778 5,633,504
May 31, 2014
Unsecured
Listed shares 657,394 194,313 851,707
Unlisted shares and units 2,583,215 470,761 3,053,976
Loans, bonds and advances 1,522,159 5,086 1,527,245
Secured
Loans and advances 30,988 (20,113) 10,875
4,793,756 650,047 5,443,803
June 1, 2013
Unsecured
Listed shares 761,142 114,403 875,545
Unlisted shares and units 2,454,011 353,550 2,807,561
Loans, bonds and advances 1,612,955 (181) 1,612,774
Secured
Loans and advances 11,590 (1,114) 10,476
4,839,698 466,658 5,306,356
Development capital investments include securities denominated in foreign currencies, mainly the U.S. dollar, with a fair value of
$406.0 million (May 31, 2014: $394.4 million; June 1, 2013: $287.4 million).
Investment agreements may include clauses providing for conversion and redemption options. Thus, in the normal course of
business, the Fonds may exercise these options and make non-monetary exchanges of financial instruments.

NOTES TO FINANCIAL STATEMENTS
FONDS DE SOLIDARITÉ DES TRAVAILLEURS DU QUÉBEC (F.T.Q.) 14
5. DEVELOPMENT CAPITAL INVESTMENTS (CONTINUED)
BREAKDOWN BY MATURITY OF LOANS, BONDS AND ADVANCES AT FAIR VALUE
Variable rates Fixed rates Total
(in thousands $) Less than 1 year 1 to 5 years 5 years and more
November 30, 2014
Unsecured 80,929
297,117 599,740 544,613
1,522,399
Average effective rate (%) 8.0 0.71 8.1 6.9
Secured
178 6,644
6,822
Average effective rate (%) 13.0 9.6
May 31, 2014
Unsecured 75,999
296,909 584,879 569,458
1,527,245
Average effective rate (%) 7.1 1.01 7.0 5.5
Secured 4,110
1,031 5,734
10,875
Average effective rate (%) 14.0 5.2 8.9
June 1, 2013
Unsecured 100,685 342,346 628,564 541,179 1,612,774
Average effective rate (%) 9.0 2.11 7.8 6.9
Secured
6,009 4,467
10,476
Average effective rate (%) 6.9 16.5
1. This average rate includes non-interest bearing advances to a wholly-owned company repayable on demand of $268.8 million (May
31, 2014: $258.2 million; June 1, 2013: $268.9 million). Excluding these advances, the average effective rate would be 6.9%
(May 31, 2014: 8.7%; June 1, 2013: 8.4%).

NOTES TO FINANCIAL STATEMENTS
FONDS DE SOLIDARITÉ DES TRAVAILLEURS DU QUÉBEC (F.T.Q.) 15
5. DEVELOPMENT CAPITAL INVESTMENTS (CONTINUED)
BREAKDOWN BY INDUSTRY SEGMENT
(in thousands $)
Energy and
materials Industrials
Consumer
discretionary
and
consumer
staples
Financials
and
utilities
Information
technology,
telecommuni-
cations
services and
healthcare Total
November 30, 2014
Cost 563,866 748,794 954,047 2,004,477 629,542 4,900,726
Unrealized appreciation (depreciation) 10,253 117,146 217,040 466,216 (77,877) 732,778
Fair value 574,119 865,940 1,171,087 2,470,693 551,665 5,633,504
Funds committed but not disbursed1 118,356 170,027 116,502 181,123 415,525 1,001,533
Guarantees and suretyships2 8,638 8,638
692,475 1,035,967 1,296,227 2,651,816 967,190 6,643,675
May 31, 2014
Cost 528,093 721,573 917,995 1,982,376 643,719 4,793,756
Unrealized appreciation (depreciation) 19,895 104,398 208,712 441,101 (124,059) 650,047
Fair value 547,988 825,971 1,126,707 2,423,477 519,660 5,443,803
Funds committed but not disbursed1 110,366 89,549 102,758 223,837 436,500 963,010
Guarantees and suretyships2 8,227 8,227
658,354 915,520 1,237,692 2,647,314 956,160 6,415,040
June 1, 2013
Cost 539,299 701,695 937,292 2,040,819 620,593 4,839,698
Unrealized appreciation (depreciation) 7,876 80,471 81,010 463,539 (166,238) 466,658
Fair value 547,175 782,166 1,018,302 2,504,358 454,355 5,306,356
Funds committed but not disbursed1 105,000 88,443 91,083 141,044 412,116 837,686
Guarantees and suretyships2 7,814 7,814
652,175 870,609 1,117,199 2,645,402 866,471 6,151,856
1. Funds committed but not disbursed represent development capital investments that have already been agreed to and for which
amounts have been committed by the Fonds but have not been disbursed at the reporting date. Disbursements are subject to
compliance with the agreement’s terms and conditions. Of funds committed but not disbursed, an amount of $305.6 million (May
31, 2014: $278.1 million; June 1, 2013: $171.8 million) represents credit facilities and project financing for operating companies,
having a weighted average maturity of 24 months (May 31, 2014: 20 months; June 1, 2013: 18 months); and an amount of
$695.9 million (May 31, 2014: $684.9 million; June 1, 2013: $665.9 million) represents commitments that will be disbursed to
specialized funds in tranches, having a weighted average maturity of 8.4 years (May 31, 2014: 7.2 years; June 1, 2013: 8.1 years).
Commitments amounting to $168.5 million (May 31, 2014: $189.5 million; June 1, 2013: $103.6 million) are denominated in foreign
currencies, mainly the U.S. dollar.
2. Under Section 17 of its Incorporation Act, when the Fonds makes a development capital investment in the form of a guarantee or a
suretyship, it must establish and maintain a reserve equal to at least 50% of the guarantee or suretyship amount for the term thereof.
This reserve is established from Other investments.

NOTES TO FINANCIAL STATEMENTS
FONDS DE SOLIDARITÉ DES TRAVAILLEURS DU QUÉBEC (F.T.Q.) 16
5. DEVELOPMENT CAPITAL INVESTMENTS (CONTINUED)
GUARANTEES AND SURETYSHIPS
The Fonds granted guarantees and suretyships for operating activities and operating lines of credit purposes, without recourse,
that do not generally include a specific maturity and that are irrevocable commitments by the Fonds to make the payments of
partner companies that cannot meet their obligations to third parties.
As at November 30, 2014, May 31, 2014 and June 1, 2013, there are no provisions related to guarantees and suretyships.
As well, in the normal course of business, the Fonds enters into various indemnification agreements, usually related to sales of
development capital investments, for the representations and warrantees made as well as to the liability of the Fonds’ directors,
officers or representatives toward partner companies. The latter liability is covered, subject to certain conditions, by liability
insurance. Due to the nature of these agreements, it is impossible to reasonably estimate the maximum amount that the Fonds
may have to pay to counterparties. In management’s opinion, it is highly unlikely that these commitments will result in material
expenses.
6. OTHER INVESTMENTS
The unaudited Statement of Other Investments is available at the Fonds’ head office, on its website at fondsftq.com or at
sedar.com.
(in thousands $)
Cost
Unrealized
appreciation Fair value
November 30, 2014
Listed shares and unlisted units 2,270,664 401,882 2,672,546
Bonds 2,302,711 103,558 2,406,269
Money market instruments 116,097 48 116,145
4,689,472 505,488 5,194,960
Derivative financial instruments - 587 587
4,689,472 506,075 5,195,547
May 31, 2014
Listed shares and unlisted units 2,168,611 310,678 2,479,289
Hedge fund units 25,097 388 25,485
Bonds 2,431,186 78,575 2,509,761
Money market instruments 59,803 52 59,855
4,684,697 389,693 5,074,390
Derivative financial instruments - 817 817
4,684,697 390,510 5,075,207
June 1, 2013
Listed shares and unlisted units 1,665,829 69,420 1,735,249
Hedge fund units 242,630 4,663 247,293
Bonds 2,325,705 65,971 2,391,676
Money market instruments 848 1 849
4,235,012 140,055 4,375,067
Derivative financial instruments 1,492 2,989 4,481
4,236,504 143,044 4,379,548
Other investments include securities denominated in foreign currencies with a fair value of $1,989.2 million (May 31, 2014:
$1,847.1 million; June 1, 2013: $1,522.3 million), mainly including $1,162.1 million (May 31, 2014: $1,020.9 million; June 1,
2013: $910.3 million) in U.S. dollars, $197.0 million (May 31, 2014: $199.3 million; June 1, 2013: $199.8 million) in euros,
$180.2 million (May 31, 2014: $172.4 million; June 1, 2013: $92.4 million) in yens and $161.5 million (May 31, 2014:
$167.0 million; June 1, 2013: $180.6 million) in pounds sterling.

NOTES TO FINANCIAL STATEMENTS
FONDS DE SOLIDARITÉ DES TRAVAILLEURS DU QUÉBEC (F.T.Q.) 17
6. OTHER INVESTMENTS (CONTINUED)
BREAKDOWN BY MATURITY
BONDS
(in thousands $)
Less than
1 year
1 to
5 years
5 to
10 years
10 to
20 years
20 to
30 years
30 years
and more
Total
November 30, 2014
Fair value 56,136 729,746 854,251 257,614 353,024 155,498 2,406,269
Cost 56,073 716,905 826,519 230,512 324,519 148,183 2,302,711
Par value 55,876 704,781 805,483 193,765 282,784 143,848 2,186,537
Average effective rate (%) 1.7 2.2 3.0 4.4 3.8 3.7 2.9
Average nominal rate (%) 2.3 2.8 3.5 6.1 4.8 3.9 3.6
May 31, 2014
Fair value 163,631 740,105 707,059 427,440 342,574 128,952 2,509,761
Cost 163,844 725,050 686,243 409,063 323,215 123,771 2,431,186
Par value 162,896 711,707 671,306 363,711 295,539 123,609 2,328,768
Average effective rate (%) 1.5 2.4 3.2 3.7 4.2 3.9 3.1
Average nominal rate (%) 2.5 3.1 3.6 4.8 4.9 3.9 3.7
June 1, 2013
Fair value 84,080 739,268 783,978 310,227 361,787 112,336 2,391,676
Cost 84,714 733,505 764,198 296,973 336,942 109,373 2,325,705
Par value 82,972 712,346 724,150 236,004 293,689 103,369 2,152,530
Average effective rate (%) 2.1 2.2 3.2 3.9 4.1 3.8 3.1
Average nominal rate (%) 4.0 3.2 4.0 6.0 5.1 4.3 4.1
MONEY MARKET INSTRUMENTS
(in thousands $) Less than 1 month 1 to 6 months
6 months and
more Total
November 30, 2014
Fair value 80,447 33,915 1,783 116,145
Average effective rate (%) 1.0 1.1 1.2 1.0
May 31, 2014
Fair value 59,565 290 59,855
Average effective rate (%) 1.0 1.0 1.0
June 1, 2013
Fair value 90 759 849
Average effective rate (%) 1.0 1.0 1.0
NOTES TO FINANCIAL STATEMENTS
FONDS DE SOLIDARITÉ DES TRAVAILLEURS DU QUÉBEC (F.T.Q.) 18
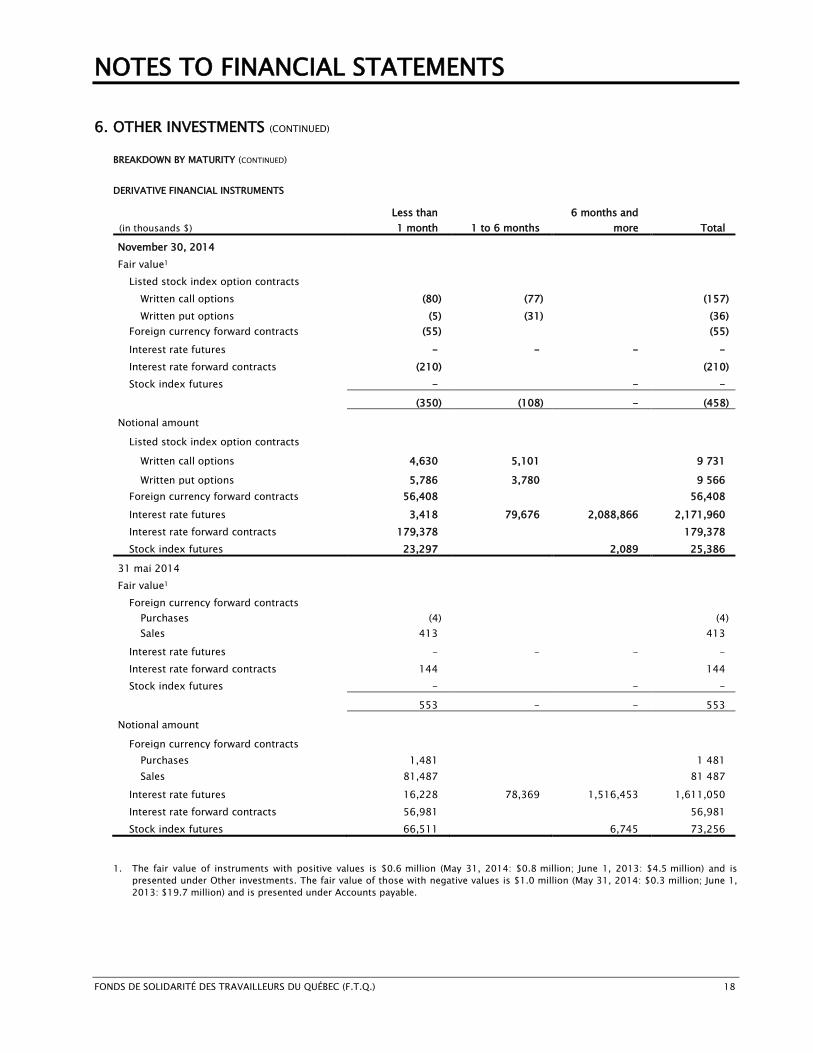
6. OTHER INVESTMENTS (CONTINUED)
BREAKDOWN BY MATURITY (CONTINUED)
DERIVATIVE FINANCIAL INSTRUMENTS
(in thousands $)
Less than
1 month 1 to 6 months
6 months and
more Total
November 30, 2014
Fair value1
Listed stock index option contracts
Written call options (80) (77)
(157)
Written put options (5) (31)
(36)
Foreign currency forward contracts (55)
(55)
Interest rate futures - - - -
Interest rate forward contracts (210)
(210)
Stock index futures - - -
(350) (108) - (458)
Notional amount
Listed stock index option contracts
Written call options 4,630 5,101
9 731
Written put options 5,786 3,780
9 566
Foreign currency forward contracts 56,408
56,408
Interest rate futures 3,418 79,676 2,088,866 2,171,960
Interest rate forward contracts 179,378
179,378
Stock index futures 23,297 2,089 25,386
31 mai 2014
Fair value1
Foreign currency forward contracts
Purchases (4)
(4)
Sales 413
413
Interest rate futures - - - -
Interest rate forward contracts 144
144
Stock index futures - - -
553 - - 553
Notional amount
Foreign currency forward contracts
Purchases 1,481
1 481
Sales 81,487
81 487
Interest rate futures 16,228 78,369 1,516,453 1,611,050
Interest rate forward contracts 56,981
56,981
Stock index futures 66,511 6,745 73,256
1. The fair value of instruments with positive values is $0.6 million (May 31, 2014: $0.8 million; June 1, 2013: $4.5 million) and is
presented under Other investments. The fair value of those with negative values is $1.0 million (May 31, 2014: $0.3 million; June 1,
2013: $19.7 million) and is presented under Accounts payable.

NOTES TO FINANCIAL STATEMENTS
FONDS DE SOLIDARITÉ DES TRAVAILLEURS DU QUÉBEC (F.T.Q.) 19
6. OTHER INVESTMENTS (CONTINUED)
BREAKDOWN BY MATURITY (CONTINUED)
DERIVATIVE FINANCIAL INSTRUMENTS (CONTINUED)
(in thousands $) Less than 1 month 1 to 6 months 6 months and more Total
June 1, 2013
Fair value1
Unlisted share option contracts
Purchased put options
750 750
Written put options
(2,327) (2,327)
Listed index stock option contracts
Purchased put options 2 254
256
Written call options (60) (179)
(239)
Written put options
(93)
(93)
Foreign currency forward contracts
Purchases 150 (1)
149
Sales (14,573) (67)
(14,640)
Interest rate futures - - - -
Interest rate forward contracts
896
896
Stock index futures -
- -
(14,481) 810 (1,577) (15,248)
Notional amount
Unlisted share option contracts
Purchased put options
18,900 18,900
Written put options
31,500 31,500
Listed index stock option contracts
Purchased put options 1,550 11,724
13,274
Written call options 1,633 12,636
14,269
Written put options
9,367
9,367
Foreign currency forward contracts
Purchases 630,656 77,298
707,954
Sales 931,659 639,582
1,571,241
Interest rate futures 25,612 67,646 1,357,638 1,450,896
Interest rate forward contracts
159,738
159,738
Stock index futures 124,603
7,925 132,528
1. The fair value of instruments with positive values is $0.6 million (May 31, 2014: $0.8 million; June 1, 2013: $4.5 million) and is
presented under Other investments. The fair value of those with negative values is $1.0 million (May 31, 2014: $0.3 million;
June 1, 2013: $19.7 million) and is presented under Accounts payable.

NOTES TO FINANCIAL STATEMENTS
FONDS DE SOLIDARITÉ DES TRAVAILLEURS DU QUÉBEC (F.T.Q.) 20
6. OTHER INVESTMENTS (CONTINUED)
BREAKDOWN OF FAIR VALUE BY INDUSTRY SEGMENT1
(in thousands $)
Energy
and
materials
Indus-
trials
Consumer
discretionary
and
consumer
staples
Financials
and
utilities
Information
technology,
telecommuni
-cations
services and
healthcare
Govern-
ments and
govern-
ment
agencies Total
November 30, 2014
Listed shares and unlisted units 449,513 246,159 541,152 737,218 698,504 2,672,546
Bonds 92,491 41,789 85,016 628,707 58,773 1,499,493 2,406,269
Money market instruments 1,389 43,007 71,749 116,145
Fair value 542,004 287,948 627,557 1,408,932 757,277 1,571,242 5,194,960
Funds committed but not disbursed2 18,808 18,808
542,004 287,948 627,557 1,427,740 757,277 1,571,242 5,213,768
May 31, 2014
Listed shares, unlisted units and
hedge fund units 502,645 220,701 468,003 738,581 574,844 2,504,774
Bonds 101,305 38,474 66,687 600,923 59,545 1,642,827 2,509,761
Money market instruments 6,999 52,856 59,855
Fair value 603,950 259,175 534,690 1,346,503 634,389 1,695,683 5,074,390
Funds committed but not disbursed2 19,102 19,102
603,950 259,175 534,690 1,365,605 634,389 1,695,683 5,093,492
June 1, 2013
Listed shares, unlisted units and
hedge fund units 752,823 270,143 681,827 277,749 1,982,542
Bonds 87,007 42,613 34,518 545,758 81,026 1,600,754 2,391,676
Money market instruments 849 849
Fair value 839,830 42,613 304,661 1,227,585 358,775 1,601,603 4,375,067
Funds committed but not disbursed2 16,903 16,903
839,830 42,613 304,661 1,244,488 358,775 1,601,603 4,391,970
1. This breakdown does not take into account changes in asset allocation resulting from derivative financial instruments.
2. Funds committed but not disbursed to international infrastructure funds represent other investments that have already been agreed
to and for which amounts have been committed by the Fonds but have not been disbursed at the reporting date. Disbursements are
subject to compliance with the agreement’s terms and conditions. These commitments, having a weighted average maturity of
6.1 years (May 31, 2014: 6.6 years; June 1, 2013: 7.4 years), are denominated in U.S. dollars.

NOTES TO FINANCIAL STATEMENTS
FONDS DE SOLIDARITÉ DES TRAVAILLEURS DU QUÉBEC (F.T.Q.) 21
7. OFFSETTING OF FINANCIAL INSTRUMENTS
The Fonds entered into International Swaps & Derivatives Association Inc. (“ISDA”) enforceable master netting arrangements with
the majority of counterparties with which it trades derivative financial instruments over the counter. These master arrangements
may make it possible to apply full netting of over-the-counter derivative financial instrument transactions. Derivative financial
instruments subject to enforceable master netting arrangements are presented in the financial statements before offsetting. The
fair value of derivative financial instrument assets subject to such arrangements is $0.4 million (May 31, 2014: $0.3 million;
June 1, 2013: $1.9 million), and the fair value of derivative financial instrument liabilities subject to such arrangements is
$0.6 million (May 31, 2014: $0.3 million; June 1, 2013: $7.4 million).
For securities purchased under reverse repurchase agreements and securities sold under repurchase agreements, the Fonds
receives from or pledges to the counterparty collateral to manage credit risk. In the event of default, amounts related to a
specific counterparty may be settled on a net basis under the Global Master Repurchase Agreement. As at November 30, 2014,
May 31, 2014 and June 1, 2013, none of these amounts was set off in the balance sheet.
8. FAIR VALUE OF FINANCIAL INSTRUMENTS
Financial instruments measured at fair value are classified using a hierarchy that reflects the significance of the inputs used in
making the measurements. This hierarchy has the following levels:
Level 1: Fair value based on the most representative price within the bid-ask spread observed on active markets for identical
instruments.
Level 2: Fair value based on quoted prices for similar financial instruments or based on valuation techniques for which all
significant inputs are based on observable market information.
Level 3: Fair value based on valuation techniques for which all significant inputs are not based on observable market
information.
(in thousands $) Level 1 Level 2 Level 3 Total
November 30, 2014
Financial assets
Development capital investments
Unsecured
Listed shares 931,896 - 931,896
Unlisted shares and units 3,172,387 3,172,387
Loans, bonds and advances 475,682 1,046,717 1,522,399
Secured
Loans 6,822 6,822
931,896 475,682 4,225,926 5,633,504
Other investments
Listed shares and unlisted units 2,618,034 54,512 2,672,546
Bonds 2,394,979 11,290 2,406,269
Money market instruments 116,145 116,145
Derivative financial instruments - 587 587
2,618,034 2,511,711 65,802 5,195,547
Accounts receivable relating to development capital investments and other investments sold 71,034 71,034
Cash 24,890 24,890
Securities purchased under reverse repurchase agreements 215,785 215,785
Financial instruments related to securities sold under repurchase agreements 137,357 137,357
Financial liabilities
Accounts payable relating to development capital investments and other investments purchased 50,322 50,322
Derivative financial instruments (193) (852) (1,045)
Securities sold under repurchase agreements (353,142) (353,142)

NOTES TO FINANCIAL STATEMENTS
FONDS DE SOLIDARITÉ DES TRAVAILLEURS DU QUÉBEC (F.T.Q.) 22
8. FAIR VALUE OF FINANCIAL INSTRUMENTS (CONTINUED)
(in thousands $) Level 1 Level 2 Level 3 Total
May 31, 2014
Financial assets
Development capital investments
Unsecured
Listed shares 851,654 53 851,707
Unlisted shares and units 3,053,976 3,053,976
Loans, bonds and advances 451,101 1,076,144 1,527,245
Secured
Loans and advances 10,875 10,875
851,654 451,154 4,140,995 5,443,803
Other investments
Listed shares and unlisted units 2,428,238 51,051 2,479,289
Hedge fund units 25,485 25,485
Bonds 2,498,500 11,261 2,509,761
Money market instruments 59,8555 59,855
Derivative financial instruments - 817 817
2,428,238 2,559,172 87,797 5,075,207
Accounts receivable relating to development capital
investments and other investments sold 121,547 121,547
Cash 15,939 15,939
Securities purchased under reverse repurchase
agreements
254,980 254,980
Financial instruments related to securities sold under
repurchase agreements 101,252 101,252
Financial liabilities
Accounts payable relating to development capital
investments and other investments purchased 122,121 122,121
Derivative financial instruments (264) (264)
Securities sold under repurchase agreements (356,232) (356,232)

NOTES TO FINANCIAL STATEMENTS
FONDS DE SOLIDARITÉ DES TRAVAILLEURS DU QUÉBEC (F.T.Q.) 23
8. FAIR VALUE OF FINANCIAL INSTRUMENTS (CONTINUED)
(in thousands $) Level 1 Level 2 Level 3 Total
June 1, 2013
Financial assets
Development capital investments
Unsecured
Listed shares 875,162 383 - 875,545
Unlisted shares and units 2,807,561 2,807,561
Loans, bonds and advances 442,405 1,170,369 1,612,774
Secured
Loans and advances 10,476 10,476
875,162 442,788 3,988,406 5,306,356
Other investments
Listed shares and unlisted units 1,677,809 57,440 1,735,249
Hedge funds units 247,293 247,293
Bonds 2,380,940 10,736 2,391,676
Money market instruments 849 849
Derivative financial instruments 256 4,225 4,481
1,678,065 2,386,014 315,469 4,379,548
Accounts receivable relating to development capital investments and other investments sold 159,421 159,421
Cash 9,172 9,172
Securities purchased under reverse repurchase
agreements
274,123 274,123
Financial instruments related to securities sold under repurchase agreements 148,819 148,819
Financial liabilities
Accounts payable relating to development capital
investments and other investments purchased 185,862 185,862
Derivative financial instruments (332) (19,397) (19,729)
Securities sold under repurchase agreements (422,942) (422,942)

NOTES TO FINANCIAL STATEMENTS
FONDS DE SOLIDARITÉ DES TRAVAILLEURS DU QUÉBEC (F.T.Q.) 24
8. FAIR VALUE OF FINANCIAL INSTRUMENTS (CONTINUED)
The following tables show the reconciliation from beginning balances to ending balances for Level 3 fair values. There were no
transfers between Levels 1 and 2 during the period. Transfers between levels are deemed to occur when the underlying
information or the prices used in measuring assets and liabilities become more or less dependent on observable market data, as
it is previously mentioned in the determination of Levels 1, 2 and 3 of the fair value hierarchy for the Fonds.
DEVELOPMENT CAPITAL INVESTMENTS
(in thousands $)
Unlisted shares
and units
Loans, bonds and advances
Total Unsecured Secured
November 30, 2014
Fair value as at May 31, 2014 3,053,976 1,076,144 10,875 4,140,995
Realized gains (losses) 12,056 2,196 (6,504) 7,748
Unrealized gains (losses) 63,435 (6,419) 8,840 65,856
Purchases 115,145 55,745 895 171,785
Sales and settlements (72,225) (50,949) (7,284) (130,458)
Transfer of a financial instrument out of Level 3 (30,000)1 (30,000)
Fair value as at November 30, 2014 3,172,387 1,046,717 6,822 4,225,926
Unrealized gains (losses) on development capital
investments held as at November 30, 2014 194,008 (4,814) 3,481 192,675
November 30, 2013
Fair value as at May 31, 2013 2,807,561 1,170,369 10,476 3,988,406
Realized gains (losses) (6,578) 1,266 (5,312)
Unrealized gains (losses) 21,001 (16,800) (1,916) 2,285
Purchases 81,551 49,135 1,200 131,886
Sales and settlements (48,822) (100,689) (769) (150,280)
Fair value as at November 30, 2013 2,854,713 1,103,281 8,991 3,966,985
Unrealized gains (losses) on development capital
investments held as at November 30, 2013 12,740 (18,050) (1,916) (7,226)
1. An unsecured loan has been transferred from Level 3 to Level 2 as its measurement method is now based on observable
market inputs.

NOTES TO FINANCIAL STATEMENTS
FONDS DE SOLIDARITÉ DES TRAVAILLEURS DU QUÉBEC (F.T.Q.) 25
8. FAIR VALUE OF FINANCIAL INSTRUMENTS (CONTINUED)
OTHER INVESTMENTS
(in thousands $)
Listed shares and
unlisted units
Hedge fund
units Bonds Total
November 30, 2014
Fair value as at May 31, 2014 51,051 25,485 11,261 87,797
Realized gains (losses) (16) 988 972
Unrealized gains (losses) 4,177 (605) 29 3,601
Purchases 960 960
Sales and settlements (1,660) (25,868) (27,528)
Fair value as at November 30, 2014 54,512 11,290 65,802
Unrealized gains on other investments held as at
November 30, 2014 4,300 29 4,329
November 30, 2013
Fair value as at May 31, 2013 57,440 247,293 10,736 315,469
Realized gains (losses) (40) 2,604 2,564
Unrealized gains (losses) 1,803 (2,908) 87 (1,018)
Purchases 240 243 483
Sales and settlements (1,048) (188,450) (189,498)
Fair value as at November 30, 2013 58,395 58,782 10,823 128,000
Unrealized gains (losses) on other investments held as
at November 30, 2013 1,803 (1,845) 87 45
USE OF UNOBSERVABLE INPUTS IN MEASURING LEVEL 3 FINANCIAL INSTRUMENTS
Level 3 financial instruments are measured at fair value using valuation techniques and models that incorporate significant
assumptions derived from unobservable market inputs. The following table shows the main techniques and inputs used in
measuring the fair value of financial instruments categorized within Level 3.
Fair value
(in thousands $)
Main valuation
techniques Unobservable inputs
Input value ranges
(weighted average)
November 30, 2014
Development capital investments
Unlisted shares and units 547,804 Capitalized cash flows Capitalization rate 5.8% - 13.0% (8.4%)
EBITDA margin %1 5.7% - 41.9% (15.8%)
2,281,286 Adjusted net assets Adjusted net assets N/A2
106,885 Recent transactions - -
236,412 Other3 - -
Loans, bonds and advances 765,874 Discounted cash flows Required rate of return 2.5% - 15.0% (7.7%)
268,838 Adjusted net assets Adjusted net assets N/A2
18,827 Other - -
4,225,926
Other investments
Unlisted units 54,512 Manager’s quote - -
Bonds 11,290 Other - -
65,802

NOTES TO FINANCIAL STATEMENTS
FONDS DE SOLIDARITÉ DES TRAVAILLEURS DU QUÉBEC (F.T.Q.) 26
8. FAIR VALUE OF FINANCIAL INSTRUMENTS (CONTINUED)
USE OF UNOBSERVABLE INPUTS IN MEASURING LEVEL 3 FINANCIAL INSTRUMENTS (CONTINUED)
Fair value
(in thousands $) Main valuation techniques Unobservable inputs
Input value ranges
(weighted average)
May 31, 2014
Development capital investments
Unlisted shares and units 1,035,939 Capitalized cash flows Capitalization rate 5.9% - 14.5% (8.8%)
EBITDA margin %1 4.1% - 42.4% (16.8%)
1,704,547 Adjusted net assets Adjusted net assets N/A2
94,251 Recent transactions - -
219,239 Other3 - -
Loans, bonds and advances 811,817 Discounted cash flows Required rate of return 2.6% - 18.0% (7.8%)
258,182 Adjusted net assets Adjusted net assets N/A2
17,020 Other - -
4,140,995
Other investments
Unlisted units 51,051 Manager’s quote - -
Hedge fund units 25,485 Manager’s quote - -
Bonds 11,261 Other - -
87,797
June 1, 2013
Development capital investments
Unlisted shares and units 395,100 Capitalized cash flows Capitalization rate 5.7% - 16.3% (9.1%)
EBITDA margin %1 4.4% - 31.8% (15.3%)
1,670,748 Adjusted net assets Adjusted net assets N/A2
486,647 Recent transactions - -
255,066 Other3 - -
Loans, bonds and advances 835,070 Discounted cash flows Required rate of return 3.0% - 18.0% (8.6%)
316,187 Adjusted net assets Adjusted net assets N/A2
29,588 Other - -
3,988,406
Other investments
Unlisted units 57,440 Manager’s quote - -
Hedge fund units 247,293 Manager’s quote - -
Bonds 10,736 Other - -
315,469
1. As a result of the high variety in sizes of the companies in the portfolio, maintainable flows are presented as a percentage of
earnings before interest, taxes, depreciation and amortization (EBITDA) over sales.
2. Since the nature and size of adjustments to net assets vary greatly between investments, no input range is presented for
adjusted net assets.
3. Other valuation techniques include the expected transaction value, redemption value, discounted cash flow and liquidation
value methods.

NOTES TO FINANCIAL STATEMENTS
FONDS DE SOLIDARITÉ DES TRAVAILLEURS DU QUÉBEC (F.T.Q.) 27
8. FAIR VALUE OF FINANCIAL INSTRUMENTS (CONTINUED)
SENSITIVITY OF THE FAIR VALUE OF FINANCIAL INSTRUMENTS CATEGORIZED WITHIN LEVEL 3
Our sensitivity analyses on loans and advances lead us to conclude that a +/- 0.50% change in the required rate of return would
result in a change in fair value that would not be material to net income and total assets and liabilities.
Although management believes that its fair value measurements are appropriate, for unlisted shares and units measured using the
capitalized cash flow method, using different variables related to maintainable EBITDA and capitalization rate would result in an
increase or a decrease in fair value that could be material in certain cases. In practice, the Fonds’ qualified valuators determine a
range of plausible values for each of the securities being valued and the mid-range point is generally used for preparing financial
statements. Accordingly, for a given investment, the low end of the range reflects the worst-case scenario, while the high end of
the range reflects the best-case scenario. This practice is the most common method used to estimate the financial impact of
changing the main assumptions by other reasonably acceptable assumptions.
According to management, the increase or decrease in the value of unlisted shares and units is theoretical and unlikely, as the
diversification of the portfolio with respect to industries, maturities and sizes is such that the value of investments is not moving
solely in one direction. Consequently, management believes that only a portion of the increase or decrease in value should be used
to estimate the impact of using alternative assumptions on the fair value of unlisted shares and units measured using the
capitalized cash flow method. Management determined that using reasonably plausible alternative assumptions would not change
fair value significantly.
9. INVESTMENTS IN SUBSDIARIES AND ASSOCIATES
Further to its quantitative and qualitative analyses, management determined that the Fonds controls or exercises significant
influence over operating companies and investment entities:
November 30, 2014 May 31, 2014 June 1, 2013
Number
Fair value
(in thousands $) Number
Fair value
(in thousands $) Number
Fair value
(in thousands $)
Subsidiaries
Operating companies 14 975,342 16 793,368 17 836,838
Investment entities 30 1,004,880 30 1,149,949 31 1,123,706
Associates
Operating companies 60 667,946 59 498,036 59 477,405
Investment entities 30 270,196 27 254,457 29 232,113
The principal place of business of the majority of subsidiaries and associates is in Québec. The proportion of ownership interests
held by the Fonds is greater than 50% for subsidiaries and between 20% and 49% for associates. Interests in the share capital of
operating companies are in the form of common shares, while interests in investment entities are in the form of units. Funds
committed but not disbursed to subsidiaries amount to $139.7 million (May 31, 2014: $140.9 million; June 1, 2013:
$140.7 million). In certain circumstances, some conditions could restrict the ability of a subsidiary to transfer amounts to the
Fonds: for instance, compliance with certain ratios or approval of a payment by another financial institution or other shareholders.
However, the Fonds considers that there are no significant restrictions to these transfers, except for one subsidiary operating in the
insurance industry. In that case, laws and regulations do not allow the Fonds to receive dividends, redeem its shares or obtain
repayment of its loans without approval by the Autorité des marchés financiers.
When the Fonds controls an investment entity, it must also take into account in its scope of subsidiaries and associates those of
that investment entity. Accordingly, as at November 30, 2014, the Fonds indirectly had 87 additional subsidiaries and 98 additional
associates under this criteria (May 31, 2014: 83 subsidiaries and 105 associates; June 1, 2013: 92 subsidiaries and 101 associates).

NOTES TO FINANCIAL STATEMENTS
FONDS DE SOLIDARITÉ DES TRAVAILLEURS DU QUÉBEC (F.T.Q.) 28
10. SECURITIES LENDING
As part of the securities lending program, the Fonds receives, in exchange for the securities loaned, guarantees or assets, mainly
government and corporate bonds, equivalent to the minimum percentage prescribed by any applicable law or agreement or to a
percentage that may vary according to best practices. Depending on the securities loaned, this percentage ranges from 102% to
105% as at November 30, 2014 (May 31, 2014: from 102% to 105%; June 1, 2013: 102%) and the fair value of the securities loaned
is $327.4 million (May 31, 2014: $311.3 million; June 1, 2013: $83.6 million).
11. INVESTMENT PROPERTY
The investment property held by the Fonds comprises office space for rental. The following table presents the changes in the fair
value of the investment property for the six-month periods ended November 30.
(in thousands $)
2014
2013
Balance at beginning of period 27,689 25,328
Increase in office space 2,871 -
Change in fair value recognized in net income 816 -
Balance at end of period 31,376 25,328
UNOBSERVABLE INPUTS
The investment property measured at fair value is an asset categorized within Level 3 of the fair value hierarchy, as significant
unobservable inputs are used in the valuation techniques applied. Significant unobservable inputs used in measuring the
investment property are as follows:
Fair value
(in thousands $) Valuation techniques Unobservable inputs Input value
November 30, 2014
Investment property 31,376 Discounted cash flows Internal rate of return 7.50%
Capitalization rate 6.75%
May 31, 2014
Investment property 27,689 Discounted cash flows Internal rate of return 7.50%
Capitalization rate 6.75%
June 1, 2013
Investment property 25,328 Discounted cash flows Internal rate of return 7.25%
Capitalization rate 6.50%
12. ACCOUNTS RECEIVABLE
(in thousands $) November 30, 2014 May 31, 2014 June 1, 2013
Accounts receivable relating to development capital investments
and other investments sold 71,034 121,547 159,421
Accrued dividends and interest 67,248 73,580 71,597
Other 26,207 25,358 28,031
164,489 220,485 259,049

NOTES TO FINANCIAL STATEMENTS
FONDS DE SOLIDARITÉ DES TRAVAILLEURS DU QUÉBEC (F.T.Q.) 29
13. PROPERTY AND EQUIPMENT
(in thousands $) Buildings
Office furniture
and equipment
Computer
hardware Total
November 30, 2014
Cost 42,451 11,702 16,615 70,768
Accumulated depreciation (2,019) (8,707) (12,504) (23,230)
Net carrying amount 40,432 2,995 4,111 47,538
Change during the period
Net carrying amount as at May 31, 2014 41,099 2,556 3,923 47,578
Acquisitions 191 729 1,229 2,149
Disposals (182) - (182)
Depreciation (676) (290) (1,041) (2,007)
Net carrying amount as at November 30, 2014 40,432 2,995 4,111 47,538
May 31, 2014
Cost 42,451 10,973 15,674 69,098
Accumulated depreciation (1,352) (8,417) (11,751) (21,520)
Net carrying amount 41,099 2,556 3,923 47,578
Change during the year
Net carrying amount as at May 31, 2013 42,393 2,275 4,315 48,983
Acquisitions 58 836 1,675 2,569
Disposals - -
Depreciation (1,352) (555) (2,067) (3,974)
Net carrying amount as at May 31, 2014 41,099 2,556 3,923 47,578
June 1, 2013
Cost 42,393 10,137 14,303 66,833
Accumulated depreciation - (7,862) (9,988) (17,850)
Net carrying amount 42,393 2,275 4,315 48,983
No item of property and equipment was impaired as at November 30, 2014 (none as at May 31, 2014 and June 1, 2013). In
addition, as at November 30, 2014, May 31, 2014 and June 1, 2013, the Fonds had no significant contractual commitment for the
acquisition of property and equipment. The depreciation expense is presented under Corporate expenses in the Statement of
Comprehensive Income.

NOTES TO FINANCIAL STATEMENTS
FONDS DE SOLIDARITÉ DES TRAVAILLEURS DU QUÉBEC (F.T.Q.) 30
14. INTANGIBLE ASSETS
(in thousands $)
Information
systems development
November 30, 2014
Cost 25,633
Accumulated amortization (18,749)
Net carrying amount 6,884
Change during the period
Net carrying amount as at May 31, 2014 6,542
Acquisitions 1,606
Amortization (1,264)
Net carrying amount as at November 30, 2014 6,884
May 31, 2014
Cost 24,028
Accumulated amortization (17,486)
Net carrying amount 6,542
Change during the year
Net carrying amount as at May 31, 2013 4,594
Acquisitions 3,745
Amortization (1,797)
Net carrying amount as at May 31, 2014 6,542
June 1, 2013
Cost 20,283
Accumulated amortization (15,689)
Net carrying amount 4,594
No intangible asset was impaired as at November 30, 2014 (none as at May 31, 2014 and June 1, 2013). In addition, as at
November 30, 2014, May 31, 2014 and June 1, 2013, the Fonds had no significant contractual commitment for the acquisition of
intangible assets. The amortization expense is presented under Corporate expenses in the Statement of Comprehensive Income.
15. NOTES
The notes, which arise from excess liquidities of regional and local funds and of certain specialized funds, are repayable on
demand and bear interest at a rate based on the rate of return of Other investments. As at November 30, 2014, May 31, 2014 and
June 1, 2013, the interest rate is 4%.
16. CREDIT FACILITIES
As at November 30, 2014, May 31, 2014 and June 1, 2013, the Fonds has credit facilities amounting to $80 million, bearing
interest at prime rate and renewable annually. As at November 30, 2014, May 31, 2014 and June 1, 2013, these facilities are
unused, and they were not used during the periods then ended.

NOTES TO FINANCIAL STATEMENTS
FONDS DE SOLIDARITÉ DES TRAVAILLEURS DU QUÉBEC (F.T.Q.) 31
17. ACCOUNTS PAYABLE
(in thousands $) November 30, 2014 May 31, 2014 June 1, 2013
Accounts payable relating to development capital investments
and other investments purchased 50,322 122,121 185,862
Accrued expenses and other 57,123 57,573 60,752
Derivative financial instruments 1,045 264 19,729
108,490 179,958 266,343
18. NET ASSETS
1. SHARE CAPITAL
a) Authorized
i) Class A shares
Unlimited number of Class A shares to be issued in Series 1 and 2, without par value, voting, redeemable and
inalienable unless approved by a resolution of the Board of Directors.
Class A shares, Series 1 and 2 can be exchanged for shares of another series and rank pari passu. However, Class A
share, Series 1 may be issued only to an individual requesting their transfer to a trustee under a registered
retirement savings plan.
ii) Class B shares
Unlimited number of Class B shares, without par value, non-voting, entitled to a preferential dividend at the rate
determined by the Board of Directors. In the event of liquidation, the Class B shares rank prior to Class A shares.
b) Subscribed
Subscribed capital is money cashed but for which no Class A share can be issued in consideration thereof pursuant to
the Fonds’ Purchase-by-Agreement Policy. These Class A shares will be issued at the time set out in such policy at the
share price in effect at that date.
c) Redemption terms
The Fonds is required to redeem shares in the circumstances set out in its Incorporation Act or to redeem them by
mutual agreement in exceptional situations provided under a policy for such purpose adopted by the Fonds’ Board of
Directors and approved by the Minister of Finance of Québec. The redemption price is determined semi-annually based
on the value of the Fonds.
d) Contributed surplus
Contributed surplus arises from the reduction in issued and paid-up capital resulting from transfers and the excess of
the average value of share capital over the redemption price. This excess is reduced when shares are redeemed at a
price exceeding the average value of issued share capital, pro rata to the redeemed shares.
e) Transfer
During the period, the Board of Directors approved an increase in the issued and paid-up capital on Class A shares,
Series 1 of $75 million through a transfer from retained earnings (November 30, 2013: $70 million).
As at November 30, 2014, the Fonds had, since its incorporation, transferred the following cumulative amounts:
$1,977 million from retained earnings to share capital, $1,500 million from share capital to contributed surplus and
$291 million from contributed surplus to retained earnings.
2. ACCUMULATED OTHER COMPREHENSIVE INCOME
Accumulated other comprehensive income was set up upon the first-time adoption of IFRS.
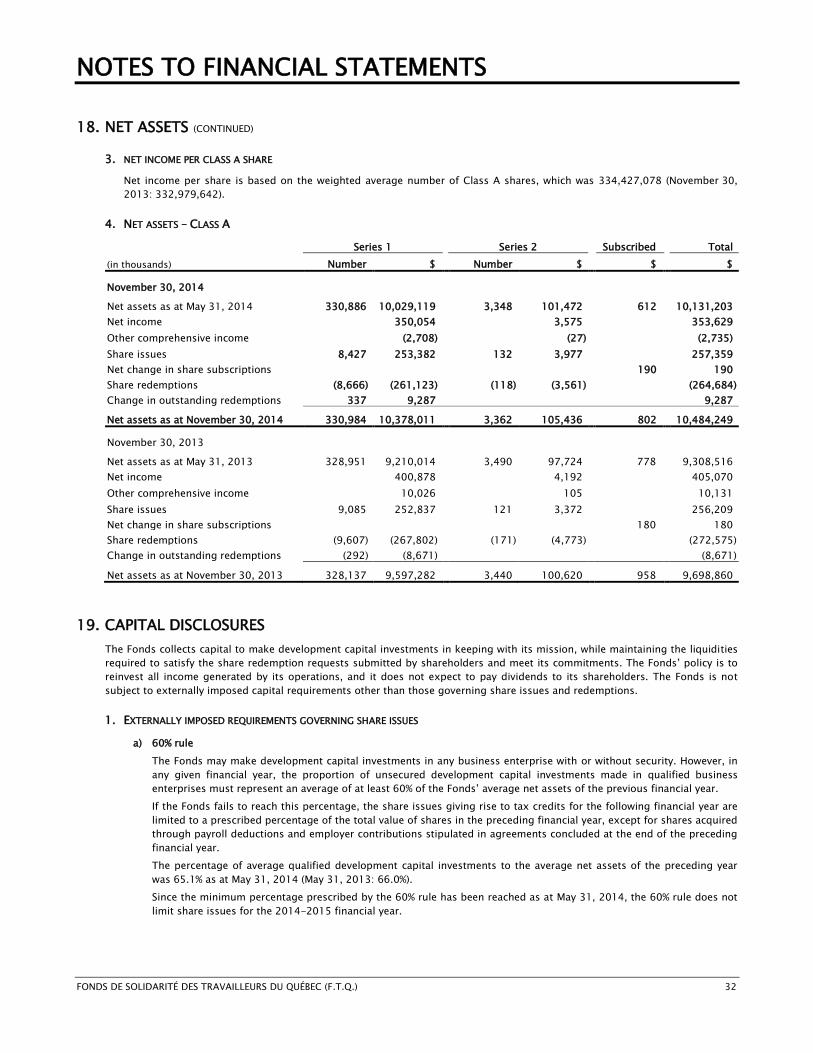
NOTES TO FINANCIAL STATEMENTS
FONDS DE SOLIDARITÉ DES TRAVAILLEURS DU QUÉBEC (F.T.Q.) 32
18. NET ASSETS (CONTINUED)
3. NET INCOME PER CLASS A SHARE
Net income per share is based on the weighted average number of Class A shares, which was 334,427,078 (November 30,
2013: 332,979,642).
4. NET ASSETS – CLASS A
Series 1 Series 2 Subscribed Total
(in thousands) Number $ Number $ $ $
November 30, 2014
Net assets as at May 31, 2014 330,886 10,029,119 3,348 101,472 612 10,131,203
Net income 350,054 3,575 353,629
Other comprehensive income (2,708) (27) (2,735)
Share issues 8,427 253,382 132 3,977 257,359
Net change in share subscriptions 190 190
Share redemptions (8,666) (261,123) (118) (3,561) (264,684)
Change in outstanding redemptions 337 9,287 9,287
Net assets as at November 30, 2014 330,984 10,378,011 3,362 105,436 802 10,484,249
November 30, 2013
Net assets as at May 31, 2013 328,951 9,210,014 3,490 97,724 778 9,308,516
Net income 400,878 4,192 405,070
Other comprehensive income 10,026 105 10,131
Share issues 9,085 252,837 121 3,372 256,209
Net change in share subscriptions 180 180
Share redemptions (9,607) (267,802) (171) (4,773) (272,575)
Change in outstanding redemptions (292) (8,671) (8,671)
Net assets as at November 30, 2013 328,137 9,597,282 3,440 100,620 958 9,698,860
19. CAPITAL DISCLOSURES
The Fonds collects capital to make development capital investments in keeping with its mission, while maintaining the liquidities
required to satisfy the share redemption requests submitted by shareholders and meet its commitments. The Fonds’ policy is to
reinvest all income generated by its operations, and it does not expect to pay dividends to its shareholders. The Fonds is not
subject to externally imposed capital requirements other than those governing share issues and redemptions.
1. EXTERNALLY IMPOSED REQUIREMENTS GOVERNING SHARE ISSUES
a) 60% rule
The Fonds may make development capital investments in any business enterprise with or without security. However, in
any given financial year, the proportion of unsecured development capital investments made in qualified business
enterprises must represent an average of at least 60% of the Fonds’ average net assets of the previous financial year.
If the Fonds fails to reach this percentage, the share issues giving rise to tax credits for the following financial year are
limited to a prescribed percentage of the total value of shares in the preceding financial year, except for shares acquired
through payroll deductions and employer contributions stipulated in agreements concluded at the end of the preceding
financial year.
The percentage of average qualified development capital investments to the average net assets of the preceding year
was 65.1% as at May 31, 2014 (May 31, 2013: 66.0%).
Since the minimum percentage prescribed by the 60% rule has been reached as at May 31, 2014, the 60% rule does not
limit share issues for the 2014-2015 financial year.

NOTES TO FINANCIAL STATEMENTS
FONDS DE SOLIDARITÉ DES TRAVAILLEURS DU QUÉBEC (F.T.Q.) 33
19. CAPITAL DISCLOSURES (CONTINUED)
1. EXTERNALLY IMPOSED REQUIREMENTS GOVERNING SHARE ISSUES (CONTINUED)
b) Government of Québec budget
Further to the Government of Québec 2014-2015 budget tabled before the National Assembly on June 4, 2014, the
number of shares giving rise to labour-sponsored fund tax credits that the Fonds may issue during the financial year
ending May 31, 2015 is limited to an amount of $650 million.
2. EXTERNALLY IMPOSED REQUIREMENTS GOVERNING SHARE REDEMPTIONS
The Taxation Act (Québec) provides for the payment of a penalty by the Fonds when the total amount paid for purchases by
mutual agreement made during a financial year exceeds 2% of paid-up capital, with certain criteria for purchases by mutual
agreement being excluded from the calculation. Since this provision has been in effect, the Fonds has always complied with
this limit.
20. CONTINGENCIES
In the normal course of business, the Fonds is party to claims and litigations that could result in losses. A contingent loss is
recognized when it is likely and can be estimated. Management believes that the aggregate amount of contingent losses would
not have a material adverse effect on the Fonds’ financial position.
21. REVENUES
Interest totalling $8.8 million (November 30, 2013: $9.6 million) on the notes is presented as a deduction of interest in the
Statement of Comprehensive Income and capitalized under Notes.
22. TOTAL OPERATING EXPENSES
For the six-month periods ended
(in thousands $) November 30, 2014 November 30, 2013
Salaries and benefits 38,677 40,028
Advertising and information 8,139 7,124
Occupancy expenses and rent 5,006 4,990
Management fees 3,377 3,332
Professional fees 2,263 4,176
Stationery and office supplies 2,206 2,260
Travel and entertainment 1,368 1,572
Shareholder reporting costs 1,282 1,285
Custodial fees and trustee’s fees 427 476
Depreciation of property and equipment 2,007 1,966
Amortization of intangible assets 1,264 789
66,016 67,998
23. KEY MANAGEMENT PERSONNEL COMPENSATION
For the six-month periods ended
(in thousands $) November 30, 2014 November 30, 2013
Salaries and short-term benefits 1,221 1,227
Post-employment benefits 765 905
Directors’ remuneration and fees 698 376
2,684 2,508

NOTES TO FINANCIAL STATEMENTS
FONDS DE SOLIDARITÉ DES TRAVAILLEURS DU QUÉBEC (F.T.Q.) 34
24. INCOME TAXES
For purposes of the Income Tax Act (Canada), the Fonds is subject to the rules applicable to mutual fund corporations. As such,
the Fonds can receive a refund of the income taxes paid on its capital gains by redeeming its shares or by increasing its issued
and paid-up capital through a transfer from retained earnings. Since these income taxes are refundable and that, in
management’s opinion, the issued and paid-up share capital will be increased sufficiently to recover them, these income taxes
are not presented in the Statement of Comprehensive Income, but are presented under Refundable taxes on hand in the Balance
Sheet. The balance of these income taxes is nil (May 31, 2014: $2.2 million; June 1, 2013: $7.2 million).
The Fonds, as a private company under the Income Tax Act (Canada), can receive a refund of a portion of the income taxes paid
on its investment income through the refundable dividend tax on hand (RDTOH). The RDTOH is recoverable by increasing the
issued and paid-up share capital through a transfer from retained earnings. This tax of $17.4 million
(May 31, 2014: $29.2 million; June 1, 2013: $30.3 million) was entirely applied against income taxes payable following a transfer
approved by the Board of Directors during the period.
Under the Taxation Act (Québec), the Fonds is an open-ended investment company. As such, the Fonds can, in calculating its
Québec taxes, deduct taxable capital gains from its taxable income. Consequently, capital gains realized by the Fonds are not
subject to taxes in Québec.
Income taxes on income before income taxes are detailed as follows:
For the six-month periods ended
(in thousands $) November 30, 2014 November 30, 2013
Current 13,638 7,202
Deferred (2,238) (278)
11,400 6,924
The above income taxes are different from the amounts that would be obtained by applying the combined basic tax rate (Québec
and federal) to income before income taxes. The difference is explained as follows:
For the six-month periods ended
(in thousands $) November 30, 2014 November 30, 2013
Income before income taxes 365,029 411,994
Tax rate to which the Fonds is subject 46.6% 46.6%
Income taxes 170,104 191,989
Non-taxable dividends and distributions (22,940) (49,634)
Refundable dividend tax on hand (17,437) (14,049)
Realized and unrealized capital gains (losses)
Non-taxable portion and federal rate difference (68,474) (67,712)
Refundable federal tax (35,999) (35,611)
Québec tax deduction (15,324) (15,135)
Other items 1,470 (2,924)
11,400 6,924
Items giving rise to deferred income tax assets are as follows:
(in thousands $) November 30, 2014 May 31, 2014 June 1, 2013
Development capital investments (1,884) (2,846) (3,447)
Investment property (1,645) (1,650) (1,514)
Property and equipment and intangible assets (3,915) (3,925) (3,733)
Net defined benefit liability 10,292 8,329 8,538
Other 473 496 1,027
3,321 404 871

NOTES TO FINANCIAL STATEMENTS
FONDS DE SOLIDARITÉ DES TRAVAILLEURS DU QUÉBEC (F.T.Q.) 35
25. POST-EMPLOYMENT BENEFITS
On January 1, 2001, the Fonds implemented funded and unfunded defined benefit pension plans, which guarantee pension
benefits to most of its employees. Also, since July 1, 2003, the Fonds has had an optional personal insurance plan for retired
employees.
The defined benefit obligation of these plans, as measured by independent actuaries, and the fair value of plan assets are
determined as at November 30, 2014. The most recent actuarial valuation of the pension plans for funding and solvency purposes
was as at December 31, 2013 and the next valuation will take place by December 31, 2016.
1. DEFINED BENEFIT PENSION PLANS
The defined benefits from these pension plans are based on the number of years of service and the average annual salary,
which is the highest annualized average salary for 36 consecutive months of service. The Fonds is responsible for these plans.
The Fonds set up retirement committees to manage the plans, and these committees engaged independent investment
managers, actuaries and trustees to obtain professional services.
Changes in the defined benefit obligation and the fair value of plan assets during the period are as follows:
For the six-month periods ended
November 30, 2014 November 30, 2013
2013
(in thousands $)
Present value
of pension
obligation
Fair value of
plan assets
Net defined
benefit
liability
Present value
of pension
obligation
Fair value
of plan
assets
Net defined
benefit
liability
Balance at beginning of period (228,410) 187,378 (41,032)
(189,433) 147,207 (42,226)
Current service cost (6,509) (6,509) (6,150) (6,150)
Interest (4,921) (4,921) (4,190) (4,190)
Interest income 3,931 3,931 3,188 3,188
Impact on net income (11,430) 3,931 (7,499) (10,340) 3,188 (7,152)
Remeasurements
Return on plan assets, excluding
revenue 5,225 5,225 5,796 5,796
Loss arising from changes in
demographic assumptions
(9,252) (9,252)
Gain (loss) arising from changes
in financial assumptions (7,751) (7,751)
16,054 16,054
Experience loss (773) (773)
Impact on other comprehensive
income (8,524) 5,225 (3,299)
6,802 5,796 12,598
Fonds contributions 3,171 3,171
7,458 7,458
Employee contributions (2,527) 2,527 - (2,117) 2,117 -
Benefits paid 1,915 (1,915) - 836 (836) -
(612) 3,783 3,171 (1,281) 8,739 7,458
Balance at end of period (248,976) 200,317 (48,659) (194,252) 164,930 (29,322)
As at November 30, 2014, the weighted average duration of the defined benefit obligation is 17.7 years.
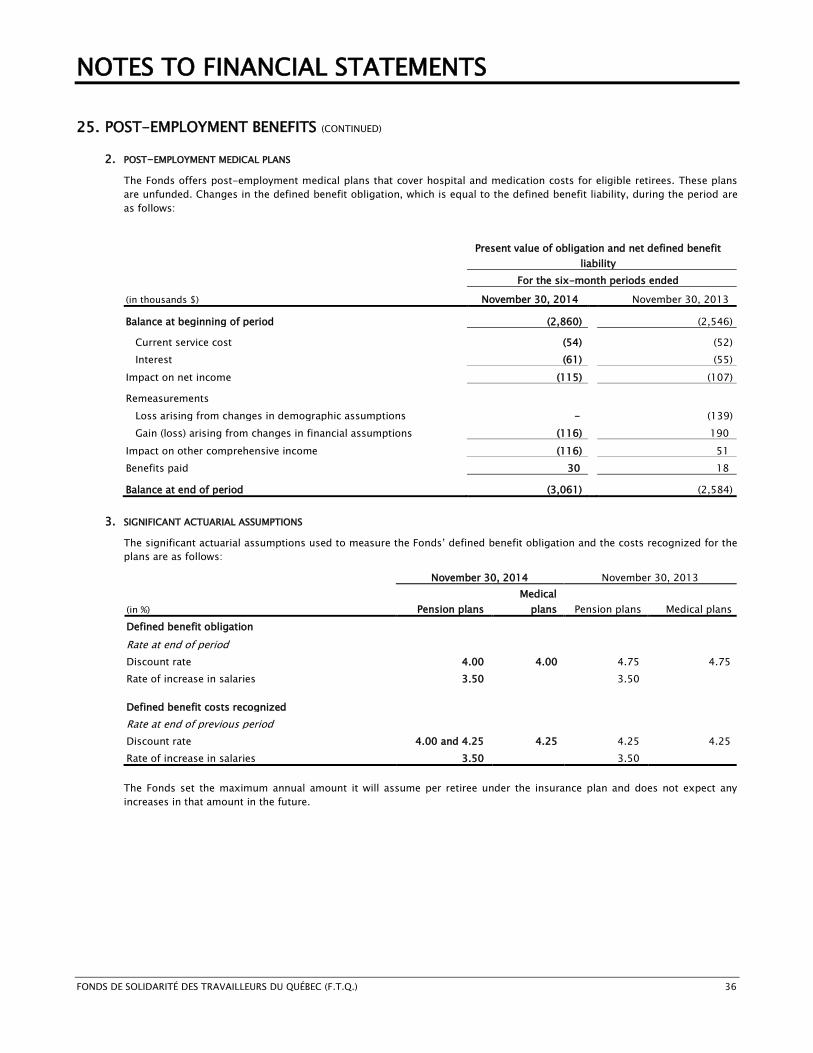
NOTES TO FINANCIAL STATEMENTS
FONDS DE SOLIDARITÉ DES TRAVAILLEURS DU QUÉBEC (F.T.Q.) 36
25. POST-EMPLOYMENT BENEFITS (CONTINUED)
2. POST-EMPLOYMENT MEDICAL PLANS
The Fonds offers post-employment medical plans that cover hospital and medication costs for eligible retirees. These plans
are unfunded. Changes in the defined benefit obligation, which is equal to the defined benefit liability, during the period are
as follows:
Present value of obligation and net defined benefit
liability
For the six-month periods ended
(in thousands $) November 30, 2014 November 30, 2013
Balance at beginning of period (2,860) (2,546)
Current service cost (54) (52)
Interest (61) (55)
Impact on net income (115) (107)
Remeasurements
Loss arising from changes in demographic assumptions - (139)
Gain (loss) arising from changes in financial assumptions (116) 190
Impact on other comprehensive income (116) 51
Benefits paid 30 18
Balance at end of period (3,061)
(2,584)
3. SIGNIFICANT ACTUARIAL ASSUMPTIONS
The significant actuarial assumptions used to measure the Fonds’ defined benefit obligation and the costs recognized for the
plans are as follows:
November 30, 2014 November 30, 2013
(in %) Pension plans
Medical
plans Pension plans Medical plans
Defined benefit obligation
Rate at end of period
Discount rate 4.00 4.00 4.75 4.75
Rate of increase in salaries 3.50 3.50
Defined benefit costs recognized
Rate at end of previous period
Discount rate 4.00 and 4.25 4.25 4.25 4.25
Rate of increase in salaries 3.50 3.50
The Fonds set the maximum annual amount it will assume per retiree under the insurance plan and does not expect any
increases in that amount in the future.
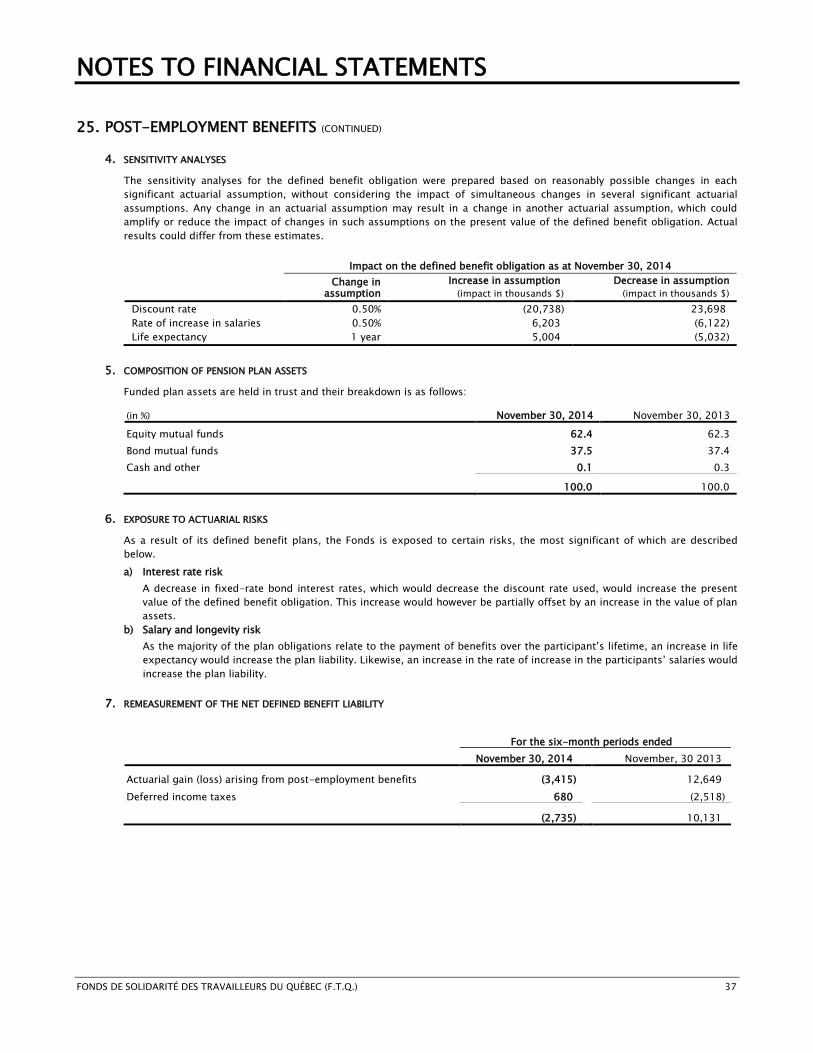
NOTES TO FINANCIAL STATEMENTS
FONDS DE SOLIDARITÉ DES TRAVAILLEURS DU QUÉBEC (F.T.Q.) 37
25. POST-EMPLOYMENT BENEFITS (CONTINUED)
4. SENSITIVITY ANALYSES
The sensitivity analyses for the defined benefit obligation were prepared based on reasonably possible changes in each
significant actuarial assumption, without considering the impact of simultaneous changes in several significant actuarial
assumptions. Any change in an actuarial assumption may result in a change in another actuarial assumption, which could
amplify or reduce the impact of changes in such assumptions on the present value of the defined benefit obligation. Actual
results could differ from these estimates.
Impact on the defined benefit obligation as at November 30, 2014
Change in assumption
Increase in assumption
(impact in thousands $)
Decrease in assumption
(impact in thousands $)
Discount rate 0.50% (20,738) 23,698
Rate of increase in salaries 0.50% 6,203 (6,122)
Life expectancy 1 year 5,004 (5,032)
5. COMPOSITION OF PENSION PLAN ASSETS
Funded plan assets are held in trust and their breakdown is as follows:
(in %) November 30, 2014 November 30, 2013
Equity mutual funds 62.4 62.3
Bond mutual funds 37.5 37.4
Cash and other 0.1 0.3
100.0 100.0
6. EXPOSURE TO ACTUARIAL RISKS
As a result of its defined benefit plans, the Fonds is exposed to certain risks, the most significant of which are described
below.
a) Interest rate risk
A decrease in fixed-rate bond interest rates, which would decrease the discount rate used, would increase the present
value of the defined benefit obligation. This increase would however be partially offset by an increase in the value of plan
assets.
b) Salary and longevity risk
As the majority of the plan obligations relate to the payment of benefits over the participant’s lifetime, an increase in life
expectancy would increase the plan liability. Likewise, an increase in the rate of increase in the participants’ salaries would
increase the plan liability.
7. REMEASUREMENT OF THE NET DEFINED BENEFIT LIABILITY
For the six-month periods ended
November 30, 2014 November, 30 2013
Actuarial gain (loss) arising from post-employment benefits (3,415) 12,649
Deferred income taxes 680 (2,518)
(2,735)
10,131

NOTES TO FINANCIAL STATEMENTS
FONDS DE SOLIDARITÉ DES TRAVAILLEURS DU QUÉBEC (F.T.Q.) 38
26. RELATED PARTY TRANSACTIONS
1. TRANSACTIONS WITH KEY MANAGEMENT PERSONNEL
The Fonds’ key management personnel comprises the members of the Board of Directors and the members of the
Management Committee. Information on key management personnel compensation for the period is presented in Note 23.
2. TRANSACTIONS WITH RELATED PARTIES INCLUDED IN DEVELOPMENT CAPITAL INVESTMENTS
In the normal course of business, the Fonds conducts transactions with related companies that it either controls or over which
it has significant influence. Many of the development capital investments are of such an amount and nature that the investee
is considered a related party. The number of investments in subsidiaries and associates is presented in Note 9. The following
table details the transactions carried out with all the subsidiaries and associates of the Fonds during the period and presents
the end-of-period balances appearing on the Balance Sheet.
For the six-month periods ended
(in thousands $) November 30, 2014 November 30, 2013
Transactions
Interest 11,019 12,833
Dividends and distributions 12,080 4,277
Rental income, fees and other income 1,365 80
Total operating expenses 3,122 3,150
Interest expense on notes 8,758 9,515
Issuance of notes 56,625 124,204
Repayment of notes 69,576 84,325
Disbursements for development capital investments 60,475 39,733
Capital repayments on development capital investments 30,299 73,228
Balances November 30, 2014 May 31, 2014
Development capital investments, at cost 2,445,423 2,401,628
Accounts receivable 10,050 16,325
Accounts payable 315 110
Notes 443,266 447,459
Other information
Funds committed but not disbursed 516,125 565,255
The Fonds engaged two of its associates to manage portfolios with assets totalling $631.2 million (May 31, 2014:
$600.7 million).
3. OTHER TRANSACTIONS
The Fonds, of which a majority of directors are elected by the Fédération des travailleurs et travailleuses du Québec (FTQ),
agreed to pay $1.4 million to the FTQ for the six-month periods ended November 30, 2014 (November 30, 2013:
$1.2 million) under an agreement that calls for compensation to be paid for services rendered in respect of economic training,
social audits, shareholder development, and support and guidance of certain activities. These transactions are measured at
the exchange amount, which is the amount of consideration established and agreed to by the related parties.
The Fonds incorporated the Fondation de la formation économique du Fonds de solidarité des travailleurs du Québec (F.T.Q.)
(the “Fondation”) under Part III of the Québec Companies Act and appoints the members of the Fondation’s Board of Directors.
The Fonds granted a loan of $5 million to the Fondation at a variable, contingent interest rate, with a fair value of $3.8 million
(May 31, 2014: $3.6 million; June 1, 2013: $3.8 million).
The Fonds granted non-interest bearing loans of $15 million (May 31, 2014: $15 million; June 1, 2013: $20 million) with a
fair value of $10.9 million (May 31, 2014: $10.6 million; June 1, 2013: $13.7 million) to the Fonds étudiant solidarité travail
du Québec (FESTQ), which are considered related to the Fonds because the Fonds appoints some of their directors together
with the Government of Québec.

NOTES TO FINANCIAL STATEMENTS
FONDS DE SOLIDARITÉ DES TRAVAILLEURS DU QUÉBEC (F.T.Q.) 39
26. RELATED PARTY TRANSACTIONS (CONTINUED)
3. OTHER TRANSACTIONS (CONTINUED)
The Fonds granted a non-interest bearing loan of $5 million (May 31, 2014: $5 million; June 1, 2013: N/A) with a fair value of
$3.3 million (May 31, 2014: $3.2 million; June 1, 2013: N/A) to Fiducie de Montréal inc., which is considered related to the
Fonds because the Fonds appoints some of its directors.
These loans are presented under Accounts receivable on the Balance Sheet.
27. ADDITIONAL INFORMATION
The audited Statement of Development Capital Investments, at Cost, the unaudited Relevé des autres investissements and the
unaudited Index of the Share of the Fonds in Investments Made by the Specialized Funds, at Cost are available at the Fonds’ head
office, on its website at fondsftq.com or at sedar.com.
28. TRANSITION TO IFRS
The financial statements for the six-month period ended November 30, 2014 are the first IFRS financial statements. They have
been prepared as described in Notes 2 and 3. To prepare these financial statements, the Fonds applied IFRS 1.
The date of adoption of IFRS by the Fonds is June 1, 2014. However, the date of transition is June 1, 2013, which is the beginning
of the first comparative year presented.
In preparing these first IFRS financial statements in accordance with IFRS 1, the Fonds elected to use some of the allowed
exemptions to the retrospective application of certain IFRSs while taking into account the exceptions to the retrospective
application of other IFRSs.
1. ELECTIONS AT TRANSITION
In accordance with IFRS 1 First-time Adoption of International Financial Reporting Standard, the Fonds used the following
exceptions to the full retrospective application of IFRS at the transition date:
Deemed cost of property and equipment
As permitted by IFRS 1, the Fonds elected to use the fair value of its buildings at the date of transition as their cost of
acquisition.
Designation of previously recognized financial instruments
IFRS 1 allows irrevocably designating any financial instrument as measured at fair value through profit or loss, provided
certain criteria are met at the date of transition. The Fonds thereby designated as at fair value through profit or loss all its
development capital investments, all its other investments, cash as well as certain accounts receivable and accounts payable.
2. RECONCILIATION – TRANSITION TO IFRS
Balance sheet and net assets reconciliation
(in thousands $) Note May 31, 2014 June 1, 2013
Net assets reported under Canadian GAAP - Part V 10,125,598 9,301,300
Development capital investments a 6,648 7,513
Other investments a 6,188 9,362
Post-employment benefits b (29,170) (28,691)
Investment property c 8,456 6,095
Property and equipment d 10,202 10,202
Accumulated depreciation – Property and equipment d 562 -
Deferred income taxes e 2,719 2,735
Net assets reported under IFRS 10,131,203 9,308,516
Net assets per share reported under Canadian GAAP - Part V $30.29 $27.98
Net assets per share reported under IFRS $30.31 $28.00

NOTES TO FINANCIAL STATEMENTS
FONDS DE SOLIDARITÉ DES TRAVAILLEURS DU QUÉBEC (F.T.Q.) 40
28. TRANSITION TO IFRS (CONTINUED)
2. RECONCILIATION – TRANSITION TO IFRS (CONTINUED)
Comprehensive income reconciliation
(in thousands $) Note Period ended November 30, 2013
Net income
Other
comprehensive
income Comprehensive income
Income reported under Canadian GAAP - Part V 410,991 - 410,991
Unrealized gains (losses) a (5,613) (5,613)
Post-employment benefits b (645) 12,649 12,004
Depreciation of property and equipment d 261 261
Income taxes e 76 (2,518) (2,442)
Income reported under IFRS 405,070 10,131 415,201
Income per share reported under Canadian GAAP - Part V $1.23 $1.23
Income per share reported under IFRS $1.22 $1.25
3. NOTES – TRANSITION TO IFRS
a) Development capital investments and other investments
Under Canadian GAAP – Part V, the Fonds determined the fair value of its development capital investments and other
investments in accordance with Section 3855, “Financial Instruments – Recognition and Measurement”, which required
using the bid price for long positions and the asking price for short positions to the extent such prices were available.
Under IFRS, the Fonds measures the fair value of its listed financial instruments in accordance with the guidance of IFRS
13 Fair Value Measurement and uses the price within the bid-ask spread that is most representative of fair value, given
the relevant facts and circumstances.
Consequently, on first-time adoption of IFRS, the carrying amount of the following financial instruments was adjusted:
(in thousands $) May 31, 2014 June 1, 2013
Development capital investments
Listed shares 5,964 6,332
Bonds 684 1,181
6,648 7,513
Other investments
Listed shares 3,809 3,488
Bonds 2,377 5,874
Money market instruments 2 -
6,188 9,362
This adjustment decreased the Fonds’ comprehensive income by $5.6 million, under Gains (Losses) unrealized, for the
six-month period ended November 30, 2013.

NOTES TO FINANCIAL STATEMENTS
FONDS DE SOLIDARITÉ DES TRAVAILLEURS DU QUÉBEC (F.T.Q.) 41
28. TRANSITION TO IFRS (CONTINUED)
3. NOTES – TRANSITION TO IFRS (CONTINUED)
b) Post-employment benefits
Under IFRS, actuarial gains and losses arising from the remeasurement of post-employment benefit obligations are
recognized in other comprehensive income when they occur. Under Canadian GAAP – Part V, the Fonds applied the
“corridor approach” to recognize such gains and losses, whereby gains and losses were gradually recognized in income
only when they exceeded specified thresholds.
In addition, under IFRS, the pension expense component reflecting interest income on plan assets is measured using the
discount rate for the obligation. Under Canadian GAAP – Part V, this component was measured using the expected rate of
return on assets.
Finally, under IFRS, the past service cost is recognized immediately in net income, whereas it was amortized over the
average remaining service period of active employees under Canadian GAAP – Part V.
The carrying amount of the net defined benefit liability corresponding to the post-employment benefit obligation was
increased by $28.7 million as at June 1, 2013 and $29.2 million as at May 31, 2014 as a result of recognizing the net
amount of unamortized actuarial gains and losses as at these dates. These adjustments decreased net income and
increased other comprehensive income by $-0.6 million and $12.6 million, respectively, for the six-month period ended
November 30, 2013.
c) Investment property
Under IFRS, the investment property is subject to the requirements of IAS 40 Investment Property with respect to
recognition, measurement and disclosures. According to this standard, investment property is property (land or a
building—or part of a building—or both) held to earn rentals or for capital appreciation or both. An entity that holds an
investment property must choose as its accounting policy either the fair value model or the cost model and apply it to its
investment property. Under Canadian GAAP – Part V, this property was classified as an item of property and equipment,
was recognized using the cost method and was depreciated.
As an entity meeting the definition of an investment entity, the Fonds must recognize its investment property at fair value,
with changes in fair value recognized in net income. Consequently, on first-time adoption of IFRS, the carrying amount of
the investment property was increased by $6.1 million as at June 1, 2013 and $8.5 million as at May 31, 2014 to reflect
fair value.
d) Property and equipment
i) Fair value measurement:
As previously mentioned, the Fonds elected to remeasure at fair value at the date of transition buildings included
in property and equipment, and thereby increased their value by $10.2 million as at June 1, 2013.
ii) Depreciation:
Under Canadian GAAP – Part V, all buildings were items of property and equipment, were recognized at cost and
depreciated. Under IFRS, a portion of the buildings was recognized as investment property. The depreciation on
the remaining balance of property and equipment is therefore decreased based on the portion that remained in
property and equipment. In addition, under IFRS, buildings are divided into their significant parts, which are
depreciated over their specific lives. These adjustments decreased depreciation expense by $0.3 million for the
six-month period ended November 30, 2013 and decreased accumulated depreciation by $0.6 million as at
May 31, 2014.

NOTES TO FINANCIAL STATEMENTS
FONDS DE SOLIDARITÉ DES TRAVAILLEURS DU QUÉBEC (F.T.Q.) 42
28. TRANSITION TO IFRS (CONTINUED)
3. NOTES – TRANSITION TO IFRS (CONTINUED)
e) Income taxes
Income taxes were adjusted to reflect the following items:
(in thousands $) May 31, 2014 June 1, 2013
Post-employment benefits 5,805 5,709
Investment property (944) (944)
Property and equipment (2,030) (2,030)
Depreciation of property and equipment (112) -
Total adjustment to deferred income taxes reported under IFRS 2,719 2,735
(in thousands $) Period ended November 30, 2013
Net income
Other
comprehen-
sive income
Compre-
hensive
income
Post-employment benefits 128 (2,518) (2,390)
Reversal of depreciation expense recognized under Canadian GAAP
attributable to the investment property portion (70) (70)
Impact of the different depreciation expense under IFRS 18 18
Total adjustment to income taxes reported under IFRS 76 (2,518) (2,442)
f) Reclassification adjustments
In addition to the above-mentioned measurement adjustments, the Fonds reclassified certain amounts at the date of
transition to ensure that its financial statements were presented in accordance with IFRS. The main reclassifications were
the following:
In accordance with IAS 1 Presentation of Financial Statements, the Fonds reclassified the gains (losses) on
development capital investments and other investments to revenues in the Statement of Comprehensive Income.
Under IFRS, the Fonds considers itself exempted from income tax related to capital gains and, accordingly, does not
recognize any deferred tax liabilities for unrealized net gains on development capital investments, other
investments and investment property nor any corresponding deferred tax assets for unrealized recoveries resulting
from the tax mechanisms related to refundable capital gains tax on hand. Amounts that the Fonds is entitled to
receive under the refundable tax on hand rules are presented separately on the Balance Sheet.
The Fonds reclassified distributions in net income under Dividends and distributions; they were previously
presented under Realized and unrealized gains (losses).
g) Adjustments to the Statement of Cash Flows
Acquisition of investments and proceeds of disposal of investments were reclassified from investing activities to operating
activities to reflect the nature of the Fonds’ operations and the fact that it qualifies as an investment entity.

FOR THE SIX-MONTH PERIOD ENDED NOVEMBER 30, 2014
INTERIM MANAGEMENT
DISCUSSION AND ANALYSIS

FONDS DE SOLIDARITÉ DES TRAVAILLEURS DU QUÉBEC (F.T.Q.)
INTERIM MANAGEMENT DISCUSSION AND ANALYSIS FOR THE SIX-MONTH PERIOD ENDED NOVEMBER 30, 2014
This interim Management Discussion and Analysis (“MD&A”) is intended to help the readers assess, through the eyes of management, the Fonds de solidarité FTQ’s (the “Fonds”) results and financial condition and the material changes therein during the six-month period ended November 30, 2014. The interim MD&A complements and supplements the financial statements as at November 30, 2014 and contains financial highlights, but does not contain the financial statements of the Fonds. To facilitate the understanding of events and uncertainties presented herein, this interim MD&A should be read together with the financial statements and the notes thereto.
The financial information presented in this interim MD&A has been prepared in accordance with International Financial Reporting Standards (“IFRS”). The Fonds adopted this accounting framework for the year beginning June 1, 2014, as required by Canadian securities laws and the Accounting Standards Board of Canada. Previously, the Fonds prepared its financial statements in accordance with Canadian generally accepted accounting principles as defined in Part V of the CPA Canada Handbook – Accounting (“Part V”).
The financial information presented in this interim MD&A has been restated to reflect the adoption of IFRS as at June 1, 2013, the date of transition, in a manner consistent with the financial statements. The financial information for periods prior to June 1, 2013 has not been restated and has been prepared in accordance with Part V. Note 28 to the financial statements discloses the impact of the transition to IFRS on the financial position, financial performance and cash flows reported by the Fonds. It also presents the nature and impact of the significant changes in accounting policies from the accounting policies used to prepare the financial statements of the Fonds in accordance with Part V for the period ended November 30, 2013.
This MD&A contains forward-looking statements about the Fonds’ activities, results, and strategies that should be interpreted with caution. These forecasts necessarily involve assumptions, uncertainties and risks; it is therefore possible that a number of factors may cause them not to materialize. Legislative or regulatory changes, economic and business conditions and the level of competition are some examples of major factors that may influence, sometimes significantly, the accuracy of the forward-looking statements in this MD&A. This MD&A is dated December 23, 2014.
The Fonds is subject to the Regulation Respecting Development Capital Investment Fund Continuous Disclosure (the “Regulation”) and, as such, applies the requirements of this Regulation, notably to its financial statements and its MD&A. The Regulation was updated to reflect the transition to IFRS.
You can get a copy of the financial statements as at November 30, 2014 by visiting our website (fondsftq.com) or the SEDAR website (sedar.com), or at your request, and at no cost, by calling us at 514-383-3663 or toll free at 1-800-567-3663, or by writing to us at 8717, Berri Street, Montréal, Québec H2M 2T9. You can also get a copy of the annual documents in this same manner.
1

FONDS DE SOLIDARITÉ DES TRAVAILLEURS DU QUÉBEC (F.T.Q.)
FINANCIAL HIGHLIGHTS
The following tables show selected key financial information about the Fonds and are intended to help you understand the Fonds’ financial performance for the past five financial years and the six-month period ended November 30, 2014. This information is derived from the Fonds’ audited financial statements. Financial data for the six-month period ended November 30, 2014 are in accordance with IFRS. Financial data for the financial year ended May 31, 2014 have been restated to conform to IFRS for purposes of comparison with the data for the current year. The impact of this accounting restatement on the value of the shares for presentation purposes means that applying IFRS, if they had been effective at that time, would have had an impact of $0.02 on the value of the Fonds’ shares. In addition, for the financial year ended May 31, 2014, certain revenues that were previously presented as a reduction of expenses were reclassified to revenues. Financial data for the years that began prior to June 1, 2013 are in accordance with Part V. The Fonds’ results are discussed under “Results of operations” on page 5.
RATIOS AND SUPPLEMENTAL DATA Six-month period or years ended
(in millions of dollars, unless otherwise specified)
November 30, 2014
(IFRS) (six-month
period)
May 31, 2014
(IFRS)
May 31, 2013
(Part V)
May 31, 2012
(Part V)
May 31, 2011
(Part V)
May 31, 2010
(Part V)
Revenuesa 431 937 256 247 256 222 Net incomeb 354 769 458 215 650 600 Net assets 10,484 10,131 9,301 8,525 8,178 7,294
Class A shares outstanding (number, in thousands) 334,346 334,234 332,441 320,629 315,504 305,951 Total operating expense ratioc (%) 0.63 1.51 1.44 1.46 1.47 1.54 Portfolio turnover rated: Development capital investments (%) Other investments (%)
2.42
65.32
7.14
167.36
8.44
115.57
12.09
158.61
11.38
172.57
7.93
233.20 Trading expense ratioe (%) 0.01 0.02 0.02 0.02 0.02 0.03 Number of shareholders (number) 613,958f 613,958 615,664 594,287 583,235 577,511 Issues of shares 257 787 855 767 698 660 Redemptions of shares 264 729 542 620 465 341 Fair value of development capital investmentsg 6,644 6,415 6,144 5,757 5,207 4,784
a For the six-month period ended November 30, 2014 and the financial year ended May 31, 2014, revenues include realized and unrealized gains and losses, distributions, rental income, fees and other income, which is not the case for the financial year ended May 31, 2013 and the prior years.
b Net income corresponds to revenues less total operating expenses and income taxes. To arrive at comprehensive income, the remeasurement of the net defined benefit liability is deducted from (or added to) net income.
c The total operating expense ratio is obtained as follows: for a six-month period, by dividing total operating expenses in net income for the six-month period by the net assets attributable to security holders of the Fonds at the end of that six-month period; for a year, by dividing total operating expenses in net income for the year by the average net assets attributable to security holders of the Fonds for that year. The total operating expense ratio for the six-month period ended November 30, 2014 is presented on a non-annualized basis.
d The portfolio turnover rate reflects the number of changes made to the composition of the portfolio. A portfolio turnover rate of 100% means, for example, that the Fonds purchased and sold all the securities in its portfolio once during the financial year. There is not necessarily a relationship between a high turnover rate and the portfolio’s performance. The portfolio turnover rate for the six-month period ended November 30, 2014 is presented on a non-annualized basis.
e The trading expense ratio represents transaction costs expressed, for the six-month period, as an annualized percentage of net assets at the end of the six-month period and, for the year, as a percentage of average net assets.
f As at May 31, 2014. g These investments include funds committed but not disbursed as well as guarantees and suretyships.
2

FONDS DE SOLIDARITÉ DES TRAVAILLEURS DU QUÉBEC (F.T.Q.)
CHANGE IN NET ASSETS PER SHARE Six-month period or years ended (in dollars)
November 30,
2014 (IFRS)
(six-month period)
May 31,
2014 (IFRS)
May 31,
2013 (Part V)
May 31,
2012 (Part V)
May 31,
2011 (Part V)
May 31,
2010 (Part V)
Net assets per share, beginning of six-month period/yeara
30.31 27.98 26.59
25.92 23.84 21.78
Impact of the transition to IFRS - 0.02 - - - -
Net assets per share, beginning of six-month period/year after impact of the transition to IFRSa 30.31 28.00 26.59
25.92 23.84 21.78
Increase from operationsb: 1.06 2.32 1.41 0.68 2.10 2.01
Interest, dividends and distributions and rental income, fees and other incomec 0.46
1.06 0.79 0.78
0.82 0.74
Realized gains 0.23 0.56 0.30 0.16 0.26 0.22
Unrealized gains 0.60 1.21 0.77 0.22 1.48 1.51
Total operating expensesd (0.20) (0.45) (0.40) (0.39) (0.38) (0.37)
Income tax and capital tax (0.03) (0.06) (0.05) (0.09) (0.08) (0.09)
Decrease from other comprehensive income (0.01) - - - - -
Variance from issues and redemptions of shares - (0.01) (0.02) (0.01) (0.02) (0.02)
Variance from the transfer of Class G shares - - - - - 0.07
Net assets per share, end of six-month period/yeara
31.36
30.31 27.98 26.59 25.92
23.84
a The amount of net assets per share is based on the actual number of shares outstanding at the relevant time. b The increase from operations is based on the weighted-average number of shares outstanding during the relevant six-month period or financial year. c For the six-month period ended November 30, 2014 and the financial year ended May 31, 2014, this item includes distributions as well as rental income, fees
and other income. d For the year ended May 31, 2013 and the prior years, distributions as well as rental income, fees and other income were presented as a reduction of total
operating expenses.
ECONOMIC CONDITIONS AND OUTLOOK World and the United States Over the last few months, the downward trend in prices for commodities such as copper, gold and especially oil, geopolitical crises around the world, particularly persistent conflicts in Ukraine and the Middle East, and more recently, the Ebola epidemic in West Africa have all contributed, in one way or another, to casting a shadow over the global economic outlook. The economic conditions in many emerging countries, particularly in Latin America, also continues to be a source of concern, due to the major depreciation of their currency, high inflation or significant capital flight, among other factors. The situation has many economists worried that in the coming quarters these countries will lose their ability to continue playing the role of economic engine that they have played in the global economy in recent years.
In the Eurozone, the situation is not much better. In the last few months, economic growth has been very weak: among other things, German real GDP contracted, which was a hard pill to swallow, as this country had always been the pillar of the zone’s economy for the previous quarters. Facing persistent economic weakness in the Eurozone, the European Central Bank has taken action in recent months by implementing new monetary easing measures. Despite this, in the current conditions, most economic indicators seem to suggest that the Eurozone economy will continue to have tepid growth in the coming quarters.
3

FONDS DE SOLIDARITÉ DES TRAVAILLEURS DU QUÉBEC (F.T.Q.)
All this uncertainty surrounding the global economic outlook can be felt on the stock markets: the latter were highly volatile in the last few months and, despite that, many stock indexes reached new highs.
After recording a decrease in GDP in the first quarter of 2014, in particular due to poor weather conditions during the winter, the U.S. economy rebounded in the second quarter. This recovery is explained notably by sustained growth in real consumption, particularly in durable goods, faster growth in business investment and a greater change in inventory. U.S. GDP continued to grow in the third quarter, but at a slower pace than in the previous quarter. Despite some apprehensions regarding the ability of the U.S. economy to continue to firm up in the coming quarters, economists generally seem relatively optimistic that it will do just that. Several economic indicators such as manufacturing and non-manufacturing indexes also seem to point to sustained economic growth for the coming quarters. Recent gains in the labour market (monthly average of 258,000 net hires for the last six months) drove down the unemployment rate, which was 5.8% in November 2014, compared to 6.3% in May 2014.
In the U.S. real estate sector, existing home sales grew somewhat after a temporary downturn during the winter of 2014, while new home sales and housing starts remained fairly weak during the same period. Many specialists in this sector believe that the situation should improve in the coming year. Furthermore, last spring, several economists expected inflation to rise in the United States, but inflation has actually stayed relatively low and stable for the last six months, and in all likelihood, the situation should not change much in the coming year. In addition, given that the unemployment rate fell below 6% and the bond purchase program has ended, economists expect that, as long as economic growth continues and inflation remains weak, the Fed will be in a position to order the first increase in the key interest rate toward the middle of 2015. It is important to remember that this rate has remained unchanged at 0.25% since December 2008.
Canada and Québec After a rough start to the year, the Canadian economy recovered in the second quarter of 2014 and continued to grow in the third quarter, albeit at a slower pace. However, it is important to point out that this economic growth was very asymmetrical, as the Western provinces posted higher growth than Ontario, Québec and the Atlantic provinces. The recovery of the U.S. economy, which started in spring 2014, explains some of the robustness of the Canadian economy over the recent months. More specifically, starting in the second quarter of 2014, Canada saw an increase in consumer and business spending as well as a steep increase in the volume of exports. This growth in the volume of exports stems from the positive contribution of many sectors, including automobiles and parts, which did particularly well. Despite this good news, many economists wonder if the Canadian economy will have the capacity to maintain this pace of growth in the coming quarters, particularly on the exports front, given the concerns about the capacity of the U.S. economy to continue to firm up, the decline in oil prices and the difficulties seen in Europe and several emerging countries.
Overall, in the last six months, the Canadian unemployment rate inched down from 7.0% in May 2014 to 6.6% in November 2014. Many economists believe that it should continue to fall in the coming quarters as long as the Canadian economy continues to grow. In general, inflation has remained weak in Canada in recent months. The annual variation in the Canadian CPI has been 2.2% on average since May 2014. In the opinion of many experts, inflation should edge up slightly in 2015.
The Canadian real estate market showed strong resilience in the last six months. After slowing at the beginning of the year, home sales started to go up in spring 2014. According to many economists, they should gradually slow over the coming quarters mainly due to the anticipated intensification of tensions related to accessibility. Lastly, to the extent that the economic recovery continues across the country in the coming quarters, the Bank of Canada may be prompted to modify its monetary policy, particularly by raising the discount rate (which has been at 1% since September 2010). Many economists believe that such an increase will likely not happen before fall 2015.
During the last six months, short-term (2 years) and long-term (10 years) Canadian government bond rates posted a slight decrease. During the same period, investment-grade corporation credit spreads trended up while provincial credit spreads remained relatively stable. The Canadian dollar traded at $US0.88 on November 30, 2014, compared with $US0.92 on May 31, 2014. In light of current conditions, we forecast that the Canadian dollar will fluctuate between $US0.85 and $US0.91, and that interest rates on Canadian 10-year and 30-year bonds should vary in a range not exceeding plus or minus 50 basis points.
4

FONDS DE SOLIDARITÉ DES TRAVAILLEURS DU QUÉBEC (F.T.Q.)
In Québec, despite a sharp improvement in exports, economic growth remained weak during the last six months, notably due to the weakness in household consumption and business investment. The unemployment rate was 7.6% in November 2014, down from 8.0% in May 2014; this rate is higher than for Canada (6.6%) and for Ontario (7.0%). According to many economists, economic growth in Québec should remain weak in the coming months, especially given the current fiscal austerity context. The Fonds will therefore definitely continue to play an important role in contributing to creating and maintaining jobs in Québec and by working with Québec companies that have the will and the desire to expand abroad while generating economic spinoffs for Québec.
Despite the positive signs suggesting an economic recovery built on a stronger foundation that seem to be appearing on the horizon in North America, economic and financial issues still abound elsewhere in the world, particularly in Europe and emerging countries. Put another way, the road to greater stability on a global scale is still littered with obstacles of all kinds. This situation is giving rise to many economic uncertainties that should continue to impact the performance of many financial institutions, including the Fonds.
MANAGEMENT DISCUSSION OF FINANCIAL PERFORMANCE RESULTS OF OPERATIONS
RESULTS FOR THE FONDS For the six-month period, the Fonds posted comprehensive income of $351 million, compared to $415 million for the corresponding period of the prior year. The Fonds’ return was 3.5% for the six-month period, compared to the return of 4.4% posted for the same period a year ago. The value of the Fonds’ shares increased by $1.07 compared to the value in effect since July 4, 2014 to stand at $31.36 as at January 5, 2015. The Fonds’ net assets amounted to $10.5 billion as at November 30, 2014 compared to $10.1 billion as at May 31, 2014. For the last 12 months (from December 1, 2013 to November 30, 2014), the Fonds generated a return of 7.4%, the same as for the corresponding period in 2012-2013.
As a result of its mission, a significant portion of the Fonds’ portfolio is comprised of private securities and specialized funds. Consequently, the Fonds did not benefit from the full effect of the increase in global stock markets that occurred during the last few months. In general, the Fonds’ asset allocation tends to limit its return potential in a bull market, while the opposite occurs in a bear market.
FONDS RETURN Six-month periods ended November 30
2014
(IFRS) 2013
(IFRS) Assets under
management at end of period*
$M
Weight %
Return %
Assets under management at
end of period* $M
Weight %
Return %
Development capital investments 5,201 49.5 3.5 4,998 51.4 6.6 Other investments** 5,308 50.5 4.8 4,725 48.6 3.4 10,509 100.0 4.2 9,723 100.0 5.1 Other income 0.1 0.0 Total operating expenses (0.6) (0.7) Income tax (0.1) (0.1) Fonds return (six-month period) 3.5 4.4
Fonds return (last 12 months) 7.4 7.4 * Assets under management at end of period refer to the fair value, at the end of the six-month period, of the assets managed by the Investments and Other
Investments sectors and used to generate revenues presented in the Statement of Comprehensive Income. This amount differs from the amount of assets presented in the financial statements, which includes, unlike assets under management, notes from the liquidity surpluses of regional and local funds and certain specialized funds, among other things.
** Other investments represent the remaining assets not invested in partner companies. Managed by the Other Investments sector, they consist of the following portfolios: cash and money market, bonds, shares, international infrastructure funds, high-income securities and absolute return strategies.
5

FONDS DE SOLIDARITÉ DES TRAVAILLEURS DU QUÉBEC (F.T.Q.)
SECTOR RESULTS
Investments sector The assets managed by the Investments sector are essentially mission-driven development capital investments made by the Fonds in public and private companies in the form of shares, units or loans. To stabilize its return, the Fonds favours a fair balance between investments in the form of loans—that are usually unsecured and provide a current return through interest payments—, investments in shares—that potentially generate a higher return but involve an increased level of volatility—, and investments in specialized fund units—that allow the Fonds to better diversify its portfolio while bringing private and foreign capital inflows to Québec. Development capital investments are governed by the Fonds’ Investment Policy, which is an important component of its Integrated Financial Assets Management Policy.
The Investments sector earned a gross return of 3.5% for the six-month period, compared to the gross return of 6.6% generated for the corresponding period in 2013. Taking into account this return and given the level of mission-driven investments made by the Fonds, the assets in this sector represented $5.2 billion at the end of the six-month period or 49.5% of assets under management as at November 30, 2014 (51.4% as at November 30, 2013).
The performance of the Investments sector is influenced by various factors, particularly the behaviour of the financial markets as well as the economic and business conditions in which our partner companies operate, and by the dynamic management of our investments. The gross return of 3.5% of the Investments sector for the most recently ended six-month period is largely explained by the following:
• the return of 3.4% generated by our private securities and specialized funds portfolio during the six-month period (compared to 3.0% for the corresponding period in 2013). Overall, this performance is attributable to the general strength of the portfolio, which produced interest and dividend revenues and, in addition, generated an increase in value during the six-month period in a low economic growth environment in Québec. The depreciation of the Canadian dollar over the last six months is a factor that contributed positively to this increase in value;
• the return of 4.0% generated by our portfolio of listed securities during the six-month period. This return was earned in an environment in which the Canadian stock markets were very volatile and, in general, did not perform as well as in the corresponding period of the prior year, when conditions were much more favourable, which enabled our portfolio to generate a return of 23.2%.
Other Investments sector The Other Investments sector manages the Fonds’ assets that are not invested in partner companies. Other investments consist of the following portfolios: cash and money market, bonds, shares, international infrastructure funds, high-income securities and absolute return strategies. Other investments are managed in accordance with the Other Investments Portfolio Policy, which is an integral part of the Integrated Financial Assets Management Policy. The Other Investments Portfolio Policy is designed to optimize the return/risk ratio of the Fonds, diversify the development capital investments portfolio and ensure that the Fonds has a liquidity level that is sufficient to meet all its obligations.
The changes to portfolios initiated during the year ended May 31, 2014 as part of the revision of the Other Investments Portfolio Policy (in particular reducing the target bond allocation to increase the target equity allocation, adopting an active management approach for Canadian equities and adding low-volatility and high-dividend shares to optimize the Fonds’ return/risk ratio) were completed on June 30, 2014.
For the six-month period, the Other Investments sector earned a gross return of 4.8%, up from the gross return of 3.4% recorded for the corresponding period in 2013. The assets of this sector represented $5.3 billion, or 50.5% of the Fonds’ assets under management as at November 30, 2014 (48.6% as at November 30, 2013).
The evolution of interest rates and the performance of the stock markets are the determining factors in analyzing the performance of the Other Investments sector. Accordingly, the results achieved by this sector are influenced by the behaviour of the financial markets and the conditions affecting the economic environment. The gross return of 4.8% of the Other Investments sector for the year is largely explained by the following:
• the good performance of foreign stock markets which, combined with the depreciation of the Canadian dollar, led to a return of 6.2% for the shares and other securities1 portfolios. These portfolios had generated a return of 9.7% for the corresponding period of the prior year, when economic conditions were characterized by a widespread increase in stock markets;
• the positive return of 3.5% on our fixed-income portfolio for the six-month period, compared to the negative return of 1.0% for the corresponding period in 2013. This return is essentially explained by the interest income generated by the portfolio and the decrease in interest rates for Government of Canada securities, which increased the value of bond securities in the portfolio.
1 Other securities are comprised of the following portfolios: international infrastructure funds, high-income securities and absolute return strategies.
6

FONDS DE SOLIDARITÉ DES TRAVAILLEURS DU QUÉBEC (F.T.Q.)
RETURN BY ASSET CLASS Six-month periods ended November 30 2014
(IFRS) 2013
(IFRS) Assets under
management at end of period
$M
Weight %
Return %
Assets under management at
end of period $M
Weight %
Return %
Development capital investments Private securities and specialized funds 4,269 40.6 3.4 3,963 40.8 3.0 Listed securities 932 8.9 4.0 1,035 10.6 23.2
Other investments Fixed-income securities 2,587 24.6 3.5 2,742 28.2 (1.0) Shares and other securities 2,721 25.9 6.2 1,983 20.4 9.7
10,509 100.0 4.2 9,723 100.0 5.1
TOTAL OPERATING EXPENSES Total operating expenses consist mainly of expenses related to assets under management, shareholder services, subscription activities, economic training, systems and controls and their improvement, the process of investing in companies, personnel and all other resources the Fonds requires to achieve its mission and meet its objectives. Although it is essential that the Fonds has available resources to achieve its mission, it is also fundamental that it controls its expenses. Year after year, the Fonds was able to maintain its total operating expense ratio at a lower level than the management expense ratio of Canadian balanced funds2, which stands at approximately 1.2% on a six-month basis.
For the six-month period ended November 30, 2014, the ratio of total operating expenses to net assets attributable to security holders of the Fonds at the end of the six-month period (on a non-annualized basis), calculated using the method prescribed in the Regulation, was 0.6% (0.7% for the corresponding period of the previous year). Expressed in dollars, total operating expenses amounted to $66.0 million for the six-month period ended November 30, 2014, down $2.0 million compared to the corresponding period of the prior year.
ANALYSIS OF CASH FLOWS, BALANCE SHEET AND OFF-BALANCE SHEET ITEMS
Cash flows Cash flows from operating activities of the Fonds totalled $39 million for the six-month period, up from $13 million for the corresponding period in the prior year. Changes in these cash flows mainly resulted from our current operations.
Cash flows from financing activities were a negative total amount of $26 million for the six-month period, compared to a positive total amount of $20 million for the corresponding period in 2013. In addition, cash flows from investing activities of the Fonds represented a net cash outflow of $4 million for the six-month period, the same as for the corresponding period in 2013.
As at November 30, 2014, the Fonds had lines of credit of $80 million available for its working capital requirements. These lines of credit were not used during the six-month period, and their outstanding balance was nil as at November 30, 2014.
2 Source: Bloomberg (based on a sample of 168 Canadian retail balanced funds)
7

FONDS DE SOLIDARITÉ DES TRAVAILLEURS DU QUÉBEC (F.T.Q.)
Balance sheet and off-balance sheet items Balance sheet development capital investments increased from $5.4 billion as at May 31, 2014 to $5.6 billion as at November 30, 2014. This $190 million increase results mainly from our net disbursed investments of $70 million (disbursed investments of $210 million less disinvestments of $140 million) and the increase in value of development capital investments during the six-month period.
On a commitment basis, the Fonds made development capital investments of $240 million during the six-month period, compared to $69 million for the corresponding period of the previous year. Funds committed but not disbursed increased from $963 million as at May 31, 2014 to $1.0 billion as at November 30, 2014.
In addition, balance sheet other investments increased by $121 million during the six-month period to $5.2 billion as at November 30, 2014 ($5.1 billion as at May 31, 2014). This increase is mainly attributable to the increase in value of securities held in the portfolio as a result of the stock market appreciation.
The Fonds uses derivative financial instruments in particular to increase its revenues or reduce its financial risks, to safeguard the value of its assets, to facilitate the management of its portfolios, to modify its asset allocation and to enhance its returns within allocated risk limits.
MISSION OF THE FONDS, OBJECTIVES AND STRATEGIES As part of the 2014-2015 Québec budget tabled on June 4, 2014, the Government of Québec decided to set a limit on share issues by tax-advantaged funds for the 2014-2015 fiscal year. The limit for the Fonds will amount to $650 million in shares giving rise to labour-sponsored fund tax credits and will have no impact on its share return or its ability to redeem its shares. However, it will reduce both the ability of the Fonds to invest in Québec SMEs and, the ability of Quebec workers to save for retirement.
Except for the foregoing, there have been no material changes in the Fonds’ mission, objectives, strategies and business model since the issuance of the last annual MD&A.
PHASE-OUT OF THE FEDERAL TAX CREDIT
In the budget tabled on March 21, 2013, the Government of Canada announced its intention to phase out through 2017 the 15% tax credit it grants to labour-sponsored fund shareholders. Despite the representations and proposals made by the two Québec-based labour-sponsored funds (the Fonds and Fondaction CSN), the Government of Canada passed Bill C-4 in December 2013 without amending the measures set out in the March 2013 budget. More specifically, according to these measures, the federal income tax credit remains at 15% until the taxpayer’s 2014 tax year (therefore including any contributions made during the first 60 days of 2015 and applied to the 2014 tax year), and will then be phased out through 2017. The Québec tax credit of 15% remains in place. Consequently, for the taxpayer’s 2014 tax year, total credits will continue to be 30%. Despite this decision by the Government of Canada, the Fonds will continue to make representations and proposals to convince federal government to change its decision in future budgets.
It is important to highlight that the phase-out of the federal labour-sponsored fund tax credit will not affect the ability of the Fonds to seek a reasonable return, its ability to comply with the 60% rule or its ability to satisfy the eligible requests for redemption from its shareholders, as a significant part of its assets is liquid. In addition, it should be noted that the Fonds’ share value does not depend on the federal tax credit, on the size of the Fonds, on the annual subscriptions or on the redemption requests to the Fonds, but depends exclusively on the value of the Fonds’ assets, which are solid.
According to a KPMG-SECOR analysis, the Fonds’ business model will remain viable despite the feared decrease in subscription caused by this hidden tax hike. However, should subscriptions decrease, the Fonds will have to reduce its investments in Québec companies to maintain the equilibrium of its model. In addition, should subscriptions decrease while redemptions maintain their trend, the financial impact of the measure would be, for the Fonds, a potential decrease in its assets that would be gradual and slow. The Fonds’ assets will nevertheless continue to be very substantial, and their decrease will have no impact on the equilibrium of the model mentioned above, in particular the Fonds’ ability to redeem shares from its shareholders. The conclusions of the KPMG-SECOR analysis show the potential disruptive effect of the federal government’s decision on the financing of Québec job-creating companies.
Put another way, the federal government’s decision, which will represent a significant tax increase for Québec workers who save (annual increase of $418 for the average Fonds shareholder who invests $2,785 per year), could reduce subscriptions and, consequently, job-creating investments in the Québec economy.
8

FONDS DE SOLIDARITÉ DES TRAVAILLEURS DU QUÉBEC (F.T.Q.)
60% RULE The 60% rule set out in the Fonds’ Incorporation Act stipulates that the Fonds’ average unsecured investments in qualified business enterprises must represent at least 60% of its average net assets of the previous financial year. The Fonds may invest the remaining assets in other financial vehicles for asset diversification and sound management purposes. The calculation method for this rule is based on the value of the Fonds’ assets, which depends in part on interest rate fluctuations and on the performance of stock markets and the economy in general.
As at May 31, 2014, the value of average qualified investments3 amounted to $5.8 billion, or 65.1% of the average net assets of the previous financial year (compared to 66.0% as at May 31, 2013). Since the minimum percentage prescribed was reached as at May 31, 2014, the amount of share issues for the 2014-2015 year will not be limited by the 60% rule. However, as noted previously, as part of the 2014-2015 Québec budget tabled on June 4, 2014, the Government of Québec decided to limit share issues by tax-advantaged funds for the 2014-2015 fiscal year. This limit for the Fonds amounts to $650 million in shares giving rise to a tax benefit.
As at November 30, 2014 and May 31, 2014, the Fonds was also in compliance with all other limits and rules set out by its Incorporation Act. The Fonds expects to comply with all the limits and rules set out in its Incorporation Act over the next several years.
RECENT DEVELOPMENTS The Fonds adopted the IFRS for the year beginning June 1, 2014, as required by Canadian securities laws and the Accounting Standards Board of Canada. Note 28 to the financial statements at as November 30, 2014 discloses the impact of the transition to IFRS on the financial position, financial performance and cash flows reported by the Fonds. It also presents the nature and impact of the significant changes in accounting policies.
PAST PERFORMANCE This section presents the past performance of the Fonds. The past performance of the Fonds does not necessarily indicate how it will perform in the future.
YEAR-BY-YEAR RETURNS OF THE FONDS The following chart shows the Fonds’ annual performance and illustrates how the Fonds’ performance has changed from year to year for the last ten financial years ended May 31 and the six-month period ended November 30, 2014.
3 These investments include funds committed but not disbursed as well as guarantees and suretyships.
9

FONDS DE SOLIDARITÉ DES TRAVAILLEURS DU QUÉBEC (F.T.Q.)
The annual performance of the Fonds is calculated by dividing net income (net loss) per share for the financial year by net assets per share at the beginning of the financial year. Such performance sometimes differs from the annual compound return to the shareholder because the annual performance of the Fonds is calculated taking into account share issues and redemptions made during the year, which have a dilutive or accretive effect on net income (net loss) per share, as the case may be. The non-annualized performance for the six-month period ended November 30, 2014 is calculated by dividing net income per share for the six-month period by net assets per share at the beginning of the six-month period.
ANNUAL COMPOUND RETURNS TO THE SHAREHOLDER At the current value of $31.36 per share, a shareholder who has invested at the beginning of each of the periods indicated below earns the following annual compound returns:
The annual compound return to the shareholder is calculated by taking into account the annualized change in the value per share over the periods indicated. This return sometimes differs from the annual performance of the Fonds since, as explained above, it does not take into account the dilutive or accretive effect of share issues and redemptions made during the year.
Since the inception of the Fonds, the annual compound return to the shareholder has been 3.9%.
ANNUAL COMPOUND RETURNS TO THE SHAREHOLDER (INCLUDING TAX CREDITS)
Let’s take, for example, a shareholder who has invested an equal amount each year through payroll deduction. Including the Québec and federal labour-sponsored fund tax credits (each amounting to 15%) that this shareholder has received, at the current value of $31.36 per share, this shareholder earned an annual compound return of 16.1% and 11.5% for a 7-year and 10-year period, respectively. In addition to this return, the shareholder can receive additional tax benefits if he transfers his Fonds shares to an RRSP.
10

FONDS DE SOLIDARITÉ DES TRAVAILLEURS DU QUÉBEC (F.T.Q.)
SUMMARY OF INVESTMENT PORTFOLIO As at November 30, 2014, the Fonds’ assets under management were broken down between the following categories of the development capital investments and other investments portfolios:
Asset classes % of net assets
Development capital investments Private securities 30.2 Specialized funds 10.5 Listed securities 8.9 49.6
Other securities
Cash and money market 2.0 Bonds 22.7 Shares 25.0 High-dividend shares4 0.4 International infrastructure funds 0.5 50.6
The following table presents the issuers of the top 25 positions held by the Fonds as at November 30, 2014, of which 18 are part of the development capital investments portfolio and 7 are part of the other investments portfolio. When the Fonds holds more than one class of securities of an issuer, those classes are aggregated. However, with respect to other investments, debt and equity securities of an issuer are not aggregated.
Issuers % of net assets
Development capital investments (18 issuers)* 30.0 Other investments (7 issuers)**
13.7
43.7 * The 18 issuers representing, as a group, 30.0% of the Fonds’ net assets are (in alphabetical order):
** The 7 issuers representing, as a group, 13.7% of the Fonds’ net assets are:
Camoplast Solideal inc. Cogeco Câble inc. Corporation Financière L'Excellence ltée Entreprises québécoises publiques5 FinTaxi, s.e.c. Fonds immobilier de solidarité FTQ inc.5 Fonds immobilier de solidarité FTQ I, s.e.c.5 Fonds immobilier de solidarité FTQ II, s.e.c.5 Gestion TFI inc. La Coop fédérée Metro inc. Société de gestion d'actifs forestiers Solifor, société en commandite5
Société en commandite Groupe CH SSQ Financial Group6 TMX Group Limited Transcontinental inc. Trencap s.e.c. VC, société en commandite
Province of Ontario 4.6% Province of Québec 3.0% Government of Canada 2.3% Financement-Québec 1.5% Canada Housing Trust No 1 0.9% Hydro-Québec 0.8% Canadian Imperial Bank of Commerce 0.6%
This summary of investment portfolio may change due to the ongoing portfolio transactions of the Fonds.
4 High-dividend shares are included in the high-income securities portfolio. 5 Despite their relatively important weight in the overall portfolio of the Fonds, these issuers do not constitute a significant concentration risk given the large
number of investee. 6 Includes all of the Fonds’ investments in SSQ, Life Insurance Company Inc. and its subsidiary, SSQ General Insurance Company Inc. Includes also the Fonds’
investment in SSQ, Mutual Holding Inc.
11

FONDS DE SOLIDARITÉ DES TRAVAILLEURS DU QUÉBEC (F.T.Q.)
CONTRIBUTION TO QUÉBEC’S ECONOMIC DEVELOPMENT In keeping with its mission, the Fonds made investments over the six-month period that contributed to creating, maintaining or saving quality jobs in various sectors of the Québec economy. In the current economic conditions, the Fonds continues to play an active role in the development and growth of Québec companies. As such, during the six-month period, the Fonds invested $240 million, on a commitment basis, to support development projects in the Québec economy. Here are a few examples of the Fonds’ contribution to Québec’s economic development during the six-month period.
To support Maibec Inc. in a project aimed at broadening its market position and increasing its purchasing power, the Fonds reinvested $10 million in this company, which employs over 650 people in Québec. The Fonds invested close to $5 million in Rudsak Inc., an investment that will help it pursue expansion plans for its store network. This company already has over 300 employees in Québec. The Fonds also participated, for an amount of $20 million, in the project involving the combination of Osisko Gold Royalties Ltd. and Virginia Mines Inc. to create a new leading intermediate royalty company with two world-class gold royalty assets in Québec.
The Fonds also participated with the Caisse de dépôt et placement du Québec and Investissement Québec in recapitalizing the Fonds Anges Québec capital, s.e.c., (the Fonds contributed $15 million of the total $85 million) in order for entrepreneurs to have access to the capital they need for projects that required seed or start-up capital. To that end, Anges Québec works closely with a number of key Québec organizations interested in the development and growth of technological innovations. So far, Anges Québec members have invested and reinvested in over 50 promising businesses in the seed or start-up stage.
TRENDS AND OUTLOOKS TRENDS IN THE SAVINGS MARKET AND RRSP The debate on retirement plans, on which the D’Amours report (Innovating for a Sustainable Retirement System – Summary) is still the primary reference, continues in the current context of fiscal austerity in Québec and discussions on taxation and programs. In addition, the act respecting VRSPs (Voluntary Retirement Savings Plans) came into force on July 1, 2014, and its implementation will span a long period of time. This obviously reminds us of the importance of Quebecers personally taking responsibility for their savings.
A careful analysis of the behaviour of investors in Canada and Québec shows that they seem to have a more favourable perception of stock and financial markets in 2014 than they had the previous year. This boost in investor confidence in stock and financial markets across the country is largely explained by the very good returns the markets have provided in recent years. Despite everything, many investors point out that they still remember the financial crisis of 2008-2009 and that, although stock markets increased in recent years, they continue to be very conservative when it comes to selecting savings products; this conservatism is increased even further in today’s context of stock market volatility and uncertain global economic outlook for the coming quarters.
For the next RRSP campaign, the Fonds’ shares (which generated a return of 7.4% for the 12-month period ended November 30, 2014) will be part of the good choices of financial products available to Québec’s savers, given their low volatility and their advantageous return enhanced by the savings from the tax credit to which they give rise. The local representative (LR) network and the Fonds’ employees will continue their ongoing work of raising awareness on the importance of saving early in life and the advantages of systematic savings.
12

FONDS DE SOLIDARITÉ DES TRAVAILLEURS DU QUÉBEC (F.T.Q.)
FONDS OUTLOOK7 The phase-out of the federal income tax credit and the $650 million limit imposed by the Government of Québec on the Fonds’ issues of shares giving rise to labour-sponsored fund tax credits will not, strictly speaking, affect the overall strength of the Fonds’ assets, the share value, the return to shareholders or the ability of the Fonds to redeem shares, even in the long-term.
There have been no material changes to the other outlooks presented in our last annual MD&A.
RISK MANAGEMENT
Sound risk management practices are vital to the success of the Fonds. We manage our risk within a framework taking into account the nature of our activities and the risks we can reasonably assume considering the desired return/risk ratio and stakeholder expectations. To that end, we capitalize on a structured process to determine, measure and control the significant risks with which we must contend.
Notice to readers: The following paragraphs and the sections on market risk, credit and counterparty risk and liquidity risk form an integral part of the financial statements on which an unmodified opinion was expressed in an independent auditors’ report dated December 23, 2014.
The Fonds manages all its financial instruments in an integrated, comprehensive manner in accordance with the standards set out in the Integrated Financial Assets Management Policy. The Integrated Financial Assets Management Policy is complemented by the Investment Policy for the development capital investments managed by the Investments sector and by the Other Investments Portfolio Policy for the assets managed by the Other Investments sector. These policies, which were adopted by the Board of Directors, set goals, guidelines and several limits so that the Fonds’ management can ensure that the target return/risk profile is reached. The Fonds uses derivative financial instruments in particular to increase its revenues or reduce its financial risks, to safeguard the value of its assets, to facilitate the management of its portfolios, to modify its asset allocation and to enhance its returns within allocated risk limits.
During the six-month period ended November 30, 2014, the Fonds continued to implement its integrated risk management framework. This process, which was undertaken a few years ago, is essentially aimed at providing the Fonds’ management with an overall vision of all risks to ensure that they are managed in accordance with their degree of importance. The production of an integrated risk profile allowed prioritizing the key financial and non-financial risks to which the Fonds is exposed, before and after considering the effectiveness of the controls implemented to mitigate the Fonds’ exposure to these risks. A mitigation strategy was developed for some of these risks, and action plans were set up and deployed. In addition, the Fonds produces on a quarterly basis a risk scorecard. This scorecard, which is integrated into its corporate scorecard, allows management to monitor the evolution of risks with respect to its business objectives and strategies.
The integrated risk management approach was also designed to improve risk governance, monitoring and reporting. To that end, the Board of Directors of the Fonds adopted, in May 2012, the Integrated Risk Management Policy, a policy that sets out the Fonds’ requirements in that regard while specifying the responsibilities of the main stakeholders involved. This policy has been in effect since June 1, 2012.
In addition, as the Fonds chose to manage its risks using the principle of subsidiarity, the Fonds’ business sectors have started to review their procedures and processes to integrate the management of the risks identified in the Integrated Risk Management Policy into the management of their operations. The review of processes, which has already been completed in the Other Investments and Investments sectors, has continued in two other sectors (Shareholder Services and Information Technologies) during the six-month period.
In the normal course of business, the Fonds is exposed to various risks; the principal ones are presented hereafter.
7 The outlook presented in this MD&A reflects the Fonds’ expectations with respect to future events, based on information available to the Fonds as at December 23, 2014, and presupposes certain risks, uncertainties and assumptions. Many factors, several of which are beyond our control, may cause the Fonds' actual results, performance, or achievements to differ materially from explicit or implicit expected future results, performance, or achievements.
13
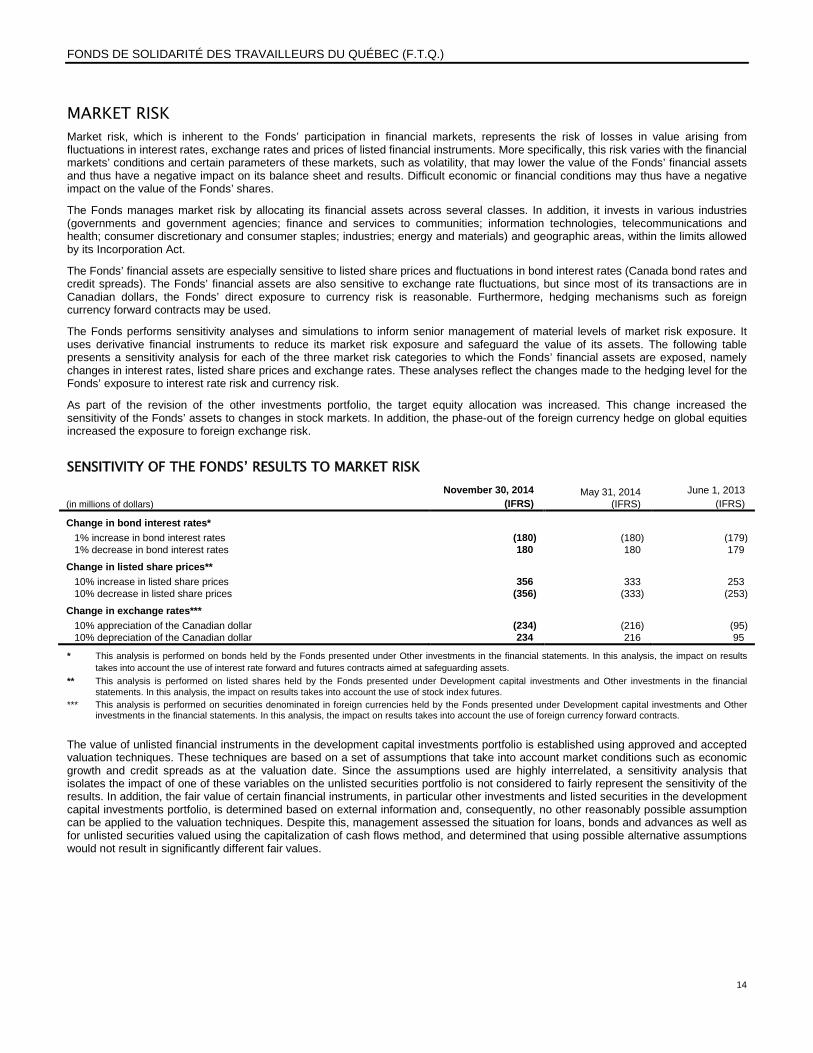
FONDS DE SOLIDARITÉ DES TRAVAILLEURS DU QUÉBEC (F.T.Q.)
MARKET RISK
Market risk, which is inherent to the Fonds’ participation in financial markets, represents the risk of losses in value arising from fluctuations in interest rates, exchange rates and prices of listed financial instruments. More specifically, this risk varies with the financial markets’ conditions and certain parameters of these markets, such as volatility, that may lower the value of the Fonds’ financial assets and thus have a negative impact on its balance sheet and results. Difficult economic or financial conditions may thus have a negative impact on the value of the Fonds’ shares.
The Fonds manages market risk by allocating its financial assets across several classes. In addition, it invests in various industries (governments and government agencies; finance and services to communities; information technologies, telecommunications and health; consumer discretionary and consumer staples; industries; energy and materials) and geographic areas, within the limits allowed by its Incorporation Act.
The Fonds’ financial assets are especially sensitive to listed share prices and fluctuations in bond interest rates (Canada bond rates and credit spreads). The Fonds’ financial assets are also sensitive to exchange rate fluctuations, but since most of its transactions are in Canadian dollars, the Fonds’ direct exposure to currency risk is reasonable. Furthermore, hedging mechanisms such as foreign currency forward contracts may be used.
The Fonds performs sensitivity analyses and simulations to inform senior management of material levels of market risk exposure. It uses derivative financial instruments to reduce its market risk exposure and safeguard the value of its assets. The following table presents a sensitivity analysis for each of the three market risk categories to which the Fonds’ financial assets are exposed, namely changes in interest rates, listed share prices and exchange rates. These analyses reflect the changes made to the hedging level for the Fonds’ exposure to interest rate risk and currency risk.
As part of the revision of the other investments portfolio, the target equity allocation was increased. This change increased the sensitivity of the Fonds’ assets to changes in stock markets. In addition, the phase-out of the foreign currency hedge on global equities increased the exposure to foreign exchange risk.
SENSITIVITY OF THE FONDS’ RESULTS TO MARKET RISK
(in millions of dollars) November 30, 2014
(IFRS) May 31, 2014
(IFRS) June 1, 2013
(IFRS)
Change in bond interest rates* 1% increase in bond interest rates (180) (180) (179) 1% decrease in bond interest rates 180 180 179
Change in listed share prices**
10% increase in listed share prices 356 333 253 10% decrease in listed share prices (356) (333) (253)
Change in exchange rates***
10% appreciation of the Canadian dollar (234) (216) (95) 10% depreciation of the Canadian dollar 234 216 95
* This analysis is performed on bonds held by the Fonds presented under Other investments in the financial statements. In this analysis, the impact on results takes into account the use of interest rate forward and futures contracts aimed at safeguarding assets.
** This analysis is performed on listed shares held by the Fonds presented under Development capital investments and Other investments in the financial statements. In this analysis, the impact on results takes into account the use of stock index futures.
*** This analysis is performed on securities denominated in foreign currencies held by the Fonds presented under Development capital investments and Other investments in the financial statements. In this analysis, the impact on results takes into account the use of foreign currency forward contracts.
The value of unlisted financial instruments in the development capital investments portfolio is established using approved and accepted valuation techniques. These techniques are based on a set of assumptions that take into account market conditions such as economic growth and credit spreads as at the valuation date. Since the assumptions used are highly interrelated, a sensitivity analysis that isolates the impact of one of these variables on the unlisted securities portfolio is not considered to fairly represent the sensitivity of the results. In addition, the fair value of certain financial instruments, in particular other investments and listed securities in the development capital investments portfolio, is determined based on external information and, consequently, no other reasonably possible assumption can be applied to the valuation techniques. Despite this, management assessed the situation for loans, bonds and advances as well as for unlisted securities valued using the capitalization of cash flows method, and determined that using possible alternative assumptions would not result in significantly different fair values.
14

FONDS DE SOLIDARITÉ DES TRAVAILLEURS DU QUÉBEC (F.T.Q.)
CREDIT AND COUNTERPARTY RISK The Fonds’ exposure to credit risk stems mainly from its mission-driven development capital investments, which are generally unsecured. Its other investment activities generally entail less of this risk since the counterparties concerned are typically more financially solid (governments, banks, etc.).
Credit risk is the potential for loss due to the failure of a partner company (financial instruments presented under Development capital investments), issuer or counterparty in a transaction (financial instruments presented under Other investments) to honour its contractual obligations or due to a degradation of its financial position. The Fonds manages this risk through several means, including a due diligence process to ensure that the credit risk level is acceptable.
The Fonds maintains a sound diversification of its assets through the Integrated Financial Assets Management Policy. Compliance with this policy therefore enables managing the concentration risk associated with the exposure to an issuer or group of issuers with common characteristics (industries, credit ratings, etc.).
EXPOSURE TO CREDIT AND COUNTERPARTY RISK (fair value as a percentage of net assets)
November 30, 2014 (IFRS)
May 31, 2014 (IFRS)
June 1, 2013 (IFRS)
Weight of the five largest investments (Development capital investments) 17.4* 17.1* 19.5* Weight of the five largest issuers or counterparties (Other investments) 12.3** 13.0** 14.2**
* The portion attributable to investments that do not constitute a significant concentration of credit risk given the large number of investees represented 9.1% as at November 30, 2014 (8.9% as at May 31, 2014 and 9.6% as at June 1, 2013).
** All of these securities are issued or guaranteed by the governments of Québec, Ontario and Canada.
The summary of investment portfolio presented previously also discloses relevant information on the credit and counterparty risk concentration level.
For the development capital investments portfolio, the Fonds approves on an annual basis targets by industries, in keeping with its internal structure. These targets are set using a risk allocation mechanism. It should be noted that the actual results may however differ from the industry targets determined based on the investment opportunities on the market. Based on an optimal risk level defined by the Fonds for this portfolio as a whole by taking into account its mission, the risk allocation mechanism facilitates a more effective monitoring and control of the portfolio profile and sector allocation by risk level. The return/risk balance of this portfolio is achieved through a sector-based risk allocation mechanism that takes into account the higher risk of our investments in certain sectors.
The Fonds regularly re-examines the status of its development capital investments to ensure that they are adequately classified in one of the following three categories: compliant with internal criteria, under watch or in turnaround. To deal with the more difficult situations, an internal committee closely monitors investments that entail greater credit risk.
CLASSIFICATION OF THE DEVELOPMENT CAPITAL INVESTMENTS PORTFOLIO
(fair value in millions of dollars) November 30, 2014
(IFRS) May 31, 2014
(IFRS) June 1, 2013
(IFRS)
Compliant with internal criteria 5,299 5,142 4,989 Under watch 309 285 293 In turnaround 26 17 24 5,634 5,444 5,306 For the other investments portfolio, issuer and counterparty ratings and compliance with exposure limits by borrower or counterparty contribute to the sound management of the credit and counterparty risk of the portfolio and to the diversification of assets. These criteria are set based on the risks specific to each asset class and reduce the risk that our results will be materially affected in the event of a payment default. As at November 30, 2014, the weighted average credit rating of bonds was AA-, as it was as at May 31, 2014 and as at June 1, 2013.
15

FONDS DE SOLIDARITÉ DES TRAVAILLEURS DU QUÉBEC (F.T.Q.)
CLASSIFICATION OF BONDS INCLUDED IN THE OTHER INVESTMENTS PORTFOLIO* (fair value in millions of dollars)
November 30, 2014 (IFRS)
May 31, 2014 (IFRS)
June 1, 2013 (IFRS)
AAA 423 459 445 AA 824 775 707 A 847 966 976 BBB 312 310 264 2,406 2,510 2,392
* Presented using the Standard and Poor’s rating scale.
LIQUIDITY RISK The Fonds must make disbursements on a daily basis—when it redeems shares held by shareholders, disburses amounts it committed to invest in partner companies, reimburses notes payable and pays expenses. It is worth noting that the Fonds is required to redeem shares only in the circumstances set out in its Incorporation Act, or to purchase them by agreement in exceptional situations provided under a policy adopted for such purpose by the Board of Directors and approved by the Minister of Finance of Québec.
The Fonds must be able to obtain the liquidity required to meet its commitments. Liquidity risk is therefore related to the potential for loss due to its inability to meet such commitments. In certain cases, securities acquired on the market can be subject to resale restrictions, thus potentially reducing their liquidity.
The Fonds’ Incorporation Act provides that part of the financial assets of the Fonds may be invested in marketable securities on organized markets, such as stock and bond markets, so it can easily obtain cash. The Fonds also has access to bank credit facilities for additional liquidities.
As at November 30, 2014, the ratio of liquid assets8 as a percentage of assets under management was 59.5% (59.2% as at May 31, 2014 and 53.8% as at June 1, 2013), demonstrating, in management’s opinion, that the Fonds has the required liquidity to fulfill all its obligations and commitments, even under potential scenarios that would be less favourable to it.
OPERATIONAL RISK Inherent to all the Fonds’ activities, operational risk is the risk of sustaining losses as a result of the inadequacy or failure of certain processes or systems in place or due to human factors or external events. This risk also includes legal risk and regulatory compliance risk. Since the issuance of the last annual MD&A, there have been no material changes in the level and management of operational risk.
OTHER RISKS The Fonds is also exposed to other risks, such as strategic and reputation risks, which could result in negative financial consequences. Since the issuance of the last annual MD&A, there have been no material changes in the management of these risks.
With respect to strategic risk, the phase-out of the tax credit announced by the federal government in its March 2013 budget, which will be effective as of January 1, 2015 (for the 2015 tax year, the total tax credit granted to taxpayers will decrease from 30% to 25%), will force the Fonds to adapt and review its short-, medium- and long-term development strategies by taking into account a potential reduction in subscriptions. As explained previously in this MD&A, the phase-out of the federal tax credit does not affect the equilibrium of the Fonds’ model (ability to redeem shares, to keep sufficient liquidities, to seek a reasonable return, to comply with the 60% rule, etc.), but it will force the Fonds to adapt its annual investment volumes to the subscription amounts it will collect year after year. Should subscriptions decrease while redemptions maintain their trend, the financial impact of the measure would be, for the Fonds, a potential decrease in its assets that would be gradual and slow. The Fonds’ assets will nevertheless continue to be very substantial, and their decrease will have no impact on the equilibrium of the model mentioned above, in particular the Fonds’ ability to redeem shares from its shareholders.
In addition, the limit that the Government of Québec decided to set on share issues by tax-advantaged funds for the 2014-2015 fiscal year (for the Fonds, this limit will amount to $650 million in shares giving rise to labour-sponsored fund tax credits) will reduce both the ability of the Fonds to invest in Québec SMEs and the ability of Quebec workers to save for retirement. However, this limit will have no impact on its share return or its ability to redeem its shares.
8 Liquid financial assets are comprised of fixed-income securities (cash, money market and bonds), listed shares of the other investments portfolio and certain listed shares of the development capital investments portfolio.
16

FONDS DE SOLIDARITÉ DES TRAVAILLEURS DU QUÉBEC (F.T.Q.) Reputation risk evolved favourably in the last few months, in particular as a result of the announcement of proposed changes to the Fonds’ governance, the arrival of Robert Parizeau as a director and his appointment as Chairman of the Board of Directors, the appointment of Gaétan Morin as new President and Chief Executive Officer and the good financial results generated by the Fonds.
GOVERNANCE On February 6, 2014, the Fonds announced an important governance reform project that includes the following proposals: 1. Presidency of the Board of Directors AND all the Board’s committees (including those authorizing regional and real estate fund investments)
reserved for a member independent from both the Fonds and the FTQ9. 2. Reconfiguration of the Board of Directors in particular to increase from 17 to 19 the number of directors, a majority of which must now be elected
each year by the shareholders. 3. Enshrinement of the rule adopted in 2009 requiring any investment to be approved by an Investment Board made up of a majority of members
independent from the Fonds and the FTQ9; since 2009, this rule has granted a veto to the independent members, including at the real estate funds. Furthermore, in order to increase the power of these Boards, the amount at which an investment must be submitted to the Board of Directors will be increased.
4. Creation of three new committees composed of a majority of members independent from the Fonds and the FTQ9, namely (i) Governance and
Ethics, (ii) Human Resources and (iii) Risk Management. 5. The duration of Board members terms will be limited to 12 years. After the announcement of this reform, several actions were taken by the Fonds to implement these changes. Robert Parizeau, who joined the Board of Directors in February 2014, became its first independent Chairman on May 14, 2014. In addition, two of the proposed new committees, the Governance and Ethics Committee and the Human Resources Committee, have already been formed. Through its budget tabled on June 4, 2014, the Government of Québec announced that, in light of the principles presented by the Fonds, it will propose amendments to the Fonds’ Incorporation Act. These amendments were tabled before the National Assembly on November 26, 2014 as part of Bill 28.
RISK GOVERNANCE
The Management Committee, comprised of the President and CEO and executives, is responsible for the global management of the Fonds’ operations. Because risk governance is an essential part of integrated financial assets management, the Fonds has put in place a management framework to ensure that risk management and control strategies and resulting operational decisions take the established level of acceptable risk into account. An Integrated Risk Management Advisory Committee has also been set up. The governance structure that supports the Fonds, in particular with respect to risk management, was as follows as at November 30, 2014:
9 Including FTQ-affiliated unions
17

FONDS DE SOLIDARITÉ DES TRAVAILLEURS DU QUÉBEC (F.T.Q.) The Fonds’ governance structure also includes the decision-making boards of the Fonds immobilier de solidarité FTQ. Furthermore, in order to bring into action its regional and local commitment, the Fonds created, several years ago, within its investment network of all the administrative regions of Québec, the Fonds régionaux de solidarité FTQ and the Fonds locaux de solidarité FTQ.
The Fonds’ risk governance structure is built upon a series of policies approved by the Board of Directors. The Fonds regularly reassesses policies, standards, guidelines, and procedures to incorporate the best possible practices. Since the issuance of the last annual MD&A, there have been no material changes to the Integrated Risk Management Policy and the Integrated Financial Assets Management Policy.
Since the issuance of the last annual MD&A, there have been no material changes in the mandate, roles and responsibilities of the main governing bodies of the Fonds (Board of Directors and other committees); however, these mandates, roles and responsibilities are currently being reviewed in light of the creation of new committees. In addition, in the last few months, the Governance and Ethics Committee tasked a sub-committee with analyzing the decision-making process with respect to investment files (including the authorization of an investment, but also any changes to a file and any disinvestment as well as the periodic follow-up of approved files) in order to make recommendations to the Committee.
The recommendations arising from this analysis will have an impact on the scope of the mandate, the roles, the responsibilities and the composition of the various governance bodies of the Fonds.
VALUATION FRAMEWORK During the last six-month period, the Fonds updated its valuation principles. The changes did not have a material impact on the value of the development capital investments portfolio. The update to the valuation principles was approved by the Audit Committee in November 2014.
Since the issuance of the last annual MD&A, there have been no material changes in the management framework that governs the procedure for valuing development capital investments.
MANAGEMENT’S REPORT ON INTERNAL CONTROLS The Fonds has had for several years a financial compliance framework program commonly known as Confor. While not required to apply Regulation 52-109 respecting Certification of Disclosure in Issuers’ Annual and Interim Filings, the Fonds has decided to base its work upon the principles stated in this regulation, thereby demonstrating its willingness to respect best practices in financial governance.
Management is responsible for designing and maintaining internal control over financial reporting as well as disclosure controls and procedures. These controls are developed to provide reasonable assurance that the financial information is reliable and that the financial statements are prepared in accordance with IFRS. However, because of its inherent limitations, internal control over financial reporting may not prevent or detect certain misstatements on a timely basis. Management must periodically evaluate control design and effectiveness. The design of internal control over financial reporting has been evaluated using the COSO (Committee of Sponsoring Organizations of the Treadway Commission) framework, a recognized financial governance framework.
During the six-month period, no change has occurred that has materially affected, or is reasonably likely to materially affect, internal controls.
18

AS AT NOVEMBER 30, 2014
STATEMENT OF DEVELOPMENT CAPITAL
INVESTMENTS, AT COST
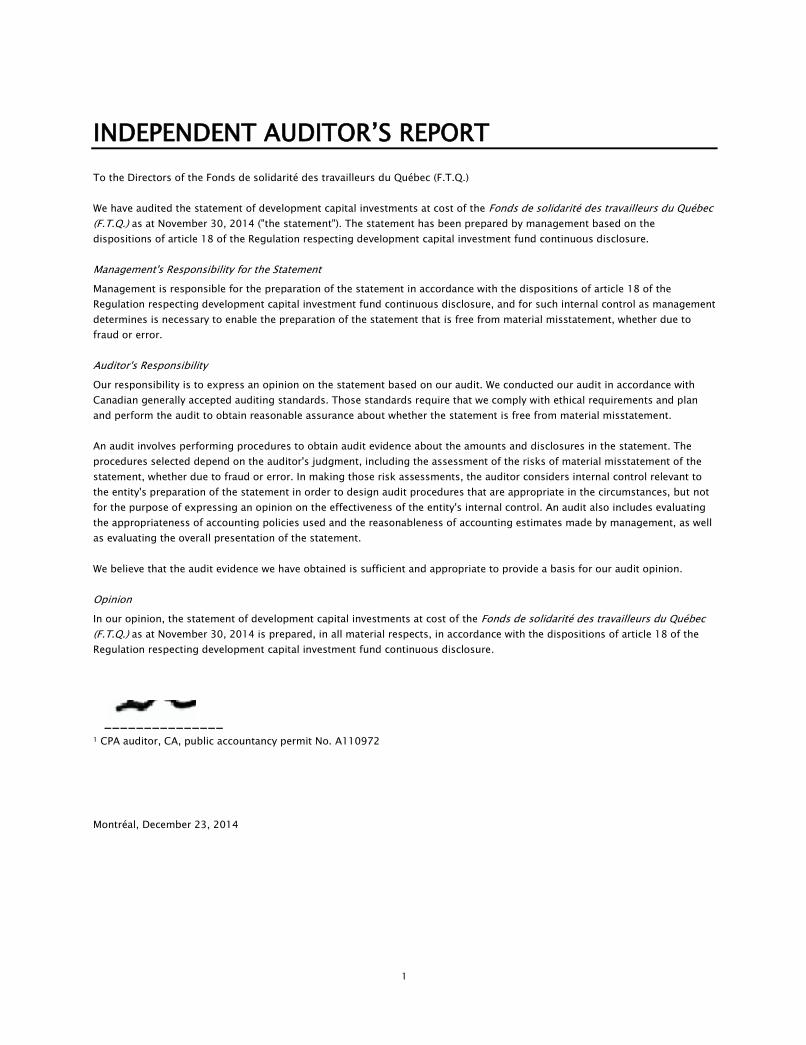
INDEPENDENT AUDITOR’S REPORT
To the Directors of the Fonds de solidarité des travailleurs du Québec (F.T.Q.)
We have audited the statement of development capital investments at cost of the Fonds de solidarité des travailleurs du Québec
(F.T.Q.) as at November 30, 2014 ("the statement"). The statement has been prepared by management based on the
dispositions of article 18 of the Regulation respecting development capital investment fund continuous disclosure.
Management's Responsibility for the Statement
Management is responsible for the preparation of the statement in accordance with the dispositions of article 18 of the
Regulation respecting development capital investment fund continuous disclosure, and for such internal control as management
determines is necessary to enable the preparation of the statement that is free from material misstatement, whether due to
fraud or error.
Auditor's Responsibility
Our responsibility is to express an opinion on the statement based on our audit. We conducted our audit in accordance with
Canadian generally accepted auditing standards. Those standards require that we comply with ethical requirements and plan
and perform the audit to obtain reasonable assurance about whether the statement is free from material misstatement.
An audit involves performing procedures to obtain audit evidence about the amounts and disclosures in the statement. The
procedures selected depend on the auditor's judgment, including the assessment of the risks of material misstatement of the
statement, whether due to fraud or error. In making those risk assessments, the auditor considers internal control relevant to
the entity's preparation of the statement in order to design audit procedures that are appropriate in the circumstances, but not
for the purpose of expressing an opinion on the effectiveness of the entity's internal control. An audit also includes evaluating
the appropriateness of accounting policies used and the reasonableness of accounting estimates made by management, as well
as evaluating the overall presentation of the statement.
We believe that the audit evidence we have obtained is sufficient and appropriate to provide a basis for our audit opinion.
Opinion
In our opinion, the statement of development capital investments at cost of the Fonds de solidarité des travailleurs du Québec
(F.T.Q.) as at November 30, 2014 is prepared, in all material respects, in accordance with the dispositions of article 18 of the
Regulation respecting development capital investment fund continuous disclosure.
_______________
1 CPA auditor, CA, public accountancy permit No. A110972
Montréal, December 23, 2014
1
mamenouc
Tampon

Statement of Development CapitalStatement of Development CapitalStatement of Development CapitalStatement of Development CapitalInvestments, at CostInvestments, at CostInvestments, at CostInvestments, at CostAS AT NOVEMBER 30, 2014(In thousands $)
UnsecuredUnsecuredUnsecuredUnsecured SecuredSecuredSecuredSecured TotalTotalTotalTotal
ListedShares
UnlistedShares
and Units Loans
Guaranteesand
SuretyshipsYear ofYear ofYear ofYear ofInitial InvestmentInitial InvestmentInitial InvestmentInitial Investment
IndustryIndustryIndustryIndustrySegmentSegmentSegmentSegment
Loans,Bonds
and Advances
1988 Fonds de développement emploi-Montréal inc. 1,338 V014001,33840
TransForce inc. 9,955 V041799,95520
1989 Entreprises québécoises publiques (Appendix A) 287,725 V04288287,725
1990 Bestar inc. 1,499 314 V022521,81325
Transat A.T. inc. 38,274 V0224338,27425
1991 B.M.B. (Îles-de-la-Madeleine) inc. 750 V0210275025
Fonds immobilier de solidarité FTQ I, s.e.c. 28,975 V0227328,97540●
Fonds locaux de solidarité FTQ, s.e.c. 38,000 V0249738,00040●
1992 Polycor inc. 9,738 V015549,73815
1993 Fonds immobilier de solidarité FTQ II, s.e.c. 25,000 V0282825,00040●
Groupe Robert inc. 21,940 12,991 V0194534,93120
Le Devoir inc. 1,315 V027801,31525
SSQ, Société d'assurance-vie inc. 221,363 66,100 V02606287,46340
1994 Corporation Financière Brome inc. 2,991 V031892,99140
1995 Château M.T. inc. 2,610 V031332,61025
Fonds régional de solidarité Abitibi-Témiscamingue, société en commandite
16,105 V0359216,10540●
Fonds régional de solidarité Côte-Nord, société en commandite
21,985 V0359321,98540●
Fonds régional de solidarité Estrie, société en commandite
20,114 V0358920,11440●
Fonds régional de solidarité Lanaudière, société en commandite
12,587 V0359812,58740●
Fonds régional de solidarité Laurentides, société en commandite
21,532 V0359921,53240●
Fonds régional de solidarité Laval, société en commandite
21,524 V0359721,52440●
Fonds régional de solidarité Mauricie, société en commandite
12,708 V0358812,70840●
Mines Virginia inc. 9,712 V121009,71215
1996 Fonds d'investissement de la culture et des communications, société en commandite
26,700 V0374826,70025●
Fonds régional de solidarité Bas Saint-Laurent, société en commandite
16,160 V0358516,16040●
Fonds régional de solidarité Chaudière-Appalaches, société en commandite
18,574 V0359618,57440●
Fonds régional de solidarité Gaspésie-Îles-de-la-Madeleine, société en commandite
12,573 V0359512,57340●
Fonds régional de solidarité Montérégie, société en commandite
24,478 V0360024,47840●
Fonds régional de solidarité Outaouais, société en commandite
30,478 V0359130,47840●
2

Statement of Development CapitalStatement of Development CapitalStatement of Development CapitalStatement of Development CapitalInvestments, at CostInvestments, at CostInvestments, at CostInvestments, at CostAS AT NOVEMBER 30, 2014(In thousands $)
UnsecuredUnsecuredUnsecuredUnsecured SecuredSecuredSecuredSecured TotalTotalTotalTotal
ListedShares
UnlistedShares
and Units Loans
Guaranteesand
SuretyshipsYear ofYear ofYear ofYear ofInitial InvestmentInitial InvestmentInitial InvestmentInitial Investment
IndustryIndustryIndustryIndustrySegmentSegmentSegmentSegment
Loans,Bonds
and Advances
1996 Fonds régional de solidarité Québec, société en
commandite
24,976 V0358724,97640●
Fonds régional de solidarité Saguenay-Lac-Saint-
Jean, société en commandite
24,971 V0358624,97140●
Groupe Solmax inc. 1,618 8,859 V0361510,47715
Mines Richmont inc. 9,219 V020889,21915
1997 Fonds régional de solidarité Nord-du-Québec,
société en commandite
12,000 V0359412,00040●
1998 9274-0547 Québec inc. (Manoir Richelieu) 45,579 V1602645,57925
Exploration Azimut inc. 650 V0428865015
Fonds régional de solidarité Centre-du-Québec,
société en commandite
9,616 V043529,61640●
Niocan inc. 284 V0428728415
Société en commandite Manoir Richelieu 1,254 V031841,25425
TSO3 inc. 5,236 V038275,23635
1999 La Financière des entreprises culturelles (FIDEC),
société en commandite
347 V0447234725
2000 ARGO II : The Wireless-Internet Fund - Limited
Partnership
11,318 V0489311,31845
Atrium Innovations inc. 22,180 V0482022,18035
Genopole 1er Jour S.A. 136 V0538713635
Groupe HNZ inc. 24,633 V0495824,63320
GTI V, société en commandite 8,043 V043968,04345
Marketing Léger inc. 1,000 1,250 V044602,25020
2001 Fonds Bio-Innovation, société en commandite 31,592 V0507631,59235●
Investissement Premières Nations du Québec,
société en commandite
2,000 V049562,00040
Kruger Wayagamack inc. 13,351 V0377213,35115
Novacap II, société en commandite 3,264 V049813,26440
Partenaires MidCap 447 V0545444740
SIDEX, société en commandite 15,000 V0533915,00015
2002 FinTaxi, s.e.c. 14,400 53,600 V0568368,00040
Fonds immobilier de solidarité FTQ inc. 1 268,838 V05025268,83940●
Junex inc. 304 V0560130410
Lumira Capital I Québec société en commandite 3,999 V057203,99935
Produits Intégrés Avior inc. 2,250 V051482,25020
Vimac Early Stage Fund L.P. 8,992 V055438,99245
2003 Fonds Vimac Milestone Medica Nord s.e.c. 5,550 V059515,55035
Le Fonds Entrepia Nord, s.e.c. 7,612 V058417,61245
Mines de la Vallée de l'or ltée 437 V0600443715
Stella-Jones inc. 35,938 V0298635,93815
2004 4262280 Canada inc. (Transat A.T.) 4,647 V063754,64725
3

Statement of Development CapitalStatement of Development CapitalStatement of Development CapitalStatement of Development CapitalInvestments, at CostInvestments, at CostInvestments, at CostInvestments, at CostAS AT NOVEMBER 30, 2014(In thousands $)
UnsecuredUnsecuredUnsecuredUnsecured SecuredSecuredSecuredSecured TotalTotalTotalTotal
ListedShares
UnlistedShares
and Units Loans
Guaranteesand
SuretyshipsYear ofYear ofYear ofYear ofInitial InvestmentInitial InvestmentInitial InvestmentInitial Investment
IndustryIndustryIndustryIndustrySegmentSegmentSegmentSegment
Loans,Bonds
and Advances
2004 Corporation Aurifère QMX 300 V0628730015
Fonds d'investissement MSBI, société en
commandite
8,927 V057108,92745
Octasic inc. 1,741 6,264 V055498,00545
Trencap s.e.c. 198,516 V06277198,51655
Vimac ESF Annex Fund L.P. 801 V0617780145
2005 9053-2698 Québec inc. 1 V04338120
A.M. Pappas Life Science Ventures III, LP 7,868 V117597,86835
Addenda Capital inc. 71,406 V1310871,40640
Camoplast Solideal inc. 39,551 V0493539,55125
Château Bonne Entente inc. 1,138 106 V062521,24425
FIER Partenaires, société en commandite 26,520 V0626026,52040●
Fonds Brightspark II, s.e.c. 1,367 V062801,36745
Fonds d'opportunités canadiennes HRS, s.e.c. 20,484 V0607620,48440
Média Groupe inc. 2,000 2,042 V064084,04225
Metro inc. 73,948 V1174073,94830
ProQuest Investments III, L.P. 3,553 V063513,55335
RHO Fund Investors 2005, L.P. 3,758 V116253,75845
SAIL Plein Air inc. 6,000 5,196 V1174311,19625
2006 6569293 Canada inc. (Maison des Futailles) 21,861 V1189721,86130
Boutique Linen Chest (Phase II) inc. 900 V1206790025
Capital Financière Agricole inc. 2,366 V061152,36630
Capital St-Laurent, s.e.c. 11,320 V1147811,32045
Corporation développement Knowlton inc. 32,374 V1236332,37430
Coveo Solutions inc. 6,318 V122516,31845
Emerald Cleantech Fund II L.P. 6,469 V117786,46940
Entreprises SMD ltée 3,500 V115153,50020
Exploration Dios inc. 184 V1197618415
FCPR Aerofund 7,576 V117927,57620
Fiducie du Chantier de l'économie sociale 12,000 V0628512,00040
Fonds CTI sciences de la vie, s.e.c. 2,865 V119652,86535
Fonds ID s.e.c. 10,000 V1174110,00040
Fonds Propulsion III s.e.c. 5,306 V062835,30645
Gestion Rivière du Diable inc. 2,841 450 V114573,29125
Les alcools de spécialités Greenfield inc. 30,000 V1237830,00015
NAPEC inc. 19,985 1,660 V1213021,64520
Relay Ventures Fund L.P. 3,424 V120243,42445
Ressources Cartier inc. 918 V1203191815
Rho Canada Capital de Risque, s.e.c. 19,830 V1198419,83045
Société en commandite Agechem 15,756 V0624815,75635
Sonaca S.A. 950 V1225795020
4

Statement of Development CapitalStatement of Development CapitalStatement of Development CapitalStatement of Development CapitalInvestments, at CostInvestments, at CostInvestments, at CostInvestments, at CostAS AT NOVEMBER 30, 2014(In thousands $)
UnsecuredUnsecuredUnsecuredUnsecured SecuredSecuredSecuredSecured TotalTotalTotalTotal
ListedShares
UnlistedShares
and Units Loans
Guaranteesand
SuretyshipsYear ofYear ofYear ofYear ofInitial InvestmentInitial InvestmentInitial InvestmentInitial Investment
IndustryIndustryIndustryIndustrySegmentSegmentSegmentSegment
Loans,Bonds
and Advances
2006 VantagePoint Venture Partners 2006 (Q), L.P. 18,631 V1154518,63140
2007 6705341 Canada inc. (North Country Slate) 90 178 V1256426825
Envivio, inc. 5,751 V124025,75145
Exploration Midland inc. 636 V1253163615
Fonds d'investissement iNovia II, société en
commandite
3,924 V123173,92445
GO capital s.e.c. 1,625 V120161,62545
Groupe Bikini Village inc. 1,275 V126551,27525
Investissement (12348) s.e.n.c. (Bandsintown
Group)
12,029 V1234812,02945
Les Industries Spectra Premium inc. 10,000 2,603 V0622512,60325
MMV Financial inc. 1 V12373140
Novacap Industries III, s.e.c. 24,698 V1223424,69840●
Novacap Technologies III, s.e.c. 5,010 V120955,01045
Partenaires Médias Remstar, s.e.c. 2,000 V119792,00025
ProQuest Investments IV, L.P. 6,918 V122766,91835
Soccrent 2006, société en commandite 11,380 7,400 V1192918,78040
Société de gestion d'actifs forestiers Solifor,
société en commandite
150,000 V11584150,00015●
Vertex III (C.I.) Fund, L.P. 2,869 V120462,86945
2008 Administration LVER inc. 1,850 V131131,85025
Alimentation Coop Port-Cartier 141 V1249614130
BDR Capital s.e.c. 64,133 V1355864,13345●
Cogeco Câble inc. 100,000 V12924100,00025
Corporation Financière L'Excellence ltée 100,000 V13127100,00040
Dalkotech inc. 5,400 300 V132525,70020
Exploration NQ inc. 124 V1323212415
Fonds soutien Montréal parallèle, s.e.c. 2,000 V131182,00045
G.D.G. Environnement ltée 2,500 V115602,50020
Gestion ACCEO inc. 22,870 6,250 V1353029,12045
Gestion TFI inc. 125,000 V14754125,00020
GLV inc. 32,061 25,000 V1315557,06120
Groupe AGF inc. 20,000 4,200 V1254124,20015
Groupe Gecko Alliance inc. 1,470 V128701,47045
HR Stratégies inc. 100 V1153110040
Ontario Venture Capital Fund LP 5,049 V132455,04945
Placements Montrusco Bolton inc. 20,055 V1313220,05540
Rho Ventures VI, L.P. 19,969 V1293019,96945
Sonaca Montréal inc. 4,473 V115954,47320
VantagePoint Cleantech Partners II, L.P. 19,938 V1303119,93840
2009 5N Plus inc. 14,166 V1243114,16645
5

Statement of Development CapitalStatement of Development CapitalStatement of Development CapitalStatement of Development CapitalInvestments, at CostInvestments, at CostInvestments, at CostInvestments, at CostAS AT NOVEMBER 30, 2014(In thousands $)
UnsecuredUnsecuredUnsecuredUnsecured SecuredSecuredSecuredSecured TotalTotalTotalTotal
ListedShares
UnlistedShares
and Units Loans
Guaranteesand
SuretyshipsYear ofYear ofYear ofYear ofInitial InvestmentInitial InvestmentInitial InvestmentInitial Investment
IndustryIndustryIndustryIndustrySegmentSegmentSegmentSegment
Loans,Bonds
and Advances
2009 A.M. Pappas Life Science Ventures IV, LP 846 V1289884635
ADS inc. 3,600 V136013,60025
Champlain Capital Partners, L.P. 3,791 V136253,79140
Corporation Nuvolt inc. 1 196 V1408119720
FCPR Aerofund II 13,664 V1366113,66420
Fonds Cycle Capital I, s.e.c. 18,360 V1382318,36040
Gestion hôtelière REVPAR inc. 96 V140339625
Gestion Juste pour Rire inc. 729 V1291672925
Holding Smardt inc. 12,121 5,000 V1532117,12120
Les Viandes Laroche inc. 2,000 V014172,00030
MECA DEV S.A.S. 21,502 11,809 V1435433,31120
Média Cineflix inc. 10,925 V1324310,92525
Premier Tech ltée 39,813 V0138739,81315
Société en commandite Groupe CH 40,000 V1410940,00025 8,620
Teraxion inc. 6,167 V057346,16745
Transcontinental inc. 100,000 V13756100,00020
VC, société en commandite 121,037 V13847121,03740●
2010 Dalkotech International inc. 1 V14868120
Foliot Management inc. 7,000 2,500 V142709,50025
Fortress Paper Ltd 7,000 25,000 V1440332,00015
Groupe Technosub inc. 2,430 V064052,43020
IPL inc. 15,000 45,000 V0197560,00015
Nemaska Lithium inc. 260 V1482626015
Radialpoint Safecare inc. 1 15,917 V1430215,91845
Ressources Géoméga inc. 465 V1479846515
Royal Nickel Corp. 300 V1482730015
Saladexpress inc. 8,318 V037688,31830
Scierie Dion & Fils inc. 1,000 V143501,00015
Serdy Média inc. 2,500 333 V138022,83325
Société de Diamant Stornoway 11,605 14,700 V1439626,30515
SSQ, Société d'assurances générales inc. 15,000 V1442815,00040
Twist, société en commandite 6,000 V144446,00030 18
2011 Abitibi Royalties inc. 8 V15313815
Acquisio inc. 4,429 V129824,42945
AmorChem, société en commandite 4,664 V143174,66435
Bombardier inc. 49,779 V1364749,77920
Cogeco inc. 40,000 V1527940,00025
Corporation Aurifère Aurvista 400 V1482840015
Fonds Alpha+ Montrusco Bolton 20,095 V1356220,09540
Fonds Capital Culture Québec, société en
commandite
10,000 V1494910,00025
6

Statement of Development CapitalStatement of Development CapitalStatement of Development CapitalStatement of Development CapitalInvestments, at CostInvestments, at CostInvestments, at CostInvestments, at CostAS AT NOVEMBER 30, 2014(In thousands $)
UnsecuredUnsecuredUnsecuredUnsecured SecuredSecuredSecuredSecured TotalTotalTotalTotal
ListedShares
UnlistedShares
and Units Loans
Guaranteesand
SuretyshipsYear ofYear ofYear ofYear ofInitial InvestmentInitial InvestmentInitial InvestmentInitial Investment
IndustryIndustryIndustryIndustrySegmentSegmentSegmentSegment
Loans,Bonds
and Advances
2011 Fonds d'amorçage Cycle-C3E, s.e.c. 5,077 V149295,07745
Fonds d'investissement pour la relève agricole
(FIRA), s.e.c.
3,667 V144553,66730
Fonds d'investissement Réal, s.e.c. 6,803 V149276,80345
Fonds Relève Québec, s.e.c. 2,710 V149482,71040
Fonds stratégique à rendement absolu HRS, s.e.c. 50,000 V1473050,00040
Groupe Crête division St-Faustin inc. 1,133 V148671,13315
Groupe Meloche inc. 3,000 V149363,00020
Groupe TMX Limitée 97,600 V1503997,60040
JV Driver Corporation inc. 16,000 V1483416,00020
Les Chantiers de Chibougamau ltée 2,250 V148142,25015
Les Investissements Nolinor inc. 1,125 V147691,12520
Magnus Poirier inc. 193 V0300219325
Milestone Pharmaceutiques inc. 5,157 V149855,15735
Nunavik Nickel Mines Ltd 14 V153141415
Ressources Monarques inc. 305 V1505430515
Rona inc. 35,375 V1536735,37525
Scandinave Spa in Whistler inc. 1,861 V148391,86125
2012 9187-8850 Québec inc. (Forage Boréal) 2,150 V149332,15015
9262-2059 Québec inc. (Casavant Frères) 2,000 V152842,00025
Abipa Canada inc. 9,600 V154259,60020
Agritibi R.H. inc. 500 V1549550020
Athos services commémoratifs inc. 15,000 V1578315,00025
Erfa Canada 2012 inc. 3,106 V152973,10635
Financement YPG inc. 7,701 V160277,70125
Fonds de solidarité FTQ investissements
croissance I, s.e.c.
6,897 V158176,89745●
Fonds de solidarité FTQ Investissements
technologiques I, s.e.c.
4,000 V153204,00045●
Germain Larivière inc. 1,174 V144641,17425
Gestion SMS inc. 1 V15483120
GLyPharma Thérapeutique inc. 2,227 V153312,22735
Groupe Colabor inc. 30,000 V0611130,00030
Groupe MBI inc. 19,519 408 V1526119,92720
Groupe PCM inc. 410 V1536241020
Groupe QuébéComm inc. 3,000 V147473,00025
Innovation Thrasos inc. 7,291 V142577,29135
La Coop fédérée 75,000 V1525675,00030
Les Bois de plancher P.G. inc. 2,000 V135782,00015
Les entreprises de divertissements Muse inc. 4,500 V146804,50025
Les Industries Touch inc. 507 V1193250725
7

Statement of Development CapitalStatement of Development CapitalStatement of Development CapitalStatement of Development CapitalInvestments, at CostInvestments, at CostInvestments, at CostInvestments, at CostAS AT NOVEMBER 30, 2014(In thousands $)
UnsecuredUnsecuredUnsecuredUnsecured SecuredSecuredSecuredSecured TotalTotalTotalTotal
ListedShares
UnlistedShares
and Units Loans
Guaranteesand
SuretyshipsYear ofYear ofYear ofYear ofInitial InvestmentInitial InvestmentInitial InvestmentInitial Investment
IndustryIndustryIndustryIndustrySegmentSegmentSegmentSegment
Loans,Bonds
and Advances
2012 Lumira Capital II, société en commandite 5,894 V137745,89435
Maibec inc. 8,644 2,136 V0250210,78015
Mine Barlow inc. 200 V1543620015
Produits alimentaires Viau inc. 5,000 V148785,00030
Société en commandite Free 2 Play 6,900 V149066,90025
Sojag inc. 3,325 V154463,32525
SSQ, Société de participation mutualiste inc. 78,050 V1537278,05040
Supermétal Structures inc. 3,618 V054113,61820
Technologies Interactives Mediagrif inc. 4,725 V039634,72545
Yellow Média Limitée 1,747 V160281,74725
2013 8239223 Canada inc. (Groupe DCM) 8,000 V159458,00020
Accedian Networks Corporation 1,252 V130811,25245
Adetel Group 4,691 V158904,69145
AJW Technique inc. 12,000 V1583612,00020
Asmacure inc. 1 V06167135
Attraction Média inc. 4,000 1,500 V118765,50025
Auberge & Spa le Nordik inc. 831 V1636183125
Bandsintown Group inc. 5,168 V163285,16845
Corporation d'Or Intégra 104 V1728310415
Distech Contrôles inc. 13,000 V0635013,00045
Entreprises Minières du Nouveau-Monde inc. 150 V1586715015
FCPR Aerofund III 6,052 V159296,05220
Fonds d'investissements Sanderling VII (Canada),
s.e.c.
2,502 V156422,50235
Humania Assurance inc. 10,000 V1529410,00040
Les Brasseurs du Nord inc. 15,750 V1595815,75030
Les Réseaux Accedian inc. 7,764 V117617,76445
Les Serres du St-Laurent inc. 1,000 V037581,00030
Lunetterie New Look inc. 15,000 V1737315,00025
Macadamian Technologies inc. 500 V1725050045
Propair inc. 779 V1602577920
Ressources Falco ltée 619 V1629261915
Vision 7 International ULC 14,000 V1589314,00025
2014 2525 inc. 625 V1819462545
Acquisition Glacier II inc. 58,895 V1759058,89535
Adventure Gold inc. 400 1 V1371540115
Argos Therapeutics inc. 1 V15710135
AV & R Vision & Robotiques inc. 1,373 V159611,37320
Coalision inc. 15,000 V0629715,00025
Colo-D inc. 2,175 3,750 V181855,92545
Decolin inc. 5,000 V176725,00025
8
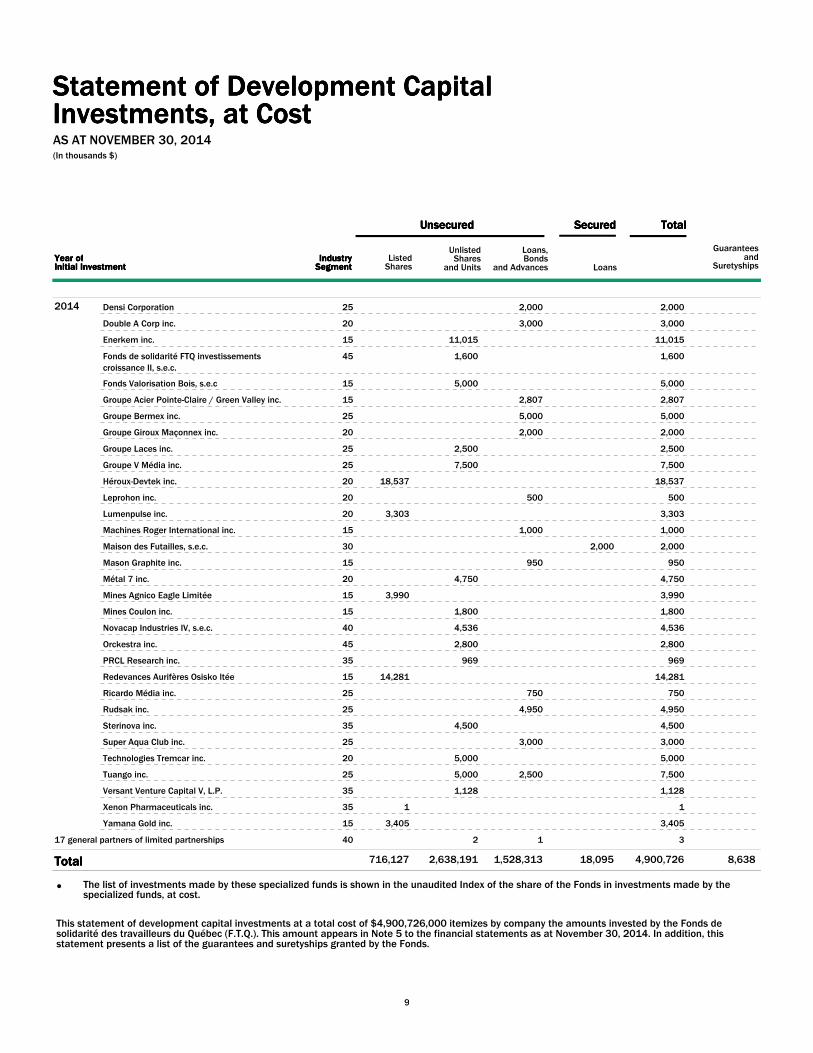
Statement of Development CapitalStatement of Development CapitalStatement of Development CapitalStatement of Development CapitalInvestments, at CostInvestments, at CostInvestments, at CostInvestments, at CostAS AT NOVEMBER 30, 2014(In thousands $)
UnsecuredUnsecuredUnsecuredUnsecured SecuredSecuredSecuredSecured TotalTotalTotalTotal
ListedShares
UnlistedShares
and Units Loans
Guaranteesand
SuretyshipsYear ofYear ofYear ofYear ofInitial InvestmentInitial InvestmentInitial InvestmentInitial Investment
IndustryIndustryIndustryIndustrySegmentSegmentSegmentSegment
Loans,Bonds
and Advances
2014 Densi Corporation 2,000 V175202,00025
Double A Corp inc. 3,000 V172353,00020
Enerkem inc. 11,015 V1302111,01515
Fonds de solidarité FTQ investissements
croissance II, s.e.c.
1,600 V181651,60045
Fonds Valorisation Bois, s.e.c 5,000 V154865,00015
Groupe Acier Pointe-Claire / Green Valley inc. 2,807 V180532,80715
Groupe Bermex inc. 5,000 V128285,00025
Groupe Giroux Maçonnex inc. 2,000 V022222,00020
Groupe Laces inc. 2,500 V181992,50025
Groupe V Média inc. 7,500 V163567,50025
Héroux-Devtek inc. 18,537 V1476618,53720
Leprohon inc. 500 V1817450020
Lumenpulse inc. 3,303 V152643,30320
Machines Roger International inc. 1,000 V026791,00015
Maison des Futailles, s.e.c. 2,000 V174742,00030
Mason Graphite inc. 950 V1745995015
Métal 7 inc. 4,750 V172574,75020
Mines Agnico Eagle Limitée 3,990 V181013,99015
Mines Coulon inc. 1,800 V173991,80015
Novacap Industries IV, s.e.c. 4,536 V176684,53640
Orckestra inc. 2,800 V181642,80045
PRCL Research inc. 969 V1721196935
Redevances Aurifères Osisko ltée 14,281 V1810514,28115
Ricardo Média inc. 750 V1737975025
Rudsak inc. 4,950 V147884,95025
Sterinova inc. 4,500 V160934,50035
Super Aqua Club inc. 3,000 V173953,00025
Technologies Tremcar inc. 5,000 V137295,00020
Tuango inc. 5,000 2,500 V175167,50025
Versant Venture Capital V, L.P. 1,128 V161551,12835
Xenon Pharmaceuticals inc. 1 V18203135
Yamana Gold inc. 3,405 V120553,40515
2 1 V0560534017 general partners of limited partnerships
716,127TotalTotalTotalTotal 2,638,191 1,528,313 18,095 8,6384,900,726
This statement of development capital investments at a total cost of $4,900,726,000 itemizes by company the amounts invested by the Fonds de solidarité des travailleurs du Québec (F.T.Q.). This amount appears in Note 5 to the financial statements as at November 30, 2014. In addition, this statement presents a list of the guarantees and suretyships granted by the Fonds.
The list of investments made by these specialized funds is shown in the unaudited Index of the share of the Fonds in investments made by the specialized funds, at cost.
●
9

Statement of Development CapitalStatement of Development CapitalStatement of Development CapitalStatement of Development CapitalInvestments, at CostInvestments, at CostInvestments, at CostInvestments, at CostAS AT NOVEMBER 30, 2014(In thousands $)
UnsecuredUnsecuredUnsecuredUnsecured SecuredSecuredSecuredSecured TotalTotalTotalTotal
ListedShares
UnlistedShares
and Units Loans
Guaranteesand
SuretyshipsYear ofYear ofYear ofYear ofInitial InvestmentInitial InvestmentInitial InvestmentInitial Investment
IndustryIndustryIndustryIndustrySegmentSegmentSegmentSegment
Loans,Bonds
and Advances
Energy
Materials
Industrials
Consumer discretionary
Consumer staples
Health care
Financials
Information technology
Telecommunication services
Utilities
Industry segment legendIndustry segment legendIndustry segment legendIndustry segment legend
10
15
20
25
30
35
40
45
50
55
10

Entreprises québécoises publiques, at costEntreprises québécoises publiques, at costEntreprises québécoises publiques, at costEntreprises québécoises publiques, at cost
AS AT NOVEMBER 30, 2014(In thousands $)
APPENDIX AAPPENDIX AAPPENDIX AAPPENDIX A
ListedListedListedListedSharesSharesSharesShares
DescriptionDescriptionDescriptionDescription IndustryIndustryIndustryIndustrySegmentSegmentSegmentSegment
5N Plus inc. V1243112,55045
Abitibi Royalties inc. V153131515
Adventure Gold inc. R143234915
Aimia inc. 39945320,54025
Alimentation Couche-Tard inc. 01626P3,28030
Amex Exploration inc. 30214Q2515
Bombardier inc. V1364736,41120
Bowmore Exploration Ltd 103037915
Cogeco Câble inc. V1292427,45425
Cogitore Resources inc. R114199315
Corporation Fiera Capital 31660A4,64340
Corporation Groupe Mercator Transport GMT75020
Corporation Océanique Iron Ore 67524Q7715
Ergorecherche ltée 29482C5,41035
Exploration Azimut inc. V042883,15515
Exploration Dios inc. V119767015
Exploration Midland inc. V1253110815
Forage Orbit Garant inc. 68556N8,85620
GLV inc. V131555,20120
Groupe Canam inc. 13710C3,37115
Groupe CGI inc. 39945C21,36045
Groupe d'alimentation MTY inc. 55378N9,29825
Groupe DMD Connexions santé numériques inc. APTILON2,53835
Hecla Mining Company 4227042615
Héroux-Devtek inc. 42774L12,07220
Industries Lassonde inc. 4179072,49030
Innergex Énergie renouvelable inc. 45790B4,36955
Junex inc. V056011,55110
Lamêlée minerais de fer ltée 5134414215
Le Groupe Jean Coutu (PJC) inc. 47215Q84030
Lumenpulse inc. V152644,33220
Manac inc. V061187,46820
Metro inc. V117406,82930
Mines Agnico Eagle Limitée V181014715
Mines de la Vallée de l'or ltée V060042415
Mines Richmont inc. V0208814815
Mines Virginia inc. V1210012,68515
Nunavik Nickel Mines Ltd V15314315
Opsens inc. 6838231,93545
1

Entreprises québécoises publiques, at costEntreprises québécoises publiques, at costEntreprises québécoises publiques, at costEntreprises québécoises publiques, at cost
AS AT NOVEMBER 30, 2014(In thousands $)
APPENDIX AAPPENDIX AAPPENDIX AAPPENDIX A
ListedListedListedListedSharesSharesSharesShares
DescriptionDescriptionDescriptionDescription IndustryIndustryIndustryIndustrySegmentSegmentSegmentSegment
Quincaillerie Richelieu ltée 76329W7,38020
Redevances Aurifères Osisko ltée V181052715
Ressources Cartier inc. V120314815
Rogers Sugars inc. 77519R7,34330
Royal Nickel Corp. V148277515
SEMAFO inc. 8169222815
Stella-Jones inc. V029865,70115
Technologies D-Box inc. DBOX5,53325
Technologies Interactives Mediagrif inc. V0396312,15345
Technologies Sensio inc. 81725Y1,28345
TransForce inc. V0417912,78520
WSP Global inc. 37230Q12,76120
Xebec Adsorption inc. 9838912,37420
Yamana Gold inc. V120554015
TotalTotalTotalTotal 287,725
Industry segment legendIndustry segment legendIndustry segment legendIndustry segment legend
10
15
20
25
30
35
40
45
50
55
Energy
Materials
Industrials
Consumer discretionary
Consumer staples
Health care
Financials
Information technology
Telecommunication services
Utilities
2
AS AT NOVEMBER 30, 2014
RELEVÉDES AUTRES
INVESTISSEMENTS(NON AUDITÉ) IN FRENCH ONLY

FONDS DE SOLIDARITÉ DES TRAVAILLEURS DU QUÉBEC (F.T.Q.)Relevé des autres investissements
au 30 novembre 2014
non audité( )
Quantité Coût
Juste
valeurDescription(en milliers $)(en milliers $)
Actions et parts
6 650 3M Co.88579Y101 50 600 9 224
743 A.P. Moeller - Maersk AS, classe B425304003 495 1 180
3 106 ABB Ltd710889908 131 773 3 383
4 830 Abbott Laboratories002824100 120 800 6 130
1 914 AbbVie inc.00287Y109 43 100 3 401
528 ABC-Mart inc.JP3152740001 11 100 636
180 Aberdeen Asset Management plc000003125 25 188 202
3 171 Accenture plcG1151C101 35 900 3 534
1 692 ACE LtdH0023R105 18 000 2 347
1 220 Actavis plc00507K103 7 328 2 261
215 Actelion LtdCH0010532478 1 596 217
158 Activision Blizzard inc.00507V109 7 000 173
110 Adecco SACH0012138605 1 208 97
1 512 Adidas AG403197908 13 724 1 249
652 Adobe Systems inc.00724F101 14 600 1 227
248 Advance Auto Parts inc.00751Y106 1 900 319
178 Advantest Corp.JP3122400009 14 900 203
63 Aecon Group inc.00762V109 3 800 46
475 Aegon NV592737902 66 389 596
341 Aeon Co. Ltd648004000 24 700 281
971 Aéroports de ParisFR0010340141 6 849 961
967 AES Corp.00130H105 64 300 1 017
723 Aetna inc.00817Y108 11 600 1 154
786 Aflac inc.001055102 13 600 926
477 Aggreko plcGB00BK1PTB77 16 358 448
828 Agilent Technologies inc.00846U101 21 200 1 033
1 097 AGL Energy LtdB0ZNPN904 76 251 973
3 780 Agnico Eagle Mines Ltd008474108 102 700 2 740
7 439 Agrium inc.008916108 83 000 9 161
4 281 AIA Group LtdB4TX8S909 868 000 5 717
3 015 Air Canada008911877 373 700 4 178
1 535 Air Liquide SAB1YXBJ905 15 011 2 159
460 Air Products & Chemicals inc.009158106 5 700 935
165 Airgas inc.009363102 2 700 356
1 154 Ajinomoto Co. inc.601090004 79 000 1 681
303 Akamai Technologies inc.00971T101 4 700 346
859 Akzo Nobel NVNL0010866596 13 074 1 033
220 Albemarle Corp.012653101 3 500 236
419 Alcatel-LucentFR0000130007 88 289 359
499 Alcoa inc.013817101 32 600 643
531 Alexion Pharmaceuticals inc.015351109 5 400 1 200
300 Alfa Laval ABSE0000695876 10 080 229
629 Alfresa Holdings Corp.JP3126340003 36 000 474
2 495 Alimentation Couche-Tard, classe B01626P403 113 400 4 593
2 102 Alleghany Corp.017175100 4 900 2 551
873 Allergan inc.018490102 8 600 2 097
167 Alliance Data Systems Corp.018581108 600 196
170 Alliant Energy Corp.018802108 4 400 315
1 898 Allianz SE523148906 11 885 2 333
698 Allstate Corp.020002101 14 000 1 088
434 Alstom SAFR0010220475 12 362 494
3 900 AltaGas Ltd021361100 89 800 3 806
1

FONDS DE SOLIDARITÉ DES TRAVAILLEURS DU QUÉBEC (F.T.Q.)Relevé des autres investissements
au 30 novembre 2014
non audité( )
Quantité Coût
Juste
valeurDescription(en milliers $)(en milliers $)
Actions et parts
942 Altera Corp.021441100 27 000 1 159
100 Altice SA101453952 1 299 100
2 279 Altus Group Ltd02215R107 103 332 2 454
376 Alumina Ltd695498006 255 975 416
666 Amadeus IT Holding SAES0109067019 14 111 642
2 727 Amazon.com inc.023135106 9 900 3 823
223 Amcor Ltd606660009 34 308 406
301 Amec Foster Wheeler plc002826006 17 891 299
246 Ameren Corp.023608102 7 300 359
307 American Airlines Group inc.02376R102 6 800 376
478 American Capital Agency Corp.02503X105 18 100 476
1 538 American Electric Power Co. inc.025537101 33 400 2 192
2 110 American Express Co.025816109 26 800 2 824
1 732 American International Group inc.026874784 37 400 2 337
220 American Realty Capital Properties inc.02917T104 21 600 232
3 900 American Tower Corp.03027X100 45 300 5 424
770 American Water Works Co. inc.030420103 17 000 1 029
626 Ameriprise Financial inc.03076C106 7 400 1 112
3 457 AmerisourceBergen Corp.03073E105 49 900 5 181
519 AMETEK inc.031100100 11 600 674
2 189 Amgen inc.031162100 20 900 3 940
558 AMP Ltd670995901 106 983 587
1 105 Amphenol Corp., classe A032095101 26 400 1 614
858 Anadarko Petroleum Corp.032511107 13 500 1 218
780 Analog Devices inc.032654105 16 400 1 022
191 Andritz AG013042748 2 808 173
3 767 Anglo American plcB1XZS8907 112 826 2 663
4 697 Anheuser-Busch InBev NV475531901 56 561 7 595
1 984 Annaly Capital Management inc.035710409 149 200 1 959
440 Ansys inc.03662Q105 5 200 495
1 057 Anthem inc.036752103 12 000 1 750
706 Antofagasta plc004561908 48 570 639
588 Aon plcG0408V102 8 900 939
588 Aozora Bank LtdJP3711200000 186 000 690
599 AP Moeller - Maersk ASDK0010244425 228 533
173 APA Group624730909 32 834 251
1 027 Apache Corp.037411105 10 800 789
23 769 Apple inc.037833100 333 300 45 199
1 982 Applied Materials inc.038222105 108 800 2 984
10 311 ARC Resources Ltd00208D408 347 070 9 385
1 129 ArcelorMittalB03XPL901 58 262 817
3 016 Arch Capital Group LtdBMG0450A1053 47 400 3 098
650 Archer-Daniels-Midland Co.039483102 19 800 1 189
1 654 ARM Holdings plc005958905 99 597 1 627
142 Aryzta AGB39VJC900 3 442 314
301 Asahi Glass Co. LtdJP3112000009 47 000 259
304 Asahi Group Holdings Ltd605440007 15 600 555
910 Asahi Kasei Corp.605460005 132 000 1 309
291 Ashland inc.044209104 3 200 416
183 ASM Pacific Technology LtdKYG0535Q1331 17 400 202
3 181 ASML Holding NVACI02GTQ9 33 320 4 022
482 Assa Abloy AB, classe B569878903 11 464 712
2

FONDS DE SOLIDARITÉ DES TRAVAILLEURS DU QUÉBEC (F.T.Q.)Relevé des autres investissements
au 30 novembre 2014
non audité( )
Quantité Coût
Juste
valeurDescription(en milliers $)(en milliers $)
Actions et parts
881 Assicurazioni Generali SPA405671009 45 593 1 127
221 Associated British Foods plc067312900 11 583 662
1 704 Astellas Pharma inc.698538006 146 200 2 398
1 874 AstraZeneca plc098952906 35 014 2 989
1 168 ASX LtdAU000000ASX7 31 562 1 106
13 077 AT&T inc.00206R102 372 600 15 031
121 ATCO Ltd, classe I046789400 2 500 119
402 Atlantia SPAIT0003506190 13 773 397
841 Atlas Copco ABSE0000122467 28 105 853
1 302 Atlas Copco AB, classe AB1QGR4907 46 375 1 528
732 ATS Automation Tooling Systems inc.001940105 48 100 694
597 Auckland International AirportNZAIAE0002S6 150 895 523
760 AuRico Gold inc.05155C105 118 800 455
2 210 Australia and New Zealand Banking Group Ltd606558005 78 414 2 436
649 Autodesk inc.052769106 10 700 756
299 Autoliv inc.052800109 2 700 305
6 060 Automatic Data Processing inc.053015103 83 400 8 144
4 033 Autozone inc.053332102 7 499 4 939
1 291 Avago Technologies LtdSG9999006241 18 800 2 002
1 526 AvalonBay Communities inc.053484101 10 700 1 961
289 Avery Dennison Corp.053611109 5 200 294
472 Aviva plc021623004 89 638 813
973 Avon Products inc.054303102 47 100 526
1 122 Axa SA708842901 53 304 1 471
14 Axis Capital Holdings LtdBMG0692U1099 250 14
132 B/E Aerospace inc.073302101 1 300 115
301 Babcock International Group plcGB0009697037 13 643 277
1 041 Badger Daylighting Ltd05651W209 31 720 977
686 BAE Systems plc026349902 107 080 920
642 Baker Hughes inc.057224107 12 000 780
70 Ball Corp.058498106 2 400 184
242 Banca Monte dei Paschi di Siena SPAIT0004984842 93 371 86
5 047 Banco Bilbao Vizcaya Argentaria SA550190904 447 129 5 491
187 Banco Comercial Português SAPTBCP0AM0007 1 460 067 172
328 Banco de Sabadell SAES0113860A34 126 171 409
247 Banco Popolare SCIT0005002883 10 777 170
387 Banco Popular Espanol SAES0113790226 46 274 291
8 164 Banco Santander SA570594903 913 597 9 414
813 Bank Hapoalim BMIL0006625771 128 414 730
597 Bank Leumi Le-Israel BMIL0006046119 138 563 557
3 973 Bank of America Corp.060505104 281 600 5 471
302 Bank of East Asia LtdHK0023000190 69 727 333
325 Bank of IrelandIE0030606259 696 940 327
141 Bankia SA011330702 142 484 286
5 890 Banque Canadienne Impériale de Commerce136069101 71 600 7 625
15 244 Banque de Montréal063671101 224 100 18 793
24 965 Banque Laurentienne du Canada51925D106Z 739 697 37 725
2 250 Banque Nationale du Canada633067103 49 800 2 646
23 394 Banque Royale du Canada780087102 372 800 31 001
26 619 Banque Toronto-Dominion891160509 600 010 34 572
1 992 Barclays plc313486904 426 517 1 867
8 081 Barrick Gold Corp.067901108 431 000 5 835
3

FONDS DE SOLIDARITÉ DES TRAVAILLEURS DU QUÉBEC (F.T.Q.)Relevé des autres investissements
au 30 novembre 2014
non audité( )
Quantité Coût
Juste
valeurDescription(en milliers $)(en milliers $)
Actions et parts
1 314 Barry Callebaut AG547692905 923 1 130
1 498 BASF SEACI0054Q2 22 883 2 369
5 453 Baxter International inc.071813109 70 500 5 868
5 862 Bayer AG506921907 47 406 8 133
2 117 Bayerische Motoren Werke AG575602909 20 076 2 623
301 Bayerische Motoren Werke AG - PRFDE0005190037 2 888 280
9 356 Baytex Energy Corp.07317Q105 201 950 4 886
724 BB&T Corp.054937107 21 200 909
9 953 BCE inc.05534B760 212 330 11 326
4 588 Becton Dickinson and Co.075887109 38 300 6 128
1 139 Bed Bath & Beyond inc.075896100 16 000 1 339
1 080 Beiersdorf AG510740905 11 285 1 145
1 434 Belgacom SAB00D9P907 40 494 1 827
954 Benesse Holdings inc.JP3835620000 22 700 788
7 562 Berkshire Hathaway inc., classe B084670702 60 600 10 274
265 Best Buy Co. inc.086516101 9 500 427
973 Bezeq Israeli Telecommunication Corp. Ltd609803903 504 944 1 018
4 570 BG Group plc087628905 219 640 3 530
8 541 BHP Billiton Ltd614469005 243 420 7 325
5 414 BHP Billiton plc005665906 171 713 4 652
1 534 Biogen Idec inc.09062X103 6 400 2 245
413 BioMarin Pharmaceutical inc.09061G101 5 600 573
1 408 Blackberry Ltd09228F103 126 070 1 495
1 099 BlackRock inc.09247X101 3 800 1 556
1 744 BNP Paribas730968906 28 744 2 107
4 573 Boardwalk Real Estate Investment Trust096631106 70 466 4 626
1 944 BOC Hong Kong Holdings Ltd653611905 595 000 2 398
141 Boliden ABB1XCBX901 10 765 208
6 859 Bombardier inc., classe B097751200 1 681 000 7 330
3 110 Bonavista Energy Corp.09784Y108 181 900 1 750
142 Boral Ltd621867902 30 744 146
404 BorgWarner inc.099724106 9 600 619
802 Boston Properties inc.101121101 7 200 1 064
426 Boston Scientific Corp.101137107 44 100 647
166 Bouygues SA400212908 3 286 141
5 180 BP plc079805909 596 944 4 479
646 Brambles LtdB1FJ0C904 70 280 665
757 Bridgestone Corp.613210004 21 800 854
3 984 Bristol-Myers Squibb Co.110122108 79 600 5 360
579 British Land Co. plc013670005 60 011 823
1 483 Broadcom Corp., classe A111320107 40 400 1 987
2 896 Brookfield Asset Management inc., classe A112585104 71 000 4 082
5 593 Brookfield Properties Corp.G16249107 255 300 6 843
2 764 Brookfield Renewable Energy Partners LPG16258108 87 200 3 092
1 222 Brown-Forman Corp., classe B115637209 18 100 2 003
781 BT Group plc309135903 217 952 1 596
1 116 Bunge LtdG16962105 13 900 1 439
1 379 Bunzl plcGB00B0744B38 46 741 1 490
879 Burberry Group plc317430908 34 148 1 006
670 Bureau Veritas SAB28DTJ907 22 473 612
1 827 C.R. Bard inc.067383109 11 300 2 156
692 Cabot Oil & Gas Corp.127097103 23 300 877
4

FONDS DE SOLIDARITÉ DES TRAVAILLEURS DU QUÉBEC (F.T.Q.)Relevé des autres investissements
au 30 novembre 2014
non audité( )
Quantité Coût
Juste
valeurDescription(en milliers $)(en milliers $)
Actions et parts
787 CALBEE inc.B3TBRZ902 26 800 1 058
211 Calpine Corp.131347304 14 400 377
171 Caltex Australia Ltd616150009 9 937 293
608 Camden Property Trust133131102 8 200 717
255 Cameco Corp.13321L108 12 000 255
669 Cameron International Corp.13342B105 12 500 730
1 827 Campbell Soup Co.134429109 38 900 2 009
2 193 Canadian Apartment Properties Real Estate Investment Trust134921105 93 600 2 426
840 Canadian Energy Services & Technology Corp.13566W108 75 000 516
8 064 Canadian National Railway Co.136375102 151 900 12 338
11 864 Canadian Natural Resources Ltd136385101 341 200 12 952
481 Canadian Oil Sands Ltd13643E105 19 500 284
3 607 Canadian Pacific Railway Ltd13645T100 21 400 4 720
3 940 Canadian Real Estate Investment Trust13650J104 86 900 4 229
9 525 Canadian Tire Corp., classe A136681202 97 300 12 485
120 Canadian Utilities Ltd, classe A136717832 3 000 120
5 641 Canon inc.617232004 156 700 5 723
410 Cap Gemini SAFR0000125338 5 326 446
538 Capita plcB23K0M900 35 190 672
1 106 Capital One Financial Corp.14040H105 17 400 1 651
590 CapitaLand Ltd630930907 207 000 601
260 CapitaMall TrustSG1M51904654 146 000 253
435 Capstone Mining Corp.14068G104 150 900 288
30 Cardinal Energy Ltd14150G400 1 600 22
1 651 Cardinal Health inc.14149Y108 26 200 2 456
238 CareFusion Corp.14170T101 3 600 243
927 Carlsberg AS, classe B416921005 9 294 947
417 CarMax inc.143130102 8 700 565
539 Carnival Corp.143658300 15 900 801
949 Carrefour SA564156909 23 544 852
1 005 Casino Guichard Perrachon SA417841004 9 595 1 057
2 413 Catamaran Corp.148887102 43 900 2 536
3 586 Caterpillar inc.149123101 38 000 4 358
155 Cathay Pacific Airways LtdHK0293001514 75 000 188
904 CBS Corp., classe B124857202 17 662 1 105
1 069 CCL Industries inc., classe B124900309 20 500 2 476
538 Celanese Corp., série A150870103 11 100 761
403 Celesio AGDE000CLS1001 10 598 406
5 545 Celestica inc.15101Q108 440 300 5 407
1 457 Celgene Corp.151020104 23 200 3 008
10 625 Cenovus Energy inc.15135U109 336 200 8 630
273 CenterPoint Energy inc.15189T107 15 900 434
601 Central Japan Railway Co.618355903 5 300 880
1 483 Centrica plcB033F2900 277 157 1 409
1 644 CenturyLink inc.156700106 44 500 2 068
508 Cerner Corp.156782104 10 000 734
248 CF Industries Holdings inc.125269100 1 800 550
1 467 CGI Group inc., classe A39945C109 40 100 1 671
500 CH Robinson Worldwide inc.12541W209 8 700 732
2 642 Chartwell Retirement Residences16141A103 241 500 2 910
387 Chemtrade Logistics Income Fund16387P103 18 200 382
195 Cheniere Energy inc.16411R208 6 500 489
5

FONDS DE SOLIDARITÉ DES TRAVAILLEURS DU QUÉBEC (F.T.Q.)Relevé des autres investissements
au 30 novembre 2014
non audité( )
Quantité Coût
Juste
valeurDescription(en milliers $)(en milliers $)
Actions et parts
401 Chesapeake Energy Corp.165167107 16 000 370
1 471 Cheung Kong Holdings Ltd619027006 91 000 1 904
1 615 Cheung Kong Infrastructure Holdings Ltd621255900 237 000 2 000
6 452 Chevron Corp.166764100 70 500 8 752
594 Chipotle Mexican Grill inc.169656105 1 300 984
128 Chiyoda Corp.JP3528600004 9 000 91
705 Christian Dior SA406139907 3 678 805
4 355 Chubb Corp.171232101 45 500 5 346
627 Chubu Electric Power Co. inc.619560006 26 900 359
114 Chugai Pharmaceutical Co. LtdJP3519400000 3 300 102
257 Chugoku Electric Power Co. inc.619590003 12 400 183
3 884 Church & Dwight Co. inc.171340102 55 500 4 855
2 563 CI Financial Corp.125491100 76 000 2 574
571 Cigna Corp.125509109 8 200 962
149 Cimarex Energy Co.171798101 2 800 335
500 Cincinnati Financial Corp.172062101 10 300 598
3 730 Cineplex inc.172454100 93 277 4 081
3 969 Cisco Systems inc.17275R102 155 800 4 910
12 311 Citigroup inc.172967424 231 900 14 272
105 Citizen Holdings Co. LtdJP3352400000 12 700 112
431 Citrix Systems inc.177376100 6 500 491
491 City Developments LtdSG1R89002252 57 000 502
1 707 Clorox Co.189054109 18 800 2 178
4 002 CLP Holdings Ltd609701909 481 000 4 771
664 CME Group inc.12572Q105 9 400 907
258 CMS Energy Corp.125896100 10 600 400
794 CNH Industrial NVNL0010545661 66 046 591
543 Coach inc.189754104 9 000 381
609 Cobalt International Energy inc.19075F106 25 900 266
357 Coca-Cola Amatil Ltd612345900 33 613 299
7 679 Coca-Cola Co.191216100 221 400 11 318
265 Coca-Cola Enterprises inc.19122T109 10 500 526
504 Coca-Cola HBC AGB9895B904 17 929 465
294 Cochlear LtdAU000000COH5 5 028 340
1 035 Cogeco Câble inc.19238V105 18 000 1 170
641 Cognizant Technology Solutions, classe A192446102 19 200 1 182
7 707 Colgate-Palmolive Co.194162103 121 200 9 617
1 561 Coloplast ASDK0060448595 17 472 1 731
933 Colruyt SAACI009ZR8 15 951 848
2 833 Comcast Corp.20030N200 70 900 4 593
315 Commerzbank AGACI05RX61 29 318 511
4 673 Commonwealth Bank of Australia621503002 64 492 5 067
655 Compagnie de St-Gobain738048909 15 108 793
3 188 Compagnie Financière Richemont SAB3DCZF902 33 142 3 563
638 Compagnie Générale des Établissements Michelin SCA458836004 6 983 734
1 695 Compass Group plc053315909 116 080 2 260
999 ConAgra Foods inc.205887102 31 600 1 316
299 Concho Resources inc.20605P101 3 400 369
116 Concur Technologies inc.US2067081099 800 118
3 812 ConocoPhillips20825C104 63 300 4 769
4 183 Consolidated Edison inc.209115104 72 400 5 213
149 Constellation Brands inc., classe A21036P108 5 300 583
6

FONDS DE SOLIDARITÉ DES TRAVAILLEURS DU QUÉBEC (F.T.Q.)Relevé des autres investissements
au 30 novembre 2014
non audité( )
Quantité Coût
Juste
valeurDescription(en milliers $)(en milliers $)
Actions et parts
1 716 Constellation Software inc.21037X100 8 200 2 719
133 Contact Energy Ltd615252905 24 055 132
457 Continental AG459858908 3 368 806
122 Continental Resources inc.212015101 3 800 178
194 Copper Mountain Mining Corp.21750U101 77 200 150
238 Core Laboratories NVN22717107 1 800 264
1 642 Corning inc.219350105 90 400 2 167
2 055 Costco Wholesale Corp.22160K105 23 700 3 841
1 229 Covidien plcG2554F113 17 434 2 008
650 Crédit Agricole SAFR0000045072 38 316 616
1 255 Credit Suisse Group AG717158901 42 267 1 292
590 Cree inc.225447101 9 500 393
4 574 Crescent Point Energy Corp.22576C101 120 100 3 564
454 CRH plc418224002 19 459 526
196 Croda International plc023352008 5 487 240
1 280 Crown Castle International Corp.228227104 21 200 2 008
301 Crown Holdings inc.228368106 6 900 389
1 832 CSL Ltd618549901 28 904 2 322
804 CSX Corp.126408103 30 900 1 286
694 Cummins inc.231021106 5 600 930
2 261 CVS Caremark Corp.126650100 43 800 4 563
78 Daicel Corp.625054002 12 000 157
946 Daiichi Sankyo Co. LtdB0J7D9901 53 500 899
688 Daikin Industries Ltd625072004 14 600 1 105
4 110 Daimler AG552902900 53 602 5 145
798 Daito Trust Construction Co. LtdJP3486800000 7 600 978
595 Daiwa House Industry Co. Ltd625136007 30 000 652
561 Daiwa Securities Group inc.625144001 67 000 614
1 150 Danaher Corp.235851102 17 900 1 705
1 224 DanoneFR0000120644 19 049 1 537
530 Danske Bank AS458882909 25 849 839
1 035 Dassault Systèmes SAFR0000130650 14 640 1 094
2 127 DaVita HealthCare Partners inc.23918K108 27 800 2 426
2 255 DBS Group Holdings Ltd617520903 159 764 2 771
1 014 Deere & Co.244199105 11 200 1 106
137 Delek Group Ltd621964907 484 187
301 Delhaize Group SA426211009 4 065 340
1 126 Delphi Automotive plcG27823106 18 044 1 500
165 Delta Air Lines inc.247361702 3 800 202
277 Denbury Resources inc.247916208 15 100 142
676 Denso Corp.664038007 15 500 825
1 619 Deutsche Bank AG575035902 36 145 1 350
439 Deutsche Boerse AG702196908 6 569 547
753 Deutsche Post AG461785909 28 830 1 094
1 091 Deutsche Telekom AG584235907 74 679 1 450
773 Devon Energy Corp.25179M103 10 600 713
747 DEXUS Property GroupAU000000DXS1 110 483 764
4 151 DH Corp.23290R101 137 255 4 940
6 377 Diageo plc023740905 220 264 7 791
572 Diamond Offshore Drilling inc.25271C102 8 500 285
2 414 DirectCash Payments inc.25456A103 160 981 2 647
991 DIRECTV25490A309 15 700 1 570
7

FONDS DE SOLIDARITÉ DES TRAVAILLEURS DU QUÉBEC (F.T.Q.)Relevé des autres investissements
au 30 novembre 2014
non audité( )
Quantité Coût
Juste
valeurDescription(en milliers $)(en milliers $)
Actions et parts
825 Discover Financial Services254709108 16 700 1 248
340 Discovery Communications inc., classe A25470F104 8 200 326
326 Discovery Communications inc., classe C25470F302 8 200 318
402 DISH Network Corp.25470M109 6 600 598
428 Distribuidora InternacionalACI00NNS8 51 496 409
488 DNB ASA426330007 29 070 551
1 903 Dollar General Corp.256677105 32 400 2 465
1 115 Dollar Tree inc.256746108 20 900 1 629
1 903 Dollarama inc.25675T107 38 400 2 057
1 931 Dominion Diamond Corp.257287102 127 200 2 370
4 735 Dominion Resources inc.25746U109 70 200 5 807
249 Don Quijote Holdings Co. LtdJP3639650005 3 500 249
1 388 Dorel Industries inc., classe B25822C205 37 850 1 435
602 Dover Corp.260003108 7 400 650
2 537 Dow Chemical Co.260543103 67 399 3 741
539 Dr Pepper Snapple Group inc.26138E109 12 700 1 072
249 DTE Energy Co.233331107 5 000 464
6 970 Duke Energy Corp.26441C204 96 000 8 856
2 959 E.I. du Pont de Nemours and Co.263534109 54 300 4 420
1 631 E.ON SE494290901 45 835 927
1 808 East Japan Railway Co.629854902 22 900 1 958
194 Eastman Chemical Co.277432100 5 000 473
956 Eaton Corp. plcG29183103 13 900 1 075
2 140 eBay inc.278642103 38 700 2 422
4 550 Ecolab inc.278865100 44 100 5 479
746 EdenredFR0010908533 22 178 731
348 Edison International281020107 8 300 602
288 EDP - Energias de Portugal SA410359905 75 436 354
201 Edwards Lifesciences Corp.28176E108 1 400 207
3 926 Eisai Co. Ltd630720001 94 800 3 875
3 561 Eldorado Gold Corp.284902103 463 700 3 306
166 Electric Power Development Co. LtdB02Q32903 4 800 190
370 Électricité de France SAB0NJJ1901 6 020 206
284 Electrolux ABSE0000103814 11 873 403
255 Electronic Arts inc.285512109 11 100 556
3 910 Eli Lilly & Co.532457108 66 300 5 150
130 Elisa OYJ570151902 5 759 191
1 859 EMC Corp268648102 70 000 2 422
2 651 Emerson Electric Co.291011104 42 000 3 053
293 Empire Co. Ltd, classe A291843407 4 300 358
85 Ems-Chemie Holding AG763561909 351 149
186 Enagas SA738307909 7 595 291
5 297 Enbridge inc.29250N105 111 200 5 839
3 541 Encana Corp.292505104 150 800 2 718
96 Endo International plcIE00BJ3V9050 1 300 108
152 Enel Green Power SPAB4TWTW909 68 845 189
1 130 Enel SPA714456902 192 760 1 063
1 120 Enerflex Ltd29269R105 70 600 1 183
155 Energen Corp.29265N108 3 000 204
187 Energizer Holdings inc.29266R108 2 500 371
181 Enerplus Corp.292766102 7 900 117
3 798 ENI SPA714505906 143 189 3 271
8

FONDS DE SOLIDARITÉ DES TRAVAILLEURS DU QUÉBEC (F.T.Q.)Relevé des autres investissements
au 30 novembre 2014
non audité( )
Quantité Coût
Juste
valeurDescription(en milliers $)(en milliers $)
Actions et parts
1 141 Ensco plc, classe AG3157S106 19 800 763
431 Entergy Corp.29364G103 5 200 497
703 EOG Resources inc.26875P101 14 600 1 444
224 EQT Corp.26884L109 4 500 467
627 Equinix inc.29444U502 3 000 777
1 547 Equity Residential29476L107 25 700 2 076
2 553 Ericsson LM, classe B595937905 197 246 2 838
590 Erste Group Bank AGAT0000652011 18 401 569
343 Essex Property Trust inc.297178105 1 700 392
1 840 Essilor International721247906 16 132 2 070
2 421 European Aeronautic Defence and Space Co. NV401225909 36 776 2 562
104 Eutelsat Communications SAFR0012314698 6 028 114
1 251 Everest Re Group LtdBMG3223R1088 7 500 1 500
254 Evertz Technologies Ltd30041N107 14 500 254
1 129 Exelon Corp.30161N101 22 400 924
213 Expedia inc.30212P303 3 200 318
292 Expeditors International of Washington inc.302130109 6 700 358
760 Experian plcB19NLV907 39 654 717
3 730 Express Scripts Holdging Co.30219G108 47 940 4 545
13 269 Exxon Mobil Corp.30231G102 167 800 17 323
1 791 Facebook inc., classe A30303M102 54 876 4 862
670 Fairfax Financial Holdings Ltd303901102 1 400 813
1 864 Family Dollar Stores inc.307000109 26 900 2 425
1 073 FamilyMart Co. Ltd633127006 22 700 955
2 093 Fanuc Corp.635693005 12 800 2 462
602 Fast Retailing Co. Ltd633243902 1 700 706
537 Fastenal Co.311900104 10 000 515
1 526 Federal Realty Investment Trust313747206 12 100 1 830
951 FedEx Corp.31428X106 9 500 1 930
304 Fiat Chrysler Automobiles NVNL0010877643 23 424 334
1 074 Fidelity National Information Services inc.31620M106 22 500 1 570
626 Fifth Third Bancorp316773100 33 500 769
6 512 Financière Sun Life inc.866796105 201 400 8 545
4 962 Finning International inc.318071404 177 400 4 501
125 FireEye inc.31816Q101 3 000 104
610 First Capital Realty inc.31943B100 34 700 650
286 First Pacific Co. LtdBMG348041077 262 000 315
1 723 First Quantum Minerals Ltd335934105 89 000 1 656
612 FirstEnergy Corp.337932107 12 100 509
1 584 Fiserv inc.337738108 29 400 2 397
132 Fission Uranium Corp.33812R109 113 900 108
100 FleetCor Technologies inc.339041105 700 121
173 Fletcher Building Ltd634160907 28 205 207
286 Flextronics International LtdSG9999000020 28 000 354
360 Flowserve Corp.34354P105 4 200 282
468 Fluor Corp.343412102 5 500 389
742 FMC Corp.302491303 12 500 775
568 FMC Technologies inc.30249U101 14 000 762
393 Foncière des RégionsFR0000064578 4 375 477
1 724 Ford Motor Co.345370860 104 200 1 869
907 Fortescue Metals Group Ltd608625901 183 674 525
254 Fortis inc.349553107 7 900 321
9

FONDS DE SOLIDARITÉ DES TRAVAILLEURS DU QUÉBEC (F.T.Q.)Relevé des autres investissements
au 30 novembre 2014
non audité( )
Quantité Coût
Juste
valeurDescription(en milliers $)(en milliers $)
Actions et parts
261 Fortum OYJ557955903 9 210 264
4 393 Franco-Nevada Corp.351858105 81 300 4 651
704 Franklin Resources inc.354613101 13 300 862
3 915 Freeport-McMoRan inc.35671D857 101 800 3 117
3 781 Fresenius Medical Care AG & Co. KGaA512907908 49 957 4 207
727 Fresenius SE & Co. KGaA435209903 16 299 1 008
1 669 Fresnillo plcB2QPKJ909 103 007 1 310
318 Frontier Communications Corp.35906A108 40 400 325
398 Fuchs Petrolub SE435435003 9 176 434
459 Fuji Heavy Industries Ltd635640006 19 700 817
416 FUJIFILM Holgings Corp.635652001 18 900 715
259 Fujitsu Ltd635694003 60 000 391
331 G4S plcGB00B01FLG62 69 138 341
2 141 Galaxy Entertainment Group LtdHK0027032686 248 000 1 930
1 021 Galp Energia SGPS, SAB1FW75903 58 352 813
340 Gas Natural SDG, SA565042900 16 461 533
1 291 GDF SuezB0C2CQ902 37 045 1 043
299 GEA Group AGDE0006602006 5 863 320
465 Geberit AGB1WGG9901 1 808 720
297 Gemalto NV019223973 2 302 224
778 General Dynamics Corp.369550108 9 700 1 608
10 328 General Electric Co.369604103 396 600 11 979
524 General Growth Properties inc.370023103 24 700 754
7 352 General Mills inc.370334104 138 100 8 306
1 359 General Motors Co.37045V100 36 000 1 372
1 461 Genuine Parts Co.372460105 16 700 1 957
1 215 Genworth MI Canada inc.37252B102 36 300 1 499
576 George Weston Ltd961148509 6 900 695
1 992 Gibson Energy inc.374825206 67 200 1 831
3 547 Gilead Sciences inc.375558103 55 200 6 315
5 362 Givaudan SA598061901 3 311 6 748
307 GKN plcGB0030646508 44 632 275
7 247 Glaxosmithkline plc092528900 261 069 6 923
295 Global Logistic Properties LtdSG2C26962630 127 000 291
12 068 Goldcorp inc.380956409 423 200 9 480
470 Golden Agri-Resources Ltd616447900 872 000 351
1 922 Goldman Sachs Group inc.38141G104 11 500 2 471
4 516 Google inc., classe A38259P508 9 500 5 948
3 578 Google inc., classe C38259P706 8 000 4 943
1 718 GPT GroupAU000000GPT8 455 526 1 835
214 Great Canadian Gaming Corp.389914102 12 823 283
1 827 Great-West Lifeco inc.39138C106 57 593 1 951
311 Groupe Canam inc.13710C107 23 300 234
158 GungHo Online Entertainment inc.JP3235900002 17 800 77
2 704 H&R Real Estate Investment Trust404428203 118 900 2 703
526 Hamamatsu Photonics KKJP3771800004 10 600 611
730 Hang Lung Properties Ltd603050006 206 000 706
5 139 Hang Seng Bank Ltd640837001 294 900 5 602
625 Hankyu Hanshin Holdings inc.377420000 104 000 652
211 Hargreaves Lansdown plc030166469 8 278 144
574 Harley-Davidson inc.412822108 10 100 802
436 HCA Holdings inc.40412C101 10 800 858
10

FONDS DE SOLIDARITÉ DES TRAVAILLEURS DU QUÉBEC (F.T.Q.)Relevé des autres investissements
au 30 novembre 2014
non audité( )
Quantité Coût
Juste
valeurDescription(en milliers $)(en milliers $)
Actions et parts
821 HCP inc.40414L109 16 600 848
795 Health Care REIT inc.42217K106 11 300 949
656 Healthscope LtdAU000000HSO1 267 778 680
484 HeidelbergCement AG512067901 7 309 633
511 Heineken Holding NVB0CCH4904 8 441 660
1 152 Heineken NV779255900 18 062 1 624
220 Helmerich & Payne inc.423452101 4 300 341
208 Henderson Land Development Co. LtdHK0012000102 28 000 214
1 782 Henkel AG & Co. KGaA500246905 22 027 2 640
987 Hennes & Mauritz AB, classe B568743900 27 272 1 335
4 225 Henry Schein inc.806407102 30 000 4 693
419 Herbalife LtdG4412G101 7 000 346
332 Hertz Global Holdings inc.42805T105 12 700 344
556 Hess Corp.42809H107 8 800 732
3 092 Hewlett-Packard Co.428236103 107 000 4 766
2 550 High Liner Foods inc.429695109 105 590 2 266
241 Hikari Tsushin inc.6416322 2 800 208
693 Hirose Electric Co. LtdJP3799000009 4 700 678
196 Hitachi Chemical Co. Ltd642912000 13 200 279
300 Hitachi Construction Machinery Co. LtdJP3787000003 14 100 347
161 Hitachi High-Technologies Corp.JP3678800008 6 300 208
1 031 Hitachi Ltd642910004 146 000 1 286
108 Hitachi Metals Ltd642920003 9 000 178
565 HKT Trust and HKT LtdB4TXDZ907 501 700 712
120 Hokuriku Electric Power Co.643312002 8 100 118
1 048 Holcim Ltd711075903 13 891 1 173
196 HollyFrontier Corp.436106108 5 900 275
952 Home Capital Group inc.436913107 28 500 1 486
4 084 Home Depot inc.437076102 50 300 5 701
1 971 Honda Motor Co. Ltd643514003 49 500 1 698
1 995 Honeywell International inc.438516106 23 800 2 689
1 572 Hong Kong & China Gas Co. Ltd643655004 752 040 2 032
657 Hong Kong Exchanges & Clearing Ltd626735906 37 649 935
2 637 Hormel Foods Corp.440452100 51 900 3 141
122 Hospira inc.441060100 1 800 122
656 Host Hotels & Resorts inc.44107P104 35 800 949
1 147 Hoya Corp.644150005 46 200 1 873
149 HRS Holding Ltd3397334 632 153
12 766 HSBC Holdings plc054052907 1 110 409 12 631
4 157 HudBay Minerals inc.443628102 420 800 3 627
416 Humana inc.444859102 5 000 787
7 153 Husky Energy inc.448055103 229 700 5 555
300 Hutchison Post Holdings TrustSG2D00968206 410 000 320
735 Hutchison Whampoa Ltd644806002 67 000 958
439 I.L.F. Ltd, série 01 2008, classe BILF200801 432 218
850 Iberdrola SAB288C9908 115 102 973
202 Ibiden Co. LtdJP3148800000 9 300 158
1 424 IGM Financial inc.449586106 28 500 1 354
112 Iliad SA775943905 950 267
960 Illinois Tool Works inc.452308109 13 200 1 429
499 Illumina inc.452327109 3 800 827
566 Iluka Resources Ltd695757005 46 405 310
11

FONDS DE SOLIDARITÉ DES TRAVAILLEURS DU QUÉBEC (F.T.Q.)Relevé des autres investissements
au 30 novembre 2014
non audité( )
Quantité Coût
Juste
valeurDescription(en milliers $)(en milliers $)
Actions et parts
84 Imerys SAB011GL903 1 352 117
238 IMMOFINANZ AGAT0000809058 57 304 196
322 Imperial Oil Ltd453038408 7 800 387
237 Incitec Pivot Ltd667304901 64 170 178
189 Incyte Corp.US45337C1027 2 300 198
881 Inditex SA711131904 33 760 1 124
1 218 Industrielle Alliance, Assurance et services financiers inc.455871103 29 114 1 380
291 Industrivarden ABSE0000107203 13 616 275
863 Infineon Technologies AGDE0006231004 67 543 757
504 Information Services Corp.45676A105 26 461 505
1 047 Ing Groep NV715418901 108 308 1 814
646 Ingersoll-Rand plcG47791101 10 800 777
312 Ingram Micro inc., classe A457153104 10 200 319
574 Inmarsat plcB09LSH907 46 115 654
663 Inpex Corp.B10RB1904 46 700 564
616 Insurance Australia Group Ltd627102908 107 509 666
6 940 Intact Financial Corp.45823T106 103 200 8 192
382 Integrys Energy Group inc.45822P105 6 100 507
10 449 Intel Corp.458140100 377 900 16 051
5 499 Inter Pipeline Ltd45833V109 190 221 6 205
638 InterContinental Hotels Group plcB85KYF903 19 481 943
622 IntercontinentalExchange Group inc.45866F104 3 359 866
11 638 International Business Machines Corp.459200101 55 500 10 263
580 International Flavors & Fragrances inc.459506101 7 200 831
212 International Paper Co.460146103 7 600 466
715 Intertape Polymer Group inc.460919103 54 900 1 044
1 131 Intertek Group plc316383900 21 069 878
724 Intesa Sanpaolo407683002 372 992 1 314
2 215 Intuit inc.461202103 30 800 3 297
618 Intuitive Surgical inc.46120E602 1 200 708
538 Invesco LtdG491BT108 15 400 709
446 Investec plcGB00B17BBQ50 49 090 519
428 Investment AB Kinnevik, classe BSE0000164626 10 930 433
514 Investor AB, classe B567959903 17 158 736
491 Israel Chemicals Ltd645553900 47 350 369
290 Isuzu Motors LtdJP3137200006 23 000 342
840 Itochu Corp.646780007 62 500 820
437 Itochu Techno-Solutions Corp.JP3143900003 9 500 423
383 ITV plcGB0033986497 104 766 401
416 J Sainsbury plcB019KW907 64 766 270
126 James Hardie Industries plc641297908 17 527 206
304 Japan Exchange Group inc.018949717 10 600 310
940 Japan Prime Realty Investment Corp.JP3040890000 255 1 055
1 494 Japan Real Estate Investment Corp.JP3027680002 261 1 467
1 903 Japan Retail Fund Investment Corp.JP3039710003 798 1 894
318 Jardine Cycle & Carriage LtdSG1B51001017 8 000 298
211 Jazz Pharmaceuticals plcIE00B4Q5ZN47 1 100 222
612 JB Hunt Transport Services inc.445658107 7 800 734
404 Jeronimo Martins SGPS, SAB1Y1SQ901 25 571 297
448 JFE Holdings inc.654379908 15 700 381
308 JGC Corp.JP3667600005 8 000 196
13 743 Johnson & Johnson478160104 146 000 18 021
12

FONDS DE SOLIDARITÉ DES TRAVAILLEURS DU QUÉBEC (F.T.Q.)Relevé des autres investissements
au 30 novembre 2014
non audité( )
Quantité Coût
Juste
valeurDescription(en milliers $)(en milliers $)
Actions et parts
776 Johnson Controls inc.478366107 20 000 1 140
242 Johnson Matthey plcB70FPS903 8 169 485
5 552 JPMorgan Chase & Co.46625H100 98 000 6 723
155 JSR Corp.647098003 7 500 153
273 Juniper Networks inc.48203R104 10 000 253
456 JX Holdings inc.B627LW906 74 000 314
405 K+S AGACI00RQT4 6 761 232
806 Kabel Deutschland Holding AGDE000KD88880 5 197 820
499 Kakaku.com inc.JP3206000006 27 700 482
786 Kamigumi Co. LtdJP3219000001 74 000 761
485 Kansai Electric Power Co. inc.648348001 22 200 254
324 Kansai Paint Co. Ltd648374007 25 000 455
563 Kansas City Southern485170302 5 000 678
1 414 Kao Corp.648380004 41 100 1 735
836 KBC Groep NVBE0003565737 12 401 811
1 264 KDDI Corp.624899902 30 300 2 214
3 567 Kellogg Co.487836108 53 900 4 071
856 Keppel Corp. LtdB1VQ5C905 98 000 772
311 Keppel Land LtdSG1R31002210 105 000 310
1 065 Kering550507909 4 713 1 113
912 Kerry Group plc, classe A451957906 13 462 1 142
215 Kerry Properties LtdBMG524401079 59 000 242
252 Keuring Green Mountain inc.49271M100 3 500 567
1 408 Keyence Corp.649099009 3 700 1 948
10 556 Keyera Corp.493271100 144 835 12 309
83 Kikkoman Corp.649080009 7 000 190
4 629 Kimberly-Clark Corp.494368103 46 200 6 142
1 169 Kinder Morgan inc.49456B101 30 318 1 429
550 Kingfisher plc331952903 99 238 553
2 200 Kinross Gold Corp.496902404 442 000 1 401
507 Kirin Holdings Co. Ltd649374006 35 000 512
572 KLA-Tencor Corp.482480100 7 200 570
386 Kobe Steel Ltd649602000 184 000 334
487 Kohl's Corp.500255104 9 100 619
1 446 Komatsu Ltd649658002 54 100 1 461
889 Kone OYJ, classe BB09M9D905 19 217 1 010
528 Koninklijke Ahold NV525260907 37 277 753
309 Koninklijke Boskalis Westminster NVNL0000852580 5 101 327
497 Koninklijke DSM NV025328825 9 069 682
517 Koninklijke KPN NV595607904 106 426 404
1 679 Koninklijke Philips NV598662906 55 425 1 911
806 Kraft Foods Group inc.50076Q106 18 300 1 256
441 Kroger Co.501044101 17 200 1 174
581 Kubota Corp.649750007 37 000 659
2 515 Kuehne + Nagel International AGB142S6906 18 146 2 794
179 Kuraray Co. Ltd649766003 14 400 200
1 341 Kyocera Corp.649926003 25 900 1 446
669 Kyowa Hakko Kirin Co. LtdJP3256000005 57 000 706
374 Kyushu Electric Power Co. inc.649980000 18 000 210
530 L Brands inc.501797104 10 200 941
30 239 La Banque de Nouvelle-Écosse064149107 487 215 34 349
2 024 Laboratory Corp. of America Holdings50540R409 19 000 2 267
13
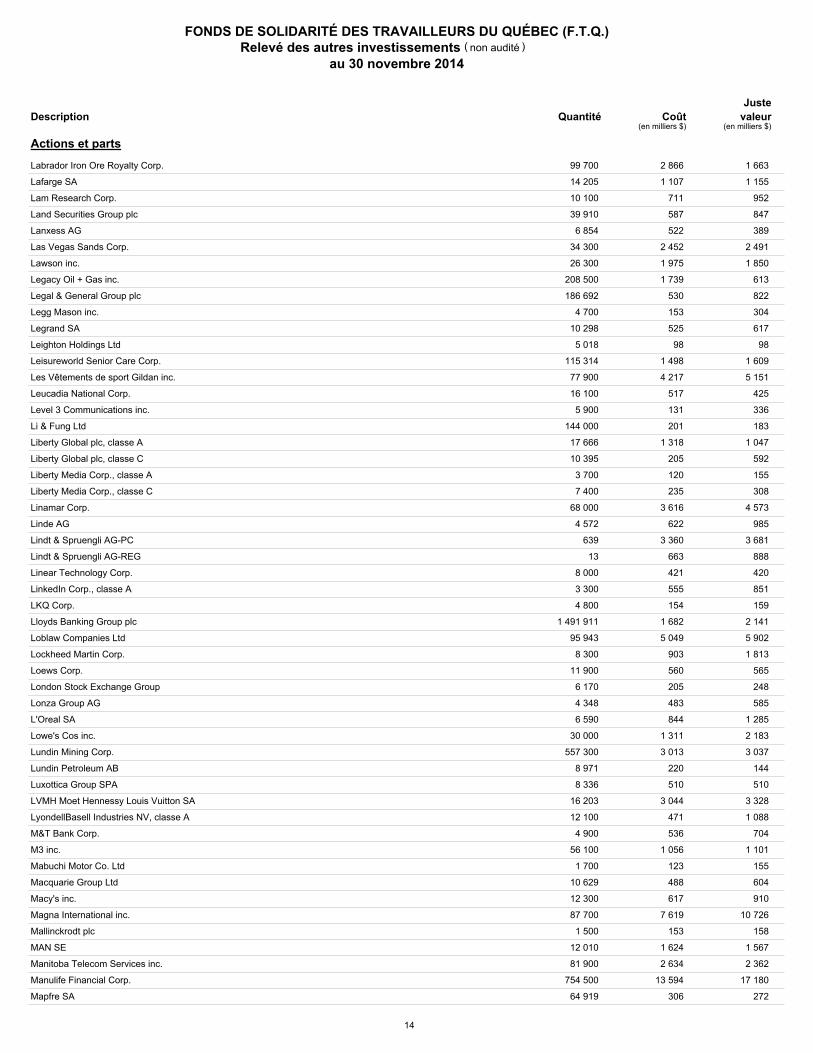
FONDS DE SOLIDARITÉ DES TRAVAILLEURS DU QUÉBEC (F.T.Q.)Relevé des autres investissements
au 30 novembre 2014
non audité( )
Quantité Coût
Juste
valeurDescription(en milliers $)(en milliers $)
Actions et parts
2 866 Labrador Iron Ore Royalty Corp.505440107 99 700 1 663
1 107 Lafarge SA450270004 14 205 1 155
711 Lam Research Corp.512807108 10 100 952
587 Land Securities Group plc318094901 39 910 847
522 Lanxess AGB05M8B904 6 854 389
2 452 Las Vegas Sands Corp.517834107 34 300 2 491
1 975 Lawson inc.626691901 26 300 1 850
1 739 Legacy Oil + Gas inc.524701505 208 500 613
530 Legal & General Group plc056039902 186 692 822
153 Legg Mason inc.524901105 4 700 304
525 Legrand SAB11ZRK906 10 298 617
98 Leighton Holdings LtdAU000000LEI5 5 018 98
1 498 Leisureworld Senior Care Corp.52542T102 115 314 1 609
4 217 Les Vêtements de sport Gildan inc.375916103 77 900 5 151
517 Leucadia National Corp.527288104 16 100 425
131 Level 3 Communications inc.52729N308 5 900 336
201 Li & Fung LtdBMG5485F1692 144 000 183
1 318 Liberty Global plc, classe A530555101 17 666 1 047
205 Liberty Global plc, classe C530555309 10 395 592
120 Liberty Media Corp., classe A531229102 3 700 155
235 Liberty Media Corp., classe C531229300 7 400 308
3 616 Linamar Corp.53278L107 68 000 4 573
622 Linde AG574081907 4 572 985
3 360 Lindt & Spruengli AG-PC596228908 639 3 681
663 Lindt & Spruengli AG-REG596230904 13 888
421 Linear Technology Corp.535678106 8 000 420
555 LinkedIn Corp., classe A53578A108 3 300 851
154 LKQ Corp.501889208 4 800 159
1 682 Lloyds Banking Group plc087061008 1 491 911 2 141
5 049 Loblaw Companies Ltd539481101 95 943 5 902
903 Lockheed Martin Corp.539830109 8 300 1 813
560 Loews Corp.540424108 11 900 565
205 London Stock Exchange GroupGB00B0SWJX34 6 170 248
483 Lonza Group AG733337901 4 348 585
844 L'Oreal SA405780909 6 590 1 285
1 311 Lowe's Cos inc.548661107 30 000 2 183
3 013 Lundin Mining Corp.550372106 557 300 3 037
220 Lundin Petroleum AB718762909 8 971 144
510 Luxottica Group SPAIT0001479374 8 336 510
3 044 LVMH Moet Hennessy Louis Vuitton SA406141903 16 203 3 328
471 LyondellBasell Industries NV, classe AN53745100 12 100 1 088
536 M&T Bank Corp.55261F104 4 900 704
1 056 M3 inc.019947980 56 100 1 101
123 Mabuchi Motor Co. LtdJP3870000001 1 700 155
488 Macquarie Group LtdB28YTC906 10 629 604
617 Macy's inc.55616P104 12 300 910
7 619 Magna International inc.559222401 87 700 10 726
153 Mallinckrodt plcG5785G107 1 500 158
1 624 MAN SEDE0005937007 12 010 1 567
2 634 Manitoba Telecom Services inc.563486109 81 900 2 362
13 594 Manulife Financial Corp.56501R106 754 500 17 180
306 Mapfre SAES0124244E34 64 919 272
14

FONDS DE SOLIDARITÉ DES TRAVAILLEURS DU QUÉBEC (F.T.Q.)Relevé des autres investissements
au 30 novembre 2014
non audité( )
Quantité Coût
Juste
valeurDescription(en milliers $)(en milliers $)
Actions et parts
543 Marathon Oil Corp.565849106 20 100 663
320 Marathon Petroleum Corp.56585A102 8 500 873
506 Marks & Spencer Group plc312748908 67 936 593
727 Marriott International inc., classe A571903202 16 600 1 491
2 134 Marsh & McLennan Cos inc.571748102 46 300 2 988
167 Martin Marietta Materials inc.573284106 1 800 246
693 Marubeni Corp.656946001 94 000 676
448 Marvell Technology Group LtdBMG5876H1051 26 000 425
2 067 MasterCard inc., classe A57636Q104 34 900 3 474
703 Mattel inc.577081102 15 100 543
570 Maxim Integrated Products inc.57772K101 15 800 533
503 Mazda Motor Corp.690030002 23 600 695
3 181 McCormick & Co. inc.579780206 44 100 3 737
10 281 McDonald's Corp.580135101 97 700 10 785
619 McDonald's Holdings Co. Japan LtdJP3750500005 21 000 548
492 McGraw Hill Financial inc.580645109 8 700 927
1 641 McKesson Corp.58155Q103 12 300 2 956
193 MDU Resources Group inc.552690109 6 700 187
1 582 Mead Johnson Nutrition Co.582839106 20 800 2 462
115 MeadWestvaco Corp.583334107 4 600 235
126 Medivation inc.US58501N1019 1 000 132
3 311 Medtronic inc.585055106 58 200 4 902
242 MEG Energy Corp.552704108 6 000 111
407 MEIJI Holdings Co. LtdB60DQV902 6 700 686
8 446 Merck & Co. inc.58933Y105 156 900 10 806
452 Merck KGaADE0006599905 4 814 548
144 Metcash LtdB0744W900 37 869 96
278 Methanex Corp.59151K108 4 100 236
1 216 MetLife inc.59156R108 26 400 1 674
339 Metro AG504141904 5 287 205
471 Metro inc.59162N109 6 800 607
200 Metso OYJFI0009007835 5 602 199
285 Mettler-Toledo International inc.592688105 1 100 368
268 MGM China Holdings LtdKYG607441022 68 400 236
917 MGM Resorts International552953101 33 000 858
521 Michael Kors Holdings LtdVGG607541015 5 800 507
536 Microchip Technology inc.595017104 10 300 530
1 638 Micron Technology inc.595112103 89 600 3 673
9 528 Microsoft Corp.594918104 257 300 14 027
641 Millicom International Cellular SAB00L2M903 6 139 584
99 Minebea Co. LtdJP3906000009 7 000 100
894 Miraca Holdings inc.JP3822000000 18 300 792
550 Mitel Networks Corp.60671Q104 46 600 570
317 Mitsubishi Chemical Holdings Corp.B0JQTJ900 56 000 329
1 019 Mitsubishi Corp.659678007 55 000 1 186
650 Mitsubishi Electric Corp.659704001 65 000 891
977 Mitsubishi Estate Co. Ltd659672000 38 000 975
247 Mitsubishi Gas Chemical Co. inc.659692008 37 000 241
674 Mitsubishi Heavy Industries Ltd659706006 104 000 692
267 Mitsubishi Materials Corp.659708002 74 000 265
295 Mitsubishi Motors Corp.JP3899800001 25 500 299
917 Mitsubishi Tanabe Pharma Corp.JP3469000008 59 100 1 028
15

FONDS DE SOLIDARITÉ DES TRAVAILLEURS DU QUÉBEC (F.T.Q.)Relevé des autres investissements
au 30 novembre 2014
non audité( )
Quantité Coût
Juste
valeurDescription(en milliers $)(en milliers $)
Actions et parts
2 211 Mitsubishi UFJ Financial Group633517909 359 200 2 369
789 Mitsui & Co. Ltd659730006 58 900 927
787 Mitsui Fudosan Co. Ltd659760003 27 000 890
296 Mizrahi Tefahot Bank LtdIL0006954379 20 143 243
1 348 Mizuho Financial Group inc.659101901 673 900 1 324
701 Molson Coors Brewing Co., classe B60871R209 11 300 997
6 808 Mondelez International inc., classe A609207105 189 219 8 457
287 Monster Beverage Corp.611740101 5 600 716
498 Moody's Corp.615369105 7 300 841
1 096 Morgan Stanley617446448 40 500 1 625
3 233 Motorola Solutions inc.620076307 46 700 3 500
535 MS&AD Insurance Group Holdings inc.B2Q4CS905 20 300 540
2 020 MTR Corp. LtdHK0066009694 493 000 2 258
965 Muenchener Rueckver AG529412900 4 996 1 174
6 527 Mullen Group Ltd625284104 232 737 5 232
1 508 Murata Manufacturing Co. Ltd661040006 17 000 2 094
727 Murphy Oil Corp.626717102 10 999 608
493 Mylan inc.628530107 12 100 809
210 Nabors Industries LtdG6359F103 8 200 123
816 Nagoya Railroad Co. LtdJP3649800004 211 000 932
1 986 National Australia Bank Ltd662460005 66 661 2 115
3 054 National Grid plcB08SNH908 245 922 4 084
534 National Oilwell Varco inc.637071101 11 200 856
341 Nec Corp.JP3733000008 101 000 362
180 Neste Oil OYJB06YV4907 6 262 170
21 293 Nestlé SA712387901 301 608 25 896
514 NetApp inc.64110D104 13 200 640
372 Netflix inc.64110L106 1 600 632
1 072 New Gold inc.644535106 189 000 861
469 New World Development Co. LtdHK0017000149 394 000 536
625 Newalta Corp.65020P103 29 200 550
2 574 Newcrest Mining Ltd663710002 210 468 2 118
5 469 Newmont Mining Corp.651639106 193 700 4 064
21 News Corp., classe A65249B109 1 275 23
72 Nexon Co. Ltd070973251 7 900 85
829 Next plc320898901 9 879 1 195
3 501 NextEra Energy inc.65339F101 40 600 4 832
135 NGK SPARK PLUG Co. LtdJP3738600000 4 000 137
935 NICE Sytems LtdIL0002730112 19 494 1 054
717 Nidec Corp.JP3734800000 12 400 938
454 Nielsen Holdings NVN63218106 12 900 614
1 512 NIKE inc., classe B654106103 22 100 2 502
291 Nikon Corp.654111103 16 300 265
376 Nintendo Co. Ltd663955003 3 600 476
1 978 Nippon Building Fund inc.JP3027670003 329 1 890
176 Nippon Electric Glass Co. LtdJP3733400000 31 000 162
258 Nippon Meat Packers inc.664076007 15 000 343
1 145 Nippon Prologis REIT inc.JP3047550003 498 1 238
673 Nippon Steel & Sumitomo Metal Corp.664256005 221 000 649
2 877 Nippon Telegraph and Telephone Corp.664137007 52 300 3 191
192 NiSource inc.65473P105 9 000 429
939 Nissan Motor Co. Ltd664286002 83 200 886
16

FONDS DE SOLIDARITÉ DES TRAVAILLEURS DU QUÉBEC (F.T.Q.)Relevé des autres investissements
au 30 novembre 2014
non audité( )
Quantité Coût
Juste
valeurDescription(en milliers $)(en milliers $)
Actions et parts
92 Nisshin Seifun Group inc.664096005 9 680 109
1 486 Nissin Foods Holdings Co. Ltd664176005 30 400 1 737
992 Nitori Co. LtdJP3756100008 20 600 1 302
499 Nitto Denko Corp.664180007 10 700 644
633 Noble Corp.H5833N103 19 200 394
376 Noble Energy inc.655044105 9 900 555
151 NOK Corp.JP3164800009 8 400 240
1 263 Nokia OYJ590294906 243 517 2 315
247 Nokian Renkaat OYJFI0009005318 5 482 177
1 040 Nomura Holdings inc.664310000 134 200 921
1 302 Nomura Research Institute LtdJP3762800005 36 900 1 312
3 869 Norbord inc.65548P403 146 800 3 390
1 105 Nordea Bank AB538003906 85 907 1 226
725 Norfolk Southern Corp.655844108 9 100 1 158
245 Norsk Hydro ASAB11HK3901 36 835 246
217 North American Energy Partners inc.656844107 25 400 130
480 Northeast Utilities664397106 12 800 739
531 Northern Trust Corp.665859104 8 800 680
2 565 Northland Power inc.666511100 143 000 2 398
672 Northrop Grumman Corp.666807102 7 900 1 269
10 036 Novartis AG710306903 122 406 13 545
1 438 Novion Property GroupAU000000NVN5 734 224 1 522
2 816 Novo Nordisk AS, classe B707752903 79 908 4 166
460 Novozymes AS, classe BB798FW902 13 251 666
272 NRG Energy inc.629377508 10 100 360
168 NTT Data Corp.JP3165700000 3 900 170
4 860 NTT DOCOMO inc.612927905 282 700 5 028
423 Nucor Corp.670346105 9 400 575
423 NuVista Energy Ltd67072Q104 40 700 338
657 NVIDIA Corp.67066G104 32 300 772
1 609 Occidental Petroleum Corp.674599105 20 300 1 846
364 Oceaneering International inc.675232102 6 099 436
291 OCI NVNL0010558797 5 802 238
542 Odakyu Electric Railway Co. Ltd665610002 53 000 553
564 OGE Energy Corp.670837103 14 800 602
167 Oji Holdings Corp.665770004 33 000 132
1 916 Old Mutual plcB77J08909 550 320 1 969
1 457 Omnicare inc.681904108 18 600 1 491
608 Omnicom Group inc.681919106 9 500 837
606 OMV AG465145001 11 996 396
197 Oneok inc.682680103 6 700 414
1 692 Onex Corp.68272K103 31 700 2 057
97 Ono Pharmaceutical Co. LtdJP3197600004 1 100 107
1 823 Open Text Corp.683715106 37 800 2 559
3 493 Oracle Corp.68389X105 99 400 4 807
685 Oracle Corp. JapanJP3689500001 13 800 594
1 244 Orange SA517617908 53 896 1 085
1 810 O'Reilly Automotive inc.67103H107 13 000 2 709
247 Orica Ltd645800004 11 478 203
3 337 Oriental Land Co. Ltd664889904 20 900 5 186
497 Origin Energy Ltd621486901 38 206 455
605 Orix Corp.666114004 42 800 644
17

FONDS DE SOLIDARITÉ DES TRAVAILLEURS DU QUÉBEC (F.T.Q.)Relevé des autres investissements
au 30 novembre 2014
non audité( )
Quantité Coût
Juste
valeurDescription(en milliers $)(en milliers $)
Actions et parts
262 Orkla ASAB1VQF4902 31 026 264
1 371 Osaka Gas Co. Ltd666176003 333 000 1 452
300 Osram Licht AGDE000LED4000 6 159 293
732 Otsuka Corp.JP3188200004 15 300 600
3 016 Otsuka Holdings Co. LtdB5LTM9909 90 800 3 273
4 648 Oversea-Chinese Banking Corp.B0F9V2906 566 447 5 193
95 Owens-Illinois inc.690768403 3 500 102
648 PACCAR inc.693718108 11 700 894
455 Pacific Rubiales Energy Corp.69480U206 22 200 245
296 Pall Corp.696429307 3 000 329
135 Palo Alto Networks inc.US6974351057 1 000 140
512 Panasonic Corp.657270005 63 700 938
156 Pandora ASDK0060252690 1 953 198
621 Park24 Co. Ltd007429126 29 500 510
536 Parker Hannifin Corp.701094104 5 200 765
2 048 Parkland Fuel Corp.70137T105 100 459 2 145
682 PartnerRe LtdBMG6852T1053 6 000 797
1 321 Partners Group Holding AGCH0024608827 4 274 1 404
1 339 Patterson Cos inc.703395103 28 100 1 544
4 602 Paychex inc.704326107 102 800 5 557
422 PCCW Ltd657407904 760 395 581
570 Pearson plc067760009 29 467 648
9 439 Pembina Pipeline Corp.706327103 243 659 9 493
1 050 Pengrowth Energy Corp.70706P104 153 200 570
332 Penn West Petroleum Ltd707887105 19 300 79
475 Pentair LtdH6169Q108 7 900 583
1 385 People's United Financial inc.712704105 84 600 1 426
178 Pepco Holdings inc.713291102 9 100 285
9 076 Pepsico inc.713448108 114 700 13 092
2 022 Pernod Ricard SA468232004 17 899 2 425
1 033 Perrigo Co.714290103 7 582 1 385
612 Petrofac LtdB0H2K5904 27 044 399
828 PetSmart inc.716768106 10 900 979
175 Peugeot SAFR0000121501 11 356 166
4 499 Peyto Exploration & Development Corp.717046106 127 800 4 291
9 802 Pfizer inc.717081103 336 400 11 949
2 862 PG&E Corp.69331C108 62 300 3 587
301 Pharmacyclics inc.716933106 2 100 334
502 Phillips 66718546104 15 300 1 274
375 PHX Energy Services Corp.69338U101 22 700 226
188 Pinnacle West Capital Corp.723484101 4 300 310
265 Pioneer Natural Resources Co.723787107 3 800 621
302 Pirelli & C. SPAIT0004623051 17 243 280
1 135 PNC Financial Services Group693475105 15 300 1 526
558 Porsche Automobil Holding SE710106907 6 592 657
50 319 Portefeuille de deux fonds d'infrastructures privésCITI5 2 54 141
3 842 Potash Corp. of Saskatchewan inc.73755L107 93 860 3 690
2 158 Power Assets Holdings Ltd643532005 243 000 2 646
2 069 Power Corp. of Canada739239101 71 000 2 303
666 Power Financial Corp.73927C100 18 900 676
309 PPG Industries inc.693506107 3 800 948
1 853 PPL Corp.69351T106 54 600 2 212
18

FONDS DE SOLIDARITÉ DES TRAVAILLEURS DU QUÉBEC (F.T.Q.)Relevé des autres investissements
au 30 novembre 2014
non audité( )
Quantité Coût
Juste
valeurDescription(en milliers $)(en milliers $)
Actions et parts
776 PrairieSky Royalty Ltd739721108 20 700 712
5 770 Praxair inc.74005P104 44 400 6 500
1 016 Precision Castparts Corp.740189105 4 600 1 248
1 242 Priceline.com inc.741503403 1 500 1 984
303 Primero Mining Corp.74164W106 62 000 292
534 Principal Financial Group inc.74251V102 13 600 826
2 133 Progressive Waste Solutions Ltd74339G101 80 600 2 804
827 Prologis inc.74340W103 19 800 955
130 ProMetic Sciences de la vie inc.74342Q104 115 600 240
926 Prudential Financial inc.744320102 12 900 1 250
1 300 Prudential plc070995006 73 530 2 033
299 Prysmian SPAIT0004176001 10 838 223
991 Public Service Enterprise Group inc.744573106 27 300 1 300
2 894 Public Storage74460D109 16 200 3 466
642 Publicis Groupe SA438042905 8 741 734
580 QBE Insurance Group Ltd671574002 36 693 388
232 QEP Resources inc.74733V100 7 200 168
18 295 QUALCOMM inc.747525103 227 400 18 902
852 Quebecor inc., classe B748193208 34 000 1 054
1 342 Quest Diagnostics inc.74834L100 21 000 1 564
178 Rackspace Hosting inc.750086100 4 700 246
257 Raiffeisen Bank InternationalAT0000606306 7 073 167
315 Rakuten inc.39672000 22 800 350
501 Ralph Lauren Corp.751212101 2 800 590
449 Ramsay Health Care LtdAU000000RHC8 9 383 494
3 446 Randgold Resources LtdB01C3S908 41 100 3 122
1 829 Range Resources Corp.75281A109 20 600 1 542
693 Raytheon Co.755111507 10 100 1 229
4 960 Reckitt Benckiser Group plcB24CGK904 64 774 6 078
321 Recruit Holdings Co. LtdJP3970300004 8 564 321
234 Red Electrica Corp. SA572377901 4 362 457
410 Red Hat inc.756577102 6 700 475
776 Reed Elsevier plcB2B0DG904 65 921 1 310
590 Regeneron Pharmaceuticals inc.75886F107 2 400 1 139
536 Regions Financial Corp.7591EP100 56 700 651
1 193 Reitmans (Canada) Limitée, classe A759404205 194 827 1 157
293 Rémy Cointreau SA474171006 3 265 281
1 654 RenaissanceRe Holdings LtdBMG7496G1033 15 400 1 719
522 Renault SA471279901 6 558 601
643 Repsol SA566935904 26 285 674
1 959 Republic Services inc.760759100 47 300 2 137
457 Resona Holdings inc.642155907 97 100 598
480 Restoration Hardware Holdings inc.761283100 5 000 482
500 Rexam plcGB00BMHTPY25 56 144 453
2 128 Rio Tinto Ltd622010007 33 262 1 913
5 558 Rio Tinto plc071887004 97 074 5 188
4 558 RioCan Real Estate Investment Trust766910103 167 900 4 584
7 912 Roche Holding AG711038901 29 139 9 980
125 Rock Tenn Co., classe A772739207 3 400 220
509 Rockwell Automation inc.773903109 5 600 737
212 Rockwell Collins inc.774341101 2 600 254
7 993 Rogers Communications inc., classe B775109200 173 700 7 950
19

FONDS DE SOLIDARITÉ DES TRAVAILLEURS DU QUÉBEC (F.T.Q.)Relevé des autres investissements
au 30 novembre 2014
non audité( )
Quantité Coût
Juste
valeurDescription(en milliers $)(en milliers $)
Actions et parts
226 Rohm Co. LtdJP3982800009 4 600 339
1 030 Rolls-Royce Holdings plcB63H84900 55 155 830
16 Rolls-Royce Holdings plc, classe CGB00BQ1JYL65 9 525 330 17
501 Roper Industries inc.776696106 3 900 702
1 096 Ross Stores inc.778296103 16 100 1 679
363 Royal Bank of Scotland GroupB7T772907 67 923 479
18 005 Royal Dutch Shell plc, classe BB03MM4906 495 634 19 110
202 RSA Insurance Group plcGB00BKKMKR23 23 000 192
183 Russel Metals inc.781903604 6 400 191
920 RWE AG476896907 12 997 538
642 Ryman Healtcare LtdNZRYME0001S4 77 539 556
3 962 SABMiller plc048354906 86 418 5 500
307 Safeway inc.786514208 9 900 393
596 Safran SAB058TZ909 10 848 802
725 Saipem SPA476876008 22 825 374
754 Salesforce.com inc.79466L302 17 500 1 195
150 Salix Pharmaceuticals LtdUS7954351067 1 300 152
531 Sampo OYJ, classe A522603901 12 567 709
1 415 SanDisk Corp.80004C101 20 400 2 407
1 824 Sands China LtdB5B23W909 264 400 1 806
1 024 Sandvik ABB1VQ25903 69 687 834
294 Sandvine Corp.800213100 85 500 246
831 Sankyo Co. LtdJP3326410002 18 000 661
3 635 Sanofi567173901 33 042 3 657
938 Santen Pharmaceutical Co. LtdJP3336000009 19 100 1 218
491 Santos Ltd677670002 38 938 383
2 136 SAP SE484628904 27 467 2 210
2 507 Saputo inc.802912105 92 400 3 062
1 940 SBA Communications Corp., classe A78388J106 19 400 2 691
986 SCANA Corp.80589M102 19 100 1 242
1 696 Scentre GroupAU000000SCG8 509 659 1 721
1 081 Schindler Holding AGCH0024638212 6 654 1 063
396 Schindler Holding AG - part. cert.B11TCY906 2 646 432
6 466 Schlumberger Ltd806857108 78 500 7 693
2 851 Schneider Electric SA483410007 32 810 3 059
1 015 Seadrill LtdB09RMQ900 30 725 502
480 Seagate Technology plcG7945M107 10 700 807
102 Sealed Air Corp.81211K100 4 600 207
2 570 Secom Co. Ltd679159004 43 700 2 882
773 Secure Energy Services inc.81373C102 52 000 886
6 Securitas AB, classe BSE0000163594 500 7
266 Seek LtdAU000000SEK6 15 677 261
123 Seiko Epson Corp.JP3414750004 2 300 127
599 SEMAFO inc.816922108 126 900 418
1 271 Sempra Energy816851109 15 900 2 026
294 ServiceNow inc.81762P102 5 300 387
2 040 SES SAB00ZQQ907 56 071 2 385
717 Seven & I Holdings Co. LtdB0FS5D909 24 200 1 029
486 Seven Bank LtdJP3105220002 112 300 556
234 Severn Trent plcB1FH8J905 9 301 339
3 196 SGS SA482477007 1 228 3 037
297 Shangri-La Asia LtdBMG8063F1639 192 000 265
20

FONDS DE SOLIDARITÉ DES TRAVAILLEURS DU QUÉBEC (F.T.Q.)Relevé des autres investissements
au 30 novembre 2014
non audité( )
Quantité Coût
Juste
valeurDescription(en milliers $)(en milliers $)
Actions et parts
431 Sharp Corp.335960000 121 000 329
3 183 Shaw Communications inc., classe B82028K200 132 200 4 081
1 099 ShawCor Ltd820439107 20 000 942
220 Shikoku Electric Power Co. inc.680434008 7 600 108
323 Shimadzu Corp.JP3357200009 33 000 372
701 Shimamura Co. LtdJP3358200008 7 400 706
438 Shimano inc.JP3358000002 3 700 573
669 Shin-Etsu Chemical Co. Ltd680458007 12 100 929
601 Shire plcB2QKY0906 17 585 1 431
408 Shiseido Co. Ltd680526001 22 000 375
146 Showa Shell Sekiyu KK680554003 12 400 118
4 934 Siemens AG572797900 41 698 5 654
219 Sigma-Aldrich Corp.826552101 3 800 592
372 Sika AG480808906 148 644
3 927 Silver Wheaton Corp.828336107 156 500 3 533
2 053 Simon Property Group inc.828806109 12 700 2 618
294 Singapore Airlines LtdSG1V61937297 32 000 302
1 995 Singapore Press Holdings LtdSG1P66918738 541 000 2 030
909 Singapore Technologies Engineering LtdSG1F60858221 271 000 799
4 526 Singapore Telecommunications LtdB02PY2901 1 487 000 5 073
373 SJM Holdings LtdHK0880043028 120 000 272
536 Skandinaviska Enskilda Banken AB, classe A481334902 49 422 746
663 SKF AB, classe BB1Q3J3907 26 049 613
2 180 Sky plc014119903 142 203 2 367
1 179 Skyworks Solutions inc.US83088M1027 16 000 1 231
705 SMC Corp.676396005 3 300 1 034
1 665 Smith & Nephew plc092232909 104 055 2 063
557 Smiths Group plcB1WY23900 25 427 525
282 Snam SPA725147904 57 055 346
621 Société BIC SAFR0000120966 4 278 652
1 687 Société de Diamant Stornoway86222Q806 2 409 928 1 253
836 Société Financière Manuvie56501R122 38 900 886
898 Société Générale596651901 21 763 1 234
760 Sodexo706271905 8 621 994
750 Softbank Corp.677062903 25 800 1 974
561 Solvay SA482110004 4 074 640
364 Sompo Japan Nipponkoa Holdings inc.B62G7K908 15 200 430
1 042 Sonic Healthcare LtdAU000000SHL7 58 513 994
562 Sonova Holding AGCH0012549785 3 455 598
728 Sony Corp.682150008 35 000 874
385 Southwestern Energy Co.845467109 11 000 404
161 Spark New Zealand Ltd012285353 79 751 218
3 189 Spectra Energy Corp.847560109 88 300 3 814
184 Sprint Corp.85207U105 28 108 164
2 346 SSE plc079087003 89 885 2 632
451 St. Jude Medical inc.790849103 10 100 783
4 302 Standard Chartered plc040828907 180 062 3 013
583 Standard Life plcB16KPT907 94 209 713
393 Stanley Black & Decker inc.854502101 4 800 517
180 Stanley Electric Co. LtdJP3399400005 7 400 183
1 343 Stantec inc.85472N109 49 800 1 653
151 Staples inc.855030102 12 400 199
21

FONDS DE SOLIDARITÉ DES TRAVAILLEURS DU QUÉBEC (F.T.Q.)Relevé des autres investissements
au 30 novembre 2014
non audité( )
Quantité Coût
Juste
valeurDescription(en milliers $)(en milliers $)
Actions et parts
2 338 Starbucks Corp.855244109 35 800 3 315
922 StarHub LtdB1CNDB906 266 000 964
711 Starwood Hotels & Resorts Worldwide inc.85590A401 10 000 901
890 State Street Corp.857477103 12 900 1 129
2 986 Statoil ASA713360907 103 100 2 224
2 632 Stericycle inc.858912108 21 900 3 220
1 503 StocklandAU000000SGP0 389 823 1 563
137 Stora Enso OYJ, classe R507267904 12 969 131
728 Stryker Corp.863667101 10 400 1 102
764 Stuart Olson inc.863834107 74 632 529
208 Subsea 7 SA525824900 8 955 102
215 Suez Environnement Co.B3B8D0900 11 008 223
303 Sulzer AGCH0038388911 2 004 256
321 Sumitomo Chemical Co. Ltd685856007 63 000 272
796 Sumitomo Corp.685894008 59 500 724
425 Sumitomo Electric Industries Ltd685870008 33 400 495
298 Sumitomo Metal Mining Co. Ltd685884009 21 000 367
1 531 Sumitomo Mitsui Financial Group inc.656302908 36 800 1 582
534 Sumitomo Mitsui Trust Holdings inc.643189905 122 000 578
560 Sumitomo Realty & Development Co. Ltd685890006 14 000 551
1 617 Sun Hung Kai Properties Ltd685992000 112 364 1 874
9 305 Suncor Energy inc.867224107 292 500 10 563
796 Suncorp Group Ltd658508007 62 707 875
1 960 Suntory Beverage & Food LtdJP3336560002 48 594 1 957
613 SunTrust Banks inc.867914103 18 400 824
202 Superior Energy Services inc.868157108 6 600 145
3 049 Superior Plus Corp.86828P103 219 350 2 818
709 Suzuken Co. LtdJP3398000004 16 900 494
756 Suzuki Motor Corp.686550005 29 400 1 059
292 Svenska Cellulosa AB SCA, classe BB1VVGZ901 18 267 492
750 Svenska Handelsbanken AB, classe A570366906 16 704 932
695 Swedbank AB, classe A484652904 27 853 835
718 Swire Pacific Ltd, classe A686774001 55 000 862
1 674 Swiss Prime Site AGB083BH906 21 000 1 851
702 Swiss Re AGACI00MQT5 10 435 1 020
5 578 Swisscom AG553397902 8 636 5 994
265 Sydney AirportAU000000SYD9 59 691 258
521 Symantec Corp.871503108 22 500 669
101 Symrise AGDE000SYM9999 1 465 100
5 484 Syngenta AG435664909 14 319 5 393
2 236 Synopsys inc.871607107 52 300 2 588
1 994 Sysco Corp.871829107 52 700 2 419
698 T. Rowe Price Group inc.74144T108 8 900 847
101 Taiheiyo Cement Corp.666020003 48 000 172
352 Taisei Corp.JP3443600006 73 000 435
4 871 Takeda Pharmaceutical Co. Ltd687044008 99 200 4 739
7 649 Talisman Energy inc.87425E103 646 000 3 521
571 Tamarack Valley Energy Ltd87505Y409 87 600 280
3 684 Target Corp.87612E106 53 200 4 489
210 Tate & Lyle plc087541009 19 077 206
254 TDC AS569879901 30 723 285
287 TDK Corp.JP3538800008 6 200 426
22

FONDS DE SOLIDARITÉ DES TRAVAILLEURS DU QUÉBEC (F.T.Q.)Relevé des autres investissements
au 30 novembre 2014
non audité( )
Quantité Coût
Juste
valeurDescription(en milliers $)(en milliers $)
Actions et parts
627 TE Connectivity LtdH84989104 13 600 996
576 Technip SA487416901 6 378 474
8 195 Teck Resources Ltd, classe B878742204 294 900 5 202
193 Tekmira Pharmaceuticals Corp.87911B209 8 100 141
219 Tele2 AB, classe BB97C73904 12 606 186
817 Telecom Italia SPA763439908 520 950 600
5 644 Telefonica SAES0678430986 575 020 5 415
2 533 Telenor ASA473249902 111 353 2 685
437 TeliaSonera AB597838903 59 968 489
5 553 Telstra Corp. Ltd608728903 1 116 739 6 184
16 161 Telus Corp.87971M103 418 750 18 123
758 Tenaris SA753851906 36 897 698
231 Terna - Rete Elettrica Nazionale SPAB01BN5908 58 963 326
1 636 Tesco plc088470000 248 686 828
459 Tesla Motors inc.88160T101 2 400 669
314 Tesoro Corp.881609101 4 900 428
1 991 Teva Pharmaceutical Industries Ltd688217900 44 888 2 910
4 995 Texas Instruments inc.882508104 108 900 6 758
374 Textron inc.883203101 9 700 479
347 The ADT Corp.00101J106 8 300 331
1 045 The Bank of New York Mellon Corp.064058100 33 300 1 520
4 492 The Boeing Co.097023105 39 700 6 082
694 The Charles Schwab Corp.808513105 33 700 1 088
461 The Dai-ichi Life Insurance Co. LtdB601QS905 32 000 529
1 419 The Estée Lauder Cos. inc., classe A518439104 24 100 2 037
374 The Gap inc.364760108 9 000 406
527 The Hartford Financial Services Group inc.416515104 16 600 782
3 308 The Hershey Co.427866108 33 400 3 820
1 693 The J.M. Smucker Co.832696405 17 700 2 070
2 920 The Link Real Estate Investment TrustHK0823032773 538 500 3 912
203 The Macerich Co.554382101 2 300 207
1 196 The Mosaic Co.61945C103 21 028 1 097
2 682 The North West Co. inc.663278109 111 130 2 717
19 010 The Procter & Gamble Co.742718109 238 900 24 634
546 The Progressive Corp.743315103 20 900 649
1 682 The Sherwin-Williams Co.824348106 9 700 2 708
5 852 The Southern Co.842587107 127 200 6 880
324 The Swatch Group AGCH0012255144 2 547 268
1 192 The Swatch Group AG - BR718472905 2 001 1 131
2 393 The Travelers Cos. inc.89417E109 26 800 3 192
3 535 The Walt Disney Co.254687106 51 600 5 443
738 The Weir Group plcGB0009465807 16 019 537
388 The Western Union Co.959802109 20 800 441
1 126 Thermo Fisher Scientific inc.883556102 12 300 1 813
8 046 Thomson Reuters Corp.884903105 216 400 9 867
479 ThyssenKrupp AG563692904 15 146 455
265 Tim Hortons inc.88706M103 2 900 276
781 Time Warner Cable inc.88732J207 7 900 1 345
1 366 Time Warner inc.887317303 23 900 2 320
3 678 TJX Cos. inc.872540109 61 500 4 639
134 T-Mobile US inc.872590104 5 600 186
1 408 Tobu Railway Co. Ltd689516003 262 000 1 346
23

FONDS DE SOLIDARITÉ DES TRAVAILLEURS DU QUÉBEC (F.T.Q.)Relevé des autres investissements
au 30 novembre 2014
non audité( )
Quantité Coût
Juste
valeurDescription(en milliers $)(en milliers $)
Actions et parts
618 Toho Co. LtdJP3598600009 27 900 709
391 Tohoku Electric Power Co. inc.689526002 18 900 250
704 Tokio Marine Holdings inc.651312902 22 700 846
858 Tokyo Electric Power Co. inc.689540003 38 000 158
720 Tokyo Electron Ltd689567006 13 300 1 033
867 Tokyo Gas Co. Ltd689544005 170 000 1 058
1 191 TonenGeneral Sekiyu KK636600009 120 000 1 145
990 Toray Industries inc.689714004 133 000 1 193
703 Toshiba Corp.689721009 142 000 720
1 288 Tourmaline Oil Corp.89156V106 38 000 1 444
109 Toyo Seikan Group Holdings Ltd690026000 6 600 91
816 Toyo Suisan Kaisha Ltd689996007 25 000 966
4 689 Toyota Motor Corp.690064001 76 100 5 347
180 Tractor Supply Company892356106 2 100 184
5 813 TransCanada Corp.89353D107 122 400 6 665
1 076 Transocean LtdB5W3ND904 18 048 437
4 343 Transurban Group620088906 599 640 4 849
137 Treasury Wine Estates LtdB61JC6908 26 447 122
220 Trend Micro inc.JP3637300009 6 500 225
107 Trimble Navigation Ltd896239100 2 500 80
1 712 Trinidad Drilling Ltd896356102 151 800 918
251 TripAdvisor inc.896945201 3 300 277
117 TRW Automotive Holdings Corp.87264S106 1 000 118
1 592 Tullow Oil plc015008907 107 668 819
263 Turquoise Hill Ressources Ltd900435108 68 324 254
1 916 Twenty-First Century Fox inc., classe B90130A200 57 700 2 326
309 Twitter inc.90184L102 6 500 309
683 Tyco International plcH89128104 19 500 954
158 Tyson Foods inc., classe A902494103 9 300 449
179 UBI Banca - Unione di Banche Italiane ScpaIT0003487029 17 834 157
1 760 UBS Group AGCH0244767585 97 862 2 009
159 UCB SABE0003739530 1 805 162
241 Ulta Salon, Cosmetics & Fragrance, inc.90384S303 2 400 346
183 Umicore SA400500005 4 590 213
171 Under Armour inc., classe A904311107 3 100 256
987 Unibail-Rodamco SE707624904 3 926 1 186
915 Unicharm Corp.691148001 51 900 1 355
711 UniCredit SPAACI01A0K7 120 136 1 015
4 737 Unilever NVNL0010866604 243 719 5 725
6 417 Unilever plcB10RZP905 151 372 7 315
3 890 Union Pacific Corp.907818108 42 100 5 605
931 Uni-Select inc.90457D100 32 700 948
137 United Continental Holdings inc.910047109 3 100 216
1 439 United Overseas Bank Ltd691678007 80 740 1 695
4 678 United Parcel Service inc., classe B911312106 48 800 6 117
2 296 United Technologies Corp.913017109 23 300 2 925
1 497 United Urban Investment Corp.JP3045540006 885 1 622
328 United Utilities Group plcB39J2M903 26 792 433
3 888 UnitedHealth Group inc.91324P102 53 500 6 016
204 UPM-Kymmene OYJ505125906 12 461 236
3 584 US Bancorp902973304 92 700 4 672
1 077 USS Co. LtdJP3944130008 69 800 1 149
24

FONDS DE SOLIDARITÉ DES TRAVAILLEURS DU QUÉBEC (F.T.Q.)Relevé des autres investissements
au 30 novembre 2014
non audité( )
Quantité Coût
Juste
valeurDescription(en milliers $)(en milliers $)
Actions et parts
3 810 Valeant Pharmaceuticals International inc.91911K102 33 600 5 591
471 Valeo SAFR0000130338 3 100 436
587 Valero Energy Corp.91913Y100 15 400 854
317 Vallourec SAFR0000120354 5 281 200
1 454 Varian Medical Systems inc.92220P105 14 500 1 463
1 478 Ventas inc.92276F100 20 200 1 648
333 Veolia Environnement403187909 15 969 333
3 571 Veresen inc.92340R106 214 300 3 834
1 213 Verisk Analytics inc., classe A92345Y106 19 000 1 343
13 470 Verizon Communications inc.92343V104 289 295 16 689
4 351 Vermilion Energy inc.923725105 66 000 3 516
563 Vertex Pharmaceuticals inc.92532F100 7 000 941
292 Vestas Wind Systems ASDK0010268606 5 044 212
2 067 VF Corp.918204108 29 200 2 503
900 Viacom inc., classe B92553P201 13 200 1 138
195 Vienna Insurance GroupAT0000908504 3 587 204
968 Vinci SAB1XH02900 18 119 1 120
4 526 Visa inc., classe A92826C839 23 200 6 830
822 Vivendi SA483477907 36 405 1 060
7 219 Vodafone Group plcB16GWD903 1 779 660 7 435
161 Voestalpine AG494340904 4 334 206
1 149 Volkswagen AG549716900 5 122 1 347
1 415 Volvo AB, classe BB1QH83908 89 092 1 114
699 Vornado Realty Trust929042109 8 400 1 069
206 Vulcan Materials Co.929160109 3 800 286
930 Walgreen Co.931422109 24 500 1 917
557 Wartsila OYJ Abp452518905 11 244 576
1 420 Waste Management inc.94106L109 32 100 1 784
287 Waters Corp.941848103 2 400 317
914 Weatherford International plcH27013103 45 500 679
5 427 Wells Fargo & Co.949746101 129 000 8 013
1 315 Wesfarmers Ltd694883000 39 133 1 577
1 709 West Fraser Timber Co. Ltd952845105 29 500 1 751
1 912 West Japan Railway Co.JP3659000008 42 100 2 292
1 302 Western Digital Corp.958102105 16 999 2 001
1 603 Western Forest Products inc.958211203 630 447 1 538
1 472 Westfield Corp.AU000000WFD0 212 074 1 711
6 241 Westjet Airlines Ltd960410207 239 500 7 723
2 532 Westpac Banking Corp.607614005 87 638 2 776
1 918 Westshore Terminals Investment Corp.96145A200 60 000 2 020
641 Weyerhaeuser Co.962166104 20 665 832
199 WH Group LtdKYG960071028 261 854 177
925 Wharf Holdings Ltd643557002 106 000 872
294 Wheelock & Co. LtdHK0020000177 69 000 396
790 Whirlpool Corp.963320106 4 900 1 040
382 Whitbread plcGB00B1KJJ408 4 963 407
1 519 Whitecap Resources inc.96467A200 93 100 1 115
305 Whitting Petroleum Corp.966387102 4 700 224
353 Whole Foods Market inc.966837106 11 000 615
532 William Demant Holding ASDK0010268440 5 621 461
454 William Morrison Supermarkets plc060431004 94 866 302
451 Williams Cos. inc.969457100 18 600 1 098
25

FONDS DE SOLIDARITÉ DES TRAVAILLEURS DU QUÉBEC (F.T.Q.)Relevé des autres investissements
au 30 novembre 2014
non audité( )
Quantité Coût
Juste
valeurDescription(en milliers $)(en milliers $)
Actions et parts
885 Willis Group Holdings plcG96666105 21 200 1 032
1 151 Wilmar International LtdB17KC6900 360 000 1 011
273 Windstream Holdings inc.97382A101 24 000 277
2 490 Wisconsin Energy Corp.976657106 52 600 2 963
701 Wolseley plc098834435 12 659 812
4 228 Woodside Petroleum Ltd697972008 105 785 3 681
3 303 Woolworths Ltd698123908 105 284 3 188
296 Workday inc.98138H101 2 900 288
193 WorleyParsons Ltd656247905 7 921 86
860 WPP plcB8KF9B904 48 307 1 156
1 677 WR Berkley Corp.084423102 36 600 2 180
492 WSP Global inc.92938W202 13 700 479
631 WW Grainger inc.384802104 2 400 672
496 Wynn Macau LtdKYG981491007 109 200 406
1 387 Wynn Resort Ltd983134107 7 600 1 548
2 741 Xcel Energy inc.98389B100 87 500 3 386
378 Xerox Corp.984121103 41 500 661
730 Xilinx inc.983919101 13 400 694
315 Yahoo Japan Corp.JP3933800009 53 000 220
742 Yahoo! inc.984332106 27 200 1 605
122 Yakult Honsha Co. Ltd698511003 3 800 230
305 Yamaha Motor Co. LtdJP3942800008 17 300 419
3 924 Yamana Gold inc.98462Y100 398 800 1 648
420 Yamato Kogyo Co. Ltd698544004 11 900 381
2 111 Yamato Transport Co. LtdJP3940000007 89 200 2 295
764 Yamazaki Baking Co. Ltd698550001 58 000 835
297 Yangzijiang Shipbuilding (Holdings) Ltd029649723 312 000 334
477 Yara International ASA775125909 11 372 552
159 Yokogawa Electric Corp.JP3955000009 9 000 129
486 Yue Yuen Industrial Holdings LtdBMG988031446 126 000 515
2 862 Yum! Brands inc.988498101 37 800 3 330
568 Zimmer Holding inc.98956P102 7 000 896
336 Zodiac Aerospace002364611 9 720 368
564 Zoetis inc.98978V103 18 100 927
1 039 Zurich Insurance Group AG598381903 4 085 1 464
Total - actions et parts 2 270 664 2 672 546
26

FONDS DE SOLIDARITÉ DES TRAVAILLEURS DU QUÉBEC (F.T.Q.)Relevé des autres investissements
au 30 novembre 2014
non audité( )
Valeur
nominale Coût
Juste
valeurDescription(en milliers $)(en milliers $)(en milliers $)
Obligations
1 502 CI Financial Corp. 4,19 %125491AB6 2014-12-16 1 501 1 501
2 641 Banque Toronto-Dominion (NHA MBS) 2,25 %62924ZQM0 2015-01-01 2 639 2 640
Taux variable 15 000 Banque de Montréal 1,65 %06367VAP0 2015-03-23 15 000 15 001
3 750 VW Credit Canada inc. 2,50 %918423AE4A 2015-06-01 3 750 3 770
592 GE Capital Canada Funding Co. 4,24 %36158ZBP0 2015-06-08 585 594
254 Alliance Pipeline L.P. 7,23 %01877PAA0 2015-06-30 252 254
5 401 Daimler Canada Finance inc. 2,33 %23384NAG2 2015-09-14 5 400 5 433
7 185 Metro inc. 4,98 %59162ZAA0 2015-10-15 7 000 7 193
Taux variable 19 750 Caisse Centrale Desjardins du Québec 1,62 %12801ZCH9A 2015-10-16 19 750 19 750
250 Capital Power L.P. 4,60 %14043ZAB8 2015-12-01 250 257
510 Gouvernement du Canada 3,00 %135087ZF4 2015-12-01 500 510
5 000 Banque Nationale du Canada 2,05 %633067WR0 2016-01-11 5 000 5 031
6 000 Cadillac Fairview Finance Trust 3,24 %12741RAA7 2016-01-25 6 000 6 137
73 809 Gouvernement du Canada 1,25 %135087A79 2016-02-01 73 590 73 828
1 999 VW Credit Canada inc. 3,60 %918423AC8 2016-02-01 2 000 2 047
105 Ford Auto Securitization Trust 3,02 %345213BR2 2016-02-15 105 106
10 303 Province de l'Ontario 4,40 %683234YC6 2016-03-08 9 900 10 310
9 000 Daimler Canada Finance inc. 2,23 %23384NAH0 2016-04-18 9 000 9 069
Rachetable à compter du 2016-01-20 3 040 Choice Properties L.P. 3,00 %17039BAA2 2016-04-20 3 000 3 040
9 994 La Banque de Nouvelle-Écosse 1,80 %064149T23 2016-05-09 10 000 10 037
1 219 Enbridge inc. 5,17 %29251ZAT4 2016-05-19 1 185 1 244
1 800 Shoppers Drug Mart Corp. 2,01 %82509ZAE6 2016-05-24 1 800 1 808
2 499 Rogers Communications inc. 5,80 %775109AM3 2016-05-26 2 500 2 647
Taux variable 20 000 Banque Nationale du Canada 1,52 %633067YJ6 2016-06-23 20 000 19 954
1 500 Powell River Energy inc. 6,45 %739135AB7 2016-07-25 1 500 1 577
5 000 Banque Royale du Canada 3,03 %7800853L8 2016-07-26 5 000 5 118
5 000 Banque de Montréal 2,96 %063679SP0 2016-08-02 5 000 5 113
4 450 Banque Toronto-Dominion 2,95 %891145QS6 2016-08-02 4 450 4 554
10 482 Enbridge inc. 5,00 %29251ZAS6 2016-08-09 10 000 10 541
18 855 Province de l'Ontario 3,20 %68323AAF1 2016-09-08 18 200 18 854
1 999 VW Credit Canada inc. 2,20 %918423AF1 2016-10-11 2 000 2 020
7 131 George Weston Ltd 3,78 %96115ZAW2 2016-10-25 7 000 7 257
13 888 Banque Canadienne Impériale de Commerce 2,65 %13595ZDS2 2016-11-08 13 700 13 969
1 025 La Banque de Nouvelle-Écosse 2,10 %064149Z59 2016-11-08 1 025 1 034
350 Ford Credit Canada 2,63 %34527ABE9 2016-11-21 350 354
13 468 Financement-Québec 3,50 %31739ZAN5 2016-12-01 13 000 13 592
2 992 La Banque de Nouvelle-Écosse 2,74 %064149G76 2016-12-01 2 950 3 013
2 999 Emera inc. 2,96 %29087ZAD9 2016-12-13 3 000 3 069
Variable et rachetable à compter du 2015-12-14 1 075 CI Investments inc. 3,94 %125521AA2 2016-12-14 1 075 1 100
3 069 Bell Canada 5,00 %07813ZAU8 2017-02-15 3 000 3 206
2 993 Daimler Canada Finance inc. 2,28 %23384NAK3 2017-02-17 2 990 3 024
17 607 La Banque de Nouvelle-Écosse 2,60 %064149J24 2017-02-27 17 300 17 659
4 042 Gouvernement du Canada 1,50 %135087ZV9 2017-03-01 4 000 4 046
16 987 Province de l'Ontario 4,30 %683234YX0 2017-03-08 16 015 17 098
Rachetable à compter du 2017-01-20 1 527 Choice Properties L.P. 3,00 %17039BAB0 2017-04-20 1 500 1 534
5 262 Brookfield Asset Management inc. 5,29 %112585AC8 2017-04-25 5 000 5 364
3 750 VW Credit Canada inc. 2,90 %918423AD6 2017-06-01 3 750 3 855
3 310 Banque de Montréal 5,45 %063671RH6 2017-07-17 3 030 3 318
24 307 Banque Toronto-Dominion 2,43 %891145A95 2017-08-15 24 050 24 490
3 500 Banque Nationale du Canada 2,69 %633067VX8 2017-08-21 3 500 3 583
10 031 Banque de Montréal (NHA MBS) 2,10 %62932ZAF2 2017-09-01 9 897 10 047
4 192 Banque Royale du Canada 2,36 %780086BU7 2017-09-21 4 200 4 266
27

FONDS DE SOLIDARITÉ DES TRAVAILLEURS DU QUÉBEC (F.T.Q.)Relevé des autres investissements
au 30 novembre 2014
non audité( )
Valeur
nominale Coût
Juste
valeurDescription(en milliers $)(en milliers $)(en milliers $)
Obligations
5 011 Banque Canadienne Impériale de Commerce 2,35 %13595ZHZ2 2017-10-18 5 000 5 077
1 363 Hydro One inc. 5,18 %44810ZAT7 2017-10-18 1 260 1 384
744 VW Credit Canada inc. 2,45 %918423AJ3 2017-11-14 745 758
34 982 Financement-Québec 3,50 %31739ZAQ8 2017-12-01 34 300 36 384
363 OMERS Realty Corp. 3,04 %68214WAF5 2017-12-05 363 371
17 921 Banque de Montréal 2,24 %0636795H3 2017-12-11 17 800 18 017
2 500 Enbridge Income Fund 2,92 %29254ZAJ3 2017-12-14 2 500 2 555
10 511 Banque Toronto-Dominion (NHA MBS) 1,70 %62932ZC60 2017-12-15 10 468 10 523
3 002 Gouvernement du Canada 1,25 %135087A87 2018-03-01 3 000 3 011
6 946 Banque Canadienne Impériale de Commerce 2,22 %13595ZLB0 2018-03-07 7 000 7 074
5 000 American Express Canada Credit Corp. 2,31 %02580ZAM8 2018-03-29 5 000 5 058
1 904 BMW Canada inc. 2,33 %05590HAH0 2018-05-23 1 900 1 926
3 500 Shoppers Drug Mart Corp. 2,36 %82509ZAF3 2018-05-24 3 500 3 532
2 500 Caterpillar Financial Services Ltd 2,29 %14911ZAP6 2018-06-01 2 500 2 529
6 000 OMERS Realty Corp. 2,50 %68214WAG3 2018-06-05 6 000 6 125
655 NBC Asset Trust 7,24 %62874WAA0 2018-06-30 575 670
9 514 Banque Royale du Canada 2,82 %780086FE9 2018-07-12 9 300 9 577
306 bcIMC Realty Corp. 2,79 %07329VAL4 2018-08-02 300 309
27 462 Hydro-Québec 5,50 %44889ZDU7 2018-08-15 26 965 30 741
2 992 Gouvernement du Canada 1,25 %135087B37 2018-09-01 3 000 3 006
5 980 Province de l'Ontario 1,75 %68323ACW2 2018-09-01 5 990 6 037
10 015 Groupe TMX Limitée 3,25 %87262KAA3 2018-10-03 10 000 10 412
512 Hydro One inc. 2,78 %44810ZBJ8 2018-10-09 500 517
1 790 Brookfield Power Corp. 5,25 %05573YAA9 2018-11-05 1 790 1 968
155 BMW Canada inc. 2,27 %05590HAN7 2018-11-26 155 156
24 506 Financement-Québec 2,40 %31739ZAS4 2018-12-01 24 500 25 237
56 382 Province de Québec 4,50 %74814ZDU4 2018-12-01 51 125 56 817
9 986 Municipal Finance Authority of British Columbia 2,35 %626209JM3 2018-12-03 10 000 10 278
14 112 Banque Royale du Canada 2,77 %780086GH1 2018-12-11 14 000 14 395
1 335 TD Capital Trust III 7,24 %87239BAA3 2018-12-31 1 335 1 583
1 498 Enbridge Income Fund 4,10 %29254ZAF1 2019-02-22 1 500 1 592
9 000 Loblaw Cos. Ltd 3,75 %539481AH4 2019-03-12 9 000 9 507
3 750 Tim Hortons inc. 2,85 %88706MAD5 2019-04-01 3 750 3 790
4 945 Brookfield Asset Management inc. 3,95 %11257ZAB5 2019-04-09 4 850 5 099
625 Metropolitan Life Global Funding I 2,68 %592179JQ9 2019-04-16 625 637
3 000 Power Corp. of Canada 7,57 %739239AB7 2019-04-22 3 000 3 624
10 003 Transcontinental inc. 3,90 %893578AA2 2019-05-13 10 000 10 106
5 000 Thomson Reuters Corp. 3,37 %884903BR5 2019-05-23 5 000 5 182
3 599 Veresen inc. 3,06 %92343ZAD7 2019-06-13 3 600 3 640
1 400 Scotia Plaza 3,21 %78468GAA3 2019-06-15 1 400 1 423
9 999 Cominar Real Estate Investment Trust 3,62 %199910AP5 2019-06-21 10 000 10 151
580 Banque Canadienne Impériale de Commerce 2,35 %13595ZWG7 2019-06-24 580 586
2 997 John Deere Canada Funding inc. 2,35 %47787ZAG7 2019-06-24 3 000 3 032
100 WestJet Airlines Ltd 3,29 %960410AA6 2019-07-23 100 100
19 716 First National Bank (NHA MBS) 1,75 %62937Z5E6 2019-08-01 19 792 19 817
Rachetable à compter du 2019-06-20 4 998 Choice Properties L.P. 3,00 %17039BAC8 2019-09-20 5 000 5 064
8 000 Banque Nationale du Canada 2,40 %633067ZK2 2019-10-28 8 000 8 064
12 422 La Banque de Nouvelle-Écosse 2,40 %0641496N2 2019-10-28 12 425 12 530
2 000 OMERS Realty Corp. 2,47 %68214WAL2 2019-11-12 2 000 2 020
374 Greater Toronto Airports Authority 5,96 %39191ZAV1 2019-11-20 345 408
8 630 Saputo inc. 2,65 %80310ZAA7 2019-11-26 8 630 8 668
60 346 Financement-Québec 2,45 %31739ZAT2 2019-12-01 60 500 62 114
28

FONDS DE SOLIDARITÉ DES TRAVAILLEURS DU QUÉBEC (F.T.Q.)Relevé des autres investissements
au 30 novembre 2014
non audité( )
Valeur
nominale Coût
Juste
valeurDescription(en milliers $)(en milliers $)(en milliers $)
Obligations
5 305 TELUS Corp. 5,05 %87971MAK9 2019-12-04 5 000 5 600
9 070 Canada Housing Trust No 1 2,00 %13509PEP4 2019-12-15 9 000 9 128
596 BP L.P. 3,24 %05576AAA8 2020-01-09 591 605
Variable et rachetable à compter du 2015-04-22 3 734 Banque de Montréal 4,87 %063671DQ1 2020-04-22 3 685 3 731
1 984 Gouvernement du Canada 3,50 %135087YZ1 2020-06-01 1 800 1 998
40 881 Province de l'Ontario 4,20 %6832348J0 2020-06-02 37 250 41 561
800 Metropolitan Life Global Funding I 3,03 %592179JP1 2020-06-11 800 822
Variable et rachetable à compter du 2015-06-15 5 728 Banque Royale du Canada 4,35 %780085M86 2020-06-15 5 600 5 680
10 854 Bell Canada 3,25 %07813ZBD5 2020-06-17 11 000 11 367
3 240 Banque Toronto-Dominion 2,56 %891145S47 2020-06-24 3 240 3 285
3 398 NBC Asset Trust 7,45 %62874WAB8 2020-06-30 2 925 3 593
12 729 CDP Financial inc. 4,60 %125094AF9 2020-07-15 12 150 13 731
9 372 Inter Pipeline Ltd 3,45 %45834ZAD1 2020-07-20 9 375 9 780
5 447 TELUS Corp. 5,05 %87971MAM5 2020-07-23 5 000 5 631
237 Cominar Real Estate Investment Trust 4,94 %199910AL4 2020-07-27 225 240
7 652 Canadian Natural Resources 2,89 %13638ZCE3 2020-08-14 7 650 7 780
3 155 Thomson Reuters Corp. 4,35 %884903BJ3 2020-09-30 3 000 3 246
1 000 PSP Capital inc. 3,03 %69363TAF9 2020-10-22 1 000 1 052
Variable et rachetable à compter du 2015-11-02 10 780 Banque Canadienne Impériale de Commerce 3,15 %136069DQ1 2020-11-02 10 000 10 137
Variable et rachetable à compter du 2015-11-02 4 780 Banque Royale du Canada 3,18 %780085R57 2020-11-02 4 770 4 839
9 141 Banque Toronto-Dominion 3,37 %89116ZAH9 2020-11-02 9 000 9 140
Variable et rachetable à compter du 2015-11-23 11 640 Capital Desjardins inc. 3,80 %14006ZAE7 2020-11-23 11 300 11 523
4 979 TransAlta Corp. 5,00 %89347ZAL1 2020-11-25 5 000 5 213
1 545 Mississagi Power Trust 6,92 %605204AA4 2020-11-27 1 545 1 828
3 001 Cadillac Fairview Finance Trust 4,31 %12741RAB5 2021-01-25 3 000 3 365
249 TELUS Corp. 3,60 %87971MAT0 2021-01-26 250 262
95 Wells Fargo Financial Canada Corp. 3,04 %94975ZBU9 2021-01-29 95 98
900 Leisureworld Senior Care L.P. 3,47 %52541RAC1 2021-02-03 900 933
870 Goldman Sachs Group inc. 3,55 %38141GVL5 2021-02-12 870 899
5 800 Brookfield Asset Management inc. 5,30 %112585AG9 2021-03-01 5 200 5 810
2 956 Banque Royale du Canada 2,86 %780086GV0 2021-03-04 2 955 3 026
10 055 Rogers Communications inc. 5,34 %775109AS0 2021-03-22 9 470 10 822
3 000 OMERS Realty Corp. 2,97 %68214WAK4 2021-04-05 3 000 3 090
2 834 Banque de Montréal 3,40 %06367VJN6 2021-04-23 2 790 2 945
9 915 Province de l'Ontario 4,00 %68323AAD6 2021-06-02 9 100 10 105
1 000 La Banque de Nouvelle-Écosse 2,87 %0641494K0 2021-06-04 1 000 1 024
12 684 Canada Housing Trust No 1 3,80 %13509PCS0 2021-06-15 11 600 12 917
857 TELUS Communications inc. 10,65 %110727BJ2 2021-06-19 743 1 076
90 Ford Credit Canada 3,28 %34527ABH2 2021-07-02 90 91
Rachetable à compter du 2021-06-05 797 Granite Reit Holdings L.P. 3,79 %387427AB3 2021-07-05 795 811
560 Reliance L.P. 4,08 %759480AG1 2021-08-02 560 568
421 Sun Life Financial inc. 4,57 %86682ZAD8 2021-08-23 385 430
5 012 Choice Properties L.P. 3,60 %17039BAE4 2021-09-20 5 000 5 119
2 499 AltaGas Ltd 3,72 %02138ZAE3 2021-09-28 2 500 2 629
Rachetable à compter du 2021-10-12 6 000 Thomson Reuters Corp. 3,31 %884903BS3 2021-11-12 6 000 6 078
Rachetable à compter du 2021-10-26 1 894 Suncor Energy inc. 3,10 %86721ZAL3 2021-11-26 1 900 1 931
Rachetable à compter du 2021-11-01 8 099 Metro inc. 3,20 %59162NAA7 2021-12-01 8 100 8 071
49 228 Province de Québec 4,25 %74814ZEH2 2021-12-01 45 400 51 154
5 020 Algonquin Power Co. 4,65 %01585PAE5 2022-02-15 5 000 5 342
260 Enbridge Income Fund 4,85 %29254ZAG9 2022-02-22 235 261
445 TELUS Communications inc. 9,65 %110727BL7 2022-04-08 362 514
Variable et rachetable à compter du 2017-04-11 1 025 Banque Nationale du Canada 3,26 %63306ZDM0 2022-04-11 1 025 1 057
29
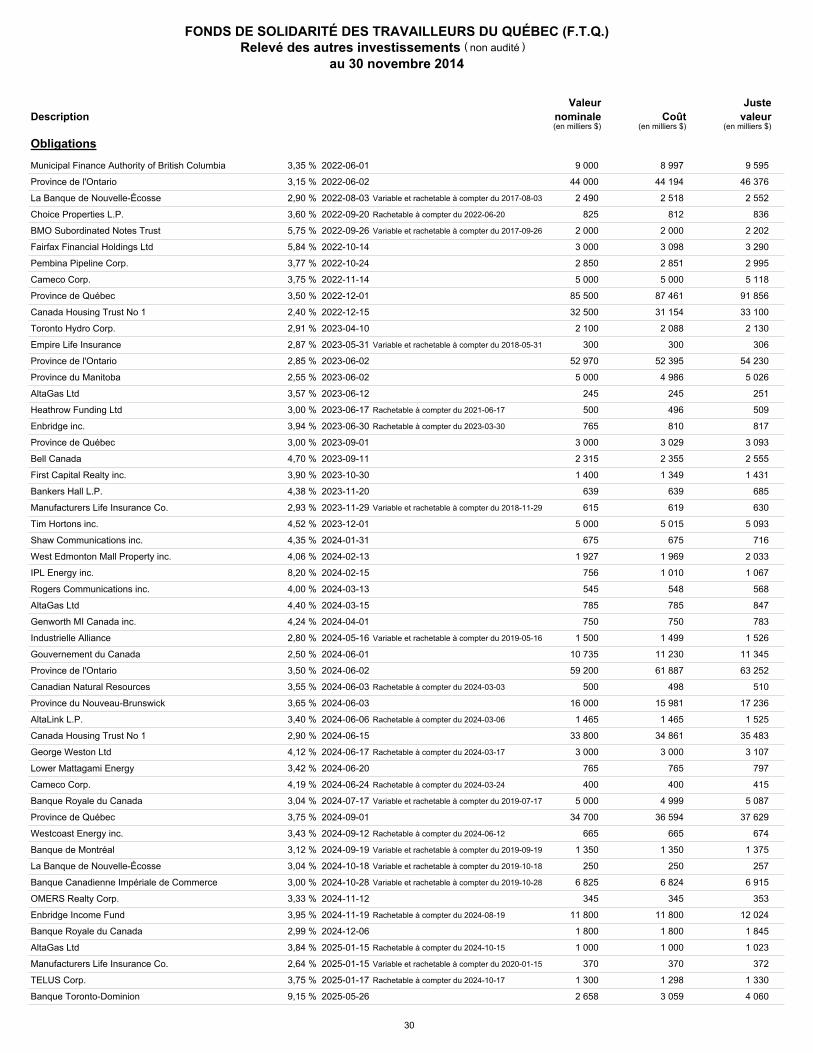
FONDS DE SOLIDARITÉ DES TRAVAILLEURS DU QUÉBEC (F.T.Q.)Relevé des autres investissements
au 30 novembre 2014
non audité( )
Valeur
nominale Coût
Juste
valeurDescription(en milliers $)(en milliers $)(en milliers $)
Obligations
8 997 Municipal Finance Authority of British Columbia 3,35 %626209JK7 2022-06-01 9 000 9 595
44 194 Province de l'Ontario 3,15 %68323AAW4 2022-06-02 44 000 46 376
Variable et rachetable à compter du 2017-08-03 2 518 La Banque de Nouvelle-Écosse 2,90 %064149M38 2022-08-03 2 490 2 552
Rachetable à compter du 2022-06-20 812 Choice Properties L.P. 3,60 %17039BAF1 2022-09-20 825 836
Variable et rachetable à compter du 2017-09-26 2 000 BMO Subordinated Notes Trust 5,75 %055972AA1 2022-09-26 2 000 2 202
3 098 Fairfax Financial Holdings Ltd 5,84 %303901AV4 2022-10-14 3 000 3 290
2 851 Pembina Pipeline Corp. 3,77 %70632ZAB7 2022-10-24 2 850 2 995
5 000 Cameco Corp. 3,75 %13321LAH1 2022-11-14 5 000 5 118
87 461 Province de Québec 3,50 %74814ZEL3 2022-12-01 85 500 91 856
31 154 Canada Housing Trust No 1 2,40 %13509PDL4 2022-12-15 32 500 33 100
2 088 Toronto Hydro Corp. 2,91 %89119ZAE3 2023-04-10 2 100 2 130
Variable et rachetable à compter du 2018-05-31 300 Empire Life Insurance 2,87 %291839AC2 2023-05-31 300 306
52 395 Province de l'Ontario 2,85 %68323ABN3 2023-06-02 52 970 54 230
4 986 Province du Manitoba 2,55 %563469UA1 2023-06-02 5 000 5 026
245 AltaGas Ltd 3,57 %02138ZAG8 2023-06-12 245 251
Rachetable à compter du 2021-06-17 496 Heathrow Funding Ltd 3,00 %42246QAA6 2023-06-17 500 509
Rachetable à compter du 2023-03-30 810 Enbridge inc. 3,94 %29251ZBD8 2023-06-30 765 817
3 029 Province de Québec 3,00 %74814ZEP4 2023-09-01 3 000 3 093
2 355 Bell Canada 4,70 %07813ZBF0 2023-09-11 2 315 2 555
1 349 First Capital Realty inc. 3,90 %31943BBU3 2023-10-30 1 400 1 431
639 Bankers Hall L.P. 4,38 %066164AA2 2023-11-20 639 685
Variable et rachetable à compter du 2018-11-29 619 Manufacturers Life Insurance Co. 2,93 %564835AF3 2023-11-29 615 630
5 015 Tim Hortons inc. 4,52 %88706MAC7 2023-12-01 5 000 5 093
675 Shaw Communications inc. 4,35 %82028KAT8 2024-01-31 675 716
1 969 West Edmonton Mall Property inc. 4,06 %952637AC0 2024-02-13 1 927 2 033
1 010 IPL Energy inc. 8,20 %46065DAA4 2024-02-15 756 1 067
548 Rogers Communications inc. 4,00 %775109BA8 2024-03-13 545 568
785 AltaGas Ltd 4,40 %02138ZAH6 2024-03-15 785 847
750 Genworth MI Canada inc. 4,24 %37252BAC6 2024-04-01 750 783
Variable et rachetable à compter du 2019-05-16 1 499 Industrielle Alliance 2,80 %455870AB1 2024-05-16 1 500 1 526
11 230 Gouvernement du Canada 2,50 %135087B45 2024-06-01 10 735 11 345
61 887 Province de l'Ontario 3,50 %68323ACG7 2024-06-02 59 200 63 252
Rachetable à compter du 2024-03-03 498 Canadian Natural Resources 3,55 %13638ZCR4 2024-06-03 500 510
15 981 Province du Nouveau-Brunswick 3,65 %642869AJ0 2024-06-03 16 000 17 236
Rachetable à compter du 2024-03-06 1 465 AltaLink L.P. 3,40 %02135ZAM8 2024-06-06 1 465 1 525
34 861 Canada Housing Trust No 1 2,90 %13509PEF6 2024-06-15 33 800 35 483
Rachetable à compter du 2024-03-17 3 000 George Weston Ltd 4,12 %9611488Y2 2024-06-17 3 000 3 107
765 Lower Mattagami Energy 3,42 %548243AG9 2024-06-20 765 797
Rachetable à compter du 2024-03-24 400 Cameco Corp. 4,19 %13321LAK4 2024-06-24 400 415
Variable et rachetable à compter du 2019-07-17 4 999 Banque Royale du Canada 3,04 %780086JC9 2024-07-17 5 000 5 087
36 594 Province de Québec 3,75 %74814ZES8 2024-09-01 34 700 37 629
Rachetable à compter du 2024-06-12 665 Westcoast Energy inc. 3,43 %95751ZAS2 2024-09-12 665 674
Variable et rachetable à compter du 2019-09-19 1 350 Banque de Montréal 3,12 %06369ZBS2 2024-09-19 1 350 1 375
Variable et rachetable à compter du 2019-10-18 250 La Banque de Nouvelle-Écosse 3,04 %064149P27 2024-10-18 250 257
Variable et rachetable à compter du 2019-10-28 6 824 Banque Canadienne Impériale de Commerce 3,00 %136069JJ1 2024-10-28 6 825 6 915
345 OMERS Realty Corp. 3,33 %68214WAM0 2024-11-12 345 353
Rachetable à compter du 2024-08-19 11 800 Enbridge Income Fund 3,95 %29254ZAM6 2024-11-19 11 800 12 024
1 800 Banque Royale du Canada 2,99 %780086CW2 2024-12-06 1 800 1 845
Rachetable à compter du 2024-10-15 1 000 AltaGas Ltd 3,84 %02138ZAM5 2025-01-15 1 000 1 023
Variable et rachetable à compter du 2020-01-15 370 Manufacturers Life Insurance Co. 2,64 %564835AH9 2025-01-15 370 372
Rachetable à compter du 2024-10-17 1 298 TELUS Corp. 3,75 %87971MAX1 2025-01-17 1 300 1 330
3 059 Banque Toronto-Dominion 9,15 %891160EW9 2025-05-26 2 658 4 060
30

FONDS DE SOLIDARITÉ DES TRAVAILLEURS DU QUÉBEC (F.T.Q.)Relevé des autres investissements
au 30 novembre 2014
non audité( )
Valeur
nominale Coût
Juste
valeurDescription(en milliers $)(en milliers $)(en milliers $)
Obligations
2 363 Nova Gas Transmission Ltd 8,90 %66975ZAE4 2025-05-27 2 000 2 964
2 324 Westcoast Energy inc. 8,85 %95751DAK8 2025-07-21 2 086 3 050
630 AGT Ltd 8,80 %00126TAB1 2025-09-22 560 812
1 500 Lievre Power Financing Corp. 5,56 %531739AA8 2025-10-06 1 500 1 661
381 Alliance Pipeline L.P. 6,77 %01877ZAC4 2025-12-31 381 450
875 Brookfield Asset Management inc. 4,82 %11257ZAE9 2026-01-28 875 925
Variable et rachetable à compter du 2021-09-29 5 997 Banque Royale du Canada 3,45 %780086JM7 2026-09-29 6 000 6 144
955 NAV Canada 7,56 %628957AE2 2027-03-01 873 1 124
423 Bell Canada 7,00 %078149DW8 2027-09-24 445 583
3 339 Loblaw Companies Ltd 6,45 %53947ZAD9 2028-02-09 3 240 3 929
1 134 Loblaw Companies Ltd 6,50 %53947ZAF4 2029-01-22 1 172 1 434
38 855 Province de l'Ontario 6,50 %683234LJ5 2029-03-08 30 000 41 943
1 924 Bell Canada 6,55 %07813ZAC8 2029-05-01 2 143 2 687
8 282 Province de la Colombie-Britannique 5,70 %110709EK4 2029-06-18 7 000 9 291
1 724 Ontario School Boards Financing Corp. 5,48 %683244AM9 2029-11-26 1 724 2 018
2 134 Hydro One inc. 7,35 %448810AC5 2030-06-03 1 902 2 736
3 527 Greater Toronto Airports Authority 7,05 %39191ZAA7 2030-06-12 3 437 4 808
3 689 Enbridge inc. 7,22 %29251ZAD9 2030-07-24 3 050 4 171
2 297 Ontario School Boards Financing Corp. 4,79 %683244AP2 2030-08-08 2 297 2 482
999 Gaz Métro inc. 7,05 %368271AU6 2030-10-30 1 000 1 399
1 030 TransCanada PipeLines Ltd 6,50 %89353ZBK3 2030-12-09 1 115 1 426
274 Bell Canada 7,85 %07813ZAL8 2031-04-02 237 329
1 417 Ontario School Boards Financing Corp. 5,07 %683244AR8 2031-04-18 1 417 1 602
70 811 Province de l'Ontario 6,20 %683234NM6 2031-06-02 53 600 74 541
661 Greater Toronto Airports Authority 7,10 %39191ZAC3 2031-06-04 610 867
20 814 Hydro-Québec 6,00 %448814GY3 2031-08-15 16 000 21 645
1 720 Aéroport de Montréal 6,95 %007863AB9 2032-04-16 1 661 2 153
4 319 Hydro One inc. 6,93 %44810ZAB6 2032-06-01 3 575 5 065
614 North Battleford Power L.P. 4,96 %65746TAA6 2032-12-31 614 687
5 812 55 Ontario School Board Trust 5,90 %31680PAA4 2033-06-02 5 815 7 668
460 SEC L.P. and Arci Ltd 5,19 %784103AA1 2033-08-29 460 517
2 992 Aéroport de Montréal 6,55 %007863AC7 2033-10-11 2 600 3 570
498 Gaz Métro inc. 6,30 %368271AV4 2033-10-31 500 670
3 924 Province du Nouveau-Brunswick 5,50 %642866FR3 2034-01-27 3 900 5 081
500 Greater Toronto Airports Authority 6,47 %39191ZAJ8 2034-02-02 500 685
18 893 Financement-Québec 5,25 %31739ZAG0 2034-06-01 17 614 22 174
362 Loblaw Companies Ltd 6,05 %53947ZAU1 2034-06-09 365 430
3 843 University of Ontario Institute of Technology 6,35 %914764AA3 2034-10-15 3 843 4 559
690 FortisAlberta inc. 6,22 %34957EAB7 2034-10-31 525 705
25 104 Hydro-Québec 6,50 %44889ZCM6 2035-02-15 20 040 29 144
17 743 Province de l'Ontario 5,60 %683234VR6 2035-06-02 13 500 18 102
1 054 Brookfield Asset Management inc. 5,95 %10549PAJ0 2035-06-14 1 060 1 167
965 EPCOR Utilities inc. 5,65 %29410ZAF2 2035-11-16 940 1 170
Variable et rachetable à compter du 2015-11-23 1 152 Sun Life Financial inc. 4,80 %866796AA3 2035-11-23 1 135 1 169
1 133 407 International inc. 5,75 %35085ZAM8 2036-02-14 1 075 1 340
335 Gaz Métro inc. 5,70 %368271AX0 2036-07-10 325 414
508 Enbridge inc. 5,08 %29250ZAG3 2036-12-19 450 535
238 Bell Canada 6,17 %07813ZBL7 2037-02-26 195 238
471 Suncor Energy inc. 5,39 %86721ZAB5 2037-03-26 405 474
1 200 Toronto Community Housing Corp. 4,88 %87228VAA2 2037-05-11 1 200 1 400
51 097 Gouvernement du Canada 5,00 %135087XW9 2037-06-01 36 700 53 370
6 011 Ontario Infrastructure Projects Corp. 4,70 %683086AA0 2037-06-01 6 000 6 945
31

FONDS DE SOLIDARITÉ DES TRAVAILLEURS DU QUÉBEC (F.T.Q.)Relevé des autres investissements
au 30 novembre 2014
non audité( )
Valeur
nominale Coût
Juste
valeurDescription(en milliers $)(en milliers $)(en milliers $)
Obligations
22 497 Province de l'Ontario 4,70 %683234YD4 2037-06-02 19 700 23 933
25 801 Province de la Colombie-Britannique 4,70 %110709FL1 2037-06-18 22 000 27 276
36 812 Province de Québec 5,00 %74814ZDK6 2038-12-01 32 250 40 519
1 116 Power Corp. of Canada 8,57 %739239AC5 2039-04-22 980 1 562
797 Nova Scotia Power inc. 5,95 %66988ZAY5 2039-07-27 800 1 047
1 161 Rogers Communications inc. 6,68 %775109AP6 2039-11-04 1 090 1 401
698 Shaw Communications inc. 6,75 %82028KAQ4 2039-11-09 710 883
3 000 Canada Post Corp. 4,36 %13521JAB7 2040-07-16 3 000 3 750
285 Hydro One inc. 5,49 %44810ZAY6 2040-07-16 240 305
1 808 407 International inc. 7,13 %350863AU0 2040-07-26 1 690 2 539
1 164 Winnipeg Airport Authority inc. 5,21 %975014AA9 2040-09-28 1 164 1 294
2 501 Greater Toronto Airports Authority 5,30 %39191ZAX7 2041-02-25 2 500 3 106
2 738 Province du Manitoba 4,10 %563469TM7 2041-03-05 2 900 3 294
275 Arrow Lakes Power 5,52 %042767AB9 2041-04-05 275 323
25 095 Gouvernement du Canada 4,00 %135087YQ1 2041-06-01 20 800 27 238
9 460 Province de l'Ontario 4,65 %683234B98 2041-06-02 8 000 9 811
170 Teranet Holdings L.P. 6,10 %880789AN2 2041-06-17 155 181
261 407 International inc. 4,45 %35085ZBE5 2041-11-15 250 275
500 TransCanada PipeLines Ltd 4,55 %89353ZBV9 2041-11-15 480 522
17 412 Province de Québec 5,00 %74814ZEF6 2041-12-01 15 300 19 483
3 492 EPCOR Utilities inc. 4,55 %29410ZAK1 2042-02-28 3 500 3 848
Rachetable à compter du 2042-01-25 2 996 407 International inc. 4,19 %35085ZBF2 2042-04-25 3 000 3 162
380 AltaLink L.P. 3,99 %02135ZAF3 2042-06-30 380 390
2 318 OPB Finance Trust 3,89 %67103MAA4 2042-07-04 2 320 2 389
1 394 Aéroport de Montréal 3,92 %007863AH6 2042-09-26 1 400 1 424
6 967 Province du Manitoba 3,35 %563469TW5 2043-03-05 7 000 7 038
1 000 Simon Fraser University 5,61 %82878RAA5 2043-06-10 1 000 1 305
3 978 Nova Scotia Power inc. 4,50 %66988ZBC2 2043-07-20 4 000 4 370
Rachetable à compter du 2043-03-09 895 CU inc. 4,72 %12657ZBB8 2043-09-09 895 1 033
130 AltaLink L.P. 4,92 %02135ZAK2 2043-09-17 130 154
2 821 TELUS Corp. 5,15 %87971MAU7 2043-11-26 2 835 3 126
3 779 Province de l'Alberta 3,45 %013051DK0 2043-12-01 4 000 4 183
4 969 Ville de Toronto 4,15 %891288DH2 2044-03-10 5 000 5 537
5 101 Enbridge inc. 4,57 %29251ZBG1 2044-03-11 5 075 5 388
Rachetable à compter du 2043-09-25 400 Pembina Pipeline Corp. 4,81 %70632ZAD3 2044-03-25 400 420
Rachetable à compter du 2043-11-30 2 475 Inter Pipeline Ltd 4,64 %45834ZAE9 2044-05-30 2 475 2 573
Rachetable à compter du 2043-12-02 1 999 Union Gas Ltd 4,20 %90664ZAD2 2044-06-02 2 000 2 098
10 550 Province de la Colombie-Britannique 3,20 %110709GC0 2044-06-18 11 800 11 789
Rachetable à compter du 2044-02-15 315 AltaGas Ltd 4,50 %02138ZAL7 2044-08-15 315 316
Rachetable à compter du 2044-03-02 5 053 CU inc. 4,09 %12657ZBE2 2044-09-02 5 000 5 210
Rachetable à compter du 2044-03-29 793 Bell Canada 4,75 %07813ZBH6 2044-09-29 800 825
Rachetable à compter du 2044-05-21 2 000 AltaLink L.P. 4,05 %02135ZAP1 2044-11-21 2 000 2 078
Rachetable à compter du 2044-05-21 150 Enbridge Income Fund 4,87 %29254ZAN4 2044-11-21 150 155
6 007 Gouvernement du Canada 1,50 %135087ZH0 2044-12-01 4 783 5 950
Rachetable à compter du 2044-06-01 2 999 Metro inc. 5,03 %59162NAB5 2044-12-01 3 000 3 013
Rachetable à compter du 2044-07-17 1 987 TELUS Corp. 4,75 %87971MAY9 2045-01-17 2 000 2 081
15 867 Province de Nouvelle Écosse 3,45 %669827FZ5 2045-06-01 16 000 16 208
46 331 Province de l'Ontario 3,45 %68323ACC6 2045-06-02 47 040 48 004
7 056 Province de la Saskatchewan 3,90 %803854JU3 2045-06-02 7 000 7 930
16 567 Province du Manitoba 4,05 %563469UB9 2045-09-05 16 000 18 289
2 924 Province de Québec 3,50 %74814ZER0 2045-12-01 3 000 3 045
380 Lower Mattagami Energy 4,18 %548243AE4 2046-02-23 380 399
32

FONDS DE SOLIDARITÉ DES TRAVAILLEURS DU QUÉBEC (F.T.Q.)Relevé des autres investissements
au 30 novembre 2014
non audité( )
Valeur
nominale Coût
Juste
valeurDescription(en milliers $)(en milliers $)(en milliers $)
Obligations
5 797 Gouvernement du Canada 1,25 %135087B94 2047-12-01 5 306 6 304
Rachetable à compter du 2032-06-30 1 517 Sun Life Capital Trust 7,09 %86679QAB7 2052-06-30 1 390 1 852
2 984 Master Asset Vehicle II, classe A-1 0,00 %57632XAW3 2056-07-15 2 969 2 835
9 184 Master Asset Vehicle II, classe A-2 0,00 %57632XAY9 2056-07-15 9 141 8 455
Variable et rachetable à compter du 2017-06-21 3 415 Great-West Lifeco Finance Delaware L.P. II 5,69 %391382AA6 2067-06-21 3 370 3 685
Variable et rachetable à compter du 2016-12-14 1 600 Banque Toronto-Dominion 4,78 %89116ZAC0 2105-12-14 1 600 1 692
Variable et rachetable à compter du 2019-06-30 6 617 CIBC Capital Trust 9,98 %12544UAA9 2108-06-30 5 000 6 485
Variable et rachetable à compter du 2019-06-30 5 200 La Banque de Nouvelle-Écosse 7,80 %80928FAA5 2108-06-30 5 200 6 330
Variable et rachetable à compter du 2021-06-30 8 580 TD Capital Trust IV 6,63 %87239GAC8 2108-06-30 7 500 9 058
Variable et rachetable à compter du 2019-12-31 3 170 Manulife Financial Capital Trust II 7,41 %56501XAA1 2108-12-31 3 170 3 883
Total - obligations 2 302 711 2 186 537 2 406 269
33

FONDS DE SOLIDARITÉ DES TRAVAILLEURS DU QUÉBEC (F.T.Q.)Relevé des autres investissements
au 30 novembre 2014
non audité( )
Valeur
nominale Coût
Juste
valeurDescription(en milliers $)(en milliers $)(en milliers $)
Instruments du marché monétaire
14 994 Banque Canadienne Impériale de Commerce,
acceptation bancaire
1,10 %ST38098 2014-12-03 15 000 14 996
6 499 Banque Canadienne Impériale de Commerce,
acceptation bancaire
1,10 %ST38173 2014-12-03 6 500 6 499
4 998 Gouvernement du Canada, bon du trésor 0,87 %ST38079 2014-12-04 5 000 5 000
29 990 Gouvernement du Canada, bon du trésor 0,89 %ST38069 2014-12-04 30 000 29 996
100 Gouvernement du Canada, bon du trésor 0,90 %1350Z7VJ0 2014-12-04 100 100
45 Gouvernement du Canada, bon du trésor 0,95 %1350Z7V92 2014-12-05 45 45
879 Province de Québec, note promissoire 0,94 %09006RZG3 2014-12-15 880 880
120 Banque Nationale du Canada, acceptation bancaire 1,16 %ST37891 2014-12-16 120 120
499 Banque Nationale du Canada, acceptation bancaire 1,16 %ST37892 2014-12-16 500 500
579 Gouvernement du Canada, bon du trésor 0,87 %1350Z7UX0 2014-12-18 580 580
674 Gouvernement du Canada, bon du trésor 0,88 %1350Z7UX0 2014-12-18 675 675
125 Gouvernement du Canada, bon du trésor 0,94 %1350Z7UX0 2014-12-18 125 125
6 986 Province de la Colombie-Britannique, note promissoire 0,97 %743989UY9 2014-12-18 7 000 6 996
1 709 Canadian Wheat Board, papier commercial 0,92 %136796ZL6 2014-12-19 1 710 1 709
199 Banque Nationale du Canada, acceptation bancaire 1,15 %ST37832 2014-12-22 200 200
299 Banque Nationale du Canada, acceptation bancaire 1,15 %ST37833 2014-12-22 300 300
1 734 Province de Québec, note promissoire 0,95 %09006RZP3 2014-12-22 1 735 1 734
9 984 Province de Québec, bon du trésor 0,96 %ST37909 2014-12-23 10 000 9 993
50 Province de Nouvelle-Écosse, note promissoire 0,97 %669980UA0 2015-01-05 50 50
75 Province de Québec, note promissoire 0,95 %09006RA62 2015-01-06 75 75
325 Province de l'Ontario, bon du trésor 0,99 %6832Z52A7 2015-01-07 325 325
20 Canadian Wheat Board, papier commercial 0,91 %136796AD1 2015-01-12 20 20
1 447 Gouvernement du Canada, bon du trésor 0,88 %1350Z7U28 2015-01-15 1 450 1 448
9 981 Banque Nationale du Canada, acceptation bancaire 1,18 %ST38126 2015-01-23 10 000 9 981
2 670 Banque Nationale du Canada, acceptation bancaire 1,18 %ST38128 2015-01-23 2 675 2 670
6 103 Gouvernement du Canada, bon du trésor 0,88 %1350Z7VQ4 2015-01-29 6 115 6 106
5 760 Banque Nationale du Canada, acceptation bancaire 1,18 %ST38029 2015-02-03 5 775 5 762
55 Banque Nationale du Canada, acceptation bancaire 1,18 %ST38037 2015-02-03 55 55
613 Banque Nationale du Canada, acceptation bancaire 1,18 %ST38038 2015-02-03 615 614
249 Banque Nationale du Canada, acceptation bancaire 1,19 %ST38164 2015-02-03 250 249
70 Banque Nationale du Canada, acceptation bancaire 1,19 %ST38175 2015-02-03 70 70
1 697 Gouvernement du Canada, bon du trésor 0,89 %1350Z7U69 2015-02-12 1 700 1 697
1 711 Province de l'Ontario, bon du trésor 0,99 %6832Z52G4 2015-02-18 1 715 1 711
1 386 VW Credit Canada inc., papier commercial 2,33 %92890ABL0 2015-02-19 1 390 1 389
498 Province de la Saskatchewan, note promissoire 0,49 %80390AC96 2015-03-09 500 496
199 Banque Canadienne Impériale de Commerce,
acceptation bancaire
1,15 %136072CT0 2015-03-26 200 199
996 Gouvernement du Canada, bon du trésor 0,87 %1350Z7VZ4 2015-03-26 1 000 997
990 Province de l'Ontario, bon du trésor 1,05 %6832Z53P3 2015-09-16 1 000 992
789 Banque Manuvie du Canada, note promissoire 1,41 %564912K28 2015-10-02 800 791
Total - instruments du marché monétaire 116 097 116 250 116 145
34

FONDS DE SOLIDARITÉ DES TRAVAILLEURS DU QUÉBEC (F.T.Q.)Relevé des autres investissements
au 30 novembre 2014
non audité( )
Prix de
contrat ou
d'exercice
Juste
valeurCoût
Échéance /
livraisonNombre
d'unités
Valeur
notionnelle(en milliers $)(en milliers $)(en milliers $)
Élément sous-jacent
Contrats à terme - position acheteur
Gouvernement du Canada, 2,75 %, 2016-09-01F135ZQ00412 103,03 CAD 2014-12-04 74 000 000 76 239 39 -
Indice devise australienneADZ4F14MER 90,36 USD 2014-12-15 13 1 260 - -
Indice E-Mini TechnologieIXTZ4F13NEW 398,30 USD 2014-12-19 75 3 629 - -
Indice Euro StoXX 50VGZ4F04NEW 3 163,03 EUR 2014-12-19 187 8 623 - -
Indice Euro StoXX 50 dividendDEDZ6F13NEW 110,00 EUR 2016-12-16 65 1 049 - -
Indice Nikkei 225NHZ4F04NEW 15 295,00 JPY 2014-12-11 39 3 271 - -
Indice S&P 500 E-MiniESZ4F04NEW 2 056,43 USD 2014-12-19 28 3 299 - -
Taux d'intérêt 3 mois acceptations bancaires canadiennesBAU5F14MER 98,47 CAD 2015-09-14 200 49 335 - -
Taux d'intérêt 3 mois eurodollarEDZ5F14MER 98,92 USD 2015-12-14 200 56 585 - -
Taux d'intérêt 3 mois eurodollarEDZ6F14MER 98,00 USD 2016-12-19 1 400 392 443 - -
Taux d'intérêt 3 mois eurodollarEDU6F14MER 98,23 USD 2016-09-19 600 168 575 - -
Taux d'intérêt 3 mois eurodollarEDM7F14MER 97,40 USD 2017-06-19 200 55 852 - -
Taux d'intérêt 3 mois indice EuriborERM5F14MER 99,76 EUR 2015-06-15 150 53 266 - -
Taux d'intérêt 3 mois indice EuriborERH6F14MER 99,80 EUR 2016-03-14 300 106 500 - -
Taux d'intérêt 3 mois indice EuriborERZ7F14MER 98,97 EUR 2017-12-18 300 106 271 - -
Taux d'intérêt 3 mois livre sterlingL Z5F14MER 98,40 GBP 2015-12-16 250 55 306 - -
US Treasuries, 1,00 %, 2019-09-30F912TR10412 97,29 USD 2014-12-04 15 000 000 16 641 81 -
US Treasuries, 2,75 %, 2024-02-15F912B660412 103,85 USD 2014-12-04 15 000 000 17 762 217 -
Total - contrats à terme - position acheteur 1 175 906 337
Contrats à terme - position vendeur
Dollar américainFUSD081214 1,14 CAD 2014-12-08 134 000 152 (1) -
Dollar américainFUSD081214A 1,13 CAD 2014-12-08 2 484 000 2 816 (17) -
Dollar américainFUSD091214 1,13 CAD 2014-12-09 25 506 000 28 847 (243) -
Dollar américainFUSD091214A 1,12 CAD 2014-12-09 2 386 000 2 681 (40) -
Dollar australienFAUD081214 0,98 CAD 2014-12-08 6 962 000 6 822 48 -
Dollar canadienCDZ4F14MER 90,25 USD 2014-12-16 10 997 - -
EuroFEUR081214 1,42 CAD 2014-12-08 2 247 354 3 191 (4) -
Gouvernement du Canada, 2,25 %, 2025-06-01F135D500412 100,97 CAD 2014-12-04 30 500 000 30 797 (541) -
Indice devise Nouvelle-ZélandeNVZ4F14MER 81,00 USD 2014-12-15 13 1 161 - -
Indice Euro StoXX 50 dividendDEDZ5F13NEW 111,70 EUR 2015-12-18 65 1 040 - -
Indice S&P 500 E-MiniESZ4F04RBC 1 976,19 USD 2014-12-19 38 4 476 - -
Livre sterlingFGBP081214 1,82 CAD 2014-12-08 6 550 000 11 899 202 -
Taux d'intérêt 10 ans obligations du trésor américainTYH5F04NEW 125,85 USD 2015-03-20 550 79 676 - -
Taux d'intérêt 3 mois acceptations bancaires canadiennesBAH6F14MER 98,21 CAD 2016-03-14 200 49 265 - -
Taux d'intérêt 3 mois eurodollarEDZ7F14MER 96,98 USD 2017-12-18 400 111 368 - -
Taux d'intérêt 3 mois eurodollarEDU5F14MER 99,24 USD 2015-09-14 180 51 039 - -
Taux d'intérêt 3 mois eurodollarEDH6F14MER 98,60 USD 2016-03-14 220 62 102 - -
Taux d'intérêt 3 mois eurodollarEDM6F14MER 98,53 USD 2016-06-13 1 000 281 613 - -
Taux d'intérêt 3 mois eurodollarEDH7F14MER 97,80 USD 2017-03-13 600 167 865 - -
Taux d'intérêt 3 mois indice EuriborERZ5F14MER 99,90 EUR 2015-12-14 150 53 261 - -
Taux d'intérêt 3 mois indice EuriborERU6F14MER 99,46 EUR 2016-09-19 300 106 441 - -
Taux d'intérêt 3 mois indice EuriborERM7F14MER 99,17 EUR 2017-06-19 300 106 351 - -
Taux d'intérêt 3 mois livre sterlingL M5F14MER 98,85 GBP 2015-06-17 250 55 429 - -
US Treasuries, 0,88 %, 2016-09-15F912VW70412 100,82 USD 2014-12-04 33 000 000 37 937 (6) -
Total - contrats à terme - position vendeur 1 257 226 (602)
Contrats d'options - position vendeur
Indice Euro StoXX 50OSX5E3225 3 225,00 EUR 2014-12-19 500 2 292 (43)(18)
35

FONDS DE SOLIDARITÉ DES TRAVAILLEURS DU QUÉBEC (F.T.Q.)Relevé des autres investissements
au 30 novembre 2014
non audité( )
Prix de
contrat ou
d'exercice
Juste
valeurCoût
Échéance /
livraisonNombre
d'unités
Valeur
notionnelle(en milliers $)(en milliers $)(en milliers $)
Élément sous-jacent
Contrats d'options - position vendeur
Indice Euro StoXX 50SXSE3300 3 300,00 EUR 2015-01-16 350 1 642 (23)(16)
Indice Nikkei 225NKYF04NEW 16 500,00 JPY 2015-01-09 10 000 1 585 (20)(22)
Indice Nikkei 225ONKSF04NEW 18 000,00 JPY 2015-01-09 20 000 3 459 (54)(68)
Indice S&P 500ESZ4P1800B 1 800,00 USD 2014-12-19 1 000 2 052 (1)(27)
Indice S&P 500ESZ4P1850 1 850,00 USD 2014-12-19 1 000 2 109 (2)(25)
Indice S&P 500ESZ4P1900 1 900,00 USD 2014-12-19 750 1 625 (2)(28)
Indice S&P 500ESZ4C2050A 2 050,00 USD 2014-12-19 1 000 2 338 (37)(5)
Indice S&P 500ESF5P1925 1 925,00 USD 2015-01-16 1 000 2 195 (11)(27)
Total - contrats d'options - position vendeur (236) 19 297 (193)
Total - instruments financiers dérivés *(236) (458)
Total des autres investissements
De ces totaux, un montant de 1,0 M$, représentant la juste valeur négative des instruments financiers dérivés et un montant de 0,2 M$ représentant le coût de ces
instruments financiers dérivés, sont présentés sous Créditeurs et autres passifs aux états financiers du Fonds de solidarité des travailleurs du Québec (F.T.Q.) au 30
novembre 2014.
*
* 4 689 236 5 194 502
Titres achetés en vertu de conventions de revente
Au 30 novembre 2014, la juste valeur des titres en portefeuille achetés en vertu de conventions de revente est de 215,8 M$. Ces titres sont des obligations. Ces transactions
ont été exécutées entre le 12 novembre 2014 et le 28 novembre 2014, tandis que leurs échéances se situent dans l'intervalle compris entre le 1er décembre 2014 et le 10
décembre 2014. Le montant payé est de 215,2 M$ et il correspond à la juste valeur des titres reçus.
Titres vendus en vertu de conventions de rachat
Au 30 novembre 2014, la juste valeur des titres en portefeuille vendus en vertu de conventions de rachat est de 353,4 M$. Ces titres sont des obligations. Ces transactions ont
été exécutées entre le 3 novembre 2014 et le 28 novembre 2014, tandis que leurs échéances se situent dans l'intervalle compris entre le 1er décembre 2014 et le 11 décembre
2014. Le collatéral reçu est de 360,5 M$. Le prix de rachat à payer est de 353,1 M$.
36

AS AT NOVEMBER 30, 2014
INDEX OF THE SHARE OF THE FONDS IN INVESTMENTS
MADE BY THE SPECIALIZED FUNDS, AT COST (UNAUDITED)

1
Information from Secured TotalAnnual Financial Shares Loans and Loans andReport dated and Units advances advances
12-31-13 BDR Capital s.e.c.Securities of fourteen companies 26,398 3,907 30,305
12-31-13 FIER Partenaires, société en commanditeCapital St-Laurent, s.e.c.Fonds Brightspark II, s.e.c.Fonds CTI sciences de la vie, s.e.c.Fonds d'investissement iNovia II, société en commanditeFonds d'investissement Réal III, s.e.c.Fonds Propulsion III s.e.c.GO capital s.e.c.Novacap Industries III, s.e.c.Novacap Technologies III, s.e.c.Rho Canada Capital de Risque, s.e.c.Société en commandite AgeChemSecurities of three other companies
33,701 33,701Funds committed but not disbursed 18,275
51,976
03-31-14 Fonds Bio-Innovation, société en commanditeSecurities of ten companies 6,983 2,099 989 10,071Funds committed but not disbursed 2,124
12,195
05-31-14 Fonds de solidarité FTQ Investissements croissance I, s.e.c.2525 inc. 450 450Colo-D inc. 450 450Distech Contrôles inc. 1,333 1,333iBwave Solutions inc. 381 381Lumenpulse inc. 3,334 3,334
5,948 5,948
05-31-14 Fonds de solidarité FTQ Investissements technologiques I, s.e.c.Axesnetwork Solutions inc. 667 667Bonlook inc. 31 31Cadens Imagerie Médicale inc. 1 667 668E2metrix inc. 333 333Embrionix Design inc. 444 444GCS Medical inc. 23 23mConcierge Systems inc. 166 166Réflex Photonique inc. 500 333 833
2,165 1,000 3,165
12-31-13 Fonds d'investissement de la culture et des communications, société en commanditeAttraction Média inc.Carpediem film & TV inc.Datsit Studios inc.De Marque inc.Gestion Juste pour Rire inc.Groupe Phaneuf inc.Groupe Star Suites inc.GVGS inc. (Laboratoire de test Enzyme)Hibernum Créations inc.La Compagnie Larivée, Cabot, ChampagneLaboratoires GSS inc.Lotb Productions inc. (Echo Média)Max Films inc.Média Cineflix inc.Media-Max inc.Modus FX inc.Scène Scapin inc.Studios Budge inc.Via Éditorial, société en commanditeVivavision inc.Wilson & Lafleur, limitéeSecurities of six other companies
1,796 6,123 4,132 12,051Funds committed but not disbursed 2,173
14,224
FONDS DE SOLIDARITÉ DES TRAVAILLEURS DU QUÉBEC (F.T.Q.)Index of the Share of the Fonds in investments Made by the Specialized Funds, at Cost
(unaudited)as at November 30, 2014
(in thousands $)
Unsecured

2
Information from Secured TotalAnnual Financial Shares Loans and Loans andReport dated and Units advances advances
FONDS DE SOLIDARITÉ DES TRAVAILLEURS DU QUÉBEC (F.T.Q.)Index of the Share of the Fonds in investments Made by the Specialized Funds, at Cost
(unaudited)as at November 30, 2014
(in thousands $)
Unsecured
12-31-13 Fonds immobilier de solidarité FTQ inc.1030-1040 de Bleury s.e.c. 15,681 15,681300 St-Paul Québec inc. 1,917 1,917325 St-Vallier inc. 2,083 2,083790 Rand s.e.c. 1,654 1,65481-83 Richelieu s.e.c. 880 3,000 3,880875 Charest s.e.c. 2,010 2,010880 Honoré-Mercier s.e.c. 30,103 30,103Brossard-sur-le-Fleuve s.e.c. 2,217 2,217Carré Chambord s.e.c. 10 10Centre de développement des Biotechnologies de Laval s.e.c. 5,100 5,100Condominiums Le George V s.e.c. 10 10Condominiums Renaissance Blainville s.e.c. 653 653Condos Wanklyn-Milot s.e.c. 4,597 4,597CPA Fontainebleau, s.e.c. 753 753Développement Joseph-Morin, s.e.c. 250 250Développements Wilfrid-Carrier s.e.c. 7,956 7,956Espace MV1 s.e.c. 1 1Espace MV2 s.e.c. 1 1Espace MV3 s.e.c. 2,700 500 3,200Espaces Lebourgneuf Phase III s.e.c. 2,800 2,800Fonds d'acquisition de Montréal, société en commandite 5,080 5,080Fonds d'acquisition québécois, société en commandite 5,073 5,073Fonds d'investissement de Montréal (F.I.M.), société en commandite 1,607 1,607Fonds d'investissement de Montréal (F.I.M.) II, société en commandite 979 979Fonds d'investissement de Montréal (F.I.M.) III, société en commandite 1,957 52 2,009Gérer son Quartier 3,562 3,562Graham-Mont-Royal s.e.c. 7,194 7,194Montée des Pionniers Phase 1 s.e.c. 500 500Montée des Pionniers Phase II s.e.c. 500 1,177 1,677R.P.A. Mont-Joli s.e.c. 901 71 972R.P.A. Rawdon s.e.c. 1,209 1,209Société en commandite Bourassa- Pelletier 10 9,603 9,613Société en commandite Château Hymus 1 1Société en commandite Clairevue 150 162 312Société en commandite D.P.L.S. 1,521 100 1,621Société en commandite des Bassins I 2,500 3,750 6,250Société en commandite GII, Ilôt 10 (Comm-bur) 2,682 176 3,115 5,973Société en commandite GII, Ilôt 10 (Résidentiel) 1,166 189 4,974 6,329Société en commandite Griffintown II 2,468 2,468Société en commandite Griffintown II, Phase II 2,777 2,777Société en commandite Griffintown II, Phase II (Commercial) 2,348 1,600 3,948Société en commandite Griffintown II, Phase II (Condos-Tour 1) 964 2,200 3,164Société en commandite Griffintown II, Phase II (Condos-Tour 2) 1,042 1,300 2,342Société en commandite Griffintown II, Phase II (Tour 3) 378 378Société en commandite Griffintown II, Ilot 09 (locatif) 3,768 3,768Société en commandite Griffintown II, Phase III (Bloc I) 581 581Société en commandite Héritage Pointe-Claire 1 1Société en commandite immobilière T.D.C. 5,050 5,050Société en commandite Laurin/ St-Louis Phase I 8,266 15,686 23,952Société en commandite QDS 28,500 28,500Société en commandite Rose de Lima 10 10Société en commandite St-Bruno-sur-le-Lac Phase 4 2,000 2,305 4,305Société en commandite Viau Ontario 1 1Souvenir-Corbusier s.e.c. 1 1St-Paul/Du Palais s.e.c. 3,928 3,928Technoparc Bromont Phase I s.e.c. 1,383 1,383Urbania Phase VII s.e.c. 1 1Wanklyn-Milot s.e.c. 3,566 3,56647 general partners of limited partnerships 1 1
161,759 42,797 30,406 234,962Direct holdings :Terrain Boul. Lucille Teasdale, Terrebonne 2,596Terrain Boul. Le Corbusier, Laval 11,377
248,935

3
Information from Secured TotalAnnual Financial Shares Loans and Loans andReport dated and Units advances advances
FONDS DE SOLIDARITÉ DES TRAVAILLEURS DU QUÉBEC (F.T.Q.)Index of the Share of the Fonds in investments Made by the Specialized Funds, at Cost
(unaudited)as at November 30, 2014
(in thousands $)
Unsecured
12-31-13 Fonds immobilier de solidarité FTQ I, s.e.c.1061 St-Alexandre s.e.c. 1 19176-0934 Québec inc. 647 647C.C.L. II, société en commandite 559 559Complexe d'affaires 440, s.e.c. 2,825 2,825Condos Miscéo s.e.c. 225 225Immobilière St-Hippolyte, s.e.c. 317 317Sfère-Ahuntsic s.e.c. 1,483 1,483Société en commandite 1190 Jeanne-Mance 6 2,193 2,199Société en commandite 544 de l'Inspecteur 3,314 3,314Société en commandite Alfred-Nobel 14 14Société en commandite Alphonse T. Lépine 1,725 1,725Société en commandite Ann-Ottawa 1,502 2,192 3,694Société en commandite Beauharnois 8 8Société en commandite Claude Baillif 1,045 1,045Société en commandite Inspecteur-William 20 20Société en commandite Les Berges Brossard 11 9 20Société en commandite Milton 17 17Société en commandite Place Dunant 150 150Société en commandite Square Mont-Royal 5 5Société en commandite Ste-Hélène 27 20 47Village de la Gare s.e.c. 500 375 87514 general partners of limited partnerships 1 1
10,097 5,880 3,214 19,191Direct holding :Terrain ave. du Lac-Clermoutier, Chertsey 1,295
20,486
12-31-13 Fonds immobilier de solidarité FTQ II, s.e.c.1030-1040 de Bleury s.e.c. 4,100 4,1001405 Henri-Bourassa ouest s.e.c. 2,932 2,9329176-0934 Québec inc. 647 647Capital BLF inc. 1,842 1,842Espaces Lebourgneuf s.e.c. 3,471 3,471Faubourg la Grande Place, s.e.c. 1,201 1,201Hôtel Particulier:Le Ste-Hélène s.e.c. 6 3,827 3,833Immobilière Concorde-Corbusier s.e.c. 3,400 3,400Les Haltes du Roi s.e.c. 806 806Neuvième Avenue s.e.c. 410 2,710 3,120SEC St-Bruno-sur-le-Lac Phase 2 1 1SEC St-Bruno-sur-le-Lac Phase 3 10 10Société en commandite Ann-Ottawa 2,192 2,192Société en commandite Cavelier de La Salle 4,326 107 4,433Société en commandite CDTI de Hull 100 100Société en commandite du 259 boulevard St-Joseph-Hull 133 133Société en commandite JBSL 10 10Société en commandite Mansfield 2,075 2,075Société en commandite RMI 239 239Trois A, Société en commandite 850 850Village de la Gare s.e.c. 375 37516 general partners of limited partnerships 1 1
25,913 6,644 3,214 35,771Direct holdings :Condominium 410 des Récollets, Montréal 615Terrain ave. du Lac-Clermoutier, Chertsey 1,295
37,681

4
Information from Secured TotalAnnual Financial Shares Loans and Loans andReport dated and Units advances advances
FONDS DE SOLIDARITÉ DES TRAVAILLEURS DU QUÉBEC (F.T.Q.)Index of the Share of the Fonds in investments Made by the Specialized Funds, at Cost
(unaudited)as at November 30, 2014
(in thousands $)
Unsecured
08-31-14 Fonds locaux de solidarité FTQ, s.e.c.
352 352Centre local de développement (CLD) Centre-Ouest 10 10Centre local de développement (CLD) de la MRC de Caniapiscau 10 10Centre local de développement (CLD) de la MRC de Maskinongé 173 173Centre local de développement (CLD) de Marguerite-D'Youville 405 405Centre local de développement (CLD) des Îles-de-la-Madeleine 38 10 48Centre local de développement (CLD) du Fjord 10 10Centre local de développement (CLD) du Haut-St-François 150 150
15 15
10 10Centre local de développement (CLD) Montréal-Nord 10 10Centre local de développement au Cœur de la Montérégie 10 10Centre local de développement Beauharnois-Salaberry 487 487Centre local de développement de Brome-Missisquoi 10 10Centre local de développement de l'Île d'Orléans 10 10Centre local de développement de la Basse-Côte-Nord 10 10Centre local de développement de la Côte-de-Beaupré 342 342Centre local de développement de la Haute-Côte-Nord (CLDHCN) 10 10Centre local de développement de la M.R.C. d'Avignon inc. 60 10 70Centre local de développement de la M.R.C. de Bonaventure 280 280Centre local de développement de la Mitis 63 10 73Centre local de développement de la MRC de Charlevoix 205 205Centre local de développement de la MRC de Charlevoix-Est inc. 143 60 203Centre local de développement de la MRC de Memphrémagog 230 230Centre local de développement de la MRC de Sept-Rivières inc. 32 249 281Centre local de développement de la MRC des Laurentides 380 380Centre local de développement de la MRC du Val-Saint-François 10 10Centre local de développement de la MRC Les Maskoutains 250 250Centre local de développement de la MRC Robert-Cliche 163 163
70 70
100 100Centre local de développement de la Nouvelle-Beauce (C.L.D.N.B.) 10 10Centre local de développement de la région d'Acton 60 60Centre local de développement de la région de Rivière-du-Loup 125 125Centre local de développement de la Vallée-du-Richelieu 50 50Centre local de développement de Lachine (CLD Lachine) 10 10Centre local de développement de Longueuil «CLD» 370 370Centre local de développement de Manicouagan 40 40Centre local de développement de Québec 10 10Centre local de développement de Rimouski-Neigette (CLD) 45 45Centre local de développement de Roussillon 77 4 81Centre local de développement des Basques 30 30Centre local de développement des Collines-de-l'Outaouais 10 10Centre local de développement des Etchemins 17 10 27Centre local de développement des Pays-d'en-Haut 10 10Centre local de développement Domaine-du-Roy inc. 150 10 160Centre local de développement du Pontiac 10 10Centre local de développement les 3 Monts 10 10Centre local de développement Maria-Chapdelaine 114 30 144Centre local de développement Mékinac 444 444Centre local de développement Minganie 10 10Centre local du développement du Témiscamingue (C.L.D.T.) 10 10CLD de la MRC de Lotbinière 80 10 90Conseil Économique de Beauce (CEB) 95 95
210 210
120 120
10 10Corporation de développement économique de Lasalle (CLD) 10 10
560 560Développement économique - CLD Gatineau 460 460
Corporation de développement économique communautaire Ahuntsic-CartiervilleCorporation de développement économique communautaire Côte-des-Neiges/Notre-Dame-de-Grâce
Corporation de développement économique et communautaire Centre-sud/Plateau Mont-Royal
Corporation de développement économique communautaire (C.D.E.C.) Centre-Nord
CDEC Rosemont-Petite Patrie, corporation de développement économique communautaire
Centre local de développement (CLD) du territoire de la MRC d'ArgenteuilCentre local de développement (CLD) du territoire de la MRC du Rocher-Percé
Centre local de développement de la Municipalité régionale de comté de Bellechasse inc.Centre local de développement de la municipalité régionale de comté de d'Autray

5
Information from Secured TotalAnnual Financial Shares Loans and Loans andReport dated and Units advances advances
FONDS DE SOLIDARITÉ DES TRAVAILLEURS DU QUÉBEC (F.T.Q.)Index of the Share of the Fonds in investments Made by the Specialized Funds, at Cost
(unaudited)as at November 30, 2014
(in thousands $)
Unsecured
08-31-14 Fonds locaux de solidarité FTQ, s.e.c. (continued)Fonds local de solidarité (FLS) de la MRC de La Jacques-Cartier 10 10Fonds local de solidarité (FLS) MRC d'Antoine-Labelle 20 20Fonds local de solidarité (FLS) MRC de la Rivière-du-Nord 250 250Fonds local de solidarité Laval 10 10Fonds local de solidarité MRC de Coaticook 10 10Fonds local de solidarité MRC de Joliette 320 320
248 248Le centre local de développement de la M.R.C. de Bécancour inc. 367 367Regroupement économique et social du Sud-Ouest (RESO) 400 400Sherbrooke Innopole (CLD) 285 285Société de développement économique de la région de Thetford (CLD) 102 10 112Société de développement économique de Lévis (CLD) 220 220
110 110Société de développement économique Ville-Marie (CLD) 260 260SOLIDE de la M.R.C. de Matane 205 205SOLIDE de la M.R.C. de Vaudreuil-Soulanges 173 173SOLIDE de la MRC des Jardins-de-Napierville 10 10SOLIDE de la MRC du Fjord-du-Saguenay 10 10SOLIDE de Mercier/Hochelaga-Maisonneuve 10 10
876 9,762 10,638Funds committed but not disbursed 45,832
56,470
03-31-14 Fonds régional de solidarité Abitibi-Témiscamingue, société en commandite2645-3530 Québec inc. (Hardy Construction) 667 6672965-5099 Québec inc. (Les Réclamations du Nord-Ouest) 270 2703088-6469 Québec inc. (Centre Jardin Lac Pelletier) 172 1729052-5320 Québec inc. (Consultants B.C.H.) 125 1259187-1186 Québec inc. (Dan Extermination) 65 659187-8850 Québec inc. (Forage Boréal) 1,300 1,148 2,4489210-8737 Québec inc. (Pétroles Témis) 180 180A. & L. Pinard inc. 198 198Abitibi Royalties inc. 3 3Adventure Gold inc. 95 95Agritibi R.H. inc. 1,660 1,660ASDR Fabrication inc. 500 500Atelier Tangente inc. 222 222Centre de peinture L.B.G. inc. 141 141Corporation Aurifère QMX 200 200Corporation d'Or Intégra 150 150Entrepreneur Minier Promec inc. 246 246Exploration Azimut inc. 11 11Exploration Midland inc. 219 219Ferabi inc. 235 235Géliko inc. 200 200Groupe MBI inc. 1,642 1,642Groupe Technosub inc. 1,021 1,021H.P. Hydraulique inc. 240 240Industries Wood4 inc. 264 264Les Aciers J.P. inc. et Immobilière J.P. inc. 164 164Les équipements de forage VersaDrill inc. 1 383 384Les Grains du Témis inc. 455 455Les Ressources Yorbeau inc. 100 100LVL Global inc. 350 93 675 1,118Machineries Horticoles d'Abitibi inc. 108 108Machines Roger lnternational inc. 1,133 1,133Matamec Explorations inc. 141 141Mines de la Vallée de l'or ltée 214 214Mines Richmont inc. 142 142Modulabec inc. 750 750Propair inc. 1,350 1,350Ressources Cartier inc. 247 247Service Sani Tri inc. 201 201Transport Clément Bégin inc. 587 587VCC-Massénor inc. 320 320
5,882 12,031 675 18,588Funds committed but not disbursed 562
19,150
La Société de développement économique de Drummondville (CLD Drummond) inc.
Société de développement économique Rivière-des-Prairies - Pointe-aux-Trembles - Montréal-Est (CLD)
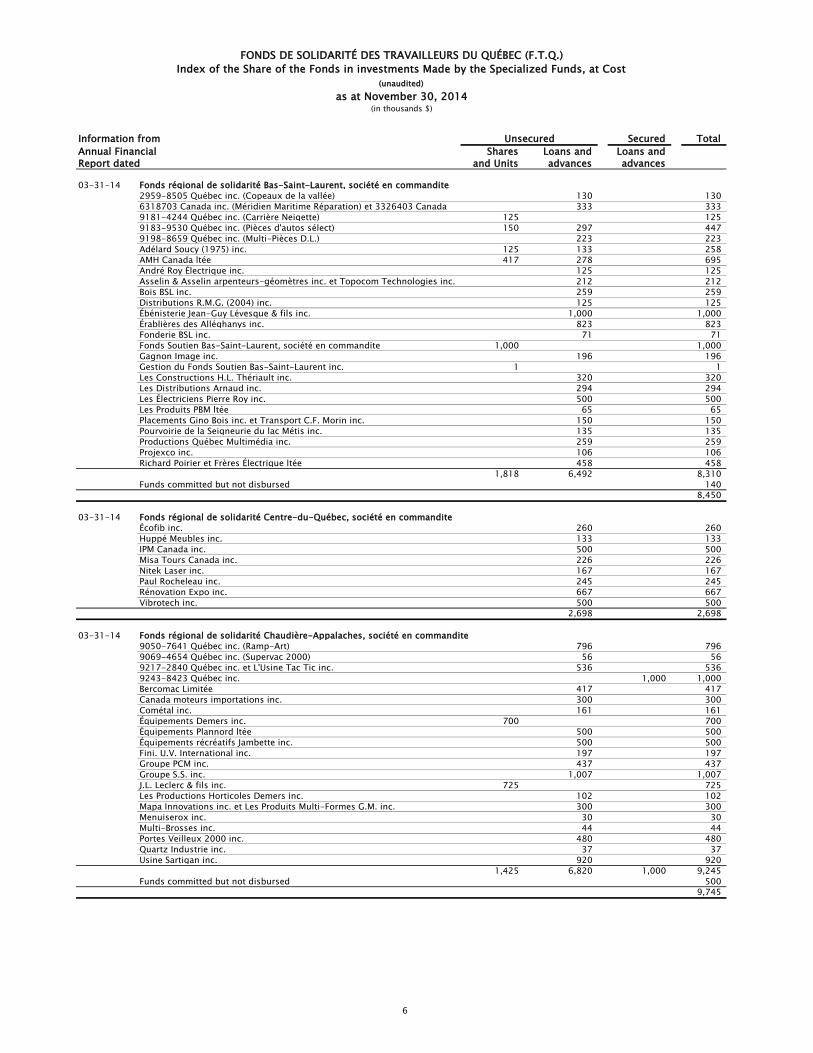
6
Information from Secured TotalAnnual Financial Shares Loans and Loans andReport dated and Units advances advances
FONDS DE SOLIDARITÉ DES TRAVAILLEURS DU QUÉBEC (F.T.Q.)Index of the Share of the Fonds in investments Made by the Specialized Funds, at Cost
(unaudited)as at November 30, 2014
(in thousands $)
Unsecured
03-31-14 Fonds régional de solidarité Bas-Saint-Laurent, société en commandite 2959-8505 Québec inc. (Copeaux de la vallée) 130 130
333 3339181-4244 Québec inc. (Carrière Neigette) 125 1259183-9530 Québec inc. (Pièces d'autos sélect) 150 297 4479198-8659 Québec inc. (Multi-Pièces D.L.) 223 223Adélard Soucy (1975) inc. 125 133 258AMH Canada ltée 417 278 695André Roy Électrique inc. 125 125Asselin & Asselin arpenteurs-géomètres inc. et Topocom Technologies inc. 212 212Bois BSL inc. 259 259Distributions R.M.G. (2004) inc. 125 125Ébénisterie Jean-Guy Lévesque & fils inc. 1,000 1,000Érablières des Alléghanys inc. 823 823Fonderie BSL inc. 71 71Fonds Soutien Bas-Saint-Laurent, société en commandite 1,000 1,000Gagnon Image inc. 196 196Gestion du Fonds Soutien Bas-Saint-Laurent inc. 1 1Les Constructions H.L. Thériault inc. 320 320Les Distributions Arnaud inc. 294 294Les Électriciens Pierre Roy inc. 500 500Les Produits PBM ltée 65 65Placements Gino Bois inc. et Transport C.F. Morin inc. 150 150Pourvoirie de la Seigneurie du lac Métis inc. 135 135Productions Québec Multimédia inc. 259 259Projexco inc. 106 106Richard Poirier et Frères Électrique ltée 458 458
1,818 6,492 8,310Funds committed but not disbursed 140
8,450
03-31-14 Fonds régional de solidarité Centre-du-Québec, société en commanditeÉcofib inc. 260 260Huppé Meubles inc. 133 133IPM Canada inc. 500 500Misa Tours Canada inc. 226 226Nitek Laser inc. 167 167Paul Rocheleau inc. 245 245Rénovation Expo inc. 667 667Vibrotech inc. 500 500
2,698 2,698
03-31-14 Fonds régional de solidarité Chaudière-Appalaches, société en commandite9050-7641 Québec inc. (Ramp-Art) 796 7969069-4654 Québec inc. (Supervac 2000) 56 569217-2840 Québec inc. et L'Usine Tac Tic inc. 536 5369243-8423 Québec inc. 1,000 1,000Bercomac Limitée 417 417Canada moteurs importations inc. 300 300Cométal inc. 161 161Équipements Demers inc. 700 700Équipements Plannord ltée 500 500Équipements récréatifs Jambette inc. 500 500Fini. U.V. International inc. 197 197Groupe PCM inc. 437 437Groupe S.S. inc. 1,007 1,007J.L. Leclerc & fils inc. 725 725Les Productions Horticoles Demers inc. 102 102Mapa Innovations inc. et Les Produits Multi-Formes G.M. inc. 300 300Menuiserox inc. 30 30Multi-Brosses inc. 44 44Portes Veilleux 2000 inc. 480 480Quartz Industrie inc. 37 37Usine Sartigan inc. 920 920
1,425 6,820 1,000 9,245Funds committed but not disbursed 500
9,745
6318703 Canada inc. (Méridien Maritime Réparation) et 3326403 Canada

7
Information from Secured TotalAnnual Financial Shares Loans and Loans andReport dated and Units advances advances
FONDS DE SOLIDARITÉ DES TRAVAILLEURS DU QUÉBEC (F.T.Q.)Index of the Share of the Fonds in investments Made by the Specialized Funds, at Cost
(unaudited)as at November 30, 2014
(in thousands $)
Unsecured
03-31-14 Fonds régional de solidarité Côte-Nord, société en commandite7583168 Canada inc. (Les Entreprises Electro Select) 176 1769011-1501 Québec inc. (Pompage Pelletier) 799 7999196-7109 Québec inc. (Parmon Construction) 716 7169262-3701 Québec inc. (Résidence J.R. Lafontaine) 248 248Carrosserie Pro 2010 inc. 393 393Construction Fortin & Lévesque inc. 1,050 1,050Construction J.G.M. inc. 687 687Fonds Soutien Côte-Nord, société en commandite 1,000 1,000Gestion du Fonds Soutien Côte-Nord inc. 1 1Hôtel Mingan inc. 1,842 1,842Hôtel Motel Le Q'Artier des Îles inc. 600 600Lajoie Réfrigération inc. 88 88Les Distributions G.F.D. inc. 456 456Les Motels de l'Énergie inc. 400 400Les Pétroles Paul Larouche inc. 180 180Nord Industrie inc. 109 109Pec-Nord inc. 300 300Synergica Alliance inc. 240 240
1,301 7,984 9,285
03-31-14 Fonds régional de solidarité Estrie, société en commandite9100-2790 Québec inc. (Multi distribution Sherbrooke inc.) 187 1879159-7500 Québec inc. (Armoires NAC) 337 337Acier Fastech inc. 296 296Amecci inc. 217 217Ani-Mat inc. 1,154 1,154Boréal - Informations stratégiques inc. 1,018 1,018Domaines Pinnacle inc. 506 506Innotex inc. 722 722Kemestrie inc. 630 630LeProhon inc. 739 739Les Cartons Northrich inc. 175 175Les Entreprises Dauphinais inc. 472 472Les Industries Touch inc. 1,158 1,158Les Quais Bertrand inc. 587 587Les Viandes Laroche inc. 407 407M.P. Éco inc. 342 342Motrec international inc. 896 896Oasis Tropik Nordik inc. 150 150Scholer Industriel inc. 107 107Signalisation de l'Estrie inc. 500 500Soudure Brault inc. 130 130Sport Powertek inc. 227 227
630 10,327 10,957Funds committed but not disbursed 1,150
12,107
03-31-14 Fonds régional de solidarité Gaspésie - Îles-de-la-Madeleine, société en commanditeB.M.B. (Îles-de-la-Madeleine) inc. 524 524Cap sur mer inc. 632 30 662Duclos & Michaud Télécom inc. 125 217 342Fabrication Delta inc. 219 219Fonds Soutien Gaspésie-Îles-de-la-Madeleine, société en commandite 1,000 1,000Gaspésie Diésel inc. 218 218Gestion du Fonds Soutien Gaspésie-Îles-de-la-Madeleine inc. 1 1Junex inc. 46 46Les entreprises Léo Leblanc & fils inc. 282 282Les Pêcheries Marinard ltée 700 700Les Reboiseurs de la Péninsule inc. 48 48Pêcheries Vilo inc. 281 281Serres Jardins-Nature inc. 97 269 366
2,425 2,264 4,689

8
Information from Secured TotalAnnual Financial Shares Loans and Loans andReport dated and Units advances advances
FONDS DE SOLIDARITÉ DES TRAVAILLEURS DU QUÉBEC (F.T.Q.)Index of the Share of the Fonds in investments Made by the Specialized Funds, at Cost
(unaudited)as at November 30, 2014
(in thousands $)
Unsecured
03-31-14 Fonds régional de solidarité Lanaudière, société en commanditeABC Environnement inc. 168 168ABC Environnement inc. et 9216-4615 Québec inc. 400 400Agro-100 ltée 500 500Gestion EDB Mondor inc. 300 300Groupe Manucam inc. 749 749Laboratoires Bi-Op inc. 1,250 1,250Multi-modèles Martin Gaudet inc. 80 80Pneus Lanoraie inc. 164 164Sécurité GMR inc. 30 30Triotech Amusement inc. 751 751Verre Select inc. 108 108
4,500 4,500
03-31-14 Fonds régional de solidarité Laurentides, société en commandite4486021 Canada inc. (Aliments Urbains) 147 1477661665 Canada inc. (Profab mécanique 2010) et 9151-0768 Québec inc. 500 5009018-4995 Québec inc. (Lacelle & Frères) 102 102Autobus Lion inc. 350 350BMI Canada inc. 1,596 1,596Canrep inc. 200 200Complexe Hôtelier St-Jovite/ Mont-Tremblant inc. 750 750Distributions Denis Fontaine inc. 210 210Garage François Thouin inc., Remorques CFT inc. et 8236011 Canada inc. 596 596Gestion Estérel inc. 694 694Gestion hôtelière REVPAR inc. 133 133Groupe Aviation et Puissance inc. 1,117 1,117Groupe Sima Palsol inc. 7 7Groupe Star Suites inc. 1,010 1,010La Petite Bretonne inc. 1,092 1,092Le Groupe Synergie Xpress inc. 217 217Lev-Fab inc. 300 300Montour ltée 350 350Myre, Pageau & Associés Consultant immobilier inc. 150 150Palmex International inc. 108 108Service Alimentaire Desco inc. 347 347Vision Villégiature inc. 300 300
1,050 9,226 10,276Funds committed but not disbursed 200
10,476
03-31-14 Fonds régional de solidarité Laval, société en commandite9160-5188 Québec inc. (Hulix Construction) 491 4919210-9107 Québec inc. (Jungle Aventure) 242 242Ciel Aventure Québec inc. 1,000 1,000Forages M.S.E. inc. et ICANDA Corporation 750 750Hydrolico International inc. 867 867K.F. Construction inc. 480 480Les Bouteilles Recyclées du Québec (B.R.Q.) inc. 126 275 401Paris, Ladouceur & associés inc. 250 250Produits Alimentaires Berthelet inc. 917 917S.R.A.D. Communications inc. 167 167
126 5,439 5,565Funds committed but not disbursed 1,000
6,565
03-31-14 Fonds régional de solidarité Mauricie, société en commandite9145-5980 Québec inc. (Transport Jacques Labbé) 400 400Climatisation Trois-Rivières inc. 100 100Concept Éco-Plein-Air Le Baluchon inc. 751 601 1,352Portes & fenêtres Nouvel Horizon inc. 500 500Simaudio Ltée 500 500
751 2,101 2,852

9
Information from Secured TotalAnnual Financial Shares Loans and Loans andReport dated and Units advances advances
FONDS DE SOLIDARITÉ DES TRAVAILLEURS DU QUÉBEC (F.T.Q.)Index of the Share of the Fonds in investments Made by the Specialized Funds, at Cost
(unaudited)as at November 30, 2014
(in thousands $)
Unsecured
03-31-14 Fonds régional de solidarité Montérégie, société en commandite7774672 Canada inc., 3897338 Canada inc. et 3897320 Canada inc. 295 295Agro-Bio contrôle inc. 185 185Agrocentre Belcan inc. 117 117Alimentation L'Épicier inc. 733 733Aliments Horizon Nature inc. 528 528Allard & Ricard inc. 400 400Andy transport inc. 160 160Atelier d'usinage Quenneville inc. 107 107Bousquet Frères Limitée 420 420Contrôle Industriel C.T.H. ltée 300 300Corporation Norme Internationale inc. 300 300Corporation Smartsilk inc. 444 444DCL Nutrition & santé animale inc. 300 300Emballages Cré-O-Pack International inc. 434 434FDC Composites inc. 196 196Galerie au chocolat inc. 300 300Groupe Carreaux Céragrès inc. 2,000 2,000Groupe Exel International inc. 91 91Groupe Lincora inc. 122 122Investissements Brasco inc. 631 631Laboratoires Natrum inc. et Dermolab Pharma ltée 292 292Le Groupe Conseil Integrim inc. 423 423Les industries Cendrex inc. 308 308Les Investissements Sylnic inc. 217 217Les Laboratoires de recherche de Lan Wirewerks inc. 487 487Les Productions Diamant ltée 90 90Les Produits de Ventilation Lambro inc. 95 95Les sols Sportica inc. 150 150Location Jean Légaré ltée 346 346M.G.B. Électrique inc. 814 814Magnus Poirier inc. 777 777Matériaux paysagers Savaria ltée 434 434Perfecta Plywood ltée 555 555Perlite Canada inc. 433 433Plombco inc. 287 287Portes et fenêtres Cordy inc. 275 275Quincaillerie architecturale Capsol inc. 128 128Ray-Mont Logistiques inc. 1,090 1,090RB&C Maintenance de voies inc. 200 200Secco International inc. 700 700Service sérigraphique professionnel S.S.P. inc. 423 423Soya Excel inc. 147 147SPB Psychologie organisationnelle inc. 600 600Stylo Bankers (1991) inc. 583 583Tornatech inc. 729 729Vulcan Compagnie de Palans ltée 743 743
570 17,729 1,090 19,389
03-31-14 Fonds régional de solidarité Nord-du-Québec, société en commandite9129-3852 Québec inc. (Entretien industriel D.L.B.) 133 1339181-4228 Québec inc. (Nord Décoration inc.) 100 1009189-3081 Québec inc. (Relais du Lac Caché) 400 400Cogitore Resources inc. 167 167Corporation Éléments Critiques 138 138Donner Metals Ltd 387 200 587Équipement de bureau Ungava inc. 247 247Exploration Azimut inc. 187 187Exploration Dios inc. 56 56Exploration Khalkos inc. 6 6Exploration Midland inc. 113 113Exploration NQ inc. 71 71Focus Graphite inc. 10 10Fonds Soutien Baie-James, société en commandite 500 500Gestion du Fonds Soutien Baie-James inc. 1 1Les Consultants de l'Arctique inc. 190 66 256Les Pétroles M.J. inc. 59 59M.A.S. Chibougamau inc. 600 600Mines Coulon inc. 200 200Mines Virginia inc. 71 71Nemaska Lithium inc. 77 77
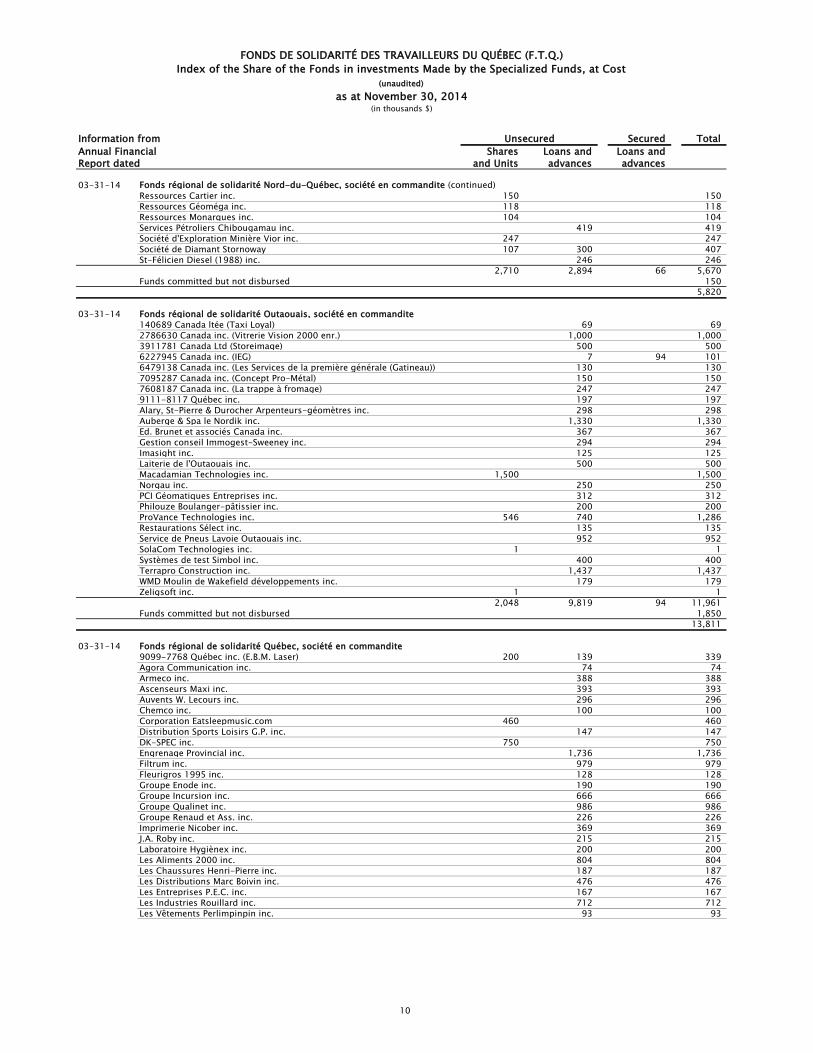
10
Information from Secured TotalAnnual Financial Shares Loans and Loans andReport dated and Units advances advances
FONDS DE SOLIDARITÉ DES TRAVAILLEURS DU QUÉBEC (F.T.Q.)Index of the Share of the Fonds in investments Made by the Specialized Funds, at Cost
(unaudited)as at November 30, 2014
(in thousands $)
Unsecured
03-31-14 Fonds régional de solidarité Nord-du-Québec, société en commandite (continued)Ressources Cartier inc. 150 150Ressources Géoméga inc. 118 118Ressources Monarques inc. 104 104Services Pétroliers Chibougamau inc. 419 419Société d'Exploration Minière Vior inc. 247 247Société de Diamant Stornoway 107 300 407St-Félicien Diesel (1988) inc. 246 246
2,710 2,894 66 5,670Funds committed but not disbursed 150
5,820
03-31-14 Fonds régional de solidarité Outaouais, société en commandite140689 Canada ltée (Taxi Loyal) 69 692786630 Canada inc. (Vitrerie Vision 2000 enr.) 1,000 1,0003911781 Canada Ltd (Storeimage) 500 5006227945 Canada inc. (IEG) 7 94 1016479138 Canada inc. (Les Services de la première générale (Gatineau)) 130 1307095287 Canada inc. (Concept Pro-Métal) 150 1507608187 Canada inc. (La trappe à fromage) 247 2479111-8117 Québec inc. 197 197Alary, St-Pierre & Durocher Arpenteurs-géomètres inc. 298 298Auberge & Spa le Nordik inc. 1,330 1,330Ed. Brunet et associés Canada inc. 367 367Gestion conseil Immogest-Sweeney inc. 294 294Imasight inc. 125 125Laiterie de l'Outaouais inc. 500 500Macadamian Technologies inc. 1,500 1,500Norgau inc. 250 250PCI Géomatiques Entreprises inc. 312 312Philouze Boulanger-pâtissier inc. 200 200ProVance Technologies inc. 546 740 1,286Restaurations Sélect inc. 135 135Service de Pneus Lavoie Outaouais inc. 952 952SolaCom Technologies inc. 1 1Systèmes de test Simbol inc. 400 400Terrapro Construction inc. 1,437 1,437WMD Moulin de Wakefield développements inc. 179 179Zeligsoft inc. 1 1
2,048 9,819 94 11,961Funds committed but not disbursed 1,850
13,811
03-31-14 Fonds régional de solidarité Québec, société en commandite9099-7768 Québec inc. (E.B.M. Laser) 200 139 339Agora Communication inc. 74 74Armeco inc. 388 388Ascenseurs Maxi inc. 393 393Auvents W. Lecours inc. 296 296Chemco inc. 100 100Corporation Eatsleepmusic.com 460 460Distribution Sports Loisirs G.P. inc. 147 147DK-SPEC inc. 750 750Engrenage Provincial inc. 1,736 1,736Filtrum inc. 979 979Fleurigros 1995 inc. 128 128Groupe Enode inc. 190 190Groupe Incursion inc. 666 666Groupe Qualinet inc. 986 986Groupe Renaud et Ass. inc. 226 226Imprimerie Nicober inc. 369 369J.A. Roby inc. 215 215Laboratoire Hygiènex inc. 200 200Les Aliments 2000 inc. 804 804Les Chaussures Henri-Pierre inc. 187 187Les Distributions Marc Boivin inc. 476 476Les Entreprises P.E.C. inc. 167 167Les Industries Rouillard inc. 712 712Les Vêtements Perlimpinpin inc. 93 93

11
Information from Secured TotalAnnual Financial Shares Loans and Loans andReport dated and Units advances advances
FONDS DE SOLIDARITÉ DES TRAVAILLEURS DU QUÉBEC (F.T.Q.)Index of the Share of the Fonds in investments Made by the Specialized Funds, at Cost
(unaudited)as at November 30, 2014
(in thousands $)
Unsecured
03-31-14 Fonds régional de solidarité Québec, société en commandite (continued)Machitech inc. 1,000 1,000Maçonnerie Dynamique ltée 475 475Métafab (1996) inc. 500 500Métal Potvin inc. 374 374Miro Cuisines Tendances inc. 596 596Mode Avalanche inc. 81 81Panavidéo inc. 194 194Radio-Onde inc. 861 861SGPP (Québec) inc. (Simon Giguère Produits Pétroliers) 532 532TBC Constructions inc. 750 750Vohl inc. et Gestion A.V.F. inc. 300 300
1,491 14,753 500 16,744Funds committed but not disbursed 800
17,544
03-31-14 Fonds régional de solidarité Saguenay - Lac-Saint-Jean, société en commandite2861-0467 Québec inc. (Notre Hôtel) 169 205 3742956-3475 Québec inc. (Interbus) 86 866482066 Canada inc. (Société P.C.P.) 871 8718439117 Canada inc. (Récupère Sol) 1,000 1,0009055-3876 Québec inc. (Les Chocolats Lulu) 380 3809099-3593 Québec inc. (Inter-Projet) 800 8009107-6513 Québec inc. (Menuiserie St-Henri) 146 146
743 7439143-8945 Québec inc. 839 839A.S. Nettoyage inc. 120 120Cycles Devinci inc. 1 1Dynamitage Express inc. 968 968Garage Marcel Simard inc. 400 400Gestion du Fonds AP 60 inc. 1 1Gestion LJ inc. 73 73Groupe Giroux Maçonnex inc. 560 560Industrie Bois Lamontagne inc. 430 430Industries Bofab inc. 259 259Isumi Précision ltée 58 58Laval Fortin ltée 1,000 1,000Les Équipements pétroliers Claude Pedneault inc. 464 464Les Fenêtres AGM inc. 158 300 200 658Les Lignes du Fjord inc. 26 26Les Pétroles R.L. inc. 142 142Les Placements G.M.R. Maltais inc. 40 40Nolicam Location de camions inc. 300 352 652Novabrik International inc. 1,405 117 1,522Oxygène Dolbeau inc. 100 100Pétrolex St-Félicien inc. 404 404Précicast ltée 559 88 647Prowatt inc. 13 13Reboitech inc. et Plani-forêt S.G.F. inc. 230 230Remac innovateurs industriels inc. 179 179SCP 89 inc. 297 297Société de gestion Trois-Trois-Trois inc. 350 350Transports J.M. Bernier inc. 380 380
4,176 10,749 288 15,213Funds committed but not disbursed 400
15,613
12-31-13 Novacap Industries III, s.e.c.Corporation de Développement Enviro-Viridis inc.Corporation de Développement Nautilus inc.IPL inc.La Corporation de développement cuirs Bentley inc.Securities of six other companies
10,536 8,370 18,906
9115-3023 Québec inc., 9244-7770 Québec inc. et 9261-9238 Québec

12
Information from Secured TotalAnnual Financial Shares Loans and Loans andReport dated and Units advances advances
FONDS DE SOLIDARITÉ DES TRAVAILLEURS DU QUÉBEC (F.T.Q.)Index of the Share of the Fonds in investments Made by the Specialized Funds, at Cost
(unaudited)as at November 30, 2014
(in thousands $)
Unsecured
04-30-14 Société de gestion d'actifs forestiers Solifor, société en commanditeSolifor Bloc A-RPF, société en commanditeSolifor Bloc B-LP, société en commanditeSolifor Bloc Monet, société en commanditeSolifor Charlevoix-Saguenay, société en commanditeSolifor Lac Métis, société en commanditeSolifor Lotbinière, société en commanditeSolifor Mauricie, société en commanditeSolifor Nicolas Riou, société en commanditeSolifor Perthuis, société en commandite
138,315 138,315
12-31-13 VC, société en commanditeSecurities of two companies 32 32Direct holdings of real estate 122,948
122,980
This unaudited index details the investments made by the specialized funds as required by the Regulation Respecting Development Capital InvestmentFund Continuous Disclosure.