
FINAL REPORT Contract No OE 5.10.426 An Exploratory ...
105
FINAL REPORT Protect No. 5 -8006 Contract No OE 5.10.426 An Exploratory Study of The Relationship Between High School Building Design and Student Learning Richard Myrick, Ph. D. and Barbara S. Marx, M. A. The George Washington University Washington, D. C. 20006 March 1968 The research reported herein was performed pursuant to a contract with the Office of Education, U.S. Department of Health, education, and Welfare. Contractors undertaking such projects under Govern. ment sponsorship are encouraged to express freely their professiosi al judgment in the conduct of the project. Points of view or opine ions stated do not, therefore, necessarily represent official Office, of Education position or policy. U. S. Department of Health, Education, and Welfare Office of Education Bureau of Research 0.~01111*.11,
-
Upload
khangminh22 -
Category
Documents
-
view
1 -
download
0
Transcript of FINAL REPORT Contract No OE 5.10.426 An Exploratory ...

FINAL REPORTProtect No. 5 -8006
Contract No OE 5.10.426
An Exploratory Studyof The Relationship BetweenHigh School Building Design
and Student Learning
Richard Myrick, Ph. D.and
Barbara S. Marx, M. A.
The George Washington UniversityWashington, D. C. 20006
March 1968
The research reported herein was performed pursuant to a contractwith the Office of Education, U.S. Department of Health, education,and Welfare. Contractors undertaking such projects under Govern.ment sponsorship are encouraged to express freely their professiosial judgment in the conduct of the project. Points of view or opineions stated do not, therefore, necessarily represent official Office,of Education position or policy.
U. S. Department ofHealth, Education, and Welfare
Office of EducationBureau of Research
0.~01111*.11,


712
FINAL REPORTPro::ect No. 5 -8006
Contract No. OE 5404426
An Exploratory Studyof The Relationship BetweenHigh School Building Design
and Student Learning
Richard Myrick, Ph. D.and
Barbara S. Marx, M. A.
The George Washington. UniversityWashington9 D. C. 20006
March 1968
- ,
The research reported herein was performed pursuant to a contractwith the Office of Education, U.S. Department of Health, Educationand Welfare. Contractors undertaking such projects under Govern-ment sponsorship are encouraged to express freely their professios.al judgment in the conduct of the project. Points of view or °pin..ions stated do not, therefore, necessarily represent official Officeof Education position or policy.
1
U. S. Department ofHealth, Education, and Welfare
Office of EducationBureau of Research

Irk :.
0.--,-... +..--,-,...,-*...!.-. .' At:.-.-....,....,:..- -,..X.....s-A-.....41,-,-,--*--.-, --*--=---.----_-....-.:z,,,-;;;-1.----44.1..k..-s.-g--;.4.-7,14-i....,,
II4
ACKNOWLEDGEMENTS
Many Individuals and several organizations have contributed to
this rotearch. First, we wish to express gratitude to the U, S.
OffleA of Education, whose Small Contracts Program provided much
of the financial support, thus making the study possible.
Next, we wish to acknowledge the outstanding assistance of each
of the three schools which took part in the study. In Arlington
County, Virginia, we particularly wish to thank Dr. Harold M. Wilson,
Assistant Superintendent for Instruction, John F. Fanning, Coordinator
of Curriculum Research and Development; and W. Ralph Kier, Principal;
and Acting Principals Mrs. Olive F. Pawley and Leon Fe Witliams ell,
of Yorktown High School, In Montgomery' County, Maryland, thinks are
particularly owed to Dr. Samuel M. Goodman, Director of Research in
the Public Schools; and to Dr. Paschal Emma, Principal, Joseph G,
Hornyak, former Acting Principal, and William J. Clark, former Admin.
istrative Latern, all of John F. Kennedy High School, In WashiAgton
D..C., we appreciatively acknowledge the cooperation and interest of.
Headmaster Robert L. Smith, and of If, Hall"Katzenbadh, Principal of
the Upper School, and Mks. Jean Jasperson, former Dean of Girls and
present Assistant Headmaster, all of Bidwell Friends School. Many
other individuals belonging to the teaching and administrative staffs
of these schools also gave generously of their time and umderstanding
to help make the researchers' efforts as fruitful as possible. In
addition, we must thank an essential element in this study, namely,
the 1631 students, who participated with considerable interest and
enthusiasm as subjects in the research.
iii
111.611.*111...
t.
F

Finally, the help of our colleagues at The George Washington
University is greatly appreciaad. Special thanks are due to Dr.
t se 1-6-1-fari Resources Research Office, who pro.
vided helpful advice pertaining to the analysis of the data. OUr
thanks also go to Stanley L. Cohen for his assistance with the
data analysis, and to teachers Nancy Cohen and Betty Lou Toone, who
aided us by obtaining students for the pretest of the questionnaire.
iLast but not least, unstinting assistance was provided throughout
much of the study by Mrs. Kaaren M. Mahoney, who coded and scored
the questionnaire responses, and aided in preparation of the final
report
iv
B. S. VI.
R. M.
The George Washington University

-
TABLE OF CONTENTS
Acknowledgements
List of Summary Tables and Figures
INTRODUCTION
1, Statement of Research Focus and
Description of Related Research
3, Theory
iiojectives
Strategy
METWD
1. Description of Schools
21 Selection of Subjects
3. Description of Measures Used and DataCollection Process
RESULTS
Questionnaire Item #1 .- Time WhenInteraction Occurred
Questionnaire Item #2
Questionnaire Item #3Participants
Questionnaire Iiem #4
ODIN
OD MO
'1-far st-
Page
1
3
7
1.10
10
20
21
25
29
Number of Participants 31
Identity of the Other34
Who Started Interaction 36
Questionnaire Item #5 Location WhereInteraction Occurred
Questionnaire Item #6 Activities Engaged In
By Participants When Interaction Began
Questionnaire Item #7 .. Activities Engaged In
By Other Participants When Interaction Began
MimplAPINIMIOr AIIII.w."..41~Mwevo
V
...,
36
40
Page
Questionnaire Item #8 How Student Took PartIn interaction 44
Questionnaire Item #9 ..'Content of Interaction
stn Mr:4- ofv.- Item wa,a ==t ivn 54
Questionnaire Item #11 Whether PurposeWas Accomplished 61
Questionnaire Item #12 Approximate, ,amountof Time Interaction Took 62
Questionnaire Item #13 .. Whether There WasEnough Time for Interact ion 53
CONCEPTS EMERGING FROM THE STUDY
1. Symbolic Ownership of Spaces
2. Psychological Centers
3. .Student Social Schedules
4. Mix
3. Cohesive vs. Isolating Buildings
SUMARY
SUGGESTED RELATED READINGS
APPENDIX
A . High School Interaction inventory
67
67.
69
.69
'71
'73
75
78
B Full Tables 81

Figure 1
/
74^VIIMA
F3 lure 4
Table No.
1
2
3
4
5
6
7
8
9
10
11
12
LIST OF FIGURES ADD TABLES
Summary of Differences Amongthe Three School Buildings
D115. 0.0 O.-U.1 viv 4a I.. a. L: C.L.W L 1101. ay.; z .1. rt.
Plan of Lover Level and First Floorof School Y
Plan of First Floor of School Z
Recorded Interactions Broken Down bySchool, Sex, and Grade
Time of Occurrence of Interactions
Number of Participants in Interact ions
Locations of Interactions InvolvingFive or More Participants
Activities Engaged in By ParticipantsWhen Two-Person Interactions Began
Sex and Status of ParticipantsIn Intpractions
'rade-Levels of Participants inInteractions
Locations of Interactions with Teachers
Locations of Interactions
Grade-Levels of Participants inHallway Interactions
Comparison of Course Work Content andLocations of Interactions
Activities Engaged in By ParticipantsWhen Interactions Began
vii
16
11in I
18
19
28
30
32
33
33
34
35
35
37
38
39
41

able No. flat
Comparison of Length of Interactionsand Activities Engaged in by Parti-cipants When Interactions Began
14 Extent of Self-Perceived Participationin Interactions
15 Extent of Self-Perceived Participationin Interactions Compared with Sizeof Group
43
44
45
16 Content of Interactions 48
17 Single.Content Compared with Multiple.Content Interactions 50
18 Subject Matter of Single-Content andMultiple-Content Interactions 51
19 Course Work Content of Multiple-ContentIn: ractions 51
20 Comparison of Length Interactionsand Single.Content and Multiple.ContentInteractions 52
21 Comparison of Amount of Time and Contentof Interactions 54
22 Purposes of Interactions 56
23 Purposes of Course Work Interactions 57
24 Comparison of Purposes of Interactionswith Locations 60
25 Accomplishment of Purpose of Interactions 61
26 Length of Interactions
27 Accomplishment of Purpose Compared WithAdequacy of Amount of Time for
Interactions 64
28 Length of Interactions Compared withAdequacy of Amount of Time 65
viii

LIST OF FULL TABLES
Slattion 112.2. rit&q.
1 "Time When Interaction Occurred ?'1 82
2 "Total Number of Participants in83Interaction?"
3-A "Who Were the Other Participantsin the Interaction?" 84
3 -B "Were Other Participants in theInteraction from the Same or Dif-ferent Class-Level?" 85
5 "Location Where Interaction Ctcurred?" 86
6 "What Was Student Doing When Inter-action Began?" 87
8 "How Student Took Part in Interaction?" 88
9A "Single-Content or Multiple - Content ?" 89
9-B "Content Related to?" 90
10 "Student's Main Purpose in Participatingin Interaction?" 91
11 "Was Student's Purpose Accomplished ?" 92
12 "Amount of Time Spent on Interaction?" 93
13 "Sufficient Time for Interaction?" 94
ix

INTRODUCTION
1. Statement of Research Focus and Strate
This rep'rt presents data from an exploratory study of the
influence of high school building design upon the quality and
quantity of student informal. interactions. The study sought to
find out what kinds of interaction typically axist among high
school students; how much of tha interaction is academically-related
in its content; and how the architectural design of the school
building influences patterns of interaction. It was felt that Oh.
taining preliminary descriptive data about typical patterns of
interaction among hie. school students might be valuable in itself
to educators, and in addition could provide a useful'basis for
further research studying the effect of archittacturo on behavior.
Informal interactions were defined as all conversations between
students, or between students and teachers, which take place in the
school building and on school grounds during the academic day, and
are not part of the regular instructional procedure, Informal inter-
actions were chosen as the unit of study because these represent be
havior that lies atthamore spontaneous and voluntary end of the
interactional continuum; consequently we had speculated that informal
interactions may be more directly influenced by the building's archi-
tectural design than are formal interactions. We also had speculated
.debasing our assumptions upon commonly accepted theories of srcial
psychologists about communication and attitudes that the informal
interactions of students may importantly affect the learning prOcess
by supplementing the formal classroom process of acquiring factual
material, and Ivy shaping attitudes toward learning.

.2.
The general research strategy consisted of selecting three high
schools which each represented what appeared to be considerable dif-
ferences in architectural design and layout; of collecting data &bout
the interactional behavior of the students at each school; and of then
examining whether the differences in patterns of interactional behavior
could be related in part to differences in the architectural design of
the schools. After the investigators familiarized themselves with the
schools' architectural design, the first step in the study consisted of
collecting data about student informal interactions, by means of a
written questionnaire, in order to identify the types of interactions
and:the locations in the schools where these most often occur. The
second step then consisted of using interviews to find out, from the
students' standpoint, what characteristics of a certain location or
behavioral setting make it especially appropriate for certain types of
interactions.
It seemed liRely that any effect of architectural design upon in.
teract ions would amcInt to a more passive influence than the influence
exerted by the behavioral characteristics of the people in the school
building ,- i,e, the student body, teachers, and administrator@e
Nevertheless, the possible effects of the architectural design still
remained of interest, for even if it may be more passive in its influ.
once, it usually endures longer and for better or worse offer=
A succession of user groups.
It should be pointed out here that relatively little is currently
known about typical patterns and types of student interaction existing
in various educational settings, or what patterns and types of inter.
action are most beneficial to the formal learning process, or what

.3
influence the building design factors can have upon interactional
behavior. The present study undertakes in part to close this gap.
2. pescripIlon.of Related Research
The general importance of social interaction in shaping attitudes,
cognitions, and motivation of individuals has been much studied and
amply documented by psychologists, sociologists, and other social scien-
tists. In the school setting by means of interactions .- information
attitudes, and values are transmitted from the faculty to the students
during the learning process. Likewise, information, attitudes, and
values are transmitted from one student group to another. An important
effect of social interaction in school settings emerges as one considers
the nature and influence of the various student subcultures upon each
other. It seems likely thit social interaction is a key fator in the
development and transmission of the value systems of different faculty
and student groups, either breaking down or strengthening the barriers
between value systems, and thus increasing or decreasing the area of
commonly held values.
In considering the effect of interaction on group attitudes and
the possible effect upon student learning, the following studies seemed
especially relevant. Coleman (1959 and 1960) and McDill and Coleman
(1963) have shown how the attitudes of the student group affect both
the motivation and iedtaiag of its members. Coleman has noted that
there can be group restrictions on learning, achieved in much the same
way that factory workers establish restrictions on productivity. As
with other value systems, student value systems contain certain incon-
sistencies. For example, McDill and Coleman found that in many high
:717....7.P.V.11

,
.-0.000.110w00,001610AW
.4.
chools, college plans on the part of students led to higher status
in the grow); yet at the same time a negative orientation toward
academic achievement was also rewarded. Ina study of medical stu-
dents , Becker and Geer (1958) showed how the student subculture in-
fluenced what was learned, by identifying and xAmusing upon what it
perceived to be the most important learning tasks in medical schools.
These tasks emphasized learning only the material necessary to pass
exams, and learting the basic informtion needed to enter general
practice .. hardly preoccupations that would be viewed by a medical
school faculty as being ideally the primary goals of learning in
medical education.
Turning now to a consideration of the possible effect of school
building architecture on student interaction and informal learning,
one may cite several studies as relevant. Festinger in his studies of
student housing (1960 and 1951) found students living in the middle of
in row of apartment houses had more interactions than students living
in the end apartments. The apartments located in the middle of the row
facilitated more face.to.face meetings which tended to increase social
interactions. In addition, students occupying the middle locations
were ad:picent to more neighbors than students on the ends. thus giving
them more choices and greater likelihood of finding others with whom
they could interact congenially.
Ir studying social interaction within school buildings, Getlithet-li
(1952) and Blake (1956) found that low physical barriers, such as file
cabinets in a large study room in a school building, tended to increase
the number of interactions between students within the mailer enclosed

f.,,,erie!.4.1.04tt.zte"? ,
-5-
sub- apace, but tended to decrease the number of students with whom
social contact was made. Barker and Gump (1964) report a series of
ecudies which shed iight on the interrelationship between the person
and his eevironment. Some of the results deal with the specific
effects of school sizes In general they found that students are able
to enter into more behavioral settings in small schools than in large
schools, The explanation for this is that: in both larger and smaller
schools there are roughly the same number of extracurricular activi-
ties and "slots" to be filled. But in smaller schools there are fewer
students, which leads to more participation on the part of each student
because there are more "slots" per student which have to be filled.
The importance of behavioral settings is further documented by Rausch,
Dittman and Taylor (1959a2 1959b, and 1960) who produced evidence
showing that behavioral settings have a strong effect on regulating the
behavior of individuals.
In a study of the possible relationship between design of high
school buildings and interactional behavior, Hereford and Hecker (1963)
specifically examined the relationship between four building factors,
and seven factors relating to interaction and attitudes of both stu
dents and teachees. An important facet of this study was that it util-
ize e 4 systematic survey of many schools to study the effects of varia-
bles in school design° To quote briefly from the sumnary of the results
Size of, school is the /thank dominant factor lin respect,
to school mrsonnerGterection and attitudes,
The influence of size of schools ak a factor can be modified4however, with respect to some aspects of interaction and atti-tude by related building !actors of design and utilization,

There is no evidence, in interaction and attitude, however,to support a contention that design is a major factor amongthe 34 schools -. independently of school size or plan ofutilization. This should not be construed to mean that designcannot be a factor, for such obviously is the case under ex.perimental conditions. (italics in the original)
ThA HArAfnrd Aid !!esker giv.. inf-rmeition about such wautoora
as the frequency and types of interaction in large schools as opposed to
small schools; the effects of a campus arrangement of buildings as
einineileAmA to morn anhnehl AgAmigebirket. ishipui*Um, mgq.0.406.4.9aµ ww vub.11. %may w...16xvo...ural w& usam
several different building utilization plans (whet.4er by school-within.
school, subject area, or grade-level). However, while examining the
importance of these factors, Hereford and Hecker do not provide an ex..
planation of how these aspects of building design may influence social
interaction.
The investigators writing this report have considered the possible
effect of the architecture of school buildings upon student informal
interaction and informal learning in several papers (Myrick 1965a and
1965b, and Myrick and Marx, 1967). Interaction cam help satisfy some of
the important educational requirements, which are chat the student needs
to be able to learn and integrate the subject matter of his educational
program, to develop certain skills,and to acquire favorable attitudes
toward 1A21-ning. Tn their research into the influence of dental school
building design upon interactional patterns among dental students, the
investigators found some evidence indicating that architectural varia-
bles, such as the layout of a building, and the size and placement of
its component spaces, can contribute to the meeting of these educational
requirements by affecting interaction between students and between
students and faculty. In one pilot study it was possible to identify a

.7.
number of specific locations in dental school buildings including
hallways, locker- rooms, and clinical laboratories .. where many inter-
actions leading to informal learning tended to take place. In another
pilot study it was found that a correlation existed between how inter
eared the dental students felt the instructors were in the students,
and how much the general layout of the building helped the students to
see relationships between the various courses of their training program.
Thus it may be that the general architecturAl layout of bUclidings can
contribute in various ways to helping students better understand the
underlying unity of their educational program, one way being by making
many aspects of the program visible to themes they move about the
building. Still another finding was that as the arrangement of the
building facilitates more interaction between faculty and studentst
the building is viewed as being a warmer and more friendly place.
The findings of the pilot studies described above suggest some of
the ways in which student informal interaction may contribute to the
informal learning process, and thus to the overall effectiveness of
the formal learning process. In addition, the findings indicate that
tho architectural design of edliebatinnAl hiolaingft may have an influence
both on the quality and quantity of student informal interaction.
3. :theory
In the light of the related research, the investigators
theorized that:
(1) Learning in educational facilities occurs both throughformal and informal processes, involving contacts amongteachers and students, and amongftutients, in a series offormal and informal interactions,

Alt IVIPIVOINIVNIMMIPMWIMMIaMMISNO
O
(2) Only portions of the learning process occur throughthe formal activities of class instruction.
(3) Therefore, the effectiveness of the learning process isalso in part dependent on a variety of informal socialinteractions, since many of the interactions that con-tribute importantly to learning are essentially informal.Part of the job of reinforcing, claelying, discussing,and gona..14.4 ng what h-s be-n he-r4 n th aaro=ie cls m&yoften be best accomplished by means of spontaneous, in-formal conversations, which occur during a class period,between class periods, or during some other part of theschool day.
UU41,ft 4Artfnm..mal 4,600,m.mm...4.4m,ftm Ummrm m A44,xh.40 oil 4 4ifinstpio.Wie4 .110410rWaDel
fluence on the learning process, not all kinds of Learning benefit
from social interaction. In addition, the influence may be positive
or negative. Depending upon the etrcumstances, negative influence
might be caused by informal interactions expressing sustained opposi-
tion to the goals and values of the educational institution, or oppo-
sition to the means used by the administration and faculty for reaching
these goals. This opposition results when there are wide and strongly
felt differences between the value systems of an educational institution
and its student body. In this kind of situation, the students may
strive to punish the administration and faculty by restricting their
learning and conducting counter-institutional activities; consequently
their informal interactions will support and promote this behavior.
However, student informal interaction can be an equally potent
force in giving positive support to the goals and values of the insti-
tution, and to the learning process. It can contribute to learning in
many ways: by reinforcing what has been presented in the formal learning
situation; by leading to the clarification of learned materials and the
sharing of student insights; by contributing to favorable student
.....,*...,

.9.
motivation through shared positive attitudes expressing interest and
enthusiasm in the leanings; by helpint students understand the rela-
tionships between the various subject- matters they are learning; and
by helping them see how the educational program relates to their future
encupational goals, together with perceiving the other future rewards
and utilities of their educational experience.
In theorizing about how the architectural design of educational
buildings might influence behavior, the following design characteristics
were considered by the investigators to be of interest: the compactness
or extendedness of the building; the location, layout, and interrelation-
ships of various building components such as classrooms, offices, lounges,
cafeteria, auditorium, gymnasium, and library; sizes of these spaces;
the kind of corridor system and the number of corridors, stairways, and
corridor intersections; the number and placement of entries into the
building; and the number of stories. It was felt these design characters
istics might influence the quantity and quality of informal conversations
by affecting such factors as: the amount of face-to-face contact between
individuals in the building; the pattern of traffic flow and number of
alternative routes; the existence of suitable gathering and talking spots
on routes; and the heterogeneity or homogeneity of the "mix" of indivi-
duals composing conversational groups, and the size of these groups. It
seemed likely that these factors could influence interaction by deter-
mining, in part, which persons who were in movement were likely to en-
counter each other in ways that permitted interaction; as well as whether
persons who were stationary in rooms were grouped so they can talk while
involved in certain learning tasks. Thus one architectural environment

.10.
might provide more opportunity for interactions than another by
encouraging people to use certain routes in going from one point to
another, by regulating the size of various groups, by providing
settings for interactions which were more public or private, by
organizing activities in certain places, and so on.
EathStins
The purpose of the research was to conduct an exploratory study
of the relationship between the design of high school buildings and
the kinds of informal student interactions and informal learning
occurring there.
The specific objectives of the study were:
1. ro describe the student informal interactions whichoccurred in three different high schools, in terms ofcontent, purpose, frequency, and length of the interac-tions , as well as number of participants) activitiesengaged in at the time of the interaction, and therelatedness of the interaction tk in academiclearning.
To identify the architectural locations in the schoolswhere student informal interactions mainly occur.
3. To explain, in terms of student perceptions of the architectural environment, why certain kinds of interactionoccur mainly in some locations and not in others.
4. To identify some student interactional needs which areunsatisfied, in part due to the architectural design ofthe school building.
METHOD
1. Descri tion of Schools
Three seconder_ achools located in the Washington, D. C. metro.
politan area were used in the research. Schools X and Y are
public suburban high schools, while School Z is a small 2rivete qty.

-1t-
high school.. All three schools have predominantly white student
populations.
The intention governing the selection of the schools was to
hold constant certain factors pertaining to student population' and
age of the building, while varying a_f _1_4,4,AI factors.
Thus the three schools differ in building size and architectural de-
sign and layout, but they are similar in factors relating to student
population and age of the building,2 for each has: a new or relatively
new school building; an attractive appearance and good maintenance of
the building and grounds; high academic utandards and high quality of
instruction; a position of prestige as an outstanding school in the
1. Early during the selection process certain guidelines were
decided upon so schools would not be selected that represented the
following contrasts: (1) high academic attainment vs. low; (2) urban
vs. rural location; (3) student population which was predominantly
college.bound and had white - collar parents wk. that which was job.
bound and had blue-collar parents; and (4) student population 'filmdom.
inantly white vs... Negro. The rationale for using these guidelines was
to avoid selecting schools and student populations that were very dif-
ferent in non-architectural factors, which might substantially influence
the number and kinds of interactions (for example, the number of aca.
demically relai:ed vs. non-academically related interactions occurring
in each school).
2. At the beginning of the study, the intention was to contrast
both old vs. new , and large vs. small high school buildings, but it
was necessary to modify this. It was found that school systems felt
reluctant to permit their older school buildings to be included in a
study which also included newer schools, perhaps because of a fear of
its leading to unfavorable comparisons and as a result, to bad publi-
city. Although School Y is housed in a somewhat older building than
the other two schools selected with the majority of the building
built in 1960, as an addition to a small former elementary school con..
structed in 1950 -di. School Y cannot really be considered an old school,
either in its actual age, or its appearance and condition. Therefore,
all three school buildings were categorized as new or relatively new,
which represents a change from the design originally planned for the
research. It was found that all recently built local public high
schools were large and therefore did not provide the planned contrast
between large and small size. Therefore, a small private city school,
which had recently moved into a newly constructed classroom building,
was selected to provide the contrast between large and small size
school buildings.
r0.1.1.1106031.11Ira4

-12-
cemmunity; an unusually large percentage of students who are college-
bound; and a higher than average expenditure per pupil. However,
although it was viewed as a relatively important factor, no attempt
was made in selecting the schools to hold constant tbc ''administrative
climate;i -e consisting of such factors as the strictness of the rule
system and its enforcement, and how the administrative staff was per-
ceived by the students.1 This was due to the difficulty of finding
schools both with similar administrative system and differing architec-
tural characteristics, while at the same time selecting on the basis
of a number of other important factors.
Architecturally, the three schools selected differ in the building's
size, layout, compactness, the number of entrances and lobbies, stories
and staircases, and the number and kinds of corridors and corridor inter-
sections. The differences between the architectural design and layout
1. The differences is the "administrative climate" of the threeschools will be iescritesd briefly to give some of the flavor of howeach school was operated. School X is an innovational and experimentalpublic high school, which is trying out many of the newer educationaltechniques. It has atttacted widespread interest and a constant streamof visiting educators who come to scrutinize both the design of theschool and its educational activities. The innovative building designand layout were deliberately planned to help give the students an aca-demic situation leading to the development of individual responsibilityand self - determination in planning and carrying out their weekly "menu"of academic activities, which includes considerable independent study.The administrative approach used in the school seeks to give stud antsconsiderable personal freedom and substantially emphasizes principlesof democratic management, rather than principles of more traditionalautocratic management used in most schools. The atmosphere is unusuallyinformal and friendly for a public high school of this size.
The administrative approach used in School Y is a traditional one,and there is a somewhat impersonal atmosphere such as is typically foundin large high schools. By contrast, in School Z, although the adminis-trative approach used is also traditional in most respects, the smallenrollment and the small size c' classes there create a friendly atmos-phere in which most of the teacners and students know each other. Inaddition, emphasis is placed upon giving each student individual atten-tion and encouraging personal responsibility and a considerable amountof freedom on the part of the students.

rm-
.13.
of the three schools will be presented in the following pageu
by means of a brief description, a summary chart (Figure 1) and a
drawing of each school (Figures 2, 3 and 4).
School X is a large suburban public high school. The building
contains epproximately 159,090 square feet of space and is the second
largest of the three schools studied. The school occupies a "T- shaped"
building with both of the rectangles forming the "T" quite broad
rather than long and extended, so the building is fairly compact in its
layout. It is two stories high, with the second story almost completely
superimposed on the first story, except in the case of a few parts of
the building which are only one story high, such as the library. As a
results the layout of the building is quite easy for a newcomer to
understand. School X was planned so it incorporates a number of innova.
tions in both its design and teaching. Chief among the innovations are
a "resources center," which represents a broadening of the concept of
library use; an "instructional center," containing a great variety of
audiovisual teaching aids in a space that doubles as an auditorium;
and a combination of small seminar rooms and large team teaching rooms,
used predominantly in place of conventional size classrooms which are
relatively few in number (See Figure 2).
School Y is also a large suburban public high school, and largest
of the three schools, both in terms of square footage and enrollment.
The building contains appm.kmately 178,000 square feet of space, ex.
eluding its unroofed courtyard. The building is constructed around a
Large nearly square grassy courtyard, which is surrounded on all four
sides by building elements of different widths containing corridors,

E{t, I
ernIMMON=r4 1...t"SeV. VAS
.14.
lassrooms, and other parts of the school.' From this roughly square
forma pion built around the center courtyard, a number of wide stubby
wings protrude, giving the perimeter of the building a highly irregular
shape. Of the schools studied, School Y is the least compact and most
'complicated in its layout. Parts of the building are three stories
high, but because the school is located on a sloping site and has had
Many additions built on to its original elementry school building core,
there are many structural variations from one wing to the next and front
one story to the next. The stories are only partially superimposed on
each other, with part of the school one story high, part of it two
tories, and part of it three stories. Threfore, when drawn in out.
line, each story is quite different in shape, giving the building a
complex and rather confusing labyrinthian layout (See Figure 3) .
School Z is a small city private high school. It is laid out on
a campus plan, which consists of several school buildings located some
distance apart and _onnected by uncovered outdoor walkways that cross
the grassy open campus, The main classroom building . which was the
buildii:g primarily studied because it was the building in which most
of the students and courses were situated is constructed in the
shape of a simple rectangle and thus it is the most compact of the
1. Plans are underway for the construction of additionalspace, which will eliminate the pleasant grass :' courtyard withthe sentimentally regarded large old tree in its center, and willprovide more classrooms and a larger more modern library.
a
I
11.1,

PI --15.
three school buildings in its layout. However, it should be noted
that the library is in a connecting building, the gym in still another
balding, and some classes are held in an additional mall building
nearby. The main classroom building contains approxtuately 60,4300
square feet of space, and it is the smallest of the school buildings
studied. It is three stories high, with each floor completely super -
imposed on the one below it, which gives the by:tiding an espemally
easy to understand layout (See Figure 4).
Schools X, Y and Z may be viewed as falling along a continuum
for each of a number of building factors, rather than as representing
sharp contrasts. The following chart summarizes the differences des.
cribed above-(see next page):
_ ..."10/

FIGURE 1
Summary of Difiercences Among the Three School Buildings
School X School Y School Z
AGE
.........._
SIZE OFBUILDING
New(opened in fall
of 1963)
Les New(mostly built
in 1960)
NewestThis replacement foran older campusbuilding opened in/fall of 1964)
..e.......e.waIm~INIAN
Large(21/2 times sizeof School Z)
Slightly Larger(3 times sizeof School Z)
AN..m.1.........1*
Small
DESIGN Innovational Traditional Traditional
COMPACTNESS Fairly Compact
.
Least Compact
...11Ita ,IIIIL.101MMIM....
Most Compact
SHAPE T.Shape Hollow Squarewith Wings
Rectangle....... ...
NUMBER OFSTORIES
,.........
2
.
3 _ 3

- k4tk0,4/106=4
C2A
4
PA 31 %00'104 4, CA( ALSO USED ik.S
Up %TOvote%),0,;001$
CAFIT BM& °"11-- ps AKA GkReA
4%44.444-17'
Is
4
1, 4,
0
4 #04a Onr-se
I. 4 A .................4.4.......... ....
temomt tomst
R.E.boOlvttS CZ,Viett..11.'
,....--------...---.. . . 9 ? c 1 ate ( LigORY )
a 4 4.D
F&vitt 2.PLAg OF Pia Fizoik
OF co 000..
Schiz loot z me: ztrr
1 7

pmesel.,11
ore Tim* TWO
s Aikr ow/ airrP If4PoieD . TOE Latie
Vei. is tmloictXED PYSTIkEET
, :'
,1111.111=1/.111105.0.
RY tiL.L D
41 we as sp
I
I
1AO) rroftsta)
--to
1411E1k FRDA .1Lomuk Litsits. a
'IL 'II( ifieli ow wow
.1 1 se so on wt.i. 1
1 wee amW11 I
0 /
1 11 1 G Yitk 1
es it I iON LOWCit.
LeveL I. : i1
att .......
li
egt,t>,
ty's (as ejsCLASS tkooteoON Lowell LEVEL
/I1111.1111111...........11.11.111.
010,1.11,
FIGURE 3? kW 3F I. oweit
,440b F stsi P Lotitof Sc000k.
CcaLa t I 01 CR a 100 VIET
-48.

6 Tab.daararama....
. eLliaritli10 V I. 'row
kg. Nnwi WU" Ate WD4c
Stiovn4 11.1 Tots mi. tdirgu
AS it SLY Mike. umXTED 13
VII IL Vise Mgr o/0114 Soto:. 1143%
1(.14 Biot..00rw mat mu
es4iL WW1.
`ARK1N6/1/4t0..A
Ct./4510014i
amouglaS
Cs-.1 c Nby 4,51
t)3%); MG" *\ PR e kittia2s MEE
a rue-"Kne
61;
s
a a
a1AIM
mipsosionamonminai
mft......"1""m4"1
Sem% bik LoONCre
kV/AVIA fS TRA.Ittt..vi %G.
ft GA) WE. 14-
Pukt4 F Its Som.or Scoom.
schLt 1 Lt cvt .= 100 rEET.19"

.20.
0
Saltption of Sub acts
Lfter selecting the schools, the ii ;tap in the rse-"ch plAn
called for administering a written questionnaire to the students, in
order to collect information about their interactions and locations
in the schools where these had occurred. The population of subjects
who filled out the questionnaire consisted of virtually all the 1631
students attending the top two grades of the three schools. In Schools
1(
Y and 1, all the students in the 11th and 12th grades were used; whileA
in School X, the 10th and 11th graders filled out the questionnaire,
since this school was new and did not have a 12th grade. The reason
for administering the questionnaire to all students in the top two
grades was that in the school setting it is often simpler to test all
students, rather than to disrupt classes by testing only some.
After a preliiminary examination of all the questionnaire data for
the entire population of subjects, decisions were made about the sample
size and an appropriate sampling plan, so the number of subjects could
be reduced to permit a systematic and detailed analysis of the raw data.
A total sample of 300 subjects was used, with 100 drawn from each school.
These subjects were randomly selected, after being stratified 50-50
according to grade- level and sex, and also stratified according to the
time.segment of the day for which they had been asked to record their
interactions.
When the analysis of the questionnaire data had been complet
the next step in the research called for selecting a smaller stratified
sample of students who would be interviewed to obtain explanatory
information of a qualitative nature, which would be helpful in

.21.
interpreting the questionnaire data and relating the findings to the
erchttectural design and layout of each school. Out of the sample of
300 subjects for whom the questionnaire data had been analyzed, a
further sample of 90 students was randomly selected, with 30 students
drawn from each school.
The sample of subjects who were interviewed was stratified not
only by grade.level, sex, and time of day for whtvh they had recorded
their interactions, but also according to whether their interaction
rates were high or low. The reason for stratifying according to
interaction rates was that it: was thought this variable might be
important, and therefore it seemed desirable to insure that both stu.
dents who had few interactions and those who had many interactions
would be interviewed, in order to help develop explanations for why
intet74etione occurred 4. *4%4% nrimv4enimw.uas _____
locations of the school buildings.
3. Desert tion of Measures Used and Data Collection Process
As already stated, data for the study were collected by means of
two kinds of measures: (1) a written questionnaire, in which the
students recorded information about their interactions and the loca.=
tions in school where these had occurred; and (2) an interview schedule,
in which students were asked questions aimed at finding out what their
perceptions of the architec tural environment were, and why certain types
of interactions occurred mainly in certain locations of the school
buildings. In addition, the investigators recorded their on.site ob-
servations about the design and layout of Each school, which provided
further information about each of the three architectural environments

.22.
This material was later utilized to help in interpreting the data.
The written questionnaire, titled the "High School Interaction
Inventory" (See Appendix A9 page 78 ), collected pertinent biograpttcal
data and obtained the student's recording of all the informal interac-
tions in which he or she had participated during a specified portion of
the school day. Informal interactions were defined as all student con-
versations taking place in the school building or on school grounds
'during the academic day, except, those conversations occurring among
students, or among students and teachers as a part of the ret..269.....ar
,classroom instructional Es2cedure. The intent was to guide the students,
but not bias them in providing the required data. Therefore, in the
questionnaire instructions, which were read aloud, the students were
geld that the investigators were interested in the informal communica.
tion process occurring in schools, and that they should therefore record
all their informal conversations, including even those which seemed very
brief or trivial. However, no reference was made to the investigators'
'interest in the number of conversations occurring, or academic vs. non-
academic interactions, or architectural implications.
To help the student record in a conveNnient format all the necessary
information about each interaction, a series of questions with aAmpie
answer-choices were furnished, down the left column of each questionnaire
recording sheet. Students were told to select from the answer- choices
nd write these in where appropriate, or otherwise to devise their own
descriptive answers to fit the interaction being recorded.
The recording sheets provided for the collection of systematic
information about each interaction, consisting of such items as: the
...1,

,,T....*.
-23-
time and date when the interaction occurred; the number of particle
pants, and the activities they were engaged in at the time of the in-
teraction; the content of the interaction (e.g., whether it related t~
classwork, homework, teachers, school administration, future college or
job plans, extracurricular activities, social life, or personal matters)
the main purpose of the interaction (e.g., whether its purpose was to
give information, obtain information, express an opinion, socialize,
gripe, kill time, or just be friendly); and the amount of timeehe in-
teraction lasted. At the end of the questionnaire, some additional
related recording tasks were furnished for students who finished re-
cording early in the period.
The questionnaire was administered to classes of students through-
out the regular periods of the day, as they were assembled in required
basic classes. In this way it was possible to give the questionnaire
to all students with' a minimum of disruption to their normal clues
schedule. But there was a more important reason for this strategy.
It was realized that students could not be expected either to remember
or to write fast enough to record all their interactions fcr an entire
school day. Therefore, to reduce the .recording task to a reason. 'Le
length, the day was divided into parts, and the students during each
class period were asked to record only their informal interactions which
took place during a certain specified portion of the day. By reducing
the recording task to manageable limits, the likelihood was reduced of
losing interactions either through inability to remember or lack If re.
cotding time.' So students would remember their interactions clearly,
1. In the case of a student who had had a greater number of inter-actions than he could record during the class period, he was asked toestimate the number of interactions not recorded. There was probably1Noth a little under-recording and over-recording. But the fact that somestudentm recorded as few as one interaction, while other students givingestimates of unrecorded interactions
ihad recorded many interactions
suggests that the majority recorded n good faith. This impression Vassupported by comments made in the interviews.

.24-
each group filling out the questionnaire recorded their interac-
tions which had just occurred during the: previous time segment. Since
each group covered a part of the school day, we were able to obtain
data that sampled the interactions occurring throughout the entire day,
providing a kind of composite of the school's interactional day.
In devising the interview schedule, the questionnaire data was
examined, certain differences and similarities among the schools were
noted, and questions were constructed to obtain explanations from the
students. Additional questions were used to obtain: the student's
perceptions of the school building's architect:_irai design and layout;
further specifications of locations and Arcumstances in which interac-
tions took place; information about the main gathering places, or
0 poychological centers" where large groups of students congregated in
theluildings; and the various needs that informal interactions satisfy,
as well as ways in which such interactions contribute to the informal
learning process. Detailed diagrams of the layouts of the entire school
building were used in conjunction with a number of these questions to
elicit and record the qualitative data more exactly.

-25-
RESULTS
This section presents the quantitative data about informal inter-
actions, obtained from analysis of the responses to the written ques-
tionnaire made by the randomly selected, stratified sample of students.
The qualitative explanatory data obtained from the interviews are
incorporated in the report as part of the interpretive material. The
procedure for analysing the questionnaire data consisted of scoring
and categorizing the responses to each item, and then figuring percen-
tage distributions. Following this, cross - tabulations were carried out
for a number of items which seemed of special interest. Aoditional
cross-tabulations and analyses might have been fruitfully performed,
if the funds available for data analysis had been less limited.
The somewhat unconventional format of this section needs a few
words of explanation. Since this is an exploratory study which presents
a considerable amount of data pertaining to a large number of factors,
it was realized that it would be difficult for the reader to understand
and respond to the findings if the customary format for a results section
were followed, consisting only of the statistical tables and brief explan.
ations, with the bulk of the explanatory and interpretive material coming
later in the discussion se<Aion. The customary format would have caused
tables and interpretive material to be quite separated. It wns decided
the presentation would be more meaningful if these were presented together
Far the reader's convenience, short summary tables based on the full
tables have been uspld in the results section, and the full tables --
showing the responses to each item on the questionnaire, broken :own by
school, grade.ievel, and sex .. have been placed in the appendix. (See
Appendix Et, pages 81 - 94 ). The reader will notice that in the

-26-
short summary tables, the data for all three schools are only presentcN71
part of the time. Thus, it should be explained what is the pattern
underlying the schools selected to represent the data in the summary
tables. On these short tables, if the data on the full tables for each
of the three schools were quite similar/ the_ the data for one school
are used to give a quick visual summary of a trend shared in common by
all the schools. In these cases, the school selected is chosen on a
rotating basis, so that one school will not be used to represent the
similar data throughout the results. The three schools are only cam
pared in short summary tables when this would be of interest to make a
particular point, for example, when there are important differenoes, or
when anticipated differences turn out surprisingly not to exist. In
the cases when there was a hypothesis about a particular behavioral or
architectural factor which one school exemplified especially, it seemed
appropriate to use the data for that school in the short table. At any
time more information is desired, or additional comparisons wanted, all
the data are available in Appendix B.
The reader is cautioned to remember that all the data about inter-
actifts used in this study was obtained from gall=mprts of individualt"
and therefore the inferences made reflect the limitations of data derived
from personal judgents and estimates. In addition, the reader is
cautioned to remember, in responding to the data about interactions,
that the three high schools used in this exploratory research have some
s.m.ciat and rather at zkisa4, characteristics (as described in the section
about selection of the schools). These schools are "prestige" sdhools,
with high academic standards and an unusually large percentage of
college-bound students. If data were collected in other types of schools
'I

.27-
-- for example, in slum schools .. the findings might be very
different. A future study, using a considerably larger sample of
schools, which would compare several different types of schools,
and examine the similarities and dissimilarities in the hphAvierai
characteristics of the interactions, would provide a very interesting
follow -up to this exploratory stud,.
In a preliminary analysis of the questionnaire data, it was found
that informal interaction totals for each of the three schools were
somewhat affected by the grade-level of the students, with the 10th
grade reporting significantly fewer interactions. For this reason,
the original plan of analyzing a sample of all the data collected was
modified. It was decided that the data obtained for the two upper
grades in each school should not be combined and used in the analysis,
as 10th grade data were not comparable with 12th grade data and would
piece School X, which had no 12th grade, at a disadvantage in comparing
informal interaction rates for the three schools. Therefore, with the
"'meals!! of Table 1, throughout the results section com7arisous will
be made of the responses which 1/th grade students gave in answer to
each item. since the 11th grade was the ove grade common to all three
schools, and the data for it were quite uniform thus giving a good
basis for comparison.
The lack of comparability of the data for the 10th and 12th grades
is shown in Table 1, which summarizes the total number of informal
interactions recorded for the sample of 300 subjects drawn from the
three schovis:

Imteractions
10th Grade
llth Grade
12th Grade
- 4,,,W3WAft* 0.4.......010.71.
TABLE I
Recorded Interactions Broken DownBy School, Sex, and Grade
School X School Y3;Ia)
Boys Girls Boys Girls(N=50)(N=50) (N=50) (N=50)
117 127
128 161
la MD MP SI
School Z7N=1065Boys Girls(N=50) (N=50)
IsC MD el t2 GO SO
123 162 124 140
138 179 125 148
Note: Each of the column figures in this table represents the numberof interactions recorded for a subsample of 25 students.
It can be seen that, in addition to the slight trend of higher
grades reporting more informal interactions than lower grades, there is
a marked trend toward the females reporting more interactions than the
males, However, when making comparisons between the schools9 holding
sex and grade. level constant, the results are quite uniform. For the
11th grade boys, only small differences exist among the schools. For
11th grade girls, Schools X and ? are nearly the same, although girls
in School Z had fewer interactions.
In thinking about thecae data, it should be remembered that the
data were c6llected in a series of assigned recording periods, which
cumulatively spanned the school day, but with each group of students
reporting only a part of the day. The form oil' the data, and the fact
that only interactions for one day were sampled for each school, do not
permit an exact statement of the mean number of informal interactions
these students had during the Entire school. day. However, it can be
estimated that for the typical 11th grade student, the number of informal
interactions fell between 35 and 40 for the entire school day.
.28.
4

-*
29.
The short summary tables of the datta derived from the responses
to each questionnaire item will now follow. The material presented
for each item will explain why the question was asked, how the respon-
ses were analyzed9andwhat the findings were. The data will uniformly
consist of llth grade data, based on a sample of 150 students, with 50
students drawn from each of the three high schools. The randomly
selected sample was stratified according to sex (25 males and 25 females
from each school), and also stratified according to the tine-segment of
the day for which the students had been asked to record their-interac-
tions.
questionnaire Item #1 -- Time When Interaction Occurred
The purpose of this question was to identify those interactions
occurring within the more structured and formal class periods, as
opposed to those occurring in the less structured and less formal
motmarAnns between elaanes; at lunch; or before and after school. The
question was asked because it was felt that the architecture might have
more of an influence on interactions occurring in the loss behaviorally
restricted situations than in the formal classroom situations. In addi-
tion, another purpose was to find out i2 certain portions of the school
day were richer in interactions than other portions. Table 2 shows the
time when interactions occurred for the 11th grade sample:

InicarmintAnno
School X(289=100%)
School Y(28511,100%)
School Z(264=100%)
Table 2
Time of Occurrence of Interactions
BetweenClass
Periods
32%
31%
34%
DuringClassPeriods
43%
40%
36%
8%
12%
17%
9%
Eck
5%
During BeforeLunch School
AfterSchool
8%
9%
6%
Comparing the differences in Table 2 for the number of interac-
tions occurring between class periods, all three schools are nearly
the same. One difference is that School X has a slightly larger per-
centage of interactions occurring Ausim class periods than the other
schools. It should be recalled that by definition informal interacts
tions are not related to the regular instructional procedure such as
class discussion, and therefore the nteractiors constitute what
teachers refer to as "whispering" or "talking in class." Another dif-
ference shown in Table 2 is that School Z considerably exceeds the other
schools in the percentage of interactions occurring during the lunch
period.
In thinking about the data presented in all the tables, the reader
should bear in mind that the number of interactions, which is the way
Intaractions are counted in most of the tables, is separate from the
duration or length of interactions. A time period in uttich there are
evirv, interactions does net neeasmarily mean the students did worry talking
dt in amt time periOd than in one with fewer interactions. For exam.
pie, during a lunch period in which students may have talked almost
30.

.31.
continuously, there may be fewer interactions because the conversations
are longer and unbroken, while in the halls there may be a much higher
number of interactions because of the brevity of each one. To summarize,
the number or Immenci of conversations cannot be taken as a measure
of how much of the timAt, during a certain time period, was stea....liefikx
talkinft.
In accounting for the two differences noted in the preceding table,
it appears that architectural factors may account for the first of
them. At School X, the large number of seminar rooms and the small
number of regular-size classrooms may lead to smaller and more informal
class situations in which more informal interactions are possible during
class periods. As for the larger number of lunch period interactions at
School Z, here administrative factors probably account for the differ.
ence. It should be noted that at School Z all classes in the high school
stop for lunch hour, and that after the students finish eating they have
20 to 30 minutes of free time. By contrast, at Schools X and Y the more
customary "staggered" lunch schedule is used, and also the students have
a shorter lunch period and cnvsequently less free time during which
they are able to conduct many of the lengthier conversations which
typically' occur during lunch.
amtlaansire Item #2 . Number of Participants,
This question was concerned with the size of the groups in which
informal interactions occurred, because it was felt that group size
might affect the content and purpose of the interactions. The results
arc mhiwn 4n Table 3:

Table 3
Number of Participants in Interactions
Two Three Four Five Over Five
Interactions
School X 54% 24% 8%(289=100%)
School Y 69% 21% 5%(285=100%)
School Z 62% 21% 11%(264=100%)
This table shows that School X has more interactions involving
five or more students than the other schools, School Y has more in.
teractions involving only two students than the other schools.
There are two architectural factors that may account for the
greater number of Large-group interactions at School X. It should be,
recalled that at this school there are many small seminar rooms and
relatively few regular-size classrooms. The data show that many, gf
the large -group interactions occur in either the small seminar rooms
or in classrooms. It may be that the group structure encouraged in the
seminar room setting carries over to the classrooms and causes larger
groups to participate in the informal interactions. Or the other hand,
P!rly of the large-group interactions occurring in the corridors of School
X are perhaps explained by the compactness of the school and layout of
the corridor system, which bring large groups of students together and
give them time between classes to talk while remaining in these groups.
The location of School K's thirty-nine large -group interactions are
show in the following table. in order to examine which of these
architectural factors is more influential:
.32-

maespo.001.11,,,
Table 4
Locations of LnteractionsInvolving Five or More Participants
Halls andStairs
Seminar Roomsand Classrooms
All OtherLocations
'NIMIMINEIIIIIIIWIPM=1111111.411121ellic,
Interactions 8% 60% 32%(39=100%)
From this table we see that large-group interactions occur
mainly in the seminar roams andglassrooms, suggesting that these
rooms are more likely to be associated with the cause of large - group
interactions, than is the corridor system.
In seeking an explanation for School Y's large number of two.
person interactions, it can be speculated that the layout of the
building around a central courtyard and its long corridors frequently
require the students to travel a comparatively long distance between
classes. It follows that interactions involving two persons are more
likely to occur than those involving larger groups, since students
wbo are hurrying to class would find it difficult to converse with a
group of persons while en route. Table 5 compares two-person interac-
tions occurring in transit at School X, which had the smallest percen-
tage of two-person interactions, with those occurring in School Y:
Interactions
School(157=100%)
School Y(194-100%)
Table 5
Activities Engaged in by ParticipantsWhen Two-Person Interactions Began
In Transit Waiting All Other. Activities
32%
42%
26%
20%
.33-
42%
38%

lUseevmak Its,*
ll'
-34.
The 10% difference in favor of School '1 tends to support the
peculation that its more extended type of buildtag layout may load
o a greater number of two- person interactions.
es ionnaire Item #3 .. I&utit of the Other Participants
In this questionnaire item, stuelelits were asked to identify the
Cher participants in terms of status (student or teacher), sex, and
rade-level, if a student The purpose was to find out about the
eterogeneity or homogeneity of the "mix" of conversational groups,
hat is, the extent to which students interact with teachers, or with
tudents of the opposite sex, or of different grade-levels. Mix was
bought to be important because in a conversational group which has a
diverse mix, the student has a chance to meet and interact with
students of the opposite sex, of different grade-levels, and possibly
of difZerent academic programs. In this situation, the student is more
ikely to be exposed to different points of view about the courses and
activities in the school. A building, by the may it is laid out, may
influence which students encounter each other as they go to their
c lasses, and thus may help to influence the diversity of the mix.
Table 6 shows who were the participants in interactions:
IF
Nrr.arorrirrirmons
Sex and Status of
ABItoptions
School X(289=100%)
School Y(285=100%)
School Z(264=100%)
Same-SexStudent
717aherParticipant)
46%
57%
50%
Table 6
Participants in
Different-SexStudent
4"--71 otherParticipant)
21%
22%
26%
Interactions
Mixed-SexStudents Teacher Unknown
(More than 1Other Parti.)
AM,
2%
re
1%

A I 1
...ftwor...........m.mwmaferreftimr_..,Affrawfaerisprsed-o4 mgtem-
-35-
Table 7 shows the grade-levels of the participants:
Table 7
Grade Levels of Participants in Interactions
Same- DifferentGrade Grade Grade Urknown
Interactions
School X(246=100%)
School Y(258=100%)
School Z(236=100%)
76%
74%
74%
10%
7%
6% 1%
Note: Discrepancies between the number of interactthn3 shownin Tables 6 and 7 are accounted for by the fact that ateacher interaction is counted in more than one categoryif it has multiple-oontont.
One finds relatively little difference between schools in
either table with the possible exception of student-teacher interac-
tions. A higher perentage is found at School X, and this is worth
exploring further since more informal interactions with teachers
might ! very desirable in promoting the informal learning of students.
The locations in which student-teacher interactions occurred are
examined in Table 8:
Table 8
Locations of Interactions with Teachers
Interactions
School X(41=100%)
School Y(23=100%)
School Z(26=100%)
Halls,Stairs, and
Lobbis.J
17%
20%
27%
Classrooms,Seminar Rooms, All Other
and Labs Locations
57%
36%
50%
26%
44%
23%

-36-
In this table, the most striking difference is the low number'
student-teacher interactions occurring in classrooms at School Y.
School Y, which has only a small number of student-teacher inter-
tions occurring in classrooms, the long corridors and lack of com-
ctness may provide part of the explanation, Presumably the students
d teachers often have long distances to travel when they change
asarooms, leaving little time for informal student - teacher converse-
oms in the classroom, either before or after the instructional
riod. By contrast, Schools X and Y are similar in that both have a
star percentage of student teacher interactions otcurring in class-
cms. At School X, seminar rooms and labs account for a large number
the classroom interactions between students and teachers. An
ctitectural explanation for School Xls classroom interactic_im may be
e relatively compact layout and the fact that School X has many
minar rooms where students are able to meet teachers on am informal
eis. Likewise, the very compact layout of School Z may be one reason
y it too has more classroom student-teacher interactions than School Y.
estionnaire Item 4 Who Started Interaction
The responses to this item were not tabulated and analyzed because,
fter a preliminary examination of the raw data, it was decided that the
expanses would not contribute to a better understanding of the rela-
ionships between interactions, architectural layout, and the infcrmal
earning process.
testionnaire Itemj5 Itication Where Interaction Occurred
The location where an interaction occurs would appear to be related
part to the architecture, since certain locations may provide

1.
,
.37.
opportunities for students to meet more easily, or talk more freely,
or interact in different behavioral settings. Table 9 3twes the
data for locations of interactions;
Interactions
School X(289=100%)
School Y(285=100%)
School I(264=100%)
Table 9
Locat.....:ns of Interactions
Outside Classroams,Building,on School
Halls,Stairs,&
Cafeteriaor
SeminarRooms and
Grounds Lobbies Restrooms Labs GymowinisalmwmIIII 2.101011MMIWZMIONIMIOMM.M.M. T900.11.1.217.
5% 29% a% 40% 1%
4% 38% 13% 33% 4%
3% 34% 11% 42% ni.
Li. Un.Amu kncan
MIIIROINWPM.PEN
6%
2%
5%
The main finding is that, for Schools X and Z, about one third of
the interactions take place Ln the halls, stairs and lobbies, and about
40% take place in the classrooms, seminar rooms, and labs, while with
School Y these figures are reversed. The extended Layout of School Y,
and the many long corridors which the students must travel in changing
classes, probably account for this difference. It is irteresting to
note that the figures in Table 9 fit generally with those o1 Table 2,
dealing with the time when the interaction occurred. As would be ex.
pected, most of the interacAons occurring in the hallways take place
between classes, and most of those occurring in the classroca take
place dLring a class period.
Interactions occurring in the halls, stairs and lobbies are of
particular intwest; first, because these are spaces where students
201wInsoMMITMSe.,,*G.,,haa 441..

.re;;;inC:- ;:3'o "4"-- -
ystareWm*...., ........opiu1~0MAMIMAilgi.*ageleMOKZAW,Olen
38.
am interact with greater freedom, and second, because corridor systems
any' more widely among the three schools than many of the otb,"- ardhi»
emtural factors. It has been conjecturee that some corridor systems
tend to keep sub-groups of students relatively isolated, resulting it
a smaller number of interactions, or in a more restricted mix. Evi.
deuce for any differences among the schools in the number of interac.
tlans occurring in the halls was not found, but in examining the rata
on the grade -level of the students with whom interactions occurred,
some differences are found in the heterogeneity or "richness" of the
mix, as shown in Table 10:
Table 10
Grade-Levels of Participants in Pnllway Interactions
Second& Third
Same- Different. Mixed. ColumnGrade Grade Grade Combined Unknown
Interact tons
School X 67% 13% 13% 26% ' 7%
(84=100%)
School Y 67% 27% 2% 29%
(107=100%)
School Z 67% 18% 7% 25%
(92m100%)
However, uince School X has already been shown to have more hallway
interactions occurring in Large-sized groups, and by definition, a
Inixad.grade interaction has a minimum of three participants, one
actually obtains a fairer basis of comparison here if one combines
thm above percentages for different grade.leveI and the mixed grade.
shown in the third column of Table 10. Viewing the data
VOWINONI01011,

eery
add
-39.
this way, there is very little difference among the three schools.
Therefore, on the basis of these data, the variable of "richness"
of mix does not a. pear to be influenced by differences in the arehi.
tectural layout of the three schools.
1r alutu LaGe a.pat.m.s. lc acs t 4.1 J. (Lia. ma. 1. Ali L.= rac..; ..t.0/15 OA. Jaig
in classrooms would be more aksly to have an academic content than
those occurring in halls, stairs, and lobbies, or other less beha.
viorally restricted locations. In other words, the nearer the location
of the interaction to the instructional setting, the more likely it
is to deal with instructional natters. To test this idea, an extmina.
tion was made of the contetC of interactions occurring in classrooms,
seminar rooms, and labs, compared both with those occurs ing in halls,
stairs stnd lobbies, and those occurring in all other locations. The
data for School Y were used, since this school had the highest pemen.
tags of interactions relating to course work (even though its percentage
was only slightly higher than School. 2). Table 11 shows the results:
Table 11
Comparison of Course Work Contentand Locations of interactions
Related to Related toRelated to Personal- OtherCourse.work Social Hatters Matters
School Y
Interactions Ot.curring in Class.rooms, SeminarRooms, & Labs(150=100%)
Interactions Oc..curring in Hans,Stairs, & Lobbies(150=100%)
Interactions et.curving in OtherLocations, Includ.ing Library, Gym,Cafeteria etc.(115=100%3
35% 40% 25%
3L% 44% 25%
2(3 50% 23%
"11,,,....""'",41
- . .

-40.
The data show the highest percentage of informal interactions
related to course.work occurs in the cLassrooms, seminar rooms, and
labs. The definition of informal interactions is such that this per
tentage excludes the formal student .teacher interactions which are
part of the regular instructional procedure and which oomprise the
bulk of classroom activity. Fewer informal interactions relating to
course work occurred in the hallb, stairs and lobbies, and still fewer
in other locations. There is a corresponding increase in the percen-
tage of personal.social interactions as on moves away from the
classroom cream These data support the view that interactions taking
place closer to the instructional setting are more likely to have an
academic content.
Iltulpstionnaire Item ,#6
When intelaOleliktMa
The information from.this item is -useful in understanding the
behavioral context in Which the interaction took place. To classify
the kinds of activities in which dtudents were engaged when inZormal
conversations occurred, four main categories were used: (1) "Doing,"
which meant carrying out some sectflic stationary' activity; (2) "Wait.
ing," which meant waiting for an activity to begin; (3) "In Transit,"
which referred to activities in which a student was going to a specific
destination; and (4) "Roaming," which referred to activities in which
the student was moving about the building withoat having a specific
destination in mind, although he was possibly seeking a certain kind
of environment. Categories 1 and 2 refer essentially to stationary
activities, while 3 and 4 refer to activities in which the individual

.41.
is going from one place to another. Another difference is that Cate.
gorie s 1 and 3 have a more clecrly defined purpose than Categories 2
and 4. Since many conversations occurred while the students were
eating lunch, the category "Eating" was added as a sub-category under
"Doing."
It seemed likely that the number and length of interactions which
students participated in while in transit might be influenced by the
extent to which the school building was spread out and lacking in
compactness, as a result of the extendedness o its layout and its long
corridors. If an architectural factor like this can be shown to have
such an effect, then,.as more is learned about the types of informal
student interactions which occur in transit and their desirability,
it may be that architec.ts ultimately will be able to influence their
occurrence by modifying the architectural design of school buildings.
The distribution of the data for each school is shown in the following
table:
Table 12
Activities Engaged in by ParticipantsWhen Interactions Began
Interactions
School X(289=100%)
School Y(285=100%)
School Z(264=100%)
InTransit 112amiaa Aitina Reim Estim
30% 2% 23% 38%
37% 1% 26% 30%
33% 2% 23% 36%
.1*
6%
6%
6%

.42..
School. r has the largest percentage of "In Transit" interactions,
st likely due to the extended layout of this school.
The number of conversations recorded for an activity category is,
course, in part related to how much of the academic day is spent in
tivities Cilline into that catezory. However: it is clear that some
tivities which may take only a small proportion of the day may be
sociated with a disproportionately high number of conversations,
chaps as a result of supplying an especially favorable interactional
tting or increasing the probability of encountering individuals with
one interaction is desired. It seems reasonable that the character.
stics of interactions may differ according to the accompanying activi.
y which in part provides their behavioral setting; in turn, the nature
f the activity is often in part determined by the location in the
Jiang wheie it occurs. For example, certain activities, such as
prking in a Lab, may tend to encourage fairly frequent but short con.
ersationsu while other activities, such as eating, tend to encourage
smaller nmmber of conversations which, however, are longer and more
stained, rbus it is seen that in addition to influencing frequencye
he nature or the activity and its setting may affect the length of
onve_atioms. Length of the interaction obviously had some effect on
he kind of topic which is likely to be discussed, and the depth or
xtensiveness with which it can be treated in the conversation.
It has previrlusly been commented upon that at School Y, there is
pattern of A higher percentage of two.perlon interactions occurring
hile students are in transit in the halls and stairs. To describe the
In Transit" interactions further, the length of time of "In Transit"

.43.
interactions was compared with that of "Waiting" and "Doing" inter-
actions, analyzing the data for School Y as shown in Table 13:
Table 13
Comparison of Length of Interactions and ActivitiesEngaged in By Participants When InteractiorbBegan
Len th of interaction:Up to 3 - 4 - 1I Over 10Minutes Minutes Minutes Minutes
AstlxitzSittszciuat School
"In Transit"Interactions 59% 291, 10% 2%(102=100%)
"Waiting" and "Doing" 45% 28% 19% 8%Interactions(154= 100%)
As expected, the majority of the "In Transit" interactions have
a short duration of two minutes or less, while interactions accompanying
activities in the "Waiting" and "Doing" categories take longer. This
indicates that "In Transit" interactions are typically charactarized
by haste and brevity which place certain constraints on the content,
both in terms of the kinds of topics which can be discussed and what
can be said about them in a limited amount of time
Itestionnaire Item #7 Activities EAtuejLiallyAthpr Participants
When_Interaction Began
Originally it was planned to study the specific routes used and
the activities engaged in by all participants in a part icula _Iterac
action, that led to that interaction's taking place. Later this approach
was viewed as being too ambitious for the present study, and this item
was not scored.

estionnaire Item #8 Wm Student Took Part in Interaction
It was conjectured that the extent to which a student perceived
self ae participating in a conversation might give some indication
his involvement in the interaction. Therefore, it was decided to
oliect and compare the perceptions of students about the extant of
eir participation in their interactions. It was recognized that the
Etta might be somewhat distorted and that self-reports on this question
Id be factually inaccurate, since students might not realize how
ch. or how little they were actually participating. Nonetheless, the
ate appeared potentially interesting enough to warrant scrutiny, The
caimans data for the 11th grade show there were practically no differ.
noes among the schools on this item:
Table 14
Extent of Self.Perceivecl Participation in Interactions
nteractions
School X(289=100%)
School Y(285=100%)
School Z-(264=100%)
Talked Talked Listeneda Lot Some
24%
27%
23%
56% 19%
56% 17%
61% 16%
It seemed interesting a:so to examine the relationship between
he erudert's perceived extent of participation and the size of the
nteraetion group, since group stze appears to be a variable that can
influenced by the architecture, and, when considered with other
actors, the extent of participation may give one kind of indication
1,61.1111.

.45.
A! the quality of the intz:raction. Table 15 examines the data for
School X in terms of the relationship between,these two vakables:
Table l5
Extent of Self-Perceived Participation in InteractionsCompared with Size of Group
Extert of Particlatiol...Talked Talked Listeneda Lot Some 11,915.1Y_
Interactions at School X
Two Participants(146=100%)
Five or More Participants(42=100%)
There is virtually no
percentages, alghough there
Some- an Mostly"
25% 57% 18%
24% 50% 26%
difference between "Talked a Lot"
are slight differences in the "Talked
categories, It may be that most students
actually do ,view themselves as talking some, rather than talking a
lot, in the majority of their interactions. Or, on the other hand,
a possible explanation may be that students viewed the "Talked a Lot".
answ3r-choice as descript4ve of the behavior of a "big-mouth" which,
particularly among teenagers, is likely to have given that choice an
unfavorable connotation in terms of desirable social behavior. Further
data would be required to clarify the meaning of the above differences
about the extent of particip&ticm in interactions. It is interesting,
however, to note that in the larger interaction-groups more students
reported themselves as listening mostly, as would be expected.
mrsanrwrsr
Contentof Interaction
Although riuther limited as a measure of the quality and possible
academic desirability of an interaction, the content of an interaction

measingglegg.-
.46.
onstituted the major kind of data in this study used for evaluation
f the quality of the interaction. The general criterion decided upon
Yas that the interactions with academically-related or school-related
ontent are generally more desirable in promoting informal academic
earning than those which do not have acadmic or schcool.related con.
exit. In evaluating the possible desirability of the various kinds of
school-related interactions, content dealing with coursework or home-
ork was ranked as mast desirable; with school events, extra-curricular
etivities and future plans ranked second; and content dealing with
eachers or the school administration ranked third. Content dealing
ith social and personal matters was viewed as being less likely to
ontribute to the informal academic learning process, and it was thus
anked as least desirable, although such content certainly contributes
to the learning in a broader sense.
These criteria have limitations and ignore a number of factors
hich may be very important. However, the criteria are useful in pro-
iding 'a preliminary way of sorting the data about interaction content,
hick represents an initial attempt to evaluate the quality of various
types of interactions, One limitation is that the quality, or desirai.
bility, of a type of interaction should not really be considered apart
from the educational situation to which it reLates, and the educational
bjectives of that situation. Furthermore, it was recognized that the
ategories and rankings used are somewhat conjectural and arbitrary,
rid in addition repr:-.sert oversimplificatiens. A further limitation is
hat these categories deal with interactions only in terms of their
rowel Pest content, ignoring latent content, and ignoring issues both of
he possible complex relationship between different types of interac.
ions* and the possible array of important interactional needs that

.47.
students might have to satisfy in their interactions, in order to
accomplish effective informal academic learning,
For example, it is easy to see that students are unlikely to
engage in informal academic interact ions with other students whom
they know only slightly: or with whom they are bot on comfortable
social terms. Thus, interactions about social and personal matters
may cumulatively help set the stage for interactions resulting in
informal academic lee-ning, In addition,, students may need to react
to various events of the day which hava personal or emotional sign*fi-
cance before they can turn to topics that are academically related.
In this respect, the student is not too different from the worker in a
business office, who as part of the process of getting assigned tasks
done, has social.exiotionat Leeds which must be attended to and setts.
fie& Thus in order to accomplish the work, the individual may find
it necessary to talk with his peers who share the same situation, dis-
cussing what the "boss" really meant Sy a certain set of instructions,
"ventilating" feelings by expressing gripes about aggravating aspects
of the wont situation, and offsetting the hard effort or monotony of
the task by some recreation, which may consist of having periodic en-
joyable "talk..breaks" with fellow workers. Clearly even interactions
dealing with gripes, or with social and personal matters, may be cf
value and be a desirable part of the day, as long as these are functional
in that they facilitate getting the wOrk7done properly.
In filling out the questionnaire, students were instructed that
they could lint up to three topics or contents for an interaction; in
the case cf more topics than three they were to list the three which were

ost talked about in the conversation. These contents were then cate-
gorized. The data are shown for the three schools in the followtng
table:
Interactions
SchoOl X 22% 15%(385=100%)
School Y 31% 12%(45=100%)
School Z 30% 13%-(357=100%)
.0.1M.O.M141,
Table It
Content of Interactions
.....60.demicaklY214114..ieac
Course School Future SchoolVork Events Plans Admin.
6%
7%
10%
Non--
Acadenn.Related_ Unknown
Personal.Social
OIMMIIIMINr0111...11.10111110
53%
44%
44%
Note: in this table it will be noticed that the numbers of interuc-tions given are higher than in the other tables. The reasonis that multiple-content interactions in which several topicswere discussed were categorized in terms of each of theirvarious contents, for purposes of analysis. Thus the numberof content-categories exceeds the number of interactions,since each of the contentcategories was counted up to a maxi-mum of three per interaction.
In view of the cAticisms heard about students spending too much
time discussing personal and social matters in school, it is in.
teresting to note that in two schools, the percentage for this kind of
nteraction constitutes less than half of the total and, in the other
school only slightly over half of the total. It is thus seen that a
arge portion of the informal conversations are related to school acti-
vities. The differences found in comparing the three schools must be
interpreted cautiously. The data represent only interactions for one

-49-
day, on which there could have been important events connected with
course-work which might give a somewhat higher percentage for one
school than is typical for an average day. For example, report cards
had been given out at School Y the day before, with resulting discussion
this topic. An analysis of the content etf -o-rse work interactions
at School Y confirmed this point, by showing that 37% of these dealt
with "school grades" or "report cards."
Another important point about course work interactions pertains
to the distinction between those which are about assignment of course
work, such as the number of pages required to be read or how long the
homework took; opposed to those of a more academic type, such as dis-
cussion of ideas presented in the class or textbook. The questionnaire
did not collect information about the content of "course work" interac-
",ons in such a way that a distinction would be made betWeen these two
types, but interview data indicated that many of these interactions
dealt with the assignment of course work rather than its intellectual
content.
Nonetheless, interactions dealing with the assignment of course
work may make a more important contribution than is realized at first.
In a number of these interactions, students compared their performances
in studying, or in completing an assignment. While, on the surface,
such content might appear to make relatively little contribution to
informal academic learning, further data provided by students in the
interviews sunested that comparing performance may in fact have the
important function of "setting the pace" by establishing performance
norms, and therefore may have an important effect on motivation and

- 50-
achievement. Whether the performance norms for a subgroup of students
are set high or low depends on many factors in the school, as well as
on the subgroup to which e student belongs. But certainly the communi-
cation of these performance norms, together with information on the
efforts actually made by students, would seem to be an important factor
in learning.
Considering the kinds of interactional situations which are
conducive to course work interactions, one may first note the distribun
tion of interactions in terms of dealing with a single topic or several
topics, shown in Table 17:
Table 17
Single-Content Compared with Multiple-Content Interactions
Single-Content Mul'::.ple-Content
Interactions
School X 78% 22%(289=100%)
School Y 68% 31%(285=100%)
School Z 72% 28%(264=100%)
Ad can be seen in this table, the majority of the interactions
reported deal with a single topic, and differences are slight among
the three schools.
The folleAnst table now examines the data for School Z, comparing
the subject matter of single-content and multiple-content interactions,
in order to find out in which of these types of interactions course
woek is discussed more often:

Table 18
Subject Matter of Single-Content andMultiple-Content Interactions
Content of Interactions:Course Other Personal/.Work Schol- Social
Related
Interactions atSchool Z
Single-Content 21% 28% 50%(189=1.00%)
Multiple-Content 39% 26% 35%(75=100%)
The data show that course work is discussed more often in
multiple-content interactions than in single-content interactions.
Therefore, it next seems worthwhile to analze multiple-content
interactions further to find out what percentage of these were related
entirely or partly to coursework;
Table 19
Course Work Content of Multiple-Content Interactions
Interactions
School X(289=100%)
SchoOl Y(285=100%)
School Z(264=100%)
TotalMultiple-Content
Interactions
22%
31%
28%
Multiple -Con-tent Related
1 Entirely toCourse Wo04,
Multiple-Con-tent RelatedPartly toCourse Work
2% 12%
5% 15%
7% 14%
Multiple.COnntent EntirelyUnrelated toCourse Work

.52.
The main point of interest here 1.3 that multiple-content in.
&.eractions are quite rich in content related to course work. Thus,
personal-social convemations may have e.111.edded in them some discus.
;Q ion of course work; and consequently, It should not be assumed that
such conversations make no contribution to i ormal academic learning.
In short, discussions of personal or social matters may be useful
academically when rtlese provide a contextual matrix in which academically
related interactions occur.
In considering what conditions encourage multiple - content inter-
actions, it would be expected that interactions covertlig several topics
generally would require more time. This is confirmed in the following
table, which shows the lensth of time of single and multiple-content
interactions, analyzing the data for School Z:
Table 20
Comparison of Length of Interactions andSingle-Content and Multiple-Content Interactions
Length of Interaction:Up to J to 4 5 to 10 Over 10Mins. Mins. Mins.
latgIt5mm,15111nat School Z
Single-Content(189=100%)
55% 29% 13% 3%
Multiple-Content .21% 11% 52% 16%
(75 = 100%)
It will be recalled that longer lilteractions tended to occur
while students were engaged in activities in the "Waiting" and
"Doing" categories, and shorter interactions tended to occur while
they were engaged in "In Transit" activities. While data are latking

-53.
to give a full description of the characteristics of longer interac-
tions, the data collected suggest that interactions occurring while
students are relatively stationary, either "'Waiting" or "Doing," com-
bine with the two variables of muli-iple-content and a length of over
five renutes to form an identifiable ty)e of interaction. As has
already been shown, this type of lengthy inteTaction which typically
occurs with groups of students in the halls betweee -lass periods, often
to the annoyance of the school administration -- can at times be highly
desirable due to the contributi'm it makes to informal academic learning.
It might be inferred that the interest and emotional involvement
of students in various kinds of topics might be shown indirectly by how
they evaluated the adequacy of the amount of tine available for discus-
sing certain topics. Therefore, the table on the following page, com-
paring the data for Schools Y and Z, was used .to examine how involved
students are in discussing course work, as compared with personal-social
matters.
However, if the inference is correct that involvement in topics is
indicated by how the adequacy of time is rated, then, after examining
the data in the table, one finds that there is relatively little differ.
ence in the extent of involvement, either when the schools are compared,
or when the different types of topics are compared.
The only difference between Schools Y and Z is that School Z shows
a somewhat higher percentage of "All Other Academically Related Topics"
as being partially or very rushed, and this may suggest a somewhat
higher degree of involvement and need to talk about these kinds of
topics. Interactions in this category include those pertaining to school
events, students' future plans, and the actions of teachers or the school
administration.

Table 21
Comparison of Amount of Time andContert of Interactions
Adequacy of Amount of TimeEnoughTime or Very Rushed
Partially Rushed
Content of Interaetions
School Y
Course Work 7 1,% 29%(129=100%)
All Other AcademicallyRelated Topics 63% 37% ,
(102=100%)
Tersonal-SocialMatters 60% 40%(184=100%) .
School Z
Course Work(107=100%)
69% 31%
All Other AcademicallyRelated Topics 50% 50%
(85=100%)
Personal-Socialhatters 65% 35%(157=100%)
Qutestionnaire Item 10 Main Pur ose of Interaction
In this questionnaire item, the student was asked to state what
for him or her was the main purpose served by each interaction, Some
of the possible answer- choices given 3, the left margin of the ques-
tiounaire were to: give information," "get information," "express
-54-

55.
opinions,"be friendly," "gripe," "kill time," " have an interesting
talk. or "exchange ideas." The reason for including this item was
to collect data about the purposes or motives served by student
informal interactions, both:(1) to learn more about the reasons why
interactions occurred, and the basic student needs satisfied by such
interactions; and (2) to find out what are some of the different ways
in which the purpose of an interaction may be related to its con en'
In addition, the data collected by this item made it possible to ob.»
tain a little more information about the content of particular interac.
tionr. for when the information about an interaction2s content (e.g,
"the homework assignment") and the interaction's purpose (e.g. "to
gripe") are put toge,:her, considerably more about the content is
learned.
At the time the questionnaire was designed, it was
that a certain specific kind of interactional content ..
anticipated
for example ,
diss.-ssion about a particular homework assignment ..., might serve a
number of different purposes for the participants in the isteract.on,
depending on the situation. this assumption was supported by the data;
for example, it was found that an interaction pertaining to a homework
assignment might in one situation serve the purpose of getting .nforma
tion, while in other situations it might serve the purpose of being
friendly, or of griping, or of killing time. Furthermore, the purposes
served by a particular interaction might be different for each of the
participants.
In the analysis of the purposes served by interactions, the
4
purposes have been categorized along lines traditional in social

f
I
.56.
psychclogy, with the one main category representing an informational
component, and the other main category representing a social or
emotional component, The data about purposes of interactions for
the llth grade students are compared in Table 22:
Table 22
Purposes of Interactions
MainlyMainly Social.
Informational Emotional Both Unknown
Interactions
School X 56% 33% 10%(280=100%)
School Y 51% 35% 11% 2%(28 5 =100 %)
40
School Z 50% 6% 1%(264=100%)
One difference noted in this table is that School X, which
actively strives to encourage students to learn independently, has
a slightly higher percentage of interactions wnich serve mainly infor.
national purposes. Another difference is that School Z has the
highest percentage of interactions that are mainly social.emotional
1i purpose, and the smallest percentage that serve both informational
and f:locial.emotional purposes. It is only possible to speculate on
reasons for this r ifference. In the interviews, the students from
School Z .. which is the small private city school studied in this
rek3-1,arch referred many tims to the high intellectual standards of
siltxj and the pressure that most of the students felt was placed
on th to perform at their top capabilities. As a result of the

-57.
selective admission policies of School Z, the student body is cer-
tainly the most homogeneous of the three high schools in intellectual
values and goals. The investigators felt it was likely that the
standards were particularly highthere, memetw,A=a1 fit's uniformly
by most of the students. It might be speculated that 4n this kind of
academic environment there is e greater. need for interactions V111.1.110.-1.1
satisfy social-emotional purposes, and a tendency to react to or to
relieve the pressure by dxpressing feelings and having recreational
"talk.breaks."
In thinking about various types of interactions which are likely
to have a large informational component, it might be expected that
course work interactions would have almost entirely informational
purposes. However, when the data for course work interactions at
School Z are analyzed in terms of the two basic categol Les. of purposes,
the following distribution is found:
Table 23
Purposes of Course Wort; Interactions
Course Work Inter-actions at School Z
(107=100%)
MainlyMainly Social.
Informational Emotional Both Unknown
50% 38% q% 2%
This table reveals an interesting fact about the purposes which
academically-related interactions may serve. Based on the finding
that only 50% of the course work interactions are described as serving
mainly informational purposes, it can be said that both acquisition of
lonoffirseer,

.58.
information end socializing seem to occur in course work interactions,
and sometimes at the same time. Furthermore, in some cases, interacts
tions about course work can satisfy informational and social needs si-
multaneously, and thus at times the two may !)e c.,,,,flunded and difficult
to sort out.
Perhaps, this aspect of the multiplicity of purposes served by
interactions ostensibly dealing with a certain topic should be discussed
further here, so the implications for informal 1,,,arning emerge more
clearly. An example is a student's inquiry to a fellow student, asking
what he thought of the material presented in the reading assignment for
a history course. The question can be responded to by another student
at various content-levels of richness and seriousness, from an answer
of fttcl long" to an answer which discusses the ideas presented in tba
reading. But, regardless of the content.level, both the inquiry and
the answer can serve either the purpose of collecting useful information,
and/or the purpose of expressing a sociable interest in another student's
activities and feelings. In the one case, the informatonal purpose may
be primary, with sociability being a by-product, while in the other case
sociable purposes may be primary, with collection of academically.
related information occurring as the incidental by-product. But in each
case, there is an opportunity for informal learning to take place. It
becomes increasingly clear that the categorization of contents and pur.
)oses of interactions, and the evaluation of the quality of interactions,
are in fact complex matters, even though we have been forced initially
to treat these matters quite simply.
Data about the purposes of student interactions could be viewed as
providing a further basis for assessing the quality or desirability of
_

-59-
various types of interactions. But, while it might seem initially
reasonable to set a criterion in which informational purposes are the
most desirable, combined informational and social-emotional next most
lam0.LCIVW79 CIM4 JGWP4. AGeiJwwA.,as.
Ubammuem s alrmmAt hami
pointed out that the matter is more complex than this, since, for
example, interactions which have a social-emotional content often in-
clude discuss ions of course work. Thus this criterion is too simplistic;
and the data presented here are offered mainly for their general interest,
and to furnish a starting point for future considerations of how to
approach the criterion question, in assessing the desirability of certain
types of student informal interactions in furthering informal learning.
Keeping the limitations of the data in mind, one can next examine
the locations where interactions occurred in the school building, con.
sidering the percentage of interactions serving informational or social-
emotional purposes which took place in each of a number of different
locations at School Y. Table 24 on the following page shows the results.
In looking at the percentages for School Y, one finds that the
trend is for at least 50% of the interactions in nearly every location
to have "mainly informational" purposes. However, the data for the gym
and "other locations" should be discounted because of its being based on
too few interactions, which may explain the rather unbalanced-looking
figures of 80% and lon when these are compared with the other percen-
tages. The percentage for the Library is derived also from a somewhat
small number of interactions, so it may not be representative0 If the
library percentage is accepted, however, one can only speculate on the
reasons for most of the interactions' having a social-emotional purpOle.

Table 24
Comparisons of Purposes of Interactions with Locations
Locations of InteractionsIn Schocl Y
Mainly MainlyIn Social-Emotional
Outside 50% 50%(12=100%)
Halls Stairs, Lobbies c27 48%(96=100%)
Classrooms, SeminarRooms, Labs 58% 42%(121=100%)
Library(15=100%)
Gym(5=100%)
Cafeteria(31=100%)
Other Locations(4=100%)
27% 73%
80% 20%
55% 45%
100%
One reasor might be that the atmosphere of quiet and studiousness
character; stic of a library causes students to react with an es-
pecially high proportion of social-emotional interactions when they
take a conversational break.'
1. The extent to which talking was restricted in the libraryvaried among the three schools,, but in all cases the library could beviewed as a more permissive and less punitive setting than the teacher.regulated classrooms, though the library certainly ranked as a morerestricted behavioral setting than the tallways. In contrast with theclassrooms the library was more attractive physically, and studentscould generally have more free-choice in the activities they worked onthere, and could also talk periodically uoth less restraint being placedon them. Information obtained in interviews 'showed that the freer

.61.
Questionnaire Item #11 Whether Pur ose Accomplis red
This item, like Questionnaire Items 9 and 10, was included in
the hopes it would provide a kind of measure of the quality of the
interactions. In addition, it was thought that this item, together
with Item 13, would give an indication of whether students felt satis.
fied, or dissatisfied and frustrated, in their attempts to conduct
informal interactions, The data for the lith grade of all three
schools are shown in the f:1 lowing table:
Table 25
Ateacmplishment of Purpose of Interactions
Yes No :Partly
Interactions
School X(289=100%) 82% 5% 12%
School Y(285=100%) 77% 7% 16%
School Z(264=100%) 77% 6% 17%
The finding -- that with roughly three-fourths of the interactions,
students answered affirmatively that their purpose in having the inter-
action was accomplished .- suggests that the item, as it was worded, may
not have great discriminatory power. Another possibility is that the
students are relatively satisfied with their achievement of the purposes
of their in.:eractinns, in spite of the fact that a substantial number of
their interactions are short and hurried.
1. (cont) atmosphere motivated students to come to the library,because of the more relaxed and pleasant setting, and the opportunity
for some aoclalizing. The freer atmosphere of the libraries may be good,_
educational strategy i Ole intent is to create an educational setting
that is enjoyable and thus more favorably perceived by students,

.62.
13eqiotInaireItm g12 .IAaraximate Amount of Time Interaction Took
The reason for this item was to find out what was the typical
length of the students' Interactions. It was realized that .. as with
tile questionnaire item relating to extent of participation .. it might
be diificult for students to note the exact amount of time their inter-
actions took. So the reader should view the data about interaction
Lsngths xs representing subJective time- estimates rather than objective-
ly timed durations. On the other hand, it should be pointed out th,:;_t
the school schedule, bell system, and zb\Andance of clocks, give many
students a keen awareness of time.
Interactions
School X(289=100%)
Table 26
Length of Interactions
Up to 2 2! 4 5 . 10 Over 10Minutes Minutes Minutes Minutes Unknown
36% 25% 31% 10%
School Y 49% 24% 15% 6% 1%(285=100%)
School 1 49% 26% 19% 4% 1%(264=100%)
The major finding here is that for all three schools a substan-
tial percentage of interactions approximately one.third to one -half
of all interactions are perceived by the students as being quite
short and lasting two minutes or less. However, a difference among
the three schools on the percentages is that at School X there are
considerably higher percentages of interactions falling in the "5 - 10

-63-
Minutes" and "Ovar 10 Minutes" categories, and a considerably
smaller percentage falling into the "Up to 2 Minutes" category.
This difference can be explained in two ways: First, the
administrative control of the students was very distinctly the freest
and most permissive at School X, where a democratic management theory
prevailed, with the goal of encouraging the students to develop their
own motivation and self-control. Students were allowed to gather and
talk freely in the halls, even during class periods. Also, there were
no hells which signalled the beginning and end of class periods, and
a generally liberal attitude was taken by teachers toward students who
made leisurely arrivals in class. Therefore the administrative atti-
tude in School X would appear to encourage lenAthier interactions.
Second, the architectural layout of School X, which was the most
innovative of the three schools, was characterized by a corridor system
in which there was an especially large number of intersections where
major arteries of traffic crossed. In addition, at these intersections
there was an especially ample hallway width which provided space for
large groups of students to congregate, unhampered by the traffic flow.
Clearly it is difficult to sort out which of these factors the admin-
istrative attitude or the architectural layout of the corridor system
may have been the more influential in creating a behavioral setting in
which students tended to hold long conversations.
gueotionnaire Item #13 Whether There WasEl.iougt.me for Interaction
the main reason for including Item #13 was to compare the students
perception of whether there was an adequate amount of time for the

interaction, with the accomplishment of the interaction's purpose.
The cross-tabulation, using data for School X, follows:
Table 27
AzecizplifAi_Tuttlt of pii*--nr.QA Combated ithAdequacy of Amount of Time for Interactions
Accomplishment of PurpoRLLYes No tatUE
Ade uac of Time Lornteractions at School X
Enough Time(196=100%)
Partly Rushed(68=100%)
Very Rushed(19=100%)
95% 5%
Based on these figures it can be said that the adequacy of the
time available for the interactions appears to make some differenca
in whether the purpose of the interaction is accomplished, but not
much. This finding leads to the conclusion that students tailor the
content and purpose of their interactions to the amount of time they
have available, thereby achieving their purpose. In support of this
conclusion it is interesting to note that with the "Very Rushed" inter-
actions, there is the highest percentage of interactions in which the
purpose was accomplished, and no "middle-ground" of instances in which
the purpose was partly accomplished. Therefore, it seems reasonable to
infer that students are tailoring interaction content to the amount of
time available, so that these rushed interactions have very limited
clear-cut objectives which can easily be accomplished.

.65.
It is interesting also to compare the estimated lengths of
interactions with students' perceptions of whether there was an ade-
quate amount of time for interactions. This cross-tabulation, using
data for School Z, follows:
Table 28
Length of Interactior' ComparedWith Adequacy of Amount of Time
Len th of Interactions:Up to 3 . 4 5 - 10 Over 10Minutes Minutes Minutes Minutes
Adequacy of Amount ofrime for Interactions
Enough rime(170=100%)
Partly Rushed(86=100%)
Very Rushed(19=100%)
47% 26% 21% 6%
45% 26% 14% 15%
53% 32% 15%
It is striking that for th4x "'In '-o 2 Minutes" And "3 . 4 Minutes"
interactions, the factors of adequacy of amount of time and length of
imeraction are independent of each other; and even for the "5 - 10
Minutes" and "Over 10 Minutes" interactions they are relatively inde-
pendent. This shows that although both these measures represent per-
sonal time estimates, there is little overlap between how students per-
ceive the length of the interact for and how they pence 'me the adequacy
of time. The finding has two implications. First, that students can
indeed distinguish between the two factors. Second, that adequacy of
time for an interaction is not accounted for simply by the number of
minutes an interaction took, but requires the inclusion of additional

-66-
factors for a satisfactory explanation. One of these additional.
factors is very likely the content of the interaction, for without
a doubt, some contents require a larger amount of time for adequate
discussion that do others.

CONCEPTS EMERGXNG FROM THE STUDY
MO
1. aymbol1sastysht,z.2! ! WilaIPZ to ecogn z- a
.7.7smay1-11.0 OL Lim vfirluus spac,i.$ which ,:ompl-.7se E high schootAvlftwaftwl 111.. L_ 2 _211 U
building, then it may be gF-11Prally said that thP c/assreioms, labs,
seminar rooms and teachers' lounge and office << maibly belr.q1g to the
faculty; the principal's office 'slid adjacent hail, and the auditorium
belong mainly to the administrative staff; and th,, stafxs,
studeWe restrooms, cafeteria and outside area surrounding the school
building belong mainly to the students. Ownership of spaces seems to
be related to the amount of behavioral freeeem or restriction which
students feel exists in that space. Ownership also seems to have some
influence on the students' thinking v,hen they are considering appropriate
locations for certain kinds of informal interactions. While the ownership
of spaces is functionally and administratively determined, it becomes
architecturally connected, Since ownership is reated to the amount of
control which students perceive existing, architects througn design
modifications could somewhat alter the ownership of spaces in the school9
if this were found to be educationally desirable.
2. Psychologicalpters .. The investigators found9 as a result
of observing activity in the halls at different times of the school
day, that students congregated between class periods at certain places
in the halls, which served as gathering places for large groups of stu.
dents. The term "psychological center" has been selected to describe
such a gathering place. The locations of psychological centers are
difficult to predict simply by the architectural layout of a school
building, although once one sees where they are, they make good sense.
Al,,*..,

47`1 ,`N%-W1..memoo..10106001Karvow....11,
Characteristically, psychological centers arcs located at the,
intersection of two or more main hal_ or stairs were there ts a high
volume of traffic between periods. They are also often located where
n space cotr 1AcorA c,"-'tvevz% to r+nroranra_And a,$)t ngs4rIr>&ZI..16 C3 4.v %, a.,s%.* . a- %. err r
of the school whtch is important to the students and where there is not
excessive faculty monitoring. Far example, in School X an important
psychological center existed near the actively used and centrally local
ted library; while irt School 2 an important center was located near the
administrative offices. The locations of psychological. centers may be
constant, or may shift during the day, depending on the time of day and
the students' schedules, and depending in part upon changes in where the
largest velume of traffic occurs.
In the high schools studied, there was typically one main psycho-
logical center, as well as one or two smaller centers, in 'existence at
any one time during the day between class periods. The subsidiary
centers were distant from the main center, thus serving a need for stu-
dents who could not get to the main psychological center. In these
centers, many of the students' conversaticns took place -- including
naturally the majority of the large-group conversations. The interview
data made it clear that a psychological center served the function of a
communications nerve-center for exchanging up-to -date academic or social
messages and news bulletins consequently many students purposely
planned their routes so as to "check through" the center at least several
times a day. Here students would find out such things as how hard was
the geometry test being given that day, or whether the English teacher
had really meant it about having expected the students to read all of the
v
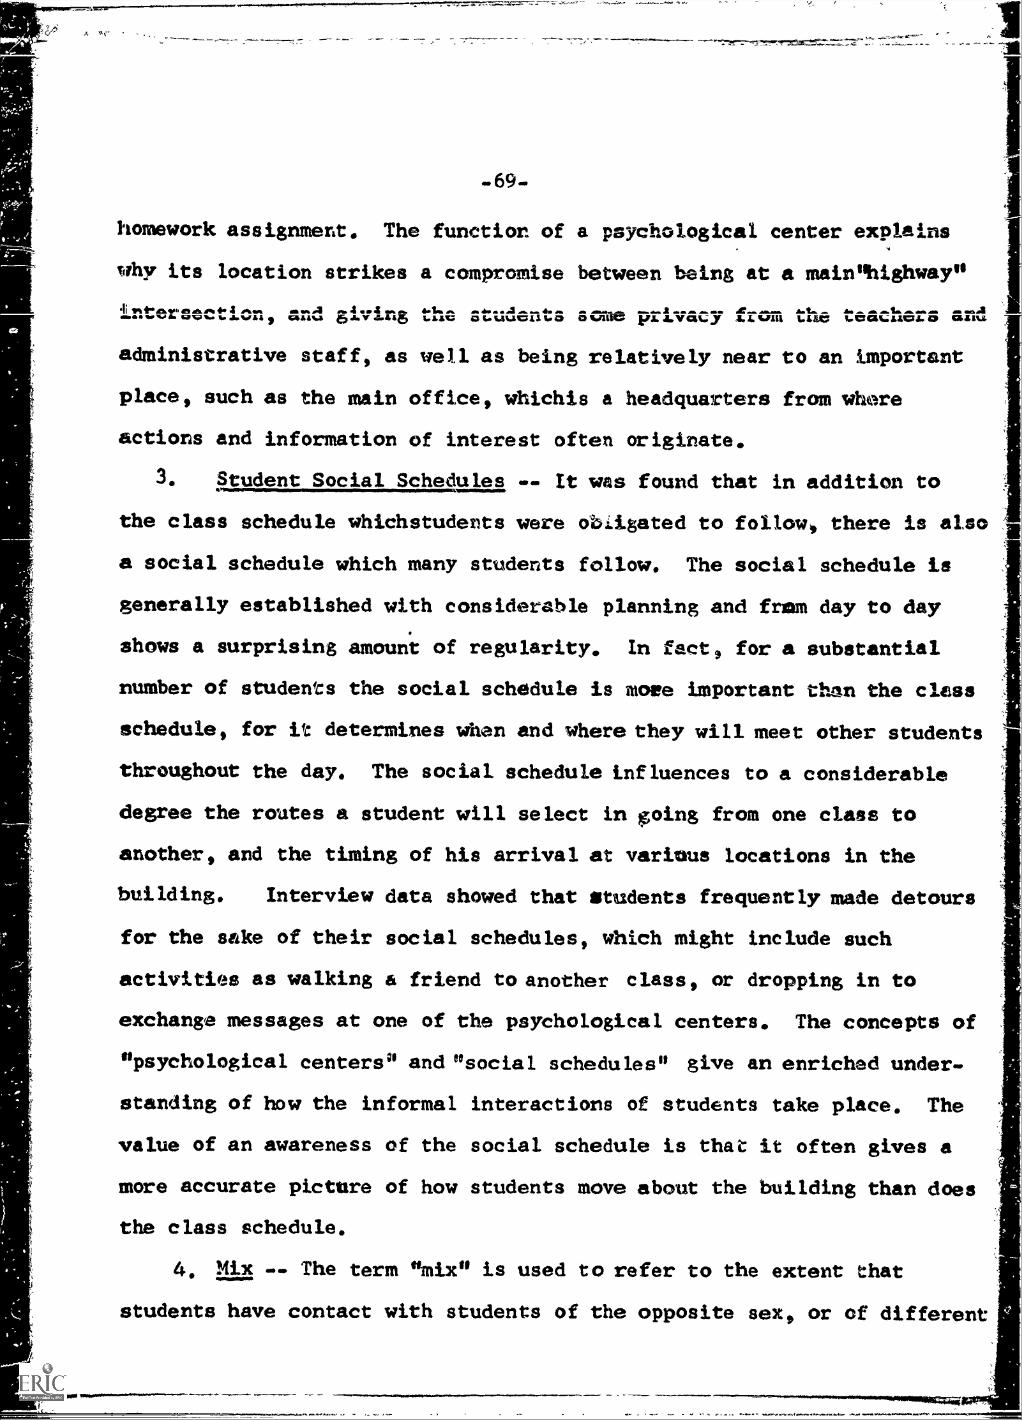
-69-
homework assignment. The function of a psychological center explains
why its location strikes a compromise between being at a mainuhighway"
4.1ft^csaMs eviv4.445 Oi*UUGLISPO OUF14 FLLIra%;Y frwm 'cue teacuea
administrative staff, as well as being relatively near to an important
place, such as the main office, whichis a headquarters from where
actions and information of interest often originate.
3. Student Social Schedules -- It was found that in addition to
the class schedule whichstudents were obiigated to follow, there is also
a social schedule which many students follow. The social schedule is
generally established with considerable planning and from day to day
shows a surprising amount of regularity. In fact for a substantial
number of students the social schedule is more important than the class
schedule, for it determines when and where they will meet other students
throughout the day. The social schedule influences to a considerable
degree the routes a student will select in going from one class to
another, and the timing of his arrival at variuus locations in the
building. Interview data showed that students frequently made detours
for the sake of their social schedules, which might include such
activities as walking a friend to another class, or dropping in to
exchange messages at one of the psychological centers. The concepts of
"psychological centers" and "social schedules" give an enriched under-
standing of how the informal interactions of students take place. The
value of an awareness of the social schedule is that it often gives a
more accurate picture of how students move about the building than does
the class schedule.
4. Mix -- The term "mix" is used to refer to the extent that
students have contact with students of the opposite sex, or of different

.70.class.levels, or of different educational programs. What represents
a desirable mix depends in part upon the goals te be attained. The
question of what constitutes a desirable mix has been recently debated
in a number of city school systems.* in connection with the aretiping nf
students by race or ability. More research is needed to ascertain how
heterogeneous or homogeneous a mix of students should be, for effective
Learning to occur in accordance with various goals and circumstances.
But it appears that in a more heterogeneous mix an enriched social
environment is created, in which a greater variety of informal learning
is possible, and in which students are more likely to be exposed to
the exchange of divergent views. On the other hand, successful inter-
actions require a mutual satisfaction of needs, and if the mix is too
heterogeneous students may have so little in common that it is difficult
for interactions to occur.
Architects and administrators, without being particularly aware of
it, often create homogeneous mixes. This occurs when in the interests
of efficienty, or cutting down on noise and disruption, similar activi.
ties are located adjacent to each other as for example when all
re lazed offices, or departments, or classes of one grade.level are loca-
ted in the same wing of a building. A common illustration is that in
many high schools the vocational education facilities are located in a
separate wing from the academic facilities. The result is to decrease
interactions between the academically and vocationally oriented students
to an extent even greater than would otherwise occur. This is not to say
that a very homogeneous mix may not be ideal for certain educational
goals, but simply to urge that school architects and administrators
become more aware of the probable effects of various mixes upon learning.

-71-
A good heterogeneous mix does not consist simply of mixing all the
departments together without any awareness of the costs and benefits
to a particular school. If there are substantial advantages to the
faculty in keeping the departments intact, for example, by locating
all the physics classrooms and labs together, then a good mix might
still be achieved by placing the physics department next to the voca.
tional education facilities or next to the art department.
The curtailment of variety in interactions caused by A restricted
mix can have undesirable cognitive and motivational effects, By narrow-
ing the exposure and choices for the student, his educational exper-
ience is also narrowed, for he sees and hears about only those specific
subjects in which he and his classmates are taking courses. He hears
little about other courses he might have chosen, or courses he might
select in subsequent years. One result of this is that he may find it
more difficult to consider educational alternatives and clarify future
occupational goals.
5. Cohesive /1,..Lokaslag_kliattaal -. This architectural-behavioral
concept refers to whether the building in general promotes or handers
interactions, and thus it is helpful in understanding how design factors
can influence the occurrence of interactions. The cohesive building
makes it easier to have interactions and 30 promotes cohesion among the
users. A cohesive building differs from an isolating building in that
it is generally characterized by a compact layout; clearly defined
central areas where students may congregate together between classes;
relatively few alternate routes; teachers' offices placed on routes that
students frequently take; the principal's office centrally located,

.72.
possibly near a major building entrance or route used by the students;
and a relatively heterogeneous mix of departments. By contrast,
isolating buildings tend to have an extended layout with long corridors,
and to provide many alteKnative routes for stud-nte to follow in f4lArm4licw
classes. A building organized around a large courtyard is likely to
be isolating, if the courtyards are spaces around which students must
detour. Cohesive buildings facilitate interactions with comparatively
large groups of students taking part; while isolating buildings facilitate
smaller group interactions. One may speculate that larger groups
are more apt to have conversations lass in keeping with the goals of
the school administration. Thus it is likely that the Layout of a
school building has some in on student motivations.

71-
SUMMARY
Based on the study of three high schools ,Pand a stratified
sample of 300 students, the main findings that emerged from
the written questionnaire and interviews -- provide the following
information about informal student interactions and related school
building design factors:
. First, informal conversation among students, and students
and teachers, can play either a positive or negative -;role
in influencing motivation and attitudes, in affecting the
learning process= in creating cohesion among students, and
in altering the gap between the value systems of the "teach-
er culture" and "student culture."
Second, 50% of informal conversations are academically-re-
lated; that: iss 27% deal with course work s, 7% deal with
teacher relationships, 13% deal with school events, and no
with college and future plans. The remaining 50% deal with
personal-social matters.
. Third, one out of every four interactions deals with several
topics, and of these, over half include some mention of course
Work. Thus academic content is often embedded in ?ersonal-
social conversations.
Fourth. although 33% of all conversations were rated as "rushed,"
nearly 80% were rated as having fulfilled their purpose.
These findings sugest that students for the most part suc.
ceed in "tailoring" the content and purpose of their inter.

Wm.,,......,
-74.
actions to the amount of time that is available.
Fifth, there are some indications that the layout of the
school building affects the s1 ze.? of student groups which,
in turn, affects the content of student conversations.
Central, or cohesive layouts, which facilitate larger
groups being formed, seem to rromobe student conversations
that are less in keeping with the goals of the school adminis.
tration. On the other hand, extended or isolating layouts
require students to spend more time traveling from one class.
room to the next, with the result that smaller groups are
formed. These smaller groups seem to have conversations
that are more in keeping with the goals of the administration.

SUGGESTED RELATED READINGS
* Barker, R. and Gump, P. Big School, Small School. Stanford, Calif.:Starderd University Press,776T7
B$,Irkert R.Issues,
-ArCn the nature of the environmunt. VL Qin:A.424.
No. 4, 1963: 17-38.
* Becker, H. and Geer, B. Student culture in medical school.ilervard Educational Review, 28, 1958: 70-80.
* Blake, R. R. , Rhead, 9C. C. Wedge, B. and Moutin, J. S. Housingarchitecture and social interaction. Sociometry, 19, 1956:133-139.
Blanchard, B. E. Recent investigations of social learning. Journqof Educational Research, 43, 1950: 507 -515.
Bolton, C. D..a Co...AAkwat+1.e.46 ftoloast.
University
and Kammeyer, C. W. The Universitz Student: it Study,
Behavior and Values. Newniaven, Conn.; College andPress, 191677
Byrne, D. and Buehler, J. A. A note on the influence of propinquityupon acquaintanceships. Journal 21 Abnormal and Social Psychology,'51, 1955: 147-148.
* Coleman, J. Academic achievement and the structure of competition.Harvard Educational Review, 29, 1959: 330-351.
* Coleman, J. The adolescent subculture and academic achievement.American Journal of Sociolosz, 659 L960: 337 -347.
Craik, K. H. The prospects for an environmental psychology. Journalof Environmental Design. (In press)
Educational Facilities Laboratories.a series of reports which providedevelopments in school planning.
Profiles of Significant Schools:information on some of the latestNew York: 1962 (and later dates).
* Festinger, L. and Kelly, H. H. Changing Attitudes throughContact: An experimental study of a housing project. tonMichigan: Research Center for Group Dynamics, InstituteResearch, University of Michigan, 1951.
* Festingert L., Schacter, S. and Back, K. Social Prefisures in In-forrmal Groups, A study of a housing project. New Ybrk: Harper, 1960
Gruen, W. Some factors in the etiology of social interaction andgroup formation. Journal of Social Psycho/ogz, 54, 1961: 57.73.
* Gullahorn, J. T. Distance and friendships as factors in the grossinteraction matrix. Sociometrz, 15, 1952: 123-134.
SocialArbor,for Social

.76.
Hail, E. T. The Hidden Dimension. Garden City, N.Y.: Doubleday,
1966.
Hall, E. T. The Study of Man's spatial Relations and Boundaries.
Prepared for the Conference on Medicine and Anthropology,
Arden House, Harriman, N. Y., 1961.
Hereford, K. and Hecker, S. Relationships Among School Design, Util-
ization, Personnel Interaction, and Attitudes. East Lansing,
Mich.: College of Education, Michigan State University, 1963.
Horowitz, H. The Architect's Program and the Behavioral Sciences.
Lecture presented at Syracuse University, RiFT17NOTIRrigg3.
McDill, E. L. and Coleman, J. High school social status, college
plans, and interest in academic achievement: A panel analysis.
American Sociological Review, 28, 1963: 905-918.
Myrick, R. A new concept in the architectural planning of dental
schools. Journal of Dental Education, 29, 1955a: 382-386.
Myrick, R, Summary, Progress Report on the Planning Study: Behavioral
Factors in Dental School Design. Washington, D.C: The George
Washington University, October 1965b. Mimeo.
Myrick, R., Cohen, S, L., and Marx, B. S. Higher order needs: A
neglected aspect of contemporary school design. The Comtmter,
In American Education, edited by D. D. Bushnell and D. W. Allen.
New York: John Wiley and Sons, 1967.
Myrick, R. and Marx, B. S. Informal conversations and learning among
dental students: Influence of school design. Journal of Dental
education, 31, 1967: 488-492.
Myrick, RA, Marx, B. S., and Cohen, S. L. Higher order needs in
architecture. AIA Journal, 45, 1966: 62-66.
* Rausch, H. L., Dittmann, A. T., and Taylor, T. J. The interpersonal
behavior of children in residential treatment. Journal of Abnormal
and Social Euchology, 58, 1959a: 9-27.
Rausch, H. L. Dittmann, A. T., and Taylor, T. J. Person, setting
and change in social interaction. Human Relations, 12, 1959b:
361.378.
* Rausch, H. L., Dittmann, A. T., and Taylor, T. J. Person, setting
and change in social interaction. II. A Normal Control Study.
Human Relations, 13, 1960: 305-332.
4r

-77-
Research and Design Institute. 1967 Directory of Behavior andEnvironmental pesign. (A directory of individuals currently.doing research in this interdisciplinary study-area, relatingto the ,influence of architecture or environmental design uponbehaviot. Nay be obtained by writing the Research and DesignInstftute, P. 0. Box 307, Providence, Rhode Island 02901.)
Sommer, R. Design for friendship, Research in a large mentalhospital. AAA Journal, 38, 1962: 84-86.
SoMmer, R. Personal space. AIA Jou-mal, 38, 1962: 81-83.
Sommer, R. Studies in personal space, Sociameta, 22, 1960: 247.260.
Sommer, R. and, Ross, H. Social interaction on a geriatrics ward.International, journal of Social Psychiatry, 1958: 128-133.
Stea, D. Toward a Elfcholou of Environmental pnian: The Im ctof Man-Made Ecology. Stanford, Ca ifornia: StanforrUnivers ty.Nrimeo.rtiiTaaTeT,
Sugarman, B. ,Involvement in youth culture, academic achievement andconforiity in school: Ar empirical study of London schoolboys.The" British Journal of Sociology, 18, 1967: 151-164.
* Note: The asterisked readings are those which are specificallyreferred to in this report.

APPENDIX A
HIGH SCHOOL INTERACTION 'MEMORY
Vote: This questionnaire was used to collect written self-report
Tiformation about the students' interactions and the locations in the
-high schools where these occurred. It was called an "Inventory" rather
than a "Questionnaire," because school systems find the lattcr word
sometimes has unfavorable connotations. In its complete format, the
"High School Interaction Inventory" consisted of: (1) a cover nheet cm
which the student entered certain biographical data, giving his or her
name, school, grade-level, age, sex, class period and date during which
the questionnaire was filled out, complete daily schedul-, of classes,
and extra- curricular activities; (2) detailed instreetio s for filling
out the interaction recording sheets, with the instrue/Ws being read
over aloud with the students; (3) a ChTile interaction recorstela sheetwith illustrative answers filled in; five blank Gteraction-r-cgailmsheets, providing the necessary recording space for a total of tii:teen
interactions, with instructions to ask for more recording sheets if needed;
and (5) a final sheet containing several optional questions about school
building designs which students were to answer if they finished recording
their interactions before the rest of the class did. (The main purpomm of
the sheet with optional questions was to keep students occupied throughout
the period, so if they finished early they would not make distracting
noises, or have an opportunity to work on their homework, with the possimble result that students with more interactions might have been motivated
to cut short their recording in order also to gain a bonus of some extra
"study-hall" time.)
As the questionnaire in its cemplete format is quite lengthy, only its
most important part, the "Interaction Recording Sheet," has been repro-
duced for inclusion in the appendix. To make the use of the sheet clearer
for the reader, sample enswers have been filled in. Each informal inter.
action is recorded downwards, in the columns that run from the top to the
bottom of the page. Thus Column 1 contains one interaction, Column 2 con-
tains another, and Column 3 gives a third interaction, allowing a total of
three interactions to be recorded on each page.
Students were told to use, whenever appropriate,theanswar-choices given in
the left-hand margin of each recording sheet; otherwiee to make up their
own answers to fit the interactions being recorded. On Item #9 dealing
with the content of the interactions, students were instructed that if the
conversation dealt with several tepics to list them all, unless these ex.
ceeded three in number, and in that case to list the three topics which
received the most discussion. It was explained that students did not have
to give any details about the content unless they wished to. Many students
however, freely went into some detail about the. content of their conversa-
tions, which was helpful to the investigators in providing more of an
"in-depth" view of the content of high school student interactions.
For ease of use, each "Interaction Recording Sheet" was printed on a
sinIklt sheet of legal-size paper. But, as this report will not account).
date a page of thalt length, the sheet has been split and printed for ire
elusion here on the two following separate pages:
-78-

Name John DoeSchool tip School Y
INTERACTION RECORDING SHEET
I. Time when interaction occurred?State whether between classperiods, or durinz period,e.g. "Between periodand a " OF;11)=.ng
lt, Total number ofasti-ispauf;?Count yourself.
I. Whonts? State whether teacher
or student, and sex of persons.Give student's class level(Junior or Seni;F7Tif can.
ZZ. Who-startgd int;uracti3n?Yourself other person, ordon't know.
wee a
°sr. :what were other_persons doing?See Quest #6)
Location ;here "Occurred?In hallway near inter-section of hallway nearstairway near..., hall-locker(give#), classroom( stateperiod), lab, office, lounge,gym, rest-rooms, locker room,cafeteria, library, parkinglot, other outside area ofschool grounds, etc.
What were you din whenaustialktan?Studying, eating, etc., 21:going from toor waiting for
specify
How-you took part in Inter.-action? State whether you-617-ged quite a lot," "talkedsome" or "listened mostly"
VIM 1111110 Mao Mow .14b
Period 1st
beforeschoolstarted
IMMO NINO,
2
Jr. girl
ORIO IMMO
myself
GINO 1.111W
outsidearea ofschoolgrounds
a/MD WINO
walkinginto bldgon way tolockermemo 41110
talking outside door obuilding
talkedquite alotedam
etween home- ! duringoom and 1st firstriod class period
5
en.
QOM
1 male teacheSr. girls
1 Jr. boy
OM.
on't know
WOO
allway nearfirst periodlassroom
standing in
SNP
standingin hall-may also
listenedmostly
a
(see next page for the rest of the questionnaire items)
-79-
VMS
WNW
VW&
3MM.
Sr. boy& 1 Sr.girl
ONO
Sr. boy
firstperiodclassroom
waiting forteacher tobegin class
alsowaiting
IMO
talked some

INTERACTION RECORDING SHEET
Vr7sContent related to?SECTirnig7iers,7.al mattersclasswork, homework, test,teachers, school administra.
.%/t1InvL.Vi.1=5C; or ,,uslAm.a.C1 asis Far
extra.curric, activities,school events, news events,weather, small talk, etc,
1.0. Your mktrammii?Give information, get infor.mation, express opinion, befriendly, gripe, kill time,have interesting talk, exchangeideas, etc.
Colz.tm 1.
school event& social life-. the ccmingetost.^^I Aminissa
$
11.Wasam r ose accomplished?State yes, no, or partly"
Ir Approximate amount of tune'smatt.iminutes ?
DoiggiaLtlie toatUNLII_LXrushed or vervjushed?
ONO
and whethershe has adate for it
get infar.mation
a
no
partlyrushed
Column 2
extra.curric,..editorial.,^14,,Ir
next issueof schoolpaper
ORM
just befriendly
IMO
Yes
MVO
Column 3
homework..borrowing apencil - &lAhnrAt-nry
assignmentfor anotherc lass ,whether
we a. fn wed
express anopinion, &gripe
SOW .11110
partly
OWN MOO
(very'rushed SUP
enough
1

APPENDIX B
FULL TABLES
-81-

Grand Total
School XSchool YSchool Z
Grade Totals
QUESTION 01: "TIME WHEN INTERACTION OCCURRED?"
Responses to Inventory by School, Grade, and Sex
(n = 300 subjects; 1672 responses)
Between DuringClasses Classes
(1672100%) 32 43
(533=100%)(602=l00%)
(537=100%)
29 463434 38
Tenth (244=100%) 26
Eleventh (838=100 %) 33
Twelfth (590=100%) 34
Total Males (755=100%) ;6
School X: (245=100%) 30
Tenth (117=100%) 27Eleventh (128=100%) 34
School Y; (261=100%) 40
Eleventh (123=100%) 36
Twelfth (138=100%) 45
School Z: (249=100%) 38Eleventh (124=100%) 44Twelfth (125=100 %) 32
Total Females (917=100%) 28
School X: (288=100%) 28
Tenth (127 =100 %) 26
Eleventh (161=100%) 30
'School Y: (341=100%) 28
Eleventh (162=100%) 28
Twelfth (179=10)%) 27
Cchool Z: (288=100%) 30
Eleventh (140=100%) 26
Twelfth (148=100%) 34
During Before After Not
Lunch School School Stated
10
7 98 716 5
8
77
00
50 6 9 840 12 7 844 9 6 6
39 11 6 7
46 6 9 8 .
52 3 9 8 .
41 8 9 7 .
36 10 7 6 .
37 15 6 635 6 8 6 .
35 16 3 8 .
3o 17 2 7 .
40 15 4 9
46 10 7 7 .
46 9 8 8
47 10 9 7
45 8 8 8 .
51 6 7 8 .
42 9 9 11 .60 2 5 6 .
) , 16 6 6 .
4e 17 8 641 14 5 5
.82..

Grand Total
School XSchool YSchool Z
fU. ^ti
QUESTION #2: "TOTAL NUMBER OF PARTICIPANTS IN INTERACTION ?"
Responses to Inventory by School, Grade, and Sex
(n m 300 subjects; 1672 responses)
Two Three Four Five Over Five NotPersons Persons Persons Persons Persons Stated
Grade Totals
(1672=100 %) 64 21 7 3 4
(533=100%) 54 24 9 5 7
(602=100%) 70 20 4 1 3
(537=100%) 67 18 9 2 3
Tenth (244=100%)
Eleventh (838 ctiO4)
Twelfth (590=100%)
,tal Males (755=100%)
School X: (245=100%)Tenth (117=100%)
Eleventh ( 12 8 =100 % )
SI:hool Y: (261=10c%)
Meventh (123=100%)
Nelfth (138=100%)
Zdhool Z: (249=100%)
Eleventh (124=100%)
Twelfth (125=100%)
Total Females (917=100%)
School X: (288=100%)
Tenth (127=100%)Eleventh (161=100%)
School Y: (341=100%)Eleventh (162=100%)
Twelfth (179=100%)
School Z: (288=100%)Eleventh (140=100%)Twelfth (148=100%)
55 24 11 4 5
61 22 8 3 6
n 18 5 2 2
64 20 7 2 5
56 24 9 4 6
57 21 12 4 5
55 26 6 5 8
68 21 5 1 6
64 19 6 1 10
71 23 14 1 1
70 16 8 2 3
67 19 10 2 2
73 13 6 3 14
63 22 8 3 4
52 25 lo 5 8
51 27 11 5 6
53 23 9 5 9
73 20 14 2 2
72 22 5 - 1
74 18 3 3 2
64 21 10 2 3
57 22 13 4 14
72 20 6 2
-83-

Grand Total
School XSchool YSchool Z
Grade Totals
TenthEleventhTwelfth
Total Males
School A:TenthEleventh
School Y:EleventhTwelfth
School Z:EleventhTwelfth
Total Females
School X:TenthEleventh
School Y:EleventhTwelfth
School Z:EleventhTwelfth
QUESTION #3-A.: "WHO WERE THE OTHER l'ARTICIPANTSIN THE INTERACTION?"
Responses to Inventory by School,/ Grade, and Sex
(n = 300 subjects; 1672 rezponses)
Student(s)
(1672=100%)
(533=100%)(602=100%)(537=100%)
SameSex
5/1
565650
DifferentSex
BothSexes
22 11
16
2525
131010
Teacher(s)
11
128
114
(244=100%) 65 3.2 10 10(838=100%) 51 23 13 11(590=100%) 52 26 9 13
(755-%100%) 514 22 10 12
(2)45=1(10%) 60 114 10 12(13.7-11k..0%) 70 10 7 8(126=Do%) 5o 17 13 16
(261=100%) 514 25 12 8(123=100%) 59 20 lit 6(138=1001) 50 30 9 10
(21!9=100%) 48 27 10 14(124=100%) 5o 30 11 9(125=100%) 146 24 8 20
(917=100%) 53 22 12 11
(288=100%) 52 18 16 13(127=130%) 60 13 12 13(161400%) )43 24 19 13
(341=100%) 56 26 9 8(162=100%) 55 214. 10 10(179=100) 58 28 8 6
(288=100%) 52 22 12 13(1140=100%) 51 23 13 11(10=100%) 52 22 10 15
-84-
NotStated
2
21
2
4514
1
2
a
a
1
`.110114.06.040,..*-

.-L.
QUESTION #3-B: 111611E OTHER PARTICIPANTS IN THE INTERACTIONFROM THE SAME OR DIFFEREIT CLASS-LEVEL?"
Resr'onses to Inventory by School, Grade, and Sex
(n = 300 subjects; 11473 responses)
Same Different Mixed NotClass Classes Classes Stated
% % % %
Grand Total (1473=100%) 72 17 8 2
School X (464=100%) 68 15 10 5School Y (550=100%) 714 18 6School Z (1459=100%) 714 18 .6 2
Grade Totals
Tenth (218=100%) 60 16 12 10Eleventh (740=100%) 75 17 7 -Twelfth (515=100%) 7/4 18 6 1
Total Males (663=100%) 72 18 oe 3
School X: (215=100%).Tenth (108=100 %)
Eleventh (107=100%)
School Y: (237=100%)Eleventh (113=100%)Twelfth (124=100%)
School Z: (211=1.00%)Elaventh (113=100%)Twelfth (98=100%)
Total Feanaled (810=100%)
School X: (2149=100%)Tenth (110=100%)Eleventh (139=100%)
School Y: (313=100%)Eleventh (145=100%)Twelfth (168=100)
School Z: (248=1.0C%)Eleventh (123=10C%)Twelfth (1250100%)
67 16 9 8
56 18 10 1578 lit 8 -75 20 '4 -76 18 5 -74 23 3 -
76 19 4 1714 21 3 177 17 5 1
72 16 10 2
70 114 12 365 15 13 6
75 13 11
714 17 9 -72 19 8 -
IND
75 15
72 1774 1670 18
10
8
MI*
78 18 4
Note: The number of remponses for this item iv less than that forother I;ables, becau6e interactions with teachers are notcountee in this distribution which deals with class level ofthe students,
.85-
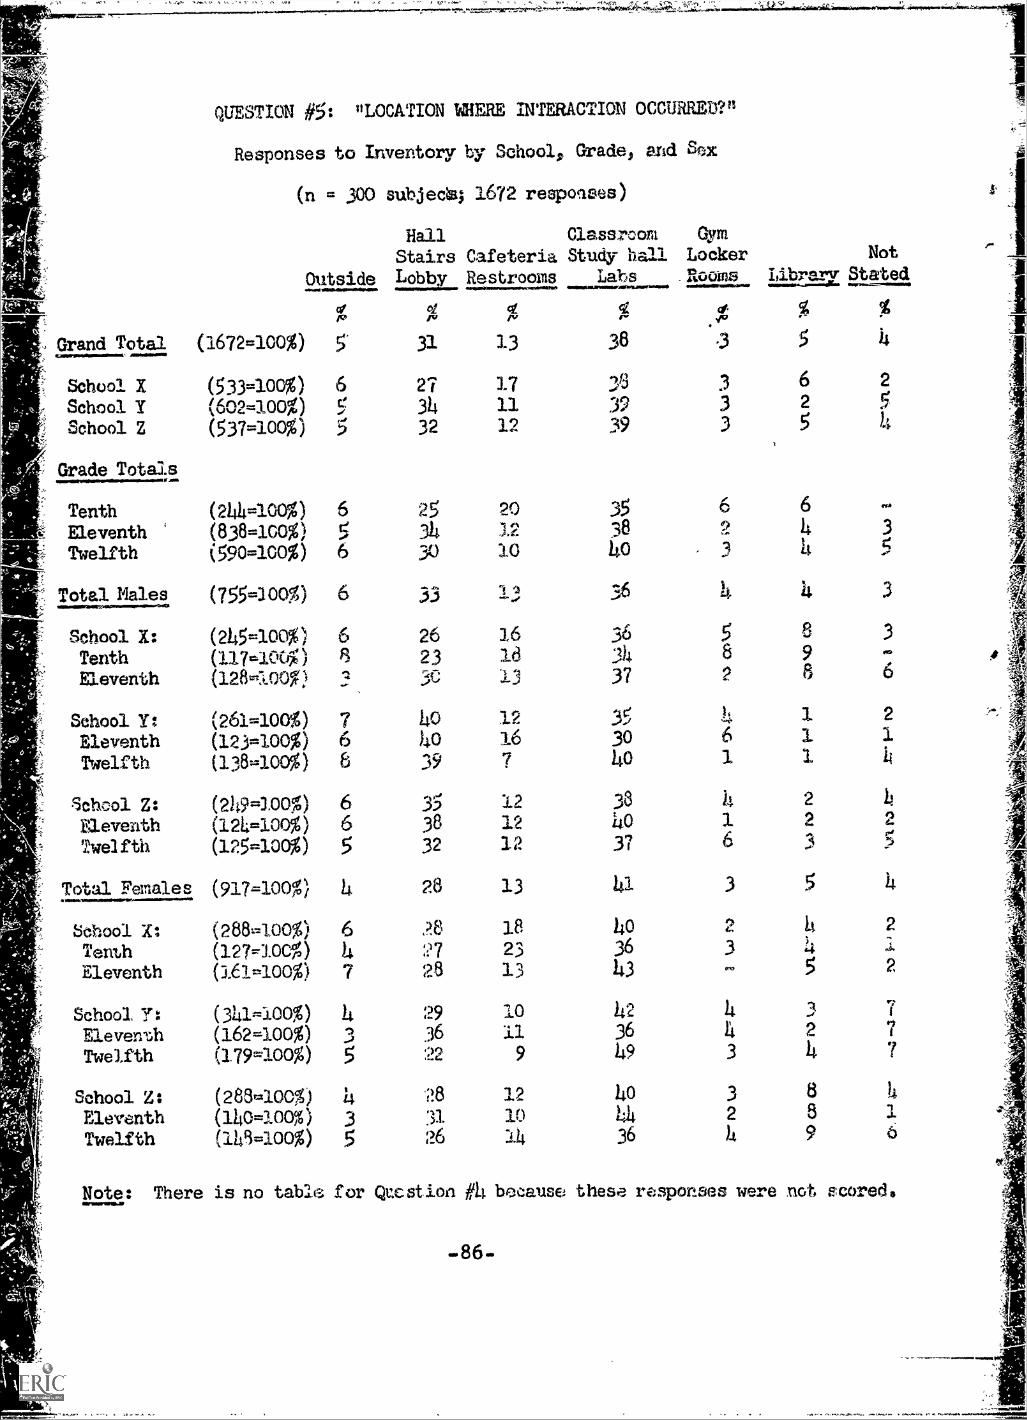
School XSchool YSchool Z
Grade Totals
Tenth
EleventhTwelfth
School X:
TenthEleventh
School Y:
EleventhTwelfth
School Z:
EleventhTwelfth
Total Females
8chool X:
TemhEleventh
School
EleventhTwelfth
School Z:EleventhTwelfth
Note: There11117071111161P
QUESTION #5: HLOGATION MERE INTERACTION OCCURREDV!
Responses to Inventory by School, Grades and Sex
(n = 300 subjedsq 1672 responses)
(1672=100%)
(533 =100%)
(602=100%)(537=l00%) 5
Hall Classroom Gym
Stairs Cafeteria Study hall Locker
Outside Lobby. Restroons Labs .R.00ms
(v.q
5 3]. 13
6
38
2i 17 lr
34 11 3932 12 39
(244=100%) 6 25 20
(535=100%) 5 34 12
(590=100%) 6 30 10
(755=100%) 6 33 1 -2-.,
(245=100%) 6 26 16
(117=100%) 8 23 Id.4...;_
(261=100%) 7 40 12
(123=100%) 6 40 16
(138=100%) 6 39 7
(249=100%) 6 35 12
(124=100%) 6 38 12
(125=100%) 5 32 12
(917 =100 %) 4 28 13
(288=100%) 6 :).6 18
(127-10c%) 4 :7 23(161-100%) 7 28 13
(341=100%) 4 29 10
(162=100%) 36 11
(179=100%) g 22 9
(288=100%) 4 2.8 12
(1110=100%) 3 31.10
(149=100%) 5 26 14
.3
Not
MMNIMWLibrary Stated
5 4
3 6 2
3 2 5
3 5 4
35 6 6
38 2 4 3
40 ".3 at
6 41_ 4 3
36
3437
582
8
98
3
6
35 ,..i.
1, 1 230 6 1 1
40 1 1 4
384037
140
36
43
16
223
3 5
23
42 436 449 3
5
2
5
2j..
2
3 72
7
140 3 8 4
)44 2 8 1
36 4 9 6
is no tablG for Qmstion #4 because these responses were not scored
'86w

Grand Total
School XSchool Y2thooi Z
Tenth1c
Twelfth
ti4hc--ei. X:TanthUtverth
School vgEleventhTwafth
School Z:gieventhTwelfth
QUESTION #6: "WHAT WAS STUDENT DOINGWHEN INTERACTION BEGAN90
Responses to inventory by School, Grade, and Sex
in 300 subjects; 1672 responses)
Waitingfor
SpecificActivityTo Begin
(1672=100%) 24
(533*100%) 25
(602=100%) 26
(537"100%) 20
(244m100%)(8380.00%)(590=100%)
(7554:00%)
(2450100%)
(117=100%)(128=100%)
(261=100%)(123=100%)(130=100%)
(24960100%)(124=100%(1250100%)
Total Females (917=100%)
School X:Tenth'Eleventh
School YtEleventhTwelfth
School Z
EleventhTwelfth
(288=100%)
(127=100%)(161=100%)
(341=100%)(1420100%)
(179-100%)
(288-100%)(140mico%)(148=100%)
282422
22
232323
252723
172014
26
23
32
23
27
25
29
2.5
2620
Engagedin
Specific
AStlYltr
36
140
3138
42
34
36
36
43
50
36
28
3027
3553.39
37
37
140
314
31
37
140
38143
-87-
11
Going toSpecific Roam- Eating Not
Place Lunch Stated
31 2 6
263731
22
33
33
2521
29
140
36145
647
2 51 6
3 5
2 6
4
14 7
5
6
36 4 839 2
32 5 10
29 2 6
27214
30
3438
26
26
26
71 8
6
1 45
2 2
4 62 85 5
YIP
ea
CZ
CO
CO
=CEP
OD
1
ICC
Oil
'Vs
SD
Olt

QUESTION #8: "HOW STUDENT TOOK PART IN INTERACTION ?"
Responses to Inventory by School, Grade, and Sex
(n = 300 subjects; 1672 responses)
Talked Talked Not
A Lot Some Listened Stated
Grand Total (1672=100%) 24 ..,)eP 17
School X (533=100%) 24 59 17 -
School Y (602=100%) 25 57 17
School Z (537=100%) 23 59 15 ,.
Grade Totals
Tenth (244=100%)
Eleventh (838=100%)
Twelfth (59Cc100%)
Total nales (755=100%)
School X: (245=100%)
Tenth (117=100%).
Sleventh (128=100%)
School!: (261=100%)
Eleventh (123=100%)
Twelfth (138=100%)
School Z: (249=10OPEleventh (124=100%)
Twelfth (125=100%)
Total Females (917=100%)
School X: (288=100%)
Tenth (127=100%)
Eleventh (161=100%)
School Y: (341=100%)Eleventh (162=100%)
Twelfth (179100%)
Schcol Z! (288=100%)
Eleventh (140=100%)
Twelfth (148=100%)
24 62 114
25 58 17
23 58 19
24 58 18
21 61 1818 66 16
24 56 20
26 ..-
c.-71
1619 55 1321 59 19
24 57 20
23 60 17
24 54 22
24 58 17
27 57 1629 58 13
25 56 18
24 56 18
22 57 20
26 56 17
22 61 17
23 61 16
22 61 18
Note: There is no table for Question #7 because these responses were not
scored.
-88-

Grand Total
School X
School. Y
School Z
Grade Totals
TenthEleventhTwelfth
Total Males
School X:TenthEleventh
School Y:EleventhTwelfth
School Z:EleventhTwelfth
Total Females
QUESTION q-As 0SINGIS- A.A A
Responses to inventory by School, Grade, and Sex
(n = 300 subjects; '672 responses)
Multiple Multiple MultipleNot Includine AIL
Academic Acadeiric Academic
(1672100%)
(533=100%)(602=100%)(537251C0%)
(244-100%)(8380100;0(5902100%)
(755100%)
(2450100%)(117=100%)(128-100%)
(261400%)(123-100%)(138-100%)
(249400%)(124400%)(125-1c0%)
(917-100%)
Q4noolia1.0
School X: (288-1coo,g)Tenth (127-100%)Eleventh (161-100 %)
School Y2 (341-100%)Eleventh (162400%)Twalth (179=104)
School Z: (288400%)Eleventh (140-100%)
Twelfth (148,11C0%)
75
777475
10 11
8 12 2
12 10 48 11 5
76 1073 8
78 11
77 9
78 6
79 7
78 6
74 14
72 11
77 16
79 7
78 6
80 8
73 10
75 1072 13
78 8
72 1066 11
17 10
70 9
66 8
75 10
-89-
11
114
6
le
121013
103.5
810
6
12
1212
1015
5
2
1.14
3
232
2
2
463
5
22
2
7
8
68

VESTION 9-Bs nCONTENT RELATED TOT"
Rotsponzen to Inventory by School, Grade, and Sex
(
Courselicrk
411,40rd (2237m100%) 27
School X (706=100%) 23School Y (822=100) 28
School Z
ade Totals
(709=1000 30
°nth (3210100%) 24leventh (1157=100%) 2?
lfth (759m100%) 28
Act. Malec (964-100%) 25
School Xs (311400%) 23Tenth (1460100%) 27Eleventh (165=100%) 29
School Y: (344=100%) 26Eleventh (168=100%) 29Twelfth (176=100%) 22
School Zs (3090100%) 27Eleventh (154-1000 28Twelfth (155=100%) 26
otal Females (1273-100%) 28CelIMIM120.7.02117.
Sokiool (395u100%) 23Tenth (175=100%) 22
23.eventh (220=100%) 24
School Y: (478-100%) 30
Eleventh (247a100%) 32Tvelfth (2510100) 29
Sahool Z (4001040%) 32
Eleventh (2030100%) 32
Twelfth .1.97go1c0%) 33
227 rcponses)
Tae hers,11011,....1011111114.11114(
7
School 6o11,-:,
Events Fhturo Social
13 3 47
6 14 2
6 12 410 13 3
688
8
869
555
1012.
6
63
141312
114
13.
16
1212
13
114
15
13
25
3
32
333
33.
5
3
13.
8 12 48 12 3
7 11 6
813.6
1212:
14
11 7
NotStzlted
2
52' 2
48 1Ito 4
5147
43
47
5o
149
50
52h955
140
435
46
54
5356
42
140
4338
223
3
25
221
658
2
1
2
ote: The number of responses for this item is more tban for other tables, becaase
471+=rect1cne dealirg with nave than one topic are counted more than once()
-90-

Grand Total
School XSchool YSchool Z
Grade Totals
TenthEleventhTwelfth
Total Males
School X:TenthEleventh
School Y:EleventhTwelfth
School Z:EleventhTwelfth
Total Females
School X:TenthEleventh
School Y:EleventhTwelfth
School Z:EleventhTwelfth
QUESTION #10: "STUDENT' S 19.4.1-14 PURPOSE
IN PARTICIPATING IN INTERACTIONVI,
Responses to Inventory by School, Grade, and Sex
(n isF 300 subjects; 1.672 responses)
ExchangeInformation, Be Friendly,Opinions, Gripe, oror Ideas Kill Time
(1672=100 %) 54
(533eao0%) 54(6020100%) 52(537=100 %) 514
(2414=100%)(838=100%)(590=l00%)
(755=10%)
(2145=100)(117=l00%)(128=100%)
(261=3.00%)(1.23.-a00%)(138 =l0o%)
(249=100%)(124=100%)(125=10o%)
(917=100%)
(288=100%)(1272.00%)(161cs100%)
(3141=100%)(162=100%)(179=100%)
(288=100%)(1140=100%)(1148=100%)
545256
52
5050
484652
585264
55
58576o
565656
50
35
35314
36
BothInformation .al
andSocial-Dnotional
8
83.06
36 737 831 9
37 6
140
38
364031
3414425
685
222
33 13
303525
3231314
3841314
614
1011
9
118
114
NotStated
2
3.
23
21it
4
2
14
53.
9
1

School XSchool YSchool Z
TenthEleventhTwelfth
Total Males
School X:
TenthEleventh
School Y:
EleventhTwelfth
School Z:EleventhTwelfth
"
QUESTION #11 VAS STUDENT I S PURPOSE ACCOMPLISHED?"
Responses to Inventory by School OTadc, and S'ex
(n = 300 subjects; 1672 responses)
(1672=100%)
(533=100%)(602=100%)
(537=100%)
(838=100%(590=100%
Yes No Partlz
%1479 6
80 7 13
79 5 1679 5 14
78 0
78 682
(755=100%) 78
(245-100%)(117=100%)
(128=100%)
(261=100%)(123=100%)(138 =1C 0%)
(249=100%)(124=100%)(125=100%)
Total Females (917=100%)
School X: (288=100%)
Tenth (127=100%)
ELevonth (161=3100%)
School Y: (341=100%)
Eleventh (162=100%)
Twelfth (179=100%)
School Z: (288=100%)
Eleventh (140=100%)
Twelfth (148=100%)
8082
79I
1415
14
6 15
8 12
8 9
7 14
78 5 17
78 7 11$
77 3 20
76 7 16
71 8 20
82 6 11
80 5 314
79
7385
6 148
11
80 6 14
6 7 177
84 4 11
82 4 14
81 3 14
83 4 13
-92.
NotStated

Grand Total
School XSchool YSchool Z
Grade Totals
V.
r.; UESTION #32: HAMOUNT OF THE SPENT ON INTERACTION?"
Raspon3ea to Inventory by School, Grade, and Sex
(n. az 300 subjects; 1672 responses)
Up to 2 3 to 14 5 to 10Minutes Minutes Minutes
(1672=100%)
(533=100%)(602=100%)(537=10%)
46
35555o
Tenth (2144=100%) 33Eleventh (838=100%) 145
Twelfth (590=100%) 56
Total Males (755 =100 %) 47
School X: (245=100%) 38Tenth (117 =100 %) 35Eleventh (128=100%) 40
School Y: (261=100%) 53Eleventh (123=loop 44Twelfth (138=100%) 62
School Z: (249=100%) 51Eleventh (124=100%) 514
Twelfth (125=100%) 148
Total Females (917=3.00%) 146
School X: (288=100%) 32Tenth (127=100%) 31Eleventh (161=100%) 33
School Y: (341=l00%) 56Eleventh (162 =100 %) 53Twelfth (179=100%) 60
School Z: (2 88 =100 %) 148
Eleventh (1140=100%) 144
Twelfth (148=100%) 53
214
214
2)4
23
22
31
1521
,
Over 10 NotMinutes Stated
6
105
26 30 1025 22 620 18 14
214 21 7
22 30 1023 32 1022 28 10
24 16 828 16 1119 15 /I
26 18 li.
29 13 222 23 6
24 23 5
25 32 929 28 1121 35 7
26 114 223 1/4 223 114 2
21 214 5214 25 618 22 14 2

Grand Total
School XSchool YSchool Z
Grade Totals
QUESTION #13: uSUFFICIENT TIME FOR INTERACTIONV!
Responses to Inventory by School, Grade, and Sex
(n 3* 300 subjects; 1672 responses)
No NoPartly Very Not
Yes Rushed Rushed Stated
(1672=100%) 67 24 9
(533=100%)(602 =100%)(537=100%)
Tenth (244=100%)Eleventh (838 =100 %)Twelfth (590=10%)
Total hales (755=100%)
School X: (245=100%)Tenth (117=100%)Eleventh (128=100%)
School Y: (261 =100%.)Eleventh (123=100%)Twelfth (138=100%)
School Z: (249=100%)Eleventh (124=100%)Twelfth (125=100%)
Total Females (917=100%)
School X: (288=100%)Tenth (127=100%)Eleventh (161=100%)
School Y: (341=100%)Eleventh (162=100%)Twelfth (179=100%)
School Z: (288=100%)Eleventh (1)40=100%)Twelfth (148=100%)
69 23 766 22 1266 27 7 .
70 21 866 214 968 23 9
69 22 9
74 18 777 12 971 24 5
6? 21 LI70 20 1064 22 14
66 26 860 31 971 21 8
66 26 8
64 28 8
63 30 7
65 27 8
65 23 1260 25 1570 21 9
68 28 669 25 666 30 5
-.94.

FROM:
ERIC. FACILITY
SUITE 601
1735 EYE STREET, N. lilt
WASHINGTON, D. C. 20006