final environmental impact assessment - Okomu Oil
604
FINAL ENVIRONMENTAL IMPACT ASSESSMENT (EIA) REPORT FOR THE PROPOSED 60TPH PALM OIL MILL PROJECT AT EXTENSION TWO IN OVIA-NORTHEAST LOCAL GOVERNMENT AREA, EDO STATE, NIGERIA BY OKOMU OIL PALM COMPANY PLC FEBRUARY 2020
-
Upload
khangminh22 -
Category
Documents
-
view
0 -
download
0
Transcript of final environmental impact assessment - Okomu Oil

FINAL ENVIRONMENTAL IMPACT ASSESSMENT
(EIA) REPORT
FOR
THE PROPOSED 60TPH PALM OIL MILL PROJECT
AT EXTENSION TWO IN
OVIA-NORTHEAST LOCAL GOVERNMENT AREA,
EDO STATE, NIGERIA
BY
OKOMU OIL PALM COMPANY PLC
FEBRUARY 2020

Environmental Impact Assessment (EIA) of the Proposed
60TPH Palm Oil Mill Project at Extension Two
in Ovia- Northeast Local Government Area,
Edo State, Nigeria
By
Okomu Oil Palm Company Plc
Submitted to.
Federal Ministry of Environment, Abuja
Final Report
Prepared by
Office Address: 21, Johnson Street, Akute Ogun State, Nigeria
Liaison Office: 21/23 Mercy Eneli Street, Surulere Lagos State, Nigeria
Email: [email protected]; Website: www.fdsng.com
Tel: +234 803 331 4800; +234 802 223 6228
FEBRUARY 2020

Okomu Oil Palm Company Plc: 60TPH Palm Oil Mill Project at Extension Two February 2020
Environmental Impact Assessment (EIA) – Final Report i
TABLE OF CONTENTS
CONTENT
List of Tables----------------------------------------------------------------------------------------------------
List of Maps----------------------------------------------------------------------------------------------------
List of Figures------------------------------------------------------------------------------------------------------
List of Plates---------------------------------------------------------------------------------------------------------
List of Annexure/Appendices-------------------------------------------------------------------------------------
List of Abbreviation and Acronyms------------------------------------------------------------------------------
EIA Study Team----------------------------------------------------------------------------------------------------
Acknowledgements--------------------------------------------------------------------------------------------------
Executive Summary-----------------------------------------------------------------------------------------------
CHAPTER ONE: INTRODUCTION----------------------------------------------------------------------
1.1 History and Business of Okomu Oil Palm Company Plc-----------------------------------------
1.2 Location and Access----------------------------------------------------------------------------------
1.3 Activities--------------------------------------------------------------------------------------------------
1.4 Mission Statement of The Okomu Oil Palm Company Plc-------------------------------------------
1.5 Literature Review on the Palm Oil----------------------------------------------------------------------
1.6 Legal and Administrative Policy Framework-------------------------------------------------------
1.6.1 National Legislation-------------------------------------------------------------------------------------
1.7 International Finance Corporation (IFC) Performance Standards (PS)-----------------------------
1.8 Roundtable on Sustainable Palm Oil – Principles and Criteria-----------------------------------
1.9 International Agreements and Protocols-------------------------------------------------------------
1.10 Institutions and Regulatory Agencies----------------------------------------------------------------
1.11 Non-Governmental Organizations (NGOs)---------------------------------------------------------
1.12 General Environmental Impact Assessment Procedural Guidelines------------------------------
1.13 Okomu Oil Palm Company Plc IMS Policy---------------------------------------------------------
1.14 Objectives of Environmental Impact Assessment-----------------------------------------------------
1.15 Terms of Reference (ToR)----------------------------------------------------------------------------
1.16 Justification of the EIA Report---------------------------------------------------------------------------
1.17 Structure of the Report-----------------------------------------------------------------------------------
1.18 Declaration------------------------------------------------------------------------------------------------
CHAPTER TWO: PROJECT JUSTIFICATION--------------------------------------------------
2.1 The Proposal---------------------------------------------------------------------------------------------
2.2 Purpose and Need for the Project----------------------------------------------------------------------
2.3 Project Justification-------------------------------------------------------------------------------------
2.4 Cost of the Project----------------------------------------------------------------------------------
2.5 Benefits of the Project--------------------------------------------------------------------------------
2.6 Envisaged Sustainability-------------------------------------------------------------------------------
PAGE
ix
xi
xi
xii
xii
xiii
xvi
xvii
xviii
1
1
2
5
5
5
8
8
11
12
12
14
15
16
19
20
21
21
22
22
23
23
23
24
25
25
25

Okomu Oil Palm Company Plc: 60TPH Palm Oil Mill Project at Extension Two February 2020
Environmental Impact Assessment (EIA) – Final Report ii
2.6.1 Economic Sustainability-------------------------------------------------------------------------------
2.6.2 Technical Sustainability-------------------------------------------------------------------------------
2.6.3 Environmental Sustainability--------------------------------------------------------------------------
2.6.4 Social Sustainability-------------------------------------------------------------------------------------
2.7 Project Alternatives and Options-------------------------------------------------------------------------
2.7.1 Alternative Site--------------------------------------------------------------------------------------
2.7.2 Alternative Project-------------------------------------------------------------------------------------
2.7.3 Alternative Technology--------------------------------------------------------------------------------
2.7.4 No Project Option--------------------------------------------------------------------------------------
2.7.5 Delayed Project Option------------------------------------------------------------------------------
2.7.6 Do Project Option-------------------------------------------------------------------------------------
CHAPTER THREE: PROJECT/PROCESS DESCRIPTION-----------------------------------------
3.1 Brief Project/Process Description--------------------------------------------------------------------
3.2 General Processes of Palm Oil Production---------------------------------------------- ---------------
3.3 The proposed Oil Mill Processing Line (Process Flow chart)------------------------------------
3.3.1 Bunch reception-------------------------------------------------------------------------------------------
3.3.2 Threshing (removal of fruit from the bunches)-------------------------------------------------------
3.3.3 Sterilization of Bunches---------------------------------------------------------------------------------
3.3.4 Digestion of the Fruit---------------------------------------------------------------------------------
3.3.5 Pressing (Extracting the palm oil)--------------------------------------------------------------------
3.3.6 Batch Presses--------------------------------------------------------------------------------------------
3.3.7 Continuous Systems------------------------------------------------------------------------------------
3.3.8 Clarification and Drying of Oil------------------------------------------------------------------------
3.3.9 Oil Storage------------------------------------------------------------------------------------------------
3.3.10 Kernel Recovery----------------------------------------------------------------------------------------
3.3.11 Traditional Method of Palm Oil Processing--------------------------------------------------------
3.3.12 Processing and Use------------------------------------------------------------------------------------
3.4 The Proposed Palm Oil Mill--------------------------------------------------------------------------
3.5 Mill Processing Line Mechanical Components-----------------------------------------------------
3.6 Safety Devices------------------------------------------------------------------------------------------
3.7 Steam Boiler---------------------------------------------------------------------------------------------
3.8 Civil Structures------------------------------------------------------------------------------------------
3.9 Mill Features and Facilities----------------------------------------------------------------------------
3.10 Sizing of the Palm Oil Mill----------------------------------------------------------------------------
3.10.1 Quantity of FFB to be processed---------------------------------------------------------------------
3.10.2 Throughput----------------------------------------------------------------------------------------------
3.10.3 Capacity Utilization per Year-------------------------------------------------------------------------
3.10.4 Finished Products---------------------------------------------------------------------------------------
3.11 Installation & Commissioning------------------------------------------------------------------------
3.11.1 Plant Installation and Construction Engineers---------------------------------------------------
26
26
26
27
27
27
27
27
27
28
28
29
29
30
33
33
33
34
35
35
35
36
37
38
38
38
39
42
50
54
54
56
56
57
57
57
57
57
58
58

Okomu Oil Palm Company Plc: 60TPH Palm Oil Mill Project at Extension Two February 2020
Environmental Impact Assessment (EIA) – Final Report iii
3.12 Description of the Site---------------------------------------------------------------------------------
3.13 Water Treatment Process------------------------------------------------------------------------------
3.14 Water Supply and Drainage System Facility-------------------------------------------------------
3.15 Firefighting System-------------------------------------------------------------------------------------
3.16 Emissions Control Facilities---------------------------------------------------------------------------
3.17 Civil Engineering------------------------------------------------------------------------------------
3.18 Current Situation of Energy Supply------------------------------------------------------------------
3.19 Training-------------------------------------------------------------------------------------------------
3.19.1 Plant Operation----------------------------------------------------------------------------------------
3.20 Environmental Considerations----------------------------------------------------------------------
3.20.1 Treatment of Solid Waste Products----------------------------------------------------------------
3.20.2 Treatment of Aqueous Effluent--------------------------------------------------------------------
3.21 Waste Management-------------------------------------------------------------------------------------
3.21.1 Ash Handling-------------------------------------------------------------------------------------------
3.21.2 Ash Yard-----------------------------------------------------------------------------------------------
3.21.3 Overall Waste Management--------------------------------------------------------------------------
3.21.3.1 Waste Classification------------------------------------------------------------------------------
3.21.4 Waste Generation and Sources-----------------------------------------------------------------
3.21.4.1 Solid Waste Handling----------------------------------------------------------------------------
3.21.4.2 Liquid Waste Handling-----------------------------------------------------------------------------
3.21.5 Waste Re-use/Re-cycling-------------------------------------------------------------------------
3.22 Waste Manifest and Tracking------------------------------------------------------------------------
3.23 Effluent Treatment Facility---------------------------------------------------------------------------
3.23.1 Anaerobic Digestion System-------------------------------------------------------------------------
3.23.2 Extended Aerobic Process--------------------------------------------------------------------------
3.23.3 Ponding System---------------------------------------------------------------------------------------
3.23.4 Lagoon System--------------------------------------------------------------------------------------
3.24 Palm Oil Mill Effluent (POME) Ponds for the Proposed Project--------------------------------
3.24.1 Palm Oil Mill Effluent Quality and Monitoring---------------------------------------------------
3.24.2 Technical Specifications-----------------------------------------------------------------------------
3.25 Greenhouse Gas (GHG Emission)---------------------------------------------------------------
3.26 GHG Emission Monitoring and Verification-----------------------------------------------------
3.27 Decommissioning and Abandonment------------------------------------------------------------------
3.28 Facilities that will be Decommissioned or Abandoned--------------------------------------------
3.29 Material Balance for the Proposed Project----------------------------------------------------
3.30 Project Schedule----------------------------------------------------------------------------------------
CHAPTER FOUR: DESCRIPTION OF THE EXISTING ENVIRONMENT-----------------
4.1 Location--------------------------------------------------------------------------------------------------
4.2 Methodology--------------------------------------------------------------------------------------------
4.2.1 Data Acquisition from Literature and Previous Studies-------------------------------------------
59
59
59
59
59
59
60
60
60
60
60
61
63
64
64
65
66
66
67
67
67
67
67
68
68
68
72
74
74
75
80
81
82
82
83
84
85
85
85
85

Okomu Oil Palm Company Plc: 60TPH Palm Oil Mill Project at Extension Two February 2020
Environmental Impact Assessment (EIA) – Final Report iv
4.3 Field Data Gathering----------------------------------------------------------------------------------
4.3.1 Sampling Points and Control--------------------------------------------------------------------------
4.3.2 Study Approach----------------------------------------------------------------------------------------
4.4 Air Quality and Noise Level----------------------------------------------------------------------------
4.5 Ambient Environment----------------------------------------------------------------------------------
4.5.1 Climate---------------------------------------------------------------------------------------------------
4.5.2 Groundwater Quality----------------------------------------------------------------------------------
4.5.3 Ambient Air Quality Measurements-----------------------------------------------------------------
4.5.3.1 In-situ Measurements---------------------------------------------------------------------------------
4.5.3.2 Results of Ambient Air Quality Measurements---------------------------------------------------
4.5.4 Noise Level Measurement------------------------------------------------------------------------------
4.5.4.1 Results of Noise Level Measurements----------------------------------------------------------------
4.5.5 Aquatic Biology-----------------------------------------------------------------------------------------
4.5.5.1 Surface Water Quality-------------------------------------------------------------------------------
4.5.5.2 Methodology-----------------------------------------------------------------------------------------
4.5.5.3 Field Work----------------------------------------------------------------------------------------------
4.5.5.4 Laboratory Analysis----------------------------------------------------------------------------------
4.5.5.5 Results and Discussions----------------------------------------------------------------------------
4.5.6 Sediment Studies----------------------------------------------------------------------------------------
4.5.6.1 Methodology-----------------------------------------------------------------------------------------
4.5.6.2 Laboratory Analysis---------------------------------------------------------------------------------
4.5.6.3 Results and Discussions-----------------------------------------------------------------------------
4.5.7 Soil Characteristics---------------------------------------------------------------------------------
4.5.7.1 Soil Profile-----------------------------------------------------------------------------------------
4.5.7.2 Laboratory Analytical Methods-------------------------------------------------------------------
4.5.8 General Soil Properties and Interpretation--------------------------------------------------------
4.5.8.1 Particle Size Distribution----------------------------------------------------------------------------
4.5.8.2 Bulk Density, Porosity and Soil Gravimetric Water Content-----------------------------------
4.5.9 Soil Chemical Characteristics--------------------------------------------------------------------------
4.5.9.1 Micro-Nutrient Status of the Soils---------------------------------------------------------------
4.6 Geology, Geotechnical/Hydrogeology Studies--------------------------------------------------------
4.6.1 Geophysical Investigation------------------------------------------------------------------------------
4.6.2 Objective of Geotechnical Investigation-------------------------------------------------------------
4.6.3 Methodology and Scope of Work--------------------------------------------------------------------
4.6.4 Soil Exploration-----------------------------------------------------------------------------------------
4.6.5 Cone Penetrometer Tests-------------------------------------------------------------------------------
4.6.6 Description of Soil Samples by Visual Inspection------------------------------------------------
4.6.6.1 Specific Gravity Test---------------------------------------------------------------------------------
4.6.6.2 Particle Size Analysis---------------------------------------------------------------------------------
4.6.6.3 Atterberg/ Consistency Tests-----------------------------------------------------------------------
4.6.6.4 Compaction Tests------------------------------------------------------------------------------------
85
85
88
89
90
90
96
99
99
99
101
101
102
102
102
102
103
106
111
111
111
113
116
116
116
117
117
117
121
126
127
127
127
128
129
129
129
132
132
133
133

Okomu Oil Palm Company Plc: 60TPH Palm Oil Mill Project at Extension Two February 2020
Environmental Impact Assessment (EIA) – Final Report v
4.6.6.5 Undrained Triaxial Tests-----------------------------------------------------------------------------
4.6.6.6 California Bearing Ratio Test--------------------------------------------------------------------
4.6.6.7 Presentation of Results----------------------------------------------------------------------------
4.6.6.8 Specific Gravity Test Results-----------------------------------------------------------------------
4.6.6.9 Particle Size Distribution Tests Results-----------------------------------------------------------
4.6.6.10 Atterberg/Consistency Limits Test Results--------------------------------------------------------
4.6.6.11 Compaction Tests Results-----------------------------------------------------------------------------
4.6.6.12 Undrained Triaxial Tests Results--------------------------------------------------------------------
4.6.6.13 Bearing Capacity Computation Using Parameters from Undrained Triaxial---------------
4.6.6.14 Dutch Cone Penetrometer Test Results---------------------------------------------------------
4.6.6.15 California Bearing Ratio Test Result---------------------------------------------------------------
4.6.6.16 General Discussion of Index Properties and Soil Classification---------------------------------
4.6.6.16.1 Specific Gravity--------------------------------------------------------------------------------------
4.6.6.16.2 Particle Size Distribution-----------------------------------------------------------------------
4.6.6.16.3 Consistency Limit Tests-------------------------------------------------------------------------
4.6.6.16.4 Compaction Tests-----------------------------------------------------------------------------------
4.6.6.17 General Discussion of Strength Results-----------------------------------------------------------
4.6.6.18 California Bearing Ratio Results-----------------------------------------------------------------
4.6.6.19 Conclusion and Recommendation-----------------------------------------------------------------
4.6.6.19.1 Conclusion---------------------------------------------------------------------------------------------
4.6.6.20 Recommendation--------------------------------------------------------------------------------------
4.6.6.20.1 Sub-grade Treatment-----------------------------------------------------------------------------
4.6.6.20.2 Sub – Base-------------------------------------------------------------------------------------------
4.7 Ecological Environment--------------------------------------------------------------------------
4.7.1 Current Status--------------------------------------------------------------------------------------
4.7.2 Secondary Data on Biodiversity from Similar Project Site (Proposed Extension
Two Oil Palm Development Project EIA Final Report December 2016)-----------------
4.7.2.1 Flora and Fauna Composition----------------------------------------------------------------------
4.7.2.1.1 Flora----------------------------------------------------------------------------------------------------
4.7.2.1.2 Composition of the Fauna--------------------------------------------------------------------------
4.8 Socioeconomic and Social Impact Assessment---------------------------------------------------
4.8.1 Communities------------------------------------------------------------------------------------------
4.8.1.1 Agbanikaka Community----------------------------------------------------------------------------
4.8.1.2 Owan Community-----------------------------------------------------------------------------------
4.8.1.3 Uhiere Community-----------------------------------------------------------------------------------
4.8.1.4 Odiguetue Community----------------------------------------------------------------------------
4.8.1.5 Odighi Community------------------------------------------------------------------- ---------------
4.8.1.6 Ihrue Community-------------------------------------------------------------------------------------
4.8.1.7 Oke Community--------------------------------------------------------------------------------------
4.8.1.8 Ekpan Community-----------------------------------------------------------------------------------
4.8.1.9 Umuokpe Community--------------------------------------------------------------------------------
133
133
134
134
137
140
143
145
146
148
150
150
150
151
151
151
152
152
153
153
153
153
154
155
155
158
158
158
162
170
170
170
170
170
170
170
171
171
171
171

Okomu Oil Palm Company Plc: 60TPH Palm Oil Mill Project at Extension Two February 2020
Environmental Impact Assessment (EIA) – Final Report vi
4.8.1.10 Orhua Community----------------------------------------------------------------------------------
4.8.2 Study Approach and Methodology----------------------------------------------------------------
4.8.2.1 Data collection---------------------------------------------------------------------------------------
4.8.2.2 Review of relevant document----------------------------------------------------------------------
4.8.2.3 Field Work-------------------------------------------------------------------------------------------
4.8.2.4 Duration of Study-------------------------------------------------------------------------------------
4.8.3 General Baseline Socioeconomic Conditions----------------------------------------------------
4.8.3.1 Household Demographics--------------------------------------------------------------------------
4.8.3.2 Housing------------------------------------------------------------------------------------------------
4.8.3.3 Infrastructure-------------------------------------------------------------------------------------------
4.8.3.4 Agriculture and Household Nutrition--------------------------------------------------------------
4.8.3.5 Education---------------------------------------------------------------------------------------------
4.8.3.6 Health----------------------------------------------------------------------------------------------
4.8.3.7 Livelihood Strategies-------------------------------------------------------------------------------
4.8.3.8 Income and Expenditure---------------------------------------------------------------------------
4.8.3.9 Belief Systems and Sacred Sites---------------------------------------------------------------------
4.9 Social Impact Assessment-------------------------------------------------------------------------
4.9.1 Baseline Social Situation-----------------------------------------------------------------------------
4.9.2 Mitigating Adverse Social Impacts-------------------------------------------------------------------
4.9.3 Summary of SIA-------------------------------------------------------------------------------------
4.10 Consultation with and Participation By Stakeholders-------------------------------------------
4.10.1 Introduction-------------------------------------------------------------------------------------------
4.10.2 Objectives----------------------------------------------------------------------------------------------
4.10.3 Consultations with Stakeholders---------------------------------------------------------------
4.10.3.1 Institutional-------------------------------------------------------------------------------------------
4.10.3.2 Communities------------------------------------------------------------------------------------------
4.10.4 Levels of Community Representatives and Organizations Consulted------------------------
4.10.4.1 Affected Communities------------------------------------------------------------------------------
CHAPTER FIVE: ASSOCIATED AND POTENTIAL ENVIRONMENTAL IMPACT---
5.1 Introduction-------------------------------------------------------------------------------------------------
5.1.1 Social and Environmental Impacts--------------------------------------------------------------------
5.2. Methodology of impact assessment--------------------------------------------------------------------
5.2.1 Overall methodology------------------------------------------------------------------------------------
5.2.2 Preliminary Identification and Screening-------------------------------------------------------------
5.3 Checklist of Environmental Indicators--------------------------------------------------------------
5.4 Project and Associated Activities of the Proposed Project at Extension Two-------------------
5.5 Screening Project – Environmental Interactions Criteria-------------------------------------------
5.6 Leopold Matrix Screening-------------------------------------------------------------------------------
5.7 Detailed Assessment of Impact------------------------------------------------------------------------
5.8 Impact Severity and Significance Evaluation--------------------------------------------------------
171
172
172
172
172
173
173
173
174
175
178
178
179
180
180
180
181
181
183
184
187
187
188
188
188
188
189
189
191
191
192
193
193
194
195
196
196
199
200
201

Okomu Oil Palm Company Plc: 60TPH Palm Oil Mill Project at Extension Two February 2020
Environmental Impact Assessment (EIA) – Final Report vii
5.9 Impact Severity Evaluation Criteria-------------------------------------------------------------------
5.10 Magnitude-------------------------------------------------------------------------------------------------
5.11 Duration------------------------------------------------------------------------------------------------
5.12 Frequency-------------------------------------------------------------------------------------------------
5.13 Extent------------------------------------------------------------------------------------------------------
5.14 Sensitivity--------------------------------------------------------------------------------------------------
5.15 Impact Significance--------------------------------------------------------------------------------------
5.16 Description of Impacts------------------------------------------------------------------------------------
5.16.1 Significant Impacts------------------------------------------------------------------------------------
5.16.2 Significant Negative Impacts---------------------------------------------------------------------------
5.16.2.1 Evaluation of Potential Impacts of Project Activities------------------------------------------
5.16.2.1.1 Adverse Impact of Loss of vegetation-------------------------------------------------------------
5.16.2.1.2 Palm Oil Mill Effluent (POME) disposal-------------------------------------------------------
5.16.2.1.3 Harvesting and Transportation of Fresh Fruit Bunches----------------------------------------
5.16.2.1.4 Decommissioning and Abandonment-----------------------------------------------------------
5.16.3 Significant Impact Producing Activities----------------------------------------------------------
5.16.4 Cumulative Impacts---------------------------------------------------------------------------------
5.16.4.1 Project Specific Cumulative Effects’ Assessment-----------------------------------------------
5.16.4.1.1 Land Based Traffic----------------------------------------------------------------------------------
5.16.4.1.2 Public Services--------------------------------------------------------------------------------------
5.16.4.1.3 Employment Opportunities-------------------------------------------------------------------------
5.16.4.1.4 Abandonment/Laying off staff---------------------------------------------------------------------
5.17 Health Impact Assessment (HIA) of the Proposed Project-------------------------------------
5.17.1 Identifying Intermediate Factors that Impact on Health--------------------------------------
5.18 Conclusion------------------------------------------------------------------------------------------
CHAPTER SIX: MITIGATION MEASURES----------------------------------------------------------
6.1 Introduction--------------------------------------------------------------------------------------------
6.2 Residual Effects Assessment Summary----------------------------------------------------------------
6.2.1 Residual Impacts-----------------------------------------------------------------------------------------
6.3 Conclusion----------------------------------------------------------------------------------------------
6.4 Cost Implications Associated with Mitigation Measures----------------------------------------
6.4.1 Construction---------------------------------------------------------------------------------------------
6.4.2 Operation (FFB Processing)----------------------------------------------------------------------------
CHAPTER SEVEN: ENVIRONMENTAL AND SOCIAL MANAGEMENT PLANS-------
7.1 Environmental Management Plan---------------------------------------------------------------------
7.1.1 EMP for Air Environment--------------------------------------------------------------------------------
7.1.2 EMP for Noise Environment-----------------------------------------------------------------------------
7.1.3 EMP for Water Environment-----------------------------------------------------------------------------
7.1.4 EMP for Land Environment-----------------------------------------------------------------------------
201
202
202
203
203
203
204
206
206
207
207
207
207
208
208
208
209
209
209
209
210
210
210
210
215
216
216
223
223
230
230
230
230
232
232
239
240
241
243

Okomu Oil Palm Company Plc: 60TPH Palm Oil Mill Project at Extension Two February 2020
Environmental Impact Assessment (EIA) – Final Report viii
7.1.5 EMP for Ecological Environment----------------------------------------------------------------------
7.1.6 EMP for Socio-Economic Environment---------------------------------------------------------------
7.1.7 EMP for Energy Conservation to Reduce Greenhouse Gas Emission-----------------------------
7.1.8 EMP at Decommissioning Phase----------------------------------------------------------------------
7.2 Environmental Management System and Monitoring Plan----------------------------------------
7.3 Health, Safety and Environment (HSE Department/HSE Committee)-----------------------------
7.4 Hierarchical Structure of Environmental Management Committee-------------------------------
7.5 Environmental Monitoring-----------------------------------------------------------------------------
7.6 Awareness and Training------------------------------------------------------------------------------------
7.6.1 Company Staff and Contractors----------------------------------------------------------------------
7.6.2 Environmental Audits and Corrective Action Plans--------------------------------------------------
7.7 Emergency Response Plan-------------------------------------------------------------------------------
7.8 Decommissioning----------------------------------------------------------------------------------------
7.8.1 Decommissioning of a Palm Oil Mill-----------------------------------------------------------------
7.8.1.1 Asset Recovery-------------------------------------------------------------------------------------------
7.8.1.2 Dismantling-----------------------------------------------------------------------------------------------
7.8.1.3 Demolition----------------------------------------------------------------------------------------------
7.8.1.4 Decontamination----------------------------------------------------------------------------------------
7.8.1.5 Remediation----------------------------------------------------------------------------------------------
7.9 Decommissioning Procedure------------------------------------------------------------------------
CHAPTER EIGHT: CONCLUSION-----------------------------------------------------------------------
References---------------------------------------------------------------------------------------------------------
246
246
247
249
254
254
254
256
257
257
257
257
258
258
258
259
259
259
259
259
260
261

Okomu Oil Palm Company Plc: 60TPH Palm Oil Mill Project at Extension Two February 2020
Environmental Impact Assessment (EIA) – Final Report ix
LIST OF TABLES
Table 1.1: International Environmental Conventions Signed by Nigeria--------------------------------
Table 3.1: Processing Line Mechanical Components--------------------------------------------------------
Table 3.2: Steam Boiler Technical Information-------------------------------------------------------------
Table 3.3: Major Equipment and Structures of the project--------------------------------------------------
Table 3.4: Mill Features and Facilities------------------------------------------------------------------------
Table 3.5: Summary of Okomu Oil Palm Company Plc Waste Management Plan--------------------
Table 3.6: Waste Profile of the proposed mill---------------------------------------------------------------
Table 3.7: Characteristics of wastewater leaving the lagoon with both National and
International Required Norms------------------------------------------------------------------
Table 3.8: Decomposition Time of POME in Various Ponds-------------------------------------------
Table 3.9: Capacity of Individual Ponds----------------------------------------------------------------------
Table 3.10: Dimensions of Various Treatment Ponds------------------------------------------------------
Table 3.11: Effluent Quality from POM and Expected Quality after Treatment-----------------------
Table 3.12: Estimation of Baseline Emission (for 30 and 60tons/hour capacity mill)-----------------
Table 3.13: Baseline GHG Emission from the Effluent Ponds of the Proposed Project----------------
Table 3.14: Data to be collected in order to monitor emission from the project activity-----------------
Table 3.15: Schedule and Timing of Critical Project Activities--------------------------------------
Table 4.1: Sampling Points and Control Locations---------------------------------------------------------
Table 4.2: Monthly Rainfall in mm (2010 – 2018)----------------------------------------------------------
Table 4.3: Monthly Temperatures in 0C (2010 – 2018)------------------------------------------------------
Table 4.4: Monthly Sunshine (Hr) (2010 - 2018)-------------------------------------------------------------
Table 4.5: Monthly Relative Humidity in % (2010 – 2018)------------------------------------------------
Table 4.6: Results of Physico-Chemical Laboratory Analysis of Groundwater Samples at
OOPC Plc--------------------------------------------------------------------------------------------
Table 4.7: Results of Physico-Chemical Laboratory Analysis of Groundwater Samples
(Secondary Data)----------------------------------------------------------------------------------
Table 4.8a: Results of Air Quality at the Proposed Project Site-----------------------------------------
Table 4.8b: Results of Air Quality and Noise Measurements– Secondary Data-------------------------
Table 4.9: Noise Levels Measurements around the Project Area-------------------------------------------
Table 4.10: Physico-chemical Analysis Result of Jemide and Stream 1 Upstream and
Downstream Water Samples at the Proposed Project Area----------------------------------
Table 4.11: Checklist of Phtoplankton Species Recorded from the Water Bodies around the
Project Area-----------------------------------------------------------------------------------------
Table 4.12: List of benthic fauna Recorded from the Water Bodies around the Project Area-----------
Table 4.13: Bottom Sediment Analysis Result---------------------------------------------------------------
Table 4.14: Soil Particle Size Analysis of Representative Soil Profiles----------------------------------
Table 4.15: Some Soil Physical Properties of the Representative Soil Profiles-------------------------
Table 4.16: Soil Chemical Properties of the Representative Soil Profiles------------------------------
Table 4.17: Detailed Soil Description by Visual Inspection-------------------------------------------------
Table 4.18: Specific Gravity Test Results---------------------------------------------------------------------
13
50
55
56
56
65
66
75
75
76
78
79
80
81
81
84
86
91
93
94
95
97
98
99
100
101
105
114
115
115
118
120
123
130
134

Okomu Oil Palm Company Plc: 60TPH Palm Oil Mill Project at Extension Two February 2020
Environmental Impact Assessment (EIA) – Final Report x
Table 4.19: Sieve Analysis Test Results-----------------------------------------------------------------------
Table 4.20: Atterberg Limit Test Results-----------------------------------------------------------------------
Table 4.21: Compaction Test Results--------------------------------------------------------------------------
Table 4.22: Shear Strength Test Results------------------------------------------------------------------------
Table 4.23: Computed Allowable Bearing Capacities at Various Depths--------------------------------
Table 4.24: Cone Resistance Obtained at Specific Depths for Points 1, 2 and 3-----------------------
Table 4.25a: Bearing Capacity Computation from CPT from Test Point 1-----------------------------
Table 4.25b: Bearing Capacity Computation from CPT from Test Point 2-------------------------------
Table 4.25c: Bearing Capacity Computation from CPT from Test Point 3--------------------------------
Table 4.26: CBR Tests Results---------------------------------------------------------------------------------
Table 4.27: Sub-Grade Strength Class and Recommended Minimum Thickness for Capping
and Granular Sub-Base----------------------------------------------------------------------------
Table 4.28: List of Encountered Fauna Species in the Study Area-----------------------------------------
Table 4.29: Population Estimates, Proportions and Diversity Indices of Animal Species--------------
Table 4.30: List of Encountered Flora Species in the Study Area-----------------------------------------
Table 4.31: Number of Species, Genera and Families of Mammals (Excluding bats)---------------
Table 4.32: A Checklist of Avifauna of the Proposed Project Area---------------------------------------
Table 4.33: Checklist of Reptiles and Amphibians Reported from the Proposed Project Area--------
Table 4.34: Schedule of Socioeconomic and SIA exercise--------------------------------------------------
Table 4.35: Demographic Data---------------------------------------------------------------------------------
Table 4.36: Housing Patterns of affected Communities-----------------------------------------------------
Table 4.37: Types of Mitigation Measure---------------------------------------------------------------------
Table 4.38: The Proposed Management and Mitigation Measures for the Communities in
2016 and Current Situation in 2019------------------------------------------------------------
Table 4.39: List of Communities in Extension 2 with Projects and the Year of Execution-------------
Table 5.1: Impact Type-------------------------------------------------------------------------------------------
Table 5.2: Criteria for Rating Magnitude, Duration and Severity of Environmental Impacts----------
Table 5.3: Scores Awarded to Magnitude, Duration and each Severity Category------------------------
Table 5.4: Matrix for Identification of Significant Activity Impacts of the Proposed Project
on the Environment at Extension Two Estate--------------------------------------------------
Table 5.5: Summary of Health Impacts of the Proposed Project-------------------------------------------
Table 5.6: Checklist for Health Impact Assessment of the Proposed Project-----------------------------
Table 6.1: Summary of Impact, Mitigation Measures and Residual Impacts------------------------------
Table 6.2: Residual Impacts Associated with the Proposed Project---------------------------------------
Table 6.3: Cost Implications Associated with Mitigation Measures---------------------------------------
Table 7.1: Summary of Potential Impacts and Remedial Measures---------------------------------------
Table 7.2: Social Impact Management Plan (SIMP)---------------------------------------------------------
Table 7.3: Suggested Monitoring Program for the Proposed Project-------------------------------------
137
141
143
145
147
148
149
149
149
150
154
155
156
157
163
165
169
173
174
174
183
184
185
196
197
199
205
211
215
217
224
231
233
251
256

Okomu Oil Palm Company Plc: 60TPH Palm Oil Mill Project at Extension Two February 2020
Environmental Impact Assessment (EIA) – Final Report xi
LIST OF MAPS
Map 4.1: OOPC Plantation Map showing the Sampling Points at the Proposed Project Site
at Extension Two-------------------------------------------------------------------------------------
LIST OF FIGURES
Figure 1.1: Map of Nigeria indicating Edo State-----------------------------------------------------------
Figure 1.2: Map of Edo State indicating the Proposed Mill in Ovia Northeast LGA--------------
Figure 1.3: Fresh Fruit Bunch (FFB)--------------------------------------------------------------------------
Figure 1.4: Structure of the palm fruit---------------------------------------------------------------------------
Figure 1.5: FMEnv EIA Procedure-----------------------------------------------------------------------------
Figure 3.1a: General Palm Oil Flow Diagram----------------------------------------------------------------
Figure 3.1b: Flowchart for the Proposed Extraction of Crude Palm Oil----------------------------------
Figure 3.2: Foundation Layout for Palm Oil Mill-----------------------------------------------------------
Figure 3.3: Machinery Arrangement for Sterilizer Station------------------------------------------------
Figure 3.4 Machinery Arrangement for Threshing Station-----------------------------------------------
Figure 3.5: Machinery Arrangement for Pressing---------------------------------------------------------
Figure 3.6: Machinery Arrangement for Depricarping Station-------------------------------------
Figure 3.7: Machinery Arrangement for Kernel Plant--------------------------------------------------
Figure 3.8: Machinery Arrangement for Boiler Station--------------------------------------------------
Figure 3.9: Schematic Flow Diagram for Ponding System--------------------------------------------------
Figure 3.10: DSSB Schematic Flow Diagram for Ponding System---------------------------------
Figure 3.11: Drawings of the Proposed Palm Oil Mill Effluent Treatment Ponds-----------------
Figure 3.12: Drawings of the Trenches at POME Treatment Ponds--------------------------------
Figure 4.1: Average Annual Rainfall of Study Area and Environs--------------------------------
Figure 4.2: Average Annual Temperature of Study Area and Environs-----------------------------
Figure 4.3: Average Annual Temperature of Study Area and Environs----------------------------
Figure 4.4: Average Annual Humidity of Study Area and Environs-------------------------------
Figure 4.5: Stakeholders’ interrelationship in the activities for an EIA study--------------------
Figure 7.1: HSE Department/Committee Structure--------------------------------------------------
87
3
4
6
6
18
32
41
43
44
45
46
47
48
49
70
71
77
79
92
93
94
96
187
255

Okomu Oil Palm Company Plc: 60TPH Palm Oil Mill Project at Extension Two February 2020
Environmental Impact Assessment (EIA) – Final Report xii
LIST OF ANNEXURE/APPENDICES
Annexure I- Approved Terms of Reference
Appendix I- Laboratory Results of all Environmental Parameters
Appendix II- Geotechnical Information for Okomu Extension Palm Oil Mill
Appendix III- Extension Two FPIC Process Report
Appendix IV – OOPC Stakeholders’ Engagement Procedure
LIST OF PLATES
Plate 4.1a - 4.1h: Different Types of Vegetation Recorded at Extension Two----------------------
Plate 4.2: Emergent vegetation--------------------------------------------------------------------------
Plate 4.3: Canopy trees-------------------------------------------------------------------------------------
Plate 4.4: Understory Trees with Epiphytes----------------------------------------------------------
Plate 4.5a – 4.5d: Bird Species Recorded at Project Site----------------------------------------------
Plate 4.6: Different Bird Nests in the Project Area-----------------------------------------------------
Plate 4.7a – 4.7c: Arthropods from the proposed project area----------------------------------------
Plate 4.8: Umuokpe Malfunction Water Scheme-----------------------------------------------------
Plate 4.9: New Water Scheme Project at Umuokpe Community by OOPC-----------------------
Plate 4.10: Odiguetue Abandoned Water Scheme----------------------------------------------------
Plate 4.11: First Borehole Project at Odiguetue by OOPC------------------------------------------
Plate 4.12: Town Hall Project at Odiguetue Community by OOPC---------------------------------
Plate 4.13: New Market Stalls at Odiguetue Community by OOPC---------------------------------
Plate 4.14: New Borehole at Irhue Community by OOPC-------------------------------------------
Plate 4.15: New Market Stalls at Irhue Community by OOPC-------------------------------------
Plate 4.16: New Town Hall at Irhue Community by OOPC------------------------------------------
Plate 4.17: Odiguetue Health Centre with Old beds---------------------------------------------------
Plate 4.18: Umokpe Nursing Home---------------------------------------------------------------------
Plate 4.19: Her Excellency Lara Oshiomole Commissioning Odighi Clinic----------------------
Plate 4.20: Odighi Clinic Built by Ovia North East L.G.A and equipped by OOPC--------------
Plate 4.21: Some of the Hospital Beds donated by OOPC-----------------------------------------
Plate 4.22 Generator Set at Odighi Clinic donated by OOPC-------------------------------------
Plate 4.23: Photos of Community Meetings------------------------------------------------------------
159
160
161
162
166
167
168
175
175
175
175
176
176
177
177
177
179
179
179
179
180
180
190

Okomu Oil Palm Company Plc: 60TPH Palm Oil Mill Project at Extension Two February 2020
Environmental Impact Assessment (EIA) – Final Report xiii
LIST OF ABBREVIATIONS AND ACRONYMS
AGO -Automotive Gas Oil
ALARP -As Low as Reasonably Practicable
ANC -Antenatal Care
APHA -American Public Health Association
BOD -Biochemical Oxygen Demand
BS -Base Saturation
BSR -Basal Stem Rot
CBD -Convention on Biological Diversity
CBR -Crude Birth Rate
CEC -Cation Exchange Capacity
CDR -Crude Death Rate
CH4 - Methane
CITES -Convention on International Trade in Endangered Species of Wild Fauna and Flora
Cm -Centimeter
CO -Carbon Monoxide
CO2 -Carbon dioxide
COD -Chemical Oxygen Demand
CSR -Corporate Social Responsibility
CPO -Crude Palm Oil
CPKO -Crude Palm Kernel Oil
dB(A) -Decibel
DO -Dissolved Oxygen
DOE -Department of Environment
EC -Electrical Conductivity
ECEC -Effective Cation Exchange Capacity
EEA -Environmental Evaluation Assessment
EFB -Empty Fruit Bunch
EHS -Environmental Health and Safety
EIA -Environmental Impact Assessment
EMP -Environmental Management Plan
EMS -Environmental Management System
ERM -Electrical Resistivity Method
ERP -Emergency Response Plan
ESAs -Environmentally Sensitive Areas
ESMP -Environmental and Social Management Plans
ETPs - Effluent Treatment Plants
FDS -Foremost Development Services Limited
FEPA -The Federal Environmental Protection Agency
FFA -Free Fatty Acids

Okomu Oil Palm Company Plc: 60TPH Palm Oil Mill Project at Extension Two February 2020
Environmental Impact Assessment (EIA) – Final Report xiv
FFB -Fresh Fruit Bunch
FMARD -Federal Ministry of Agriculture and Rural Development
FMEnv -Federal Ministry of Environment
FSC -Forest Stewardship Council
GC-FID -Gas Chromatography with flame ionization Detector
GHG -Green House Gas
GPS -Geographic Positioning System
Ha -Hectare
HCVF -High Conservation Value Forest
HIA -Health Impact Assessment
HIV/AIDS -Acquired Immune Deficiency Syndrome
Hr - Hour
HRT -Hydraulic Retention Time
HSE -Health Safety and Environment
IEE -Initial Environmental Examination
IFC -International Finance Corporation
IUCN -International Union for Conservation of Nature
KII -Key Informant Interviews
LC -Least Concern
LGA -Local Government Area
MgO -Magnesium Oxide
MOP -Muriate of Potash
MOU -Memoranda of Understanding
NCF -Nigerian Conservation Foundation
NES -Nigerian Environmental Society
NESREA -National Environmental Standards and Regulations Enforcement Agency
NGO -Non-Governmental Organization
NIFOR -Nigerian Institute for Oil Palm Research
NIMET -Nigeria Meteorological Agency
NOS -Non Oily Solids
NPK -Nitrogen Phosphorus Potassium fertilizer
NSE -Nigeria Stock Exchange
OKM -Okomu
OOPC - Okomu Oil Palm Company
PAT -Profit After Tax
P&C -Principles & Criteria
PK -Palm Kernel
PKC -Palm Kernel Cake
PKO -Palm Kernel Oil
POM -Palm Oil Mill
POME -Palm Oil Mill Effluent

Okomu Oil Palm Company Plc: 60TPH Palm Oil Mill Project at Extension Two February 2020
Environmental Impact Assessment (EIA) – Final Report xv
POPs -Persistent Organic Pollutants
PPE -Personal Protective Equipment
PS -Performance Standards
RAMSAR -Convention on the Protection of Wetlands of International Importance
RBDPO -Refined, Bleached and Deodorized Palm Oil
RSPO -Roundtable on Sustainable Palm Oil
SFB -Sterilized Fruit Bunches
SHOC -Safe Handling of Chemicals
SIA -Social Impact Assessment
SMP -Social Management Plan
SPC -Standard Plate Count
SPO -Special Palm Oil
SPM -Suspended Particulate Matter
SSP -Single Super Phosphate
STD -Sexually transmitted diseases
TCPC -Technical committee on Privatization and Commercialization
TDS -Total Dissolved Solid
THC -Total Hydrocarbon Content
TN -Total Nitrogen
TOC -Total Organic Carbon
TOR -Terms of Reference
UNCCD -United Nation Convention on Combating Desertification
UNDP -United Nation Development Programme
UNFCCC -UN Framework Convention on Climate Change
US -United State
VES -Vertical Electrical Sounding
VOC -Volatile Organic Compound
WHO -World Health Organization
Yr -Year
WEIGHTS AND MEASURES
kVA (kilovolt-ampere) – 1,000 volt-amperes
kW (kilowatt) – 1,000 watts
kWh (kilowatt-hour) – 1,000 watts-hour
MW (megawatt) – 1,000,000 watts
MT - Metric Tonne
W (watt) – unit of active power
T (Ton) – 1,000 kilogram

Okomu Oil Palm Company Plc: 60TPH Palm Oil Mill Project at Extension Two February 2020
Environmental Impact Assessment (EIA) – Final Report xvi
EIA STUDY TEAM AND REPORT PREPARERS
The EIA study and report were carried out and prepared by Foremost Development Services
Limited’ multi-disciplinary team of consultants including:
Names of Consultant Qualification Role Played
Mr. F.A. Afolabi M.Sc. Development Planning Overall job execution and delivery
Professor Kokunre Eghafona PhD. Socio-Cultural
Anthropology Rural sociology
Team Leader, Social Impact
Assessment (SIA).
Professor Chris Oke Ph.D Forestry Management Biodiversity studies, Flora and
Fauna.
Mr. A. A. Olanigan
M.Phil. Environmental
Management & Protection
Environmental Monitoring;
Determination of Sampling Control
Point, Air Quality, Water Quality,
Noise Measurement, Field work
coordinator.
Professor Salako Ph.D Soil Science
Team Leader, Soil Survey.
Nigeria Institute for Oil Palm
Research
Research Institute
Soil Survey
Mr. Abiodun Makinde B.Sc Soil Science Team Community Engagement and Field
Assistant, member; Soil Survey,
Professor Ehiorobo J.O. Ph.D Geology and Geophysics Environmental Geology,
Geotechnical and Soil Analysis
Mr. Hakeem Olajobi M.Sc. Remote Sensing and
Geographic Information System
(GIS)
GIS Expert
Dr. Femi Oyediran
Environmental Services
Limited (No. 28, Apaola street
off Aladelola Ikosi Ketu Lagos
State)
Ph.D Environmental
Management
Federal Ministry of
Environment Accredited
Laboratory
Public Analyst
Technical and Laboratory Services

Okomu Oil Palm Company Plc: 60TPH Palm Oil Mill Project at Extension Two February 2020
Environmental Impact Assessment (EIA) – Final Report xvii
ACKNOWLEDGEMENTS
The Management of the Okomu Oil Palm Company Plc is grateful to:
1. Our experienced consultant, Foremost Development Services Limited for the
execution, compiling and writing this report. We also thank the following
Okomu Oil Palm Company Plc staff who worked dedicatedly with the
consultant on this study:
Dr. Graham Hefer; Managing Director
Mr. Billy Ghansah Agric Coordinator
Mr. Allain Mary; Financial Director
Mr. Leonit Shaji; Industrial Coordinator
Mr. Prabhat Pareekh Extension Two Plantation Manager
Mr. Mikle George; HSE Manager
Ms Paulyn Ojukwu; Managing Director’s Secretary
2. Federal Ministry of Environment:
a. Abuja Staff
b. Zonal Office, Benin City, Edo State:
3. Edo State Ministry of Environment and Sustainability
4. Ovia Northeast Local Government Area, Edo State
5. The Affected Communities.

Okomu Oil Palm Company Plc: 60TPH Palm Oil Mill Project at Extension Two February 2020
Environmental Impact Assessment (EIA) – Final Report xviii
EXECUTIVE SUMMARY (ES)
ES 1.0 The Proponent
The Okomu Oil Palm Company Plc (OOPC Plc) is an agricultural and food-processing
company located at Okomu-Udo, Ovia Southwest Local Government Area, Edo State,
Nigeria. The company specializes in plantation development and production of special
palm oil, palm kernel oil and palm kernel cake and crump rubber. It started operation in
1976 as a Federal Government project and was privatized in 1990. The then Bendel State
government granted the company a total concession of about 15,000 hectares within the
Okomu forest reserve in 1978. The entire 15,000 hectares of the total concession at the
main estate has been developed into oil palm and rubber plantations.
The company operates the Main Estate (a concession of 15,000 hectares) Extension One
Estate (a concession of 6,000 hectares), and Extension Two Estate (a concession of
11,416.673 hectares) all located in Edo State. It supplies special palm oil, palm kernel oil,
palm kernel cake and crump rubber.
The Company has over 12,000 individual and institutional shareholders, both Nigerian
(40%) and foreign (60%). Currently, the company employs over 2000 permanent staff
and several independent sub-contractors. All these have added up to place the Company
on top in the burgeoning oil palm business and to position it as an emerging leader in
rubber production.
ES 2.0 Project Justification
The company has just expanded it plantation holdings with additional oil palm plantation
at another site in Ovia Northeast and Uhunmwonde LGA, called Extension Two. It is
envisaged that the capacity of the palm oil mill at the main estate will not be able to
absorb additional fresh fruit bunches coming from Extension Two as more of the new
plantings at both extension Two and the main estate (including Extension One) become
mature.
The bulk of the new plantings have attained the harvesting age and the acquired
plantation has increasingly been producing FFB in the last five years. Given the existing
mill capacity at the Main estate, company is faced with the following challenges as the
bulk of the holdings attain full maturity:
• There is no neighbouring palm oil mill to absorb the excess FFB produced on
the plantations.
• The risk of large quantities of FFB not being harvested and rotting on the trees.
• The cost of transporting FFB to the main estate for processing is very high

Okomu Oil Palm Company Plc: 60TPH Palm Oil Mill Project at Extension Two February 2020
Environmental Impact Assessment (EIA) – Final Report xix
• Loss of value-added advantage.
• High prospects of loss of revenue.
In order to overcome these challenges, the Company proposes to establish a 60Tons
FFB/hour palm oil mill at Extension Two to process the excess FFB being harvested from
its plantations.
The operation of the palm oil mill would enhance the revenue base of the company and be
of immense economic, social benefit to both proponent and Nigeria as a whole. Invariably,
the proposed project will generate employment to the people directly or indirectly and
assist to further meet its financial obligations and social responsibilities to host
communities.
Nigeria is the fourth largest producer of palm oil in the world accounting for 3% of global
production. The Nigerian Institute for Oil Palm Research (NIFOR) estimates that
upstream palm oil production is 0.98 million tons.
Considering Nigeria’s population of about 194m [as per FAOSTAT] and per capita
consumption of 12.5 kg per person per annum against the world average of about 20 kg
per person per annum, estimated annual consumption is 2.4 million tons. Hence, Nigeria
has deficit of 0.9 million tons worth of more than USD 800 million. The mechanisms to
fulfill this gap are:
• Import of refined palm oil / vegetable oil is prohibited and there is a duty of
35% on the import of Crude Palm Oil / Crude Vegetable Oil.
• Creating an enabling environment for the establishment of Palm Oil Mills
and Vegetable oil refineries across the country.
By adopting this policy, country is able to generate employment in manufacturing/refining
industry and also supports oil palm plantation by protecting them with an additional
margin of more than $300 per ton on and above sales price realized by Malaysia and
Indonesia’s palm oil plantation."
The ongoing investments by the company, including the proposed 60tons FFB/Hour Palm
Oil Mill Project could be seen as the company’s contribution and support aimed at
meeting the goals of the Economic Recovery and Growth Plan (ERGP) of the Federal
Republic of Nigeria.

Okomu Oil Palm Company Plc: 60TPH Palm Oil Mill Project at Extension Two February 2020
Environmental Impact Assessment (EIA) – Final Report xx
ES 3.0 Project Description
The proposed palm oil mill at Extension Two will lie on about 10.4 hectares (400m x
260m) in Ovia Northeast Local Government Area. The proposed mill project has the
capacity to process 60 tons Fresh Fruit Bunch (FFB) per hour. It lies between latitude
5007.120’ and 5025.220’E and longitude 6018.870’ and 6026.110’N.
The proposed project will involve six major civil and mechanical components namely:
Reception Station; Sterilization Station (horizontal); Oil Mill Processing Line with all its
components (for the extraction of palm oil from fresh fruit bunches through sterilization,
bunch stripping, digestion, oil extraction and finally clarification and purifications), Boiler
Station, Power generating units and Palm Oil Mill Effluent (POME) Treatment Ponds.
ES 4.0 EIA Study Procedure
The EIA study was carried out after due consultation with the Federal Ministry of
Environment (FMEnv), and in accordance with the Ministry’s Procedural Guidelines, and
Terms of Reference (TOR) and scope of work, approved by the Ministry Edo State
Ministry of Environment and Sustainability and Ovia Northeast Local Government were
also carried along.
ES 5.0 Verification by the FMEnv
The FMEnv visited the proposed project site in March 2018 in order to verify the
proposals and statements in the OOPC Plc’s application for an environmental impact
assessment (EIA) permit. The proposed project was classified as Category Two (2);
requiring mandatory EIA Studies and a Technical Review Meeting.
ES 6.0 Period of EIA Study
The field data gathering for scientific studies of the existing environment started on 25
February to 5 March 2019 which was supplemented with data from Extension Two Oil
Palm Development Project; Final EIA Report 2016.
ES 7.0 Consultations with and Participation by Stakeholders
The Stakeholders identified were: (i) Federal Ministry of Environment (FMEnv), (ii) Edo
State Ministry of Environment and Sustainability; (iii) Ovia Northeast Local Government
Council; (iv) Project’s Affected Communities, namely; Agbanikaka, Owan, Uhiere,
Odiguetue, Odighi, Ihrue, Oke, Ekpan, Umuokpe and Orhua Communities.
The objective of the consultation was to inform and educate stakeholders on details of the
project, its justification, discuss the scope of study and the project’s potential and
associated environmental impacts, and obtain their views and comments. The summary of
the community’s assessment of the likely environmental impacts of the proposed project

Okomu Oil Palm Company Plc: 60TPH Palm Oil Mill Project at Extension Two February 2020
Environmental Impact Assessment (EIA) – Final Report xxi
was that the proposed project would largely have insignificant adverse impacts but rather
beneficial effects on the lives of the people.
ES 8.0 Alternative Considered and Envisaged Sustainability
In order to achieve the desirable sustainability of the proposed project, OOPC Plc will
develop and operate the project based on industry best practices, applying especially the
IFC Performance Standards and the Principles and Criteria of the Roundtable on
Sustainable Palm Oil (RSPO) as follows.
Economic Sustainability: The planning and management of operations and
production activities will aim at long-term financial and economic viability of the
project. This will be achieved through sound industrial best practices with utmost
safety measures to attain high productivity and premium quality of products.
Technical Sustainability: Technically, best hands and agricultural practices shall be
employed to carry out the project to ensure its technical sustainability by relying on
its foreign and local expertise and experience in the palm oil mill construction and
operation in Edo State, other parts of Africa and Asia to ensure that the proposed
project enjoys sound technical complements from design to implementation and
operation.
Environmental Sustainability: This will be attained through the implementation of
OOPC Plc Environmental Management System (EMS) that is already in place.
Social Sustainability: The Social action plan developed from the assessment of the
social impact of the proposed project will be implemented to ensure that the desirable
support and harmony is established between the project proponent and the
communities.
Financial Sustainability: The project will be financed from the company’s yearly
turnover and profits which has been impressive and promising in the last five years.
OOPC Plc is listed on the Nigerian Stock Exchange. The estimated cost of the
project is about USD34million (1.2 Trillion Naira) while the life span of the project
(oil mill) is about 30 years or more during which upgrades can be done.
Options and alternatives to the proposed project includes the no project option, delayed
project option, and full development of the project as proposed.
▪ Alternative Site
The option of alternative location means establishing a new palm oil mill at a
different location. This option is undesirable because the prospect of acquiring
new land is low. Moreover, establishing a new palm oil mill at a different location

Okomu Oil Palm Company Plc: 60TPH Palm Oil Mill Project at Extension Two February 2020
Environmental Impact Assessment (EIA) – Final Report xxii
could mean that it would require travelling longer distances to transport FFB from
its estates to this new location and this can be expensive. The advantage of
synergy with the existing plantations will be lost
▪ Alternative Project
This would mean the company embarking on other projects other than the palm oil
mill establishment, given that the mill establishment is another developmental
phase following the establishment of over 11,000ha oil palm plantation. This
alternative would amount to a lack of vision and poor business strategy on the part
of the company.
▪ Alternative Technology
This means adopting a new, non-tested or trusted technology which could lead to
the company incurring more cost in terms of procurement or technology failure
especially considering the life span of the project.
▪ No Project Option
This option would mean that the company should continue to operate without the
option of increasing its CPO production capacity. This option is unacceptable
when one considers the substantial net financial, economic and social benefits that
will accrue to the company, the neighbouring communities and the national
economy by operating the mill.
▪ Delayed Project Option
This option would mean that the bulk of mature FFB coming from other plantation
estates will not be processed, or sourcing for a high capacity oil mill in the
neighborhood to process the FFB. This will lead to loss in company revenue, less
employment generation and less quality assurance and control on products.
▪ Do Project Option
The establishment of the 60TPH Palm Oil Mill within the Extension Two estate as
proposed is the preferred option which will translate to financial, economic and
social benefits to the company, neighbouring communities and country.
ES 9.0 Relevant Environmental Laws, Decrees, Regulations and Edicts
The following laws and regulations apply to the proposed project: (i) National Policy on
Environment (FEPA, 1989), revised in 1999; (ii) EIA Act Cap E12 LFN, 2004; (iii)
National Guidelines and Standards for Environmental Pollution Control in Nigeria,
(FEPA,1991); (iv) National Effluent Limitations Regulations S.I.8 (FEPA,1991); (v)
National Pollution Abatement in Industries and Facilities Generating Wastes Regulations
S.I.9 (FEPA,1991); (vi) S. I. 15 National Environmental Protection (Management of Solid

Okomu Oil Palm Company Plc: 60TPH Palm Oil Mill Project at Extension Two February 2020
Environmental Impact Assessment (EIA) – Final Report xxiii
and Hazardous Wastes) Regulations 1991. (vii) National Environmental Standards and
Regulations Enforcement Agency (NESREA), 2007. (viii) Edo State Ministry of
Environment and Sustainability Environmental Pollution and Sanitation Act 2010; (ix)
Edo State Environmental Waste Management Board Edicts/Mandate; (x) Ovia Northeast
Local Government Area Mandate on environmental sanitation and solid waste
management; (xi) Factories Act CAP F1 LFN 2004; (xii) Land Use Act Cap L5 LFN,
2004; (xiii) The Urban and Regional Planning Law Act No. 88 of 1992; (ix) Workmen
Compensation Act, 1987 and Abandonment Guidelines 1995.
ES 10.0 Existing Baseline Environment
The biophysical socio-economic and health environments that might be impacted by the
proposed project were ascertained from field data gathering within 10km spatial boundary
of the study area, previous environmental studies and in-house environmental records of
the company. A total of 18 sampling stations, geo-referenced with a GPS, were
established.
10.1 Climate and Meteorology
Rainfall, temperature and sunshine hours (2010-2018),wind speed and direction,
relative humidity and atmospheric pressure were obtained from Nigeria Institute for
Oil Palm Research (NIFOR) Benin-City.
10.2 Air Quality and Noise Level
Automatic reading equipment was employed to determine air quality of the project
site. The concentrations of SO2, H2S, CO, CO2, NOX, were all below the limits set by
FMEnv; (CO, <1.0 ppm; CO2, 0.30-0.32%; H2S, <0.1 ppm; HC, <0.1%, SO2, <0.01
ppm; NO2, <0.01ppm; O2, 21% and Volatile Organic Compound, <0.01). The
concentrations of particulates were also below the set limit of 250μg/m3 with values
ranging from; (SPM, 70-110μg/m3). These show clean, unpolluted ambient air at the
locations.
The noise levels were also found to be below the FMEnv 8-hour exposure level of
90dBA with values ranging from 32.6 dB(A) to 52.4 dB(A).
10.3 Geology and Geomorphology
From the results and analysis as presented in ES 7.0, it was observed that the
location for the proposed project is comprised mainly of both fines and sands with
high to low plasticity. According to AASHTO and USSC soil classification systems,
the soil was classed as A-7-6. This shows that the soil consists of both fines and
sands, having low to high degree of plasticity.

Okomu Oil Palm Company Plc: 60TPH Palm Oil Mill Project at Extension Two February 2020
Environmental Impact Assessment (EIA) – Final Report xxiv
In terms of strength, the allowable bearing capacity calculated using shear parameters
obtained from laboratory triaxial tests revealed that the soil possesses great potential
for an economic foundation.
From the analysis, it is evident that the location can provide economic foundation
for most infrastructures, including the school that will be built on the site. Though
bearing capacity computations from CPT showed that the bearing pressure at depth
2.0 to 6m is higher than 200kN/m2, the value of 110kN/m2 should be used as the
design bearing pressure. With adequate scarification and compaction, the whole of
the site will be put to good use construction-wise.
10.4 General Soil Properties and Interpretation
Characteristically, the soils had low silt and clay content and high sand contents.
These soils had sand content that ranged in values between 70.60% and 93.20% .The
surface horizons in most cases had higher sand content than the subsurface horizon
but there was no consistent pattern of profile distribution of the sand particle size
fraction. The values of silt content of the soils were comparatively lower than the
values of the sand fractions and ranged in values from 1.40% and 13.40% in the
surface soils, while the subsurface horizons had silt contents that ranged from 1.40%
to 17.40%. The profile distribution of the silt particle size fraction did not follow any
regular pattern of distribution within the profile. The clay contents of these soils
increased with increasing soil depth in most profiles except in profile P.2Bwhere there
was decrease in the clay content of the soil with increasing soil depth. However there
was no strong evidence of clay illuviation in many of the profiles. Pedons P.2B, P.6B,
P.157, P.177 and P.191 have no accumulation of clay in any part of the profile, while
the remaining profiles show some weak evidence of argilluviation. The surface
horizons had clay that ranged in value from 5.40% to 15.00% while the subsurface
horizons had clay content that ranged from 5.40% to 28.00%.
The textures of these soils were predominantly sand to loamy sand in the epipedon
while the subsurface horizons were predominately sand to sandy clay loam in texture.
Three profiles (P.6B, P.177 and P.191) had no textural change with increasing soil
depth. These profiles had sand textural class throughout the profile.
The soil structural classes of the soils ranged from weakly formed fine-crumbs in the
surface horizons to moderately developed medium and coarse sub-angular blocky
structures in the subsurface horizons. The consistencies were loose – friable in the
surface and firm in the sub surface horizons.

Okomu Oil Palm Company Plc: 60TPH Palm Oil Mill Project at Extension Two February 2020
Environmental Impact Assessment (EIA) – Final Report xxv
10.5 Vegetation and Forestry
The vegetation at the proposed project site is presently covered by oil palm and with
weed species typical of the lowland rain forest zone in Nigeria. The dominant plants
include Guinea grass (Panicum maximum), Trema orietalis, Alchornea cordifolia,
Siam weed (Chromoleana odorata) and Sida spp. However, there is a lake (06° 40'
27.4" N and 005° 49' 50.5" E) within the southern part of the plantation where the
proposed project will be situated, with some aquatic plant species such as Nymphaea
lotus and Pistia stratiotes,Cyrtosperma.
10.6 Terrestrial Fauna and Wildlife
These fauna animals fall within six (6) classes representing vertebrates and
invertebrates. The invertebrates dominate the environment of the study area. The
proportion of reptiles when compared with other vertebrates and invertebrates is
naturally lower than the mammals and birds.
The species that were found in each site, especially within the plantation can be said
to be those that found the area suitable and are able to meet their needs.
10.7 Surface and Groundwater Assessment
Water quality varied from one location to another within the proposed project area.
The pH varied from 6.67–11.25, Conductivity 33.9–2,720(uscm-2), Turbidity 45-160,
Total Suspended solids 1-98 mg/l, Dissolved oxygen 4.8-11.2mg/L, Biological
oxygen demand 15.4-23.8mg/l, Alkalinity 9.6-60.7mg/L, Hardness <1-20mg/L,
Salinity as Chloride 6.95-41.8mg/L, Phosphate 2.1-4.66, nitrate 0.14-0.22mg/l,
Sulphate 10-26.0 mg/l, calcium <1.0-3.20mg/l, Magnesium <1.0-2.92/l. All the values
determined for heavy metals in the water bodies occurred in low concentration
(<0.01-<0.001mg/l), much below the recommended limits by FMENV and WHO
(<1.0). Water temperature was 28.4ºC± 0.4. The speed of the water ranged from 0.5
to 0.7m/sec; with a mean of 0.603±0.054 m/sec. Secchi disc turbidity for Jemide
River was 80cm.
The groundwater quality is good and free from pollution. Except for the pH that is
generally low (5.20-5.84), thus making the water to be mildly acidic. All the water
samples from the project’s water sources have all physico-chemical and
microbiological parameters within the permissible limits recommended by WHO and
FMENV for wholesome water. The pH of the water shall be raised to the
recommended limit for drinking and portable water by adding soda lime (KCl).

Okomu Oil Palm Company Plc: 60TPH Palm Oil Mill Project at Extension Two February 2020
Environmental Impact Assessment (EIA) – Final Report xxvi
10.8 Socio-Economic Environment
A quick appraisal of socioeconomic situation of the ten affected communities was
carried out in March 2018 against what was reported in 2014 during Extension Two
Oil Palm Plantation Development project. The proposed project was introduced to the
affected communities when the study was conducted.
There are ten (10 Nos.) communities around the proposed project site, namely;
Agbanikaka, Owan, Uhiere, Odiguetue, Odighi, Ihrue, Oke, Ekpan, Umuokpe and
Orhua Communities.
From communities’ sources, the cumulative population of all the affected
communities is 25,500. A dominant feature of the structure of the population of the
proposed project affected communities is its significant level of young people with
over 80% of the population below the age of 45 years. Adults in the age group 45
years and above constitute about 16% of the population. The male to female ratio is
more or less even.
ES 11.0 Present Impacts and Significant Potential and Associated Environmental and
Health Impacts
The summary of anticipated major/significant impacts arising from the proposed project
were examined and considered at four phases but with more emphasis on three phases
including: (i) Construction; (ii) Operation; (iii) Decommissioning and Abandonment.
The significant impacts of the proposed project include: 1.) Heavy machinery use;
2.) Installation of equipment; 3.) Generator use; 4.) Civil, electrical and mechanical works;
5.) Solid waste disposal; 6.) Transportation of FFB; 7.) Noise and Gaseous emissions;
8.) Palm Oil Mill Effluent (POME) disposal; 9.) Laying off staff and 10.) Palm Oil Mill
abandonment.
The predicted residual effects were also considered for each Project phase (Pre-
Construction, Construction, Operation, Decommissioning and Unplanned Events).
ES 12.0 Mitigation Measures
Mitigation measures were defined for the identified significant associated and potential
impacts, so also the residual impacts based on the following criteria:
• Prevention – design and management measures for ensuring that significant
potential impacts and risks do not occur,
• Reduction – operational and management measures for ensuring that the effects or
consequences of those significant associated and potential impacts that cannot be
prevented are reduced to a level as low as reasonably practical (ALARP).

Okomu Oil Palm Company Plc: 60TPH Palm Oil Mill Project at Extension Two February 2020
Environmental Impact Assessment (EIA) – Final Report xxvii
• Control - Operational and management measures for ensuring that residual
associated impacts are reduced to a level as low as reasonably practical (ALARP).
However, most of the significant environmental impacts that can likely arise from the
construction and operation of the proposed proposed project can be mitigated once
appropriate precautions are in place as defined in Table 6.1.
ES 13.0 Proposed Environmental and Social Management Plans, (EMP and SMP)
All mitigation measures will be adhered to by the Health, Safety and Environment (HSE)
department of the company in conjunction with HSE committee and the company’s
environmental consultant; (i) Emissions testing, Laboratory analysis of groundwater and
palm oil mill effluent (POME) will be carried out on quarterly basis and reporting will be
done in accordance with the regulatory requirements and record submitted to FMEnv; (ii)
Fire prevention precautions will be in place as required by the State Fire Service; (iii) All
firefighting equipment will be inspected and maintained regularly; iv) Regular inspections
will be conducted to verify the integrity of the fuel tanks. v) Written procedures governing
the operation of the fuel tanks and precautions to be taken will be developed; (vi) The
occupational health, safety and environmental policies shall be implemented; vii) Capacity
building programme for mill staff including awareness, in-plant training, seminars,
workshops and short courses shall be undertaken regularly to enhance the implementation
of the EMP.
The environmental monitoring programme would cover a number of parameters including
meteorology, ambient air quality, surface water quality, groundwater quality, palm oil mill
effluent quality and noise levels. All these would be regularly monitored by OOPC.
The schedule of EMP detailing impacts, mitigation measures, actions to be taken and the
persons responsible for mitigation actions has also been drawn. It will equally be
monitored for compliance.
ES 14.0 Decommissioning
The approaches to the decommissioning of the proposed project would involve the
combination of assets recovery, dismantling, demolition, decontamination and remediation.
ES 15.0 Conclusion
The EIA process demonstrates that the proposed project at OOPC extension two will fully
comply with legislative requirements in Nigeria and other relevant international regulations
applicable to the planned activities and operations.

Okomu Oil Palm Company Plc: 60TPH Palm Oil Mill Project at Extension Two February 2020
Environmental Impact Assessment (EIA) – Final Report xxviii
The proposed project is an attestation to the sustainable growth of oil palm industry, which
will result in substantial economic benefits for Nigeria through employment opportunities
generation in particular during the construction and operation phases.
This EIA also indicates that discharges including wastewater and/or effluent, gaseous
emissions and noise are expected from the operation of the proposed project. However, any
such discharges, which can be considered as potential sources of adverse environmental
effects, can be fully managed through preventive actions and mitigating measures. This
means that no significant negative impact on the natural, health and social environmental
sensitivities of the project area is expected to result from discharges.
The Project is environmentally and socially sound, and will promote balanced and
environmentally sustainable operation of Okomu Oil Palm Company Plc (OOPC).

Okomu Oil Palm Company Plc: 60TPH Palm Oil Mill Project at Extension Two February 2020
Environmental Impact Assessment (EIA) – Final Report Page 1
CHAPTER ONE
INTRODUCTION
1.1 History and Business of Okomu Oil Palm Company Plc
The proponent of the proposed 60tons FFB/Hr Palm Oil Mill project; The Okomu Oil Palm
Company Plc (OOPC Plc) herein referred to as “ The Company” is an agricultural and food-
processing company located at Okomu-Udo, Ovia Southwest Local Government Area, Edo
State, Nigeria. The company specializes in plantation development and production of crude
palm oil, palm kernel oil and palm kernel cake.
The company was established in 1976 as a Federal Government pilot project aimed at
rehabilitating oil palm production in Nigeria. At inception, the pilot project covered a
surveyed area of 15,580 hectares out of which 12,500 hectares were planted with oil palm.
It was incorporated on December 3, 1979 as a limited liability company.
In 1990 the Technical Committee on Privatization and Commercialization (TCPC)
privatized the company on behalf of the Federal Government of Nigeria. At the turn of the
millennium, the company acquired 6,000 hectares and 11,416.673ha property known as
Extension One and Extension Two at Ovia southwest and Ovia Northeast/Uhunmwonde
Local Government Areas respectively to further boost its available land holdings. The
company now plans to establish a 60 tons/hr mill given the considerable progress of oil
palm development at Extension Two.
The Company has since grown to become one of Nigeria’s leading agricultural companies.
Presently the company has over 10,000 ha of oil palm of which 8713 ha is mature and 7500
of rubber of which around 5000 ha is mature. It has also expanded its milling capacity from
a meagre 1.5 tons FFB/hr in 1985 to 30 tons FFB/hr in 1992 and most recently an expansion
of the existing mill to 60tons FFB/hr in 2018 thus making the company to operate one of
the largest palm oil mill in Nigeria.
The privatization of the Company has been a great success and a huge encouragement for
the Nigerian agricultural sector, with profound positive consequences of stable socio-
economic growth for the region where it is located. The company has consistently posted
profits in the last 15 years; a period during which most other similar establishment in the
country have either folded up or performing sub-optimally.
What is most inspiring is not just the growth and profitability of the company, but the fact
that it is the only agri-business in the NSE’s top 18 companies with the largest turnovers.

Okomu Oil Palm Company Plc: 60TPH Palm Oil Mill Project at Extension Two February 2020
Environmental Impact Assessment (EIA) – Final Report Page 2
Today, what is now known as The Okomu Oil Palm Company Plc has transformed into an
economic success, earning presidential recommendation and recording over 300 percent
rise in profit-after-tax (PAT). The company’s activities and operations were recently
certified by international bodies such as RSPO, ISO 14001, 19001 and 18001.
Just as the company is expanding in size, its corporate environment is also expanding. The
Company has over 12,000 individual and institutional shareholders, both Nigerian (40%)
and foreign (60%). Currently, the company employs over 2000 permanent staff and
several independent sub-contractors. All these have added up to place the Company on top
in the burgeoning oil palm business and to position it as an emerging leader in rubber
production.
The Company benefits from the quality management provided by its main shareholders
and technical partner, Socfinaf SA, with 62% shares in the company. Socfinaf SA is the
biggest single shareholder that brings into the company a little under a century of sound
acclaimed technical expertise in the world stage on tropical agriculture.
Socfinaf SA is a global player in the cultivation of oil palm, rubber, coffee and tropical
flower. Socfinaf SA founded in 1912 was the first industrial company to plant oil palm in
Africa and Indonesia. It has ongoing plantations in Cote D’ivoire, Liberia, Guinea,
Cameroun, Indonesia, Kenya Sierra Leone and Congo.
1.2 Location and Access
The company headquarter is located at Okomu-Udo, within the Okomu Forest Reserve in
Ovia Southwest Local Government Area of Edo State, Nigeria. The project site is
accessible through a network of roads from Lagos and Benin City. It lies between
geographic locations; top right 6040’33.63”N and 5048’43.58”E; top left 6040’32.46”N and
5048’29.41”E. Bottom right 6040’22.44”N and 5048’28.31”E; bottom left 6040’20.79”N
and 5048’42.17”E (See Figure1.2)
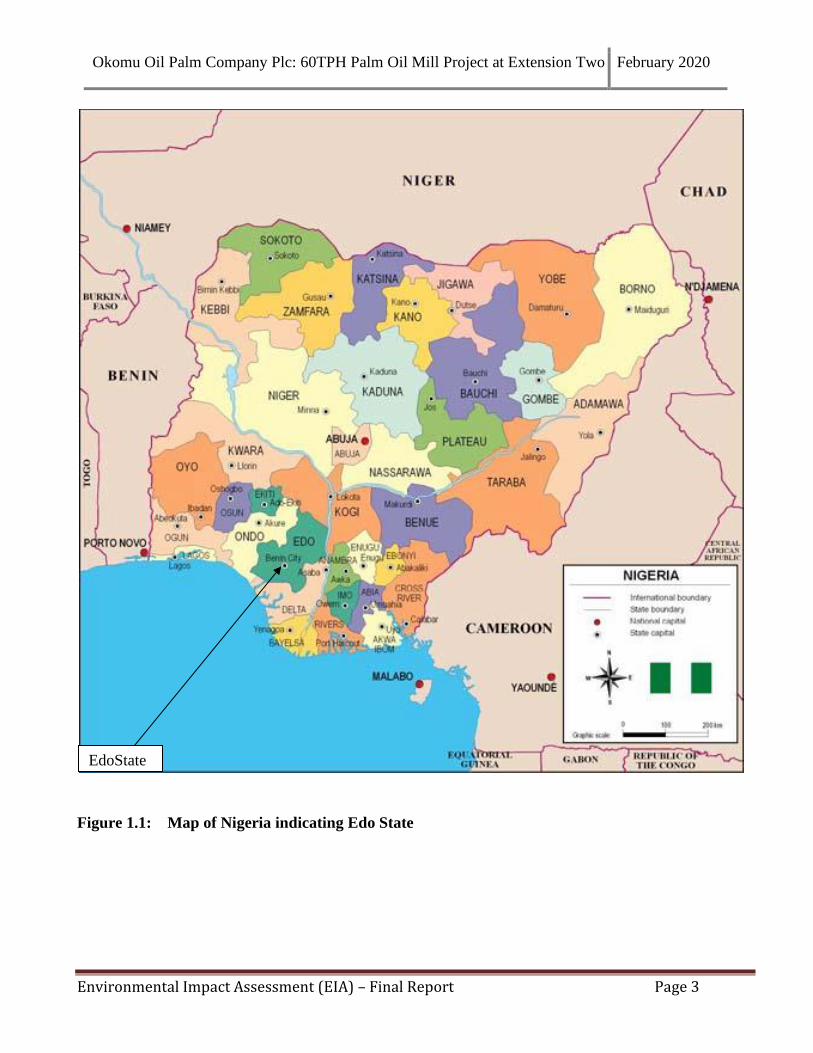
Okomu Oil Palm Company Plc: 60TPH Palm Oil Mill Project at Extension Two February 2020
Environmental Impact Assessment (EIA) – Final Report Page 3
Figure 1.1: Map of Nigeria indicating Edo State
EdoState

Okomu Oil Palm Company Plc: 60TPH Palm Oil Mill Project at Extension Two February 2020
Environmental Impact Assessment (EIA) – Final Report Page 4
Figure 1.2: Map of Edo State Indicating the Proposed Mill in Ovia Northeast LGA

Okomu Oil Palm Company Plc: 60TPH Palm Oil Mill Project at Extension Two February 2020
Environmental Impact Assessment (EIA) – Final Report Page 5
1.3 Activities
The company undertakes plantation agriculture involving the growing of oil palm (Elaeis
guineensis) and the processing of Fresh Fruit Bunches (FFB) into crude palm oil (CPO).
The company is also involved in the planting and tapping of rubber trees (Hevea brasilenses),
and also the processing of cup lumps into crumb rubber. The major activities of the company
include the oil palm plantation, palm oil mill, rubber plantation and rubber factory operations.
1.4 Mission Statement of The Okomu Oil Palm Company Plc
"To be Nigeria’s leading agribusiness, through the efficient and effective management of
our various plantations by a highly motivated workforce, working in harmony with other
stakeholders, and continuously returning favourable results to our shareholders".
1.5 Literature Review on the Palm Oil
Fruit of oil palm tree
Palm oil is rich in carotenoids, (pigments found in plants and animals) from which it derives
its deep red colour, and the major component of its glycerides is the saturated fatty acid
palmitic; hence it is a viscous semi-solid, even at tropical ambient, and a solid fat in
temperate climates.
Because of its economic importance as an high-yielding source of edible and technical oils,
the oil palm is now grown as a plantation crop in most countries with high rainfall (minimum
1 600 mm/yr) in tropical climates within 10° of the equator. The palm bears its fruit in
bunches varying in weight from 10 to 40 kg. The individual fruit, ranging from 6 to 20 gm,
are made up of an outer skin (the exocarp), a pulp (mesocarp) containing the palm oil in a
fibrous matrix; a central nut consisting of a shell (endocarp); and the kernel, which itself
contains an oil, quite different to palm oil, resembling coconut oil.

Okomu Oil Palm Company Plc: 60TPH Palm Oil Mill Project at Extension Two February 2020
Environmental Impact Assessment (EIA) – Final Report Page 6
Figure 1.3: Fresh Fruit Bunch (FFB)
Figure 1.4: Structure of the palm fruit

Okomu Oil Palm Company Plc: 60TPH Palm Oil Mill Project at Extension Two February 2020
Environmental Impact Assessment (EIA) – Final Report Page 7
The wild oil palm groves of Central and West Africa consists mainly of a thick-shelled
variety with a thin mesocarp, called Dura. Breeding work, particularly crosses between Dura
and a shell-less variety (Pisifera), have led to the development of a hybrid with a much
thicker mesocarp and a thinner shell, termed Tenera. All breeding and planting programs
now use this latter type, the fruits of which have a much higher content of palm oil than the
native Dura.
Modern high-yielding varieties developed by breeding programs, under ideal climatic
conditions and good management, are capable of producing in excess of 20 tonnes of
bunches/ha/yr, with palm oil in bunch content of 25 percent. This is equivalent to a yield of
5 tonnes oil/ha/yr (excluding the palm kernel oil), which far outstrips any other source of
edible oil.
Palm Oil
Palm oil (also known as dendê oil, from Portuguese) is an edible vegetable oil derived from
the mesocarp (reddish pulp) of the fruit of the oil palms, primarily the African oil
palm Elaeis guineensis, and to a lesser extent from the American oil palm Elaeis oleifera and
the maripa palm Attalea maripa.
Palm oil is naturally reddish in color because of a high beta-carotene content. It is not to be
confused with palm kernel oil derived from the kernel of the same fruit, or coconut
oil derived from the kernel of the coconut palm (Cocos nucifera). The differences are in color
(raw palm kernel oil lacks carotenoids and is not red), and in saturated fat content: Palm
mesocarp oil is 41% saturated, while palm kernel oil and coconut oil are 81% and 86%
saturated respectively.
Along with coconut oil, palm oil is one of the few highly saturated vegetable fats and is semi-
solid at room temperature. Like most plant-based products, palm oil contains very
little cholesterol.
Palm oil is a common cooking ingredient in the tropical belt of Africa, Southeast Asia and
parts of Brazil. Its use in the commercial food industry in other parts of the world is
widespread because of its lower cost and the high oxidative stability (saturation) of the
refined product when used for frying.

Okomu Oil Palm Company Plc: 60TPH Palm Oil Mill Project at Extension Two February 2020
Environmental Impact Assessment (EIA) – Final Report Page 8
1.6 Legal and Administrative Policy Framework
Nigeria has enacted a comprehensive policy and legal framework for
environmentalassessment and management. The country has policies, legislation, and
strategies in place tomanage the protected facilities, to satisfy its international obligations,
and to protect thequality of the environment for the health and well-being of its citizens. The
hierarchy ofpolicies and legislative provisions forenvironmental management in Nigeria is
comprised of different enactments ranging from the Constitution to international treaties, and
to environment andresource protection laws.
The Permit and Licence obtained from FMEnv will have reporting requirements and
other obligations, which will need to be fulfilled. Other regulators such as the Edo State
Ministry of Environment and Public Utilities, Edo State Waste Management Board and
Federal Ministry of Labour and Employment will also have requirements. Persons who
have to ensure that the obligations are fulfilled will need to be trained in the regulatory
requirements.
A fundamental principle of the Nigerian environmental policy is that
economicdevelopment must be in harmony with the extraction and utilization of natural
resources andthat air, water, and soil pollution will be controlled.
The applicable Domestic environmental laws and regulations are as follows:
1.6.1 National Legislation
The National legislation applicable to this project includes:
• Environmental Impact Assessment (EIA) Act, Cap E12 LFN 2004
• The National Policy on Environment 1989 revised 1999.
• National Guidelines and Standards for Environmental Pollution Control in
Nigeria, 1991
• Harmful waste (criminal provision) Act 42 of 1988
• S.I.8 National Environmental Protection (Effluent Limitations) Regulations,
1991
• S.I.9 National Environmental Protection (Pollution Abatement in Industries and
Facilities Generating Wastes) Regulations, 1991
• S.I.15: National Environmental Protection (Management of Solid and Hazardous
Waste) Regulations, 1991
• National Guidelines for Environmental Audit in Nigeria, 1999
• National Guidelines on Environmental Management System in Nigeria 1999.

Okomu Oil Palm Company Plc: 60TPH Palm Oil Mill Project at Extension Two February 2020
Environmental Impact Assessment (EIA) – Final Report Page 9
• National Environmental Standards and Regulations Enforcement Agency
(NESREA), 2007.
• Factories Act CAP F1 LFN 2004
• Land Use Act, CAP L5 LFN 2004
• The Urban and Regional Planning Law Act No. 88 of 1992
• National Policy on Renewable Energy Development
• The National Building Code (NBC)
• Workmen Compensation Act, 1987 and Abandonment Guidelines 1995
Environmental Impact Assessment Act CAP E12 LFN 2004,
EIA act was promulgated in 1992. It makes environmental impact assessment (EIA)
mandatory for all new major projects. Therefore, an EIA permit is required for the proposed
project.
National Guidelines and Standards for Environmental Pollution Control in Nigeria 1991
This schedule deals with the control of industrial effluent discharge, gaseous emissions and
hazardous wastes, so also noise pollution control. This schedule established environmental
guidelines and standards for the abatement and control of all forms of pollution.
The proposed project would therefore have to ensure that any discharges into the land, water
and atmosphere are of acceptable quality to ensure that there are no legal repercussions
under this schedule.
S. I. 8 National Environmental Protection (Effluent Limitation) Regulations 1991
These Regulations give the parameters in industrial gaseous emissions and wastewater
(effluents) and their limitations, concentration and standards for discharge into land,
atmosphere and receiving surface waters.
The proposed project would therefore have to ensure that any discharges into the land, water
and atmosphere are of acceptable quality to ensure that there are no legal repercussions
under this schedule.
S. I. 9 National Environmental Protection (Pollution Abatement in Industries and
Facilities Generating Wastes) Regulations 1991
This regulation requires every industry to install anti-pollution/pollution abatement
equipment to treat effluent discharges and gaseous emissions to the standards and limits
prescribed in Regulation S.I.8, 1991.

Okomu Oil Palm Company Plc: 60TPH Palm Oil Mill Project at Extension Two February 2020
Environmental Impact Assessment (EIA) – Final Report Page 10
S. I. 15 National Environmental Protection (Management of Solid and Hazardous
Wastes) Regulations 1991.
This regulation requires that all steps that are necessary must be taken for the effective
management of solid and hazardous wastes in order to safeguard public health, ensure that
waste is collected, stored, transported, recycled, reused or disposed in an environmentally
sound manner and promote safety standards in relation to such waste.
National Environmental (Sanitation and Waste Control) Regulations, 2009 (S.I.28)
The purpose of these regulations is the adoption of sustainable and environment friendly
practices in environmental sanitation and waste management to minimize pollution. The
provisions of the regulations state that a person in care, management or control of any
industrial facility shall:
(a) Provide educational and pictorial signs to direct persons where they can drop
waste.
(b) Provide receptacles for recyclable materials in appropriate and easily accessible
locations.
(c) Keep the premises, drains and all public or private lands, street, lanes, walkways;
beaches or docks within 5 meters of the boundary of the property free from litter
at all times.
(d) Ensure that discarded materials are regularly collected and disposed of sanitarily.
(e) Ensure that recyclable materials are properly packed and neatly stacked.
(f) Ensure sorting and segregation of solid waste at source.
National Environmental (Noise Standards and Control) Regulations, 2009 (S.I.35)
The purpose of these regulations is to ensure maintenance of a healthy environment for all
people in Nigeria, the tranquility of their surroundings and their psychological well-being by
regulating noise levels and generally, to elevate the standard of living of the people. The
regulations among others state the permissible noise levels to which a person may be
exposed; control and mitigation of noise; permits for noise emissions in excess of permissible
levels; and enforcement.
Factories Act CAP F1 LFN 2004
The regulations for Health, Safety and Welfare are under this act. This act also requires that:
Before any person occupies or uses as a factory any premises which were not so occupied at
the commencement of this Decree, he shall apply for the registration of such premises by
sending to the Director of Factory an application containing the particulars set out in
Schedule 1 to this Decree.

Okomu Oil Palm Company Plc: 60TPH Palm Oil Mill Project at Extension Two February 2020
Environmental Impact Assessment (EIA) – Final Report Page 11
Any person who has not been issued a certificate of registration as aforesaid occupies or uses
as a factory any premises that have not been registered as a factory shall be guilty of an
offence.
Land Use Act, Cap L5, 2004
The Nigerian Land Use Act 1978 was promulgated in March 1978. It vests all land in each
state of the federation (except land already vested in the Federal
Government or its agencies) in the Governor of the state. It makes the state Government the
authority for allocating land in all urban areas for residential, agricultural commercial and
other purposes while it confers similar powers regarding non-urban areas on the Local
Government in such area. The Governor of a state can revoke a Right of occupancy (statutory
customary) for overriding public interest.
The Urban and Regional Planning Law Act No. 88 of 1992
Decree 88 of 1992 established a Development Control Department (DCD) charged with the
responsibility for matters relating to development, control and implementation of physical
development plans at Federal, State, and Local Government levels within their respective
jurisdictions.
National Policy on Renewable Energy Development
The primary objective of the National Policy on Renewable Energy Development is to
encourage the diversification of sources of energy supply through renewable energy, and as
such improve the energy security of the country.
1.7 International Finance Corporation (IFC) Performance Standards (PS)
Other related international guidelines include IFC Performance Standards such as:
▪ PS 1 ̶ Assessment and Management of Environmental and social Risks and
Impacts.
▪ PS 2- Labour and Working Conditions
▪ PS 3 ̶ Resource Efficiency and Pollution Prevention
▪ PS 4 ̶ Community Health, Safety and Security
▪ PS 5 ̶ Land Acquisition and Involuntary Resettlement
▪ PS 6 ̶ Biodiversity Conservation and Sustainable Management of Living
Natural Resource
▪ PS 7 – Indigenous People
▪ PS 8 ̶ Cultural Heritage

Okomu Oil Palm Company Plc: 60TPH Palm Oil Mill Project at Extension Two February 2020
Environmental Impact Assessment (EIA) – Final Report Page 12
1.8 Roundtable on Sustainable Palm Oil – Principles and Criteria
RSPO is a not-for-pro-t association that unites stakeholders from seven sectors of the palm
oil industry - oil palm producers, palm oil processors or traders, consumer goods
manufacturers, retailers, banks and investors, environmental or nature conservation NGOs
and social or developmental NGOs - to develop and implement global standards for
sustainable palm oil. This is achieved via eight principles as follows:
Principle 1: Commitment to transparency
Principle 2: Compliance with applicable laws and regulations
Principle 3: Commitment to long-term economic and financial viability
Principle 4: Use of appropriate best practices by growers and millers
Principle 5: Environmental responsibility and conservation of natural resources
and biodiversity
Principle 6: Responsible consideration of employees, and of individuals and
communities affected by growers and mills
Principle 7: Responsible development of new plantings
Principle 8: Commitment to continual improvement in key areas of activity
1.9 International Agreements and Protocols
Nigeria has acceded to a number of international environmental conventions and the
keyones are presented in Table 1.1. The applicable international environmental
agreements and protocols include:
• The Montreal Protocol
• The Basel Convention
• The Framework Convention on Climate Change
• The Convention for The Prevention of International Trade in Endangered
Species (CITES)
• Convention on Biological Diversity (CBD)
The Montreal Protocol
This protocol discourages the use of substances that deplete the ozone layer and promotes the
synthesis of new and environment-friendly products.
The Basel Convention
This convention deals with the control of Trans–boundary movement of Hazardous Waste
and Substances among member countries.

Okomu Oil Palm Company Plc: 60TPH Palm Oil Mill Project at Extension Two February 2020
Environmental Impact Assessment (EIA) – Final Report Page 13
The Framework Convention on Climate Change
This convention requires member countries to stabilize atmospheric concentrations of
greenhouse gases at levels that will prevent human activities from interfering dangerously
with the global climate change.
The Convention for the Prevention of International Trade in Endangered Species (CITES)
The trade involving certain wild animals and plants whose numbers are considered to be
endangered is been regulated by this convention
Convention on Biological Diversity (CBD)
This convention deals with the conservation of biodiversity, the sustainable use of its
component and the fair and equitable sharing of the resulting benefits.
Table 1.1: International Environmental Conventions Signed by Nigeria
Convention Year of
Accession
African Convention on the Conservation of Nature and Natural Resources 1968
Convention on Biological Diversity CBD) 1993
UN Framework Convention on Climate Change (UNFCCC) 1994
Kyoto Protocol 1999
UN Convention on Combating Desertification (UNCCD) 1996
Convention on the Protection of Wetlands of International Importance
(RAMSAR)
1998
Vienna Convention for the Protection of the Ozone Layer 1996
Montreal Protocol (regulating substances that deplete the ozone layer) 1996
Convention on International Trade in Endangered Species of Fauna and Flora
(CITES)
1996
Convention on Trans-boundary Movement of Hazardous Waste (BASEL) 1997
Rotterdam Convention on the Prior Informed Consent Procedure for Certain
Hazardous Chemicals and Pesticides in International Trade
2000
Stockholm Convention on Persistent Organic Pollutants (POPs) 2004
World Heritage Convention 1990
Convention on the Conservation of Migratory Species of Wild Animals (BONN
Convention)
1979
International Union for the Conservation of Nature and Natural Resources
(IUCN)
1956
The Equator Principles III 2013

Okomu Oil Palm Company Plc: 60TPH Palm Oil Mill Project at Extension Two February 2020
Environmental Impact Assessment (EIA) – Final Report Page 14
1.10 Institutions and Regulatory Agencies
• Federal Ministry of Environment
• National Environmental Standards and Regulations Enforcement Agency
• Edo State Ministry of Environment and Sustainability
• Edo State Environmental and Waste Management Board
• Ministry of Agriculture and Natural Resources, Edo State
• Ministry of Lands and Surveys, Edo State
• Edo State Fire Service
• Ministry of Health, Edo State
• Departments of Environment, Ovia Northeast Local Government Area of
Edo State, Nigeria.
• Federal Ministry of Agriculture and Rural Development
• Agricultural Research council of Nigeria
• Nigerian Institute for Oil Palm Research
Federal Ministry of Environment
The Federal Ministry of Environment is the apex body with the broad mandate to regulate
and protect the environment in Nigeria. In addition, Nigeria is party to some international
agreements; protocols and conventions on Environment and is bound by their provisions and
requirements.
National Environmental Standards and Regulations Enforcement Agency (NESREA)
NESREA is charged with the responsibility of enforcing all environmental laws, guidelines,
policies, standards and regulations in Nigeria. It also has the responsibility to enforce
compliance with provisions of international agreements, protocols, conventions and treaties
on the environment.
Edo State Ministry of Environment and Sustainability
The Edo State Ministry of Environment and Sustainability is the arm of government
responsible for regulating the environment in Edo State of Nigeria. Depending on certain
peculiarities of the state, the Ministry has made and established its own laws and
environmental standards, which are not inconsistent with Federal laws.
Edo State Environmental and Waste Management Board
This Board is under the Governor’s Office with a mandate for waste management and
environmental sanitation.

Okomu Oil Palm Company Plc: 60TPH Palm Oil Mill Project at Extension Two February 2020
Environmental Impact Assessment (EIA) – Final Report Page 15
Department of Forestry and Natural Resources, Edo State
The Forestry Department of the Edo State Ministry of Environment and Sustainability has
responsibility for forest resources management, forest reserves and wildlife conservation in
the state.
Ministry of Lands and Surveys, Edo State
The Ministry of Lands and Surveys deals with land issues, plans and controls development,
establishes residential, commercial and industrial layouts and execute in the state the
Nigerian Urban and Regional Planning law.
Ovia Northeast Local Government Area
The Departments of Environment, Ovia Northeast Local Government Area of Edo State,
Nigeria is the tier of government that is responsible for regulating and monitoring the
environment at the local level especially the aspects of health and sanitation inspection of
business premises to ensure that they conform to set standards.
Federal Ministry of Agriculture and Rural Development
The Ministry has the mandate to Grow Nigeria’s agricultural sector and develop
strategic partnerships to stimulate investments to drive a market-led agricultural
transformation.
Agricultural Research council of Nigeria
To achieve significant improvements in agricultural productivity, marketing and
competitiveness by generating appropriate technologies and policy options, promoting
innovation, establishing a knowledge management capacity and strengthening the
agricultural research system.
Nigerian Institute for Oil Palm Research
The formal mandate of the institute is to conduct research into the production and
products of oil palm and other palms of economic importance and transfer its research
findings to farmers.
1.11 Non-Governmental Organizations (NGOs)
• Nigerian Conservation Foundation (NCF)
• Nigerian Environmental Society (NES)
• Human Right and Rural Development Organisation of Nigeria
• Grassroot Development Initiative
• Vision 1 Health
• Women Empowerment and Development Network (WEDEN)

Okomu Oil Palm Company Plc: 60TPH Palm Oil Mill Project at Extension Two February 2020
Environmental Impact Assessment (EIA) – Final Report Page 16
• Gender Development Action (GDA)
Nigerian Conservation Foundation (NCF)
The Nigerian Conservation Foundation (NCF) is Nigeria's foremost non-governmental
organisation dedicated to the promotion of nature conservation. Formed in 1980 and registered
in 1982 as a Charitable Trust (No. 1917), its ultimate goal is to stop and eventually reverse the
accelerating degradation of Nigeria's natural environment and to help build a future in which
humans live in harmony with nature.
Nigerian Environmental Society (NES)
The Nigerian Environmental Society (NES), with headquarters in Lagos, is incorporated in
Nigeria as a professional, non-profit making, non-governmental Organisation which is
committed to the protection, development and sustenance of the environment and to the
promotion of the profession of Environmental Science and Engineering, both in theory and
in practice. The NES has been in forefront of the vanguard of environmental protection and
resource conservation.
1.12 General Environmental Impact Assessment Procedural Guidelines
In response to the promulgation of the EIA Act CAP E12 LFN 2004, an Environmental
Impact Assessment Procedure for Nigeria was produced by the former Federal
Environmental Protection Agency (FEPA, 1995). The procedure provides the steps to be
followed from project conception to commissioning in order to ensure that the project is
implemented with maximum consideration for the environment.
The procedure for EIA involves the project proposal stage where the project proponent
notifies the Ministry of Environment of the proposed project in writing. The project proposal
is to contain all relevant information on the project and a land-use map.
This stage is followed by the screening phase, when the Ministry will carry out an Initial
Environmental Examination and assign the project into categories based on the following
criteria: magnitude; extent or scope; duration and frequency; risk; significance; mitigation
measures available for associated and potential environmental impacts. The location of the
project in Environmentally Sensitive Areas is also an important criterion in the project
categorization. The area categorized as Environmentally Sensitive Areas (ESAS) include:
coral reefs, mangrove swamps, small islands, tropical rain forests, areas with erosion prone
soils, natural conservation areas, watersheds, wetlands etc.
There are three categories (I, II and III) in Ministry of Environment’s guidelines.

Okomu Oil Palm Company Plc: 60TPH Palm Oil Mill Project at Extension Two February 2020
Environmental Impact Assessment (EIA) – Final Report Page 17
Category I projects are subjected to full scale EIA, and it consists among others: Petroleum
projects such as Oil and Gas fields development; construction of offshore pipeline in excess
of 50 kilometres in length; construction of Oil and Gas separation, processing, handling and
storage facilities, and large scale construction of depots for storage of petroleum products.
Projects listed in category II may not require a full-scale EIA except when the project is
located in an Environmentally Sensitive Area (ESA) and in this case the project will be
assigned top category I. The requirement for category II projects is a partial EIA. Also,
mitigation measures or changes in project design (depending on the nature and magnitude of
the environmental impacts) as well as further actions, may be required from the proponent.
Category II projects include reforestation/afforestation projects, land and soil management,
small scale irrigation and drainage, mini hydro-power development, small-scale
development of petroleum or related activities, etc.
Category III projects are expected to have essential beneficial impacts on the environment.
For projects in this category, the Ministry of Environment will issue an Environmental
Impact Statement (EIS). Projects in this category include; family program, institutional
development, environmental awareness projects, etc.
Another stage of erstwhile FEPA’S EIA procedure is the scoping stage, the main feature of
which is that the proponent will be required to submit a Terms of Reference (ToR) for the
proposed EIA study. In some cases, the Ministry may demand a Preliminary Assessment
Report, and any additional information from the proponent to assist in vetting the scope and
the ToR of the proposed EIA study. This stage is followed by actual implementation of the
EIA study; Preparation of Draft Final and Final Reports; Review process and
Approval/Certification.The FMEnv process is shown in Figure 1.5 below.
The proposed project is a 60tons per hour Palm Oil Mill Project at Extension two estate of
the company situated in Ovia Northeast LGA of Edo State. Upon site verification in March
2018 and screening by the Federal Ministry of Environment, it has been placed in Category
Two; requiring mandatory EIA Studies and a Technical Review Meeting. The fieldwork for
data gathering was approved for one (1) season to be supplemented with an Approved
relevant EIA report.

Okomu Oil Palm Company Plc: 60TPH Palm Oil Mill Project at Extension Two February 2020
Environmental Impact Assessment (EIA) – Final Report Page 18
Figure 1.5: FMEnv EIA Procedure
Source: FMEnv Environmental Impact Assessment Procedural Guidelines (1995)
Submission of Project Proposal or FS and the TOR for EIA Study by the
Proponent to FMEnv
Initial Environmental Evaluation which includes
Site Verification
Approval of TOR by FMEnv Review/confirmation of the Scope of TOR by
FMEnv
Conduct EIA Studies Submission of Draft EIA Report
Review of Draft EIA Report by FMEnv
FMEnv forwards technical comments of the report to
the Proponent
Impact Mitigation Monitoring by FMEnv,
State Env, & LGAs
Proponent submit the Final EIA Report to FMEnv
Approval of EIA Report by FMEnv Environmental Audit
Registration
(Payment of
fee)
Screening
Scoping
By a
registered
Consultant
Include: - In house review
- Public review (21
days display)
- Panel Review
FMEnv review
the revised
report
submitted by
the Proponent
Compliance to
mitigation
measures is
checked on the
project site EA Dept.
approves the EIA Report and issue the EIS and the certificate

Okomu Oil Palm Company Plc: 60TPH Palm Oil Mill Project at Extension Two February 2020
Environmental Impact Assessment (EIA) – Final Report Page 19
1.13 Okomu Oil Palm Company Plc IMS Policy
The OKOMU OIL PALM COMPANY PLC is committed to:
• Providing customers with high Quality products and services which meet
requirements and are fit for their purpose.
• Compliance with all applicable laws, regulations, standards and other
requirements related to our activities, products and services and their
environmental aspects.
• Enhancing the skills of management and staff through review and
actively pursuing an on-going training policy, the objective of which is
to prepare staff to perform their work more effectively.
• Promoting the culture of continual improvement of the Quality and
Environmental processes and the philosophy of getting things “right first
time”.
• Advocating the adoption of prudent Quality and Environmental
principles to our vendors, suppliers and customers. Reduce and eliminate
the generation of waste and emissions at the source and make all efforts
to recycle when practical.
• Pledging ourselves to the prudent and sustainable use of the earth’s
resources and the protection of the natural environment while we strive
to fulfil our corporate mission of contributing to enhance prosperity for
all.
• Promoting the Integrated Management System and continually
improving its effectiveness through the use of the Quality and
Environmental Policy, Quality/Environmental objectives, audit results,
analysis of data, corrective and preventive actions and management
review.
• Communicating this policy to all persons working for or on behalf of the
organization.
The Managing Director confirms the commitment and support, along with that of all
employees and those working on behalf of the company, to the above policy statement
and the effective application and continual improvement of the Integrated Management
System.

Okomu Oil Palm Company Plc: 60TPH Palm Oil Mill Project at Extension Two February 2020
Environmental Impact Assessment (EIA) – Final Report Page 20
1.14 Objectives of Environmental Impact Assessment
The main objective of the EIA is to principally identify the environmental consequences of
the operations and activities of the proposed project and also to establish baseline data of the
site to aid decision making process and serve as future reference. The EIA covers the whole
environment from the biotic to abiotic (physical), socio-economic and health aspects of the
resident company workers. In this circumstance therefore, and for the purposes of
compliance with Federal Environmental Laws, it is required that the company as a
responsible corporate organization should conduct an Environmental Impact Assessment on
its proposed projects. This would serve to adequately analyse the sites, identify any
environmental impacts and define framework for contingency plans and mitigation and
abatement measures for impacts.
In Nigeria, the legal instruments relevant for the protection of the environment are contained
in FEPA (now Federal Ministry of Environment) regulations. Some State governments also
made few enactments that are not inconsistent with the Federal laws. In consonance with
these laws, the company should:
• Develop, Implement and maintain an environmental policy that would enhance
the environmental performance of its corporate activities.
• Aim and pursue compliance with existing environmental legislation, identify
any non-compliance and endeavour to remedy such non-compliance.
• Develop and maintain environmental awareness of its employees, contractors
and any such external parties involved in their corporate activities.
• Improve its corporate image through environmental responsibilities.
• Work in partnership with regulatory agencies for better environment.
• Pay special attention to sustainable development through incorporation of
environmental concerns into any development projects.
• Minimize litigation that may arise from environmental non-performance of its
projects’ activities.

Okomu Oil Palm Company Plc: 60TPH Palm Oil Mill Project at Extension Two February 2020
Environmental Impact Assessment (EIA) – Final Report Page 21
1.15 Terms of Reference (ToR)
The detailed Terms of Reference as approved by the Federal Ministry of Environment
are provided in Annexure I.
1.16 Justification of the EIA Report
Palm oil is the most consumed vegetable oil in the world and 80% of it is used in the food
industry; a variety of other oils with different properties used various domains can be
extracted from it. It is used primarily as a food product 77% of which is consumed. Some
fatty substances are extracted from it and when mixed with other vegetable oils, produce
good oil for frying.
Countries around the world produce billion pounds of vegetable oils each year. These
domestic oils are extracted from the seeds of soybean, corn, cotton, sunflower, flax, and
rapeseed plants, palm kernel, coconut, castor, tung and palm oil.
Although more than 12 billion pounds of these oils are used for food products such as
shortenings, salad and cooking oils, and margarines, large quantities serve feed and industrial
needs. The latter applications include chemicals such as plasticizers, which add pliability to
plastics and other substances; stabilizers, which help other substances resist chemical
change; emulsifiers, which enable the mixing of normally unmixable liquids; surfactants,
which reduce the surface tension of liquids and are commonly used in detergents; and esters,
nylons, and resins, which are basic ingredients in many industrial products. Besides
detergents and plastics, products that contain chemicals derived from vegetable oils include
lubricants, coatings, corrosion inhibitors, adhesives, cleaners, cosmetics, water repellants,
and fuels.
Markets for these highly reactive oils are expected to grow with the increasing sophistication
of consumers worldwide and with changing and more stringent product performance
requirements.
Beyond these reasons, all projects in this sector worldwide are welcome as long as demand
remains higher than supply and Nigeria is no exception to this rule. Beyond the economic,
financial and social opportunities offered by the company, it is not without adverse
consequences on the environment.
Thus, this report aims primarily to assess the potential environmental impact anticipated
from the physical development and activities of the proposed project and the effects it could
have on the totality of the project environment with a view to maximize the beneficial
impacts and to mitigate the adverse impacts in order to facilitate the approval of the proposed
project.

Okomu Oil Palm Company Plc: 60TPH Palm Oil Mill Project at Extension Two February 2020
Environmental Impact Assessment (EIA) – Final Report Page 22
1.17 Structure of the Report
This report is presented in Preliminary sections and eight chapters as follows:
Preliminary pages (Cover Page, Table of Content, EIA Study Team and Preparers,
Executive Summary and Acknowledgement)
Chapter One: Introduction
Chapter Two: Project Justification and the Project Alternatives,
Chapter Three: Project Description
Chapter Four: Description of the Project Environment
Chapter Five: Associated and Potential Impact
Chapter Six: Mitigation Measures
Chapter Seven: Environmental and Social Management Plan
Chapter Eight: Conclusion and Recommendations
References
1.18 Declaration
The Company as a corporate organization and the proponent of the proposed project on
behalf of herself, the project contractors and other partners hereby declares her intention to
undertake 60TPHR Palm Oil Mill Project, and in line with her corporate policy and
compliance with all applicable national, state and local government laws, regulations and or
bye-laws, the company takes full responsibility for the protection of the environment within
the project area.
This EIA report has been prepared by Foremost Development Services Limited on behalf
of The Okomu Oil Palm Company Plc in line with statutory requirements, guidelines, and
standards for plantation crop development and the approved Terms of Reference, and the
Federal Ministry of Environment is recognised as the sole regulatory authority on
Environmental Impact Assessment in Nigeria.

Okomu Oil Palm Company Plc: 60TPH Palm Oil Mill Project at Extension Two February 2020
Environmental Impact Assessment (EIA) – Final Report Page 23
CHAPTER TWO
PROJECT JUSTIFICATION
2.1 The Proposal
The Okomu Oil Palm Company Plc stated planting oil palm (Elaeis) at the main estate since
1979. The company later expanded it plantation holdings with additional oil palm plantation
at another site in Ovia Northeast and Uhunmwonde LGA, called Extension Two. It is
envisaged that the capacity of the palm oil mill at the main estate will not be able to absorb
additional fresh fruit bunches coming from Extension Two as more of the new plantings at
both extension Two and the main estate(including Extension One) become mature.
In order to address this problem of capacity limitation, the company proposes to establish
60tons/Hr palm oil mill at Extension Two. As a requirement of the environmental laws and
regulations, a permit application and project description were submitted to the Federal
Ministry of Environment. And based on the initial assessment by the Ministry, the proposed
project was classified as Category Two requiring mandatory EIA studies and a Technical
Review meeting.
2.2 Purpose and Need for the Project
The company in addition acquired an existing plantation of about 6000 hectares with both
mature and immature trees in 2000. The bulk of the new plantings have attained the
harvesting age and the acquired plantation has increasingly been producing FFB in the last
five years. Furthermore to its expansion drive, the company acquired another 11,416.673ha
(Extension two) in 2014 and since been developing the plantation. Given the existing mill
capacity, company is faced with the following challenges as the bulk of the holdings attain
full maturity:
• There is no neighbouring palm oil mill to absorb the excess FFB produced
on the plantations.
• The risk of large quantities of FFB not being harvested and rotting on the
trees.
• The cost of transporting FFB to the main estate for processing is very high
• Loss of value added advantage.
• High prospects of loss of revenue.

Okomu Oil Palm Company Plc: 60TPH Palm Oil Mill Project at Extension Two February 2020
Environmental Impact Assessment (EIA) – Final Report Page 24
In order to overcome these challenges, the Company proposes to establish a 60Tons
FFB/hour palm oil mill to process the excess FFB being harvested from its plantations.
The operation of the palm oil mill would enhance the revenue base of the company and be
of immense economic, social benefit to both proponent and Nigeria as a whole. Invariably,
the proposed project will generate employment to the people directly or indirectly and assist
to further meet its financial obligations and social responsibilities to host communities.
This EIA is being conducted in accordance with the Terms of Reference approved by the
FMEnv (See Annexure I). It covers the range of activities and undertakings at the different
developmental stages of the project from construction to commissioning and
decommissioning.
2.3 Project Justification
Nigeria is the fourth largest producer of palm oil in the world accounting for 3% of global
production. The Nigerian Institute for Oil Palm Research (NIFOR) estimates that upstream
palm oil production is 0.98 million tons.
Groundnut is second largest source of domestic edible oil. With the assumption of 1 million
tons of unshelled groundnut crushed annually, estimated production and consumption of
Groundnut oil per annum is 0.4 million tons. Other oils like Soybean, Cottonseed and Sesame
oil, in total contribute to the production of maximum 0.1m MT. Total domestic edible oil
production is estimated at about 1.5million tons.
Considering Nigeria’s population of about 194m [as per FAOSTAT] and per capita
consumption of 12.5 kg per person per annum against the world average of about 20 kg per
person per annum, estimated annual consumption is 2.4 million tons
(https://www.proshareng.com/news/Agriculture/Fact-File-on-Crude-Palm-Oil-(CPO)-in-
Nig/39032). Hence, Nigeria has deficit of 0.9 million tons worth of more than USD 800
million. The mechanisms to fulfill this gap are.
• Import of refined palm oil / vegetable oil is prohibited and there is a duty of
35% on the import of Crude Palm Oil / Crude Vegetable Oil.
• Creating an enabling environment for the establishment of Palm Oil Mills and
Vegetable oil refineries across the country.
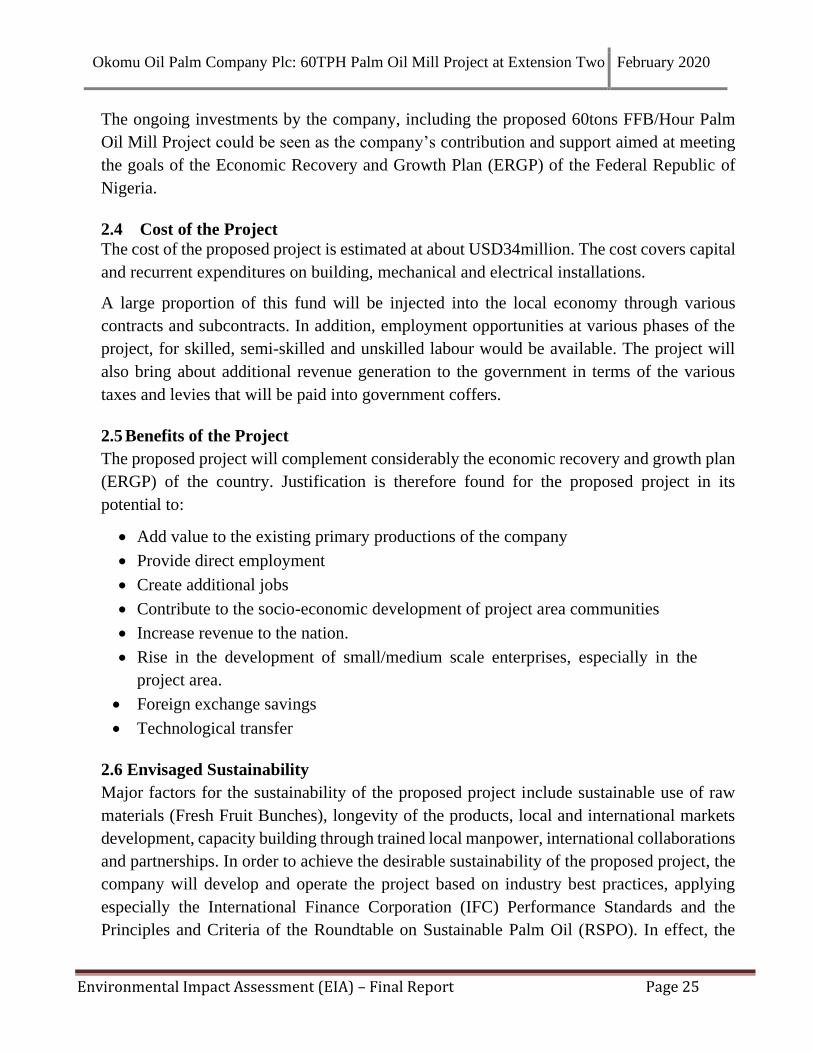
Okomu Oil Palm Company Plc: 60TPH Palm Oil Mill Project at Extension Two February 2020
Environmental Impact Assessment (EIA) – Final Report Page 25
The ongoing investments by the company, including the proposed 60tons FFB/Hour Palm
Oil Mill Project could be seen as the company’s contribution and support aimed at meeting
the goals of the Economic Recovery and Growth Plan (ERGP) of the Federal Republic of
Nigeria.
2.4 Cost of the Project
The cost of the proposed project is estimated at about USD34million. The cost covers capital
and recurrent expenditures on building, mechanical and electrical installations.
A large proportion of this fund will be injected into the local economy through various
contracts and subcontracts. In addition, employment opportunities at various phases of the
project, for skilled, semi-skilled and unskilled labour would be available. The project will
also bring about additional revenue generation to the government in terms of the various
taxes and levies that will be paid into government coffers.
2.5 Benefits of the Project
The proposed project will complement considerably the economic recovery and growth plan
(ERGP) of the country. Justification is therefore found for the proposed project in its
potential to:
• Add value to the existing primary productions of the company
• Provide direct employment
• Create additional jobs
• Contribute to the socio-economic development of project area communities
• Increase revenue to the nation.
• Rise in the development of small/medium scale enterprises, especially in the
project area.
• Foreign exchange savings
• Technological transfer
2.6 Envisaged Sustainability
Major factors for the sustainability of the proposed project include sustainable use of raw
materials (Fresh Fruit Bunches), longevity of the products, local and international markets
development, capacity building through trained local manpower, international collaborations
and partnerships. In order to achieve the desirable sustainability of the proposed project, the
company will develop and operate the project based on industry best practices, applying
especially the International Finance Corporation (IFC) Performance Standards and the
Principles and Criteria of the Roundtable on Sustainable Palm Oil (RSPO). In effect, the

Okomu Oil Palm Company Plc: 60TPH Palm Oil Mill Project at Extension Two February 2020
Environmental Impact Assessment (EIA) – Final Report Page 26
company will strive continually to implement its Health, Safety and Environment Policy. In
so doing, the following aspects of the project sustainability are therefore predicted:
2.6.1 Economic Sustainability
The planning and management of operations and production activities will aim at long-
term financial and economic viability of the project. This will be achieved through sound
operational and management practices to attain high productivity and premium quality of
products.
In addition, the project will be financed from the company’s annual turnover and profits,
which has been impressive and promising in the last five years. The company recorded a
revenue of N8,655,718,000.00 with profit after tax of N1,454,320,000.00 in year 2014. The
financial performance of the company has since improved considerably. For the year ended
31st December 2018, the revenue was N20,257,669,000.00, while the profit after tax was
N8,239,903,000.00.The company is listed on the Nigerian Stock Exchange. The financial
performance of the company over the years would enable it to execute and sustain the
proposed project operations.
2.6.2 Technical Sustainability
The company will leverage on its foreign and local expertise and experience in palm oil
mill construction and operation in Edo State, other parts of Africa and Asia to ensure that
the proposed project enjoys sound technical complements from design to implementation
and operation. Such practices will include adequate practices to safe handling of machines,
equipment, minimizing emissions and in general operating in an environment friendly
manner. They will also effectively protect the environment and its ecological system
through a proper management of the POME generated. In addition, the construction
material will be of the highest quality available. Essentially, best hands and best
management practices will be employed to execute the project. Importantly, all staff and
workers will be competent and adequately trained to ensure the technical sustainability of
the proposed project.
2.6.3 Environmental Sustainability
The on and off-site impacts of the oil mill activities and operations will continually be
assessed and managed. Continuous monitoring of environmental aspects around the
proposed project area will be ensured and maintained through the implementation of the
existing policy to monitor its operational area. In addition, POME will not be discharged
into Surface water and other strategies to reduce air and water pollution will be

Okomu Oil Palm Company Plc: 60TPH Palm Oil Mill Project at Extension Two February 2020
Environmental Impact Assessment (EIA) – Final Report Page 27
implemented. Essentially, the bulk of the solid waste to be generated will be disposed by
recycling in the plantation.
2.6.4 Social Sustainability
An assessment of the social impacts of the proposed project was carried out and the results
and social action plan will be implemented to ensure that the desirable support and
harmony is established between the project and the communities. Necessary mechanisms
will be put in place to facilitate communication with the communities, including proper
documentation and resolution of conflicts and grievances.
2.7 Project Alternatives and Options
The establishment of the proposed project essentially involves the construction and installation
of equipment and facilities to achieve a 60MT FFB/HR capacity. In this section, alternatives
and options to the proposed project are discussed.
2.7.1 Alternative Site
The option of alternative location means establishing a new palm oil mill at a
different location. This option is undesirable because the prospect of acquiring new
land is low. Moreover, establishing a new palm oil mill at a different location could
mean that it would require travelling longer distances to transport FFB from its
estates to this new location and this can be expensive. The advantage of synergy
with the existing plantations will be lost
2.7.2 Alternative Project
This would mean the company embarking on other projects other than the palm oil
mill establishment, given that the mill establishment is another developmental phase
following the establishment of over 11,000ha oil palm plantation. This alternative
would amount to a lack of vision and poor business strategy on the part of the
company.
2.7.3 Alternative Technology
This means adopting a new, non-tested or trusted technology which could lead to
the company incurring more cost in terms of procurement or technology failure
especially considering the life span of the project.
2.7.4 No Project Option
This option would mean that the company should continue to operate without the
option of increasing its CPO production capacity. This option is unacceptable when
one considers the substantial net financial, economic and social benefits that will
accrue to the company, the neighbouring communities and the national economy by
operating the mill.

Okomu Oil Palm Company Plc: 60TPH Palm Oil Mill Project at Extension Two February 2020
Environmental Impact Assessment (EIA) – Final Report Page 28
2.7.5 Delayed Project Option
This option would mean that the bulk of mature FFB coming from other plantation
estates will not be processed, or sourcing for a high capacity oil mill in the
neighbourhood to process the FFB. This will lead to loss in company revenue, less
employment generation and less quality assurance and control on products.
2.7.6 Do Project Option
The establishment of the 60TPH Palm Oil Mill within the Extension Two estate as
proposed is the preferred option which will translate to financial, economic and
social benefits to the company, neighbouring communities and country.

Okomu Oil Palm Company Plc: 60TPH Palm Oil Mill Project at Extension Two February 2020
Environmental Impact Assessment (EIA) – Final Report Page 29
CHAPTER THREE
PROJECT/PROCESS DESCRIPTION
3.1 Brief Project/Process Description
The proposed palm oil mill at Extension Two will lie on about 10.4 hectares (400m x 260m)
in Ovia Northeast Local Government Area. The proposed project of 30MT expandable to
60MT FFB/hr capacity is within the existing Extension two plantation of Okomu Oil Palm
Company Plc, Ovia Northeast/Uhunmwonde Local Government Areas of Edo State.
The proposed project will involve six major civil and mechanical components as follows:
i) Reception Station: The function of this station is to receive the FFB brought from
the plantations in Lorries to the mill for onward delivery for processing.
ii) Sterilization Station: This is where sterilization of the FFB takes place.
Sterilization inactivates the enzymes that promote the formation of Free Fatty
Acid (FFA) and makes easy the fruits loosening from the bunch. It will also break
oil cells in the mesocarp so that oil recovery will be easier.
iii) Oil Mill Processing Line: This will include the following
• Stripping/Threshing Station: This station is for separation of the fruits
from the bunch using a rotary drum.
• Pressing Station: This is for extraction of oil. It comprises Digester unit,
Screw press and conveying equipment.
• Clarification Station: This is for separation of crude palm oil and sludge
to make pure oil.
• Kernel Recovery Station: This station is for nut processing to recover
kernels. It is divided into three processes -
✓ Depericarper - For separating fibre and Nut
✓ Nut Cracking - For separation of kernel and shell
✓ Kernel Drying - For drying wet kernels from about 20% to 1%
moisture content to avoid deterioration while in storage.
iv) Boiler Station: Atmindo boilers of 2 Nos. 20Tons steam/Hour and 1 No. 40Tons
steam/Hour will be installed for 60TPH palm oil mill. The boilers will run entirely
on the solid waste of oil palm including empty fruit bunches (EFB), fibres, shells.
v) Power Generation: 2 Nos. 1200kW Shinko Steam Turbines will be installed to
supply required (500mW) power to the proposed palm oil mill. Diesel Generators

Okomu Oil Palm Company Plc: 60TPH Palm Oil Mill Project at Extension Two February 2020
Environmental Impact Assessment (EIA) – Final Report Page 30
serving the existing residential quarters will serve as backup in case of turbine
breakdown. The generator is about 500m away from the proposed palm oil mill
location.
vi) Palm Oil Mill Effluent (POME) Treatment: The proposed system to treat POME
is Biological treatment with open ponds before it is discharged in to the plantation
field as irrigation water. Proposed sizes of ponds for 30 MT FFB/hr are,
- 1No. Cooling Pond- 92.5 x 53.5 x 2 mtrs deep
- 2Nos. Anaerobic Ponds- 219 x 126.25 x 5 mtrs deep
- 2Nos. Aerobic Ponds-219 x 125.87 x 1.5 mtrs deep
3.2 General Processes of Palm Oil Production
The following description was adapted from
http://www.fao.org/docrep/005/y4355e/y4355e05.htm. Research and development work in
many disciplines - biochemistry, chemical and mechanical engineering - and the
establishment of plantations, which provided the opportunity for large-scale fully
mechanized processing, resulted in the evolution of a sequence of processing steps designed
to extract, from a harvested oil palm bunch, a high yield of a product of acceptable quality
for the international edible oil trade. The oil winning process, in summary, involves the
reception of fresh fruit bunches from the plantations, sterilizing and threshing of the bunches
to free the palm fruit, mashing the fruit and pressing out the crude palm oil. The crude oil is
further treated to purify and dry it for storage.
Large-scale plants, featuring all stages required to produce palm oil to international
standards, are generally handling from 3 to 60 tonnes of FFB/hr. The large installations have
mechanical handling systems (bucket and screw conveyers, pumps and pipelines) and
operate continuously, depending on the availability of FFB. Boilers, fuelled by fibre and
shell, produce superheated steam, used to generate electricity through turbine generators.
The lower pressure steam from the turbine is used for heating purposes throughout the
factory. Most processing operations are automatically controlled and routine sampling and
analysis by process control laboratories ensure smooth, efficient operation. Although such
large installations are capital intensive, extraction rates of 23 - 24 percent palm oil per bunch
can be achieved from good quality Tenera.
Conversion of crude palm oil to refined oil involves removal of the products of hydrolysis
and oxidation, color and flavour. After refining, the oil may be separated (fractionated) into
liquid and solid phases by thermo-mechanical means (controlled cooling, crystallization, and
filtering), and the liquid fraction (olein) is used extensively as a liquid cooking oil in tropical

Okomu Oil Palm Company Plc: 60TPH Palm Oil Mill Project at Extension Two February 2020
Environmental Impact Assessment (EIA) – Final Report Page 31
climates, competing successfully with the more expensive groundnut, corn, and sunflower
oils.
Extraction of oil from the palm kernels is generally separate from palm oil extraction. The
stages in this process comprise grinding the kernels into small particles, heating (cooking),
and extracting the oil using an oilseed expeller or petroleum-derived solvent. The oil then
requires clarification in a filter press or by sedimentation. Extraction is a well-established
industry, with large numbers of international manufacturers able to offer equipment that can
process from 10 kg to several tones per hour.
Alongside the development of these large-scale fully mechanized oil palm mills and their
installation in plantations supplying the international edible oil refining industry, small-scale
village and artisanal processing has continued in Africa. Ventures range in throughput from
a few hundred kilograms up to 8 tones FFB per day and supply crude oil to the domestic
market.
Palm oil processors of all sizes go through these unit operational stages. They differ in the
level of mechanization of each unit operation and the interconnecting materials transfer
mechanisms that make the system batch or continuous. The scale of operations differs at the
level of process and product quality control that may be achieved by the method of
mechanization adopted.
The general flow diagram is presented in Figure 3.1a below:

Okomu Oil Palm Company Plc: 60TPH Palm Oil Mill Project at Extension Two February 2020
Environmental Impact Assessment (EIA) – Final Report Page 32
Palm Oil Processing Unit Operations
Figure 3.1a: General Palm Oil Flow Diagram

Okomu Oil Palm Company Plc: 60TPH Palm Oil Mill Project at Extension Two February 2020
Environmental Impact Assessment (EIA) – Final Report Page 33
3.3 The proposed Oil Mill Processing Line (Process Flow chart
There are several stages of processing the extraction of palm oil from fresh fruit bunches.
These include sterilization, bunch stripping, digestion, oil extraction and finally clarification
and purifications; each process with its own unit operations.
The typical operations that take place during the processing of the EFB at the mill are
described below.
3.3.1 Bunch reception
Post Harvesting
Fresh Fruits Bunches (FFB)/Loose fruits are taking to the reception bay waiting for
processing. The waiting time is not up to 24hrs before they are conveyed to the ramp for
immediate processing. The fresh fruit is normally emptied into wooden boxes suitable
for weighing on a scale so that quantities of fruit arriving at the processing site may be
checked. Large installations use weighbridges to weigh materials in trucks.
The quality standard achieved is initially dependent on the quality of bunches arriving
at the mill. The mill cannot improve upon this quality but can prevent or minimize
further deterioration.
The field factors that affect the composition and final quality of palm oil are genetic, age
of the tree, agronomic, environmental, harvesting technique, handling and transport.
Many of these factors are beyond the control of a small-scale processor. Perhaps some
control may be exercised over harvesting technique as well as post-harvest transport and
handling.
3.3.2 Threshing (removal of fruit from the bunches)
The fresh fruit bunch consists of fruit embedded in spikelet’s growing on a main stem.
Manual threshing is achieved by cutting the fruit-laden spikelet’s from the bunch stem
with an axe or machete and then separating the fruit from the spikelet by hand. Children
and the elderly in the village earn income as casual laborers performing this activity at
the factory site.
In a mechanized system a rotating drum or fixed drum equipped with rotary beater bars
detach the fruit from the bunch, leaving the spikelet on the stem.
Most small-scale processors do not have the capacity to generate steam for sterilization.
Therefore, the threshed fruits are cooked in water. Whole bunches which include
spikelet’s absorb a lot of water in the cooking process. High-pressure steam is more

Okomu Oil Palm Company Plc: 60TPH Palm Oil Mill Project at Extension Two February 2020
Environmental Impact Assessment (EIA) – Final Report Page 34
effective in heating bunches without losing much water. Therefore, most small-scale
operations thresh bunches before the fruits are cooked, while high-pressure sterilization
systems thresh bunches after heating to loosen the fruits.
Small-scale operators use the bunch waste (empty bunches) as cooking fuel. In larger
mills the bunch waste is incinerated and the ash, a rich source of potassium, is returned
to the plantation as fertilizer.
3.3.3 Sterilization of Bunches
Sterilization or cooking means the use of high-temperature wet-heat treatment to loose
fruits. Cooking normally uses hot water; sterilization uses pressurized steam. The
cooking action serves several purposes.
- Heat treatment destroys oil-splitting enzymes and arrests hydrolysis and
autoxidation.
- For large-scale installations, where bunches are cooked whole, the wet heat
weakens the fruit stem and makes it easy to remove the fruit from bunches on
shaking or tumbling in the threshing machine.
- Heat helps to solidify proteins in which the oil-bearing cells are microscopically
dispersed. The protein solidification (coagulation) allows the oil-bearing cells to
come together and flow more easily on application of pressure.
- Fruit cooking weakens the pulp structure, softening it and making it easier to detach
the fibrous material and its contents during the digestion process. The high heat is
enough to partially disrupt the oil-containing cells in the mesocarp and permits oil
to be released more readily.
- The moisture introduced by the steam acts chemically to break down gums and
resins. The gums and resins cause the oil to foam during frying. Some of the gums
and resins are soluble in water. Others can be made soluble in water, when broken
down by wet steam (hydrolysis), so that they can be removed during oil
clarification. Starches present in the fruit are hydrolyzed and removed in this way.
- When high-pressure steam is used for sterilization, the heat causes the moisture in
the nuts to expand. When the pressure is reduced the contraction of the nut leads to
the detachment of the kernel from the shell wall, thus loosening the kernels within
their shells. The detachment of the kernel from the shell wall greatly facilitates later
nut cracking operations. From the foregoing, it is obvious that sterilization
(cooking) is one of the most important operations in oil processing, ensuring the
success of several other phases.

Okomu Oil Palm Company Plc: 60TPH Palm Oil Mill Project at Extension Two February 2020
Environmental Impact Assessment (EIA) – Final Report Page 35
However, during sterilization it is important to ensure evacuation of air from the
sterilizer. Air not only acts as a barrier to heat transfer, but oil oxidation increases
considerably at high temperatures; hence oxidation risks are high during sterilization.
Over-sterilization can also lead to poor bleach ability of the resultant oil. Sterilization is
also the chief factor responsible for the discoloration of palm kernels, leading to poor
bleach ability of the extracted oil and reduction of the protein value of the press cake.
3.3.4 Digestion of the Fruit
Digestion is the process of releasing the palm oil in the fruit through the rupture or
breaking down of the oil-bearing cells. The digester commonly used consists of a steam-
heated cylindrical vessel fitted with a central rotating shaft carrying a number of beater
(stirring) arms. Through the action of the rotating beater arms the fruit is pounded.
Pounding, or digesting the fruit at high temperature, helps to reduce the viscosity of the
oil, destroys the fruits’ outer covering (exocarp), and completes the disruption of the oil
cells already begun in the sterilization phase. Unfortunately, for reasons related to cost
and maintenance, most small-scale digesters do not have the heat insulation and steam
injections that help to maintain their contents at elevated temperatures during this
operation.
Contamination from iron is greatest during digestion when the highest rate of metal wear
is encountered in the milling process. Iron contamination increases the risk of oil
oxidation and the onset of oil rancidity.
3.3.5 Pressing (Extracting the palm oil)
There are two distinct methods of extracting oil from the digested material. One system
uses mechanical presses and is called the ‘dry’ method. The other called the ‘wet’
method uses hot water to leach out the oil.
In the ‘dry’ method the objective of the extraction stage is to squeeze the oil out of a
mixture of oil, moisture, fibre and nuts by applying mechanical pressure on the digested
mash. There are a large number of different types of presses but the principle of
operation is similar for each. The presses may be designed for batch (small amounts of
material operated upon for a time period) or continuous operations.
3.3.6 Batch Presses
In batch operations, material is placed in a heavy metal ‘cage’ and a metal plunger is
used to press the material. The main differences in batch press designs are as follows: a)

Okomu Oil Palm Company Plc: 60TPH Palm Oil Mill Project at Extension Two February 2020
Environmental Impact Assessment (EIA) – Final Report Page 36
the method used to move the plunger and apply the pressure; b) the amount of pressure
in the press; and c) the size of the cage.
The plunger can be moved manually or by a motor. The motorized method is faster but
more expensive.
Different designs use either a screw thread (spindle press) or a hydraulic system
(hydraulic press) to move the plunger. Higher pressures may be attained using the
hydraulic system but care should be taken to ensure that poisonous hydraulic fluid does
not contact the oil or raw material. Hydraulic fluid can absorb moisture from the air and
lose its effectiveness and the plungers wear out and need frequent replacement. Spindle
press screw threads are made from hard steel and held by softer steel nuts so that the
nuts wear out faster than the screw. These are easier and cheaper to replace than the
screw.
The size of the cage varies from 5 kg to 30 kg with an average size of 15 kg. The pressure
should be increased gradually to allow time for the oil to escape. If the depth of material
is too great, oil will be trapped in the center. To prevent this, heavy plates’ can be
inserted into the raw material. The production rate of batch presses depends on the size
of the cage and the time needed to fill, press and empty each batch.
Hydraulic presses are faster than spindle screw types and powered presses are faster than
manual types. Some types of manual press require considerable effort to operate and do
not alleviate drudgery.
3.3.7 Continuous Systems
The early centrifuges and hydraulic presses have now given way to specially designed
screw-presses similar to those used for other oilseeds. These consist of a cylindrical
perforated cage through which runs a closely fitting screw. Digested fruit is continuously
conveyed through the cage towards an outlet restricted by a cone, which creates the
pressure to expel the oil through the cage perforations (drilled holes). Oil-bearing cells
that are not ruptured in the digester will remain unopened if a hydraulic or centrifugal
extraction system is employed. Screw presses, due to the turbulence and kneading action
exerted on the fruit mass in the press cage, can effectively break open the unopened oil
cells and release more oil. These presses act as an additional digester and are efficient in
oil extraction.

Okomu Oil Palm Company Plc: 60TPH Palm Oil Mill Project at Extension Two February 2020
Environmental Impact Assessment (EIA) – Final Report Page 37
Moderate metal wear occurs during the pressing operation, creating a source of iron
contamination. The rate of wear depends on the type of press, method of pressing, nut-
to-fibre ratio, etc. High pressing pressures are reported to have an adverse effect on the
bleach ability and oxidative conservation of the extracted oil.
The advantages of the screw press over the hydraulic press are detailed below:
➢ Continuous operation – hence, less labour required; the screw press was a
‘batch’ process;
➢ Higher throughput – hence, less investment in buildings and machinery;
➢ Less power required for a given throughput;
➢ Nut/fiber separation is easier because of the lower oil content after pressing;
➢ Screw presses can handle a wide range of throughput rates.
3.3.8 Clarification and Drying of Oil
The main point of clarification is to separate the oil from its entrained impurities. The
fluid coming out of the press is a mixture of palm oil, water, cell debris, fibrous material
and ‘non-oily solids’. Because of the non-oily solids the mixture is very thick (viscous).
Hot water is therefore added to the press output mixture to thin it. The dilution (addition
of water) provides a barrier causing the heavy solids to fall to the bottom of the container
while the lighter oil droplets flow through the watery mixture to the top when heat is
applied to break the emulsion (oil suspended in water with the aid of gums and resins).
Water is added in a ratio of 3:1.
The diluted mixture is passed through a screen to remove coarse fibre. The screened
mixture is boiled from one or two hours and then allowed to settle by gravity in the large
tank so that the palm oil, being lighter than water, will separate and rise to the top. The
clear oil is decanted into a reception tank. This clarified oil still contains traces of water
and dirt. To prevent increasing FFA through autocatalytic hydrolysis of the oil, the
moisture content of the oil must be reduced to 0.15 to 0.25 percent. Re-heating the
decanted oil in a cooking pot and carefully skimming off the dried oil from any
engrained dirt removes any residual moisture. Continuous clarifiers consist of three
compartments to treat the crude mixture, dry decanted oil and hold finished oil in an
outer shell as a heat exchanger.
The wastewater from the clarifier is drained off into nearby sludge pits dug for the
purpose. No further treatment of the sludge is undertaken in small mills. The
accumulated sludge is often collected in buckets and used to kill weeds in the processing
area.

Okomu Oil Palm Company Plc: 60TPH Palm Oil Mill Project at Extension Two February 2020
Environmental Impact Assessment (EIA) – Final Report Page 38
3.3.9 Oil Storage
In large-scale mills the purified and dried oil is transferred to a tank for storage prior to
dispatch from the mill. Since the rate of oxidation of the oil increases with the
temperature of storage the oil is normally maintained around 50°C, using hot water or
low-pressure steam-heating coils, to prevent solidification and fractionation. Iron
contamination from the storage tank may occur if the tank is not lined with a suitable
protective coating.
Small-scale mills simply pack the dried oil in used petroleum oil drums or plastic drums
and store the drums at ambient temperature.
3.3.10 Kernel Recovery
The residue from the press consists of a mixture of fibre and palm nuts. The nuts are
separated from the fibre by hand in the small-scale operations. The sorted fibre is
covered and allowed to heat, using its own internal exothermic reactions, for about two
or three days. The fibre is then pressed in spindle presses to recover a second grade
(technical) oil that is used normally in soap-making. The nuts are usually dried and sold
to other operators who process them into palm kernel oil. The sorting operation is usually
reserved for the youth and elders in the village in a deliberate effort to help them earn
some income.
Large-scale mills use the recovered fibre and nutshells to fire the steam boilers. The
super-heated steam is then used to drive turbines to generate electricity for the mill. For
this reason it makes economic sense to recover the fibre and to shell the palm nuts. In
the large-scale kernel recovery process, the nuts contained in the press cake are separated
from the fibre in a depericarper. They are then dried and cracked in centrifugal crackers
to release the kernels. The kernels are normally separated from the shells using a
combination of winnowing and hydro cyclones. The kernels are then dried in silos to a
moisture content of about 7 percent before packing.
During the nut cracking process some of the kernels are broken. The rate of FFA increase
is much faster in broken kernels than in whole kernels. Breakage of kernels should
therefore be kept as low as possible, given other processing considerations.
3.3.11 Traditional Method of Palm Oil Processing
The village traditional method of extracting palm oil involves washing pounded fruit
mash in warm water and hand squeezing to separate fibre and nuts from the oil/water
mixture. A colander, basket or a vessel with fine perforated holes in the bottom is used

Okomu Oil Palm Company Plc: 60TPH Palm Oil Mill Project at Extension Two February 2020
Environmental Impact Assessment (EIA) – Final Report Page 39
to filter out fibre and nuts. The wet mixture is then put on the fire and brought to a
vigorous boil. After about one or two hours, depending on the volume of material being
boiled, the firewood is taken out and the boiled mixture allowed to cool. Herbs may be
added to the mixture at this point just before reducing the heat. On cooling to around
blood temperature, a calabash or shallow bowl is used to skim off the palm oil. Because
of the large quantities of water used in washing the pulp this is called the ‘wet’ method.
3.3.12 Processing and Use
Refining
After milling, various palm oil products are made using refining processes. First
is fractionation, with crystallization and separation processes to obtain solid (stearin),
and liquid (olein) fractions. Then melting and degumming removes impurities. Then the
oil is filtered and bleached. Physical refining removes smells and coloration to produce
"refined, bleached and deodorized palm oil" (RBDPO) and free sheer fatty acids which
are used in the manufacture of soaps, washing powder and other products. RBDPO is
the basic palm oil product sold on the world's commodity markets. Many companies
fractionate it further to produce palm olein for cooking oil, or process it into other
products.
Red palm oil
Since the mid-1990s, red palm oil has been cold-pressed and bottled for use as cooking
oil, and blended into mayonnaise and salad oil.
Antioxidants
Red palm oil antioxidants like tocotrienols and carotenes are added to foods and
cosmetics because of their purported health benefits.
Butter and Trans Fat Substitute
The highly saturated nature of palm oil renders it solid at room temperature in temperate
regions, making it a cheap substitute for butter or trans fats in uses where solid fat is
desirable, such as the making of pastry dough and baked goods. A recent rise in the use
of palm oil in the food industry has partly come from changed labelling requirements
that have caused a switch away from using trans fats. Palm oil has been found to be a
reasonable replacement for trans fats; however, a small study conducted in 2009 found
that palm oil may not be a good substitute for trans fats for individuals with already-
elevated LDL levels.

Okomu Oil Palm Company Plc: 60TPH Palm Oil Mill Project at Extension Two February 2020
Environmental Impact Assessment (EIA) – Final Report Page 40
Biomass and Bio-energy
Palm oil is used to produce both methyl ester and hydro deoxygenated biodiesel. Palm
oil methyl ester is created through a process called Trans-esterification. Palm oil
biodiesel is often blended with other fuels to create palm oil biodiesel blends. Palm oil
biodiesel meets the European EN 14214 standard for biodiesels.
The organic waste matter that is produced when processing palm oil, including oil palm
shells and oil palm fruit bunches can also be used to produce energy. This waste material
can be converted into pellets that can be used as a biofuel. Additionally, palm oil that
has been used to fry foods can be converted into methyl esters for biodiesel. The used
cooking oil is chemically treated to create a biodiesel similar to petroleum diesel.
Kernel Drying
Fresh kernels have a moisture content of about 20% and cannot be stored without
deterioration. Drying is usually done in a silo. The fresh kernels are fed in at the top,
warm air is blown upwards from below and dry kernels (7% moisture) are removed at
the base. The kernels can also be steam-sterilized for 5-6 minutes before drying and the
FFA of the kernel oil will then remain below 1% after storage for 6 months or more.

Okomu Oil Palm Company Plc: 60TPH Palm Oil Mill Project at Extension Two February 2020
Environmental Impact Assessment (EIA) – Final Report Page 41
Figure 3.1b: Flowchart for the Proposed Extraction of Crude Palm Oil

Okomu Oil Palm Company Plc: 60TPH Palm Oil Mill Project at Extension Two February 2020
Environmental Impact Assessment (EIA) – Final Report Page 42
3.4 The Proposed Palm Oil Mill
The design, manufacture, supply, installation and commissioning of the proposed palm oil
mill of capacity 30MT expandable to 60MT FFB/hr with conventional type double door
horizontal sterilizers is by Besteel Berhad, Malaysia.
The plant is designed for a useful life of about 30 years once it is operated and maintained
according to the manufacturers’ instructions.
The technical drawings of the proposed palm oil mill are presented in Table 3.2 to Table
3.8 below.

Okomu Oil Palm Company Plc: 60TPH Palm Oil Mill Project at Extension Two February 2020
Environmental Impact Assessment (EIA) – Final Report Page 43
Figure 3.2: Foundation Layout for Palm Oil Mill

Okomu Oil Palm Company Plc: 60TPH Palm Oil Mill Project at Extension Two February 2020
Environmental Impact Assessment (EIA) – Final Report Page 44
Figure 3.3: Machinery Arrangement for Sterilizer Station

Okomu Oil Palm Company Plc: 60TPH Palm Oil Mill Project at Extension Two February 2020
Environmental Impact Assessment (EIA) – Final Report Page 45
Figure 3.4: Machinery Arrangement for Threshing Station

Okomu Oil Palm Company Plc: 60TPH Palm Oil Mill Project at Extension Two February 2020
Environmental Impact Assessment (EIA) – Final Report Page 46
Figure 3.5: Machinery Arrangement for Pressing

Okomu Oil Palm Company Plc: 60TPH Palm Oil Mill Project at Extension Two February 2020
Environmental Impact Assessment (EIA) – Final Report Page 47
Figure 3.6: Machinery Arrangement for Depricarping Station

Okomu Oil Palm Company Plc: 60TPH Palm Oil Mill Project at Extension Two February 2020
Environmental Impact Assessment (EIA) – Final Report Page 48
Figure 3.7: Machinery Arrangement for Kernel Plant

Okomu Oil Palm Company Plc: 60TPH Palm Oil Mill Project at Extension Two February 2020
Environmental Impact Assessment (EIA) – Final Report Page 49
Figure 3.8: Machinery Arrangement for Boiler Station

Okomu Oil Palm Company Plc: 60TPH Palm Oil Mill Project at Extension Two February 2020
Environmental Impact Assessment (EIA) – Final Report Page 50
3.5 Mill Processing Line Mechanical Components
The mechanical components of the proposed mill processing line are presented in Table 3.1
below.
Table 3.1: Processing Line Mechanical Components
item Description Specification
LR FRUIT RECEPTION STATION
LR 1 Weighbridge 80 T X 2 Nos.
LR 2.a FFB Loading Ramp c/w Hydraulic System 12 bay x 24 door with power pack
LR 3 FFB cages 7.5 Ton each x 60nos
LR 4 Transfer carriage 2 Nos
LR 5 &6 Capstan /Winch & Bollard 11nos
LR 7 Transfer carriage pit pump 5M3,2.2Kw x 2
LR 8 Rail track System 9 sets as per drawing
LR 9 Dirt Conveyor below FFB conveyor 300mm dia x 63000mm long
ST STERILIZATION STATION
ST 1 Horizontal sterilizer 2700mm dia x 18400mm long X 4Nos.
ST 2 Sterilizer manual control As per Drawing
ST 3 Blow-down chamber 2nos, as per drawing
ST 4 Sterilizer Pit Pump 5m3/hr at 10m head, 2.2kw
ST 5 Sterilized Condensate Collection Pump 35m3/hr at 30m head, 7.5kw
ST 6 All interconnection Platform & Staircase As per drawing
ST 7 Cage trolley 1no
TH THRESHING STATION
TH 1 Sterilized Fruit Bunch (SFB) Conveyor 1.2M (W) x 32.0M
TH 2 Thresher Drum Ø 2.0m x 5.86m(L) Shaftless Type x 2
TH 3 Bottom Thresher Conveyor Ø 500mm x 9000mm (L) X2
TH 4 Bottom cross conveyor Ø 500mm x 9000mm (L)
TH 5 Horizontal Empty Bunch Conveyor 750mm (W) x 36.0M (L)
TH 6 Inclined Empty Bunch Conveyor 750mm (W) x 62.0M (L)
TH 7 Empty Bunch Conveyor structure & chute 1 set
TH 8 Thresher Structures & Platform For install 2 unit thresher drum
TH 9 Tippler c/w Hopper & shuttle door As per Spec Sheets
TH 10 Tippler pit pump 5m3/hr at 10m head, 2.2kw
PS PRESSING STATION
PS 1 Fruit Elevator 800WD x 14.0m (L) x2
PS 2 Top Cross Conveyor Ø 600mm x 7000mm (L)
PS 3 Digesters Feeding Conveyor c/w manual
rack & pinion
Ø 500mm x 17000mm (L)
PS 4 Excess fruitlet chutes M.S 500 S.QX8000mm L
PS 5 Excess Fruit Conveyor/Return Conveyor Ø 500mm x 16000mm (L)
PS 6 Digester 4.0 m3 X3
PS 7 Screw Press P 15 (Modiplam) x3
PS 8 Press Hot Water Tank M.S 6mmt (6m3)
PS 9 “V” Notch Dilution Tank M.S 4.5mmt (200 Litre)

Okomu Oil Palm Company Plc: 60TPH Palm Oil Mill Project at Extension Two February 2020
Environmental Impact Assessment (EIA) – Final Report Page 51
PS 10 Crude Oil Gutter S.S 304 Sch10 Ø 250 Pipe x 0.0M (L)
PS 11 Sand Trap Tank M.S 6mmt (7m3) x2
PS 12 Vibrating Screen Ø 60” Double Deck x2
PS 13 Screen Reject Conveyor Ø 250mm x 10000mm x(L)
PS 14 Crude Oil Tank M.S 6mmt (10m3)
PS 15 Crude Oil Pump 35m3/hr at 30m head, 7.5kw x2
PS 16 Crude Oil Vibrating Screen Platform To install 2 units
PS 17 Pressing Station Structures & Platform To install 3 units
DS DEPERICARPING STATION
DS 1 Cake Breaker Conveyor c/w Steam Jacket,
Steam trap and Catwalk
Ø 750m x 24000mm (L)
DS 2 Depericarper As per Drawing
DS 3 Nut Polishing Drum Shaftless Ø 1.0m x 6.0m (L)
DS 4 Pneumatic Fibre Transport Ducting As per drawing
DS 5 Fibre Cyclone Ø 2300mm
DS 6 Fibre Cyclone Fan & Ducting As per Drawing
DS 7 Fibre Cyclone Airlock Ø 750mm
DS 8 Inclined Wet Nut Conveyor Ø 300mm x 7000mm (L)
DS 9 Fibre/Shell Cyclone Supporting Structure As per Drawing
KS KERNEL RECOVERY PLANT
KS 1 Wet Nut Elevator 400mm (W) x 9000mm (L)
KS 2 Nut Hopper c/w Fan and heater M.S 3 compartments X 30M3 each
KS 3 Ripple Mills 6 Ton /HrX3
KS 4 Cracked Mixture Conveyor No.1 (Below
Ripple Mill)
Ø 300mm x 8000mm (L)
KS 5 Cracked Mixture Conveyor No.2 Ø 300mm x 8000mm (L)
KS 6 Cracked Mixture Elevator 450mm (W) x 12800mm (L)
KS 7 Primary Stage Winnower Cyclone 6MT cracked mixture/hr
KS 8 Primary Stage Winnower Fan & Ducting 6MT cracked mixture/hr
KS 9 Primary Stage Winnower Airlock Ø 400mm x2
KS13 Hydrocyclones 2 stage
KS 14 Wet Kernel conveyor 300mmdia x 6000mm (L)
KS 15 Kernel elevator 400mm (W) x 10000mm (L)
KS 16 Kernel distributing conveyor Ø 300mm x 9000mm (L)
KS 17 Kernel Drying Silos c/w Fan & Heater M.S (45m3 each) x2
KS 18 Bottom Dried Kernel Conveyor Ø 300mm x 10000mm (L)
KS 19 Dried Kernel Transport System 3mt dried kernel/hr
KS 20 Top distribution Dried Kernel Conveyor Ø 300mm x 12000mm (L)
KS 21 Kernel Bulk Silo c/w Support Roofing M.S 300T eachX2
KS 22 Kernel Recovery Station Structure and
Platform
As per drawing
KS 23 Wet shell Conveyor Ø 300mm x 13000mm (L)
KS 24 Wet shell Elevator 450mm (W) x 10000mm (L)
CS CLARIFICATION STATION
CS 1 Crude Oil Buffer Tank M.S 6mmt
CS 2 Oil Clarifier M.S (120m3)
CS 3 Pure Oil tank M.S (30m3)

Okomu Oil Palm Company Plc: 60TPH Palm Oil Mill Project at Extension Two February 2020
Environmental Impact Assessment (EIA) – Final Report Page 52
CS 4 Pure Oil Pump 30m3/hr at 70m head, 11kw X2
CS 6 Atmospheric Drier c/w Pump sets As per Drawing
CS 7 Oil Production Pump 15m3/hr at 70m head, 7.5kw
CS 8 Sludge Tank M.S (30m3)
CS 9 Pre-cleaner Pump 30m3/hr at 30m head , 7.5kwX3
CS 10 Pre-cleaner 45M3/hr
CS 11 Pre-cleaner Sand Collection Tank M.S 6mmt
CS 12 Overhead Sludge Buffer tank M.S 6mmt
CS 15 Sludge centrifuge 6000L/hr X3
CS 16 Light Phase Recycle Tank M.S 6mmt
CS 17 Light Phase Pump 35m3/hr at 30m head, 7.5kw x2
CS 18 Reclaim Oil Tank M.S 6mmt (6m3)
CS 19 Reclaim Oil Pump ( to crude oil buffer
tank)
35m3/hr at 30m head, 7.5kw x2
CS 21 Sludge Drain Tank M.S 6mmt, 14m3
CS 22 Fat pit tank MS 8mmt
CS 23 Fat pit pump 35m3/hr at 30m head, 7.5kw x2
CS 24 Structure and Platform support As per Drawing
SB SHELL BUNKER
SB 1 Shell Hopper M.S (30m3)
SB 2 Dry Shell &fibre Conveyor Ø 600mm x 19000mm (L)
BH Boiler Station
BH 1 Fuel distribution conveyor 750mm (W) x 36000mm (L)
BH 2 Platform for the above As per Drawing
BH 3 Excess fuel conveyor 600mm (W) x 44000mm (L)
BH 4 Excess fuel recycled conveyor 750mm (W) x 48000mm (L)
BH 5 Steam Boiler, Atmindo 20T.hrX2
BH 6 Cation & Anion Exchanger 30m3/hr
BH 7 Demin booster pump 30m3/hr at 25m head, 5.5kw x2
BH 8 Feed water tank MS 100m3
BH 10 Vacuum deaerator c/w chemical dozing As per Drawing
PH Power House
PH 1 Steam Turbine 1200KW x2
PH 2 Steam Separator As per Drawing
PH 3 Back pressure vessel MSØ 1200mm x 6000mm (L)
PH 4 Diesel Generator 1 1500KVA
PH 5 Diesel Generator 2 150KVA
PH 6 Diesel skid tank MS 20,000ltrs
PH 7 Diesel Day tank MS 2m3
PH 8 Diesel skid pump 3m3/hr at 5m head, 1.5Kw
RW RAW WATER TREATMENT PLANT
RW 2 Reservoir pipe work GI 500mtrs
RW 3 Raw water chemical dosing system 0.25 kw (Dosing) 0.18kw (Stirrer) x2
RW 4 Water clarifier tanks M.S (120m3/hr)
RW 5 Clarified water storage tank M.S 3000m3
RW 6 Pressure sand filters As per Drawing
RW 7 Pressure sand filters pumps 60m3/hr at 20m head, 11kw x2

Okomu Oil Palm Company Plc: 60TPH Palm Oil Mill Project at Extension Two February 2020
Environmental Impact Assessment (EIA) – Final Report Page 53
RW 8 Interconnection piping c/w valve Dosing, drain and filter
RW 11 Main water pump 30m3/hr at 25m head, 5.5kw x2
ET Effluent Treatment
ET 1 Sludge pit pump 35m3/hr at 35m head, 7.5kw x2
ET 2 Sludge recovery tank M.S 100m3
ET 3 Effluent Piping HDPE, 500mtrs
OS Oil Storage Despatch Area
OS 1 Oil storage tank 1 Ms 3000Mt X2
OS 2 Oil storage tank2 ( Day oil Tank) Ms 200MTX2
OS 3 Oil despatch pump 100m3/hr at 25m head, 18.5kw x2
OS 4 Oil recycle pump 20m3/hr at 30m head, 5.5kw
PW PIPING AND VALVES WORK FOR
PROCESSING
PW 1 Water- Cold and Hot G.I / SGP Pipe
PW 2 Steam- High, Low pressure and
Condensate
API Pipe
PW 3 Crude Oil and Sludge and Oil S.S 304 , API/ SGP Pipe
PW 4 Diesel API / SGP Pipe
PW 5 Compressed Air API / SGP Pipe
PW 6 Oil Recycle S.S 304 / API / SGP Pipe
AW ANCILLARY WORK
AW 1 Insulation As per drawing
AW 2 Painting As per drawing
AW 3 Lubricant As per drawing
AW 4 Motor cover and base motor frame As per drawing
AW 5 Inter connection station platform As per drawing
FF FIRE FIGHTING SYSTEM
FF 1 Firefighting diesel pump set 100m3/hr at 40m head, 30kw
FF 2 Hose reel, quick coupling and plain jet As per Spec Sheets
FF 3 Hydrant Piping System As per Spec Sheets
FF 4 Fire Extinguisher As per Spec Sheets
WI BOREHOLE WATER INTAKE
WI 2 Pipeline 6”dia HDPE,1000M

Okomu Oil Palm Company Plc: 60TPH Palm Oil Mill Project at Extension Two February 2020
Environmental Impact Assessment (EIA) – Final Report Page 54
3.6 Safety Devices
There are two safety switches on each machine including the sterilizer. The first can be used
manually as a safety button to stop the machine and the ancillary machines. The second one
is triggered off automatically by the machine if the operations limits are exceeded. Also, on
each critical machine a reverse button is installed. Some of the critical machines have safety
provisions as follows:
Oil Mill Machines and Component:
Sterilizer Emergency switch
Tipper Emergency switch
Thresher Emergency switch
Press Emergency switch
Clarification Machine Emergency switch
3.7 Steam Boiler
A boiler can be defined as a closed vessel in which water or other fluid is heated under
pressure. This fluid is then circulated out of the boiler for use in various processes or power
generation. In the case of power generation, steam is taken out of the steam boiler at very
high pressure and temperature.
Steam boilers are used where steam and hot steam is needed. Hence, steam boilers are used
as generators to produce electricity in the energy business. Besides, steam boilers are used
in many different application areas in the industry, for example in heating systems or
for cement production, steam boilers are also used in agriculture as well for soil steaming.
Boiler Types
Boiler systems are classified in a variety of ways. They can be classified according to the
end use, such as foe heating, power generation or process requirements. Or they can be
classified according to pressure, materials of construction, size tube contents (for example,
waterside or fireside), firing, heat source or circulation. Boilers are also distinguished by
their method of fabrication. Accordingly, a boiler can be packaged or field erected.
Sometimes boilers are classified by their heat source. For example, they are often referred
to as:
• Coal fired boilers
• Oil fired boilers
• Gas fired boilers
• Multi-fuel fired
• Industrial waste fired boilers
• Biomass fired boilers

Okomu Oil Palm Company Plc: 60TPH Palm Oil Mill Project at Extension Two February 2020
Environmental Impact Assessment (EIA) – Final Report Page 55
The proposed steam boilers are Atmindo boiler of 2X20 tons per hour capacity. It is a waste
fired steam boiler. The boiler would comprise Atmindo Bi-drum Model SFBW 20-SH-PG
Air cooled Fix Pinhole Grate boiler having the capacity to evaporate 2X20,000 kg/hr at 22
bar (g) MCR, 280oC steam when fired with palm waste fuel and drum working pressure of
25 bar (g).
The pressure parts of the boiler would be carried in a substantial structural steel frame to
support the boiler fabric with due provision for thermal expansion between the pressure
parts and supporting structure and the refractory and brickwork setting. The name and
address of the manufacturers are as follows:
PT AtmindoTbk
J1.Sei Belumai Km.2,4 No 30-40
Desa Dagang Kelambir
Tanjung Morawa 20362,
North Sumantera,
Indonesia.
The specific technical information on the boiler is presented in Table 3.2.
Table 3.2: Steam Boiler Technical Information
Description Details
Boiler Data SFBW 20-SH-PG
Application 1+1 (W+S)
Installation In the premise of the oil mill processing line
Quality Designed to operate under tropical conditions, i.e. hot,
25-40oC, and humid, 80-90%
Electric Motors Tropicalized
Induced Drought Fan Frequency converter to limit the start Amps
Mass Flow 4523 kg/hr
Pressure MCR 22 bar (g)
Steam Pressure 25 bar (g)
Steam Output 20 ton/hr
Temperature 2800C

Okomu Oil Palm Company Plc: 60TPH Palm Oil Mill Project at Extension Two February 2020
Environmental Impact Assessment (EIA) – Final Report Page 56
3.8 Civil Structures
The major civil structures of the palm oil mill Project are listed in Table 3.3 below.
Table 3.3: Major Equipment and Structures of the project
S/No. Item Specification
1 FFB Reception Station RCC/Steel Structure
2 Sterilizer Station Steel Structure
3 Processing Line Steel structure
4 Boiler House Steel Structure
5 Water Treatment House Steel Structure
6 Empty bunch yard RCC
7 Storage tanks RCC/Steel Structure
8 Ash Yard Open Field
9 Effluent Lagoon Earth Pond with lining
3.9Mill Features and Facilities
The main mill features and facilities are described in Table 3.4 below.
Table 3.4: Mill Features and Facilities
Component Description
FFB Storage The 12 bay FFB hoppers with hydraulic doors (24) for the 1500MT storage of
FFB prior to processing
Workshop The workshop provides back-up repairs and maintenance services for the mill
plant and machinery.
Power Supply The power requirement of the mill will be produced in house and back up with
industrial diesel generators
i) Turbine – 1200kW x 2nos
ii) Diesel Generator – 1500 kVA – To generate a total of 1.5mW
iii) Diesel Generator – 150 kVA
Water Supply
The process water requirement is 0.7m³ per ton of FFB will be sourced from 4
Nos. boreholes in the mill complex. The water supply system involves the
extraction of water from the bore holes with electrical pumps. The raw water is
pumped into an overhead water tank.
The water tank is also equipped with an automatic level switch, which turns on
and off to maintain a constant water level. Water is fed into the processing line
by gravity. The storage tank is also equipped with a flow meter to monitor and
record water use and safety ladder for ease of maintenance.
Weighbridge Proposing two (2 Nos.) weighbridge of 80 Tons capacity each with features
including computers and control panels.
Laboratory/Admin
Office
The laboratory/Admin office building is proposed within the mill office
building. The building provides accommodation for the quality control
laboratory and offices for the mill administration. The laboratory performs
essentially quality control and quality assurance operations and is equipped with

Okomu Oil Palm Company Plc: 60TPH Palm Oil Mill Project at Extension Two February 2020
Environmental Impact Assessment (EIA) – Final Report Page 57
Component Description
the appropriate equipment, machines and apparatus. The major laboratory
equipment includes oil extractor and centrifuge.
Tank Farm The finished product (CPO) will be stored in the Tank Farm. Two (2 Nos.)
storage tanks of 3000 tons each were proposed.
Communication Proposing four communication systems to facilitate operations and handle
emergencies as follows:
Local Intranet – for internal communication (between the different offices)
VHF Handset – for internal communication
Internet System – for external communication
GSM – for both internal and external communication.
Safety Devices For the proposed project, all the machines would have their dangerous parts
protected. Each machine would also have two safety switches including manual
stop button and automatic stop button. In addition, critical machines will have
reverse buttons installed.
3.10 Sizing of the Palm Oil Mill
3.10.1 Quantity of FFB to be processed
The proposed capacity of the existing mill is 30 MT FFB/hour. The capacity utilization will
rise gradually, as more plantation area becomes mature. The proposed sizing of the mill is
based on the following:
3.10.2 Throughput
o 60 tons FFB/hour
o 1200 tons/day [Average 20 h/d]
o 220,000 tons/year
3.02.3 Capacity Utilization per Year
o 2021 : 200,000 tons FFB
o 2022 : 220,000 tons FFB
o 2023 : 268,000 tons FFB
3.10.4 Finished Products
CPO
o 2021 : 42,000 tons
o 2022 : 46,000 tons
o 2023 : 56,000 tons

Okomu Oil Palm Company Plc: 60TPH Palm Oil Mill Project at Extension Two February 2020
Environmental Impact Assessment (EIA) – Final Report Page 58
PK
o 2021 : 8,000 tons
o 2022 : 8,800 tons
o 2023 : 11,000 tons
3.11 Installation & Commissioning
The equipment manufacturers and suppliers will be responsible for setting up and
commissioning the mill plant and machinery. These activities include:
• Providing detailed drawings of mill’s pre-installation requirements for
foundations, structures, elevations, layout etc.
• General arrangements for all the plant and machinery in the processing hall
together with installation pre-requirements
• On-site testing
• Instructions and training to users and maintenance technicians
3.11.1 Plant Installation and Construction Engineers
The installation and construction engineering companies are:
• Kalleen-Tech Nigeria Limited
km 20, Benin-Sapele Rd,
Benin City,
Edo State.
• Fredson Global Ventures.
5, Alhaji Street, Ladega B/stop,
Ikorodu, Lagos.
• Wilka Associates
6, Akpakpava Rd.,
Benin City, Edo State
• BesteelBerhad
Lot 968, Kawasan Perindustrian,
Desa Aman, 47000,
Sungai Buloh, Malasia.

Okomu Oil Palm Company Plc: 60TPH Palm Oil Mill Project at Extension Two February 2020
Environmental Impact Assessment (EIA) – Final Report Page 59
3.12 Description of the Site
The proposed project is to be constructed in extension 2 plantation area near Tango 1 Gate.
Effluent ponds are also proposed besides the project.
3.13 Water Treatment Process
The water treatment process (Water treatment plant) is designed to ensure the desirable water
quality for boiler feed water and auxiliary quality water needs. The existing water treatment
source will service the proposed boiler.
3.14 Water Supply and Drainage System Facility
Water supply and drainage system facility will be designed in relation to water source;
circulating water system; make-up water system; service water system; water supply and
drainage of the entire mill complex.
Domestic water supply system is fed from domestic water supply system. Water supply and
drainage systems include: domestic water supply; storm water drainage, domestic sewage and
wastewater drainage.
3.15 Firefighting System
The existing fire prevention and control system includes water firefighting system, hydrant, as
well as fire extinguishers installations. Water firefighting system is responsible for the
firefighting of the mill, oil tank area, auxiliary and associated buildings.
3.16 Emissions Control Facilities
All emission control facilities will be provided, especially at the steam boiler. Such facilities
will include:
• Electrostatic Precipitator (ESP)
• SO2 Removal Facility
• NOx Control Equipment
3.17 Civil Engineering
The civil engineering design will be sound to ensure well organized operation within
the mill complex.
In addition, fire prevention and evacuation; sanitary facilities; drainage of floors and
roofs; lighting and ventilation; decoration and finishingrequirements will be considered
in the designs.
Civil engineering designs will be completed in full consideration of the major technical
parameters and safety standards.

Okomu Oil Palm Company Plc: 60TPH Palm Oil Mill Project at Extension Two February 2020
Environmental Impact Assessment (EIA) – Final Report Page 60
3.18 Current Situation of Energy Supply
Existing 500kVA diesel generators will be used for construction.
3.19 Training
3191.1Plant Operation
Training will also be provided by the manufacturer/supplier of the mill plant and machinery
regarding their operations and maintenance requirements. Persons who should participate
in this training include:
• The Mill Manager in charge of Engineering (Operations and Maintenance)
• The personnel that will operate the mill plant and machinery
Training of staff and services contractor in waste management practices of the mill is critical.
Training programmes will include:
• Basic training in waste handling procedures for all new staff
• In-service training to revise and update the knowledge of mill and waste handling
staff.
Pamphlets and signs are all useful materials to complement the formal training activities
and they act as reminder for staff.
3.20 Environmental Considerations
3.20.1 Treatment of Solid Waste Products
In a well-run palm oil mill, it is expected that each 100 tonnes of FFB processed yields 20
to 24 tonnes of crude palm oil and about 4 tonnes of palm kernels. Thus between 72 to 76
percent of the FFB comes out at various stages of the process as waste.
The solid wastes that result from the milling operations are:
• Empty fruit bunches,
• Palm fibre, and
• Palm kernel shell.
In the large- and medium-scale mills the above-mentioned waste products are all put to
economically useful purpose. They could therefore be referred to as by-products rather than
waste products.

Okomu Oil Palm Company Plc: 60TPH Palm Oil Mill Project at Extension Two February 2020
Environmental Impact Assessment (EIA) – Final Report Page 61
Wet, empty bunches are partly dried in the sun and later used as fuel. Another economic use
for the empty bunches is to return them to the plantation as a mulch to enhance moisture
retention and organic matter in the soil.
The palm kernel shell is also used as a source of fuel for the boilers. Unfortunately the shell
contains silicates that form a scale in the boilers if too much shell is fed to the furnace, thus
limiting the amount of shell that can be utilized in the boilers. Residual shell is disposed of
as gravel for plantation roads maintenance. Blacksmiths also buy the shells to use as fuel
material in their casting and forging operations.
The fibre recovered from the nut/fibre separation stage is a good combustible material and
finds ready use as fuel to boil the fruit. The fibre constitutes the bulk of material used to fire
the large boilers used to generate superheated steam to drive turbines for electrical power
generation in large-scale plants.
Boiler ash is recycled as fertilizer and factory floor cleaning agent. The potash in the ashes
reacts with the oil to form a weak potash soap that is washed away with water.
Small-scale mills also use the fibre and bunch waste as fuel material. Most small-scale mills
do not undertake the shelling of recovered palm nuts. The nuts are sold to palm kernel
processors.
Small-scale palm kernel processors use clay baths to separate kernels from shells. The shells
are normally left in a pile to dry. Some of the shells are used for fuel but there are always
residual amounts found around the palm kernel processing centres. Periodically the pile is
removed and used as landfill.
Wood consumption of small-scale operations is relatively small because of the recycling of
the fibre and bunch waste as the main fuel source. The medium-scale operators tend to
supplement their internally generated solid waste fuel sources with wood for firing their
boilers. The impact on the local tree population is significant enough to cause factories to
close while foraging for wood supplies.
3.20.2 Treatment of Aqueous Effluent
Large- and medium-scale mills produce copious volumes of liquid waste from the sterilizer,
clarifying centrifuges and hydro cyclones. This effluent must be treated before discharge to
avoid serious environmental pollution.

Okomu Oil Palm Company Plc: 60TPH Palm Oil Mill Project at Extension Two February 2020
Environmental Impact Assessment (EIA) – Final Report Page 62
Liquid waste treatment involves anaerobic fermentation followed by aerobic fermentation in
large ponds until the effluent quality is suitable for discharge. In some of the mills the treated
effluent is used on the farm as manure and source of water for irrigation. The sludge
accumulating in the fermentation ponds is periodically removed and fed to the land.
To manage the amount of oil entrained in the effluent, while at the same time improving the
efficiency of oil recovery, the large mills use de-watering and decanting centrifuges at
various locations in the process line.
When it comes to liquid waste management most traditional processors and small-scale palm
oil processors do not adhere to any environmental protection practices. The environmental
awareness level of the operators in this industrial area is low. Indeed much is desired of the
hygiene of most facilities. Traditional processors operate so close to nature that they simply
return liquids to the surrounding bushes. The discharged quantities are so small that the
ground easily absorbs the waste matter and the operators have not yet seen their activities as
injurious to their surroundings.
However in the more organized intermediate technology mills sludge from the clarifying
tanks are carried in buckets or rudimentary gutters to sludge pits dug in the nearby bushes.
When the sludge pit begins to give off a bad odour the pit is filled in and another one dug for
the purpose. Charcoal from the cooking fires is dumped into the pits to absorb some of the
odour.
Sometimes the oil in the sludge pit is recovered and mixed with fibre to make a fire-starting
cake called ‘flint’.
It has been observed that when the small-scale mill operators empty their sludge on the
surrounding bushes the bushes slowly die. Operators say they use the sludge as a herbicide
to clear their surroundings. It is, however, time to develop simple inexpensive aqueous
pollution control systems for small-scale operators.
Environmental pollution considerations in small-scale palm oil milling need concentrated
attention as this industrial segment assumes greater importance. It is hoped that as more
educated people come into the industry they will bring increased awareness and a greater
commitment to adopt improved environmental management practices in their operations.

Okomu Oil Palm Company Plc: 60TPH Palm Oil Mill Project at Extension Two February 2020
Environmental Impact Assessment (EIA) – Final Report Page 63
3.21 Waste Management
Okomu Oil Palm Company Plc has put in place detailed waste management plans covering
a comprehensive description of activities and waste handling at preconstruction, construction,
operational and abandonment phases of this project. During site visits, the waste
management practices were observed and the company’s internal environmental
management system (EMS) was ascertained.
Palm oil processing is carried out using large quantities of water in mills where oil is
extracted from the palm fruits. During the extraction of crude palm oil from the fresh fruits,
about 50% of the water results in palm oil mill effluent (POME). It is estimated that for 1
tonne of crude palm oil produced, 5-7.5 tonnes of water ends up as POME (Ahmed et al,
2003).
The solid waste products that result from the milling operation are empty fruit bunches, palm
fibre and palm kernel. In both traditional and modern milling settings, these solid waste
products are all put to economic use such as fuel material and mulch in agriculture. It is the
POME that is usually discharged into the environment, either raw or treated.
Raw POME consisting of complex vegetative matter is thick, brownish, colloidal slurry of
water, oil and solids including about 2% suspended soils originating mainly from cellulose
fruit debris that is palm mesocarp (Bek Nelsen et al, 1999). The raw or partially treated
POME has an extremely high content of degradable organic matter which is due in part to
the presence of unrecovered palm oil (Ahmad et al, 2003).
This highly polluting wastewater can, therefore, cause pollution of waterways due to oxygen
depletion and other related effects as reported by Ahmad et al. (2003). Thus, while enjoying
a most profitable commodity, palm oil, the adverse environmental impact from the palm oil
industry cannot be ignored.
Large and medium scale mills produce copious volumes of liquid waste (POME) from the
processing lines, (Sterilizers, clarifying centrifuges and hydro cyclones) where POME is
produced on a large and commercial level. However effective the system of oil recaptured
from the sludge may be; the POME discharged from an oil mill is objectionable and could
pollute streams, rivers or surrounding land (Hartley, 1988). While mills were comparatively
few and mostly beside large fast flowing rivers, the problem was not a serious one but the
situation in many countries including Nigeria is quite different with much attention being
recently given to the subject of effective disposal and protection of the environment. Apart

Okomu Oil Palm Company Plc: 60TPH Palm Oil Mill Project at Extension Two February 2020
Environmental Impact Assessment (EIA) – Final Report Page 64
from the sludge water itself, which amounts to about 300 kg per tonne of bunches milled (or
about 1.5 tonne per tonne of palm oil), there are also about 175 kg of sterilizer condensate
and between 40 and 140 kg of POME from the hydrocyclone or clay bath separators/tonne
of bunches (Hartley, 1988). The total amounts of POME is therefore more than a tonne/tonne
bunches/hour, more than 200 tonnes of POME may be discharged over 24 hours and this
may contain up to 1 tonne of oil and 9 tonnes of dissolved or suspended solids (Hartley,
1988).
POME is generated in the sterilization, digestion and clarification phases in the palm oil
mills. POME has remained one of the largest liquid wastes generated in agro-industrial
activities in Nigeria. Studies have shown (Ohimian, 2014) that Nigeria produces 3.950 to
4.650 million tonnes of FFB producing 790,000 to 930,00 metric tonnes of crude palm oil
using 24.687 to 29.062 million tonnes of water for processing and generating 15.923 to
18.745 million tonnes POME in the past 10 years (2004–2014). The FFB production reached
4,650,000 crude palm oil, while utilizing 29,062,500 tonnes of water and releasing
18,745,312.5 metric tonnes of POME.
3.21.1 Ash Handling
Ash handing system is designed to consider ash quantity produced by the boiler; fly ash
conveying system; bottom ash conveying system; and ash transportation off the site.
The bottom ash handling system will be used to collect and transport bottom ash from the
furnace of boiler. The bottom ash from the furnace will be removed continuously by bottom
ash coolers, after cooled, then discharged to bottom ash bin, it will further be transported by
truck to the ash disposal yard east of the mill complex.
3.21.2 Ash Yard
The ash dumps of the existing operation are situated east of the mill complex. The available
space is large and it has the capacity to accommodate the boiler ash to be generated from the
proposed steam boiler. Trucks will be used for transporting ash to the ash yard. Seepage
control (including concrete flooring and protective ground cover) and other environmental
protection measures will be considered for the extra ash dumping.

Okomu Oil Palm Company Plc: 60TPH Palm Oil Mill Project at Extension Two February 2020
Environmental Impact Assessment (EIA) – Final Report Page 65
3.21.3 Overall Waste Management
No waste shall be discharged into any surface river or wetland without adequate treatment.
Table 3.5 shows the proposed waste management plan to be put in place.
Table 3.5: Summary of Okomu Oil Palm Company Plc Waste Management Plan.
None: Not discharged into/disposed off in the habitat ̶ Not Applicable
Type of Waste
Waste From
Waste Management Option Disposal
Reduce Re-use Recycle Forest/ Swamp Land
Gaseous
Noise
Heavy duty machines
(Land Preparation),
Methane
Installation of appropriate filters
to the exhaust pipe
- -
Machinery and generators, Installation of appropriate noise
Reducing devices
- -
Liquid
Office Areas
(Wastewater)
-
-
-
None Soak-away pits
attached to
buildings.
Sanitary from Toilets
-
Used
in the
field
-
None Appropriately
designed Septic
tanks
Oil traps
None Trapping of oil
using retention
trays
Palm Oil Mill Effluent - Used in the
field as
irrigation
water
- - Discharge in the
treatment ponds
for biological
(natural)
treatment.
Solid Domestic waste, mill,
workshop
Collected and taken to the dumpsite.
Used as fuel for the mill boiler
-
EFB, fibre, ash, plantation
field, shrubs, palm fronds,
tree back.
Retained in the field as manure -
Hazardous wastes such as
empty agrochemical
containers
Taken away by the manufacturers and/or suppliers
as part of agreement deal.
-

Okomu Oil Palm Company Plc: 60TPH Palm Oil Mill Project at Extension Two February 2020
Environmental Impact Assessment (EIA) – Final Report Page 66
3.21.3.1 Waste Classification
The wide range of waste that will be generated by the proposed project during construction
and operation phases are classified into solid waste, liquid waste and gaseous emissions.
3.21.4 Waste Generation and Sources
Solid, liquid and gaseous wastes will be generated during construction and operational
phases of the project. The waste profile is presented in Table 3.6 below.
Table 3.6: Waste Profile of the proposed mill
Project Phase Waste Class
Solid Liquid Gaseous
Construction ❑ Soil and vegetation ❑ Cement bags ❑ Wood scraps ❑ Steel Scraps ❑ Rubble ❑ Food Waste ❑ Glass and Plastic Bottles ❑ Dust
❑ Wastewater ❑ Engine oil ❑ Spent oil
❑ Fugitive Dust ❑ Suspended
Particulate ❑ Carbon dioxide ❑ Carbon monoxide ❑ Greenhouse Gases
Operation (Mill)
❑ EFB ❑ Sludge ❑ Paper ❑ Glass & Plastic Bottles ❑ Boiler ash ❑ Palm kernel shell
❑ Palm Oil Mill Effluent ❑ Wastewater ❑ Spent Oil
❑ Fugitive Dust ❑ Suspended
Particulate ❑ Carbon dioxide ❑ Carbon monoxide ❑ Greenhouse Gases
Operation (Laboratory)
❑ Reagent bottles & cans ❑ Papers/plastics/glass
❑ Wastewater ❑ Carbon dioxide ❑ Carbon monoxide
Operation (Offices)
❑ Papers/plastics/glass ❑ Scrap office equipment
❑ Wastewater
❑ Carbon dioxide ❑ Carbon monoxide ❑ Fumes
Operation (Workshop)
❑ Metal scraps ❑ Empty cans ❑ Electric cables
❑ Spent oil ❑ Spilled Oil ❑ Wastewater ❑ Fuel ❑ Solvents
❑ Carbon dioxide ❑ Carbon monoxide ❑ Fume
Operation
(Offices) ❑ Papers/plastics/glass ❑ Scrap office equipment
❑ Wastewater
❑ Carbon dioxide
Operation
(Powerhouse) ❑ Plastics ❑ Empty cans ❑ Electric cables
❑ Wastewater ❑ Spilled Oil ❑ Spent Oil
❑ Suspended
Particulate ❑ Carbon dioxide ❑ Carbon monoxide ❑ Greenhouse Gases
Operation (Fuel Storage)
❑ Plastic/metal Containers ❑ Papers
❑ Wastewater ❑ Spilled fuel
❑ Carbon dioxide ❑ Carbon monoxide ❑ Fume
Okomu Oil Palm Company Plc: 60TPH Palm Oil Mill Project at Extension Two February 2020
Environmental Impact Assessment (EIA) – Final Report Page 67
3.21.4.1 Solid Waste Handling
Storage: At all the points of waste generation, waste bins will be provided for the
immediate storage of solid waste. Provision would also be made for sorting and
segregation of all solid waste at the point of generation. There are waste management
plans where wealth shall be generated from wastes as much as practicable.
Collection and Transfer: Waste collection and transfer would include the provision
of a truck to collect and transport the collected waste to a designated dumpsite.
Disposal: The solid waste collected would be transported and disposed of at the solid
waste dumpsite within the plantation.
3.21.4.2 Liquid Waste Handling
Wastewater: Wastewater will be channelled into soak-away pits of varying
dimensions attached to the mill facilities.
Storm water: Rainstorm water will be collected in channels and led into natural
drainage lines and vegetation.
Palm Oil Mill Effluent: Palm Oil Mill Effluent (POME) and wastewater will be
channelled into cooling pond followed by anaerobic and Aerobic ponds for treatment
via a stainless steel pipe. The ponds are located just besides the plant.
3.21.5 Waste Re-use/Re-cycling
As much as possible, waste will be minimized. There is an existing yard already
designated for keeping all reusable waste.
3.22 Waste Manifest and Tracking
A manifest system will be established and record kept appropriately ensuring that the
mill waste is tracked from “cradle to grave”.
3.23 Effluent Treatment Facility
The discharge of untreated POME though creates adverse impact to the environment,
the notion of nurturing POME and its derivatives as valuable resources should not be
dismissed. Below are types of POME treatment.

Okomu Oil Palm Company Plc: 60TPH Palm Oil Mill Project at Extension Two February 2020
Environmental Impact Assessment (EIA) – Final Report Page 68
3.23.1 Anaerobic Digestion System
Generally, Palm oil mill effluent treatment plants (ETPs) are operated on two-phase
anaerobic digestion process followed by extended aeration process. In the anaerobic
digestion process, the raw POME is first converted into volatile fatty acids by acid
forming bacteria. The volatile acids are then converted into methane and carbon
dioxide. The advantages of anaerobic digestion system are:
• The two phase system allows greater control of digester environmental
conditions.
• Long solid retention times allow better biodegradation efficiencies.
• Additional settling of liquor ensures minimum loading to the aerobic process.
• There is capability to cope with full effluent load, regardless of fluctuation.
Anaerobic digestion also consists of breaking down of organic materials in the absence
of oxygen. These materials are broken down biologically by a complex group of acid-
forming and methanogenic bacteria which obtain their energy from the oxidation of
organic compounds converting them into end products consisting of water, gases
(mainly methane and carbon dioxide) and stabilized solids, (singh et al, 1999).
3.23.2 Extended Aerobic Process
In the extended aerobic system, the anaerobic liquor is aerated to further reduce the BOD
content. In addition to providing oxygen, the floating aerators also ensure complete
mixing is achieved and the pod contents are always in suspension. In this process, levels
of beneficial micro-organisms are increased which in turn hasten the conversion of
pollutants into carbon dioxide, water and energy. The aerobic suspension is allowed to
settle in a settling tank to ensure production of a fairly clean supernatant. The main
advantages of extended aerobics systems are its high BOD removal efficiency and low
solid yield.
3.23.3 Ponding System
This is by far the most popular treatment system adopted by more than 85 percent of the
palm oil mills in the country (Chooi 1984). Various design and configurations of raw
effluent is treated using a ponding system comprising of three phases involved anaerobic,
facultative, and aerobic processes. Although the system takes a longer retention time of
90 days, it Is less sensitive to environment changes, stable, efficient and could guarantee
excellent pollutant biodegradation efficiency of above 95%. Dominion square SdnBhd
is one of is also one of the crude palm oil suppliers that use this kind of treatment for

Okomu Oil Palm Company Plc: 60TPH Palm Oil Mill Project at Extension Two February 2020
Environmental Impact Assessment (EIA) – Final Report Page 69
their palm oil mill effluent treatment before it can be released to the water system and
comply with the standard B by the department of environmental.
Microorganism or microbe is any organism too small to be seen by the naked eye and
can only be seen under a microscope. Categories of microorganisms include Algae,
Bacteria, Fungi, Protozoa, Viruses or Sub-viral agents. Effective microorganism (EM)
technology has now become a major science, assisting in the creation of sustainable
practices for agriculture, animal husbandry, nature farming, environmental stewardship,
construction, human health and hygiene, industrial, community activities and more.
Specially-cultured microbes are used in the biological treatment of sewage and Industrial
waste effluent, a process known as bio augmentation. Treatment of POME involve the
biodegrading by thermophilic and mesophilic anaerobic microbe. Lifecycle of microbe
involved in the reduction of POME directly related to the temperature of the effluent.
That is one of the parameters that is going to be investigated in this experiment. Some
studies of the structure of mesophilic and thermophilic granules and biofilms have
already been made. The structure of mesophilic granular sludge has been described as
consisting of three distinct layers. The outer layer consists mainly of a heterogeneous
population of acidogenic bacteria, the middle layer of syntrophic cocci- and rod-shaped
bacteria, and the center of densely packed Methanothrix with many gas cavities. Such a
structure would enable substrate to pass through the biomass, being degraded by the
various types of bacteria to reach the methanogens that produce biogas. This could then
diffuse outward via gas channels. Morganet et al used sequential staining to examine the
internal architecture of mesophilic granules treating paper mill and sugar refinery
effluents. Both types of granule had a heterogenous surface population of bacteria, with
an abundance of Methanothrix being found internally. (Quarmby and Forster).
Chan (1982) and Chooi (1984) have reported that ponding system is reliable, stable and
is capable of producing good quality discharge with BOD less than the DOE standard
and meet the regulatory watercourse discharge standard. Ponding system is cheap to
construct but requires a large land area. The anaerobic ponds are usually 5-7 meter deep
while the facultative ponds are 1-1.5 meter in depth. The hydraulic retention times (HRT)
for this system is 1, 4, 45 and 16 days for de-oiling tank, acidification, anaerobic and
facultative ponds respectively.

Okomu Oil Palm Company Plc: 60TPH Palm Oil Mill Project at Extension Two February 2020
Environmental Impact Assessment (EIA) – Final Report Page 70
Land Application
Anaerobic Sludge
Sand Beds for Drying Anaerobic Sludge
Facultative ponds Final Discharge
Figure 3.9: Schematic Flow Diagram for Ponding System
Source: Chooi (1984)
Ponding system is normally operated at very low rate. The organic loading varies from 0.2
to 0.35kg BOD/m3/day. Because of the size and configuration of the ponds, the processes
are relatively difficult to control and monitor. Furthermore, there is no mechanical mixing
in the ponds. Limited mixing is achieved through the bubbling of biogas generated during
the anaerobic digestion process. Also, the rising biogas will bring along with it the fine
suspended solid to the surface of the pond. If it is allowed to accumulate, it will develop
into scum. Consequently, it is not uncommon to find discrete islands floating on the surface
of the pond resulting in the dead spots and short circulating in the ponds. Another feature
of the ponding system is the build-up of solids at the bottom of the pond. If these solids are
allowed to accumulate to excessive levels, they together with the scum at the top will
effectively reduce digester capacity and shorten the HRT. This will adversely affect the
treatment efficiency of the process. Regular desludging (solid removal) is therefore
recommended.
Energy required to operate the ponding system is minimum. It is only required to run the
pumps. Gravity flow is exploited wherever possible. For a 30-tonne FFB/hour mill, the
energy demand to operate the ponding system is about 20kwh. Figure 3.10 showed the
schematic flow diagram for DDSB wastewater ponding treatment process use in DSSB.
Primary Anaerobic Pond
30 days HRT
2 days
HRT
2 days
HRT
Anaerobic
Maturation Pond
15 days HRT
4 days
HRT
4 days
HRT
4 days
HRT
4 days
HRT

Okomu Oil Palm Company Plc: 60TPH Palm Oil Mill Project at Extension Two February 2020
Environmental Impact Assessment (EIA) – Final Report Page 71
INLET
Figure 3.10: DSSB Schematic Flow Diagram for Ponding System
BU
FF
ER
TA
NK
25
m x
25
m x
4m
DIS
TR
IBU
TIO
N
PO
ND
567
m3
0.9
Day
25
m x
25
m x
4m
CO
OL
ING
PO
ND
1
5,1
00
m3
8.5
Day
25
m x
25
m x
4m
CO
OL
ING
PO
ND
2
5,1
00
m3
8.5
Day
10
0m
x5
0m
x4
m
AN
AE
RO
BIC
PO
ND
1
14
,72
6m
3
24
.50
Day
5
RE
CY
CL
E
PU
MP
100
m x
50m
x4
m
A
NA
ER
OB
IC
PO
ND
4
14,7
26
m3
24.5
0 D
ay
100
m x
50m
x4
m
AE
RO
BIC
PO
ND
1
14,7
26
m3
73.5
0 D
ay
2
2
100m
x50m
x4m
AN
AE
RO
BIC
PO
ND
2
14,7
26m
3
24.5
0 D
ay
5
10
0m
x5
0m
x4
m
AN
AE
RO
BIC
PO
ND
3
14
,72
6m
3
24
.50
Day
100m
x50m
x4
m
AE
RO
BIC
PO
ND
2
14,7
26m
3
23.5
0 D
ay
FL
OW
ME
TE
R
RE
AD
ING
FIN
AL
DIS
CH
AR
GE
OU
TL
ET
100
m x
50
m x
1m
PE
TU
NJU
K L
OK
AS
I
SU
RF
AC
E E
RA
TIO
N
B
IO B
RIC
K
DU
MP
ING
SIT
E
S
CU
M/S
OL
ID

Okomu Oil Palm Company Plc: 60TPH Palm Oil Mill Project at Extension Two February 2020
Environmental Impact Assessment (EIA) – Final Report Page 72
3.23.4 Lagoon System
It is no wonder that one of the most popular methods of wastewater treatment around the
world is also of the simplest and least expensive. Lagoon systems use natural and energy-
efficient processes to provide low-cost wastewater treatment. They are one of the most cost-
effective wastewater treatment options for many homes and communities.
In the U.S, most wastewater treatment lagoons are found in small and rural communities.
Lagoons are especially well-suited to small communities because they can cost less to
construct, operate and maintain than other systems. They also require more land than other
wastewater treatment methods, and land is more likely to be available and inexpensive in
rural areas. Lagoons can also be designed to serve individual households. They are
sometimes good option for homes on large lots in areas where other onsite systems or sewers
are too costly or otherwise impractical. Lagoons also work well for many seasonal rental
properties and recreational areas, because they are able to handle intermittent periods of
both light and heavy use.
There are several different types and names for lagoons and many possible system designs.
Lagoon systems include one or more pond-like bodies of water or basins designed to
receive, hold, and treat wastewater for a predetermined period of time. Lagoons are
constructed and lined with material, such as clay or an artificial liner that will prevent leaks
to the groundwater below. While in the lagoon, wastewater receives treatment through a
combination of physical, chemical and biological processes. Much of the treatment occurs
naturally, but some systems are designed to also use aeration devices that increase the
amount of oxygen in the wastewater. Aeration makes treatment more efficient, so that less
land area is necessary, and aerators can be used to upgrade some existing systems to treat
more wastewater. Every lagoon system must be individually designed to fit its specific site
and use. Designs are based on such factors as the type of soil, the amount of land area
available, the climate, and the amount of sunlight and wind in an area. Other important
design considerations for lagoon systems include the amount and type of wastewater to be
treated and the level of treatment required by state and local regulations. Depending on local
standards and the final method of disposal chosen, wastewater leaving lagoon systems often
requires additional treatment, or “polishing,” to remove disease causing organisms or
nutrients from the wastewater before it can be returned to the environment.
Lagoons are not all the same, some employ different biological, chemical and physical
processes to treat the wastewater, while others may play a different role in overall treatment.
Some lagoon designs provide adequate treatment for certain methods of discharge, while
others should be used in combination with other lagoons or with additional treatment.

Okomu Oil Palm Company Plc: 60TPH Palm Oil Mill Project at Extension Two February 2020
Environmental Impact Assessment (EIA) – Final Report Page 73
Complicating matters further, there can be several different names for the same type of
lagoon, for example, the terms lagoon and pond are often used interchangeably, and names,
such as polishing, stabilization and maturation, can refer to lagoons particular role in
treatment. This can be very confusing for community leaders and home owners trying to
evaluate lagoon systems. The following is a brief overview of some of the more common
types of lagoons and some of the terms used for them.
Anaerobic Lagoons
The word anaerobic means without oxygen, which describes the conditions inside this type
of lagoon. Anaerobic lagoons are most often used to treat animal wastes from dairies and
pig farms, commercial or industrial wastes, or as the first treatment step in systems using
two or more lagoons in a series. Typically, anaerobic lagoons are designed to hold and treat
wastewater from 20 to 50 days. They are relatively deep (usually 8 to 15 feet) and work
much like septic tanks. Inside an anaerobic lagoon, solids in the wastewater separate and
settle into layers. The top layer consists of grease, scum and other floating materials. This
layer keeps oxygen out, allowing bacteria and other organisms that thrive in anaerobic
conditions to work to treat the wastewater. As with septic tanks and most other lagoon
designs, the layer of sludge that settles at the bottom of an anaerobic lagoon eventually
accumulates and must be removed periodically. Also similar to a septic tank, the wastewater
that leaves an anaerobic lagoon always requires further treatment. Odor can be a problem
with anaerobic lagoons. However, in many cases odor can be managed through a variety of
methods, such as adding sodium nitrate, recirculating pond effluent, and through regular
maintenance.
Aerobic Lagoons
Dissolved oxygen is present throughout much of the depth of aerobic lagoons. They tend to
be much shallower than other lagoons, so sunlight and oxygen from air and wind can better
penetrate the wastewater. In general, they are better suited for warm, sunny climates, where
they are less likely to freeze. Wastewater usually must remain in aerobic lagoons from 3 to
50days to receive adequate treatment. Wastewater treatment takes place naturally in aerobic
lagoons with the aid of aerobic bacteria and algae. Because they are so shallow, their
bottoms needs to be either paved or lined with materials that will prevent weeds from
growing in them. Sometimes, wastewater in aerobic lagoons needs to be mixed to allow
sunlight to reach all of the algae and to keep it from forming a layer that blocks out the air
and sun completely.

Okomu Oil Palm Company Plc: 60TPH Palm Oil Mill Project at Extension Two February 2020
Environmental Impact Assessment (EIA) – Final Report Page 74
Aerated Lagoons
Aerated lagoons are very common in small communities. These systems use aerators to mix
the contents of the pond and add oxygen to the wastewater. They are sometimes referred to
as partial-mix or complete-mix lagoons depending on the extent of aeration. Partial-mix
aerated lagoons that have been adapted and upgraded to receive more wastewater. With the
exception of wind-driven designs, most aerators require energy to operate. However, energy
costs are almost always considerably less than those for other mechanical community
treatment systems. Aeration makes treatment more efficient, which offsets energy costs in
some cases. Aerated lagoons require less land area and shorter detention times for
wastewater than other lagoons.
Facultative Lagoons
Both aerobic and anaerobic conditions exist in facultative lagoons, which also are called
stabilization ponds, oxidation ponds, photosynthetic ponds, and aerobic-anaerobic ponds.
They are the most common type of wastewater treatment lagoon used by small communities
and individual households. Facultative lagoons can be adapted for use in most climates,
require no machinery, and treat wastewater naturally, using both aerobic and anaerobic
processes.
3.24 Palm Oil Mill Effluent (POME) Ponds for the Proposed Project
The proposed POME treatment system for this project is biological (natural) method with
open ponding system before it is discharged into the plantation field as irrigation water.
Proposed sizes of treatment ponds for 60 MT FFB/hr. are:
- Cooling Pond - 92.5 x 53.5 x 2 metres deep
- Anaerobic Ponds - 219 x 126.25 x 5 metres deep
- Aerobic Ponds- 219 x 125.87 x 1.5 metres deep
3.24.1 Palm Oil Mill Effluent Quality and Monitoring
The lagoon system working efficiently treats and improves the quality of the wastewater to
acceptable international levels for the critical elements. The characteristics of water leaving
the outlet point of lagoon system with both National and International Norm requirements
for wastewater discharge onto land are presented in Table 3.7.

Okomu Oil Palm Company Plc: 60TPH Palm Oil Mill Project at Extension Two February 2020
Environmental Impact Assessment (EIA) – Final Report Page 75
Table 3.7: Characteristics of wastewater leaving the Pond with both National and International
Required Norms
Parameters
Expected
Results After
Treatment
FMEnv.,
(Nigerian,
standards)
Indonesia
Standards
Malaysia
Standards
pH 9 6-9 6-9 6-9
COD ppm < 225 80 472 216
BOD ppm < 100 30 137 93
Source: Chan (1982) and Chooi (1984)
The quality of the effluent will be monitored routinely (quarterly basis) to ensure that it
conforms to regulatory (FMEnv) standards. This means that the discharge quality at points
of discharge must not exceeds the FMEnv and/or International recommended values for
discharge into the environment. In addition to routine monitoring of effluent, quarterly
monitoring of groundwater and monitoring well at about 150 radius to the treatment ponds
will also be carried out to assess any changes in quality that may arise due to effluent
discharge and seepage.
3.24.2 Technical Specifications
One solution to treat the POM effluents is to reject them in ponds respecting residence
time to let occur biological decomposition with or without oxygen of the organic material.
Experience shows that we must have 5 ponds respecting specifically t h e depths to
encourage the anaerobic or aerobic decomposition:
Table 3.8: Decomposition Time of POME in Various Ponds
Ponds Retention Time Depth
1 Cooling pond 5 days 2
2 Anaerobic pond 70 days 5
3 Anaerobic pond 70 days 5
4 Anaerobic Pond 22 days 1.5
5 Aerobic Pond 22 days 1.5

Okomu Oil Palm Company Plc: 60TPH Palm Oil Mill Project at Extension Two February 2020
Environmental Impact Assessment (EIA) – Final Report Page 76
- The purpose of the first pond is to cool down the effluents before to reject
them in the anaerobic ponds. It helps to reach a favourable temperature for the
anaerobic decomposition.
- The purpose of the second and third ponds is to decompose the organic material
with bacteria living in a anaerobic environment.
- The purpose of the fourth and fifth ponds is to decompose the remaining organic
material with the dissolved oxygen or by the algae photosynthesis.
Considering these parameters, that the OOPC POM is producing 1,2 m3/tFFB of effluent
and its capacity is 60 t/h, the ponds could be designed as presented in Table 3.9 below:
Table 3.9: Capacity of Individual Ponds
Title Volume Size
Quantity Unit Quantity Unit
Effluent Production 1200 m3/t FFB
Palm Oil Mill (POM) Capacity 60 t/h m3/h
Effluent Production Peak 72 m3/t FFB
1 Cooling pond Volume 8,640 m3 4,320 m2
2 Anaerobic pond Volume 120,960 m3 24,192 m2
3 Anaerobic pond Volume 120,960 m3 24,192 m2
4 Anaerobic Pond Volume 38,016 m3 25,344 m2
5 Aerobic Pond Volume 38,016 m3 25,344 m2
The company has designated a location to install the effluent treatment between the road
G33/34,G34/41 and FG road, at a b o u t 1km from the p ro po se d pa lm o i l mill. A
topographical survey was made in this area. Considering these information, the five ponds
were designed and located as in the following drawings:

Okomu Oil Palm Company Plc: 60TPH Palm Oil Mill Project at Extension Two February 2020
Environmental Impact Assessment (EIA) – Final Report Page 77
Figure 3.11: Drawings of the Proposed Palm Oil Mill Effluent Treatment Ponds

Okomu Oil Palm Company Plc: 60TPH Palm Oil Mill Project at Extension Two February 2020
Environmental Impact Assessment (EIA) – Final Report Page 78
The ponds are designed to have earthworks balance, between the excavated earth and
the embankment, to reduce the quantity of earth that has to be evacuated. To separate the
ponds, a 6m wide road is designed on the top of the embankment to let vehicle circulate
and to ease the maintenance operations. The embankments are made with a slope of 2 by
3. It's important and advisable that the earthworks are done during the dry season. Here are
the ponds dimensions:
Table 3.10: Dimensions of Various Treatment Ponds
Title Length (m) Width (m) Depth (m)
1 Cooling pond 92.5 53.5 2
2 Anaerobic pond 219 126.25 5
3 Anaerobic pond 219 126.25 5
4 Aerobic pond 219 125.87 1.5
5 Aerobic pond 219 12.87 1.5
Road between ponds - 6 -
The ponds are designed to let the flow of effluents from a pond to another pond by gravity.
To do this, each consecutive pond are connected by 4 PVC pipes with a diameter of 100mm
and each pond is lower than the one before. The connections are arranged in quincunx to
force the effluent to take the longest way and to be sure that the residence time is respected.
The bottom of the ponds is covered with one layer of withe felt geotextile that is covered
by an EPDM liner to make them watertight. Both membranes are anchored at the top
of the embankment with a trench full of gravel. These trenches are also used as a rain
drain that is evacuated at both sides of the ponds in earth drains.
Aera
tor
Aera
tor

Okomu Oil Palm Company Plc: 60TPH Palm Oil Mill Project at Extension Two February 2020
Environmental Impact Assessment (EIA) – Final Report Page 79
Figure 3.12: Drawings of the Trenches at POME Treatment Ponds
To ensure that the effluent at the outlet of the last pond reaches the COD and BOD
standard values, 4 aerators will be installed in the 4th aerobic pond. They will increase the
oxygen in the water and help to decompose remaining organic material. The whole system
works by itself, but daily analyses must be done to control if the ponds are working correctly.
With this design, the experience show us that we can achieve a COD of 225 ppm and a
BOD of 100 ppm from an effluent coming out of the Palm Oil Mill with a COD of 50
000 ppm and a BOD of 25,000 ppm.
Table 3.11: Effluent Quality from POM and Expected Quality after Treatment
Title Effluents Quality
directly at the outlet of
the POM
Expected Effluents
Quality after ponds
treatment
BOD (ppm) 25,000 < 100
COD (ppm) 50,000 < 225
The advantage is that this system needs few maintenance, only the aerators need
to be maintained and need electricity which means the operation cost is low.
The disadvantage of this system is that the methane produced during the organic
decomposition is released in the atmosphere and not recovered as energy. However,
trapping the methane gas will solve the problem of electricity generation in future.

Okomu Oil Palm Company Plc: 60TPH Palm Oil Mill Project at Extension Two February 2020
Environmental Impact Assessment (EIA) – Final Report Page 80
3.25 Greenhouse Gas (GHG Emission)
Table 3.12: Estimation of Baseline Emission (for 30 and 60tons/hour capacity mill):
Effluent produced 30t/hr mill 60t/hr mill
Max production per day 600 tons FFB 1200 tons FFB
Effluent produced per day 300 tons POME 600 tons POME
Maximum expected production
per year
110,000 tons FFB 220,000 tons FFB
Effluent produced per year 55,000 ton POME 110,000 ton POME
Source: Extension Two EIA Field work 2018 (OOPC Palm Oil Mill Department)
1 tonne FFB = 0.5 tonne POME
1 ton POME = 28 m3 biogas (65% CH4, 35% CO2)
• 65% CH4 = 18.72m3 or 18720 liters
• 35% C02= 10.08m3 or 10080 liters
Base on the above calculations:
55,000 tons POME = 1,540,000 (65% CH4, 35% CO2)
• 65% CH4 = 1,001,000m3
• 35% C02= 539,000m3
While;
110,000 tons POME = 3,080,000 (65% CH4, 35% CO2)
• 65% CH4 = 2,002,000m3
• 35% C02 = 1,078,000m3
❑ total baseline emission = 1,540,000m3/year for 30tons/hr capacity
❑ total baseline emission = 3,080,000m3/year for 60tons/hr capacity
The proposed project has the potential of emitting GHG equivalent to 1,001,000m3 methane;
539,000m3 CO2 and 2,002,000m3 methane; 1,078,000m3 CO2 for 30tons/hr and 60tons/hr
mill capacities respectively equivalent per annum as shown in Table 3.15 below.

Okomu Oil Palm Company Plc: 60TPH Palm Oil Mill Project at Extension Two February 2020
Environmental Impact Assessment (EIA) – Final Report Page 81
Table 3.13: Baseline GHG Emission from the Effluent Ponds of the Proposed Project
Item Unit/Year 2020 (for 30 tons/hour
Capacity Mill)
2022 (for 60 tons/hour
Capacity Mill)
Emission of CH4 Cubic Meters CH4 eq/yr 1,001,000 2,002,000
Emission of CO2 Cubic Meters CO2 eq/yr 539,000 1,078,000
Total Emission
(65% CH4, 35% CO2)
Cubic Meters GHG eq/yr 1,540,000 3,080,000
3.26 GHG Emission Monitoring and Verification
For the evaluation of the effect of POME discharge from this project activity, Table 3.16
below presents the types of data collection and monitoring plan that shall be performed.
Table 3.14: Data to be collected in order to monitor emission from the project activity
No Data variable Data Unit Measured (m),
calculated (c)
or estimated (e)
Recording
frequency Proportion
of Data to be
monitored
For how long is
archived data
to be kept
Comment
1 FFB reception
from plantation t/year m Every FFB
reception
by truck
100% 15 years (project
period) Data will be
aggregated
monthly and
yearly 2 FFB reception
from other
producers
t/year m Every FFB
reception
by truck
100% 15 years (project
period) Data will be
aggregated
monthly and
yearly 3 POME yield
from CPO
produced
mᶾ
POME/tons
FFB
m Once a day 100% 15 years (project
period) Data will be
aggregated
monthly and
yearly

Okomu Oil Palm Company Plc: 60TPH Palm Oil Mill Project at Extension Two February 2020
Environmental Impact Assessment (EIA) – Final Report Page 82
3.27 Decommissioning and Abandonment
Palm Oil Mill exists for many decades. The ownership of the mill may change but total
abandonment is not frequent. However, the several factors that may cause decommissioning
and abandonment include:
• Lack of experience and knowledge of operational activities
• Use of outdated management principles and practices
• Financial malpractices
• Non-payment of workers’ salaries
3.28 Facilities that will be Decommissioned or Abandoned:
A. Equipment:
• Ramp
• Mill processing line building
• Sterilizer
• Machine components
• Platforms
B. Chemicals, mainly laboratory:
• Hezene
• Pepton-22
• Hydochloric Acid
• Tetraoxosulphate –vi- acid
C. Infrastructure:
• Workers’ housing
• Tank Farm
• Powerhouse
• Workshop
• Water pipes
• Quality assurance laboratory equipment
• Earth roads
• Palm Oil Mill Effluent Pond

Okomu Oil Palm Company Plc: 60TPH Palm Oil Mill Project at Extension Two February 2020
Environmental Impact Assessment (EIA) – Final Report Page 83
3.29 Material Balance for the Proposed Project

Okomu Oil Palm Company Plc: 60TPH Palm Oil Mill Project at Extension Two February 2020
Environmental Impact Assessment (EIA) – Final Report Page 84
3.30 Project Schedule
Some of the activities to be carried out from first quarter 2019 to 4th quarter 2022 are
provided in Chapter 5. The schedule and timing of the critical project activities are
illustrated in Table 3.14 below.
Table 3.15: Schedule and Timing of Critical Project Activities
Phase Activities 2019 2020 2021 2022
Pre-Construction
EIA Process
(Mobilisation)
Construction
(Heavy Machinery
Use, Civil, Electric
and Mechanical Work
Machine Installation
Commissioning Operation and
Maintenance

Okomu Oil Palm Company Plc: 60TPH Palm Oil Mill Project at Extension Two February 2020
Environmental Impact Assessment (EIA) – Final Report Page 85
CHAPTER FOUR
DESCRIPTION OF THE EXISTING ENVIRONMENT
4.1 Location
The proposed palm oil mill project is to be situated within Okomu Extension Two oil palm
plantation. The proposed mill project has the capacity to process 60 tons Fresh Fruit Bunch
(FFB) per hour. There are going to be two processing lines of 30 Tons FFB/hour each.
4.2 Methodology
4.2.1 Data Acquisition from Literature and Previous Studies
The preliminary information on the study area was obtained as follows:
a. Background information on the oil palm industry in Nigeria was obtained from
the Nigerian Institute for Oil Palm Research (NIFOR) and other technical notes
from the Plantation department of Okomu Oil Palm Company (OOPC) Plc.
b. The relevant institutional, legal and regulatory framework was obtained from
publications by the regulatory agencies and ministries.
c. The most recent relevant meteorological records were obtained from OOPC Plc
d. The OOPC Extension 2 Final EIA Report 2016 (Approved by FMENv, Abuja)
e. The OOPC Palm Oil Mill Expansion Project Final EIA Report 2017 (Approved
by FMENv, Abuja)
f. Other data sourced from literature.
g. The company’s environmental audit and environmental monitoring reports in the
last five years.
4.3 Field Data Gathering
The field data gathering started on 25 February to 5 March 2019 which was supplemented
with data from the Final EIA Report 2016 of oil palm development project at extension
two.
4.3.1 Sampling Points and Control
Sampling and observation points were established around the proposed palm oil mill project
area. At each sampling location, the GPS location was taken and all the relevant
environmental parameters including water quality, air quality, noise level, temperature, soil,
vegetation type were sampled or observed.

Okomu Oil Palm Company Plc: 60TPH Palm Oil Mill Project at Extension Two February 2020
Environmental Impact Assessment (EIA) – Final Report Page 86
The sampling points with their coordinates are presented in Table 4.1 and Map 4.1 below.
Table 4.1: Sampling Points and Control Locations
Sample Location
Coordinates – 31N
Environmental
Component (UTM Easting) (UTM Northing) Elevation (m)
Point 1 0811194 0738659 291 Groundwater
Point 2 0810677 0738734 285 Groundwater
Point 3
CTRL
0811604 0741609 254 Groundwater
River Jemide N06041’41.8” E005052’44.2” upstream Surface River
Stream I N06045’56.1” E005050’50.4” upstream Surface River
Stream I N06047’35.41” E005051’11.04” downstream- Surface River
Point A 0811895 0739708 258 Air Quality & Noise
Measurement
Point B 0811767 0739617 252 Air Quality & Noise
Measurement
Point C 0810755 0738737 285 Air Quality & Noise
Measurement
Point D 0811193 0738659 291 Air Quality & Noise
Measurement
Point E 0811604 0741609 214 Air Quality & Noise
Measurement
Point F
(Odigiemute
Community)_CTRL
0805970 0738130 260 Air Quality & Noise
Measurement
Point G 0810756 0738740 286 Soil
Point H 0810751 0738673 285 Soil
Point I 0810724 0738669 284 Soil
Point J 0810716 0738646 283 Soil
Point K 0810733 0738698 286 Soil
Point L - CTRL 0810740 0738759 289 Soil
Source: OOPC; Extension Two Mill EIA Field Work, February 2019

Okomu Oil Palm Company Plc: 60TPH Palm Oil Mill Project at Extension Two February 2020
Environmental Impact Assessment (EIA) – Final Report Page 87
Map 4.1: OOPC Plantation Map showing the Sampling Points at the Proposed
Project Site at Extension Two.

Okomu Oil Palm Company Plc: 60TPH Palm Oil Mill Project at Extension Two February 2020
Environmental Impact Assessment (EIA) – Final Report Page 88
4.3.2 Study Approach
The purpose of this environment description is to provide qualitative and quantitative
baseline information on the existing status of the proposed project area against which future
studies and the proposed project will be weighed.
Quality Assurance/Control Procedure: The Quality Assurance/Control for laboratory
analysis is in accordance with FMEnv recommended methods and it includes blank analysis
to establish analytical level, duplicate analysis to establish analytical precision, spiked and
blank sample analyses to determine analytical accuracy. It covers all aspects of the study,
and includes sample collection, handling, laboratory analysis, data coding and manipulation,
statistical analysis, presentation and communication of results. Sample chain of custody
form was used for the registration and tracking of sample from the field to the laboratory.
The name of laboratory used for all the analyses is on page xiii.
Sample Collection and Handling: This was carried out in accordance with Federal Ministry
of Environment guidelines and standards (sampling and handling of samples). Where
logistic and safety considerations precluded strict compliance with the above guidelines and
standards, other proven, scientifically acceptable methods of sample collection and handling
were used.
Laboratory Analysis: The methods of analysis used were as specified in the Federal
Ministry of Environment guidelines and standards and other International Analytical
Standards methods of analysis such as APHA for water quality. Trace metal analysis was
done using Atomic Absorption spectrophotometer dully calibrated using standards,
physicochemical parameters were determined using Thermoelectric Genesys 10 VIS
Spectrophotometer and Orion ISE Meter Model 710A, dully calibrated with standards, as
well as Flame Photometer.
Statistical Analysis: Errors in field data include those resulting from the instrument and
those introduced by the observer. With proper sustained calibration of the instrument and
the use of standardized observational procedures equipment errors were brought to
acceptable minimum. However, other errors arise from the method of sampling. Errors often
arise from two-stage sampling or sub sampling, or even from the fact that the samples
collected are not representative samples of the medium. There are also spatial variations for
the same medium, e.g., soil and water. Thus, it is taken, so as to establish a reasonable level
of confidence in the results obtained. A good result is obtained when the variance is within
5% of the mean.

Okomu Oil Palm Company Plc: 60TPH Palm Oil Mill Project at Extension Two February 2020
Environmental Impact Assessment (EIA) – Final Report Page 89
Data Coding and Manipulation: To ensure preservation of the integrity of data collected,
data coding forms for use in the field, were designed in such a way that field data could be
directly entered into computer data sheets. Since their analyses may be required in legal
proceedings, it is essential to establish sample authenticity. Samples must be properly sealed
and labelled. All data collected were labelled and the following information provided among
others:
• Identification code or sample number
• Date and time of sampling
• Description of sample
• Methods of sampling
• Particulars of any photographs taken
All movements of the samples were included on the samples record. Basic information was
recorded together with results of analysis, in a register.
4.4 Air Quality and Noise Level
a) Air Temperature
For air temperature and humidity of ambient conditions, a digital thermometer and
Fisher Scientific Hygrometer were used respectively.
b) Gases
In-situ determination of the gases was carried out using portable gas analyzers. The
ambient air was monitored using GasTech GT402 to measure the concentration of CO,
O2, Non-methane hydrocarbons, and H2S. BWT Gas Alert was used to determine the
concentration of NO2 and Ogawa Passive Air Samplers were used for the sampling of
SO2 and subsequently analysed in the laboratory to determine the concentration of the
gases.
c) Suspended Particulate Matter, (SPM)
PPM 1055 Hand-held Aerosol Monitor was used to determine Suspended Particulate
Matter (SPM).
d) Noise level measurement
Sound level was measured at same point as that for air quality. A CEL-254 Sound level
meter was first calibrated and re-checked before determining the sound level. The
reading was allowed to stabilize before recording in decibel units {dB(A)}.

Okomu Oil Palm Company Plc: 60TPH Palm Oil Mill Project at Extension Two February 2020
Environmental Impact Assessment (EIA) – Final Report Page 90
4.5 Ambient Environment
4.5.1 Climate
The project site falls within the rain forest region of south-western Nigeria
which experiences a hot and humid tropical climate. The climate is
characterized by seasonal rainfall, high temperatures and high relative humidity.
The environment is noted for two distinct seasons of rainy and dry periods in a
year, characterized by the southwest moisture laden monsoon wind and the
northeast dry cold harmattan wind respectively. The Southwest trade wind
predominates over the area, usually between March and November, while the
northeast trade wind has greater influence between December and February/March.
The Southwest monsoon wind originates from the Atlantic Ocean; hence it is
moisture laden, warm and brings rain to the area. The north east trade wind
is characterized by cold, dry and dusty weather, often referred to as harmattan.
The occurrence of these trade winds is determined by the North-South
migration of the zone of demarcation between them, known as Inter-Tropical
Discontinuity (ITD). The movement is usually gradual, steady and consistent,
hence, the regular pattern of rainfall and dry periods in the year. It directly and
indirectly controls other climatic parameters apart from rain like temperature,
relative humidity, cloud cover, wind direction and speed, etc. These in turn
moderate and determine crops to be grown, farming systems and operations,
etc.
According to Muller-Samanu et al. (1994), the area falls between humid and semi
humid climate zone of the tropics with about 8 -9months of rainfall, and having
an average of 8.5 humid months in a year. The rainfall is more than 1,500 mm
per annum for most years, and the driest months have less than 60 mm of rain.
Rainfall
The rainfall pattern (amount, intensity and distribution) is greatly influenced by
the movement of ITD. The annual total rainfall for the area ranges from 1595
– 2127.2mm (NIFOR meteorological station). The rains are said to have been
established when at least 100mm have fallen in a year. Thus, for most years, this
is not attained until April. The amount of rainfall increases from April through
to June/July when it peaks and then reduces during the month of August before
it peaks again in the months of September/October. Thereafter, it tapers-out
towards the end of the year.
The total amount of rainfall, its distribution and intensity are very important factors
in determining the suitability or otherwise of a land, apart from the quality of soil for

Okomu Oil Palm Company Plc: 60TPH Palm Oil Mill Project at Extension Two February 2020
Environmental Impact Assessment (EIA) – Final Report Page 91
any particular agricultural enterprise. The host communities of the project site are
essentially agrarian, hence highly influenced by the pattern of rainfall in their activities.
The rains, usually, at the onset of the season are noted for thunderstorms which at
times can be destructive, traveling at very high speed exceeding 48km/hr. These
are torrential and windy rains, usually referred to as line squall. I t should be noted
that the amount of rainfall in a month can vary widely from one year to another. This
is not unconnected to the global phenomenon of climate change which is becoming more
and more apparent in recent years as presented in Table 4.2, while the graphical illustration
is shown in Figures 4.1.
Table 4.2: Monthly Rainfall in mm (2010 – 2018)
Rainfall in mm
Month/Yrs 2010 2011 2012 2013 2014 2015 2016 2017 2018
January 0 0 65.4 22.9 21.5 17.8 0 0 0
February 57.5 116.2 34.4 31.9 6.7 38.2 7 2 0
March 38.7 84.9 45.4 45.4 108.7 133.1 155.1 113.8 81.7
April 219.9 118.3 162.4 221.3 132.7 38.7 84.6 132.8 75.1
May 125.4 264 188.8 199.3 154.6 157.4 133.3 275.9 165.5
June 174.6 275.2 265.2 190.5 208.5 320 178.9 178.1 231.3
July 257.8 430.3 396.9 284.6 139 289.7 200.6 246.1 260.3
August 455.8 277.8 139.9 69.3 437.2 157.3 208.2 338.9 230.4
September 282.1 250.9 317.5 469.6 246 271.6 175 252.7 269.4
October 373.8 240.8 178.9 153.5 116.6 273.3 19.7 157.7 177.1
November 109 68.8 46.9 70.7 125 7 6 58.8 28.2
December 0 0 0 13 0.6 0 3.6 31.1 0
Total 2094.9 2127.2 1814.7 1772 1697.1 1704.1 1172 1787.9 1519
Mean 174.6 177.3 151.2 147.7 141.4 142 97.7 149 126.6
Source: NIFOR Meteorological Station 2019

Okomu Oil Palm Company Plc: 60TPH Palm Oil Mill Project at Extension Two February 2020
Environmental Impact Assessment (EIA) – Final Report Page 92
Figure 4.1: Average Annual Rainfall of Study Area and Environs
Temperature
The mean air temperature of the project area, like most of the tropical
environment is generally high throughout the year. It is characterized by minimal
fluctuations, usually less than 5oC throughout the year. It is referred to as
isohyperthermic temperature regime. The highest mean monthly temperatures
are recorded in the months of February and March 34.57°C to 33.76°C, while
the lowest mean air temperatures are 20.83°C to 20.97°C in the months of January
and July respectively. The average annual (2010-2018) data of temperature at NIFOR
weather station range from 20.60C to 33.90C as presented in Table 4.3, while the graphical
illustration is shown in Figure 4.2 below.
0
20
40
60
80
100
120
140
160
180
2010 2011 2012 2013 2014 2015 2016 2017 2018
Average Annual Rainfall in mm (2010-2018)
Mean

Okomu Oil Palm Company Plc: 60TPH Palm Oil Mill Project at Extension Two February 2020
Environmental Impact Assessment (EIA) – Final Report Page 93
Table 4.3: Monthly Temperatures in 0C (2010 – 2018)
Months/Yrs
2010 2011 2012 2013 2014 2015 2016 2017 2018
Max Min Max Min Max Min Max Min Max Min Max Min Max Min Max Min Max Min
January 34.2 24.5 33.2 18.9 33.9 18.2 32.6 22.1 32.4 24.7 32.5 24.3 35 22.4 32.7 23.3 33.9 22
February 35.1 24.4 33.5 22 33.4 21.7 31.1 20.1 32.5 24.5 34.1 24.9 34.7 22.6 35 23.9 33.3 24.2
March 34.8 25.4 34.2 22.7 35.1 22.3 32.3 22 32.9 24.3 34.3 24.4 33.5 22.2 34.9 24.8 32.7 23.1
April 32 22.8 32.9 22 33.4 21.5 31.3 21.3 32.1 23.6 32.7 24.2 34 23.9 38.6 24.2 32.6 22.4
May 33.4 23.5 32.8 21.6 32.5 20.3 31.2 21.5 32.3 23.3 32.5 24 32.2 22.3 33.9 23.9 33.2 23.3
June 31.4 22.6 31.2 21.5 31.2 20 29.5 20.5 31.2 23.3 30.6 23.6 30.4 22.9 30.7 23.3 32 23.2
July 29.8 21 29.3 20.3 28.8 20.9 27.8 18.9 29.2 22.9 29 23.5 28.6 21.3 33.3 23.5 30.5 23.4
August 28.5 21.5 28.5 20.9 28 20.7 29.2 20.8 28.6 22.4 28.5 23.6 29.3 22.3 34.8 23.1 30.5 23.1
September 30.2 21.5 30.1 20.4 29.8 21.1 29 22.8 30.3 23.3 29.3 24.1 30.4 20.8 31.6 23.1 30.8 23.1
October 31.3 21.9 31.4 21.3 31.5 20.9 31.2 23.6 30.3 23.1 31.9 25 32 23 34 23.6 32.3 22.9
November 32.6 21.9 33.3 21.5 33 21.4 31.3 22.5 31.6 23.1 32.2 23.4 33 23 33.6 24 32.8 23.8
December 33.5 20.8 34.2 19 33 18 31.5 21.9 33.8 23.7 33.3 19 33.7 23.2 33.6 24.1 33 22
Total 386.8 271.8 384.6 252.1
383.6 247 368 258
377.2 282.2 380.9 284 386.8 269.9 406.7 284.8 388
276.
5
Mean 32.2 22.7 32.1 21 32 20.6 30.6 21.5 31.4 23.5 31.7 23.7 32.2 22.5 33.9 23.7 32 23
Source: NIFOR Meteorological Station 2019
Figure 4.2: Average Annual Temperature of Study Area and Environs
0
5
10
15
20
25
30
35
Max
Min
Max
Min
Max
Min
Max
Min
Max
Min
Max
Min
Max
Min
Max
Min
Max
Min
2010 2011 2012 2013 2014 2015 2016 2017 2018
Average Annual Temperature in Degree (2010-2018)
Mean

Okomu Oil Palm Company Plc: 60TPH Palm Oil Mill Project at Extension Two February 2020
Environmental Impact Assessment (EIA) – Final Report Page 94
Sunshine Hours
The mean annual sunshine hour at the proposed project site and environs for the period
2010 to 2018 range between 3.4 hours to 4.7 hours as presented in Table 4.4, while the
graphical illustration is shown in Figure 4.3.
Table 4.4: Monthly Sunshine (Hr) (2010 - 2018)
Month/Yrs 2010 2011 2012 2013 2014 2015 2016 2017 2018
January 5.2 5.4 5.4 5.5 6.4 5.2 4.6 3.4 2.9
February 5.2 5.9 4.9 4.1 4.6 5.3 2.2 2 3.1
March 3.3 6.1 5.4 5.7 5.6 4.4 4.3 3 4.3
April 5.8 5.1 5.7 5.6 5.8 4.7 5.7 5 4.3
May 5.3 5.6 5.1 5.9 5.8 5.2 5.1 6.1 4.2
June 3.8 3.3 3.8 4.3 4.5 3 4.3 4.2 4.3
July 2.9 2.4 1.7 2.7 2.5 2.1 4.2 2.2 2.9
August 2.4 1.6 2.6 2.1 1.5 1.6 2.8 2 2.9
September 3.6 2.5 3.6 2.8 1.8 2.5 2.2 2.5 3.1
October 5.5 4.4 4.7 4.7 3.7 5.2 4.9 3.3 4.7
November 6 7 6.3 6.1 5.9 6.8 5.5 4.4 5.2
December 7.1 7.3 7.6 6.5 6.2 8.8 4.4 2.5 4.3
Total 56.1 56.6 56.8 56 54.3 54.8 50.2 40.6 46.2
Mean 4.7 4.7 4.7 4.6 4.5 4.6 4.2 3.4 3.9
Source: NIFOR Meteorological Station 2019
Figure 4.3: Average Annual Temperature of Study Area and Environs
0
0.5
1
1.5
2
2.5
3
3.5
4
4.5
5
2010 2011 2012 2013 2014 2015 2016 2017 2018
Average Annual Sunshine Hour
Mean

Okomu Oil Palm Company Plc: 60TPH Palm Oil Mill Project at Extension Two February 2020
Environmental Impact Assessment (EIA) – Final Report Page 95
Relative Humidity.
In the tropical environment, there is a good correlation between the
temperature/rainfall and relative humidity. The relative humidity of the atmosphere
in the environment is generally high throughout the year. The highest values are
recorded at the height of rainy season (June and September), while the lowest are
expected during the drier months of December and January as presented in Table
4.5 and Figure 4.4 below.
Table 4.5: Monthly Relative Humidity in % (2010 – 2018)
Month/Yrs 2010 2011 2012 2013 2014 2015 2016 2017 2018
10am 4pm 10am 4pm 10am 4pm 10am 4pm 10am 4pm 10am 4pm 10am 4pm 10am 4pm 10am 4pm
January 80.4 52.5 62.9 43.8 80.5 58.3 77.1 56.7 82.7 59.4 80.7 74.4 58.3 44.3 80.4 55.5 77.9 74.3
February 80 58 81.3 58.5 83.8 63.7 77.4 64 77.1 60.3 82.9 58 76.7 48.2 79.6 62.3 82.2 78.2
March 82.9 60.5 83.5 61.1 79.8 58.1 75.3 69.6 80.4 63.2 82.5 61.2 78.4 63.3 81.3 65.8 83.9 80
April 78 64.7 82.4 67.3 80.6 68.5 77.3 73.8 81.9 66.3 80.9 63.8 81.8 66.7 83.9 71.7 83.2 77.6
May 81.4 69.9 83 72.9 83.2 71.6 77.5 74.2 79.1 69.5 81 69.4 95.4 70.1 82.6 73.1 83.5 74.8
June 84.6 72.6 86.3 77.3 87.2 75.3 83.1 77 84.2 73.3 85 80.1 81.8 77.6 87.9 78.4 82.8 73.9
July 87.7 80.5 87 78.6 82.2 73 84.8 80.7 88.8 80.4 87.3 84.3 85 81.3 88.8 81.8 85 81
August 90 84.1 90.1 81.7 89.7 78 84 81 88.7 84.5 86.5 85 84.4 80.5 88.6 84.9 87.2 80.7
September 87.7 80 87.8 80.2 86.7 75.7 83.3 75 84.4 80 85.3 78.8 80.7 80.2 87.5 83.8 90.1 79.9
October 84.9 75.3 81.9 76 85.1 74.5 82.1 71.2 86.2 79.9 83.6 71.7 81.6 75.1 84.9 77.5 83.7 70.5
November 83.1 70.1 78.7 69.5 83 68.4 83 68 84.5 75.1 81.5 59.3 83 64.8 84.7 77.5 83.4 69.5
December 77.4 55.3 76.1 5.2 83.3 68.3 73 66 79.2 62.9 61.5 45 76.3 61.8 82.6 79.3 79 66
Total 998.1 823.5 981 771.9 1005.1 833.4 957.9 857.2 997.2 854.8 978.7 831 963.4 815.9 1012.8 891.6 1001.9 906.4
Mean 83.2 68.6 81.8 64.3 83.8 69.5 79.8 71.4 83.1 71.2 81.5 69.2 80.2 67.8 84.4 74.3 83.5 75.5
Source: NIFOR Meteorological Station 2019

Okomu Oil Palm Company Plc: 60TPH Palm Oil Mill Project at Extension Two February 2020
Environmental Impact Assessment (EIA) – Final Report Page 96
Figure 4.4: Average Annual Humidity of Study Area and Environs
4.5.2 Groundwater Quality
The groundwater quality is good and free from pollution. Except for the pH that is generally
low, thus making the water mildly acidic. All the water samples from the project’s water
sources have all physico-chemical and microbiological parameters within the permissible
limits recommended by WHO and FMENV for wholesome water. The low pH can be raised
by adding soda lime (CaHNaO2).
The results of laboratory analyses of three groundwater and control samples collected from
the proposed project site are presented in Table 4.6 while the secondary data is presented in
Table 4.7.
S/N Sample Code Description of Location Coordinates
1. BH1 Okomu Extension 2 Borehole 1 N06042’03.4” E005049’08.8”
2. BH2 Okomu Extension 2 Borehole 2 N06041’11.7” E005049’55.4”
3. BH3 (CTRL) Okomu Extension 2 Borehole 3 N06040’30.6” E005048’36.6”
Source: OOPC: Proposed Palm Oil Mill at Extension Two; EIA Field Work, March 2019
0
10
20
30
40
50
60
70
80
90
10
am
4p
m
10
am
4p
m
10
am
4p
m
10
am
4p
m
10
am
4p
m
10
am
4p
m
10
am
4p
m
10
am
4p
m
10
am
4p
m
2010 2011 2012 2013 2014 2015 2016 2017 2018
Average Annual Humidity (%)
Mean

Okomu Oil Palm Company Plc: 60TPH Palm Oil Mill Project at Extension Two February 2020
Environmental Impact Assessment (EIA) – Final Report Page 97
Table 4.6: Results of Physico-Chemical Laboratory Analysis of Groundwater Samples at OOPC Plc
PARAMETER/UNIT FMENV:
2015
Method,
APHA, 23Ed. BH1 BH2 BH3 (CTRL)
Appearance Clear &
colourless
Clear & colourless liquid
Odour Unobjectionable Unobjectionable
Taste Unobjectionable Unobjectionable
pH 6.5-8.5 4500-HB 5.25 5.20 5.84
Temperature, oC Ambient - 31.8 31.2 31.1
Conductivity, S/cm 1000 2500-B 50 40 60
Colour, Pt-Co 15 2120-C 2 <1 <1
Turbidity, NTU 5 2130-B 4 6 1
Total Solids, mg/L - 2540B 26.2 22 30
Total Dissolved solids, mg/L 500 2540-D 25.2 20 30
Total Suspended Solids, mg/L - 2540-C 1 2 <1
Total Hardness, mg/L 2340-C 4 4 12
Total Alkalinity, mg/L - 2320-B 23 19.2 21.1
Total acidity, mg/L - 2310-B 24.4 27.8 13.9
Calcium, mg/L - 3500-B 1.6 1.6 3.6
Magnesium, mg/L 20 3500-B <1 <1 0.7
Chloride, mg/L 250 4500-B 1.4 6.2 6.2
Nitrate, mg/L 50 4500-NO3--E 0.10 0.5 0.9
Nitrite, mg/L 0.2 4500-NO2--B <0.01 <0.01 <0.01
Sulphate, mg/L 100 4500-SO4-E 9 12 11
Phosphate, mg/L - 4500-E <0.1 <0.1 <0.1
Free carbon dioxide, mg/L - 4500-CO2-C 21.4 24.5 12.2
Iron (total), mg/L 0.3 3500-B <0.01 0.01 0.01
Fluoride, mg/L 1.5 4500-F-C <0.10 <0.1 <0.1
Lead, mg/L 0.01 3500 -Pb-B <0.001 <0.001 <0.001
Arsenic, mg/L 0.01 3500 -As-B <0.001 <0.001 <0.001
Manganese, mg/L 0.2 3500 -Mn-B <0.001 <0.001 <0.001
Copper, mg/L 1.0 3500 -Cu-B <0.001 <0.001 <0.001
Cadmium, mg/L 0. 03 3500 -Cd-B <0.001 <0.001 <0.001
Hydrogen Sulphide, mg/L 0.05 4500-S2-H 0 0 0
Chemical Oxygen Demand, mg/L 80 5220-D <1 <1 <1
Biochemical Oxygen Demand, mg/L 30 5210-B <1 <1 <1
Oil and Grease, mg/L 10 4500-G <1 <1 <1 Salinity as Chloride, mg/L 200 4500-B <0.01 <0.01 <0.01
Total coliform count, CFU/mL 10 9225-D 0 0 0
Faecal coliform (E.coli), CFU/100 mL Nil 9222-D 0 0 0
Clostridium perfringens, CFU/100 mL Nil AOAC 973.30 0 0 0
Salmonella/Shigella sp., CFU/100 mL Nil 9260-E 0 0 0
Staphylococcus sp. , CFU/100 mL Nil AOAC 995.12 0 0 0
Pseudomonas aureus, CFU/100 mL Nil 9213-E 0 0 0
Total plate count, CFU/100 mL 102 9215-B 6 4 8
Source: OOPC: Proposed Palm Oil Mill at Extension Two; EIA Field Work, March 2019

Okomu Oil Palm Company Plc: 60TPH Palm Oil Mill Project at Extension Two February 2020
Environmental Impact Assessment (EIA) – Final Report Page 98
Table 4.7: Results of Physico-Chemical Laboratory Analysis of Groundwater Samples (Secondary Data)
Source: Extension Two Oil Palm Development Project; EIA Final Report December 2016 (Secondary Data)
Parameter/Unit
Reference
Standard
NIS554:2007
Sample 1 (UTM 31N)
E807370.44 ; N743794.01
Sample 2 (UTM 31N)
E811678.31 ; N741640.71
Control Sample (UTM 31N)
E814753.24 ; N739975.42
Dry Season Wet Season Dry Season Wet Season Dry Season Wet Season
Appearance Clear and
colourless liquid
Clear and
Colourless
liquid
Clear and
Colourless liquid
Clear and
Colourless liquid
Clear and
Colourless liquid
Clear and
Colourless liquid
Clear and
Colourless liquid
Odour Unobjectionable Unobjectionable Unobjectionable Unobjectionable Unobjectionable Unobjectionable Unobjectionable
Taste Unobjectionable Unobjectionable Unobjectionable Unobjectionable Unobjectionable Unobjectionable Unobjectionable
pH @27.5 oC 6.5-8.5 7.07 5.20 6.8 5.8 5.6 6.7
Temperature, oC Ambient 29.9 27.5 28.5 27.8 28.9 26.7
Conductivity, S/cm 1000 29.9 36.3 31.2 22.2 30.0 33.4
Electrode Potential, mV - 109 114 110 116 116 112
Colour, Pt-Co 15 <1.0 14.0 2.0 11.0 2.0 4.0
Turbidity, NTU 5 <1.0 5.0 1.0 3.0 0.9 2.0
Total Solids, mg/L - 15.0 21.3 12.0 17.0 13.0 18.0
Total Dissolved solids,
mg/L
500 15.0 18.1 9.0 11.0 10.0 16.0
Total Suspended Solids,
mg/L
- <1.0 3.0 2.0 6.0 1.0 4.0
Total Hardness, mg/L
CaCO3
150 5.0 11.0 3.0 8.08 4.0 10.0
Total Alkalinity, mg/L - 9.20 3.12 10.30 4.43 9.6 3.4
Total acidity, mg/L - 6.96 26.35 2.14 21.75 5.45 24.78
Calcium,
mg/L as Ca
- 0.8 1.2 1.1 2.02 0.9 1.3
Magnesium,
mg/L as Mg
2.0 0.73 1.94 0.24 0.74 0.21 0.72
Chloride, mg/L 250 4.43 4.42 1.92 1.70 1.9 1.72
Residual chlorine, mg/L 0.2-0.25 <0.1 <0.1 <0.1 <0.1 <0.1 <0.1
Fluoride, mg/L 1.5 <0.1 <0.1 <0.1 <0.1 <0.1 <0.1
Nitrate, mg/L 50 0.12 0.49 0.13 0.49 0.22 0.45
Nitrite, mg/L 0.2 0.02 0.08 0.20 0.21 0.14 0.25
Sulphate, mg/L 100 4 5.0 <1.0 <1.0 <1.0 <1.0
Phosphate, mg/L - <0.1 0.3 <0.1 <0.1 <0.1 <0.1
Free carbon dioxide,
mg/L
- 6.12 23.19 3.60 19.1 7.4 22.11
Iron (total), mg/L 0.3 <0.01 0.11 <0.1 0.1 0.1 0.1
Lead, mg/L 0.01 <0.001 <0.001 <0.001 <0.001 <0.001 <0.001
Arsenic, mg/L 0.01 <0.001 <0.001 <0.001 <0.001 <0.001 <0.001
Manganese, mg/L 0.2 <0.001 <0.001 <0.001 <0.001 <0.001 <0.001
Copper, mg/L 1.0 <0.001 <0.001 <0.001 <0.001 <0.001 <0.001
Cadmium, mg/L 0. 03 <0.001 <0.001 <0.001 <0.001 <0.001 <0.001
Chromium, mg/L 0.05 <0.001 <0.001 <0.001 <0.001 <0.001 <0.001
Hydrogen Sulphide,
mg/L
0.05 <0.01 <0.01 <0.01 <0.01 <0.01 <0.01
Total coliform count* 10 0 0 0 0 0 0
Faecal coliform (E.coli) Nil 0 0 0 0 0 0
Clostridium perfringens, Nil 0 0 0 0 0 0
Salmonella/Shigella sp. Nil 0 0 0 0 0 0
Staphylococcus sp. Nil 0 0 0 0 0 0
Pseudomonas aureus Nil 0 0 0 0 0 0
Total plate count, 102 4 2 2 2 2 2

Okomu Oil Palm Company Plc: 60TPH Palm Oil Mill Project at Extension Two February 2020
Environmental Impact Assessment (EIA) – Final Report Page 99
4.5.3 Ambient Air Quality Measurements
4.5.3.1 In-situ Measurements
In-situ determination of the gases was carried out using portable gas analyzers. The ambient
air was monitored using Mattheson IQ-1000 gas analyzer (with mega and electrochemical
sensors) to measure the concentrations of carbon monoxide, Oxygen, Non-methane
hydrocarbons, hydrogen sulphide, Sulphur dioxide. BWT Gas Alert was used to determine
the concentration of NO2. PPM 1055 Handheld Aerosol Monitor was used to determine
Suspended Particulate Matter (SPM). Fisher Scientific Hygrometer was used to determine
the temperature and humidity of ambient conditions during the sampling period.
4.5.3.2 Results of Ambient Air Quality Measurements
The results of ambient air quality determinations at six different locations plus the control
location are presented in Tables 4.8a and 4.8b. The results show that the ambient air quality
is good with all the quality parameters within acceptable regulated limits.
Table 4.8a: Results of Air Quality at the Proposed Project Site
Coordinate
Point A
Point B Point C Point D Point E
Point F
(Odigiemute
Community)
- CTRL FMEnv.
Limit
31N
0811895
31N
0811767
31N
0810755
31N
0811193
31N
0811604
31N
0805970
E0739708 E0739617 E0738737 E0738659 E0741609 E0738130
Elevation, m 258m 252m 285m 291m 214m 260m
SPM (µg/m3) 80 110 110 80 70 70 250
Humidity (%) 51.7 41.5 45.4 44.2 39.6 45.6 Ambient
Temperature (0C) 29.0 31.6 31.2 31.8 33.7 31.1 Ambient
Carbon monoxide,
ppm <1.0 <1.0 <1.0 <1.0 <1.0 <1.0 10-20
Carbon dioxide, % 0.32 0.31 0.30 0.32 0.31 0.32 Ambient
Hydrogen sulphide,
ppm <0.1 <0.1 <0.1 <0.1 <0.1 <0.1 -
Hydrocarbon, % <0.1 <0.1 <0.1 <0.1 <0.1 <0.1 -
Oxygen, % 21.0 21.0 21.0 21.0 21.0 21.0 21.0
Sulphur dioxide, ppm <0.01 <0.01 <0.01 <0.01 <0.01 <0.01 0.01
Nitrogen dioxide, ppm <0.01 <0.01 <0.01 <0.01 <0.01 <0.01 0.4-0.06
VOC, ppm <0.01 <0.01 <0.01 <0.01 <0.01 <0.01
Source: OOPC: Proposed Palm Oil Mill at Extension Two; EIA Field Work, February 2019

Okomu Oil Palm Company Plc: 60TPH Palm Oil Mill Project at Extension Two February 2020
Environmental Impact Assessment (EIA) – Final Report Page 100
Table 4.8b: Results of Air Quality and Noise Measurements– Secondary Data
LOCATION
Powerhouse
/Residential
Area
Control Odighi
Community
Owan
Community
Uhiere
Community
Odiguetue
Community
Agbanikaka
Community
Orhua
Community
Umuokpe
Community
Ekpan
Community
Irhue
Community
FMEnv.
Limit
Coordinate N06.701270 N06.72450 N06.64316 N06.76092 N06.73056 N06.67075 N06.78252 N06.64316 N06.76092 N06.73056 N06.67075 -
E005.818770 E005.821410 E005.764470 E005.768670 E005.788640 E005.770260 E005.777240 E005.764470 E005768670 E005.788640 E005.770260 -
SPM(µg/m3) 32 29 27 27 28 28 28 22 22 22 24 250
Temperature,
oC
36.9 38.9 38.9 37.8 38.9 42.8 42.8
35.8.4 32.7 31.0 33.3 Ambient
Humidity,% 31.2 31 28 26 24 20 21 60 68 60 56
Carbon
monoxide, ppm <0.1 <0.1 <0.1 <0.1 <0.1 <0.1 <0.1
<0.1
<0.1
<0.1
<0.1
10-20
Carbon dioxide,
% 0.01 0.01 0.01 0.01 0.01 0.01 0.01
0.01 0.02 0.01 0.01 Ambient
Hydrogen
sulphide, ppm <0.1 <0.1 <0.1 <0.1 <0.1 <0.1 <0.1
<0.1
<0.1
<0.1
<0.1
-
VOC, mg/m3 <0.01 <0.01 <0.01 <0.01 <0.01 <0.01 <0.01 <0.01 <0.01 <0.01 <0.01
Oxygen,% 21.0 21.0 21.0 21.0 21.0 21.0 21.0 21.0 20.9 21.0 21.0 21.0
Sulphure
dioxide, ppm <0.1 <0.1 <0.1 <0.1 <0.1 <0.1 <0.1 <0.1 <0.1 <0.1 <0.1 0.01
Nitrogen oxides,
ppm <0.01 <0.01 <0.01 <0.01 <0.01 <0.01 <0.01 <0.01 <0.01 <0.01 <0.01 0.04-0.06
Source: OOPC – Extension Two Oil Palm Development Project; Final EIA Report 2016 (Secondary Data)

Okomu Oil Palm Company Plc: 60TPH Palm Oil Mill Project at Extension Two February 2020
Environmental Impact Assessment (EIA) – Final Report Page 101
4.5.4 Noise Level Measurement
Sound level was measured at same point as that for air quality. A CEL-254 Sound level
meter was first calibrated and re-checked before determining the sound level. The reading
was allowed to stabilize before recording in decibel units dB(A).
4.5.4.1 Results of Noise Level Measurements
Generally, the proposed project area and its environs are serene with no abnormal noise
level recorded except at the existing mill complex. A digital sound level meter was used to
measure the noise levels at different locations in the proposed project site. The
measurement taken at different locations of the proposed project site showed that the noise
levels range from 32.6 dB(A) to 52.4 dB(A). The noise levels are within Federal Ministry
of Environment permissible limit of 90 dB(A) for 8 hours exposure as presented in Table
4.9 below.
Table 4.9: Noise Levels Measurements around the Project Area
Source: OOPC – Proposed Palm Oil Mill at Extension Two; EIA Field Work, February 2019
Facility/
Workplace
Point A
Point B
Point C
Point D
Point E
Point F
(Odigiemute
Community) -
CTRL
Coordinate
(UTM 31N)
31N
0811895
31N
0811767
31N
0810755
31N
0811193
31N
0811604
31N
0805970
0739708 0739617 0738737 0738659 0741609 0738130
Elevation (m) 258m 252m 285m 291m 214m 260m
Noise, dB(A)
Dry Season,
28 February 2019
32.6 36.0 44.4 40.5 52.4
47.8
FMEnv Limits
(8-hr. Exposure)
90dB(A)

Okomu Oil Palm Company Plc: 60TPH Palm Oil Mill Project at Extension Two February 2020
Environmental Impact Assessment (EIA) – Final Report Page 102
4.5.5 Aquatic Biology
This section focuses on the water and bottom sediment characteristics within the area. This
component of the study is aimed at monitoring surface water and bottom sediment parameters
which, when altered, can easily affect the ability of the concerned attributes to perform their
natural functions. Although there is no surface river close to the proposed project site, it is
about 10km away from the proposed site.
The area is drained by two perennial water bodies, Jemide and Owan Rivers, which are
tributaries of the Osse River that originates from the Idanre hills and drains into the Benin
River into the Atlantic Ocean. Other water body sampled within the area was Stream 1 (06°
44' 30.4" N, 005° 49' 05.7" E). The major water body is the Jemide River (N 6° 45' 42.1" N,
005° 52' 43.9" E) which is over 12km to the proposed project area.
4.5.5.1 Surface Water Quality
In-situ physio-chemical parameters measured were pH, Electrical conductivity, Dissolved
Oxygen, salinity and temperature as presented in Table 4.10 below.
4.5.5.2 Methodology
Field and laboratory studies were carried out, in addition to literature studies. During the
fieldwork, present situation of salient environmental parameters with regards to water
resources quality was carried out. Sampling and laboratory analyses of water were aimed at
determining the magnitude and pattern of variation of appropriate physico-chemical and
microbiological parameters within the study area.
One (1No.) representative sample each of surface water was collected from stream 1 and
Jemide River (upstream and downstream) and then taken to the laboratory for analysis.
4.5.5.3 Field Work
At each sampling station, water samples were collected and stored in 2 liter polyethylene
bottles, and pre-treated as suggested by Battley and Gardner (1977). Samples for heavy metal
determinations were fixed with concentrated H2SO4 and refrigerated. Samples for
microbiological analyses were stored in sterile Macarthy bottles and also refrigerated. In-situ
measurements for pH, DO, Conductivity, Salinity, TDS and Temperature were determined
using various digital meters.

Okomu Oil Palm Company Plc: 60TPH Palm Oil Mill Project at Extension Two February 2020
Environmental Impact Assessment (EIA) – Final Report Page 103
4.5.5.4 Laboratory Analysis
a) Biochemistry of Water Sample:
The parameters determined, were Biochemical Oxygen Demand (BOD) and
Chemical Oxygen Demand (COD). Tests for these parameters were
conducted using the incubation method recommended by the American Public
Health Association (APHA).
b) Chemistry:
The following physico-chemical parameters were determined:
i. Water temperature: Water temperature was determined in-situ using
mercury-in-glass floating thermometer calibrated in 0C
ii. Hydrogen ion concentration (PH): pH was determined in-situ using
Hatch water analysis test kit model FF1A Cat. No. 2430-02.
iii. Dissolved oxygen (DO): the DO concentration was measured using the
standard winkers method (Boyd, 1979) and Mackereth et al, (1978)
iv. Conductivity: Electrical conductivity was determined using
conductivity meter Karl Kolb SE 1000 table conductivity meter at room
temperature.
v. Ammonia: Ammonia in water samples was determined by
Nelslerization method (Emerson et al., 1972) in-situ using Hatch water
analysis test kit model FF1A Cat. No. 2430-02.
vi. Nitrite: Nitrite was determined on the field using Hatch water analysis
test kit model FF1A Cat. No. 2430-02.
vii. Alkalinity: Alkalinity was determined on the field using Hatch water
analysis test kit model FF1A Cat. No. 2430-02.
viii. Total dissolved solid (TDS): TDS in water samples was determined by
the method described by Boyd (1979).
ix. Heavy Metal in water. The following heavy metals; Copper, Zinc,
Cadmium, Arsenic, Iron, Manganese, lead and Nickel, were
determined in water samples according to standard method using
atomic absorption spectrophotometer (AAS) (APHA, 1992).
x. Chlorine was determined by argentiometric titration according to Swindle
(1979)

Okomu Oil Palm Company Plc: 60TPH Palm Oil Mill Project at Extension Two February 2020
Environmental Impact Assessment (EIA) – Final Report Page 104
xi. Total Solids, Total Suspended Solid (CTSS) and Total dissolved solid
were estimated by gravimetric method.
xii. The total, calcium and magnesium hardness was carried out using EDTA
titration method.
xiii. Sulphate was measured using turbidimetric method while nitrate was
estimated using the flame photometer.
xiv. Magnesium and calcium was determined by EDTA titration method.
All other physico-chemical parameters were determined according to APHA, 23Ed.
(2005).
c) Microbiological analysis
The coliform count test was carried out following standard procedure (APHA,
2005). ‘Presumptive’, ‘confirmed’ and ‘complete’ tests were carried out following
the principle that except for many coliforms only a few bacteria will ferment lactose
with simultaneous production of acid and gas. The ultimate aim was to narrow down
the identification of the coliform to Escharichia coli or rule it out.
Sampling Locations
S/N Code Description Coordinate
1. OKMEXT2G River Jemide (upstream) N06041’41.8” E005052’44.2”
2. OKMEXT2H1 Stream I (upstream) N06045’56.1” E005050’50.4”
3. OKMEXT2H2 Stream I (downstream-by
G1-West)
N06047’35.41” E005051’11.04”
Source: OOPC: Proposed Palm Oil Mill at Extension Two; EIA Field Work, March 2019

Okomu Oil Palm Company Plc: 60TPH Palm Oil Mill Project at Extension Two February 2020
Environmental Impact Assessment (EIA) – Final Report Page 105
Table 4.10: Physico-chemical Analysis Result of Jemide and Stream 1 Upstream and Downstream
Water Samples at the Proposed Project Area.
PARAMETER/UNIT METHOD, APHA
(21st Edn.) OKMEXT2G OKMEXT2H1 OKMEXT2H2
FMEnv.
Limit
Jemide
Upstream
Stream 1
Upstream
Stream 1
Downstream
Appearance Visual Faint brown
with tiny floc Clear liquid with trace particles
pH Electrometric 6.67 11.25 8.80 6-9
Temperature, oC Thermometer 28.4 28.7 28.5 Ambient
Conductivity, S/cm 2510-B 63.9 71.20 57.20 2000
Colour, Pt-Co 2120-C <1 2860 320 7.0
Turbidity, NTU 2130-B 45 117 160 10
Total Solids, mg/L 2540-B 17.9 1045 118.6 -
Total Dissolved solids,
mg/L
2540-D 16.9 980 20.6 1000
Total Suspended Solids,
mg/L
2540-C 1 65 98 30
Total Hardness, mg/L 2340-C 4 <1 20 -
Total Alkalinity, mg/L 2320-B 9.6 60.7 23.04 -
Total acidity, mg/L 2310-B 6.96 <1.0 6.96 -
Calcium, mg/L as Ca 3500-B 0.80 <1.0 3.20 -
Magnesium, mg/L as Mg 3500-B 0.49 <1.0 2.92 -
Salinity as Chloride, mg/L 4500-B 27.79 41.8 6.95 200
Nitrate, mg/L -
4500-NO3 -B 0.22 0.19 0.14 50
Nitrite, mg/L -
4500-NO2 -B 0.09 0.07 0.03 0.3
Sulphate, mg/L 4500-E 17 26.0 10 250
Phosphate, mg/L 4500-C 2.1 4.66 3.65 -
Iron (total), mg/L 3500-B 0.88 2.58 0.20 20
Lead, mg/L 3500 -Pb-B <0.001 <0.001 <0.001 <1.0
Copper, mg/L 3500 -Cu-B <0.001 <0.001 <0.001 <1.0
Manganese, mg/L 3500 -Mn-B <0.001 <0.001 <0.001 0.10
Cadmium, mg/L 3500 -Cd-B <0.01 <0.01 <0.01 <1.0
Nickel, mg/L 3500 -Ni-B <0.01 <0.01 <0.01 <1.0
Cobalt, mg/L 3500 -Co-B <0.01 <0.01 <0.01 <1.0
Arsenic, mg/L 3500 -As-B <0.01 <0.01 <0.01 <1.0
Chem. Oxygen Demand,
mg/L
5220-D 34 25 22 80
Biochem. Oxygen
Demand, mg/L 5210-B 23.8 17.5 15.4 30
Dissolved Oxygen, mg/L 4500-G 6.8 11.2 4.8 >2.0
Total Hydrocarbon, mg/L Spectrophotometer <0.01 <0.01 <0.01
Pesticides, mg/L Screening <0.01 <0.01 <0.01
Total coliform count,
MPN/mL
9225-D 6 2 3 102

Okomu Oil Palm Company Plc: 60TPH Palm Oil Mill Project at Extension Two February 2020
Environmental Impact Assessment (EIA) – Final Report Page 106
Faecal coliform,
E.coli; CFU/mL 9222-D Nil Nil Nil -
Total plate count,
CFU/mL
9215-B 72 1.0 x 10² 1.0 x 10² 104
Source: OOPC: Proposed Palm Oil Mill at Extension Two; EIA Field Work, March 2019
4.5.5.5 Results and Discussions
Water quality varied from one location to another within the proposed project area. The pH
varied from 6.67–11.25, Conductivity 33.9–2,720(uscm-2), Turbidity 45-160, Total
Suspended solids 1-98 mg/l, Dissolved oxygen 4.8-11.2mg/L, Biological oxygen demand
15.4-23.8mg/l, Alkalinity 9.6-60.7mg/L, Hardness <1-20mg/L, Salinity as Chloride 6.95-
41.8mg/L, Phosphate 2.1-4.66, nitrate 0.14-0.22mg/l, Sulphate 10-26.0 mg/l, calcium <1.0-
3.20mg/l, Magnesium <1.0-2.92/l. All the values determined for heavy metals in the water
bodies occurred in low concentration (<0.01-<0.001mg/l), much below the recommended
limits by FMENV and WHO (<1.0). Water temperature was 28.4ºC± 0.4. The speed of the
water ranged from 0.5 to 0.7m/sec; with a mean of 0.603±0.054 m/sec. Secchi disc turbidity
for Jemide River was 80cm.
Colour
The apparent surface water colour is as a result of upward scattering of light after it passes
through the water columns at various depths and undergoing selective attenuation enroute.
From this study, the colour of the surface water ranged from <1 to 2860 Hazen units in
all the locations sampled. The study showed that areas with high dissolved organic matter
and biological activities have high water colour values which may be rightly linked to
presence of human, livestock and agricultural activities. The values obtained for ground
water in all location fell within FMEnv limit of 15 Hazen.
Conductivity
The measure of the ionic richness of the surface water is best reflected through the
conductivity test. The conductivity indicates the freshness or otherwise of the water. The
conductivity results obtained in this study ranged between 57.20 and 71.20 μS/cm. These
values are typical of fresh water bodies which is further collaborated by the observations
recorded for TDS (Mustapha, 2009, Ibrahim et al., 2009). This is attributed to evapo-
transpiraton and mineralization of organic matter. The values obtained however fell
within the conductivity range of 50 – 2,000 μS recommended for freshwater (Boyd, 1979).
Turbidity
Turbidity measures the ability of water to transmit the light that restricts light penetration
and limit photosynthesis. Turbidity in water is caused by suspended solids (organic and
inorganic) which is a major concern in aquatic systems where most aquatic organisms

Okomu Oil Palm Company Plc: 60TPH Palm Oil Mill Project at Extension Two February 2020
Environmental Impact Assessment (EIA) – Final Report Page 107
especially filter feeders cannot tolerate appreciable concentrations of inorganic particulate
matter. The surface water turbidity in the study site varies from 45 to 160NTU. The values
obtained did not comply with the FMEnv limit of 10 NTU. The high level of turbidity
obtained may be attributed to low level of water which allow for adequate light
penetration and consequent increase in the level of photosynthesis and also, due to
increase in the level of allochthonous substances that find their ways into the surface
waters relative to the volume of water available during the dry season (Ikomi et al., 2003;
Oso and Fagbuaro, 2008).
Total Dissolved Solids
Total Dissolved Solids is the total amount of mobile charged ions, including minerals,
salts or metals dissolved in a given volume of water. Total Dissolved Solids, TDS is
directly related to the purity of water and the quality of water purification systems and
affects everything that consumes, lives in, or uses water, whether organic or inorganic,
whether for better or for worse. The TDS for the surface water samples ranged from 16.9
to 980mg/L during this period. These values reflected that erosion and perturbation may
be low during the period of sampling. These values are however generally lower than the
FMEv limit of 1000mg/l for surface water and 500-1500mg/l WHO limits for drinking
water.
PH
The water bodies during the study were slightly neutral or slightly alkaline and had pH
values varying from 6.67 to 8.80 with an average of 7.97. All values fell within the
tolerable limits of pH 6 –9 stipulated by FMEv for surface waters except. This pH range
was in agreement with range obtained by Idowu and Ugwumba (2005); Atobatele et
al.,(2009), pH between 6.2 to 8.5 is ideal for biological productivity (Boyd, 1998).
Total Alkalinity (HCO3)
Alkalinity refers to the capacity of water to neutralise acid. Alkalinity (expressed as
HCO3) ranged from 50.1 to 62.4mg/l with an average of 68.1mg/l. Alkalinity in water is
due to any dissolved substance, usually weak anions that can accept and neutralise
protons. Most freshwaters contain bicarbonate alkalinity. The alkalinity values are
generally good when compared with the optimum range of 50 to 300mg/l recommended
by Boyd (1998). This could account for the low acidity encountered in the water samples.
Total Suspended Solids
These are solid materials, including organic and inorganic, that are suspended in the water
which include silt, plankton and industrial wastes. High concentrations of suspended

Okomu Oil Palm Company Plc: 60TPH Palm Oil Mill Project at Extension Two February 2020
Environmental Impact Assessment (EIA) – Final Report Page 108
solids can lower water quality by absorbing light. Waters then become warmer and lessen
the ability of the water to hold oxygen necessary for aquatic life. The TSS values for
surface water samples vary from 1 to 98 mg/l during the study in February 2019. The
range of values obtained was higher than the FMEnv limits of 30mg/l. This implies that
the water is turbid and could hinder photosynthetic activities.
Anions
Monovalent, divalent and tetravalent anions were determined and occurred in varying
amounts at all sampling stations. These are NO3-N, NO2-N and NH4 +-N (which are
different forms of nitrogen in the aquatic ecosystem), phosphates, sulphates and chlorides.
Ammonia is toxic to aquatic organisms in its unionized form. In water, some ammonia
usually combines with water molecules to produce the non-toxic ionized form known as
Ammonium (NH4). Compounds of nitrogen and especially those of phosphorus are major
cellular components of organisms. They are highly dynamic in the aquatic ecosystem. In
general, there is a moderately high level of NH4 +-N, which is expected, for the flora and
fauna presence in the sampling stations. Of all forms of nitrogen, the most stable and
easily utilized is the nitrate derived from the oxidation of nitrite. The nitrate levels in the
surface water were between 0.14 to 0.22mg/L with an average of 0.18. This is less than
10 to 50mg/l limit by WHO and FMEnv. Aquatic organisms need nitrates as essential
nutrient for primary productivity and thus its value couple with that of phosphate gives a
true indication of species abundance and activity of aquatic life. The nitrite levels were
significantly low during this study (<0.01 – 0.1mg/l) in all the sample monitored. The
values obtained fall below 0.3mg/l FMEnv limit.
Phosphorus is a basic element in living matter and occurs in natural waters and
wastewaters almost solely as phosphates. This major component of agricultural fertilizers
is a limiting nutrient in many river systems. The phosphate values recorded from the study
area varied from 2.1 to 4.66mg/l with an average of 3.47 mg/L. The values are generally
below the limit of 3.50 and 5.0mg/l by WHO and FMEnv.
Sulphate values recorded were quite low and ranged from 10 to 26.0 mg/L with an average
of 53.0 mg/L. Beauchamp (1953) had reported that African inland waters are generally
deficient in this anion, which is due to its low concentration in the non-sedimentary rock
of drainage areas. Chloride anions were the most abundant anion reported; they ranged
from 6.95 to 41.8 mg/L during the sampling. The chloride values observed were basically
of the freshwater bracket. All values reported were lower than the recommended limits of
200 mg/l set by FMEnv.

Okomu Oil Palm Company Plc: 60TPH Palm Oil Mill Project at Extension Two February 2020
Environmental Impact Assessment (EIA) – Final Report Page 109
Chemical Oxygen Demand (COD)
The Chemical Oxygen Demand (COD) is an expression of the reducing capacity that
measures the oxygen equivalent of the organic matter content of a sample that is
susceptible to oxidation by a strong chemical oxidant. The COD values ranged from 22
to 34 mg/l with an average of 27 mg/L. These values were all below the 80 mg/l limit
recommended for surface waters by FMEnv.
Exchangeable Cations
The major cations dissolved in natural freshwaters are calcium, magnesium, sodium and
potassium, and of these, calcium and sodium are normally dominant. This observation
was made by Willoughby (1976) and Chukwunogo (1990) and was also confirmed in this
study. Calcium was the most abundant of all the cations during this study with a range of
<1.0 to 3.20 mg/l. Magnesium concentrations ranged from <0.1mg/l to 2.92mg/l. The high
values of Ca and Mg reported are attributable to the geomorphology of the area. The total
concentration of calcium and magnesium expressed as their CaCO3 equivalent denotes
the total hardness of waters. The presence of a generous amount of dissolved calcium
makes the water “hard”. All values reported were lower than the recommended limits of
<2000mg/l set by FMEnv.
Heavy Metals
Some of these heavy metals are highly toxic when present beyond the recommended limit.
The sources of these heavy metals may be associated with industrial process such as
electroplating, Smelting, Engraving and Battery manufacturing. Also inorganic fertilizer
such as phosphate fertilizer and Sewage used in Agricultural land could be a source.
The results of the heavy metals analysed show that all the metals occurred in trace levels
or very minute quantities far below recommended limits set by FMEnv. The values were
lower than that reported for Nigerian inland and coastal waters (Egborge, 1991). The iron
content measured in the surface water ranges from 0.20 to 2.58mg/L, while the cadmium
value was ˂0.01 (Table 4.10).
The lead content measured in the surface water <0.001 mg/l. Major sources of this metal
are atmospheric deposition of exhaust from vehicles, disposal of batteries, sewage
discharge, highway run-off and agricultural run-off from field fertilized with sewage
sludge. Nickel and Arsenic levels in the surface water samples are generally ˂0.01mg/l
and ˂0.01mg/l, respectively for all the water sampled. Copper levels were ˂0.001 mg/L
for all the water samples.

Okomu Oil Palm Company Plc: 60TPH Palm Oil Mill Project at Extension Two February 2020
Environmental Impact Assessment (EIA) – Final Report Page 110
Microbiological Characteristics of Ground water and Surface water
Pure water is completely free from micro-organisms such as bacteria, viruses, fungi and
so on. Good quality water should be free from disease-causing organisms such as
pathogenic bacteria, viruses, protozoa, or parasitic worms [Akpata and Ekundayo, 1978].
The presence or absence of living organisms in water can be one of the most useful
indicators of its quality. In streams, rivers and lakes, the diversity of fish and insects
species provides a measure of the biological balance or health of the aquatic environment.
A wide variety of different species of organisms usually indicates that the stream or lake
is unpolluted. The disappearance of certain species and overabundance of other groups of
organisms could indicate level of pollution. A very important biological indicator of water
quality and pollution used in environmental technology is the group of bacteria called
coliforms. Consequently, water that has been recently contaminated with sewage will
always contain coliforms (APHA, 1998). A particular species of coliforms found in
domestic sewage is called Eschericha coli (E. Coli). Coliform bacteria are organisms that
hardly survive in water longer than most pathogens and are also relatively easy to detect.
In general, it can be stated that if a sample of water is found not to contain coliforms, then
there has not been recent sewage pollution and the presence of pathogens is therefore
extremely unlikely. On the other hand, if coliforms are detected, there is a possibility of
recent sewage pollution. However, additional tests would be required to confirm that the
coliforms are from sewage and not from other sources [WHO/UNICEF, 1986 and UNEP,
1996]. A total coliform test is particularly applicable to the analysis of drinking water to
determine its sanitary quality. Drinking water must be free from coliforms of any kind.
On the other hand, a feacal coliform test is more appropriate for monitoring pollution of
natural surface water or groundwater, since a total coliform count would be inconclusive
in this case.
In this study, the coliform count was far below recommended limit of 102 by FMEnv.
Fisheries
Fishing activities were not noticeable in all the surface water within the proposed project
coverage areas. However, the list of few fish species identified during the study and those
reported to be available by members of the community but not sighted during the course
of sampling. Generally, fish diversity within the proposed project area is very low. This
could be attributed to low volume of surface water sampled and possibly the alternative
usage of most of the water bodies make it less productive for fish to thrive.

Okomu Oil Palm Company Plc: 60TPH Palm Oil Mill Project at Extension Two February 2020
Environmental Impact Assessment (EIA) – Final Report Page 111
The results obtained from the study showed that all investigated physico-chemical
parameters were within desirable limits for growth, survival and production of fish as well
as for public consumption.
Regular monitoring of the physical, chemical and biological properties of both surface
and ground water within the proposed project area is canvassed to quickly remediate any
parameters going beyond tolerable limits before havoc is wrecked.
4.5.6 Sediment Studies
4.5.6.1 Methodology
Two (2Nos.) sediment samples were taken during fieldwork exercise, Sediment samples
were taken at location where water sample was collected. The sediment samples were taken
using a Van-Veen type grab sampler and sediment samples for Total Hydrocarbon
estimations, Poly Aromatic Hydrocarbons and phenols were stored in aluminum foils and
refrigerated prior to laboratory analyses, while samples for microbiological analyses were
stored in sterile Teflon bags and equally refrigerated. Samples for others were stored in
labeled polyethylene bags prior to laboratory analysis.
4.5.6.2 Laboratory Analysis
The collected sediment samples were used for the laboratory analyses at Environmental
Laboratory Services, 28 Apaola Street, off Aladelola Ikosi Ketu, Lagos State. The analyses
undertaken were as follows:
a. Physico-chemical Characteristics:
- Particle size, soil texture, moisture content and organic content. Particle
size was determined using the standard Bouycous hydrometer, while
organic content were determined using sodium hexametaphosphate
solution method.
- Major and trace metals Mg2+, Ca2+, Na+, Zn2+, K+) were determined using
the X-Ray Fluorescence (XRF) method.
- Heavy metal (Cu, Fe, Pb, Cd, V, Ni, Hg, etc) were determined using
atomic absorption spectrophotometery method.
- pH, oil and grease, Total Hydrocarbon Content (THC) using standard
methods.

Okomu Oil Palm Company Plc: 60TPH Palm Oil Mill Project at Extension Two February 2020
Environmental Impact Assessment (EIA) – Final Report Page 112
b. Geotechnical Studies:
Geotechnical studies were conducted for engineering characteristics of the
sediments. In order to achieve this, the following classification tests were
conducted using standard engineering methods.
- Moisture content determination
- Grain size analysis
- Specific gravity
- Permeability
- Bulk density
- Strength test
c. Microbiology:
Soil and bottom sediment samples were subjected to microbiological tests as
follows:
- Total heterotrophs, were isolated using the standard plate count
(SPC) technique.
- Total pathogens were isolated using three (3) selective media
(MacConkey agar, blood agar and decoxycholocate agar.
- Fungi were isolated using minimal salts agar.
- Hydrocarbon utilizing micro-organisms were determined using
minimal salt agar, and a single source of carbon (crude petroleum)
according to the method described by Raymond et al (1976).
d. Identification of Micro Organisms
Hydrocarbon utilizing bacteria was first purified to obtain a pure culture, stained
by grain staining technique to differentiate gram positive from gram negative
organisms. The organisms were then passed through series of biochemical tests
which include glucose/gas production, lusive/omitare, hydrogen sulfide and
indole, oxidize, adonitol, arabinose, sorbitol, ducitol, motility, phenyl alanine,
urea, citate utilization. All these reagents were packaged in three sets.
1. BBL minitech for identification of gram positive organisms.
2. BBL. Enterotubes I and H for identification of gram negative bacteria
(oxidize negative).
3. BBL oxiferm tubes I and H for identification of gram negative, oxidize
positive bacteria.

Okomu Oil Palm Company Plc: 60TPH Palm Oil Mill Project at Extension Two February 2020
Environmental Impact Assessment (EIA) – Final Report Page 113
The BBL identification kit is latest technology in numerical identification of
microorganisms. It is packaged by Becton Dickinson Microbiology Systems, USA.
The bicode manual used for identification is the 1993 version. Fungal and yeast
identification was at specie level by microscopic examination and sugar
fermentation.
e. Total Hydrocarbon Contents
Sampling and subsequent laboratory analyses of sediment samples were aimed at
checking if the proposed site area has been impacted. At each sampling point,
sediment was collected in aluminum foil and kept in a refrigerator prior to the time
of analysis. The hydrocarbon content of the samples was extracted using the Soxhlet
apparatus with methylene chloride under reflux for a minimum of 6 hours as
suggested by Brown et al (1983). The extract, which was concentrated with a rotary
evaporator was analyzed by Gas Chromatography with flame ionization Detector
(GC-FID) and quantified by comparison with the appropriate THC standard.
4.5.6.3 Results and Discussions
The planktonic community was represented by 25 species of phyto-planktons and 2 species
of zooplankton. The phytoplankton consist of Bacillariohyta (7 species), Chlorophyta (9
species) Euglenophyta (4 species) Cyanophyta (1 species), and Dinophyta (7 species) while
the zooplankton was up of 2 species of Cladocera and Copepoda. There was no evidence of
eutrophication (alga bloom).
The benthic fauna of the Jemide river and stream 1 is made up of eleven (11) species;
decapods, crustacean and larval forms of Coleoptera, Diptera, Tricoptera and Odonata.
These species are indicative of the absence of organic pollution.
Ichthyofauna
Ichthyofauna (fishes) information revealed that the fish comprised mainly members of the
family Cichlidae (Oreochromis niloticus, Sarotherodon galilaeus), Clariidae (Clarias
gariepinus and Heterobranchus longifilis), Hepstidae (Hepsetus odoe) and Gymnarchidae
(Gymnarchus niloticus).

Okomu Oil Palm Company Plc: 60TPH Palm Oil Mill Project at Extension Two February 2020
Environmental Impact Assessment (EIA) – Final Report Page 114
Table 4.11: Checklist of Phtoplankton Species Recorded from the Water Bodies
around the Project Area
TAXA Stream 1
Jemide
Downstream
Jemide
Upstream
BACILLARIOPHYTA
1 Baccillaria paradoxa 19 16
2 Flagillaria sp 32 15 15
4 Bidulphia regia 1 5 1
5 Melosira granulata 1
6 Synedra acus 17 11 10
7 Synedra ulna 16 4 14
CHLOROPHYTA
8 Melosira granulata 1 1
9 Volvox africana 1
10 Spirogyra sp 18 8 22
11 Spirogyra majuscula 10 4
12 Pandorina morum 21 11
13 Pandorina sp 60 17
14 Closterium gracile 1
15 Closterium pseudonulula 1
16 Sirogonium melanosporum 8 7 3
17 Scenedesmus sp. 1
EUGLENOPHYTA
18 Euglena spirogyra 1
19 Phacus Curvicauda 1
20 Phacus acuminatus 1
21 Euglena sp 7 15 32
CYANOPHYTA
22 Coelosphaerium pallidum 2
DINOPHYTA
23 Gymnodinium fusum 11 2 4
24 Merisbmospeida elegans 3
25 Microcystis aeruginosa 14 4
ZOOPLANKTON
ARTHROPODA
CRUSTACEA
CLADOCERA
SIDIDAE
26 Diaphanosoma excisum 1
COPEPODA
ORDER CYCLOPOIDA
27 Mesocyclops bodanicola 6 2 3 Source: OOPC: Proposed Palm Oil Mill at Extension Two; EIA Field Work, March 2019

Okomu Oil Palm Company Plc: 60TPH Palm Oil Mill Project at Extension Two February 2020
Environmental Impact Assessment (EIA) – Final Report Page 115
Table 4.12: List of benthic fauna Recorded from the Water Bodies around the Project Area
TAXA STREAM 1
JAMIDE
UPSTREAM
JAMIDE DOWN
STREAM
DECAPODA
1 Desmocaris trispinosa 5 2
2 Caridina gabonesis 2 2 6
DIPTERA
Chironomidae
3 Chironomus sp 5 1
4 Chironomus fractilobus 2
5 Tarnypus sp 5 3
6 Culex sp 1
COLEOPTERA
7 Hydrophilus sp 1 1
EPHEMEROPTERA
8 Elassoneura candida 2
9 Cloeon sp 12 4
10 Baetis sp 3
TRICHOPTERA
11 Trichoptera larvae 2
ODONATA
12 Anisoptera
13 Aphyla sp 2
14 Libellula sp 3
Source: OOPC: Proposed Palm Oil Mill at Extension Two; EIA Field Work, March 2019
Bottom Sediments
The results of the laboratory analyses of the bottom sediment samples collected during the field
exercise are presented in Table 4.13. The pH value of the sediment samples was within the
range of 6.50 and 6.74 with an average of 6.62. Results of grain size analyses showed that the
sediment samples were predominantly made up of sand with an average content value of 85.0%
followed by silt having an average content value of 2.15% and lastly clay with 2.0% average
content value.
Table 4.13: Bottom Sediment Analysis Result
Sample
Code
pH E.C
(µS/cm)
O.C
(%)
THC
(mg/kg)
SAND
(%)
CLAY
(%)
SILT
(%)
September 2015
SP1 6.50 678.50 0.03 0.001 85.00 2.00 2.15
SP2 6.74 760.80 0.05 0.002 85.00 2.00 2.15
Source: Extension Two Oil Palm Development Project; EIA Final Report December 2016

Okomu Oil Palm Company Plc: 60TPH Palm Oil Mill Project at Extension Two February 2020
Environmental Impact Assessment (EIA) – Final Report Page 116
4.5.7 Soil Characteristics
Using Dutch Soil Auger and Mussel Soil Colour Chart, the morphological
characteristics of the soils were examined from the soil surface to a depth of
120cm.
4.5.7.1 Soil Profile:
The soil profiles were described according to the FAO guideline (2010).
The soil characteristics and morphological properties were described for
each of the identified horizons (layers) in the profiles. The soil colour was
evaluated with the aid of Munsell Soil Colour Charts; texture was determined on
the field by hand feel method, at moist state. Structure, concretions, roots
and boundary forms were described using visual assessment. The soil
consistence was determined at dry, moist and wet states on the field.
After the description of the sites and soil profiles, samples were taken from
each of the soil profiles, starting from lowest horizon upward. The samples were
put into polythene bags and labelled for laboratory analyses.
4.5.7.2 Laboratory Analytical Methods
The soil samples collected were air dried at room temperature and sieved through a 2mm
sieve. The resulting soil samples were analysed for their physical and chemical
properties as follows: Particle size was determined by hydrometer method (Gee and
Boulder, 1986). Available Phosphorous (P) was determined by Bray P-I method
(Anderson and Ingram, 1993). Total Nitrogen (TN) was determined by macro-kjedhal
method (Brookes et al., 1985). Soil pH was determined in a 1:2 soil to water suspension
using a pH meter (Maclean, 1982). Exchangeable bases were extracted using NH40AC
buffered at pH 7.0 (Thomas, 1982). While Potassium (K) and Sodium (Na) were read
from a flame photometer, Exchangeable Calcium (Ca) and Magnesium (Mg) was
determined using atomic absorption spectrophotometer. Total Exchangeable acidity (H+
+ Al3+) was by titration method (Anderson and Ingram, 1993) while effective cations
exchange capacity was determined by summation of exchangeable cations and
exchangeable acidity (Tan, 1996).
The gravel portion (> 2mm diameter), of the soil samples were weighed
and the ratio of gravel to fine earth calculated. Thus, the gravel content
was calculated as a percentage of total air-dried soil. The proportion or
gravel content goes a long way to influence, soil physical properties like
bulk density, porosity, compatibility, shearing index, infiltration and
hydraulic conductivity rates, etc.

Okomu Oil Palm Company Plc: 60TPH Palm Oil Mill Project at Extension Two February 2020
Environmental Impact Assessment (EIA) – Final Report Page 117
4.5.8 General Soil Properties and Interpretation
4.5.8.1 Particle Size Distribution
Characteristically, the soils had low silt and clay content and high sand contents (Table
4.14). These soils had sand content that ranged in values between 70.60% and
93.20% .The surface horizons in most cases had higher sand content than the subsurface
horizon but there was no consistent pattern of profile distribution of the sand particle
size fraction. The values of silt content of the soils were comparatively lower than the
values of the sand fractions and ranged in values from 1.40% and 13.40% in the surface
soils, while the subsurface horizons had silt contents that ranged from 1.40% to 17.40%.
The profile distribution of the silt particle size fraction did not follow any regular pattern
of distribution within the profile. The clay contents of these soils increased with
increasing soil depth in most profiles except in profile P.2Bwhere there was decrease in
the clay content of the soil with increasing soil depth. However there was no strong
evidence of clay illuviation in many of the profiles. Pedons P.2B, P.6B, P.157, P.177
and P.191 have no accumulation of clay in any part of the profile, while the remaining
profiles show some weak evidence of argilluviation. The surface horizons had clay that
ranged in value from 5.40% to 15.00% while the subsurface horizons had clay content
that ranged from 5.40% to 28.00%.
The textures of these soils were predominantly sand to loamy sand in the epipedon while
the subsurface horizons were predominately sand to sandy clay loam in texture. Three
profiles (P.6B, P.177 and P.191) had no textural change with increasing soil depth.
These profiles had sand textural class throughout the profile.
The soil structural classes of the soils ranged from weakly formed fine-crumbs in the
surface horizons to moderately developed medium and coarse sub-angular blocky
structures in the subsurface horizons. The consistencies were loose – friable in the
surface and firm in the sub surface horizons.
4.5.8.2 Bulk Density, Porosity and Soil Gravimetric Water Content
The soil bulk density (ρb) varied from one part of the surveyed site to the other and from
one mapping unit to the other but was lower generally in the soil surface compared with
the deeper soil layers and thus majorly increased with increasing soil depth while the
soil total porosity (Pt)was higher at the uppermost layers (0-25 cm) of the soil than the
underlying layers. The gravimetric water content (θg) also, increased with increasing
soil depth in most parts of the surveyed soil. The high bulk density values recorded as
the profiles depth increases, according to Mbagwu et al. (1984) could be caused by
translocation of clay from eluvial horizon, with simultaneous loss of structure and closer

Okomu Oil Palm Company Plc: 60TPH Palm Oil Mill Project at Extension Two February 2020
Environmental Impact Assessment (EIA) – Final Report Page 118
packing of sand grains in the eluvial horizon. Other authors such as Rasool et al., (2007);
Singh et al., (2007); Busari et al. (2012a); Busari et al., (2012b) have reported increase
in bulk density with increasing soil depth because of influence of soil organic matter
which was higher in the upper horizon than the lower horizons (Salako et al., 2006).
With exception of some parts of mapping unit 6 (P.2b and P.6B), the range of bulk
density, total porosity and θg from all the mapping units portend no hindrance to oil palm
cultivation. These ranges of bulk density and θg are a reflection of the various land uses,
vegetation and topography of the different parts of the surveyed site. For instance, in the
SMU 2 of the surveyed land around profile pit P.001 the low range of ρb and high range
of θg is attributable to densely vegetated Chromoleana odorata (Siam weeds) with less
human impacts and a nearly flat land terrain.
Table 4.14: Soil Particle Size Analysis of Representative Soil Profiles
S/Code H-Depth Sand Silt Clay Soil texture
% % % P.001 0-20 93.20 1.40 5.40 Sand
20-66 77.20 17.40 5.40 loamy sand
66-142 79.20 15.40 5.40 loamy sand
142-200 75.20 2.80 22.00 Sandy clay loam
P.011 0-15 89.20 4.80 6.00 Sand
15-35 89.20 4.80 6.00 Sand
35-83 91.20 2.80 6.00 Sand
83-146 75.20 1.40 23.40 sandy clay loam
146-200 75.20 1.40 23.40 sandy clay loam
P.040 0-5 75.20 13.40 11.40 sandy loam
5--49 83.20 4.30 12.50 loamy sand
49-97 76.20 4.40 19.40 sandy loam
97-160 76.60 3.40 20.00 sandy clay loam
P.091 0-21 92.60 1.40 6.00 Sand
21-71 82.60 5.40 12.00 loamy sand
71-115 76.60 3.40 20.00 sandy clay loam
115-163 70.60 1.40 28.00 sandy clay loam
P.095 0-49 90.60 3.40 6.00 Sand
49-73 82.60 3.40 14.00 sandy loam
73-121 85.60 8.80 5.40 loamy sand
121-160 91.80 2.80 5.40 Sand
P.111 0-9 91.80 2.80 5.40 Sand
9--49 85.80 8.50 5.70 loamy sand
49-91 83.80 10.50 5.70 loamy sand

Okomu Oil Palm Company Plc: 60TPH Palm Oil Mill Project at Extension Two February 2020
Environmental Impact Assessment (EIA) – Final Report Page 119
91-180 75.80 3.80 20.40 sandy clay loam
P.117 0-8 91.80 0.80 7.40 Sand
8--54 91.20 3.40 5.40 Sand
54-139 75.20 4.40 20.40 sandy clay loam
137-170 75.20 2.40 22.40 sandy clay loam
P.137 0-11 93.20 1.40 5.40 Sand
11--41 90.40 4.20 3.86 Sand
41-119 79.20 5.40 15.40 sandy loam
119-200 75.20 5.40 19.40 sandy loam
P.157 0-13 93.20 1.40 5.40 Sand
13-36 93.30 1.40 5.40 Sand
36-90 91.20 1.40 7.40 Sand
90-170 89.20 1.40 9.40 loamy sand 170-200 89.20 1.40 9.40 loamy sand
P.159 0-10 93.20 1.40 5.40 Sand
10--37 91.80 1.80 6.40 Sand
37-80 91.80 2.80 5.40 Sand
80-170 83.20 3.40 13.40 sandy loam
P.177 0-12 89.20 5.40 5.40 Sand
12--45 92.60 2.00 5.40 Sand
45-103 90.60 4.00 5.40 Sand
103-182 88.00 6.60 5.40 Sand
P.191 0-13 88.00 6.60 5.40 Sand
13-48 88.00 6.60 5.40 Sand
48-112 90.60 4.00 5.40 Sand
112-170 90.00 4.60 5.40 Sand
P.196 0-20 92.60 1.40 6.00 Sand
20-48 92.60 1.40 6.00 Sand
48-120 78.60 5.40 16.00 sandy loam
120-180 84.60 1.40 14.00 loamy sand
P.2B 0-16 85.60 2.40 12.00 loamy sand
16-61 85.60 2.40 12.00 loamy sand
61-150 91.20 2.80 6.00 Sand
150-200 93.20 0.80 6.00 Sand
P.6B 0-20 91.20 2.80 6.00 Sand
20-49 89.20 4.80 6.00 Sand
49-145 89.20 4.80 6.00 Sand
145-190 91.20 2.80 6.00 Sand
Source: Extension Two Oil Palm Plantation Development Project, Final EIA Report 2016

Okomu Oil Palm Company Plc: 60TPH Palm Oil Mill Project at Extension Two February 2020
Environmental Impact Assessment (EIA) – Final Report Page 120
Table 4.15: Some Soil Physical Properties of the Representative Soil Profiles
Profile No
Depth
(cm)
Bulk density
(g cm-3)
Total Porosity
(%)
Gravimetric water
content (%)
PT.001 0-25 0.89 65.40 16.09
25-50 1.32 48.29 14.62
50-75 1.68 34.37 12.12
75-100 1.25 51.08 17.07
PT.011 0-25 1.76 31.19 11.56
25-50 2.07 19.26 15.27
50-75 1.98 22.84 20.62
75-100 1.97 23.24 21.76
PT.040 0-25 1.47 42.72 11.11
25-50 1.69 33.97 10.24
50-75 1.93 24.43 14.21
75-100 1.91 25.22 16.49
PT.091 0-25 1.71 33.18 11.90
25-50 1.94 24.03 8.38
50-75 1.89 26.02 13.98
75-100 1.77 30.79 16.67
PT.095 0-25 0.91 64.45 10.38
25-50 1.19 53.46 17.35
50-75 1.62 36.76 27.61
75-100 1.45 43.52 20.42
PT.111 0-25 1.00 61.02 10.20
25-50 1.07 58.24 15.24
50-75 1.02 60.23 16.00
75-100 1.31 48.69 13.95
PT.117 0-25 1.85 27.61 6.04
25-50 2.15 16.08 8.53
50-75 1.94 24.03 11.52
75-100 1.98 22.84 15.46
PT.137 0-25 1.21 52.67 5.88
25-50 1.15 55.05 9.73
50-75 1.20 53.07 11.02
75-100 1.43 44.32 12.14
PT.157 0-25 1.26 50.68 2.42
25-50 1.30 49.09 4.69
50-75 1.20 53.07 5.08
75-100 1.35 47.10 6.02
PT.159 0-25 1.42 44.53 2.32
25-50 1.57 38.67 3.76

Okomu Oil Palm Company Plc: 60TPH Palm Oil Mill Project at Extension Two February 2020
Environmental Impact Assessment (EIA) – Final Report Page 121
Source: Extension Two Oil Palm Plantation Development Project, Final EIA Report 2016
4.5.9 Soil Chemical Characteristics
The soils had reaction ranging from strongly acid to slightly alkaline (5.10 - 7.40). The
exchangeable acidity (H + Al) values of the soils were low and ranged from 0.03 to 0.09cmol
kg-1 (Table 4.16).
The exchange sites of these soils were dominated by exchangeable calcium and magnesium.
The exchangeable calcium (Ca2+) ranged in values from 3.17cmol kg-1 to 16.85cmol kg-1. In
most profiles, the highest Ca value was observed in the first surface horizon. The Magnesium
(Mg2+) contents of the soils varied from 0.48cmol kg-1 to 2.30cmol kg-1. Exchangeable K+
content of the soils was low and ranged from 0.02cmol kg-1to 0.48cmol kg-1.
The subsoil had values of K+ that was lower than 0.10cmol kg-1in most cases. Apart from Ca
and Mg which were moderate in all the pedons, the values of exchangeable K and Na within
the rooting zones (0- 100 cm) were well below the suggested critical requirements for most
arable crops grown in the agro-ecological zone of the project site. This means that apart from
Ca2+and Mg2+which are adequate in supply, the quantity of the other exchangeable bases will
limit crop production in these soils.
50-75 1.66 35.16 3.89
75-100 1.92 25.00 5.01
PT.177 0-25 1.23 51.87 3.31
25-50 1.39 45.51 5.11
50-75 1.33 47.90 5.34
75-100 1.36 46.70 6.72
PT.191 0-25 1.24 51.48 2.46
25-50 1.33 47.90 3.05
50-75 1.28 49.88 7.94
75-100 1.27 50.28 5.60
PT.196 0-25 0.95 63.01 6.45
25-50 1.11 56.65 6.42
50-75 1.37 46.30 1.48
75-100 1.47 42.72 1.39
PT.2B 0-25 1.85 27.61 3.85
25-50 2.03 20.85 4.52
50-75 2.23 12.89 5.94
75-100 2.10 18.06 6.80
PT.6B 0-25 1.69 33.97 4.22
25-50 1.86 27.21 3.83
50-75 1.81 29.20 8.43
75-100 1.48 42.33 8.97

Okomu Oil Palm Company Plc: 60TPH Palm Oil Mill Project at Extension Two February 2020
Environmental Impact Assessment (EIA) – Final Report Page 122
The suggested soil critical levels of exchangeable Mg (0.28cmol kg-1) showed that the Mg2+
status of the soil will not limit the yield of oil palm grown on these soils. Soils with
exchangeable K less than 0.13cmol kg-1 have been classified as being poor in K, and those
that contained between 0.13cmol kg-1 to 0.31cmol kg-1 as being moderately endowed with K,
while those having exchangeable K that is greater than 0.31cmol kg-1 were regarded as being
adequate in K.
In Nigeria, the recommended critical K level for oil palm ranged between 0.18cmol kg-1 and
0.35cmol kg-1. Based on the above recommendation, the supply of K is expected to limit the
production of oil palm on these soils. Also, the low K+: Ca2+ or K+: Ca2+ + Mg2+ratio is likely
to aggravate the problem of K+ uptake. Kirkman et al. (1994) noted that the displacement of
K+ by Ca2++(Mg2+) was particularly important in the soils because of selective adsorption of
Ca2+ which resulted in leaching of K+. Parfitt (1992) also reported that a high solution
concentration of Ca2+ led to complementary ion effect occurring between Ca2+ and K+ and
that this led to reduced K+ uptake by plants. Application of K fertilizer will be a critical
requirement for sustainable use of these soils for oil palm production.
The effective cation exchange capacity (ECEC) of the soils was low in pedon P.001 but
moderate in all other pedons. The ECEC in pedon P.001 ranged from 4.71cmol kg-1to
7.66cmol kg-1 while those of the remaining pedons ranged from 10.05cmol kg-1 to
18.64cmolkg-1. Percentage base saturation (BSat) values ranged between 98.96% and 99.75%.
In most of the profiles, the sum of Ca2+ and Mg2+ accounted for more than 80% of the TEB
and ECEC.

Okomu Oil Palm Company Plc: 60TPH Palm Oil Mill Project at Extension Two February 2020
Environmental Impact Assessment (EIA) – Final Report Page 123
Table 4.16: Soil Chemical Properties of the Representative Soil Profiles
Profile
No.
H-
Depth
pH
N
(%)
Org
C
(%) Al+H Ca Mg K Na ECEC
CEC
clay B-Sat ESP Av. P Mn Fe Cu Zn EC
cmol kg-1 mg kg-1 P.001 0-20 5.60 0.09 1.02 0.08 5.99 1.12 0.18 0.29 7.66 7.00 98.96 3.79 2.15 22.15 12.75 0.65 2.05 70.50
20-66 5.51 0.04 0.61 0.06 4.23 1.19 0.15 0.21 5.84 5.44 98.97 3.60 2.99 25.06 13.83 0.75 1.65 56.40
66-142 5.61 0.02 0.33 0.06 3.42 1.16 0.02 0.05 4.71 4.50 98.73 1.06 3.06 23.90 12.80 0.60 1.55 28.20
142-
200 5.61
0.02 0.11 0.05 3.66 1.36 0.04 0.07 5.18 5.16 99.03 1.35 1.81 13.47 14.38 0.55 1.75 28.20
P.2B 0-16 5.46 0.09 0.08 0.07 3.17 1.26 0.04 0.14 4.68 4.66 98.50 2.99 2.92 9.10 15.05 0.50 1.65 28.20
16-61 5.36 0.01 0.14 0.07 9.41 1.48 0.03 0.11 11.10 11.06 99.37 0.99 4.81 12.35 21.46 0.45 1.55 14.41
61-150 5.41 0.17 2.02 0.06 12.23 1.42 0.26 0.49 14.46 13.28 99.59 3.39 6.04 19.05 19.30 0.35 2.85 84.60
150-
200 5.36
0.02 0.16 0.07 10.10 1.12 0.12 0.24 11.65 11.56 99.40 2.06 5.04 3.00 17.10 0.50 1.80 56.40
P.6B 0-20 5.77 0.08 0.75 0.08 10.18 1.22 0.18 0.35 12.01 11.57 99.33 2.91 6.37 10.25 14.35 0.45 1.95 42.30
20-49 5.72 0.02 0.27 0.08 11.33 1.51 0.03 0.07 13.02 12.86 99.39 0.54 5.37 7.65 12.98 0.55 1.60 14.10
49-145 5.56 0.01 0.12 0.05 12.53 1.62 0.03 0.11 14.34 14.27 99.65 0.77 4.26 2.60 13.80 0.60 1.80 14.10
145-
190 5.41
0.01 0.13 0.06 13.28 1.73 0.07 0.13 15.27 15.19 99.61 0.85 4.78 5.85 18.72 0.25 3.65 28.20
P.011 0-15 5.70 0.17 2.27 0.08 15.58 2.42 0.19 0.37 18.64 17.32 99.57 1.98 2.26 93.10 12.70 0.35 6.90 112.80
15-35 5.41 0.05 0.34 0.06 11.63 1.47 0.07 0.13 13.36 13.16 99.55 0.97 2.17 16.05 24.85 0.80 3.40 42.30
35-83 5.31 0.02 0.16 0.07 10.55 1.39 0.05 0.11 12.17 12.08 99.42 0.90 1.96 9.40 20.18 0.65 5.05 14.10
83-146 5.80 0.01 0.14 0.07 12.02 1.20 0.04 0.09 13.42 13.40 99.48 0.67 3.61 12.65 19.85 0.75 3.75 14.10 146-
200 5.76
0.01 0.12 0.06 11.48 1.10 0.04 0.11 12.79 12.77 99.53 0.86 3.33 15.50 24.30 0.70 2.75 28.20
P.040 0-5 5.60 0.09 0.71 0.07 13.28 1.16 0.41 0.71 15.63 15.41 99.55 4.54 4.87 14.35 23.20 0.75 2.40 56.40
5-49 5.20 0.03 0.19 0.04 8.99 0.98 0.07 0.13 10.21 10.16 99.61 1.27 6.03 13.85 15.65 0.90 2.50 14.10
49-97 4.90 0.03 0.28 0.03 10.15 1.02 0.04 0.09 11.33 11.28 99.74 0.79 2.70 14.60 13.86 0.80 2.35 28.20
97-160 4.80 0.01 0.10 0.05 9.33 0.56 0.04 0.07 10.05 10.03 99.50 0.70 2.08 16.66 16.05 0.65 1.75 28.20
P.091 0-21 6.40 0.10 1.24 0.07 12.55 1.14 0.08 0.16 14.00 13.28 99.50 1.14 5.56 16.70 4.00 0.85 4.25 56.40
21-71 5.60 0.04 0.35 0.06 10.63 0.89 0.03 0.05 11.66 11.56 99.49 0.43 4.37 22.30 8.95 0.95 5.50 28.20

Okomu Oil Palm Company Plc: 60TPH Palm Oil Mill Project at Extension Two February 2020
Environmental Impact Assessment (EIA) – Final Report Page 124
71-115 5.66 0.02 0.15 0.06 12.38 1.17 0.04 0.07 13.72 13.69 99.56 0.51 2.89 16.50 10.63 1.25 4.00 28.20
115-
163 5.60
0.01 0.04 0.07 10.78 0.75 0.03 0.05 11.68 11.68 99.40 0.43 3.98 18.45 17.54 1.50 2.55 14.10
P.095 0-49 5.20 0.22 3.00 0.08 14.88 1.06 0.36 0.62 17.00 15.25 99.53 3.65 5.19 50.75 18.75 1.65 2.35 112.80
49-73 4.80 0.12 1.00 0.05 11.83 0.68 0.08 0.15 12.79 12.54 99.61 1.17 12.87 3.05 13.90 2.30 1.75 14.10
73-121 4.70 0.21 3.29 0.08 11.40 0.62 0.26 0.47 12.83 10.70 99.38 3.66 15.31 3.25 16.10 2.15 2.65 112.80
121-
160 4.90
0.02 0.10 0.06 9.44 0.69 0.02 0.02 10.23 10.17 99.41 0.20 7.41 6.00 12.87 1.05 1.85 28.20
P.111 0-9 5.56 0.11 0.92 0.05 9.36 0.62 0.08 0.13 10.24 9.64 99.51 1.27 4.36 17.75 20.15 0.55 2.85 56.40
9-49 4.91 0.03 0.32 0.09 13.19 1.82 0.02 0.05 15.17 14.97 99.41 0.33 7.00 10.80 14.63 0.65 2.25 28.20
49-91 6.00 0.01 0.05 0.07 `13.06 1.91 0.02 0.07 2.07 2.04 96.62 3.38 3.33 8.50 13.19 0.50 3.00 28.20
91-180 6.40 0.01 0.09 0.07 14.23 1.94 0.04 0.11 16.39 16.37 99.57 0.67 3.30 7.75 8.44 0.35 4.05 14.10
P.117 0-8 6.10 0.15 2.20 0.08 16.46 1.63 0.27 0.49 18.93 17.89 99.58 2.59 5.54 6.60 6.10 0.30 4.56 141.00
8-54 6.10 0.09 0.80 0.06 12.23 1.14 0.12 0.20 13.75 13.23 99.56 1.45 2.84 14.00 9.30 0.95 1.95 28.20
54-139 4.90 0.02 0.09 0.06 11.35 1.08 0.05 0.16 12.70 12.68 99.53 1.26 2.80 9.55 5.36 0.70 2.15 28.20
137-
170 6.90
0.01 0.08 0.07 9.43 1.08 0.03 0.07 10.68 10.67 99.34 0.66 1.27 5.50 4.85 1.00 2.00 14.10
P.137 0-11 5.46 0.22 2.90 0.08 14.95 2.30 0.23 0.38 17.94 16.06 99.55 2.12 2.64 49.55 11.55 0.90 5.95 141.00
11-41 5.66 0.04 0.26 0.06 14.11 2.11 0.05 0.13 16.46 16.22 99.64 0.79 0.82 41.87 9.75 0.60 3.55 28.20
41-119 5.76 0.01 0.07 0.04 12.88 1.81 0.03 0.07 14.83 14.81 99.73 0.47 0.55 50.10 7.66 0.80 4.55 28.20
119-
200 5.76
0.01 0.06 0.05 13.52 2.00 0.03 0.07 15.67 15.66 99.68 0.45 0.94 35.75 10.12 0.90 2.50 28.20
P.157 0-13 5.10 0.07 0.53 0.04 10.55 0.86 0.05 0.13 11.63 11.29 99.66 1.12 1.27 10.55 12.15 0.30 2.30 56.40
13-36 4.90 0.02 0.15 0.04 13.11 1.05 0.02 0.07 14.29 14.19 99.72 0.49 0.94 4.20 10.86 0.50 3.05 28.20
36-90 4.70 0.01 0.07 0.05 10.93 0.77 0.02 0.05 11.82 11.79 99.58 0.42 1.52 3.85 15.65 0.40 2.00 14.10
90-170 4.60 0.04 0.34 0.04 11.42 0.63 0.01 0.05 12.15 12.02 99.67 0.41 2.58 5.62 14.82 0.60 4.20 28.20
170-
200 5.10
0.01 0.06 0.06 10.96 0.84 0.01 0.05 11.92 11.90 99.50 0.42 1.96 3.95 18.71 0.45 2.75 14.10
P.159 0-10 5.20 0.07 0.63 0.09 11.03 0.78 0.11 0.20 12.21 11.80 99.26 1.64 3.19 4.70 17.35 0.55 1.45 70.50
10-37 4.90 0.01 0.13 0.08 9.87 0.67 0.04 0.07 10.73 10.66 99.25 0.65 1.42 2.75 19.42 0.65 1.65 28.20
37-80 4.60 0.01 0.13 0.09 11.83 0.48 0.04 0.11 12.55 12.47 99.28 0.88 1.37 5.50 29.20 0.50 1.50 28.20

Okomu Oil Palm Company Plc: 60TPH Palm Oil Mill Project at Extension Two February 2020
Environmental Impact Assessment (EIA) – Final Report Page 125
80-170 4.70 0.01 0.11 0.07 10.51 0.61 0.02 0.05 11.26 11.23 99.38 0.44 2.82 12.30 24.55 0.65 5.10 14.10
P.177 0-12 7.40 0.10 0.83 0.08 13.76 1.16 0.31 0.55 15.86 15.32 99.50 3.47 5.71 15.00 25.65 0.50 6.05 70.50
12-45 5.20 0.01 0.12 0.05 10.55 0.59 0.23 0.42 11.84 11.76 99.58 3.55 1.91 21.50 22.15 0.85 5.85 14.10
45-103 5.50 0.01 0.06 0.06 11.40 1.23 0.47 0.84 14.00 13.96 99.57 6.00 1.83 18.45 11.29 0.80 5.60 28.20
103-
182 5.56
0.01 0.05 0.05 11.29 1.46 0.03 0.09 12.92 12.89 99.61 0.70 1.24 16.90 13.33 0.95 7.85 28.20
P.191 0-13 5.61 0.09 0.74 0.06 12.17 1.18 0.12 0.22 13.75 13.27 99.56 1.60 2.40 25.35 9.86 0.70 6.70 14.10
13-48 5.81 0.01 0.04 0.04 14.30 1.78 0.02 0.07 16.21 16.18 99.75 0.43 2.25 15.60 10.25 0.60 9.15 28.20
48-112 5.91 0.01 0.06 0.03 14.18 1.47 0.02 0.07 15.77 15.73 99.81 0.44 1.82 19.28 7.85 0.55 11.25 28.20
112-
170 5.61
0.01 0.05 0.06 13.78 1.84 0.05 0.13 15.86 15.83 99.62 0.82 1.49 27.42 6.21 0.65 7.50 28.20
P.196 0-20 5.81 0.16 2.14 0.05 16.85 2.20 0.26 0.47 19.83 18.58 99.75 2.37 2.85 83.90 6.15 0.50 8.50 84.60
20-48 5.76 0.03 0.22 0.04 12.77 1.96 0.05 0.15 14.97 14.84 99.73 1.00 3.13 42.55 6.83 1.25 8.00 28.20
48-120 5.71 0.02 0.21 0.05 13.46 2.08 0.14 0.29 16.02 15.97 99.69 1.81 5.43 38.75 8.29 1.10 5.75 28.20
120-
180 5.56
0.01 0.10 0.06 13.27 2.12 0.10 0.20 15.75 15.73 99.62 1.27 8.14 45.56 10.11 0.95 6.75 14.10
Source: Extension Two Oil Palm Plantation Development Project; Final EIA Report 2016

Okomu Oil Palm Company Plc: 60TPH Palm Oil Mill Project at Extension Two February 2020
Environmental Impact Assessment (EIA) – Final Report Page 126
The organic carbon content of the soils was moderate to high in the surface of all the
pedons except pedon P.2B (where OC value was 0.08%). However, the OC content of
the subsurface horizons were very low except in pedons P.2B and P.095 (where OC
values were 2.02% and 3.29% in the third horizon respectively). Organic carbon
content of the surface soils ranged from 0.53% and 3.00% while the subsurface
horizons had organic carbon contents that ranged from 0.05% to 0.35%. In all the
profiles the organic carbon content of the horizons deeper than 30 cm were below the
critical requirement of 0.8% recommended for sustainable production of oil palm.
The total Nitrogen (TN) status of the soils varied linearly with the soil organic carbon
content. Thus the TN content of the soil was moderate in the surface horizons with
moderate OC contents and very low in the subsurface horizons where the OC content
was low. The surface horizons had TN that ranged from 0.08% to 0.22% while the
subsurface horizons have TN that ranged from 0.01 – 0.21. In most cases, the surface
horizons had the highest TN content.
Available P was low in the surface and subsurface horizons of the soils. Available P in
these soils ranged from 2.15 mg kg-1 and 6.37 mg kg-1 in the surface horizons while the
subsurface horizons had values of available P between 1.27 mg kg-1 and 15.31 mg kg-
1. In most cases, the surface horizons had higher content of available P than the
subsurface horizons. All the pedons were deficient in available P and thus application
of P fertilizer will be required for sustainable production of oil palm.
4.5.9.1 Micro-Nutrient Status of the Soils
The values of available Fe in the soils were very high and ranged from 4.00 to
29.20 mg kg-1 (Table 4). These values are higher than values reported for most
soils in Nigeria (Adesanwo, 2002). Available Fe is generally high in tropical
soils, although localized deficiencies of Fe are known to occur (Enwezor et al.,
1990; Adesanwo, 2002). At low nutrient level, even 30 mg kg-1, Fe has been
reported to be toxic (Moorman and Van Breemen, 1978).
Apart from its direct effect on crops, high level of Fe in the soil can also have
serious negative effect on availability of P for plant uptake. However, at high
soil pH (pH > 6.0) both the uptake of Fe and its influence on availability of P
may not be significant. Therefore, any step taken to bring down the soil pH from
neutrality will improve the activity of soil Fe with its likely negative effects on
P availability.

Okomu Oil Palm Company Plc: 60TPH Palm Oil Mill Project at Extension Two February 2020
Environmental Impact Assessment (EIA) – Final Report Page 127
The contents of available copper ranged from 0.25 to 2.30 mg kg-1, with a mean of 0.67
mg kg-1. The mean value of Cu obtained in this study is lower than the critical value of
0.75 mg kg-1 suggested for EDTA-extractable Cu (Haque et al., 2010). However,
pedons P.040, P.091, P.095 and P.196 had mean Cu content higher than this suggested
critical value. This result suggests that external input of Cu inform of fertilizer will be
for sustainable use of the land for oil palm production.
The values of available Mn ranged from 2.60 to 93.10 mg kg-1 with a mean of 20.65
mg kg-1. The values of Mn obtained in this study were higher than the critical values
suggested by several authors (Borggaard, 1976; Kociał kowski et al., 1999) and higher
than values reported for most parts of Nigeria.
The available Zn ranged from 1.50 to 11.25 mg kg-1 with a mean of 4.62 mg kg-1.
Chude and Obigbesan (1982) reported mean Zn values that ranged from 2.50 to 42.50
mg kg-1 for soils on sedimentary deposits and a range of 5.80–22.50 mg kg-1 for soils
developed on igneous and metamorphic deposits in southwestern Nigeria. Haque et al.,
(2010) suggested a critical range of 1.40 – 3.00 mg kg-1 for EDTA-extracted Zn. A
critical range of 1.0–5.0 mg kg-1 has been reported elsewhere (Sims and Johnson, 1991;
Deb and Sakal, 2002). The values obtained from this study are lower than those
reported by Chude and Obigbesan (1982). From the result obtained in this study, Zn
may not be limiting to sustain good oil palm yield.
4.6 Geology, Geotechnical/Hydrogeology Studies
4.6.1Geophysical Investigation
The geophysical investigation at the proposed project site was done in June 2018 for the
economic design of the foundation structure of the proposed mill to carry surface load in line
with the proposed project’s objectives for the site location.
4.6.2 Objective of Geotechnical Investigation
The objectives of the geotechnical investigation included the following:
(i) To investigate and give details about the soil profile to a maximum depth of
about 15 m below the natural ground level
(ii) To determine the index and strength properties of the soil required for foundation
design
(iii) To collect disturbed and undisturbed samples of the soil by drilling ten
boreholes to 15.0 m depth and three road points to depths of 1.5m each for
laboratory testing and analysis

Okomu Oil Palm Company Plc: 60TPH Palm Oil Mill Project at Extension Two February 2020
Environmental Impact Assessment (EIA) – Final Report Page 128
(iv) To carry out Dutch Cone Penetrometer Testing (CPT) to depth of refusal or
anchorage
(v) Recommendation f o r further i m p r o v e m e n t o f the geotechnical properties
of the investigated site soil where necessary.
4.6.3 Methodology and Scope of Work
The scope of work includes the following:
1. Mobilization of equipment and personnel to site
2. Drilling of ten (10) boreholes to 15 m depths at each test point using the Shell and
Augar Technique with a Percussion Rig mounted equipment and also collect
samples from three road points at depths 1.5m each.
3. Laboratory testing of recovered soil samples from the location. The laboratory
test shall include:
i. Specific gravity test
ii. Sieve analysis test
iii. Consistency test
iv. Compaction test
v. Undrained Triaxial test
vi. California Bearing ratio
4. Cone penetrometer tests
5. Bearing capacity calculations at specific depths
6. Analysis of the tests results with recommendation for improvement and economic
design
7. Preparation and submission of detailed Geotechnical Report with Appendices.
Materials
The equipment and materials used for soil exploration includes:
1. Pilcon Drilling Equipment
2. Measuring Tapes and Steel Rule
3. Dutch Cone Penetrometer
4. Shovels

Okomu Oil Palm Company Plc: 60TPH Palm Oil Mill Project at Extension Two February 2020
Environmental Impact Assessment (EIA) – Final Report Page 129
4.6.4 Soil Exploration
Soil samples were drilled from ten deep boreholes up to a depth of 15 m and to depths
of 1.5m for the road samples. Water table was not reached in the course of this
investigation. The recovered soil samples were then taken to the Geotechnical and
Highway Materials Testing Laboratory of the University of Benin for testing and
analysis.
4.6.5 Cone Penetrometer Tests
The field work also involved the execution of three Cone Penetrometer Tests. The
apparatus consisted of a cylindrical probe of 1000 mm2 cross sectional area, and a
conic head of apex angle of 60o. The probe was forced down through the soil at a
steady rate of about 20 mm/s in the closed position by exerting pressure force on outer
sounding tube. The point resistance and the resistance to side friction were measured
separately from the attached gauge.
4.6.6 Description of Soil Samples by Visual Inspection
Both soil description and classification require knowledge of grading and plasticity.
Grading and plasticity can be assessed using a rapid procedure which involves
personal judgments based on the appearance and feel of the soil.
Most of the soil samples collected was dark to light reddish brown in colouration
depicting lateritic nature. A table showing a complete description of the soil
samples obtained at the various depths investigated is shown below in Table 4.17.
Most of the samples are smooth when rubbed between fingers indicating a lower size
limit for coarse soils and is also evident on sight when moist. The soils could easily
be moulded to a firm mass when some amount of water is added indicating its
cohesiveness and could deform without severely cracking or crumbling.

Okomu Oil Palm Company Plc: 60TPH Palm Oil Mill Project at Extension Two February 2020
Environmental Impact Assessment (EIA) – Final Report Page 130
Table 4.17: Detailed Soil Description by Visual Inspection
Location Borehole ID Depth (m) Physical Description
Okomu Road
Point 1 1.5 Dark reddish brown fine grained silty clay Point 2 1.5 Reddish brown coarse grained silty clay
Point 3 1.5 Reddish brown coarse grained silty clay
Okomu Boiler
BHI
1.0 Reddish brown fine grained sandy silt 3.0 Reddish brown fine grained sandy silt 6.0 Reddish brown fine grained sandy silt 9.0 Reddish brown fine grained sandy silt
12.0 Reddish brown fine grained sandy silt 15.0 Reddish brown fine grained sandy silt
Okomu Power
House
BHII
2.0 Reddish brown fine grained silty clay 5.0 Reddish brown fine grained sandy silt
8.0 Reddish brown fine grained sandy silt
11.0 Reddish brown fine grained sandy silt
15.0 Reddish brown fine grained silty clay
Okomu
Clarification Station
BHIII
2.5 Reddish brown fine grained sandy silt
5.5 Reddish brown fine grained sandy silt
8.5 Reddish brown fine grained sandy silt
11.5 Reddish brown fine grained sandy silt
14.5 Reddish brown fine grained sandy silt
Okomu Sterilizer
BHIV
0.5 Reddish brown fine grained silty clay
3.5 Reddish brown fine grained sandy silt
6.5 Reddish brown fine grained silty clay
9.5 Reddish brown fine grained silty clay
12.5 Reddish brown fine grained silty sand
15.0 Reddish brown coarse grained silty sand
Okomu Pressing
Station
BHV
1.5 Reddish brown fine grained silty clay
4.5 Reddish brown coarse grained silty clay
7.5 Reddish brown fine grained silty clay
10.5 Reddish brown fine grained silty clay
14.5 Reddish brown fine grained silty clay
Okomu Storage
Tank
BHVI
1.0 Reddish brown fine grained silty clay
4.0 Reddish brown fine grained silty clay
7.0 Reddish brown fine grained silty clay
10.0 Reddish brown fine grained silty clay
13.0 Reddish brown fine grained silty clay
15.0 Reddish brown fine grained silty clay

Okomu Oil Palm Company Plc: 60TPH Palm Oil Mill Project at Extension Two February 2020
Environmental Impact Assessment (EIA) – Final Report Page 131
Table 4.17 cont’d: Detailed Soil Description by Visual Inspection
Location Borehole ID Depth (m) Physical Description
Okomu Weigh
Bridge
BHVII
1.0 Reddish brown fine grained sandy silt
4.0 Reddish brown fine grained sandy silt
7.0 Reddish brown fine grained sandy silt
10.0 Reddish brown fine grained sandy silt
13.0 Reddish brown fine grained sandy silt
15.0 Reddish brown fine grained silty sand
Okomu Water
Tank
BHVIII
3.0 Reddish brown coarse grained silty sand
6.0 Reddish brown coarse grained silty sand
9.0 Reddish brown coarse grained silty sand
12.0 Reddish brown coarse grained silty sand
15.0 Reddish brown coarse grained silty sand
Okomu Ramp I
BHIX
2.0 Reddish brown fine grained silty clay
5.0 Reddish brown coarse grained silty sand
8.0 Reddish brown coarse grained silty sand
11.0 Reddish brown fine grained sandy silt
14.0 Reddish brown fine grained sandy silt
Okomu Ramp II
BHX
1.5 Reddish brown fine grained sandy silt
4.5 Reddish brown fine grained sandy silt
7.5 Reddish brown fine grained sandy silt
10.5 Reddish brown fine grained sandy silt
13.5 Reddish brown fine grained sandy silt
15.0 Reddish brown fine grained sandy silt
Source: OOPC: Proposed Palm Oil Mill at Extension Two; EIA Field Work, June 2018

Okomu Oil Palm Company Plc: 60TPH Palm Oil Mill Project at Extension Two February 2020
Environmental Impact Assessment (EIA) – Final Report Page 132
Laboratory Testing
All the laboratory tests were done in accordance with the general specification given
in the British standard specification BS EN 1997-1-2004 and BS EN 1997-2-2007,
Geotechnics Designs (General Rules and Ground Investigation and testing
respectively).
Disturbed samples were selected for standard laboratory classification and other tests
which included the following:
• Specific Gravity Test
• Particle Size Analysis Test
• Atterberg Limit Test
• Compaction Test
• Undrained Triaxial Test
4.6.6.1 Specific Gravity Test.
Specific gravity tests were carried out on samples recovered from specified depths of
borehole. The tests were performed as per procedures laid out in BS EN 1997-1-2004
and BS EN 1997- 2-2007, Geotechnics Designs (General Rules and Ground
Investigation and testing respectively).
The specific gravity of a soil is the ratio of the weight or mass of a volume of the
material to the weight or mass of an equal volume of water. For soils, it is specified
to use one litre gas jar fitted with a rubber bung and a mechanical shaker apparatus
which rotates the jar at a constant rate. An oven dried sample was placed into the gas
jar along with some 500 ml of water. The jar was sealed and shaken. Subsequently,
following established procedures, specific gravity of the soil can be calculated.
4.6.6.2 Particle Size Analysis
This test is to determine the percentage quantity of individual grain sizes as they
occur in a particular soil layer. British Standard Sieves (BS – Sieves) were used on
the mechanical sieve shaker to separate these grains into their various sizes. These
were then weighed and their percentage weights calculated. The result of this test
is of value when used for classification purposes and it enables soil groupings to be
delineated and their properties inferred. Further tests to determine the size of the grain
particle was undertaken with the aid of the Hydrometer tests. These were carried out
in accordance with BS EN 1997-2-2007.

Okomu Oil Palm Company Plc: 60TPH Palm Oil Mill Project at Extension Two February 2020
Environmental Impact Assessment (EIA) – Final Report Page 133
4.6.6.3 Atterberg/ Consistency Tests
Atterberg limits were determined on soil specimens with very fine particles, i.e.
the clay samples. The Atterberg limits are boundaries between the liquid limit and
plastic states (Liquid Limit, LL), and between the plastic and brittle states (Plastic
Limit, PL). They are expressed as water content, in percentage.
The liquid limit is the water content at which a part of soil placed in a standard cup
and cut by a groove of standard dimensions flow together at the base of the groove,
when the cup is subjected to 25 standard shocks. The one-point liquid test was carried
out. Distilled water was added during soil mixing to achieve the required
consistency. The plastic limit is the water content at which a soil can no longer be
deformed by rolling into 3 mm diameter threads without crumbling. The range of
water contents over which a soil behaves plastically is the Plasticity Index, Ip. This
is the difference between the liquid limit and the plasticity limit (WL-WP). The
Reference test standard used for this test was BS EN 1997-2-2007.
4.6.6.4 Compaction Tests
Compaction is the process of increasing the density of a soil by packing the particles
of the soil closer together, with a reduction in the volume of air. Two parameters are
usually obtained from this test – optimum moisture content (OMC) and maximum dry
density (MDD). The compaction tests were carried out in accordance with BS EN
1997-2-2007.
4.6.6.5 Undrained Triaxial Tests
This test was used were to obtain the drained shear parameters (i.e. c’ and ’) of the
sand layers in the investigation. It involves the shearing of a cylindrical column of
soil obtained in- situ to determine its resistance to pressure. Triaxial machine is used,
from where two important parameters namely; angle of internal friction and cohesion
are obtained. With these, the bearing capacity of the soil is calculated. The test was
carried out in accordance with BS 1377:75 Test 13.
4.6.6.6 California Bearing Ratio Test
The CBR test was conducted using the compaction energy as for compaction test. The
California Bearing Ratio test was carried out in accordance with BS EN 1997-1-2004
and BS EN 1997-2-2007, Geotechnics Designs (General Rules and Ground
Investigation and Testing respectively).

Okomu Oil Palm Company Plc: 60TPH Palm Oil Mill Project at Extension Two February 2020
Environmental Impact Assessment (EIA) – Final Report Page 134
4.6.6.7 Presentation of Results
The recovered samples from the sites were taken to the Geotechnical Engineering
Laboratory in the Civil Engineering Department of the University of Benin. The
following laboratory tests and analysis were conducted alongside the in situ cone
penetrometer test (CPT):
• Specific gravity test
• Particle size analysis
• Atterberg limit test
• Compaction
• Unconsolidated Undrained Triaxial test
4.6.6.8 Specific Gravity Test Results
The Average Specific Gravity (A.GS) values for the deep borehole (BH) are
presented in Table 4.18.
Table 4.18: Specific Gravity Test Results
S/N LOCATION BOREHOLE ID DEPTH (m) AGs
1
Okomu Road
Point 1 1.5 2.57
2 Point 2 1.5 2.55
3 Point 3 1.5 2.42
4
Okomu Boiler
BHI
1.0 2.34
5 3.0 2.46
6 6.0 2.50
7 9.0 2.44
8 12.0 2.52
9 15.0 2.43

Okomu Oil Palm Company Plc: 60TPH Palm Oil Mill Project at Extension Two February 2020
Environmental Impact Assessment (EIA) – Final Report Page 135
Table 4.18 cont’d: Specific Gravity Test Results
S/N LOCATION BOREHOLE ID DEPTH (m) Ags
10
Okomu Power
House
BHII
2.0 2.47
11 5.0 2.56
12 8.0 2.43
13 11.0 2.50
14 15.0 2.47
15
Okomu
Clarification
Station
BHIII
2.5 2.44
16 5.5 2.51
17 8.5 2.42
18 11.5 2.44
19 14.5 2.36
20
Okomu
Sterilizer
BHIV
0.5 2.38
21 3.5 2.30
22 6.5 2.30
23 9.5 2.11
24 12.5 2.21
25 15.0 2.23
26
Okomu
Pressing
Station
BHV
1.5 2.28
27 4.5 2.24
28 7.5 2.28
29 10.5 2.34
30 14.5 2.51
31 BHVI 1.0 2.47

Okomu Oil Palm Company Plc: 60TPH Palm Oil Mill Project at Extension Two February 2020
Environmental Impact Assessment (EIA) – Final Report Page 136
Table 4.18 cont’d: Specific Gravity Test Results
S/N LOCATION BOREHOLE ID DEPTH (m) Ags
32 Okomu Storage
Tank
BHVI
4.0 2.47
33 7.0 2.35
34 10.0 2.17
35 13.0 2.42
36 15.0 2.28
37
Okomu Weigh
Bridge
BHVII
1.0 2.40
38 4.0 2.44
39 7.0 2.19
40 10.0 2.23
41 13.0 2.18
42 15.0 2.25
43
Okomu Water
Tank
BHVIII
3.0 2.22
44 6.0 2.49
45 9.0 2.47
46 12.0 2.50
47 15.0 2.46
48
Okomu Ramp I
BHIX
2.0 2.31
49 5.0 2.33
50 8.0 2.36
51 11.0 2.37
52 14.0 2.37
53 Okomu Ramp
II
BHX 1.5 2.24

Okomu Oil Palm Company Plc: 60TPH Palm Oil Mill Project at Extension Two February 2020
Environmental Impact Assessment (EIA) – Final Report Page 137
Table 4.18 cont’d: Specific Gravity Test Results
S/N LOCATION BOREHOLE ID DEPTH (m) Ags
54
Okomu Ramp II
BHX
4.5 2.52
55 7.5 2.35
56 10.5 2.36
57 13.5 2.42
58 15.0 2.42
4.6.6.9 Particle Size Distribution Tests Results
The tests were conducted to determine the percentage quantity of individual grain sizes
as they occur in particular soil layers. The test results are presented in Table 4.19 and
Appendix II. Mechanical sieving was carried out up to 0.075mm sieve.
Table 4.19: Sieve Analysis Test Results
S/N LOCATION BOREHOLE
ID
DEPTH(m) PERCENTAGE PASSING SIEVE NO.
1.18mm 0.425mm 0.075mm
1
Okomu Road
Point 1 1.5 99.24 78.00 44.12
2 Point 2 1.5 98.50 82.00 60.52
3 Point 3 1.5 97.97 81.00 57.64
4
Okomu Boiler
BHI
1.0 97.89 72.85 47.75
5 3.0 98.37 82.60 63.31
6 6.0 98.22 83.53 60.40
7 9.0 97.71 81.64 56.69
8 12.0 98.43 86.63 64.66
9 15.0 98.29 92.29 67.98

Okomu Oil Palm Company Plc: 60TPH Palm Oil Mill Project at Extension Two February 2020
Environmental Impact Assessment (EIA) – Final Report Page 138
Table 4.19 cont’d: Sieve Analysis Test Results
S/N LOCATION BOREHOLE ID DEPTH(m) PERCENTAGE PASSING SIEVE NO.
1.18mm 0.425mm 0.075mm
10
Okomu
Power House
BHII
2.0 98.49 79.35 55.91
11 5.0 98.11 81.60 58.98
12 8.0 98.58 85.17 63.56
13 11.0 98.24 85.05 63.50
14 15.0 98.40 85.21 62.82
15
Okomu
Clarification
Station
BHIII
2.5 97.88 79.23 54.02
16 5.5 98.42 84.54 61.61
17 8.5 98.22 83.22 53.89
18 11.5 98.08 82.46 56.82
19 14.5 98.13 83.00 56.21
20
Okomu
Sterilizer
BHIV
0.5 98.64 75.15 43.64
21 3.5 97.94 78.50 53.02
22 6.5 97.99 80.74 55.49
23 9.5 97.74 80.85 52.77
24 12.5 98.02 81.71 53.43
25 15.0 98.29 81.61 57.31
26 Okomu
Pressing
Station
BHV
1.5 98.78 78.34 48.57
27 4.5 98.11 83.33 61.53
28 7.5 97.48 81.56 50.86
29 10.5 98.08 83.62 53.97

Okomu Oil Palm Company Plc: 60TPH Palm Oil Mill Project at Extension Two February 2020
Environmental Impact Assessment (EIA) – Final Report Page 139
Table 4.19 cont’d: Sieve Analysis Test Results
S/N LOCATION BOREHOLE ID DEPTH(m) PERCENTAGE PASSING SIEVE NO.
1.18mm 0.425mm 0.075mm
30
Okomu Storage
Tank
BHVI
14.5 97.43 79.25 49.12
31 1.0 98.28 79.23 51.11
32 4.0 97.91 81.69 55.45
33 7.0 98.03 82.39 54.61
34 10.0 97.08 77.91 49.07
35 13.0 98.38 84.54 60.22
36 15.0 98.05 84.11 58.56
37
Okomu
Weigh-Bridge
BHVII
1.0 98.51 80.57 54.55
38 4.0 98.50 85.03 64.05
39 7.0 95.51 80.57 54.55
40 10.0 97.65 81.40 52.78
41 13.0 98.29 83.44 59.45
42 15.0 98.20 84.12 57.55
43
Okomu Water
Tank
BHVIII
3.0 97.68 78.90 51.92
44 6.0 97.35 79.06 53.39
45 9.0 98.27 83.99 55.83
46 12.0 98.51 83.18 57.53
47 15.0 97.97 82.64 60.51
48
Okomu Ramp I
BHIX 2.0 98.43 76.66 47.32
49 5.0 98.69 73.77 40.11

Okomu Oil Palm Company Plc: 60TPH Palm Oil Mill Project at Extension Two February 2020
Environmental Impact Assessment (EIA) – Final Report Page 140
Table 4.19 cont’d: Sieve Analysis Test Results
S/N LOCATION BOREHOLE ID DEPTH(m) PERCENTAGE PASSING
SIEVE NO.
1.18mm 0.425mm 0.075mm
50
Okomu Ramp I
BHIX
8.0 98.60 76.55 49.19
51 11.0 97.49 75.05 47.17
52 14.0 97.30 73.20 48.95
53
Okomu Ramp II
BHX
1.5 98.97 80.96 51.98
54 4.5 98.67 69.82 35.01
55 7.5 98.34 73.89 43.18
56 10.5 97.88 76.93 55.73
57 13.5 98.17 78.08 52.83
58 15.0 98.29 78.27 47.49
4.6.6.10 Atterberg/Consistency Limits Test Results
The tests carried out under this heading includes Liquid Limit (LL), Plastic Limit (PL),
Plasticity Index (PI) and Linear shrinkage (LS), all of which make up the Atterberg Limit
test. The results of these tests are presented in Table 4.20.

Okomu Oil Palm Company Plc: 60TPH Palm Oil Mill Project at Extension Two February 2020
Environmental Impact Assessment (EIA) – Final Report Page 141
Table 4.20: Atterberg Limit Test Results
LOCATION BOREHOLE ID DEPTH
(m) ATTERBERG LIMIT TESTS
LL (%) PL (%) PI (%) PLASTICITY
Okomu Road Point 1 1.5 36.46 22.03 16.43 CI
Point 2 1.5 56.85 28.61 28.25 CH
Point 3 1.5 52.88 27.77 25.12 CH
Okomu Boiler
BHI
1.0 50.15 27.44 22.71 MH
3.0 52.13 27.79 24.33 MH
6.0 49.32 25.47 23.85 MH
9.0 54.48 28.48 25.66 MH
12.0 52.48 29.94 22.54 MH
15.0 54.19 25.86 28.33 MH
Okomu Power House
BHII
2.0 49.29 23.37 25.92 CI
5.0 48.97 27.80 21.17 MI
8.0 53.43 28.16 25.27 MH
11.0 50.65 27.78 22.86 MH
15.0 45.23 25.69 22.54 CI
Okomu Clarification
Station
BHIII
2.5 47.28 27.97 20.31 MI
5.5 53.87 27.02 26.85 MH
8.5 51.06 27.24 23.82 MH
11.5 51.85 27.22 24.64 MH
14.5
52.51
30.23
22.27
MH

Okomu Oil Palm Company Plc: 60TPH Palm Oil Mill Project at Extension Two February 2020
Environmental Impact Assessment (EIA) – Final Report Page 142
Table 4.20 cont’d: Atterberg Limit Test Results
Okomu Sterilizer
BHIV
0.5 45.34 24.55 20.80 CI
3.5 29.50 27.03 2.47 ML
9.5 53.35 27.22 26.13 CH
12.5 45.34 24.55 20.80 CI
Okomu Pressing
Station
BHV
7.5 53.32 26.85 26.46 CH
14.5 51.30 28.67 22.63 MH
Okomu Storage
Tank
BHVI
10.0 54.13 25.74 28.39 CH
Okomu Weigh
Bridge
BHVII
7.0 52.37 28.09 24.30 MH
15.0 54.79 29.11 25.69 MH
Okomu Water Tank
BHVIII
6.0 50.87 30.87 20.28 MH
9.0 49.79 26.38 23.41 CI
12.0 51.21 27.97 23.24 MH
15.0 51.41 26.16 25.26 MH
Okomu Ramp I
BHIX
2.0 54.63 27.44 27.19 CH
5.0 56.70 31.28 25.43 MH
8.0 56.17 28.50 27.67 MH
11.0 48.41 27.23 21.18 MI
1.5 48.14 28.19 19.95 MI
Okomu Ramp II BHX 7.5 49.50 28.46 21.04 MI
10.5 48.85 27.23 21.63 MI
13.5 55.34 25.62 29.73 MH
C=CLAY, M= SILT (M-SOIL), I= INTERMEDIATE PLASTICITY, L= LOW PLASTICITY,
H=HIGH PLASTICITY

Okomu Oil Palm Company Plc: 60TPH Palm Oil Mill Project at Extension Two February 2020
Environmental Impact Assessment (EIA) – Final Report Page 143
4.6.6.11 Compaction Tests Results
Compaction tests is used to determine the density beyond which any increment in water
content will not have effect on the strength of the soil. From the test, the optimum
moisture content and maximum dry densities were obtained as shown below in Table
4.21 for the samples that were tested.
Table 4.21: Compaction Test Results
LOCATION BOREHOLE ID DEPTH (m) MDD (g/cm3) OMC (%)
Okomu Road
Point 1 1.5 1.74 13.40
Point 2 1.5 1.51 21.90
Point 3 1.5 1.47 25.30
Okomu Boiler
BHI
1.0 1.51 22.50
3.0 1.48 24.0
6.0 1.50 23.40
9.0 1.48 20.60
12.0 1.44 24.70
15.0 1.48 23.40
Okomu Power
House
BHII 2.0 1.47 20.60
5.0 1.49 20.10 8.0 1.49 19.40
11.0 1.53 24.30
15.0 1.44 24.80
Okomu
Clarification
Station
2.5 1.51 22.30
BHIII 5.5 1.52 22.30
8.5 1.58 22.30
11.5 1.49 21.90
14.5 1.51 22.60
Okomu Sterilizer 0.5 1.58 18.90
3.5 1.48 21.70
BHIV 6.5 1.61 18.90
9.5 1.50 21.60
12.5 1.55 21.40
15.0 1.51 21.20
Okomu Pressing
Station
1.5 1.56 19.20
BHV 4.5 1.47 21.60
7.5 1.55 21.40
10.5 1.52 23.50
14.5 1.58 22.00

Okomu Oil Palm Company Plc: 60TPH Palm Oil Mill Project at Extension Two February 2020
Environmental Impact Assessment (EIA) – Final Report Page 144
Table 4.21 cont’d: Compaction Test Results
LOCATION BOREHOLE ID DEPTH (m) MDD (g/cm3) OMC (%)
Okomu Storage
Tank
BHVI
1.0 1.47 19.60
4.0 1.48 20.80
7.0 1.50 21.20
10.0 1.51 24.90
13.0 1.49 21.90
15.0 1.58 21.80
Okomu Weigh
Bridge
BHVII
1.0 1.50 20.00
4.0 1.52 23.50
7.0 1.49 22.30
10.0 1.46 24.70
13.0 1.46 25.30
15.0 1.55 23.40
Okomu Water
Tank
BHVIII
3.0 1.48 26.40
6.0 1.48 26.40
9.0 1.49 23.20
12.0 1.48 21.70
15.0 1.58 21.80
Okomu Ramp I
BHIX
2.0 1.57 19.20
5.0 1.68 16.50
8.0 1.52 19.9
11.0 1.54 17.80
14.0 1.51 21.60
Okomu Ramp II
BHX
1.5 1.58 18.70
4.5 1.73 15.00
7.5 1.65 17.90
10.5 1.54 18.90
13.5 1.62 19.30
15.0 1.56 20.50

Okomu Oil Palm Company Plc: 60TPH Palm Oil Mill Project at Extension Two February 2020
Environmental Impact Assessment (EIA) – Final Report Page 145
4.6.6.12 Undrained Triaxial Tests Results
The results obtained from Undrained Triaxial Test performed on U2 soil samples
recovered from specific depths are presented in Table 4.22.
Table 4.22: Shear Strength Test Results
Location Borehole ID Depth(m) Φ’ (°) C’ (KN/m2)
Okomu Boiler
BH1
3.0 4.00 11.0
6.0 10.68 37.0
9.0 6.73 29.0
15.0 5.88 38.0
Okomu Power House
BH2
2.0 12.68 12.0
5.0 6.66 58.0
15.0 9.93 17.0
Okomu Clarification
Station
BH3
2.5 12.48 46.0
8.5 11.49 38.0
14.5 10.36 37.0
Okomu Sterilizer
BH4
0.5 6.46 18.0
6.5 7.57 15.0
12.5 6.16 5.0
Okomu Pressing
Station
BH5
7.5 15.64 9.0
10.5 11.62 18.0
14.5 10.28 5.0
Okomu Storage Tank
BH6
1.0 13.71 3.0
7.0 6.22 22.5
15.5 3.43 46.0
Okomu Weigh Bridge
BH7
4.0 7.97 15.0
13.0 3.94 24.0
15.0 22.64 13.0
Okomu Water Tank
BH8
3.0 12.64 45.0
9.0 5.94 45.0
12.0 5.0 11.43
Okomu Ramp I
BH9
2.0 20.34 20.0
8.0 9.15 4.0
11.0 9.29 35.0
Okomu Ramp II
BH10
1.5 7.93 15.50
7.5 3.61 24.0
13.5 10.20 50.0

Okomu Oil Palm Company Plc: 60TPH Palm Oil Mill Project at Extension Two February 2020
Environmental Impact Assessment (EIA) – Final Report Page 146
4.6.6.13 Bearing Capacity Computation Using Parameters from Undrained Triaxial
Test The ultimate bearing capacity was calculated for a 1m square pad footing using
Meyerhof’s equations as shown below:
‘ 1 cot ∅ (3)
‘ 1 tan 1.4∅ (4)
1 0.2+, /. (5)
1 0.1+, /. (6)
1 0.2/+, / (7)
1 0.1/+, / (8)
+, !”# 45 ∅/2 (9)
Where;
qult = Ultimate bearing capacity c = Cohesion
Φ = Angle of internal friction
c = Cohesion
Nc, Nq, NƳ = Bearing capacity factors
sc, sq, sƳ = Shape correction factors
dc, dq, dƳ = Depth correction factors
Table 4.23 below shows the allowable bearing capacity computed at various depths using a
factor of safety of 3.5, which is suitable for light industrial projects.

Okomu Oil Palm Company Plc: 60TPH Palm Oil Mill Project at Extension Two February 2020
Environmental Impact Assessment (EIA) – Final Report Page 147
Table 4.23: Computed Allowable Bearing Capacities at Various Depths
Location Borehole ID Depth (m) Ultimate
bearing
capacity
(q,ult)
kN/m2
Allowable bearing
capacity (q,all)
kN/m2
Okomu Boiler
BH1
3.0 252 72
9.0 1453 415
15.0 1579 451
Okomu Power
House
BH2
2.0 402 115
5.0 1376 393
15.0 2948 842
Okomu
Clarification
Station
BH3
2.5 1153 329
8.5 2403 687
14.5 3915 1119
Okomu Sterilizer
BH4
0.5 195 56
6.5 805 230
12.5 1218 348
Okomu Pressing
Station
BH5
7.5 1758 502
10.5 2202 629
14.5 2326 665
Okomu Storage
Tank
BH6
1.0 143 41
7.0 939 268
15.5 2575 736
Okomu
Weigh-Bridge
BH7
4.0 500 143
15.0 6284 1795
Okomu Storage
Tank
BH8
3.0 1274 364
9.0 1764 504
12.0 1882 538
Okomu Ramp I
BH9
8.0 849 243
11.0 2495 713
Okomu Ramp II
BH10
1.5 273 78
7.5 839 240
13.5 4132 1181

Okomu Oil Palm Company Plc: 60TPH Palm Oil Mill Project at Extension Two February 2020
Environmental Impact Assessment (EIA) – Final Report Page 148
4.6.6.14 Dutch Cone Penetrometer Test Results
Cone penetrometer test was carried out at three (3) points. The cone penetration
resistance (qc) obtained at specific depths for the three points are shown in Table 4.24.
Several correlations have been drawn to relate ultimate bearing capacity to cone
penetration resistance. Meyerhof (1976) suggested a direct method for estimating qult
from cone resistance as follows:
3 (10)
0 112.2
2 11 2
Where
q,ult = Ultimate bearing capacity in kN/m2
q̅ c = Arithmetic average of qc values in a zone including footing base and 1.5B beneath
footing, in kN/m2
B = Width of footing, in m Df = Depth of footing, in m
The computed allowable bearing capacities for the specific depths shown in Table 4.23
above are presented in Table 4.25 below, for a 1m square footing. It should be noted
that depth was not corrected for, and that a factor of safety of 3.5 was used in the
calculations.
Table 4.24: Cone Resistance Obtained at Specific Depths for Points 1, 2 and 3
Depth (m) CPT1 (kg/cm2) CPT2 (kg/cm2) CPT3 (kg/cm2)
1.0 25.0 65.0 47.0
2.0 50.0 200.0 65.0
3.0 55.0 220.0 68.0
4.0 64.0 205.0 70.0
5.0 83.0 220.0 75.0
6.0 110.0 250.0 92.0
7.0 130.0 - 105.0
8.0 150.0 - 135.0
9.0 175.0 - 180.0
10.0 200.0 - 220.0
11.0 230.0 - -

Okomu Oil Palm Company Plc: 60TPH Palm Oil Mill Project at Extension Two February 2020
Environmental Impact Assessment (EIA) – Final Report Page 149
Table 4.25a: Bearing Capacity Computation from CPT from Test Point 1
Depth (m) Ave. qc(MN/m2) qult (kN/m2) qall (kN/m2)
1.0 2.45 402.05 114.87
2.0 4.91 1206.15 344.61
3.0 5.39 1769.00 505.43
4.0 6.28 2573.12 735.18
5.0 8.14 4004.41 1144.12
6.0 10.79 6191.56 1769.02
7.0 12.75 8362.62 2389.32
8.0 14.72 10855.33 3101.52
9.0 17.17 14071.72 4020.49
10.0 19.62 17690.16 5054.33
Table 4.25b: Bearing Capacity Computation from CPT from Test Point 2
Depth (m) Ave. qc (MN/m2) qult (kg/cm2) qall (kN/m2)
1.0 6.38 1045.33 298.67
2.0 19.62 4824.59 1378.45
3.0 21.58 7076.07 2021.73
4.0 20.11 8242.01 2354.86
5.0 21.58 10614.10 3032.60
6.0 24.53 14071.72 4020.49
Table 4.25c: Bearing Capacity Computation from CPT from Test Point 3
Depth (m) Ave. qc (MN/m2) qult (kg/cm2) qall (kN/m2)
1.0 4.61 755.85 215.96
2.0 6.38 1567.99 447.99
3.0 6.67 2187.15 624.89
4.0 6.87 2814.34 804.09
5.0 7.36 3618.44 1033.84
6.0 9.03 5178.39 1479.54
7.0 10.30 6754.43 1929.84
8.0 13.24 9769.79 2791.37
9.0 17.66 14473.77 4135.36
10.0 21.58 19459.18 5559.77

Okomu Oil Palm Company Plc: 60TPH Palm Oil Mill Project at Extension Two February 2020
Environmental Impact Assessment (EIA) – Final Report Page 150
4.6.6.15 California Bearing Ratio Test Result
The California Bearing Ratio test is a depth penetration test for determining the
mechanical strength of subgrade beneath new carriageway construction. The CBR test
is described in ASTM Standards D1883-05 (for soils place in field), and AASTO T193.
The CBR Test is fully described in BS 1377: Soils for civil engineering purposes: Part
4, compaction related tests, and in Part 9: In-situ tests. The California bearing ratio
test results for samples tested are presented in Table 4.26 below.
Table 4.26: CBR Tests Results
S/N Location Sampling Depth Pressure Layer Unsoaked Soaked
2.5mm 5.0mm 2.5mm 5.0mm
1.
Point 1
0.5m
BOTTOM 8.67 8.06 6.44 5.86
TOP 6.69 6.90 5.53 5.86
2.
Point 2
0.5m
BOTTOM 12.30 10.96 7.52 8.88
TOP 11.81 11.07 7.59 8.49
3.
Point 3
0.5m
BOTTOM 8.84 10.47 8.59 8.49
TOP 10.24 10.79 5.45 8.27
4.6.6.16 General Discussion of Index Properties and Soil Classification
Geotechnical investigation to understand the subsurface at the proposed location showed
that the site passed most of the criteria that characterises a suitable soil for Civil
Engineering construction.
4.6.6.16.1 Specific Gravity
The specific gravity results from the boreholes presented in Table 4.1 ranged from 2.34
to 2.52 for borehole 1, 2.47 to 2.56 for borehole 2, 2.36 to 2.51 for borehole 3, 2.11 to
2.38 for borehole 4, 2.28 to 2.51 for borehole 5, 2.17 to 2.47 borehole 6, 2.18 to 2.44 for
borehole 7, 2.22 to 2.50 for borehole 8, 2.31 to 2.37 for borehole 9 and 2.24 to 2.52 for
borehole 10 while the road points have specific gravity values ranging from 2.42 to 2.57.
The highest specific value of 2.57 was recorded in road point 1, 1.5m .These results
obtained from the specific gravity tests indeed show the suitability of the soils as a
construction material especially as subgrade materials with respect to the road points.

Okomu Oil Palm Company Plc: 60TPH Palm Oil Mill Project at Extension Two February 2020
Environmental Impact Assessment (EIA) – Final Report Page 151
4.6.6.16.2 Particle Size Distribution
Particle size distribution tests carried out on the Auger Samples showed that the soils
have many similarities irrespective of depth. The range of the soil passing the 0.075
mm sieve for borehole I is , borehole II IS 55.91% to 63.56%, borehole III IS 53.89%
to 61.61% , borehole IV is 43.64% to 55.49%, borehole V is 48.57% to 61.53% ,
borehole VI is 49.07% to 60.22%, borehole VII is 52.78% to 64.05 , borehole VIII is
51.92% to 60.51% , borehole IX is , borehole X is 47.49% to 53.77% .For the road
points: point I, point II and point III have maximum of 44.92%, 60.52% and 57.64%
passing through 0.075 mm sieve. This indicates that the soils contain both fines and
sands. According to the American Association of State Highway and Transportation
Officials (AASHTO), these soils can be classified as A-7-6.
4.6.6.16.3 Consistency Limit Tests
The extent of fine material in the soil mix was also ascertained using the
consistency or Atterberg limit tests. The results obtained showed that the soils from all
the boreholes ranges within intermediate to high plasticity silty clay/ sandy silty soil
with a maximum plasticity index of 29.73% and liquid limit of 56.85%.
4.6.6.16.4 Compaction Tests
The maximum dry density (MDD) and optimal moisture content (OMC) values which
are used to determine the dry unit weight of the soil were obtained from the standard
proctor compaction tests carried out on recovered soil samples from specific depths for
all the borehole locations. The results show that the range of maximum dry density and
optimum moisture content values for road points is 1.47 g/cm3 to 1.74 g/cm3 and
13.40% to 25.30% , borehole 1 is 1.44 g/cm3to 1.51 g/cm3 and 20.60% to 24.70%,
borehole 2 is 1.44 g/cm3 to 1.49 g/cm3 and 19.40% to 24.80%, borehole 3 is 1.49
g/cm3 to 1.58 g/cm3 and 21.90% to 22.60 %, borehole 4 is 1.48 g/cm3 to 1.58 g/cm3
and 18.90% to 21.70%, borehole 5 is 1.47 g/cm3 to 1.58 g/cm3 and 19.20% to 23.50%,
borehole 6 is 1.47 g/cm3 to 1.58 g/cm3 and 19.60% to 24.90%, borehole 7 is 1.46
g/cm3 to 1.55 g/cm3 and 20.00% to 25.30%, borehole 8 is 1.48 g/cm3 to 1.58 g/cm3 and
21.70% to 26.40%, borehole 9 is 1.51 g/cm3 to 1.68 g/cm3 and 16.50% to 21.60%
while borehole 10 maximum dry density values range from 1.54 g/cm3 to 1.65
g/cm3 with optimum moisture content values from 15.0% to 20.50%. Their
compaction curves are typical for sandy silt soils and silty clay soils with high plasticity
clay as obtained in literature.

Okomu Oil Palm Company Plc: 60TPH Palm Oil Mill Project at Extension Two February 2020
Environmental Impact Assessment (EIA) – Final Report Page 152
4.6.6.17 General Discussion of Strength Results
The allowable bearing capacity of the soil was determined using shear parameters
obtained from laboratory triaxial tests and cone penetration resistance obtained
from in situ cone penetrometer test (CPT), both of which are shown in Tables 4.24
and 4.25a - 4.25c respectively. It should be noted that the calculations were done
assuming a 1m x 1m square footing and a factor of safety of 3.5. In the foundation
analysis and design, actual sizes of footings should be used alongside the shear
parameters to obtain the adequate bearing capacity.
Comparing the allowable bearing capacities shown in Table 4.24 to those in Table 4.25a
– 4.25c, it can be seen that both agree to certain levels. However, the values obtained
via calculation using the shear parameters obtained from laboratory tests appear to be
more conservative and should therefore be used in the foundation analysis and design.
In general, the results of the bearing capacity showed that the soil is relatively firm
and high strength foundation can be obtained with a minimum bearing capacity of
110 kN/m2 at depth 2.0m and factor of safety of 3.5 employed.
4.6.6.18 California Bearing Ratio Results
The result of California Bearing Ratio (CBR) test revealed that the sub-surface strength
varies along the road as could be seen in Table 4.26. These should be further checked
with moving load of vehicles that will use this route for adequacy as subgrade material.
It was observed that both the unsoaked CBR values and the soaked CBR values were
less than 15%, although the unsoaked CBR values recorded higher values than the
soaked CBR values. The soaked CBR values were used in this analysis of which the
highest value was taken as the CBR value for each chainage. Table 4.26 shows the
minimum value of soaked CBR for various road pavement layer. For a subgrade layer,
the minimum is between 5 – 11% which is the focal point of this report. Any value
found below this range will be subject to capping or subgrade treatment.
Recommendations for capping and sub-base layer have been presented in Table 4.27.
This fill material should be appropriately compacted by roller compactor after
spreading.

Okomu Oil Palm Company Plc: 60TPH Palm Oil Mill Project at Extension Two February 2020
Environmental Impact Assessment (EIA) – Final Report Page 153
4.6.6.19 Conclusion and Recommendation
4.6.6.19.1 Conclusion
From the results and analysis, it was observed that the location for the proposed
project is comprised mainly of both fines and sands with high to low plasticity.
According to AASHTO and USSC soil classification systems, the soil was classed
as A-7-6. This shows that the soil consists of both fines and sands, having low to
high degree of plasticity.
In terms of strength, the allowable bearing capacity calculated using shear parameters
obtained from laboratory triaxial tests revealed that the soil possesses great potential
for an economic foundation.
4.6.6.20 Recommendation
From the analysis, it is evident that the location can provide economic foundation
for most infrastructures, including the school that will be built on the site. Though
bearing capacity computations from CPT showed that the bearing pressure at depth
2.0 to 6m is higher than 200kN/m2, the value of 110kN/m2 should be used as the
design bearing pressure. With adequate scarification and compaction, the whole of
the site will be put to good use construction-wise.
4.6.6.20.1 Sub-grade Treatment
In exceptional circumstances where the CBR value falls below 2%, a value below
which the sub-grade would deform under construction traffic, there are several
options open to the designer:
The material can be removed and replaced with a more suitable material. The
thickness replaced should be between 0.5m and 1.0m. Irrespective of the quality of
the new material a CBR value of just below 2% should be assumed for the sub-grade.
With these soils having cohesive properties, it may be possible to treat the soils using
lime. The sub-base and capping is again designed assuming a sub-grade CBR of just
below 2%.
For sub-grades with CBR values of 15% and above, the sub-base should have a
standard thickness of 150mm, a value determined as the minimum practical for
spreading and compaction. This is in accordance with the Design Manual for Roads
And Bridges, HD 23/99, Road Note RD/GN/ 042 (Pavement Design for Carriageway
Construction), Federal ministry of works, Highway manual and the AASHTO 1993
(Design of Pavement Structures). This is summarised in Table 4.25 for the chainages
tested. For sub-grade of elastic modulus below 50 MPa or 5% CBR, strengthening

Okomu Oil Palm Company Plc: 60TPH Palm Oil Mill Project at Extension Two February 2020
Environmental Impact Assessment (EIA) – Final Report Page 154
measures are required in order to provide a strong and uniform support for the
pavement and to allow road construction vehicles to pass over the sub-grade without
damaging the layer. This can be achieved by providing a thick layer of sub-base on the
sub-grade but it may be more economical to provide a capping layer of selected
materials. The provision of a capping layer over a weak sub-grade avoids the necessity
of an extraordinarily thick sub-base, and provides an adequate working platform for
sub-base compaction as well as reduces the risk of damage to the sub-grade during
construction. The CBR value of the capping layer shall be of at least 15%.
The recommended thicknesses of the capping layer for various CBR values of
subgrade for flexible and rigid pavements are shown in Table 4.27. The capping
layer can be specified as granular fill material in accordance with Section 6 of
the General Specification for Civil Engineering Works.
4.6.6.20.2 Sub - Base
Sub-base shall be specified as granular material in accordance with Section 9 of the
General Specification for Civil Engineering Works. Lean concrete is generally not
recommended for sub- base application. For flexible pavements, localised shrinkage
cracks developed in the lean concrete sub-base would likely propagate upwards
through the bituminous surfacing causing reflective cracking at the pavement surface,
which reduces the service life of pavement. For rigid pavements, the high rigidity
and flexural strength of concrete itself contribute to most of the load bearing function,
resulting in very small deflections and pressures induced by vehicular loading on the
sub-layers. The purpose of sub-base on rigid pavements is primarily for
controlling pumping, which can be achieved by using granular materials.
The thickness of the sub-base layer is determined primarily from the strength of the
sub-grade, i.e. the CBR value. The recommended thicknesses and type of sub-base for
flexible and rigid pavements are shown in Table 4.27 below.
Table 4.27: Sub-Grade Strength Class and Recommended Minimum Thickness for Capping and
Granular Sub-Base
Location Depth of
Sampling
(m)
PI (%) CBR % Capping
Layer
(mm)
Granular
Sub-Base
Layer (mm)
Subgrade
Strength Class
Point 1 1.5 16.43 6.44 N/A 200 S3
Point 2 1.5 28.25 8.88 N/A 200 S4
Point 3 1.5 25.12
8.59 N/A 200 S4

Okomu Oil Palm Company Plc: 60TPH Palm Oil Mill Project at Extension Two February 2020
Environmental Impact Assessment (EIA) – Final Report Page 155
4.7 Ecological Environment
4.7.1 Current Status
The vegetation at the proposed project site is presently covered by oil palm and with weed
species typical of the lowland rain forest zone in Nigeria. The dominant plants include
Guinea grass (Panicum maximum), Trema orietalis, Alchornea cordifolia, Siam weed
(Chromoleana odorata) and Sida spp. However, there is a lake (06° 40' 27.4" N and 005°
49' 50.5" E) within the southern part of the plantation where the proposed project will be
situated, with some aquatic plant species such as Nymphaea lotus and Pistia
stratiotes,Cyrtosperma.
The results of the biodiversity study indicate the presence of about fourteen (14)
fauna species of animal, while about twenty-one (21) Flora species of plants
were found as shown in Tables 4.28 and 4.30.
Table 4.28: List of Encountered Fauna Species in the Study Area
S/N Common Name Scientific Name Family Name
1 Tree squirrel Protexerus spp Sciuridae
2 Giant rat Cricetomys gambianus Cricetidae
3 Bush fowl Francolinus bicalcaratus Phasianidae
4 Water snail Lymnea spp Mollusca
5 Giant land snail Archatina archatina Mollusca
6 Butterfly Paplio spp Papilionidae
7 Earthworm Lumbricus terrestris Lumbricidae
8 Village weaver bird Ploceus calcullatus Ploceidae
9 Side stripe brown snake Bothropthalmus lineatum Colubridae
10 Millipede Spirostepus aseniansis Spirostreptidae
11 Centipede Hoxodesmos plaz Scolopendridae
12 Honey bee Apis milifera Apidae
13 Lizard buzzard Kalpifalco monogrammicus Accipitridae
14 Grass cutter Thyronomys swinderianus Thronomydae
Source: OOPC – Proposed Mill EIA at Extension Two; Field work, February-March 2019
These fauna animals fall within six (6) classes representing vertebrates and invertebrates.
The invertebrates dominate the environment of the study area. The proportion of reptiles
when compared with other vertebrates and invertebrates is naturally lower than the
mammals and birds.
The species that were found in each site, especially within the plantation can be said to be
those that found in the area suitable and are able to meet their needs.

Okomu Oil Palm Company Plc: 60TPH Palm Oil Mill Project at Extension Two February 2020
Environmental Impact Assessment (EIA) – Final Report Page 156
Table 4.29: Population Estimates, Proportions and Diversity Indices of Animal
Species Encountered in the Study Area
S/N
Name of animal
Plantation
Population
estimates/field
Proportion (p)
1 Tree squirrel 59.20 0.0575
2 Giant rat 10.40 0.0101
3 Bush fowl 16.00 0.0155
4 Water snail 0.80 0.0008
5 Giant land snail 1.60 0.0016
6 Butterfly 6.40 0.0119
7 Earthworm 180.00 0.3338
8 Village weaver bird 12.80 0.0237
9 Side stripe brown snake 0.80 0.0008
10 Millipede 20.80 0.0386
11 Centipede 20.80 0.0386
12 Honey bee 3.52 0.0030
13 Lizard buzzard 0.80 0.0008
14 Grass cutter 13.60 0.0252
15 Crab 20.80 0.0386
Total No of Species: 15
Total Population: 368.32
Site Diversity Index: 0.5118
It was also noticed that the floor of the plantation is covered by dry brown litter fall, which
may not be able to camouflage reptiles.
The plant species found in all the sample fields of the blocks revealed that Euphorbia hirta,
Eupatorium odoratum, Centrocema spp, Pueraria spp, Ipomea spp, Commelina spp,
Pennisetum purpureum and Ludigwa spp are the most common flora plants that are
noticeable in all the block sampled.
The flora found in all the sample plots represents different classes of plants that were
grouped into 13 families. The Solanaceae leguminaceae dominate the environment of the
study area.
The species of plants found at the sample plots show that the environments of the study
area are really recuperating from the destruction of vegetation that occurred during the
clearing stage. There were no IUCN Red-listed categories of threatened, endangered, rare
and endemic plants, medicinal and economic crops at or near the project area.

Okomu Oil Palm Company Plc: 60TPH Palm Oil Mill Project at Extension Two February 2020
Environmental Impact Assessment (EIA) – Final Report Page 157
The plant species found in all the sample fields of the blocks revealed that Euphorbia hirta,
Eupatorium odoratum, Centrocema spp, Pueraria spp, Ipomea spp, Commelina spp,
Pennisetum purpureum and Ludigwa spp are the most common flora plants that are
noticeable in all the block sampled.
The flora found in all the sample plots represents different classes of plants that were
grouped into 13 families. The Solanaceae leguminaceae dominate the environment of the
study area.
The species of plants found at the sample plots show that the environments of the study
area are really recuperating from the destruction of vegetation that occurred during the
clearing stage. There were no IUCN Red-listed categories of threatened, endangered, rare
and endemic plants, medicinal and economic crops at or near the project area.
Table 4.30: List of Encountered Flora Species in the Study Area
S/N Common Name Scientific Name Family Name
1 Capsicum Capsicum spp Solanaceae
2 Pawpaw Carica papaya Cacaceae
3 Goat weed Ageratum conyzoldes Compositae
4 N.A Combretum peniculatum Combretaceae
5 Garden egg Solanum nigrum Solanaceae
6 Pepper Capsicum frutescens Solanaceae
7 Lemmon grass Cymbopogon citratus Papilionaceae
8 Water leaf Talinium triangulare Portulacaceae
9 Mushroom Termitomyces spp Agaricaceae
10 Awolowo weed Chromolaena odorata Asteraceae
11 Cats hair Euphorbia hirta Euphobiaceae
12 Giant grass Imperata cylindrica Poaceae
13 Giant star grass Axonopus compressus Giramineae
14 Osetura Sida acuta Mimosaceae
15 Odukun Ipomea batas Convolvulaceae
16 Ope Elaeis guineensis Oil palm
17 Black night shade Solanum nigruum Solanaceae
18 African allophylus Allophyllus Africana Sapindaceae
19 Asofeyese (yor) Rauwolfia amygdalina Apocynaceae
20 Bitter leaf Vernonia amygdalina Asteraceae
21 Garden egg Solanum nigrum Solanaceae
Source: OOPC – Proposed Mill at Extension Two; EIA Field work, 2019

Okomu Oil Palm Company Plc: 60TPH Palm Oil Mill Project at Extension Two February 2020
Environmental Impact Assessment (EIA) – Final Report Page 158
4.7.2 Secondary Data on Biodiversity from Similar Project Site (Proposed
Extension Two Oil Palm Development Project EIA Final Report December
2016)
The secondary data on biodiversity for the proposed project was obtained from the
recent Final EIA report of the same location in 2016. Suffice to say that it is enough
for the purpose of the proposed project. The study was conducted on a large expanse
of land (11,200 hectares) of which the proposed project site was included. The
vegetation type, plant form/species, terrestrial fauna particularly invertebrate species
and Wildlife, especially large mammals recorded are presented below.
4.7.2.1 Flora and Fauna Composition
4.7.2.1.1 Flora
The vegetation in the northern part of the proposed site consists of a mosaic of fallow
lands, farms, and riparian wetlands along the streams located within the site. The
commonest crops under cultivation in the farms include Manihot esculenta (cassava),
Musa sapientum (Plantain), Zea mays (corn), and Dioscorea alata (yams). The fallow
lands are covered by a variety of weeds including Commelina nodiflora, Panicum
repens, Indigofera suffruticosa, Chromoleana odorata, Tridax procumbens, Panicum
maximum, Axonopus compressus, Ageratum conyzoides, Ipomoea involucrata, Sida
acuta, Abuliton sp., Costus afer, Smilax anceps, Manniophyton fulvum,
Solanumtorvum Ipomoea hirta and Cyperus spp.
Trees within the fallow area of the northern region of the proposed project area include
Baphia nitida, Trema orientalis, Pycnanthus angolensis, Musanga cecropioides,
Alchornea cordifolia, Alstoni aboonei, Milicia excelsia,Nauclea spp., Voacanga spp,
Terminalia ivorensis,Ricinodendron africanum ,Irvingia gabonensis and Bombax spp.
The riparian wetland areas along the streams and JemideRiver are dominated by
swamp loving plants such as Hallea ciliata, Ancistrophyllum seccundiflorum, Uapaca
spp., Musanga cropioides, Anthostema aubryanum, Danielia ogea, Pandanus
togoensis, and Alchornea cordifolia. Riparian wetlands area areas of high
conservation value as they contain sensitive biota. Aquatic macrophytes encountered
include Cyrtosperma senegalense, Ipomoea aquatica, Leersia hexandra, Crinum sp.
and Jussiea repens. The vegetation is generally healthy. The cassava mosaic disease
is however prevalent in the study area.
The vegetation in the Southern part of the study area is also similar to that of the
northern part but a portion of it is presently covered by oil palm plantation, farmlands,
forest regrowth and with weed species typical of the lowland rain forest zone in Nigeria.
The dominant plants include Guinea grass (Panicum maximum), Trema orietalis,

Okomu Oil Palm Company Plc: 60TPH Palm Oil Mill Project at Extension Two February 2020
Environmental Impact Assessment (EIA) – Final Report Page 159
Alchornea cordifolia, Siam weed (Chromoleana odorata) and Sida spp. However,
there is a lake (06° 40' 27.4" N and 005° 49' 50.5" E) within the southern part of the
proposed project area, with some aquatic plant species such as Nymphaea lotus and
Pistia stratiotes,Cyrtosperma.
Plate 4-1a: Luxuriant growth of cassava in the study area Plate 4-1b: Part of a plantain farm
Plate 4-1c: A new plantain farm by one of the streams Plate 4-1d: Part of a yam farm
Plate 4-1e: Part of the fallow land colonised by various
weeds, shrubs and trees
Plate 4-1f: A riparian forest is well developed
along one of the streams.
Plate 4-1g: River Jemide with emergent aquatic species Plate 4-1h:The southern part with mainly weed species
Plate 4-1a to 4-1h: Different Types of Vegetation Recorded at Extension Two

Okomu Oil Palm Company Plc: 60TPH Palm Oil Mill Project at Extension Two February 2020
Environmental Impact Assessment (EIA) – Final Report Page 160
Forest Stratification
Forest stratification was observed in large patches. There were three tree strata,
consisting of emergents, canopy and under-storey layers. Other life forms associated
with trees were epiphytes and climbers.
Emergent
These are the tallest trees (>35m) scattered within the forest. Their crowns do not touch
as they are far apart and tower above the canopy trees. Emergent species encountered
during the survey included Triplochiton scleroxylon, Ceiba pentandra, Khaya
ivorensis, Terminalia superba, Piptadeniastrum africanum and Milicia excelsa. A
Terminalia sp tree was above 50m in height and 5m in girth. As these are timber
species of value, these forest fragments are susceptible to assault by timber merchants
and their collaborators.
Plate 4.2: Emergent vegetation

Okomu Oil Palm Company Plc: 60TPH Palm Oil Mill Project at Extension Two February 2020
Environmental Impact Assessment (EIA) – Final Report Page 161
Canopy Layer
The trees in this layer have their crown touching one another so they form a complete
cover (canopy) over the forest, thus casting shade upon the species below. Species
found in this layer included Trema guineensis, Antiaris toxicaria, Trilepisium
madagascariense, Malacantha alnifolia, Hallea ciliata, Alstonia boonei and
Dacryodes edulis.
Plate 4.3: Canopy trees
Under-Storey Layer
The trees in this layer are adapted to the little amount of light that filters through the
canopy layer. They are smaller in size and some notable characteristics include
buttresses at the bases of the stems, relatively thin barks, and drip tips of leaves.
Species found included Olax subscorpioidea, Celtis phillipensis, Cola millenii,
Campylospermum flavum, and Pycnanthus angolensis.
The canopies of trees in this layer were infested with epiphytes such as lichens, mosses
and ferns, and some vascular plants including Culcasia scandens and a variety of
orchids. The shrub layer had species like Abrus precatorius, Cnestis ferruginea, and
Connarus staudtii. Paullinia pinnata occurred at the edge of the forests where there is
illumination.

Okomu Oil Palm Company Plc: 60TPH Palm Oil Mill Project at Extension Two February 2020
Environmental Impact Assessment (EIA) – Final Report Page 162
Plate 4.4: Understory Trees with Epiphytes
4.7.2.1.2 Composition of the Fauna
The terrestrial wildlife fauna of the region consist of mammals, birds, reptiles,
amphibians and invertebrates.
Mammals
Table 4.31 gives a summary of the mammalian fauna recorded from the study area. A
total of 27 species of mammals (excluding bats) were recorded in the area during the
period of study. These species belong to 6 mammalian Orders, 16 Families, and 24
Genera. They include the rodents (Rodentia), primates (Primates), pangolins
(Pholidota), carnivores (Carnivora), insectivores (Insectivora), and ungulates
(Artiodactyla). The rodents were the most dominant mammalian group, excluding bats,
constituting about 40% of the total number of mammalian species recorded. Except for
the Giant rats, the rodents are small mammals and are very varied in pelage coloration
and patterning (Happold, 1987). They are mostly terrestrial and live in burrows, being
mostly nocturnal. Because of their large numbers they are neither threatened nor
endangered by the proposed project but rather considered a pest to field crops and stored
products. They are listed as Least Concert (LC) by the 2014 IUCN Red list.
The primates include the monkeys, galagos and pottos. Monkeys were sighted along
the watershed forest in Grid 11, 17 and 18. Mona monkeys (Cercopithecus mona ) and
the White-throated monkeys were seen recently but their population is declining as a
result of habitat loss through deforestation for timber and conversion of forest to

Okomu Oil Palm Company Plc: 60TPH Palm Oil Mill Project at Extension Two February 2020
Environmental Impact Assessment (EIA) – Final Report Page 163
agricultural land. These monkeys are now restricted to the watershed forest of the
Jemide River. The White Throated Monkey is listed in the IUCN Red list (2014) as
Vulnerable and will need special attention for protection when clearing and farm
operations commence. Pottos and galagos have been reported by trappers and hunters.
Although their population is declining, they were considered as Least Concern by the
IUCN Red list.
The carnivores are represented by small to medium-sized species of civet, genet and
mongoose. They are all rare and may be threatened by habitat loss and over-exploitation
by humans for food. They were considered as Least Concern by the IUCN Red list.
Amongst the Artiodactyla (even-toed ungulates) only the antelopes (family Bovidae)
and bush pigs (family Suidae) were reported to occur in the area. They are commonly
found in the area and may not be threatened immediately by the project. However, as
the forest becomes more accessible to hunters/trappers due to the project, these wildlife
species will be seriously threatened. The buffalo was reported to be present in the past
but this species has not been recorded in the area in the last 5 years and may be locally
extinct. All the Artiodactyla are considered as Least Concern by the IUCN Redlist.
The pangolins (Order Pholidota) were represented by a single species of tree pangolin,
or White-bellied Pangolin Manis tricuspis = Phataginus tricuspis. This species is
considered as Vulnerable by the IUCN Red list. Table 4.31 gives a checklist of all the
mammalian fauna found in the area of study.
Table 4.31: Number of Species, Genera and Families of Mammals
(Excluding bats)
Order Family Genera Species
Rodentia 6 6 11
Primates 3 4 4
Artiodactyla 2 3 4
Carnivora 2 5 5
Insectivora 2 2 2
Pholidota 1 1 1
Total 16 21 27
Source: Extension Two Oil Palm Development Project; EIA Final Report
December 2016

Okomu Oil Palm Company Plc: 60TPH Palm Oil Mill Project at Extension Two February 2020
Environmental Impact Assessment (EIA) – Final Report Page 164
Birds (Avifauna)
The avifauna of the region represents the diverse habitat types in the region. The habitats
include secondary forest at various successional stages, farmlands (including cassava,
yam) and freshwater swamp forest in the northern part of the concession and oil palm
plantation in the south. A total of 49 species were recorded. Birds’ characteristic of
primary forest or old growth secondary forest such as hornbills, turacos, various bulbuls,
flycatchers, and eagles were found in the primary forest fragment near the Jemide River.
Seed and insect eating birds dominated the farmlands and oil palm plantation in the
southern part of the concession within the proposed project area. They include bulbuls,
barn swallows, swift, wagtails, waxbills, pin-tailed whydahs, common thrush,
kingfishers and sunbirds. These species gives a clear indication of habitat change.
Common raptors in the proposed project area include hawks, hawk-sparrow, kites,
buzzards, palmnut vultures and martial eagles.
Moreover, only a few species restricted to the Guinea-Congo Forest Biome, were
identified during the assessment. These include the White-Thighed Hornbill (Bycanistes
albotibialis), African Emerald Cuckoo (Chrysococcyx cupreus), Yellow-Crested
Woodpecker (Thripias xantholophus) and White-Breasted Negro finch (Nigrita
fusconotus). Plate 4.5 shows some of the bird species recorded from the proposed project
area.
The proposed project area is not located within any Important Bird Area (IBA) as
defined by Birdlife International. The nearest being the Okomu National Park,
approximately 60 km, in Ovia Southwest Local Government Area, Edo State, Nigeria.

Okomu Oil Palm Company Plc: 60TPH Palm Oil Mill Project at Extension Two February 2020
Environmental Impact Assessment (EIA) – Final Report Page 165
Table 4.32: A Checklist of Avifauna of the Proposed Project Area
Family Scientific Name Common Name IUCN
Status
Accipitridae Gypohierax angolensis Palm-Nut Vulture Least
concern
Accipitridae Polyboroides radiatus Harrier Hawk LC
Accipitridae Polemaetus bellicosus Martial Eagle LC
Accipitridae Milvus migrans Black Kite LC
Accipitridae Kaupifalco monogrammicus Lizard Buzzard LC
Alcedinidae Halcyon malimbica Blue-Breasted kingfisher LC
Alcedinidae Halcyon senegalensis Woodland Kingfisher LC
Alcedinidae Alcedo cristata Malachite kingfisher LC
Apodidae Cypsiurus parvus African Palm-swift LC
Ardeidae Bubulcus ibis Cattle Egret LC
Bucerotidae Bycanistes subcylindricus Black-and-White Casqued
Hornbill
LC
Bucerotidae Tockus fasciatus African Pied hornbill LC
Capitonidae Pogoniulus bilineatus Yellow-Rumped Tinkerbird LC
Capitonidae Pogoniulus subsulphureus Yellow-Throated Tinkerbird LC
Cisticolidae Cisticola erythrops Chattering Cisticola LC
Columbidae Turtur tympanistria Tambourine Dove LC
Columbidae Streptopelia senegalensis Laughing Dove LC
Columbidae Streptopelia semitorquata Red eyed Dove LC
Coraciidae Eurystomus glaucurus Broad-Billed Roller LC
Columbidae Turtur afer Blue-spotted Wood dove LC
Corviidae Corvus albus Pied Crow LC
Cuculidae Centropus senegalensis Senegal Coucal LC
Cuculidae Centropus grilli Black Coucal LC
Cuculidae Chrysococcyx caprius Didric cuckoo LC
Estrildidae Nigrita fusconotus White Breasted Negrofinch LC
Estrildidae Lonchura cucullata Bronze Mannikin LC
Estrildidae Nigrita canicapillus Grey-Headed Negrofinch LC
Estrildidae Lonchura bicolor Black and White Mannikin LC
Hirundinidae Hirundo nigrita White-Throated Blue Swallow LC
Hirundinidae Hirundo aethiopica Ethiopian Swallow LC
Meropidae Merops pusilus LittleBee-Eater LC
Meropidae Merops albicollis White-throated bee-eater LC
Motacillidae Motacilla flava Yellow Wagtail LC
Motacillidae Macronyx croceus Yellow-Throated Longclaw LC
Nectariniidae Hedydipna collaris Collared Sun-bird LC
Nectariniidae Cinnyris cupreus Copper Sun-bird LC
Nectariniidae Cinnyris superbus Superb Sunbird LC
Numididae Numida meleagris Helmented Guinea Fowl LC
Passeridae Passer griseus Northern Grey-Headed
Sparrow
LC
Picidae Dendropicos goertae Grey Woodpecker LC

Okomu Oil Palm Company Plc: 60TPH Palm Oil Mill Project at Extension Two February 2020
Environmental Impact Assessment (EIA) – Final Report Page 166
Picidae Dendropicos gabonensis Gabon Woodpecker LC
Ploceidae Ploceus cucullatus Village Weaver LC
Pycnonotidae Pycnonotus barbatus Common Bulbul LC
Pycnonotidae Andropadus virens Little Greenbul LC
Pycnonotidae Thescelocichla leucopleura Swamp Palm Bulbul LC
Sylviidae Hylia prasina Green Hylia LC
Turdidae Turdus pelios African Thrush LC
Viduidae Vidua macroura Pin-Tailed whydah LC
Plate 4.5a: White-throated Bee-eater,
Merops albicollis
Plate 4.5b: Little Bee-eater, Merops
pusillus
Plate 4.5c: Red-eyed Dove, Streptopelia vinacea Plate 4.5d: Pied Crow
Plate 4.5a-5d: Bird Species Recorded at Project Site
Source: Extension Two Oil Palm Development Project; EIA Final Report December 2016

Okomu Oil Palm Company Plc: 60TPH Palm Oil Mill Project at Extension Two February 2020
Environmental Impact Assessment (EIA) – Final Report Page 167
Plate 4.6: Different Bird nests in the project area
Source: Extension Two Oil Palm Development Project; EIA Final Report December 2016
Invertebrates: Arthropods and Molluscs
Arthropods collected were represented mainly by the Lepidoptera (butterflies),
Coleoptera (beetles), Isoptera (termites), Orthoptera (grasshoppers), Hemiptera (bugs)
and Diptera (flies). Land molluscs were represented by over thirty species of snails
belonging to the families Achatinidae, Streptaxidae, Subulinidae, urocyclidae, and
Veronicellidae.
Plate 4-7a: Butterflies

Okomu Oil Palm Company Plc: 60TPH Palm Oil Mill Project at Extension Two February 2020
Environmental Impact Assessment (EIA) – Final Report Page 168
Plate 4-7b: Prey mantis, Plate 4-7c: Dragonfly
Plate 4.7a to 4-7c: Arthropods from the proposed project area
Source: Extension Two Oil Palm Development Project; EIA Final Report December
2016
Amphibians and Reptiles
The reptiles were represented by chameleons, geckos, monitor lizards, agama lizards,
snakes, skinks, and tortoises. There are reports of the presence of the long snouted
crocodiles in the lake within the southern part of the project area. However, none was
sighted during the study. A total of 14 species of reptiles and ten (10) amphibian species
were recorded in the proposed project area. Apart from the crocodiles and the royal
python most reptilian and amphibian species are neither endangered nor threatened. The
amphibians were represented mainly by different types of frogs and toads including the
African Tree frogs and the Tongueless frogs. A checklist of the amphibian and reptilian
species found or reported is listed in Table 4.33 below.

Okomu Oil Palm Company Plc: 60TPH Palm Oil Mill Project at Extension Two February 2020
Environmental Impact Assessment (EIA) – Final Report Page 169
Table 4.33: Checklist of Reptiles and Amphibians Reported from the Proposed Project Area
Order Family Common name Scientific name Abundance
IUCN
status
Chelonia Testudinidae Tortoise
Serrate Hinge-
back tortoise Kinixys erosa Rare LC
Crocodilia Crocodylidae
Dwarf Crocodile Osteolaemus tetraspis Rare V
Squamata Agamidae Agama lizard Agama agama Abundant LC
Gekkonidae Wall Gecko Hemidactylus brooki Abundant LC
Scincidae Skinks Mabuya sp Abundant LC
Lygosoma sp Abundant LC
Melanoceps sp. Abundant LC
Varanidae Nile Monitor Varanus niloticus Rare LC
Boidae Royal Python Python regius Rare LC
Colubridae Common Snakes
Common Nigerian
File Snake Mehelya crossi Abundant LC
The Lined House
Snake Boaedon lineatus Abundant LC
the Common
Hedge Snake
Philothamnus
irregularis Abundant LC
Elapidae Black Cobra Naja melanoleuca Abundant LC
Viperidae common vipers Vipera sp. Abundant LC
Amphibians Bufonidae Toads
Amietophrynus
maculates Abundant LC
Dicroglossidae True frogs
Hoplobrachus
occipitalis Abundant LC
Arthroleptidae Leptopelis hyloides Rare LC
Phrynobatrachidae Phrynobatracus sp Abundant LC
Hyperoliidae Treefrogs Afrixalus dorsalis Rare LC
Hyperiolius fusciventris Rare LC
Ptychadenidae Ptychadena longirostris Abundant LC
Ptychadena oxyrynchus Abundant LC
Ptychadena pumlio Abundant LC
Chiromantis rufescens Rare LC
Source: Extension Two Oil Palm Development Project; EIA Final Report December 2016

Okomu Oil Palm Company Plc: 60TPH Palm Oil Mill Project at Extension Two February 2020
Environmental Impact Assessment (EIA) – Final Report Page 170
4.8 Socioeconomic and Social Impact Assessment
A quick appraisal of socioeconomic situation of the ten affected communities was carried
out in March 2018 against what was reported in 2014 during Extension Two Oil Palm
Plantation Development project. The proposed project was introduced to the affected
communities when the study was conducted. The Extract of the study in 2014 is thus
presented as follows:
4.8.1 Communities
There are ten communities surrounding the proposed project. The respective locations
of the communities in relation to the proposed project are as follows:
4.8.1.1 Agbanikaka Community
Agbanikaka, which translates to “The Land of Peace”, is an Uhobe community in Ovia
North East Local Government Area in Edo State, Nigeria. The community is in the
North-West of the Extension and shares boundaries with Sabogida, Ijagba, Owan, and
Sobe in the North, South, East and West respectively.
4.8.1.2 Owan Community
Owan, which translates to “The land that protects its children”, is an Uhebe community
in Ovia North East Local Government Area in Edo State, Nigeria. The community is in
the North-West of Extension Two, and shares boundaries with Sabongida, Ofutebe,
Uhiere, and Agbanikaka in the North, South, East and West respectively.
4.8.1.3 Uhiere Community
Uhiere, which translates to “The Land of Peace”, is an Ishan community in Ovia North
East Local Government Area in Edo State, Nigeria. The community is in the West of
the project site and shares boundaries with Oke, Ofutebe, Odiguetue and Owan in the
North, South, East and West respectively.
4.8.1.4 Odiguetue Community
Odiguetue, which translates to “The Land of dignity”, is an Edo community in Ovia
North East Local Government Area in Edo State, Nigeria. The community is in the
South-West of the project site and shares boundaries with Okokhuo, Oke, Uhiere and
Odighi in the North, South, East and West respectively.
4.8.1.5 Odighi Community
Odighi, which translates to “The Land of honey”, is an Ozoguo community in Ovia
North East Local Government Area in Edo State, Nigeria. The community is in the
South-West of the project site and shares boundaries with Idunmowo, Oke,
Osasinmwonoba, and Uhiere in the North, South, East and West respectively.

Okomu Oil Palm Company Plc: 60TPH Palm Oil Mill Project at Extension Two February 2020
Environmental Impact Assessment (EIA) – Final Report Page 171
4.8.1.6 Ihrue Community
Ihrue, which translates to “The Land of evil blood”, is a Benin community in
Uhunmwonde Local Government Area in Edo State, Nigeria. The community is in the
East of the project site and shares boundaries with Oke, Iruekpe, Ekpan and Ikhuo in
the North, South, East and West respectively.
4.8.1.7 Oke Community
Oke, translates to “The Land surrounded by hills”, is a Benin community in
Uhunmwonde Local Government Area in Edo State, Nigeria. The community is in the
East of the project site and is one of the oldest communities based on oral history.
4.8.1.8 Ekpan Community
Ekpan, which translates to “The Land of Peace”, is a Benin community in
Uhunmwonde Local Government Area in Edo State, Nigeria. The community is in the
East of the project site. The community which is about 2 square kilometers in size (in-
dwelling) is made up of four quarters namely Dumeso, Idueke, Ukpoka and Egohie. It
shares boundaries with Isa West, Owan, Irhue and Umuokpe-Irhua in the North, South,
East and West respectively.
4.8.1.9 Umuokpe Community
Umuokpe, which translates to “The Land of Prosperity”, is a Benin community in
Uhunmwonde Local Government Area in Edo State, Nigeria. The community is in the
North-East of Extension Two. It is about 2 square kilometers in size (in-dwelling) and
is made up of three quarters and seven compounds. The community shares boundaries
with Orhua, Ekpan, Isan West and Owan in the North, South, East and West
respectively.
4.8.1.10 Orhua Community
Orhua, which translates to “The Land of humility”, is a combination of Ishan and Benin
community in Uhunmwonde Local Government Area in Edo State, Nigeria. The
community is in the North-East of the project site and shares boundaries with Iruekpen,
Umuokpe, Isan West and Owan in the North, South, East and West respectively.

Okomu Oil Palm Company Plc: 60TPH Palm Oil Mill Project at Extension Two February 2020
Environmental Impact Assessment (EIA) – Final Report Page 172
4.8.2 Study Approach and Methodology
Methodology adopted for the study in the affected communities involved triangulation of
various sources of data with the use of tools relevant to Participatory Rural Appraisal (PRA)
and Socio-Economic Assessment.
The following steps were undertaken at ensuring the successful outcome of the study:
• Formal stakeholders’ meetings with the ten local communities of the proposed
project at Extension Two (FGD)
• Scoping: This is the process of identifying, defining and prioritizing the social
components to be addressed in the social assessment. The impact of the proposed
project was assessed in terms of the following impact criteria:
✓ Scale: Physical scale/areas which the impact would be felt (local or regional).
✓ Duration: Length of time the impact would likely be felt (short term, medium
term and long term).
✓ Severity: The intensity of the impact.
✓ Direction: Whether the impact would be positive (beneficial) or negative
(adverse).
4.8.2.1 Data collection
To facilitate accurate information dissemination from each community,
• Structured check-lists were used to enlist information and data in the ten
communities as well as other internal and external stakeholders of the respective
communities such as community executives, Local Government representatives,
CBOs and NGOs, and so on.
• Interview of key informants in each community to obtain divergent views on the
issues at stake and how to address them.
4.8.2.2 Review of relevant document
Secondary data were gathered from journals, archives, publications and internet. The
gathering and review of published and unpublished baseline/project data were not left out.
4.8.2.3 Field Work
Socio-economic survey and SIA of the proposed project communities were
concurrently conducted as outlined in Table 4.34 below.

Okomu Oil Palm Company Plc: 60TPH Palm Oil Mill Project at Extension Two February 2020
Environmental Impact Assessment (EIA) – Final Report Page 173
Table 4.34: Schedule of Socioeconomic and SIA exercise
Communities SIA Field Exercise Attendance Checklist authentication
Agbanikaka 18th March, 2014 27 Ikpefuran Sunday - 08038157678
Owan 19th March, 2014 28 Elder Clement Ugboiyobo
Uhiere 20th March, 2014 35 Francis Obanor - 08182731748
Odigwetue 20th March, 2014 36 John Ehigia - 08182401090
Odighi 24th March, 2014 27 Flamingo Dajide - 08077220988
Oke- Irhue 20th March, 2014 53 Ohiengbe Sylvester - 08134266005
Ihrue 24th March, 2014 15 Samuel Alohan (08031259221)
Umuokpe 25th March, 2014 15 (Community Secretary - 08086792306)
Epkan 24th March, 2014 13 Matthew Omoniyi (07031259895)
Orhua 25th March, 2014 10 O.C. District Forest Chairman - 08066318167
Source: Extension Two Oil Palm Development Project EIA Final Report December 2016
4.8.2.4 Duration of Study
The socioeconomic and social impact assessment study including data collection and
fieldwork in the ten communities was conducted between March and May 2014.
4.8.3 General Baseline Socioeconomic Conditions
4.8.3.1 Household Demographics
From communities sources the demographic data are summarized in Table 4.35 below
while the cumulative population of all the affected communities is 25,500. A dominant
feature of the structure of the population of the Extension Two affected communities is its
significant level of young people with over 80% of the population below the age of 45
years. Adults in the age group 45 years and above constitute about 16% of the population.
The male to female ratio is more or less even.

Okomu Oil Palm Company Plc: 60TPH Palm Oil Mill Project at Extension Two February 2020
Environmental Impact Assessment (EIA) – Final Report Page 174
Table 4.35: Demographic Data
S/No. Community Children Youth Adult Total LGA Male Female
1 AGBANIKAKA 1,200 800 300 2,300 OVIA NORTH EAST 1,300 1,000
2 OWAN 1,500 1,000 500 3,000 OVIA NORTH EAST 1,400 1,600
3 UHIERE 600 1,200 200 2,000 OVIA NORTH EAST 1,000 1,000
4 ODIGWETUE 1,500 2000 1000 4,500 OVIA NORTH EAST 2,200 2,300
5 ODIGHI 1,000 1500 500 3,000 OVIA NORTH EAST 1,400 1,600
SUB-TOTAL 5,800 6500 2500 14,800 7,300 7,500
6 IHRUE 400 800 300 1,500 UHUNWONDE 800 700
7 OKE-IHRUE 2,000 1600 400 4,000 UHUNWONDE 2,100 1,900
8 EKPAN 500 700 300 1,500 UHUNWONDE 700 800
9 UMUOKPE 400 600 200 1,200 UHUNWONDE 500 700
10 ORHUA 600 1,600 300 2,500 UHUNWONDE 1,300 1,200
SUB-TOTAL 3,900 5,300 1500 10,700 5,400 5300
GRAND TOTAL 9,700 11,800 4,000 25,500 12,700 12,800
Source: Extension Two Oil Palm Development Project EIA Final Report December 2016
The population distribution is skewed towards youth and the implication is that unless they
are productively engaged in proposed Extension Two project, they may constitute a
social/security risk as soon as their farmland is taken over by the project.
4.8.3.2 Housing
Housing is one of the three essential things of life and the housing pattern of the people in
the ten affected communities of proposed Okomu Extension Two project is below MDG
goals with only 29% living in cement block houses. Table 4.36 shows the housing summary
on community basis.
Table 4.36: Housing Patterns of affected Communities
S/N Thatched
roof (%)
Shed for
relaxation
(%)
Zinc roof
(%)
Mud house
(%)
Block & Cement
(%)
1 Agbanikaka 3 10 12 50 25
2 Owan 3 7 20 60 10
3 Uhiere 1 2 2 80 15
4 Odiguetue 1 2 2 10 85
5 Odighi 1 5 14 60 25
6 Ihrue 4 3 8 50 35
7 Oke- Ihrue 1 4 5 70 20
8 Umuokpe 1 3 6 70 20
9 Orhua 4 3 3 65 25
10 Ekpan 5 5 10 45 35
AVERAGE 2 5 8 56 29
Source: Extension Two Oil Palm Development Project; EIA Final Report December 2016

Okomu Oil Palm Company Plc: 60TPH Palm Oil Mill Project at Extension Two February 2020
Environmental Impact Assessment (EIA) – Final Report Page 175
4.8.3.3 Infrastructure
It was obvious that all the ten communities of the proposed project lack virtually all the
desirable basic infrastructural facilities. There are four (4) abandoned reticulated water &
three (3) neighbourhood water schemes which are malfunctioning therefore, no portable
water for most population in the affected communities.
Plate 4.8: Umuokpe Malfunction Water Scheme
Plate 4.9: New Water Scheme Project at Umuokpe
Community By OOPC
Plate 4.10: Odiguetue Abandoned Water Scheme
Plate 4.11: First Borehole Project at Odiguetue by OOPC

Okomu Oil Palm Company Plc: 60TPH Palm Oil Mill Project at Extension Two February 2020
Environmental Impact Assessment (EIA) – Final Report Page 176
Plate 4.12: Town Hall Project at Odiguetue
Community by OOPC
Plate 4.13: New Market Stalls at Odiguetue
Community by OOPC
Oke-Irhue community is one of the oldest communities based on oral history, and till date
the little infrastructure there, such as road, health centre care all dilapidated. Odighi
community has some infrastructural facilities, which are mostly non-functional.

Okomu Oil Palm Company Plc: 60TPH Palm Oil Mill Project at Extension Two February 2020
Environmental Impact Assessment (EIA) – Final Report Page 177
Plate 4.14: New Borehole at Irhue Community
By OOPC
Plate 4.15: New Market Stalls at Irhue
Community By OOPC
Plate 4.16: New Town Hall at Irhue Community
By OOPC

Okomu Oil Palm Company Plc: 60TPH Palm Oil Mill Project at Extension Two February 2020
Environmental Impact Assessment (EIA) – Final Report Page 178
4.8.3.4 Agriculture and Household Nutrition
Farming and agricultural activities are rain fed and on subsistence level. Men are more
into farming (usually with the assistance of children/youth) than women. A wide range of
crops is cultivated especially cocoa, plantain/banana, maize, cassava, vegetables and
root/stem crops. Apart from being one of the main traditional occupations of the people,
it is also practiced mostly by the natives due to the community’s land ownership structures.
The assets used in agricultural activities are as follows:
Human Assets: The people employ traditional farming skills such as:
- Land management skills, like rotational bush fallowing, in cultivation of crops
- Maintenance of local farm tools
- Fairly good marketing skills but growth and opportunity in the commodity value
chains have not been used to their advantage.
Natural Assets: These include farmland, soil and topography and favorable climate.
Physical Assets: Farmers own hoes, cutlass, spades, wheelbarrow, basins, basket and other
equipment.
Social Assets: There is low level of social cooperation due to subsistence level of farming
practice as well as poverty.
The rainy season (March/April to September/October is associated with peak cropping
seasons especially arable crop cultivation whilst the dry season is used for harvesting,
marketing and land preparation for the next farming season.
The level of poverty in all the communities is pretty high as the standard of living is really
low. Though the communities are rich in agricultural produce, due to the lack of processing
facilities, most of their crops get spoilt early because of lack of storage facilities for these
produce as was reported in 2014.
4.8.3.5 Education
There is no marked discrimination in access to education gender-wise, although the only
few primary schools and two secondary schools in the Extension Two communities have
positive correlation with the school enrolment rate. The informal education facilities and
the adult learning programmes are non-existent in all the communities. It is worth
mentioning that the educational attainment / literacy level amongst the community people
is below average. There is however skewed literacy rate in favor of men compared to
women.

Okomu Oil Palm Company Plc: 60TPH Palm Oil Mill Project at Extension Two February 2020
Environmental Impact Assessment (EIA) – Final Report Page 179
4.8.3.6 Health
All the four (4) health centres in the communities need staffing, equipment and drugs as
reported in 2014 (see Plate 4.17 and Plate 4.18) while the new clinic and equipment
donated by Okomu Oil Palm Company Plc to Odighi community is depicted in Plate 4.19
to Plate 4.22 below.
Plate 4.17: Odiguetue Health Centre with Old beds Plate 4.18: Umokpe Nursing Home
Plate 4.19: Her Excellency Lara Oshiomole
Commissioning Odighi Clinic
Plate 4.20: Odighi Clinic Built By Ovia North
East L.G.A and Equiped By OOPC

Okomu Oil Palm Company Plc: 60TPH Palm Oil Mill Project at Extension Two February 2020
Environmental Impact Assessment (EIA) – Final Report Page 180
Plate 4.21: Some of the Hospital Beds Donated By
OOPC
Plate 4.22: Gen Set at Odighi Clinic Donated
By OOPC
4.8.3.7 Livelihood Strategies
Economic activities of Extension Two communities are relatively diverse although on
small and medium scales. Traditional occupations of the people of the affected
communities include subsistence farming, lumbering and agro-based trading. These
livelihoods are practiced alongside other gainful non-traditional economic activities such
as commercial transportation, civil service, contracting and artisans. There are fertile soils
for farming; rivers for fishing & water transport, timber for lumbering as well as forest
products as natural resource use in the most of the affected communities.
4.8.3.8 Income and Expenditure
The measurement of income level is generally a major problem in Nigeria because of the
reluctance of respondents to give accurate information on their real income. Moreover,
there are problems in quantifying the real income of the rural working population because
a good proportion of their produce is consumed directly and does not enter the market.
There are various forms of social capital available to households in the community notably
family support, exchange of labour, group activities, association and cooperative groups.
The main sources of income of households and individuals are from occupations / activities
like farming, trading and rendering of various services. Generally, there is poor income
security in virtually all the communities.
4.8.3.9 Belief Systems and Sacred Sites
Sacred sites are places within the landscape that have a special significance under
Aboriginal tradition. Hills, rocks, waterholes, trees, plains and other natural features may
be sacred sites. In coastal and sea areas, sacred sites may include features which lie both

Okomu Oil Palm Company Plc: 60TPH Palm Oil Mill Project at Extension Two February 2020
Environmental Impact Assessment (EIA) – Final Report Page 181
above and below water. There are sacred sites in some of the communities such as
Agbanikaka and Odighi. In Agbanikaka, there are two shrines that is, Osun Shrine and a
sacred shrine called Ose River Shrine. It was said that Odiguetue community has a lake
called Odighi Lake and they have a shrine beside the lake. The locations of these sacred
sites in Extension Two land are in the South West and North West.
Some belief systems are localized while some cut across the ten communities. Uhiere has
two main rivers (Ikpesira and Abumeri). The Ikpesira River has great law guiding it like;
no one is allowed to visit it at night, no woman in her period is allowed to visit it, it forbids
fishing and the pouring of oil on it; while the Abumeri River forbids the killing of its fishes
only.
The community frowns greatly at having sex with married women (another man’s wife),
the use of “juju” is a taboo and also no use of gun or cutlass when fighting, and stealing is
also a taboo. The Oke River is one of their main sources of water but the River forbids the
washing of oil and killing of the fish.
4.9 Social Impact Assessment
4.9.1 Baseline Social Situation
A baseline assessment provides information on the situation the study aims to change. It
provides a critical reference point for assessing changes and impact, as it establishes a basis
for comparing the situation before and after an intervention, and for making inferences as
to the effectiveness of the program. Baseline assessments should be conducted before the
actual programme intervention starts so as to serve as a benchmark for examining what
change is triggered by the intervention. The baseline situation information was obtained
through direct observation and local talent and knowledge of communities. The direct
observation is nothing less than “Visual inspection” which is the quickest and best way to
check issues of location, scale and proximity that determine many impacts. Stakeholders
and local communities have local knowledge that you need. And, impacts depend on what
those that are affected value and need!
The results of baseline situation as related to the people of the communities to be affected
by the proposed Extension Two project are presented as follows:
People’s way of life: Based on the empirical data gathered from the FGD and key
informants from the various communities it is obvious that the people are majorly
farmers with a few into some forms of trade. They tend to be more bounded by the
common interests they share as farmers. Apart from Odiguetue and Oke that have
internal crisis among themselves and the SIA team identified them as social hot

Okomu Oil Palm Company Plc: 60TPH Palm Oil Mill Project at Extension Two February 2020
Environmental Impact Assessment (EIA) – Final Report Page 182
spots, other communities are peaceful and are receptive to strangers. During the
study of the various communities we were informed that some criminals from Oke
went to the bush and killed a young man from Uhiere who attempted to run when
he was about to be robbed. Few days later we also heard that another person was
shot dead at Oke due to conflict among groups of youths. Even during pre-entry
visit to the community some members of Oke community presented such a high
level of antagonism that neither the study team nor the company is welcomed. Other
communities such as Owan, Odighi, Agbanikaka, Uhiere are very harmonious in
their day to day live, and tend to work for the overall interest of the community
members.
Their culture: The ten communities have similar culture in the way of greetings,
marriage, tradition and other norms and values. Some of their traditions or
community dos and don’ts include – no fighting in the bush and with dangerous
weapon; no love making in the bush; no sexual advances from any man to a married
woman. But a community like Owan places emphasis on no usage of charms against
any other person the community. It is their belief that River Owan is not friendly to
strangers – hence, it is advised that strangers beware. The Owan, Agbanikaka and
Uhiere are a multi ethnic communities but the predominant language among them
is Owan language; for Oke, Umopke, Epkan and Orhua the dialect is basically Ishan.
But Odiguetue, Odighi and Irhue are Benin speaking people. Odighi and Uhiere
both have sacred rivers that are not accessible.
Their environment: On the general perspective their environment is clean and
habitable. No exposures to hazardous and dangerous chemicals; no epidemic
outbreak whatsoever. The air is generally clean. However, the pathetic condition of
their source of portable water can lead to water borne diseases. Owan River demands
an urgent attention due to some community members who deposit waste substances
therein or use chemical to kill fish from the river.
One of the major problems in some of the communities is erosion and flooding.
During the peak of rainy season the western part of Owan land is cut off from the
community for about three months. To the extent that the two major rivers around
Ose and Owan meet at some point and making the major road to Benin partially
impassable for about two to three days. Likewise at Irhue – the only security outfit
Nigerian police Force was forced out of the location because of flooding.

Okomu Oil Palm Company Plc: 60TPH Palm Oil Mill Project at Extension Two February 2020
Environmental Impact Assessment (EIA) – Final Report Page 183
The physical safety of most of the communities is threatened at a particular period
of the year because of the activities of Fulani herdsmen armed with sophisticated
rifles and who without regard enter into farmlands with their cattle, when
challenged for this provoking action they either attack the males or rape the females
in the communities.
Their Health and Wellbeing: The health status is average as in a normal Nigerian
community setting. But the people are majorly affected by malaria and typhoid
fever. The lack of healthcare facilities in most of the communities also place the
community members at risk most especially pregnant and nursing mothers.
Their Level of Education: Although no educational status related questions were
asked but from our observation most men can express themselves either in pidgin
or simple English but the case is different with women. However, there are some
graduates from various institutions and some other persons with vocational skills.
There is opportunity to develop capacity and competencies even further most
especially in the agricultural sector.
Their Personal and Property Rights: The land use and ownership of the proposed
Extension Two project communities is mainly for farming and gathering of forest
products and there is no case of share-croppers in the community at present.
4.9.2 Mitigating Adverse Social Impacts
Impacts are matched to mitigation actions. Mitigation is the implementation of measures
designed to reduce the undesirable effects of a proposed action on the people and/or
environment. The types of mitigation measures are contained in the Table 4.37 below.
Table 4.37: Types of Mitigation Measure
Type of mitigation measure How it works
Prevention and control measures Fully or partially prevent an impact/reduce a risk by:
-Changing means or technique
-Changing or adding design elements
-Changing the site
-Specifying operating practices
Compensatory measures Offset adverse impacts in one area with improvements
elsewhere.
Remediation measures Repair or restore the environment after damage is done.

Okomu Oil Palm Company Plc: 60TPH Palm Oil Mill Project at Extension Two February 2020
Environmental Impact Assessment (EIA) – Final Report Page 184
4.9.3 Summary of SIA
Based upon the findings, the proposed project at Extension Two showed generally
positive social consequences in the affected communities. However, there are
considerable adverse social impacts enumerated by community stakeholders and
perceived by the study team, which require urgent attention and mitigation measures in
order for Okomu Oil Palm Company Plc to achieve social security in the project area.
Table 4.38 below is the status of the management and mitigation measures proposed in
2016 for adoption and implementation to address the significant potential social and
environmental impacts in order to make the proposed project socially acceptable and
beneficial:
Table 4.38: The Proposed Management and Mitigation Measures for the Communities in 2016 and Current
Situation in 2019
S/No. Proposed Management and Mitigation
Measures
Present Situation in 2018 Remarks
1. Implement FPIC FPIC Process concluded
2016.
FPIC Agreements with the
communities signed 29, July
2016 which were late
notarized and delivered to
the communities.
2. Develop and implement community
engagement plan
The company has developed
a Stakeholders Engagement
Procedure
3. Avoidance of displacement of communities and
people.
No community and people
were displaced
4. Identification, demarcation and appropriate
management of traditional conservation areas
and other high conservation values in the
landscape.
All identified HCV’s are
presently being conserved
High Conservation Values
(HCV’s) were identified and
being conserved
5. Prevention of pollution of water resources. Ongoing Quarterly water monitoring
is being conducted
6. Ensuring proper participatory disengagement
and payment of compensation to farmers using
the land.
Done Compensation duly paid by
former owner (A & Hatman)
7. Fire prevention programmes and zero or
controlled burning.
No burning is being done
8. Corporate social services to communities. On going
9. Provision of healthcare services and HIV
prevention.
Equipping of Odighi
Community clinic
10. Diligent implementation of social impact
management plan
Implementation Ongoing

Okomu Oil Palm Company Plc: 60TPH Palm Oil Mill Project at Extension Two February 2020
Environmental Impact Assessment (EIA) – Final Report Page 185
Table 4.39: List of Communities in Extension 2 with Projects and the Year of Execution
S/N COMMUNITIES PROJECTS YEAR
1 OKE BOREHOLE PROJECT AT OKE COMMUNITY 2017
CORPERS LODGE AT OKE COMMUNITY 2017
SECOND BOREHOLE AT OKE COMMUNITY 2017
RENOVATION OF SCHOOL 2016
THIRD BOREHOLE AT OKE COMMUNITY 2018
OKE COMMUNITY TOWN HALL 2018
CONSTRUCTION OF DOUBLE SEATER DESK &
CHAIRS(40NOS)
2017
2 UHIERE BOREHOLE PROJECT AT UHIERE COMMUNITY 2015
RENOVATED MATERNITY AT UHIERE COMMUNITY 2016
MARKET STALLS AT UHIERE COMMUNITY 2016
RENOVATED TEACHERS QUARTER AT UHIERE
COMMUNITY
2017
SECOND BOREHOLE AT UHIERE COMMUNITY 2018
3 AGBANIKAKA FIRST BOREHOLE PROJECT AT AGBANIKAKA
COMMUNITY
2018
MARKET STALLS AT AGBANIKAKA COMMUNITY 2018
SECOND BOREHOLE PROJECT AT
AGBANIKAKA(UNDER CONSTRUCTION)
2019
AGBANIKAKA TOWN HALL 2017
4 IRHUE MARKET STALLS AT IRHUE COMMUNITY 2017
TOWN HALL AT IRHUE COMMUNITY 2017
FIRST BOREHOLE AT IRHUE COMMUNITY 2017
GRADING OF ROADS DURING DRY SEASON 2016-TILL
DATE
CASSAVA PROCESING MACHINE 2018
CONSTRUCTION OF POLICE STATION 2018
SECOND BOREHOLE PROJECTS(UNDER
CONSTRUCTION)
2019
5 UMOKPE FIRST BOREHOLE PROJECT AT UMOKPE
COMMUNITY
2017
SECOND BOREHOLE PROJECT AT UMOKPE
COMMUNITY
2017
GRADING OF ROADS DURING DRY SEASON 2016-TILL
DATE
CASSAVA PROCESSING MACHINE 2018
6 ODIGHI EQUIPPING OF ODIGHI CLINIC 2016
GEN SET AT ODIGHI CLINIC 2016
FIRST MARKET STALL (5ROOMS) 2016
RENOVATION OF ENOJIE PALACE 2016

Okomu Oil Palm Company Plc: 60TPH Palm Oil Mill Project at Extension Two February 2020
Environmental Impact Assessment (EIA) – Final Report Page 186
RENOVATION OF ODIONWERE’S HOUSE 2016
SECOND MARKET STALL(5ROOMS) 2017
7 OWAN POLICE STATION AT OWAN COMMUNITY 2017
FIRST BOREHOLE PROJECT AT OWAN COMMUNITY 2017
PROVISION OF SCHOOL CHAIRS AND DESKS
(40NOS)
2016
8 ODIGUETUE TOWN HALL PROJECT AT ODIGUETUE
COMMUNITY
2016
MARKET STALLS AT ODIGUETUE COMMUNITY 2016
FIRST BOREHOLE PROJECT AT ODIGUETUE
COMMUNITY
2015
SECOND BOREHOLE PROJECT AT ODIGUETUE 2017
TOWN HALL COMPLETED BY OKOMU AT
ODIGUETUE
2016
RENOVATION OF ODIONWERE’S HOUSE 2017
MARKET STALL(5ROOMS) 2015
THIRD BOREHOLE PROJECT AT ODIGUETUE 2018
GRADING OF ROADS DURING DRY SEASON 2016-TILL
DATE
9 EKPAN TOWN HALL PROJECT AT EKPAN COMMUNITY 2017
MARKET STALLS (5ROOMS)AT EKPAN
COMMUNITY
2017
GRADING OF ROADS DURING DRY SEASON 2016-TILL
DATE
10 ORHUA BOREHOLE PROJECT AT ORHUA COMMUNITY 2018
GRADING OF ROADS DURING DRY SEASON 2016-TILL
DATE
11 EKIADOLOR FENCING OF POLICE STATION 2017
12 EHOR FENCING OF POLICE STATION 2017

Okomu Oil Palm Company Plc: 60TPH Palm Oil Mill Project at Extension Two February 2020
Environmental Impact Assessment (EIA) – Final Report Page 187
4.10 Consultation with and Participation By Stakeholders
4.10.1 Introduction
In the EIA process, consultation with and participation by stakeholders is a very important
activity. EIA is not EIA without consultation and participation by stakeholders. It is a
continuous activity in the EIA process, taking place in early stages prior to the decision on
the action to be taken on the project. The decision may be made by the proponent (e.g.
choices between various alternatives), jointly by the proponent and the decision-making
and environmental regulators (screening and scooping decisions) and the public on whether
or not to allow the project or proposal proceed (Wood, 1996).
The stakeholders include the adjoining communities to the proposed project location,
environmental regulatory agencies, governmental ministries and parastatals, local
governments, non-governmental organizations (NGOs) and persons having interest and
concerns on the conservation of the areas where development will take place (Figure 4.5).
Figure 4.5: Stakeholders’ Interrelationship in the Activities for an EIA Study
Industry
E.g. Okomu OPC Plc and
its environmental
consultants
Government
• Federal
• State
• Local
government
• Government
agencies
Public
• Host
Communities
• NGOs
• Interested groups

Okomu Oil Palm Company Plc: 60TPH Palm Oil Mill Project at Extension Two February 2020
Environmental Impact Assessment (EIA) – Final Report Page 188
4.10.2 Objectives
The specific objectives of the consultation and participation process are to:
• Inform and educate stakeholders about the project
• Obtain stakeholders view on the project as it may affect the existing conditions of
the environment of the area
• Assist in scoping of activities to be included in the study
• Resolve conflicts relating to the project
• Identify problems, concerns and needs of adjoining communities
• Establish a coordinal link between the proponent (Okomu Oil Palm Co Plc) and the
affected communities
4.10.3 Consultations with Stakeholders
4.10.3.1 Institutional
Federal Ministry of Environment, FMEnv
The Federal Ministry of Environment, FMEnv, at Abuja was consulted in
screening process or initial environmental examination (IEE) in order to
categorize the project. Also an application for an EIA study by the Company, the
Terms of Reference and Scope of the study to be carried out, were submitted 04
December 2017 to the FMEnv for vetting and approval. The FMEnv carried out a
site verification visit in January 2018 and subsequently approved the TOR for the
EIA study. Regular contacts were made with the FMEnv at Abuja and sometimes
with the Edo state Zonal office in Benin City.
In similar vein contacts and consultations were made with the following
government agencies:
a. Ministry of Environment and Sustainability, Benin City.
b. Ministry of Agriculture and Natural Resources, Benin City
c. Ovia Northeast Local Government Area of Edo State, Nigeria
4.10.3.2 Communities
OOPC Plc used its FPIC process and mechanism to hold meetings with the ten affected
communities. The community engagement meetings presented the opportunity for the EIA
consultants to present and explain the proposed project to the understanding of the
communities. The outcome of the engagement meetings is what has culminated to
Notarized FPIC Agreements signed by a representative from each community and the
Company. The FPIC report is attached in Appendix II.

Okomu Oil Palm Company Plc: 60TPH Palm Oil Mill Project at Extension Two February 2020
Environmental Impact Assessment (EIA) – Final Report Page 189
4.10.4 Levels of Community Representatives and Organizations Consulted
4.10.4.1 Affected Communities
In all the communities, meetings and consultations were held with
representatives including individuals, community heads and leaders. Others
included community development associations and community based
organizations. The meetings and consultations usually held at either their town
hall or at the quarters of the community heads and the communities had
representations including the youth association members. The schedule of the
meetings is shown below, while photo illustrations are provided in Plate 4.23.
Communities Attendance Reference Contact
Agbanikaka 27 Ikpefuran Sunday - 08038157678
Owan 28 Elder Clement Ugboiyobo
Uhiere 35 Francis Obanor - 08182731748
Odiguetue 36 John Ehigia - 08182401090
Odighi 27 Flamingo Dajide - 08077220988
Oke- Irhue 53 Ohiengbe Sylvester - 08134266005
Ihrue 15 Samuel Alohan - 08031259221
Umuokpe 15 Community Secretary - 08086792306
Epkan 13 Matthew Omoniyi - 07031259895
Orhua 10 O.C. District Forest Chairman - 08066318167

Okomu Oil Palm Company Plc: 60TPH Palm Oil Mill Project at Extension Two February 2020
Environmental Impact Assessment (EIA) – Final Report Page 190
Agbanikaka Community with Study Team
Uhiere Community with Study Team
Irhue Community with Study Team
Odighi Community Leaders with OOPC
Management Team
Odiguetue Community with OOPC Management
Team
A & Hatman Workers with OOPC Management
Team
Plate 4.23: Photos of Community Meetings

Okomu Oil Palm Company Plc: 60TPH Palm Oil Mill Project at Extension Two February 2020
Environmental Impact Assessment (EIA) – Final Report Page 191
CHAPTER FIVE
ASSOCIATED AND POTENTIAL ENVIRONMENTAL IMPACT
5.1 Introduction
The primary intention of this Environmental Impact Assessment (EIA) is to identify
the associated and potential impacts of the proposed project and to develop options
for mitigating the negative impacts that have been so identified.
The primary objectives of the impact assessment process are to:
• Establish the significance of identified potential impacts that may occur as a
result of a project activity being undertaken.
• Differentiate between those impacts that are insignificant (i.e. can be sustained
by natural systems) and those that are significant (i.e. cannot be sustained by
natural systems).
Unacceptable negative impacts will require additional mitigation measures to
complement those incorporated in the project design. Potential cumulative
impacts are also considered. The significance of an impact is determined by:
o Determining the environmental consequence of the activity;
o Determining the likelihood of occurrence of the activity and
o Subsequently calculating the product of these two parameters.
This chapter basically identified the potential environmental impacts by considering
the anticipated effects of the proposed project on the existing physical, chemical,
biological conditions of the environment.
At an earlier stage in this study, an environmental screening and scoping exercise was
carried out, the process employed was a combination of desk study, site visitation,
and consultations with stakeholders. From this, an overview of the potential impacts,
the choice of the appropriate field analysis and likely mitigation measures and the
monitoring programme were examined.
This chapter presents an overview of the impact assessment methodology as well as
results of impact screening followed by detailed qualitative and quantitative impact
assessments. Their inclusion does not mean they would necessarily occur or cannot
be successfully mitigated.
The boundaries (temporal and spatial) of this EIA study were determined through the
scoping process involving consultations with stakeholders, social, economic and

Okomu Oil Palm Company Plc: 60TPH Palm Oil Mill Project at Extension Two February 2020
Environmental Impact Assessment (EIA) – Final Report Page 192
health studies. The project activities that would impact on the environment were
identified as:
• Pre-construction activities
• Construction
• Operation and maintenance
• Decommissioning
5.1.1 Social and Environmental Impacts
Social Impacts
The palm oil industry has had both positive and negative impacts on
workers, indigenous peoples and residents of palm oil-producing communities. Palm
oil production provides employment opportunities, and has been shown to
improve infrastructure, social services and reduce poverty. However, in some cases,
oil palm plantations have developed lands without consultation or compensation of
the indigenous people occupying the land, resulting in social conflict. The use
of illegal immigrants in Malaysia has also raised concerns about working conditions
within the palm oil industry.
Some social initiatives use palm oil cultivation as part of poverty alleviation
strategies. Examples include the UN Food and Agriculture Organization’s hybrid oil
palm project in Western Kenya, which improves incomes and diets of local
populations, and Malaysia's Federal Land Development Authority and Federal Land
Consolidation and Rehabilitation Authority, which both support rural development.
The use of palm oil in the production of biodiesel has led to concerns that the need
for fuel is being placed ahead of the need for food, leading to malnourishment in
developing nations. This is known as the food versus fuel debate. According to a 2008
report published in the Renewable and Sustainable Energy Reviews, palm oil was
determined to be a sustainable source of both food and biofuel. The production of
palm oil biodiesel does not pose a threat to edible palm oil supplies. According to a
2009 study published in the Environmental Science and Policy journal, palm oil
biodiesel might increase the demand for palm oil in the future, resulting in the
expansion of palm oil production, and therefore an increased supply of food.

Okomu Oil Palm Company Plc: 60TPH Palm Oil Mill Project at Extension Two February 2020
Environmental Impact Assessment (EIA) – Final Report Page 193
Environmental Impacts
Oil palm cultivation has been criticized for impacts on the natural
environment, including deforestation, loss of natural habitats, which has
threatened critically endangered species such as the orangutan and Sumatran
tiger, and increased greenhouse gas emissions. Many oil palm plantations are built on
top of existing peat bogs, and clearing the land for palm oil cultivation may contribute
to greenhouse gas emissions.
Efforts to portray palm oil cultivation as sustainable have been made by organizations
including the Roundtable on Sustainable Palm Oil, an industry group, and the
Malaysian government, which has committed to preserve 50 percent of its total land
area as forest. According to research conducted by the Tropical Peat Research
Laboratory, a group studying palm oil cultivation in support of the industry, oil palms
plantations act as carbon sinks, converting carbon dioxide into oxygen and, according
to Malaysia's Second National Communication to the United Nations Framework
Convention on Climate Change, the plantations contribute to Malaysia's status as a
net carbon sink.
Environmental groups such as Greenpeace and Friends of the Earth oppose the use of
palm oil biofuels, claiming that the deforestation caused by oil palm plantations is
more damaging for the climate than the benefits gained by switching to biofuel and
utilizing the palms as carbon sinks.
5.2. Methodology of impact assessment
5.2.1 Overall methodology
The overall methodology comprises five steps as follows:
Step 1
• Identification and description of project phase.
• Associated activities and their possible interactions with environmental, social
and health components.
Step 2
Preliminary identification of potential impacts on environmental, social and health
components
Step 3
• Screening for impact significance
• Elimination of activity of environmental interactions producing no effect;
• Selection of focus impacts for further assessments

Okomu Oil Palm Company Plc: 60TPH Palm Oil Mill Project at Extension Two February 2020
Environmental Impact Assessment (EIA) – Final Report Page 194
Step 4
Detailed assessment of selected focus impacts in terms of:
• Nature- positive or negative, direct or indirect
• Magnitude-qualitative and quantitative
• Areal extent-qualitative and quantitative
• Frequency
• Receptor sensitivity
• Duration including reversibility
• Cumulative effects
Step 5
• Final assessment and assignment of overall impact significance levels based
on step 4 results and application of objective impact severity criteria and
likelihood;
• Identification of impacts requiring mitigation.
The analysis of impacts covers the aspects of the project activities described in
Chapter Three.
For each activity, potentially affected environmental media are identified and the
nature of the effects are qualified and quantified.
5.2.2 Preliminary Identification and Screening
In accordance with recommended impact assessment approaches (FMEHUD, 1995;
UNEP, 1996; Canter, 1996; Lohani et al 1997) the first level of impact assessment
involves the preliminary identification and screening of potential environmental
impacts by anticipating activity – environment interactions. This requires a thorough
understanding of the project activities (project description), the project setting (the
environmental description), and the interaction with environmental components. A
modified Leopold matrix (Leopold, 1971) was used for the identification and
screening. The matrix shows project activities against environmental (biophysical,
social and health) components, and supports a methodical, comprehensive, and
objective identification of the impacts each project activity may have on each
biophysical, social, and health component.
Impact identification is based on Wathern (1988), who defines an impact as “having
both spatial and temporal components and can be described as the change in an
environmental parameter over a specified period within a defined area, resulting from
a particular activity compared with the situation which would have occurred had the
activity not been initiated”.

Okomu Oil Palm Company Plc: 60TPH Palm Oil Mill Project at Extension Two February 2020
Environmental Impact Assessment (EIA) – Final Report Page 195
To further guide the identification and screening of impacts using the matrix,
established environmental impact indicators or indices are developed for each of the
environmental interaction categories. Impact indicators are the observable or
measurable parameters of each environmental component that can be directly or
indirectly linked to changes in environmental conditions.
The integrated impact assessment is conducted with consideration of environmental,
social and health elements, some procedures specific to each element were used in the
process as relevant to the study.
5.3 Checklist of Environmental Indicators
(a) Biophysical (Natural and Physical)
The major indicators are:
• Climate and meteorology
• Air quality
• Noise travel
• Ground water
• Surface River
• Geology and geomorphology
• Soil
• Drainage pattern/flooding
• Unique physical features/aesthetics
• Terrestrial fauna and wildlife
• Fisheries
(b) Socio-Economic
• Community population and ethnicity
• Employment and income
• Culture and religion
• Infrastructure provision
• Health
• Education
• Traditional administration
• Community
Each of the environmental indicators above was also evaluated to ascertain the present
situation and extent of damage and/or degradation as presented in Chapter Four.

Okomu Oil Palm Company Plc: 60TPH Palm Oil Mill Project at Extension Two February 2020
Environmental Impact Assessment (EIA) – Final Report Page 196
5.4 Project and Associated Activities of the Proposed Project at Extension Two
The major activities at the proposed mill expansion site will be:
a. Pre-construction stage
• Contract Award
• Mobilization
b. Construction Stage - The activities include:
• Heavy machinery use during foundation construction
• Installation of equipment
• Generator use
• Civil, Electrical and Mechanical works
• Solid waste generation and disposal
c. Operation Phase
• Transportation of FFB to the mill
• Palm oil processing/production
• Noise and gaseous emission
• Solid waste generation and disposal
• Palm Oil Mill Effluent generation and disposal
d. Decommissioning and Abandonment
• Laying off workers
• Abandonment of equipment and vehicles
• Solid and Liquid waste generation and disposal
5.5 Screening Project – Environmental Interactions Criteria
The criteria used in categorizing the various impacts are shown in Table 5.1.
Table 5.1: Impact Type
Type Positive/Beneficial or Negative/Adverse
Severity Minor/very low/insignificant, moderate, high/major/very significant
Prevalence Likely extent of the impact
Duration Long term (>12 months), short term (<12 months or intermittent)
Importance Economic, social and cultural values attached to the undisturbed project
Severity is classified as shown in Table 5.2 below.

Okomu Oil Palm Company Plc: 60TPH Palm Oil Mill Project at Extension Two February 2020
Environmental Impact Assessment (EIA) – Final Report Page 197
Table 5.2: Criteria for Rating Magnitude, Duration and Severity of Environmental Impacts
Severity of Impact Description/Quantification
1. Impact on Sensitive Habitats e.g. wetlands; forest reserve
Very High, 5 points Very severe long term adverse effects; more than 20% of the habitat area
will be destroyed or damaged.
High, 4 points Major long term adverse effects: 1 – 2% of the habitat area will be
destroyed or damaged
Moderate, 3 points Moderate adverse effects: 0.25 – 1% of the habitat area will be destroyed
or damaged
Low, 2 points Minor adverse effects: 0.02 – 0.025% of the habitat area will be destroyed
or damaged
Very Low, 1 point Negligible to minor adverse effects: 0.02% of the habitat area will be
destroyed or damaged
2. Impacts on Water Quality (Rivers and Streams)
Very High Water quality parameters change significantly by several orders of
magnitude: toxic trace metals or hydrocarbons exceed FMEnv’s safe
levels; changes persist for months or longer.
High Water quality parameters change significantly by one or two orders of
magnitude: toxic trace metals or hydrocarbons exceed FMEnv’s safe
levels; changes persist for months or longer.
Moderate Statistically significant changes in water quality parameters which persists
for several weeks.
Low Some measures of water quality deviate significantly from ambient
measures but are quickly (within 1-2 days) restored to normal.
Very Low Normal measures of water quality such as dissolved oxygen content,
salinity, temperature, trace metal concentrations and hydrocarbon levels
show no statistically significant changes from ambient conditions.
3. Impacts on Air Quality and Noise
Very High Significant increase in levels of criteria pollutants. Significant effects on
public health and welfare are expected.
High Increase in levels of criteria pollutants likely to pose hazards to public
health and welfare.
Moderate Increase in levels of criteria pollutants moderate and unlikely to pose
hazards to public health and welfare.
Low Increase in levels of criteria pollutants unlikely to pose hazards to public
health and welfare.
Very Low Increase in levels of criteria pollutants does not pose hazards to public
health and welfare.
4. Impacts on Cultural/Archaeological Resources
Very high An interaction between a cultural resource/archaeological site and an
impact producing factor occurs and results in the loss of unique
cultural/archaeological information.

Okomu Oil Palm Company Plc: 60TPH Palm Oil Mill Project at Extension Two February 2020
Environmental Impact Assessment (EIA) – Final Report Page 198
Moderate The interaction occurs and results in the loss of cultural/archaeological
data that are not significant.
Low The results are temporary and reversible.
Very Low Little damaging interaction between an impact producing factor and
cultural resource/archaeological site occurs.
5. Impacts on Local Employment, Income, and Population
Very High 10% or greater annual growth in employment, payroll, population.
High 7-9% annual growth in employment, payroll, population.
Moderate 4-6% annual growth in employment, payroll, population.
Low 2-3% annual growth in employment, payroll, population.
Very Low 1% or less annual growth in employment, payroll, population.
6. Impacts on Community Infrastructure
Very High Potentially major long-term effects on community services and facilities
indicated by a 10% or more increase in the infrastructure.
High The effect is indicated by a 3-9.9% increase/decrease
Moderate The effect is indicated by a 1.5-2.9% increase/decrease
Low Minor effects on community services and facilities: indicated by a 0.5-
1.4% increase/decrease
Very Low Negligible to minor effects on community services and facilities:
indicated by a less than 0.5% increase/decrease,
7. Impacts on Wildlife/Forestry
Very High A specie, population, community or assemblage of wildlife will be
harmed, as a result of habitat area destroyed or disturbed, to the extent that
recovery of that particular entity may not occur.
High A significant interference with ecological relationships. This usually
involves the mortality or alteration of a noticeable segment of the
population, community or assemblage.
Moderate A short-term interference with ecological relationships. Although some
species may sustain substantial losses, other species will sustain low
losses, and the ecological mix will not be altered.
Low A few species may sustain low losses, but any interference with
ecological relationships will not be evident.
Very Low Loss of a few individuals but no interference with ecological
relationships.

Okomu Oil Palm Company Plc: 60TPH Palm Oil Mill Project at Extension Two February 2020
Environmental Impact Assessment (EIA) – Final Report Page 199
5.6 Leopold Matrix Screening
The modified Leopold impact matrix consists of a horizontal list of biophysical, social
and health environmental components that could be affected by the proposed project
activities versus a vertical list of project activities, which represent environmental
aspects, or “sources of impact”, associated with each project phase. Environmental
aspects are elements of an activity that can or will interact with the biophysical, social
and health conditions within the area of influence.
Entries in the matrix cells represent the nature and preliminary ranking of the severity
of the impact. Ranking of the severity is based on the following scale and symbols:
• Major: 2
• Minor: 1
• Negligible or no effect: - (a dash)
• Positive: +
Table 5.3 gives the criteria for rating an impact and the scores awarded to each
criterion/severity category and Table 5.4 gives the matrix obtained.
Table 5.3: Scores Awarded to Magnitude, Duration and each Severity Category
EFFECTS SCORES
A major long term effect (Very high)
A major short term effect (High)
A moderate long term effect (Moderate)
A moderate short term effect (Low)
A minor effect in magnitude and duration (Very Low)
No impact/interaction
Positive impact
Negative impact
points (in a square)
4 points
3 points
2 points
1 point (in a square)
0 point/Blank square
+ added in front of a number
- added in front of a number
For this preliminary impact assessment stage, the impacts are defined as follows:
A Major impact is one that would affect a large (higher than 40%) amount of a
resource/receptor and or have a relatively large footprint and persist for a long time
or is irreversible;
A Minor impact is one that could either affect a large (as defined above) or moderate
(less than 40%) amount of an affected resource/receptor, has a mid to long term effect (1
to 10 years) but is most likely reversible.

Okomu Oil Palm Company Plc: 60TPH Palm Oil Mill Project at Extension Two February 2020
Environmental Impact Assessment (EIA) – Final Report Page 200
A Negligible impact is one that may occur but based on experience, available scientific
information and expert knowledge will have no measurable effect on the environmental
component;
A Positive impact is one that adds a measurable benefit to the immediate and larger
project environment including its social, cultural and health dimensions.
All number entries denote negative impacts. Cells with both positive sign (+) and
numbers indicate that the specific activity and environmental interaction will potentially
result in both positive and negative impact. All potential impacts, whether likely or
unlikely are also considered at this stage. The likelihood of an impact is further assessed
in the detailed impact evaluation. The identification of and screening of an impact relies
on the following:
• Available knowledge of product activity
• Documented impacts of similar projects in similar environment
• Consultation with experts
• Professional judgment
• Result of earlier environmental studies carried out in the Lagos lagoon area.
Spatial boundaries of interaction were decided based on specialist knowledge and
documented experience of the specific activity on environmental interaction.
5.7 Detailed Assessment of Impact
The preliminary identification and screening of environmental impact resulted in a group
of focus impacts (impacts ranked 1 and 2) which were further assessed in terms of
severity and significance. Impact severity and significance criteria used at this next stage
relied on a number of resources and tools including the following:
• FMEnv Environmental Assessment guidelines;
• Overlaying project component on maps of existing conditions to identify potential
impact areas and issues
• Environmental baseline studies
• Results of earlier studies carried out in the area; experience from similar projects
in Nigeria and elsewhere.
• Published and unpublished documents (such as the World Bank environmental
assessment source book; relevant IFC performance standards, and other
authoritative texts on performing environmental impact assessment) providing
guidance on performing impact analysis for industrial development activities;

Okomu Oil Palm Company Plc: 60TPH Palm Oil Mill Project at Extension Two February 2020
Environmental Impact Assessment (EIA) – Final Report Page 201
5.8 Impact Severity and Significance Evaluation
The overall methodology for assessing impacts of activities associated with the
proposed project involves establishing impact indicators, and evaluating the potential
effects of project activities on each project specific impact indicator. Impacts may be
positive (beneficial) or adverse (detrimental). Impact indicators are easily identifiable
environmental or socio-economic components that would readily indicate changes in
environmental or socio-economic conditions. For the purpose of this project, the
impact indicators selected are shown in Table 5.4.
In order to facilitate the process of impact assessment, a tabular checklist was
developed from information provided by the client, to highlight the major activities
and the key concerns in the project location.
5.9 Impact Severity Evaluation Criteria
To objectively review those issues warranting consideration as potential impacts
(previously identified as focus areas) and to determine the likely significance of those
impacts when compared to baseline conditions, certain significance criteria were
developed. This EIA uses the significance criteria to evaluate impacts, which enables
systematic identification and focus on those resources and receptors most likely to be
impacted by the proposed project. These significance criteria were applied to all
potential impacts initially identified during the screening process to determine whether
they would likely be Positive, Negligible, Minor, Moderate, or Major. Those issues
determined to be inconsequential or not applicable based on the significance criteria
were eliminated or “screened out” from further consideration. This impact severity
assessment takes into account three main areas of significance criteria: temporal
factors, areal extent, and magnitude of the impact. The components of each of these
primary criteria are described below, i.e., temporal factors include duration, frequency,
and reversibility. In addition to the three main significance criteria, supplementary
factors were considered as part of the overall impacts severity assessment, sensitivity
of the receptor, indirect or secondary influences, and Cumulative effects.
Eligible is used in some instances and a negligible rating should be considered in
deriving the overall impact severity. The term is omitted from the impact assessment
matrix table that follows this section, but the criteria are described in the preceding
text. The following describes the severity rating criteria.

Okomu Oil Palm Company Plc: 60TPH Palm Oil Mill Project at Extension Two February 2020
Environmental Impact Assessment (EIA) – Final Report Page 202
5.10 Magnitude
Magnitude is defined as the quantitative intensity of the impact, and can be measured as
the percentage of a resource or a population within the area of influence that may be
affected by an impact. The definitions of “high”, “medium”, and “low” with respect to
magnitude may vary depending upon the specific receptor. The magnitude of an impact
is characterized as follows:
• High – large amount of the resources or population is affected; easily observable
and measurable effect;
• Medium – moderate amount of the resource or population is affected; generally
measurable and observable effect;
• Low – small amount of the resource or population is affected; low magnitude
impact may be within the range of normal variation of background conditions:
• Negligible – amount of resource or population affected is unnoticeable or
immeasurably small.
Magnitude may also be defined with respect to quantitative or semi – quantitative criteria,
if available and applicable, (e.g., level of noise as decibels). The magnitude of an impact
is characterized as follows:
• High –greater than the quantitative or semi – quantitative criteria
• Medium – at the quantitative or semi – quantitative criteria
• Low – less than the quantitative or semi – quantitative criteria
• Negligible – impact not detected or at background levels.
5.11 Duration
Duration is defined as the time that is estimated for a population or resource to return to
pre – impact/baseline conditions. The duration is calculated from the time the impact
begins, which may coincide with the start of the activity that caused the impact.
The duration of an impact is characterized as follows:
• High – long –term impact (recovery would not occur within ten years)
• Medium – moderate –term impact (recovery time between one year and ten years)
• Low – short –term impact (recovery time within less than one year)
• Negligible – impact or recovery time is very short or immediate characterization
of the duration of an impact as low, medium, or high includes consideration of the
degree of reversibility of the impact. Impacts for which the duration is classified
as high, as defined above, are considered irreversible impacts

Okomu Oil Palm Company Plc: 60TPH Palm Oil Mill Project at Extension Two February 2020
Environmental Impact Assessment (EIA) – Final Report Page 203
5.12 Frequency
Frequency is defined as the number of times an impact is expected to occur over the life
of the project, the frequency of an impact is characterized as follows:
• High-impact will occur continuously throughout the life of the project (e.g,
continuous transportation of FFB to the mill)
• Medium-impact will occur intermittently over the life of the project (e.g,
operations and maintenance)
• Low-impact will occur rarely or a very limited number of times (e.g. construction
impacts – civil work during mill construction
There is no “negligible” category for frequency because impacts with no frequency would
not occur, and were screened out.
5.13 Extent
Areal Extent refers to the potential geographic range of an impact and quantified in units
of area affected (e.g. hectares). The areal extent is classified as follows:
High-impact has influence well beyond the project environment to the regional or even
global environment.
Medium-impact limited to the general vicinity of the project site/study area.
Low-impact limited to the immediate area of the activity of occurrence.
Negligible-impact limited to a very small part of the activity area.
5.14 Sensitivity
Sensitivity refers to economic, social, and/or environmental/ecological relevance of the
receptor, including the intrinsic sensitivity of the resource, reliance on the receptor by
people for sustenance, livelihood, cultural significance or economic activity, and to the
importance of direct impacts to persons associated with the resource.
The sensitivity criterion also refers to potential impacts to Environmentally Sensitive
Areas (ESAs) and impacts on species, with effects including loss of endangered species
introduction of invasive species, and similar environmental/ecological impacts. The
intrinsic sensitivities of a receptor species and actions that after then function of the
receptor are also considered. Sensitivity is characterized as follows:
High – receptor is of high economic, social, and/or environmental relevance and or has
an intrinsic sensitivity (including vulnerability and exposure) to the specific impact (e.g.
water resources).

Okomu Oil Palm Company Plc: 60TPH Palm Oil Mill Project at Extension Two February 2020
Environmental Impact Assessment (EIA) – Final Report Page 204
Medium- receptor is of moderate economic, social, and/or environmental relevance and
is not particularly vulnerable and/or exposed to the impact.
Negligible –receptor is not of economic, social and/or environmental relevance or is not
sensitive to impact.
5.15 Impact Significance
The following section describes the method by which the overall impact severity rating
and associated impact significance is derived.
Impact Severity Rating
To reach an overall impact severity rating for each impact assessed, the five impact
severity criteria above are aggregated using impact severity matrices. Aggregation is at
three levels.
First, magnitude and areal extent are combined to arrive at a rating for the Impact
Quantum while duration and frequency are aggregated to give the overall temporal effects.
Impact Quantum and Temporal Effects are then combined and their resulting aggregate
assessed in terms of sensitivity to arrive at the overall impact severity.
Impact Likelihood
To further assess the significance of the severity associated with each potential negative
impact identified in the previous section, a likelihood criterion is applied to each negative
impact. The likelihood criteria are used to determine whether negative impacts can be
prevented or mitigated or if they are unavoidable.
It should be noted that the likelihood criteria are applied to the likelihood of the impact
occurring and not of the activity occurring. Thus the overall severity rating (significance)
of a negative environmental impact is a function of its severity as earlier defined and the
likelihood of occurrence as defined in the table.
Overall Impact Significance
The overall impact significance is indicated by the position on the impact significance
matrix. Impacts with a high likelihood of occurrence and consequence have a high
significance rating. These high-significance impacts become high priority for further
evaluation or management action (e.g. design, change or mitigation). Impacts that are
moderate are of medium priority; there are also activities with low impacts. Other impacts
are positive or beneficial impacts. The criteria and severity matrix set forth in this section
are applicable to all the types of events and impacts identified.

Okomu Oil Palm Company Plc: 60TPH Palm Oil Mill Project at Extension Two February 2020
Environmental Impact Assessment (EIA) – Final Report Page 205
Table 5.4: Matrix for Identification of Significant Activity Impacts of the Proposed Project on the Environment at
Extension Two Estate
ENVIRONMENTAL
COMPONENTS
Project Activity Phases
Pre-
Construction
Construction Operation
and Maintenance
Decommission
and Abandonment
Co
ntr
act
s A
wa
rd
Mo
bil
isa
tio
n
Hea
vy
Ma
chin
ery
Use
Gen
era
tor
Use
Civ
il,
Ele
ctri
c a
nd
Mec
ha
nic
al
wo
rks
So
lid
Wa
ste
Dis
po
sal
Tru
cks
Ca
rry
ing
FF
B
Gen
era
tors
an
d M
ach
ine:
No
ise
an
d G
ase
ou
s E
mis
sio
n
Pa
lm O
il M
ill
Eff
luen
t
(PO
ME
) D
isp
osa
l
So
lis
Wa
ste
Dis
po
sal
Met
ha
ne
Em
issi
on
La
yin
g o
ff S
taff
Mil
l A
ba
nd
on
men
t
Eq
uip
men
t a
nd
Ch
emic
als
Ab
an
do
nm
ent
Air Quality -2 -2 -2 -3 -3 -5
Noise level -2 -2 -2 -2 -3
Vegetation -2 -2 -3
Terrestrial Inverts -2 -2 -3
Wildlife -2 -3
Groundwater -2 -3
Surface River -2 -2 -4 -2 -1
Soil/Land Pollution -1 -2 -2 -2 -4 -2
Drainage
Demography -1
Employment/Income +3 +3 +3 +2
Culture/Religion -3
Occupational Health/Accidents -3 -3 -1 -2 -2 -2 -3 -3 -2 -2 -2
Infrastructure
Community Relations +3 -3 -2
Economic loss -3 -3 -2
Corporate Image -2 -2 -3 -2 -3
KEY: + Positive impact No impact = Blank Square
- Negative impact Minor effect, (very low) = 1 point in square
Moderate short term effect (Low) = 2 points
Moderate long term effect (Moderate) = 3 points
Major short term effect (High) = 4 points
Major long term effect (Very high) = 5 points

Okomu Oil Palm Company Plc: 60TPH Palm Oil Mill Project at Extension Two February 2020
Environmental Impact Assessment (EIA) – Final Report Page 206
5.16 Description of Impacts
5.16.1 Significant Impacts
The proposed project by OOPC Plc offers a number of potential beneficial impacts to the
people of the project site and area beyond. These effects shall be enhanced throughout
the duration of the project. Improved and more secured palm oil mill would benefit a
broad range of individuals and businesses throughout Nigeria. The project will
substantially improve agricultural development by improving palm oil production that
will continuously provide job opportunities for teeming youths in Nigeria.
In addition, the project will contribute to achieving some of the objectives of the Federal
Ministries of Agriculture & Rural Development and Trade &Investment, which include
securing the social and economic benefits of an efficient Agricultural and Investment
sector; considerably increasing Palm oil production to meet its annual requirement in the
country.
More importantly, the proposed project is the company’s contribution and support aimed
at meeting the goals of the Economic Recovery and Growth Plan (ERGP) of the Federal
Republic of Nigeria.
Moreover, the proposed project will provide employment opportunities for qualified
Nigerians (skilled, semi –skilled and unskilled) from the immediate project area and
beyond. The employment opportunity will lead to acquisition of new skills and
introduction of all manners of income generating spill over effects.
Other potential benefits of the project include:
• Increase the life span of the oil palm plantation
• Add values to the FFB produced on the plantation
• Increase in the revenue base of the company
• Provide direct employment
• Create additional jobs
• Contribute to the socio-economic development of the neighbouring communities
• Increase the revenue base of both Edo State Government and Federal Government
of Nigeria

Okomu Oil Palm Company Plc: 60TPH Palm Oil Mill Project at Extension Two February 2020
Environmental Impact Assessment (EIA) – Final Report Page 207
5.16.2 Significant Negative Impacts
In this section, only activity-receptor relationships resulting in impact significance above
‘low’ are presented and discussed to understand how additional mitigation measures
beyond those incorporated in the project design could help bring down the residual
impacts to ‘low’ in the least. In the analysis, the environmental receptors are considered
singly or collectively along with the corresponding project activities.
5.16.2.1 Evaluation of Potential Impacts of Project Activities
5.16.2.1.1 Adverse Impact of Loss of vegetation
There will be complete loss of vegetation in the main land area that is going to
contain the discharged POME especially mature oil palm. Considering the large
volume of POME that is going to be discharged especially during optimal capacity
production level of the palm oil mill, large land area would be lost to POME
treatment ponds.
5.16.2.1.2 Palm Oil Mill Effluent (POME) disposal
The discharge of the raw and untreated POME to the open land area although
undesirable, has beneficial impact on the adjoining soils as follows.
Soil Nutrient Enrichment: The recent study has revealed that the levels of both
essential macro and micronutrient elements needed for plant growth and
development were increased following the open discharge of the POME in the
soil. Specifically, there were notable increases in the levels of exchangeable
cations of potassium and magnesium, and corresponding elevation in the values
of available phosphorus, organic carbon and total nitrogen content of the soils
containing POME. Also, the amount of iron, zinc, manganese and copper
increased in these soils. Proper and effective management of the soils could lead
to increase in crop yield and productivity.
Hydrocarbon and Oil/Grease Contaminants: The increase in the amount of
these contaminants in the soil could have adverse effect in the functionality and
productivity capacity of the soils. Relatively high levels of THC and Oil/Grease
in the soil receiving POME can reduce the microbial activity of the soil thereby
making potentially available nutrients unavailable for plant uptake.
Heavy Metals Enrichment: Enrichment of the POME soil with heavy metals
such as lead, cadmium, chromium, nickel and vanadium as determined in the
present study would have adverse effects or impacts on soil quality. This is
because, under favourable soil conditions of pH, texture and moisture regimes,

Okomu Oil Palm Company Plc: 60TPH Palm Oil Mill Project at Extension Two February 2020
Environmental Impact Assessment (EIA) – Final Report Page 208
these metals could be made available for plant uptake, especially when the soil is
used for the cultivation of vegetables and shallow rooting crops.
5.16.2.1.3 Harvesting and Transportation of Fresh Fruit Bunches
During harvesting, fronds are pruned. This helps to give easy access to the ripe
fruit bunches as well as keep the oil palm stem clean of hanging dead and
decaying leaves. The fronds are left on the ground to add organic matter to the
soil. The pruning of fronds, harvesting and collection of fruit bunches are
activities which provide employment for more workers.
5.16.2.1.4 Decommissioning and Abandonment
• Permanent and casual workers will be laid off resulting in loss of
employment and income. This can itself give rise to strained relations
between workers/community and the company.
• The palm oil mill will no longer be regularly and properly serviced and
maintained. There will be great economic loss to company, shareholders
and the nation. There will be no facility to process FFB harvested from the
plantation thereby making the fruits to get rotten.
• Equipment and Materials Abandonment, Abandoned trucks and other mill
machinery will blight the workshop and mill premises. This is also an
economic loss to the Company and its shareholders.
5.16.3 Significant Impact Producing Activities
Based on a score of 3 points and above as shown in Table 5.4 (Matrix for Identification
of Significant Activity Impacts of the Proposed Project) above, the significant impact
producing activities (IPAS) are as follow:
• Palm Oil Mill Effluent (POME) may contaminate and/or pollute groundwater
thereby causing health problem to the public.
• Laying off workers/Severance Payment
• Palm Oil Mill Abandonment
• Gaseous Emission
• Decommissioning and abandonment have three main activities, which will
produce adverse impacts as listed in section 5.16.2.1.4 above.

Okomu Oil Palm Company Plc: 60TPH Palm Oil Mill Project at Extension Two February 2020
Environmental Impact Assessment (EIA) – Final Report Page 209
5.16.4 Cumulative Impacts
Cumulative impacts are changes to the environment that are caused by an activity in
combination with other past, present and future human activities (GSI, 2003). The
concept of cumulative effects is an important one. It holds that, while impacts may be
small individually, the overall impact of all environmental changes affecting the receptors
taken together can be significant. When a resource is nearing its tolerance threshold, a
small change can push it over. The objective of the cumulative impact assessment is to
identify those environmental and/or socio-economic aspects that may not on their own
constitute a significant impact but when combined with impacts from past, present or
reasonably foreseeable future activities associated with this and/or other projects, result
in a larger and more significant impact[s].
5.16.4.1 Project Specific Cumulative Effects’ Assessment
This section evaluates the cumulative effects of the individual impacts evaluated
in the preceding sections.
5.16.4.1.1Land Based Traffic
It is envisioned that land based traffic will also increase as a result of the proposed
project. Land based traffic is expected to increase mainly during the operation
phase to allow the FFB collected in the field to be processed at the proposed mill.
Activities at the project site during construction will however be varied and limited
to the construction phase. The proposed project will result in a negligible impact
on traffic, circulation and parking at the project site and its vicinity. It would be
unlikely that the rate of motor vehicle accidents would increase due to the project.
No additional cumulative transportation impacts would result from the proposed
action. Therefore, it is anticipated that no long-term environmental impact will be
forthwith in considering the land-based traffic.
5.16.4.1.2 Public Services
There would be no impact to public services under the proposed project. The
project will not introduce any additional long-term population or employment into
the area, and thus, would not result in any additional demand for police or fire
services or the need for new or altered facilities. No damage to roadways is
expected beyond that which would be considered normal wear and tear. Therefore,
the proposed project would result in negligible impact on public utilities.

Okomu Oil Palm Company Plc: 60TPH Palm Oil Mill Project at Extension Two February 2020
Environmental Impact Assessment (EIA) – Final Report Page 210
5.16.4.1.3 Employment Opportunities
There will be some beneficial impacts that are cumulative that are in the
employment sector. During the operational phase of the proposed project, the
company will employ workers – all Nigerian. Positive cumulative social benefits
include gainful employment and tax being paid to government coffers.
5.16.4.1.4 Abandonment/Laying off staff
There will be serious negative impacts that are cumulative that are also in the
employment sector. During the abandonment/decommissioning phase of the
project, the company will lay off workers. Negative cumulative social impacts
include loss of employment and thereby adding to the unemployment status of the
region in particular and the nation in general.
5.17 Health Impact Assessment (HIA) of the Proposed Project
The health impact assessment of the proposed project is a rapid appraisal of the likely
health impacts the project might have on the totality of the environment. The assessment
will consist simply of a summary table and a conclusion. The summary table shall list the
intermediate factors and their likely impacts with minimal qualification.
5.17.1 Identifying Intermediate Factors that Impact on Health
Many proposals that are not intended to affect health directly have indirect effects on
health and well-being; often these indirect effects have not been recognized. Proposals
may affect things such as employment, income, air quality or housing which in turn affect
health. These factors which are not health indicators but do influence health are referred
to as intermediate factors. (They may also be called determinants of health).
Some of the identified intermediate factors of the proposed project are:
• Air Quality
• Water Quality and Hydrology
• Noise and Vibration
• Health and Safety
• Traffic and transport
• Waste Management
• Workers’ Welfare
• Social cohesion
• Corporate Image

Okomu Oil Palm Company Plc: 60TPH Palm Oil Mill Project at Extension Two February 2020
Environmental Impact Assessment (EIA) – Final Report Page 211
Table 5.5: Summary of Health Impacts of the Proposed Project
Intermediate Factor
Affected Group
Health Impact
Action to be Taken
Air quality
Dust and gaseous emissions from land
preparation and palm oil mill and
vehicular emission leading to high
suspended particulates in the
atmosphere.
All
- Allergy
- Eye irritation Nose irritation
- Respiratory Tract Infections
The Company will ensure the following:
- Low-emission/high efficiency engines shall be
used.
- Regular maintenance of vehicles to ensure
optimal performance.
- Movement of men and materials shall be
properly coordinated to optimize vehicle use
and resultant emissions.
- Dust and particulate barriers shall be used
during operation.
- Avoid burning in the oil mill (i.e. zero
burning).
Noise and vibration
Noise emissions generated by heavy
duty vehicles and palm oil mill
All
- Hearing impairment,
hypertension, annoyance,
sleep disturbance of site
workers.
- Hand-Arm Vibration
Syndrome (HAVS)
The Company will ensure the following:
- Noise attenuation measures such as
installation of acoustic mufflers on large
engines and equipment;
- Hearing protection shall be provided and
usage enforced for workers on site.
Water Quality and Hydrology
Increased receiving water body
turbidity from runoff.
Improper storage and handling of,
hydrocarbons, fuel and other chemicals
would inevitably result in spillage
during construction activities.
All
- Illnesses including
Typhoid, Cholera,
Dysentery, Polio, Hepatitis
The Company will ensure the following:
- Stack demolition materials properly to reduce
turbidity effect on surface runoffs;
The Company will ensure the following:
- Put in place adequate contingency measures to
curtail accidental spills and ensure spill
containment equipment shall be available at
the construction site
- In order to reduce ground contamination, an
impervious sump or container shall be placed

Okomu Oil Palm Company Plc: 60TPH Palm Oil Mill Project at Extension Two February 2020
Environmental Impact Assessment (EIA) – Final Report Page 212
under the spigots of fuel drums to collect
drippings.
- Re-fuelling and maintenance of heavy
construction vehicles at the site, shall be done
at specified areas or makeshift “depots” where
measures are in place to deal with spillages
and temporary storage of oily waste.
Preferably these depots shall be located in an
area that would ultimately be permanently
paved (e.g. parking lots) thereby covering any
contaminated soil.
- A thick layer of sawdust or absorbent would
be used to absorb any spillages. Subsequently,
this layer shall be removed for proper
disposal. In the event of a large spill, the latter
will be cleaned up immediately by excavating
the contaminated soil and removing it in a
secure vehicle to an approved disposal site.
Solid Waste
- Solid waste constituting
aesthetic nuisance
- Sewage nuisance
All
- Improper solid waste handling
can lead to the following:
- - Creating conditions
favourable to the survival and
growth of microbial pathogens
- - Causing infectious and
chronic diseases especially the
waste workers.
The Company shall ensure the following:
- Waste is contained and removed regularly
through its own waste management system
already in place.
Hostility
Industrial disputes
Workers and
communities
- Youth restiveness
- Persistence conflicts
between community and
company
- Hostages
The Company shall ensure the following:
- Grievance and conflict resolution mechanism
is instituted.
- Employ as much local labour as possible.
- Adequate stakeholders forum and information
shall be given to stakeholders.
- Adequate compensation shall be paid to

Okomu Oil Palm Company Plc: 60TPH Palm Oil Mill Project at Extension Two February 2020
Environmental Impact Assessment (EIA) – Final Report Page 213
permanent workers in case of any
eventualities.
Health and Safety
- Accidents, Vehicular, slips, falls,
trips etc
- Hearing impairment due to exposure
to noise of heavy machineries
- Improper storage and handling of
hazardous materials (e.g. lubricants,
fuels, etc), are potential health hazards
workers
Carcinogenic/Toxic/Chemical
hazards: corrosive substances
- Poor chemical handling
- Asphyxiating atmosphere
- Road Traffic Accident
- Wrong use of PPE
- Inadequate PPE
- Inadequate equipment/surface guard
on equipment
- Low awareness
All
Health hazards that can arise from
poor health and safety include:
- Occupational health problems
such as terminal diseases and/or
prolonged ill health
- Permanent Loss Injury
- Temporary Loss Injury
-
The Company will ensure the following:
Wearing of ear protection.
- Safe storage areas shall be identified and
retaining structures constructed prior to the
arrival of material.
- Hazardous materials (e.g. fuels) shall be
properly stored in appropriate containers and
shall be safely locked away.
- Conspicuous warning signs (e.g. ‘No
Smoking’) shall be posted around hazardous
waste storage and handling facilities.
The Company will ensure the following:
- Guideline on safe handling of chemicals
(SHOC) and appropriate PPE are provided.
- Guideline on traffic control to ensure best
traffic safety practices on the road.
The Company shall ensure:
- Awareness training
- Sufficient PPE are provided
The Company will ensure:
- Equipment specifications are made available.
- Provision of adequate training to workers.
- Provision of warning signs to workers and
commuters.
Waste Management
- Wastes constitute aesthetic and
pollution issues for the project area
All
Health hazards associated with
poor waste management include:
- Skin and blood infections
The Company will ensure the following:
- A site waste management plan although
already in place shall be prepared prior to
project commencement. This shall include

Okomu Oil Palm Company Plc: 60TPH Palm Oil Mill Project at Extension Two February 2020
Environmental Impact Assessment (EIA) – Final Report Page 214
*Note: “All” in the Affected Group column means, “Totality of the Environment” including flora and fauna and humans.
- Accumulated waste could lead to
contamination of soil/groundwater and
breeding grounds for vectors and
rodents
resulting from direct
contact with waste.
- Different diseases such as
intestinal infections that
result from poor waste
management. Reduction in
aquatic food supply
- Disruption of food chain
designation of appropriate waste storage areas,
collection and removal schedule, identification
of approved disposal sites, and system for
supervision and monitoring.
- Preparation and implementation of the plan
shall be the responsibility of OOPC with the
system being monitored independently.
- Waste shall be properly contained to avoid
contamination of groundwater.
Sewage
- Faecal aesthetic issues for the
project area.
- Spillage of septic liquor
Workers
- Cholera
- Dysentery
- Infectious and chronic
diseases
The Company will ensure the following:
- Onsite toilets shall be made available for use.
Socio-economics
- Promiscuity
- Sexual harassment
- Youth Militancy
- Unemployment
- Grievances
All
- Sexually transmitted
diseases (STDs)
- HIV/AIDS
- Population explosion
The Company will ensure the following:
- Public enlightenment about potential health
risks (STDs).
- Facilitate education/enlightenment about the
project and its nature.
- Appropriate policies.
Workers’ Welfare
Especially when workers leave the
organization and/or layoff.
Workers
- Depression
- Hypertension
- Workers’ restiveness
The Company will ensure that:
- Workers receive their full benefits when
leaving the organization.
Corporate Image
The negative corporate image arising
from day-to-day activities of the
organization,
Company/All
- Annoyance
- Depression
The Company will always ensure that its day-to-day
activities and operations do not portend bad image
about the organization to the general public and
therefore operate according to the best industry
standards and practice.

Okomu Oil Palm Company Plc: 60TPH Palm Oil Mill Project at Extension Two February 2020
Environmental Impact Assessment (EIA) – Final Report Page 215
Table 5.6: Checklist for Health Impact Assessment of the Proposed Project
Environmental Component
Effect on Health
Good None Bad
Employment ✓
Income ✓
Workplace ✓
Housing ✓
Transport ✓
Built Environment ✓
Air Pollutants ✓
Water pollutants ✓
Noise ✓
Amenity ✓
Lifestyle ✓
Social Cohesion ✓
Parenting ✓
Education ✓
Use of health services ✓
Other cause of public
concern
✓
5.18 Conclusion
The main negative impacts are health and safety. However, mitigation measures will be put
in place for health and safety through the provision of adequate and appropriate PPE.
As a result of the above provisions and measures, the net health impact of the proposed
project is positive.

Okomu Oil Palm Company Plc: 60TPH Palm Oil Mill Project at Extension Two February 2020
Environmental Impact Assessment (EIA) – Final Report Page 216
CHAPTER SIX
MITIGATION MEASURES
6.1 Introduction
The rationale for impact quantification and significance has earlier been discussed in the
previous chapter. The results have indicated that various components would be impacted
positively or negatively. In order to preserve the present integrity of the environment, certain
steps have been recommended to mitigate or control the major negative impacts identified
in this study. The control/mitigation measures have been based on the baseline conditions
with regards to the biophysical environment, socio-economic and health status of the
supposed host communities. Also considered were the project activities and their envisaged
impacts and concerns of stakeholders during consultation meetings and socio-
economic/health status of the host communities. However, mitigation measures are defined
for the identified significant present impacts and associated and/or potential impacts based
on the following criteria:
• Prevention – design and management measures for ensuring that significant potential
impacts and risks do not occur.
• Reduction – operational and management measures for ensuring that the effects or
consequences of those significant associated and potential impacts that cannot be
prevented are reduced to a level as low as reasonably practical (ALARP).
• Control - Operational and management measures for ensuring that residual associated
impacts are reduced to a level as low as reasonably practical (ALARP).
• Corrective/Precaution – Operational and management measures for correcting the
identified impacts emanating from previous operations and also taking appropriate
precautions to preventing reoccurrence
Most of the significant environmental impacts that can likely arise from the construction and
operation of the proposed project can be mitigated once appropriate precautions are in place.
Table 6.1 below define the identified and potential environmental and social impacts, their
sources and the recommended mitigation measures.

Okomu Oil Palm Company Plc: 60TPH Palm Oil Mill Project at Extension Two February 2020
Environmental Impact Assessment (EIA) – Final Report Page 217
Table 6.1: Summary of Impact, Mitigation Measures and Residual Impacts
Activity
Phase
Environmental
Aspects
Type of Impact Mitigation measures Residual
Impacts
Pre
-Con
stru
ctio
n P
hase
Mobilization to
Site
- Risk of road accidents and
congestion
- Air pollution leading to global
warming and increase in
carbon footprint.
- Generation and spillage of
small amount of toxic or
hazardous materials
(lubricating oils, hydraulic
fluids and insulating fluids)
- safe driving under speed limitation
- Well maintained vehicles of appropriate
engine capacity will be used
- Necessary precautions to avoid leaks and
training on oil spill containment
procedures
None
Co
nst
ruct
ion
Ph
ase
Air quality and
Climate
Dust and gaseous emissions from
mill construction and vehicular
emission leading to high
suspended particulates in the
atmosphere.
- Low-emission/high efficiency engines
shall be used.
- Regular maintenance of vehicles to
ensure optimal performance
- Movement of men and materials shall be
properly coordinated to optimize vehicle
use and resultant emissions.
- Dust and particulate barriers shall be used
during operation.
- Avoid burning in the oil mill (i.e. zero
burning).
There would
be emitted
gaseous
substances in
the ambient
air
environment
Noise and
vibration
Noise emissions generated by
heavy duty vehicles and workers
activities and resultant hearing
impairment on site workers.
- Noise attenuation measures such as
installation of acoustic mufflers on large
engines and equipment;
- Hearing protection shall be provided and
usage enforced for workers on site to
reduce noise level below 85dB(A).
None

Okomu Oil Palm Company Plc: 60TPH Palm Oil Mill Project at Extension Two February 2020
Environmental Impact Assessment (EIA) – Final Report Page 218
Table 6.1 Cont’d: Summary of Impact, Mitigation Measures and Residual Impacts
Activity
Phase
Environmental
Aspects
Type of Impact Mitigation measures Residual
Impacts
Con
stru
ctio
n P
hase
Traffic, Access
and Transport
- Safety issues associated
with the movement of
abnormal loads on the
road network associated
with the Proposed
Development
- Increased intimidation of
pedestrians and cyclists.
- Construction vehicles to use
approved Site access routes only.
- Movement of abnormal loads to take
place outside of peak flow hours and
warning signs and traffic
management to control abnormal
load movements
Negligible
Landscape
Change in land use and
visual effect
Ornamental trees and flowers will be
planted which will minimize aesthetic
impacts of land clearing.
Minimal disturbance of
natural landscape and
visual appearance
Solid Waste
- Solid waste constituting
aesthetic nuisance
- Sewage nuisance
- Solid waste generated
(packaging, construction
and domestic waste)
- Waste is contained and removed
regularly through its own waste
management system already in place.
- All practical measures will be taken
to avoid, minimize and recycle
wastes.
Significant amount of
construction waste
will be reused onsite.
While domestic waste
generated will be
recycled
Job Creation
Creation of employment
- -
Water
Resources and
Hydrology
Increased receiving water body
turbidity from runoff from the
palm oil mill.
-
None

Okomu Oil Palm Company Plc: 60TPH Palm Oil Mill Project at Extension Two February 2020
Environmental Impact Assessment (EIA) – Final Report Page 219
Table 6.1 Cont’d: Summary of Impact, Mitigation Measures and Residual Impacts
Activity
Phase
Environmental
Aspects
Type of Impact Mitigation measures Residual
Impacts
Op
erati
on
Ph
ase
Traffic, Access
and Transport Increased intimidation of
pedestrians and cyclists. A
Traffic Management Plan is
proposed.
Standard traffic management measures will
be implemented during operational phase,
particularly for the use of cranes, and will be
set out in the Traffic Management Plan.
Negligible
Air quality and
Climate
- Stack emission
- Fugitive emissions from tanks
used to store petroleum and
other hydrocarbon products.
- Combustion emissions from
exhausts of machines e.g.
pumps power generating sets
- Air pollution from transport
during the decommissioning
phase.
- All flanges and vents shall be properly
tightened to reduce fugitive emissions.
- All systems shall be properly checked to
ensure there are no leakages or losses.
- All machinery and vehicles for the project
shall have high efficiency burner to reduce
emission of noxious gases.
- Well maintained vehicles will be used to
reduce air pollution
There would
be present of
emitted
gaseous
substances in
the ambient
air
environment
-
Solid waste and
sewage and
POME
- Waste runoff flowing into
the surface waters.
- Solid waste constituting
aesthetic nuisance.
- Sewage nuisance.
- GHG emission
- Weeds and long grass
- Blue-green algae
- Waste is contained and removed regularly
through its own waste management system
already in place.
- Efficient POME treatment system.
- Pond banks would be mowed and weeded
regularly.
None
Green House
Gas (GHG)
Emission

Okomu Oil Palm Company Plc: 60TPH Palm Oil Mill Project at Extension Two February 2020
Environmental Impact Assessment (EIA) – Final Report Page 220
Table 6.1 Cont’d: Summary of Impact, Mitigation Measures and Residual Impacts
Activity
Phase
Environmental
Aspects
Type of Impact Mitigation measures Residual
Impacts
Op
erati
on
Ph
ase
Solid waste,
Sewage and
POME
- Algae blooms
- Odors
- Sludge accumulation
- Unlike green algae, this algae is stringy
and can clump, block sunlight, and cause
short-circuiting. It can dominate the ponds
when conditions are poor, when pH is low,
or when protozoa eat all of the green algae.
Blue-green algae can be physically
removed like duckweed.
- After periods of cloudy weather or abrupt
temperature changes, algae can multiply
quickly and then die-off. Matted algae on
the surface can block sunlight and cause
foul odors.
- There would be proper operation and
maintenance- to help prevent odors.
- Sludge in the bottom of POME treatment
ponds shall be removed as needed.
Insignificant
Inefficient
functioning of
the POME
treatment
ponds
Water
Resources and
Hydrology
Increased receiving water body
turbidity from runoff from the
proposed mill.
-
None

Okomu Oil Palm Company Plc: 60TPH Palm Oil Mill Project at Extension Two February 2020
Environmental Impact Assessment (EIA) – Final Report Page 221
Table 6.1 Cont’d: Summary of Impact, Mitigation Measures and Residual Impacts
Activity
Phase
Environmental
Aspects
Type of Impact Mitigation measures Residual
Impacts
Op
erati
on
Ph
ase
Health and
Safety
- Chemical and toxic hazards:
corrosive substances
- Poor chemical handling
- Asphyxiating atmosphere
- Road Traffic Accident
- Ponds can attract children, pets
and unsuspecting adults, who may
think they look like good places to
play and even swim
- Wrong use of PPE
- Inadequate PPE
- Inadequate equipment/surface
guard on equipment
- Low awareness
- Guideline on safe handling of chemicals (SHOC) and appropriate
PPE are provided.
- Guideline on traffic control to ensure best traffic safety practices on
the road.
- Ponds to be cordon off by bund walls and have warning signs
clearly posted.
- All OOPC occupational safety practices and standards by anyone
working near a body of water would be observed.
- Awareness training
- Sufficient PPE are provided
- Equipment specifications are made available.
- Provision of adequate training to workers.
- Provision of warning signs to workers and commuters.
None
None
None
Oil/Fuel Spills
- Oil/fuel can enter the drainage
system and contaminate the land
and water.
- Oil spills can occur within and
outside the powerhouse, and the
fuel and lubricant storage area.
- Effluent pipe leakages
- The fuel storage tanks will be surrounded by a bund wall to contain
up to 1.5 times the total storage capacity in case of a spill.
- All wash down from inside the powerhouse will be directed to a
sump equipped with an oil/water separator to trap and filter oil from
wastewater before it is discharged to the drains.
- Arrangements for the proper disposal of the waste oil collected in
the oil/water separator will be made.
- An emergency response plan will be developed with detailed
procedures for preventing and handling spills.
None

Okomu Oil Palm Company Plc: 60TPH Palm Oil Mill Project at Extension Two February 2020
Environmental Impact Assessment (EIA) – Final Report Page 222
Table 6.1 Cont’d: Summary of Impact, Mitigation Measures and Residual Impacts
Activity
Phase
Environmental
Aspects
Type of Impact Mitigation measures Residual
Impacts
Op
erati
on
Ph
ase
Workers’ Welfare Payment of severance to permanent
workers - Workers will receive their full benefits
when leaving the organization.
None
Hostility
Conflicts between the communities and
the company.
- Conflict resolution mechanism is
instituted.
- Employ as much local labour as possible.
- Adequate stakeholders’ forum and
information shall be given to stakeholders.
- Adequate compensation shall be paid to
permanent workers in case of any
eventualities.
Insignificant
Socio-economics - Sexual laxity disruption
- Youth
Militancy/unemployment/grievances
- Public enlightenment about potential
health risks (STDs).
- Facilitate education/enlightenment about
the project and its nature.
None
Corporate Image The negative corporate image arising from
day-to-day activities of the organization., - Ensure that its day-to-day activities and
operations do not portend bad image about
the organization to the general public and
therefore operate according to the best
industry standards and practice.
None
Dec
om
mis
sio
nin
g
Ph
ase
Air Quality and
Climate
Air pollution from transport during the
decommissioning phase.
Well maintained vehicles will be used to reduce air
pollution
Insignificant
Impact

Okomu Oil Palm Company Plc: 60TPH Palm Oil Mill Project at Extension Two February 2020
Environmental Impact Assessment (EIA) – Final Report Page 223
In addition to the mitigation measures for environmental impacts and social issues above,
the following management and mitigation measures are also proposed for adoption and
implementation to address the significant residual social and environmental impacts in
order to make the proposed project operations environmentally and socially acceptable and
beneficial:
• Develop and implement community engagement plan
• Prevention of pollution of water resources.
• Preparation of a Traffic Management Plan
• Fire prevention programmes and zero or controlled burning.
• Corporate social services to communities.
• Provision of healthcare services and HIV prevention.
• Diligent implementation of social impact management plan
6.2 Residual Effects Assessment Summary
Residual impacts refer to those environmental effects predicted to remain after the
application of mitigation outlined in Table 6.1. The predicted residual effects are
considered for each project phase (Pre-Construction, Construction, Operation,
Decommissioning and Unplanned Events). As per the criteria established in Section 5.5
(Impact Significance) of this EIA report, the significance has been determined for each
residual adverse effect in Table 6.2 (no significance rating was established for positive
effects).
6.2.1 Residual Impacts
The residual impacts of the proposed project, following the implementation of the
environmental mitigation measures are listed below in Table 6.2.

Okomu Oil Palm Company Plc: 60TPH Palm Oil Mill Project at Extension Two February 2020
Environmental Impact Assessment (EIA) – Final Report Page 224
Table 6.2: Residual Impacts Associated with the Proposed Project
Activity
Phase
Environmental
Aspects
Type of Impact Nature of Impact
(Adverse, Beneficial or Negligible)
Significance (Minor,
Moderate, Major)
Pre
-Con
stru
ctio
n P
hase
Mobilization to
Site
- Risk of road accidents and
congestion
- Air pollution leading to
global warming and
increase in carbon
footprint.
- Generation and spillage of
small amount of toxic or
hazardous materials
(lubricating oils, hydraulic
fluids and insulating fluids)
Negligible
Adverse
Negligible
-
Moderate to Major
-
Co
nst
ruct
ion
Ph
ase
Air quality and
Climate
Dust and gaseous emissions
from palm oil mill construction
and vehicular emission leading
to high suspended particulates
in the atmosphere.
Negligible
-
Noise and
vibration
Noise emissions generated by
heavy duty vehicles and
workers activities and resultant
hearing impairment on site
workers.
Not Significant
-

Okomu Oil Palm Company Plc: 60TPH Palm Oil Mill Project at Extension Two February 2020
Environmental Impact Assessment (EIA) – Final Report Page 225
Table 6.2 Cont’d: Residual Impacts Associated with the Proposed Project
Activity
Phase
Environmental
Aspects
Type of Impact Nature of Impact
(Adverse, Beneficial or Negligible)
Significance (Minor,
Moderate, Major)
Con
stru
ctio
n P
hase
Traffic,
Access and
Transport
- Safety issues associated
with the movement of
abnormal loads on the
road network associated
with the Proposed
Development
- Increased intimidation of
Pedestrians and Cyclists.
Negligible
Negligible
-
-
Landscape
Change in land use and
visual effect
Adverse.
Moderate
Solid Waste
- Solid waste constituting
aesthetic nuisance
- Sewage nuisance
- Constitutes an eye sore
Negligible
Negligible
Negligible
-
-
-
Job Creation
Creation of employment
Beneficial
Minor
Water
Resources and
Hydrology
Impact on receiving water body
Adverse
Minor/Negligible

Okomu Oil Palm Company Plc: 60TPH Palm Oil Mill Project at Extension Two February 2020
Environmental Impact Assessment (EIA) – Final Report Page 226
Table 6.2 Cont’d: Residual Impacts Associated with the Proposed Project
Activity
Phase
Environmental
Aspects
Type of Impact Nature of Impact
(Adverse, Beneficial or Negligible)
Significance
(Minor, Moderate,
Major)
Significance (Minor,
Moderate, Major)
Op
erati
on
Ph
ase
Traffic, Access
and Transport
Increased intimidation of
pedestrians and cyclists. A
Traffic Management Plan is
proposed.
Negligible
-
Air quality and
Climate
- Stack emission
- Fugitive emissions from tanks
used to store petroleum and
other hydrocarbon products.
- Combustion emissions from
exhausts of machines e.g.
pumps power generating sets
- Air pollution from transport
during the operation.
Negligible
Negligible
Negligible
Negligible
Negligible
-
-
-
-
-
Solid waste and
sewage and
POME
- Waste runoff flowing into
the surface waters.
- Solid waste constituting
aesthetic nuisance.
- Sewage nuisance.
- GHG emission
- Weeds and long grass
- Blue-green algae
Negligible
Negligible
Negligible
Adverse
Adverse
Adverse
-
-
-
Major
Minor
Minor

Okomu Oil Palm Company Plc: 60TPH Palm Oil Mill Project at Extension Two February 2020
Environmental Impact Assessment (EIA) – Final Report Page 227
Table 6.2 Cont’d: Residual Impacts Associated with the Proposed Project
Activity
Phase
Environmental
Aspects
Type of Impact Nature of Impact
(Adverse, Beneficial or Negligible)
Significance (Minor,
Moderate, Major)
Op
erati
on
Ph
ase
Solid waste
and sewage
and POME
- Algae blooms
- Odors
- Sludge accumulation
Adverse
Negligible.
Adverse
Minor
-
Minor
Water Quality
and
Hydrology
Increased receiving water body
turbidity from runoff from the palm
oil mill.
Adverse
Minor

Okomu Oil Palm Company Plc: 60TPH Palm Oil Mill Project at Extension Two February 2020
Environmental Impact Assessment (EIA) – Final Report Page 228
Table 6.2 Cont’d: Residual Impacts Associated with the Proposed Project
Activity
Phase
Environmental
Aspects
Type of Impact Nature of Impact
(Adverse, Beneficial or Negligible)
Significance
(Minor,
Moderate,
Major)
Op
erati
on
Ph
ase
Health and
Safety
- Chemical and toxic hazards:
corrosive substances
- Poor chemical handling
- Road Traffic Accident
- Ponds can attract children, pets
and unsuspecting adults, who may
think they look like good places to
play and even swim
- Wrong use of PPE
- Inadequate PPE
- Inadequate equipment/surface
guard on equipment
- Low awareness
Negligible
Negligible
Negligible
Negligible
Negligible
Negligible
Negligible
Negligible
-
-
-
-
-
-
-
-
Oil/Fuel Spills
- Oil/fuel can enter the drainage
system and contaminate the land
and water.
- Oil spills can occur within and
outside the powerhouse, and the
fuel and lubricant storage area.
- Effluent pipe leakages
Negligible
Negligible
Negligible
-
-
-

Okomu Oil Palm Company Plc: 60TPH Palm Oil Mill Project at Extension Two February 2020
Environmental Impact Assessment (EIA) – Final Report Page 229
Table 6.2 Cont’d: Summary of Impact, Mitigation Measures and Residual Impacts
Activity
Phase
Environmental
Aspects
Type of Impact Nature of Impact
(Adverse, Beneficial or Negligible)
Significance (Minor,
Moderate, Major)
Op
erati
on
Ph
ase
Workers’ Welfare
Payment of severance to permanent
workers
Beneficial
-
Hostility
Conflicts between the communities and
the company.
Adverse
Major
Socio-economics - Sexual laxity disruption
- Youth
Militancy/unemployment/grievances
Negligible
Adverse
-
Minor
Corporate Image The negative corporate image arising from
day-to-day activities of the organization.,
Negligible
-
Dec
om
mis
sio
nin
g
Ph
ase
Air Quality and
Climate
Air pollution from transport during the
decommissioning phase.
Negligible
-

Okomu Oil Palm Company Plc: 60TPH Palm Oil Mill Project at Extension Two February 2020
Environmental Impact Assessment (EIA) – Final Report Page 230
6.3 Conclusions
On the basis of the assessment of potential impacts and the recommended mitigation
measures, overall, the proposed project is not likely to impose many significant adverse
effects on the environment. As summarised in Table 6.1, the majority of impacts on the
environment are either negligible in nature (and therefore significance) or of minor
adverse significance.
The EIA has, however, identified some potentially moderate/major adversely significant
effects, largely surrounding the POME discharge impacts of the proposed project during
operation. Impacts on POME discharge and potentially sensitive receptor points in the
surrounding area are considered to be potentially major adverse in significance.
Conversely, the implementation of mitigation measures to reduce the significance of
potential impacts has allowed for some beneficial environmental impacts to be identified,
such as to the socio-economics. Further, the economic benefits of job creation during the
entire lifespan of the proposed project are considered a positive effect.
6.4 Cost Implications Associated with Mitigation Measures
6.4.1 Construction
The mitigation measures for the proposed project (construction phase) would be included
as line items in the Bills of Quantities in the tender document so that the bidders are sure
to cost these items and can be held accountable for them during construction. It is not
possible to estimate these costs as they will vary depending on the contractor, the number
of workers to be used.
6.4.2 Operation (FFB Processing)
The activities and equipment that will have costs associated with them are listed below
in Table 6.3 below.

Okomu Oil Palm Company Plc: 60TPH Palm Oil Mill Project at Extension Two February 2020
Environmental Impact Assessment (EIA) – Final Report Page 231
Table 6.3: Cost Implications Associated with Mitigation Measures
Mitigation Measures Cost Implications
Pollution abatement equipment. This cost will be included in the cost of the project.
Construction of ramp, sterilizer, processing
line, boiler and ponding system
Cost will be included as a line item in the Bills of
Quantities for the project build-up.
All the necessary mill operation equipment Not possible to estimate these costs.
Personal Protective Equipment (PPE) for the
persons handling hazardous materials.
This cost will be part of the running cost of the
proposed palm oil mill and cannot be determined at
this point.
All contracts relating to supply, handling and
management of hazardous materials must have
provisions for this, i.e. personnel being kitted with
PPE.
Correction of all inherited impacts from
previous activities and operation.
Costs will be decided and implemented by the
management.

Okomu Oil Palm Company Plc: 60TPH Palm Oil Mill Project at Extension Two February 2020
Environmental Impact Assessment (EIA) – Final Report Page 232
CHAPTER SEVEN
ENVIRONMENTAL AND SOCIAL MANAGEMENT PLANS (ESMP)
Environmental monitoring will be required to monitor the effectiveness of the mitigation
measures and to report to the regulatory agencies. Through sound environmental
management, many avoidable adverse impacts from the construction and operation of the
proposed project can be prevented.
The Environment Management Plan (EMP) consists of all mitigation measures for each
component of the environment due to the activities increased during the construction,
operation, decommissioning and the entire life cycle to minimize adverse environmental
impacts resulting from the activities of the project. It would also delineate the
environmental monitoring plan for compliance of various environmental regulations. It
states the steps to be taken in case of emergency such as accidents at the sites including
fire. The detailed EMP for the complex is given below.
7.1 Environmental Management Plan
The Environment Management Plan (EMP) is a site specific plan developed to ensure
that the project is implemented in an environmental sustainable manner where all
contractors and subcontractors, including consultants, understand the potential
environmental risks arising from the project and take appropriate actions to properly
manage that risk. EMP also ensures that the project implementation is carried out in
accordance with the design by taking appropriate mitigation actions to reduce adverse
environmental impacts during its life cycle. The plan outlines existing and potential
problems that may adversely impact the environment and recommends corrective
measures where required. Also, the plan outlines roles and responsibility of the key
personnel and contractors who will be in-charge of the responsibilities to manage the
project site.
The components of the environmental management plan, potential impacts arising,
from the project and remediation measures are summarized below in Table 7.1.

Okomu Oil Palm Company Plc: 60TPH Palm Oil Mill Project at Extension Two February 2020
Environmental Impact Assessment (EIA) – Final Report Page 233
Table 7.1: Summary of Potential Impacts and Remedial Measures
S/No. Environmental
components
Potential Impacts Potential Source of
Impact
Controls Through
EMP & Design
Impact Evaluation Remedial Measures
1. Groundwater
Quality
Ground Water
Contamination
Construction Phase
Wastewater
generated from
temporary labor
tents.
No surface accumulation
will be allowed.
Mobile toilets will be
provided.
No significant impact as
majority of labours
would be locally
deployed
Operation Phase
Sewage from the
project
Effluent discharges
Toilets will be built
inside the mill complex
for workers
Ponding system will be
used for effluent
treatment.
No negative impact on
ground water quality
envisaged.
Not significant.
Monitoring Borehole
will be dug at 150m
Radius
2. Ground Water
Quantity
Ground Water
Depletion
Construction Phase
Groundwater aquifer
depletion.
• Industrial borehole will
be constructed for
construction purpose
No significant impact on
ground water quantity
envisaged.
Operation Phase
The source of water during operation p h as e i s Boreholes (4 in number).
Industrial borehole will
be constructed for
construction purpose.
Awareness
Campaign to reduce the
water consumption
No significant impact on
ground water quantity
envisaged from the
project.
In an unlikely event
of non-availability of
water supply, water
will be brought using
tankers.

Okomu Oil Palm Company Plc: 60TPH Palm Oil Mill Project at Extension Two February 2020
Environmental Impact Assessment (EIA) – Final Report Page 234
3. Surface Water
Quality
Surface water
contamination
Construction Phase
Surface runoff from
site during
construction activity.
Surface water is over 8
km away from the
project site.
No significant impact on
surface water envisaged from
the project.
Operation Phase
Discharge of
wastewater/ effluent
to the environment.
Wastewater/effluent
will be channelled to 5
serial ponds for
biological treatment.
No significant impact on
surface water envisaged
4. Air Quality Dust Emissions
Construction Phase
All heavy construction
activities
• During construction
phase the contractors
are advised to
facilitate nose
masks for the
workers.
• Water sprinklers
will be used for
suppression of dust
during construction
phase.
Not significant because dust
generation will be temporary
and will settle fast due to dust
suppression techniques.

Okomu Oil Palm Company Plc: 60TPH Palm Oil Mill Project at Extension Two February 2020
Environmental Impact Assessment (EIA) – Final Report Page 235
Emissions of
SPM, SO2, NO2
and CO
Construction Phase
• Operation of
Construction
equipment and
vehicles during site
development.
• Rapid on-site
construction and
improved maintenance
of equipment
• Use of Personal
Protective Equipment
(PPE) like earmuffs
and earplugs during
construction activities
Not significant. Regular monitoring of emissions and control measures will be taken to reduce the emission levels.
Operation Phase
• Power
generation by
generator set
• Emission from
vehicular traffic in
use
• Use of low sulphur
diesel if available
• Stack height of
generator would be
adequate.
• Providing Footpath
and pedestrian ways
within the site for
the employees and
visitors
Not significant.
No significant increase
in ambient air quality
level is expected from
the project’s activities.
There are no sensitive
receptors located within
the vicinity of site.
The vegetation cover
(oil palm) at the
proposed site will help
trap greenhouse gases
to be emitted.

Okomu Oil Palm Company Plc: 60TPH Palm Oil Mill Project at Extension Two February 2020
Environmental Impact Assessment (EIA) – Final Report Page 236
5. Noise
Environment
Operation Phase
• Noise from
vehicular movement
• Noise from
generator set
operation
• Green Belt Development
• Development of speed
breakers to check the traffic
movement
• Provision of noise shields
near the heavy construction,
operations and acoustic
enclosures for generator set.
• Construction activity will be
limited to day time only
No significant impact
6. Land
Environment
Soil
contamination
Construction Phase
• Disposal of
construction
debris
Construction debris will be
collected and suitably used on
site
No significant impact.
Impact will be local, as
waste generated will be
reused for filling of low
lying areas etc.
Operation Phase
• Generation of
solid waste
• Used oil
generated from
generator set
• It is proposed that the solid
waste generated will be
managed as per ESWMB
Rules.
• Collection, segregation,
transportation and disposal will
be done as per ESWMB Rules.
• Used oil generated will be
sold to authorized recyclers
Since solid waste is
handled by the authorized
agency, waste dumping is
not going to be allowed.
Not significant.
Negligible impact

Okomu Oil Palm Company Plc: 60TPH Palm Oil Mill Project at Extension Two February 2020
Environmental Impact Assessment (EIA) – Final Report Page 237
7. Biological
Environment
(Flora and
Fauna)
Displacement of
Flora and Fauna
on site
Construction Phase
Site Development
during construction
Landscaping is being carried
out.
Operation Phase
Increase in green
covered area
Suitable green belts will be
developed as per landscaping
plan in and around the site
using local flora
Beneficial impact.
8. Socio-
Economic
Environment
Population
displacement
and loss of
income
Construction Phase
• There is no
displacement due to
the construction.
No negative impact.
Operation Phase
Site operation
Project will provide
employment opportunities to the
local people in terms of labor
during construction and service
personnel (guards, securities,
gardeners etc) during operations
.
Beneficial impact

Okomu Oil Palm Company Plc: 60TPH Palm Oil Mill Project at Extension Two February 2020
Environmental Impact Assessment (EIA) – Final Report Page 238
9. Traffic Pattern Increase of
vehicular traffic
Construction Phase
• Heavy Vehicular
movement during
construction
• Adequate parking facility
will be provided
• The peak hour will be
avoided for transportation
of materials.
No negative impact
Beneficial Impact
Operation Phase
• Traffic due to people
once the project is
operational
• Vehicular movement
will be regulated inside
the project area with
adequate roads and
parking lots.
No major significant
impact
10. Occupational
Safety
Accidents from
heavy machinery
movement and
assemblage
Construction and Operation Phases
Influx of machine and material movement into the site
• Operators must wear PPE
• Traffic control into/out
of site.
In case there is a violation
of PPE usage.
Persuasion will
first be adopted
followed by
sanction.
11. Effluent and/or
POME
Water/Land
Pollution from
POME.
Construction Phase
Effluent and/or POME will not be discharged during construction activity.
Not Applicable No significant impact
on effluent/POME
discharge is expected.

Okomu Oil Palm Company Plc: 60TPH Palm Oil Mill Project at Extension Two February 2020
Environmental Impact Assessment (EIA) – Final Report Page 239
7.1.1 EMP for Air Environment
Construction Phase
To mitigate the impacts of suspended particulate matter during the construction phase of
the project, the following measures are recommended for implementation:
• A dust control plan
• Procedural changes to construction activities
Dust Control Plan
The most cost-effective dust suppressant is water because water is easily available on
construction site. Water can be applied using water trucks, handled sprayers and
automatic sprinkler systems. Furthermore, incoming loads could be covered to avoid loss
of material in transport, especially if material is transported off-site.
Procedural Changes to Construction Activities
Idle time reduction: Construction equipment is commonly left idle while the operators
are on break or waiting for the completion of another task. Emission from idle equipment
tends to be high, since catalytic converters cools down, thus reducing the efficiency of
hydrocarbon and carbon monoxide oxidation. Existing idle control technologies comprises
of power saving mode, which automatically off the engine at preset time and reduces
emissions, without intervention from the operators.
Improved Maintenance: Significant emission reductions can be achieved through regular
equipment maintenance. Contractors will be asked to provide maintenance records for their
fleet as part of the contract bid, and at regular intervals throughout the life of the contract.
Incentive provisions will be established to encourage contractors to comply with regular
maintenance requirements.
Reduction of On-Site Construction Time: Rapid on-site construction would reduce the
duration of traffic interference and therefore, will reduce emissions from traffic delay.
Operation Phase
To mitigate the impacts of pollutants from generators and vehicular traffic during the
operational phase of the Project, the following measures are recommended for
implementation:
• Generator emission control measures
• Vehicular emission controls and alternatives
• Greenbelt development

Okomu Oil Palm Company Plc: 60TPH Palm Oil Mill Project at Extension Two February 2020
Environmental Impact Assessment (EIA) – Final Report Page 240
Diesel Generator Set Emission Control Measures
Adequate stack height will be maintained to disperse the air pollutants generated from
the operation of the generators to dilute the pollutants concentration within the immediate
vicinity coupled with vegetation growth around the proposed project site. Hence no
additional emission control measures have been suggested.
Vehicle Emission Controls and Alternatives
During construction, vehicles will be properly maintained to reduce emission.
Greenbelt Development
Increased vegetation in the form of greenbelt is one of the preferred methods to mitigate air
and noise pollution. Plants serve as a sink for pollutants, act as a barrier to break the wind
speed as well as allow the dust and other particulates to settle on the leaves. It also helps
to reduce the noise level to a large extent. There exists vegetation growth (oil palm)
around the proposed project site to take care of this impact.
7.1.2 EMP for Noise Environment
Construction Phase
To mitigate the impacts of noise from construction equipment during the construction phase
on the site, the following measures are recommended for implementation.
Time of Operation: Noisy construction equipment will not be allowed to be use at night time.
Job Rotation and Hearing Protection: Workers employed in high noise areas are not
employed on shift basis. Hearing protection such as earplugs/muffs will be provided to
those working very close to the noise generating machinery.
Operation Phase
To mitigate the impacts of noise from diesel generator set during operational phase,
the following measures are recommended:
• Adoption of Noise emission control technologies
• Greenbelt development
Noise Emission Control Technologies
Source of noise in the operational phase will be from generator sets (which is the main source
of power for the propose project) and pumps & motors. All the machinery will be of highest
standard of reputed make and will comply with standard i.e. The generator set room will be
provided with acoustic enclosure to have maximum 90 dB(A) insertion loss or for meeting
the ambient noise standard whichever is on higher side as per FMENV standard for 8 hour
exposure limit.

Okomu Oil Palm Company Plc: 60TPH Palm Oil Mill Project at Extension Two February 2020
Environmental Impact Assessment (EIA) – Final Report Page 241
7.1.3 EMP for Water Environment
Construction Phase
To prevent degradation and to maintain the quality of the water source, adequate control
measures have been proposed. To check the surface run-off as well as uncontrolled flow of
water into any water body is proposed. The following management measures are
suggested to protect the water source being polluted during the construction phase:
• Avoid excavation during raining season
• Care has will be taken to avoid soil erosion
• Common toilets has been constructed on site during construction phase and the
sewage would be channelized to the septic tanks in order to prevent sewage to enter
into the water bodies
• To prevent surface and ground water contamination by oil and grease, the floors
of oil and grease handling area will be kept effectively impervious. Any wash off
from the oil and grease handling area or workshop will be drained through
imperious drains
• Collection and settling of storm water, prohibition of equipment wash downs and
prevention of soil loss and toxic release from the construction site are necessary
measure to be taken to minimize water pollution
Operation Phase
In the operation phase of the project, water conservation and development measures will
be taken, including all possible potential for rain water harvesting. Following measures
will be adopted:
• Minimizing water consumption.
• Promoting reuse of water after treatment and development of closed loop systems
for different water streams.
Minimizing Water Consumption
Consumption of fresh water will be minimized by combination of water saving devices and
other domestic water conservation measures. Further, to ensure ongoing water
conservation, an awareness program will be introduced for employees not to excessively
use or waste water.

Okomu Oil Palm Company Plc: 60TPH Palm Oil Mill Project at Extension Two February 2020
Environmental Impact Assessment (EIA) – Final Report Page 242
Wastewater Treatment Method
It is expected that the project will generate approx 300 tons/day of effluent. The effluent
will be treated in the 5 Nos. serial ponds for biological treatment before being discharged
into the oil palm plantation for irrigation.
Storm Water Management
Most of the storm water produced on site will be harvested for ground water recharge.
Thus proper management of this resource is a must to ensure that it is free from
contamination.
Contamination of Storm Water is possible from the following sources:
• Diesel and oil spills in the diesel power generator and fuel storage area
• Waste spills in the solid / hazardous waste storage area
• Oil spills and leaks in vehicle parking lots
• Silts from soil erosion in gardens
• Spillage of palm oil from palm oil mill processing line
A detailed storm water management plan will be developed which will consider the
possible impacts from above sources. The plan will incorporate best management practices
which will include following:
• Regular inspection and cleaning of storm drains
• Clarifiers or oil/separators will be installed in all the parking areas. Oil/grease
separators installed around parking areas. Both clarifiers and oil/water separators
will be periodically pumped in order to keep discharges within limits
• Covered waste storage areas
• Secondary containment and dykes in fuel/oil storage facilities
• Conducting routine inspection to ensure cleanliness
• Provision of slit traps in storm water drains
• Good housekeeping in the above areas

Okomu Oil Palm Company Plc: 60TPH Palm Oil Mill Project at Extension Two February 2020
Environmental Impact Assessment (EIA) – Final Report Page 243
7.1.4 EMP for Land Environment
Construction Phase
The waste generated from construction activity includes construction debris, biomass from
land clearing activities, waste from the temporary make shift tents for the labour’s and
hazardous waste.
Construction Debris
Construction debris is bulky and heavy and re-utilization and recycling is an important
strategy for management of such waste. As concrete constitutes the majority of waste
generated, recycling of this waste by conversion to aggregate can offer benefits of
reduced landfill space and reduced extraction of raw material for new construction
activity. This is particularly applicable to the project site as the construction is to be
completed in a phased manner.
Metal scrap from structural steel, piping, concrete reinforcement and sheet metal work will
be removed from the site by construction contractors. A significant portion of wood scrap
will be reused on site. Recyclable wastes such as plastics, glass fibre insulation, roofing etc
shall be sold to recyclers.
Hazardous waste
Construction sites are sources of many toxic substances such as paints, solvents wood
preservatives, adhesives and sealants. Hazardous waste generated during construction phase
shall be stored in sealed containers and disposed as per The S.I.15 - National Environmental
Protection (Management of Solid and Hazardous Wastes) Regulations 1991.
Some management practices to be developed are:
• Paintbrushes and equipment for water and oil based paints shall be cleaned
within a contained area and has not been allowed to contaminate site soils,
water courses or drainage systems.
• Provision of adequate hazardous waste storage facilities. Hazardous waste
collection containers will be located as per safety norms and designated
hazardous waste storage areas will be away from storm drains or watercourses
• Segregation of potentially hazardous waste from non-hazardous construction site
debris
• Well labelled all hazardous waste containers with the waste being stored and the
date of generation
• Instruct employees and subcontractors in identification of hazardous and solid
waste.

Okomu Oil Palm Company Plc: 60TPH Palm Oil Mill Project at Extension Two February 2020
Environmental Impact Assessment (EIA) – Final Report Page 244
Even with careful management, some of these substances are released into air, soil and water
and many are hazardous to workers. With these reasons, we will try as much as practically
possible to avoid their use by using low-toxicity substitutes and low VOC (Volatile Organic
Compound) materials.
Waste from Temporary Makes Shift Tents for Labours
Wastes generated from temporary make shift labour tents will mainly comprise of
household domestic waste, which will be managed by the contractor on the site. The sewage
generated will be channelized to the septic tank.
Operation Phase
In the operation phase of the project, e f f l u e n t / P O M E w i l l b e d i s c h a r g e d
i n t o f i v e ( 5 ) s e r i a l p o n d s f o r b i o l o g i c a l t r e a t m e n t b e f o r e
d i s c h a r g e i n t o t h e p l a n t a t i o n a s i r r i g a t i o n w a t e r . T h e f ollowing
measures will be adopted to monitor both the quality of the effluent and also the impact on
groundwater:
• Effluent sample (treated) will be collected from the last pond discharge point (pond
No. 5) and taken to the laboratory for analysis to know if it conforms to FMENV
limit for land application.
• Sample of monitoring well located at about 150 radius to the effluent treatment
ponds will be collected and taken to the laboratory for analysis. This will inform us
of contamination potential of groundwater.
Top Soil Management
To minimize disruption of soil and for conservation of top soil, the contractor will keep the
top soil cover separately and stockpile it. After the construction activity is over, top soil
will be utilized for landscaping activity. Other measures, which would be followed to
prevent soil erosion and contamination include:
• Maximize use of organic fertilizer for landscaping.
• To prevent soil contamination by oil/grease, leak-proof containers will be
used for storage and transportation of oil/grease and wash off from the
oil/grease handling area will be drained through impervious drains and treated
appropriately before disposal.
• Working in a small area at a point of time (phase wise construction)
• Construction of erosion prevention troughs/berms.

Okomu Oil Palm Company Plc: 60TPH Palm Oil Mill Project at Extension Two February 2020
Environmental Impact Assessment (EIA) – Final Report Page 245
Operational Phase
The philosophy of solid waste management at the proposed mill complex will be to
encouraging the four R’s of waste i.e. Reduction, Reuse, Recycling and Recovery
(materials & energy). T h e c o m p a n y w i l l l e v e r a g e o n i t s p r e s e n t w a s t e
m a n a g e m e n t Plan for proper segregation and storage techniques. The Environmental
Management Plan for the solid waste focuses on three major components during the life
cycle of the waste management system i.e., collection and transportation, treatment or
disposal and closure and post-closure care of treatment/disposal facility.
Collection and Transportation
• During the collection stage, the solid waste of the project will be segregated
into biodegradable waste and non-biodegradable. Biodegradable waste and
non-biodegradable waste will be collected in separate bins. Biodegradable
waste will be composted and returned to the plantation field as organic manure.
Proper segregation of waste will be carried out as follows:
• To minimize littering and odour, waste will be stored in well-designed
containers/ bins that will be located at strategic locations to minimize
disturbance in traffic flow
• Care would be taken such that the collection vehicles are well maintained
and generate minimum noise and emissions. During transportation of the waste,
it will be covered to avoid littering.
Organic
Waste
Converter

Okomu Oil Palm Company Plc: 60TPH Palm Oil Mill Project at Extension Two February 2020
Environmental Impact Assessment (EIA) – Final Report Page 246
Disposal
With regards to the disposal/treatment of waste, the management will take the services of
the authorized agency for waste management and disposal of the same on the project site
during its operational phase.
7.1.5 EMP for Ecological Environment
Construction activity changes the natural environment. But the proposed project also creates
a built environment for its inhabitants. The project requires the implementation of
following choices exclusively or in combination.
Construction Stage
• Restriction of construction activities to defined project areas, which are
ecologically sensitive
• Restrictions on location of temporary labour tents and offices for project staff
near the project area to avoid human induced secondary additional impacts on
the flora and fauna species
• Cutting, uprooting, coppicing of trees or small trees if present in and around
the project site for cooking, burning or heating purposes by the labors is
prohibited.
• Conservation plots of High Conservation Value forest had been set aside before
the construction of this project
Operation Stage
Improvement of the current ecology of the project site will entail the following measures:
• Oil Palm Plantation and Landscaping
• Conservation Plots of HCV
7.1.6 EMP for Socio-Economic Environment
The social management plan has been designed to take proactive steps and adopt best
practices, which are sensitive to the socio-cultural setting of the region. The Social
Management Plan for the proposed project focuses on the following components:
Income Generation Opportunity during Construction and Operation Phase
The project would provide employment opportunity during construction and operation
phase. There would also be a wide economic impact in terms of generating opportunities
for secondary occupation within and around the complex. The main principles considered
for employment and income generation opportunities are out lined below:

Okomu Oil Palm Company Plc: 60TPH Palm Oil Mill Project at Extension Two February 2020
Environmental Impact Assessment (EIA) – Final Report Page 247
• Employment strategy will provide for preferential employment of local
people
• Conditions of employment would address issues like minimum wages and
medical care for the workers. Contractors would be required to abide to
employment priority towards locals and abide by the labour laws regarding
standards on employee terms and conditions.
Improved Working Environment for Employees
The project would provide safe and improved working conditions for the workers employed
at the facility during construction and operation phase. With the ambience and facilities
provided, the proposed project will provide a new experience in living and recreations.
Following measures would be taken to improve the working environment of the area:
• Developing a proper interface between the work and the human resource
through a system of skill improvement
• Measures to reduce the incidence of work related injuries, fatalities and diseases
• Maintenance and beautifications of the project site
7.1.7 EMP for Energy Conservation to Reduce Greenhouse Gas Emission
Energy conservation program will be implemented through measures taken both on
energy demand and supply.
Energy conservation will be one of the main focuses during the project planning and
operation stages. The conservation efforts would consist of the following:
Energy Conservation Supply Demand
•
•
Utilize energy-efficient diesel Generators
Exploring the possibilities of
introducing renewable energy
Reduce consumption
Use energy efficient appliances
Create Guest Awareness

Okomu Oil Palm Company Plc: 60TPH Palm Oil Mill Project at Extension Two February 2020
Environmental Impact Assessment (EIA) – Final Report Page 248
Architectural design
• Maximize the use of natural lighting through design.
• The orientation of the buildings will be done in such a way that maximum
daylight is available.
Energy Saving Practices
• The company has already put in place an energy conservation plan which
includes switching off all electrical appliances when not in use or when going on
break.
• Constant monitoring of energy consumption and defining targets for energy
conservation.
• Adjusting the settings and illumination levels to ensure minimum energy used
for desired comfort levels.
Behavioural Change on Consumption
• Promoting workers awareness on energy conservation
• Training staff on methods of energy conservation and to be vigilant to such
opportunities.

Okomu Oil Palm Company Plc: 60TPH Palm Oil Mill Project at Extension Two February 2020
Environmental Impact Assessment (EIA) – Final Report Page 249
7.1.8 EMP at Decommissioning Phase
Activity Phase
Potential Impact
Action that shall be taken
Responsibility for
Mitigating Action
Monitoring of Mitigation/Impacts
Activity to be
Monitored
Timing &
Frequency
Dec
om
mis
sion
ing P
hase
Air Pollutants
Generation of dust during mill
components destruction and also
residues retained on the inner surface
of the machinery may pose a health
risk to the persons dismantling the
components and its ancillary facilities.
This risk could spread to the residences
if particulates and PM10 in the residues
are allowed to become airborne
through a failure to contain the
contaminated parts.
Pollutants of particular concern in the
residues include PCBs, dioxins and
heavy metals.
Decontamination will be done
according to procedure that will
be approved beforehand by
FMEnv
HSE Department/HSE
Committee
Contamination and
pollution of the soil
During
decommissioning
exercise
Noise
The dismantling and demolition of the
mill components will generate
minimal noise.
Decontamination will be done
according to procedure that will
be approved beforehand by
FMEnv
HSE Department/HSE
Committee
Contamination and
pollution of the soil
During
decommissioning
exercise
Wastewater
Though quantities of wastewater may
be small, this needs to be appropriately
contained to prevent release into any
nearby waterways or leaching into soil.
Decontamination will be done
according to procedure that will
be approved beforehand by
FMEnv
HSE Department/HSE
Committee
Contamination and
pollution of the soil
During
decommissioning
exercise

Okomu Oil Palm Company Plc: 60TPH Palm Oil Mill Project at Extension Two February 2020
Environmental Impact Assessment (EIA) – Final Report Page 250
Activity Phase
Potential Impact
Action that shall be taken
Responsibility for
Mitigating Action
Monitoring of Mitigation/Impacts
Activity to be
Monitored
Timing &
Frequency
Dec
om
mis
sion
ing P
hase
Solid Waste
Large quantities of steel, metal,
wooden and concrete waste will be
accumulated after demolition and
dismantling of the machinery may be
contaminated with residues of PCBs,
dioxins and heavy metals.
Decontamination will be done
according to procedure that will
be approved beforehand by
FMEnv
HSE Department/HSE
Committee
Contamination and
pollution of the soil
During
decommissioning
exercise
Air Pollutants
Generation of dust during mill
components destruction and also
residues retained on the inner surface
of the machinery may pose a health
risk to the persons dismantling the
components and its ancillary facilities.
This risk could spread to the residences
if particulates and PM10 in the residues
are allowed to become airborne
through a failure to contain the
contaminated parts.
Pollutants of particular concern in the
residues include PCBs, dioxins and
heavy metals.
Decontamination will be done
according to procedure that will
be approved beforehand by
FMEnv
HSE Department/HSE
Committee
Contamination and
pollution of the soil
During
decommissioning
exercise

Okomu Oil Palm Company Plc: 60TPH Palm Oil Mill Project at Extension Two February 2020
Environmental Impact Assessment Report (EIA) - Final Report Page 255
Table 7.2: Social Impact Management Plan (SIMP)
Mitigation Target: To Minimize Influx of Plantation Workers and its Implications on
Communities’ Family Structures and Social Networks
Priority is given to affected communities for
all categories of workers to be recruited
provided they have the requisite qualification
and expertise.
Okomu Oil Palm
Company Plc and
communities
Throughout the project’s life.
Develop database of local service providers
and ensure they are informed of opportunities
and tenders.
Okomu Oil Palm
Company Plc
Within the first 3 years of
project implementation.
Undertake orientation and induction on local
communities’ culture, tradition and values for
workers from outside of the communities.
Okomu Oil Palm
Company Plc and
Community Liaison
Officer (CLO)
Throughout the project’s life.
Mitigation Target: To Minimize Water Pollution due to POME
Proper treatment of POME before discharge
into the environment.
Okomu Oil Palm
Company Plc
Throughout project life.
Secure POME treatment facility by enough
posting of the area with safety warnings
Okomu Oil Palm
Company Plc
Throughout project life.
Mitigation Target: To Avoid or Minimize the Exposure of Workers and Local Communities to
Health and Safety Risk including HIV Aids
Conduct risk assessment for all tasks and
provide personal protective clothing to all
workers.
Okomu Oil Palm
Company Plc
At the commencement of
operation.
Provide decent and adequate toilet and
sanitation facilities for workers at the mill
complex
Okomu Oil Palm
Company Plc
During operation phase.
Develop and implement waste management
plans.
Okomu Oil Palm
Company Plc
Throughout the project life.
Undertake regular medical check-up for
workers.
Okomu Oil Palm
Company Plc
Throughout the project life.
Formulate and release HIV/AIDS policy for
workplace.
Okomu Oil Palm
Company Plc and
Workers Unions
Throughout the project life.
Design and implement health education
programmes for workers.
Okomu Oil Palm
Company Plc
Throughout the project life.

Okomu Oil Palm Company Plc: 60TPH Palm Oil Mill Project at Extension Two February 2020
Environmental Impact Assessment Report (EIA) - Final Report Page 256
Establish an in-plant clinic to provide
healthcare services to workers and their
families.
Okomu Oil Palm
Company Plc
At commencement of project
implementation.
Mitigation Target: To Minimize Impacts of Operations on Public Facilities and Structures
Ensure that damage caused to public facilities
are appropriately fixed and within reasonable
timeframe.
Okomu Oil Palm
Company Plc and
contractors
Soon after damage is
identified.
Identify and develop guidelines for key
activities that have the potential to impact on
public facilities
Okomu Oil Palm
Company Plc
Before commencement of
project implementation.
Regular and effective monitoring of
operation’s impacts on public facilities and
infrastructure
Okomu Oil Palm
Company Plc
To be part of monitoring.
Support to the development of public facilities
and infrastructure (e.g. schools, roads,
electricity, etc.)
Okomu Oil Palm
Company Plc
Throughout project life.
Mitigation Target: To Maximize Local Employment and Ensure Reasonable Quality of Life
and Working Conditions of Workers at Palm Oil Mill
Ensure workers’ conditions of service
including salaries and wages compare
favorable as applicable in the oil palm
industry in Nigeria.
Okomu Oil Palm
Company Plc,
service providers
and contractors
Throughout project life.
Dialogue, engage regularly and communicate
effectively with workers union.
Okomu Oil Palm
Company Plc and
Workers Union
Throughout project life.
Ensure workers have appropriate and safe
means of transport to and from work site.
Okomu Oil Palm
Company Plc
Throughout project life.
Adopt and implement mechanism for disputes
and grievance resolution.
Okomu Oil Palm
Company Plc
Throughout project life.
Mitigation Target: To Avoid/Minimize Potential Impacts of Pollution, Safety, Noise and Dust
and Damage to Roads caused by Heavy Vehicles and Construction Activities
Ensure all vehicles are roadworthy and drivers
receive road safety trainings.
Okomu Oil Palm
Company Plc and
contractors
Throughout project life.

Okomu Oil Palm Company Plc: 60TPH Palm Oil Mill Project at Extension Two February 2020
Environmental Impact Assessment Report (EIA) - Final Report Page 257
Institute safe driving culture including
sanctions for violators both inside and outside
of the estate.
Okomu Oil Palm
Company Plc,
customers and
contractors
Throughout project life.
Maintain access roads to the palm oil mill. Okomu Oil Palm
Company Plc
Throughout project life.
Undertake a noise mapping of the mill and
workshop to identify areas with more than 90
decibels and monitor regularly.
Okomu Oil Palm
Company Plc
Throughout project life.
Provide appropriate personal protective
equipment (PPE) for all workers especially at
the workshop palm oil mill.
Okomu Oil Palm
Company Plc
Throughout project life.
Mitigation Target: To Avoid Pollution or Destruction of Water Bodies
Implement the environmental management
plan (EMP) as approved by Federal Ministry
of Environment.
Okomu Oil Palm
Company Plc
Throughout the project life.
Comply with regulations relating to pollution Okomu Oil Palm
Company Plc and
contractors
Throughout the project life.
Avoid environmental pollution at all
workplaces.
Okomu Oil Palm
Company Plc and
contractors
Throughout the project life.
Obtain permits from regulatory bodies for
effluent discharges and solid waste disposal.
Okomu Oil Palm
Company Plc
Throughout project life.
Monitoring:
Monitoring of operations impacts on local
communities and population.
Okomu Oil Palm
Company Plc
3 Years after
commencement, then bi-
annual.
Implement the approved social impact
monitoring programme.
Okomu Oil Palm
Company Plc
Annually.

Okomu Oil Palm Company Plc: 60TPH Palm Oil Mill Project at Extension Two February 2020
Environmental Impact Assessment Report (EIA) - Final Report Page 258
7.2 Environmental Management System and Monitoring Plan
The company has put in place an effective Environmental Management system (EMS) to
ensure consistent functioning of the project. The EMS would include the following:
• An Environmental management committee.
• Environmental Monitoring.
• Personnel Training.
• Regular Environmental audits and Correction measures.
• Documentation – standards operation procedures Environmental Management
Plan and other records.
7.3 Health, Safety and Environment (HSE Department/HSE Committee)
Apart from having an Environmental Management Plan, it is also proposed to have a
permanent organizational set up charged with the task of ensuring its effective
implementation of mitigation measures and to conduct environmental monitoring. The
major duties and responsibilities of HSE department with HSE Committee shall be as given
below:
• To implement the environmental management plan.
• To assure regulatory compliance with all relevant rules and regulations.
• To ensure regular operation and maintenance of pollution control devices.
• To minimize environmental impact of operations as by strict adherence to the
EMP.
• To initiate environmental monitoring as per approved schedule.
• Review and interpretation of monitored results and corrective measures in case
monitored results are above the specified limit.
• Maintain documentation of good environmental practices and applicable
environmental laws for a ready reference.
• Maintain environmental related records.
• Coordination with regulatory agencies and external consultants
• Maintenance of log of public complaints and the action taken.
7.4 Hierarchical Structure of Environmental Management Committee
Normal activities of the EMP cell would be supervised by HSE department together with
the site manager/coordinator of the project. The hierarchical structure of HSE
department/HSE Committee is presented in Figure 7.1 below.

Okomu Oil Palm Company Plc: 60TPH Palm Oil Mill Project at Extension Two February 2020
Environmental Impact Assessment Report (EIA) - Final Report Page 259
Figure 7.1: HSE Department/Committee Structure

Okomu Oil Palm Company Plc: 60TPH Palm Oil Mill Project at Extension Two February 2020
Environmental Impact Assessment Report (EIA) - Final Report Page 260
7.5 Environmental Monitoring
The purpose of environmental monitoring is to evaluate the effectiveness of implementation
of Environmental Management Plan (EMP) by periodic monitoring. The important
environmental parameters within the impact area are selected so that any adverse effects
are detected and timely action can be taken. The project proponent will monitor ambient
air Quality, Ground Water Quality and effluent/wastewater Quality and ambient noise level
in accordance with an approved monitoring schedule.
Table 7.3: Suggested Monitoring Program for the Proposed Project
S. No. Type Locations Parameters Period and Frequency
1. Meteorology At the
proposed
project site
Rainfall, temperatures,
Wind Speed, Sunshine
Hours
Daily
2. Ambient Air
Quality
Project Site Criteria Pollutants: SO2,
NO2, SPM, CO, CO2,
VOC etc
Quarterly
3. Groundwater
(Portability testing)
Project site Drinking water parameters
as per FMENV/WHO
Standard such as pH, BOD,
COD, Microbiology.
Quarterly
4. Effluent/Wastewater
Quality
Effluent Ponds FMENV Limit for Land
Application such as pH,
BOD, COD, TSS, Oil and
Grease, Microbiology.
Quarterly
5. Ambient Noise Noise
Generating
Facilities
FMENV Limit for 8-hour
Exposure {dB (A)} levels.
Monthly
6. Health Facility Clinic Occupational diseases
and/or Medical statistics
Every 6 months

Okomu Oil Palm Company Plc: 60TPH Palm Oil Mill Project at Extension Two February 2020
Environmental Impact Assessment Report (EIA) - Final Report Page 261
7.6 Awareness and Training
Training and human resource development is an important link to achieve sustainable
operation of the facility and environment management. For successful functioning of the
project, relevant EMP would be communicated to:
7.6.1 Company Staff and Contractors
Workers must be made aware of the importance of waste segregation and disposal,
water and energy conservation. The awareness would be communicated through posters
and notices in a bill board. They would be informed of their responsibilities.
7.6.2 Environmental Audits and Corrective Action Plans
To assess whether the implemented EMP is adequate, periodic environmental audits
will be conducted by the project proponent’s HSE department. These audits will be
followed by Correction Action Plan (CAP) to correct various issues identified during the
audits.
7.7 Emergency Response Plan
An emergency is any unplanned occurrence caused by either natural or man-made events
which can lead to deaths, significant injuries, cessation of operations, physical or
environmental damage and economic losses. Numerous events can lead to emergencies.
These include:
• Fires
• Floods
• Communications failure
• Chemical spills
• Oil Spills
• Structural failure
• Civil disturbance
Emergency management is therefore critical to planning, mitigating, responding and
recovering from the potential impacts of these events. The emergency management process
however is very site specific and varies according to type of operations, geographic location,
proximity to neighbouring communities and the history of such occurrences. Therefore, one
of the first stages in developing an Emergency Response Plan (ERP) would be the
identification of the potential hazards or threats to the facility, organisation or operation based
on the above mentioned factors.

Okomu Oil Palm Company Plc: 60TPH Palm Oil Mill Project at Extension Two February 2020
Environmental Impact Assessment Report (EIA) - Final Report Page 262
The Emergency Response Plan must be documented and cover all the areas mentioned above.
In addition;
• The plan must identify the person(s) responsible for Emergencies and Safety. This
person will keep the documentation updated (at least annually) and ensure that it is
disseminated to all relevant persons.
• The plan must speak to the preparatory actions that must be taken in case of
emergencies with forewarning such as hurricanes and responsibilities must be
assigned.
• The plan should include actions that must be taken when a spill, riot or fire occurs.
A safe area (muster) must be designated for persons to congregate during an
emergency.
• A system must be in place to account for all staff members in an emergency with the
appropriate responsibilities assigned.
• Drills must be conducted on a specified frequency (for example 3 times in the year
for fire).
The plan must include for firefighting equipment to be checked on a specified
• frequency by a competent entity.
• The plan must address clean-up measures after the emergency.
The Emergency Response Plan must be developed in consultation with FMEnv to ensure that
it meets their requirements. The Emergency Response Plan for the mill expansion will form
a part of the overall Emergency Response Plan for the company.
7.7 Decommissioning
7.7.1 Decommissioning of a Palm Oil Mill
The approaches to the decommissioning of a palm oil mill would involve the combination
of the following activities/options:
7.7.1.1 Asset Recovery
This would be achieved through a reputable decommissioning services company. The
company would offer to purchase the complete asset units or sale of the entire palm oil
mill. Assets recovery would be done such as to achieve maximum return for the assets
within the specified time.

Okomu Oil Palm Company Plc: 60TPH Palm Oil Mill Project at Extension Two February 2020
Environmental Impact Assessment Report (EIA) - Final Report Page 263
7.7.1.2 Dismantling
This is applicable to either the removal of installations or the 'un-building' of structures.
Dismantling is generally achieved by a careful reversal of the construction process.
Dismantling will be done to optimize asset recovery.
7.7.1.3 Demolition
Demolition usually applies to structures and plant which have reached the end of their
working life, and must be carried out with a high degree of knowledge and expertise.
The demolition techniques used include conventional, remote mechanical and the use of
controlled explosive charges.
7.7.1.4 Decontamination
Contamination and pollution of the soil and buildings can often be a major problem for
those decommissioning industrial premises. The contamination may be in various forms
i.e. solid, liquid, vapour, gas or powder. This contamination can be present in the air or
on surfaces such as plant items or building fabric. Decontamination will be done
according to procedure that will be approved beforehand by FMEnv.
7.7.1.5 Remediation
Ground remediation, rehabilitation and regeneration package will form an integral part
of the services to be performed by the company to be appointed for decommissioning.
7.8 Decommissioning Procedure
A decommissioning service company will be contracted to undertake the decommissioning.
The company will prepare and submit a manual articulating the procedure and methodology
of decommissioning, including approach, type of waste and disposal method. The procedure
will be such as to minimize the adverse impacts associated with decommissioning and will
be approved by FMEnv before commencement of decommissioning.

Okomu Oil Palm Company Plc: 60TPH Palm Oil Mill Project at Extension Two February 2020
Environmental Impact Assessment Report (EIA) - Final Report Page 264
CHAPTER EIGHT
CONCLUSION
This project is an attestation to the sustainable growth of palm oil processing which will result
in substantial economic benefits for Nigeria through employment opportunities generation in
particular during the construction and operation phases.
This EIA also indicates that discharges including wastewater discharge, gaseous emissions
and noise are expected from the operation of the palm oil mill. However, any such discharges,
which can be considered as potential sources of adverse environmental effects, can be fully
managed through preventive actions and mitigating measures. This means that no significant
negative impact on the natural, health and social environmental sensitivities of the project
area is expected to result from discharges.
The assessment has gathered and analysed the present situation which shall form the basis for
baseline data. The data seem adequate and have assisted to determine the present and socio-
economic status of the project environment and the kinds of effects and responses that may
result from the interaction of the mill operation. However, the proposed project is not
expected to have significant adverse effects on the natural, cultural, environmental and
socioeconomic life in the project area.
The assessment further demonstrates that the proposed project will fully comply with
legislative requirements in Nigeria and other relevant international regulations applicable to
the planned operations much as in the case of the existing one at the proponent headquarters
known as Main estate.
The existing environmental management programme of OOPC Plc has put in place good solid
waste management system, which will fully complement the waste management requirement
of the proposed project.
An EMP involving environmental management and supervision organizations, and
environmental monitoring has been established to ensure the environmental performance of
the Project. To ensure successful implementation of these measures, the EMP covers major
relevant aspects such as institutional arrangement for environmental management and
supervision and environmental monitoring. With implementation of the mitigation measures
defined in the EIA and EMP, all the likely adverse environmental impacts associated with the
proposed project will be prevented, eliminated, or minimized to environmentally and socially
acceptable levels.
It is clear that the proposed project will be sustainable if all the identified and potential
environmental and social impacts are adequately mitigated.

Okomu Oil Palm Company Plc: 60TPH Palm Oil Mill Project at Extension Two February 2020
Environmental Impact Assessment Report (EIA) - Final Report Page 265
References
Adejuwon, J.O. 1971. The ecological status of fresh water swamp savannas in the forest zone
of Nigeria. Journal of the West African Science Association. 16(2), pg 133-154
Agboola, S.A. 1979. An Agricultural atlas of Nigeria. Oxford University Press, Oxford.
248pp
Ahmed et al 2003
Ahn, M.P. 1970. West African Soils. Vol 1 Oxford University Press, London. 332pp
Allen J.R. 1965. Late quaternary Niger Delta and adjacent areas: sedimentary environments
and lithofaceies. A.A.P.G. Bull. 49, 541-600.
Allison P.A. 1973. A historical sketch of the forests of Benin. Bulletin of the Nigerian
Forestry Departments vol. 33 No. 1 1-30
Alloway, B.J. (ed) 1990. Heavy metals in soils. Blackie, Glasgow and London. 330pp.
APHA, 1985. Standard methods for the examination of water and wastewaters 16th ed.
American Public Health Association, Washington D.C. 1268pp.
Bek Nelsen et al, 1999
Boorman, J. 1991. West African insects. Longman, Essex,. 98pp.
Borror, D.J. and White, R.E. 1970. A field guide to insects of America North of Mexico.
Houghton Mullflim Company, Boston, 403pp.
Brown et al 1976
Canter, 1996
Davis, C.C. 1958. The marine and freshwater plankton. Michigan State University Press,
Michigan. 562pp.
Federal Environmental Protection Agency (FEPA) 1991. Guidelines and standards for
Environmental Pollution Control in Nigeria. Federal Republic of Nigeria.
Federal Environmental Protection Agency (FEPA) 1991. National Effluent Limitations
Regulations S.I.8. Federal Republic of Nigeria.

Okomu Oil Palm Company Plc: 60TPH Palm Oil Mill Project at Extension Two February 2020
Environmental Impact Assessment Report (EIA) - Final Report Page 266
Federal Environmental Protection Agency (FEPA) 1991. Waste Management and hazardous
waste regulations S.I.15. Federal Republic of Nigeria.
Federal Government of Nigeria (FGN), 1985. The endangered species Decree II (Control of
International Trade and Traffic), Federal Government of Nigeria.
Federal Military Government 1992. Environmental Impact Assessment Decree No. 86 Federal
Military Government of Nigeria.
FMEHUD, 1995
Glendhill, D. 11991. West African Trees. Longman, Essex. 67pp.
Hartley, 1988
Hill, F.W. 1952. Economic Botany. 2nd edn. MacGraw-Hill, NewYork.
Hendy, N.I. 1964. An Introductory account of small algae of British coastal waters. Fishery
investigation. HMSO. London. Part iv. 317pp.
Holden, M. and Reed, W. 1991. West African freshwater fish. Longman, Essex. 68pp.
Hutchingson, J. and Daiziel, J.M. 1952-1974. Flora of West Tropical Africa. Crown Agents
for Overseas Government and Administrations. London https://www.proshareng.com/news/Agriculture/Fact-File-on-Crude-Palm-Oil-(CPO)-in-Nig/39032
International Union for the Conservation of Nature, IUCN 2014. Red List of Threatened
Species. Gland, Switzerland.
Kinako, P.D.S. Structure and function of some Nigerian wetland ecosystems in Nigeria
Nigeria wetlands. Akpata, T.V.I., Okali, D.U. (eds). Man and Biosphere, Lagos, pp48-54
Leopold, L.B., Clarke, F.E., Henshaw, B.B. and Balsley, J.T. 1971. A procedure for
evaluating environmental impacts. Geological survey circular 645. Government Printing
Office, Washington, D.C.
Lohani et al 1997
Madge, D.S. AND Sharma, G.D. 1969. Soil Zoology. Ibadan University Press, Ibadan.
Olaniyan, C.I.O. 2975. An introduction to West African Animal Ecology, 2nd ed., Heinemann
Educational Books, Ltd, London. 170pp.
Raymond et al 1976

Okomu Oil Palm Company Plc: 60TPH Palm Oil Mill Project at Extension Two February 2020
Environmental Impact Assessment Report (EIA) - Final Report Page 267
Slingsby, D. and Cook, C. 1989. Practical ecology. Macmillan Education, Bainstoke. 210pp.
Southwood, T.R.E. 1992. Ecological Methods 2nd ed., Chapman and Hall, London.
UNEP, 1996
Wathern, 1988
Wood, C. 1996. Environmental impact assessment. A comparative review. Longman, Harlow
Essex, 337pp.
World Bank, 1991. Operational directive 4.01 Annex C. Environmental Management Plan.
The World Bank Operational Manual.
World Bank 1995. Plantation and large scale agricultural development Annex E: Defining an
environmental development strategy for the Niger Delta. Vol. 11, pp 17-21. Industry and
Energy Operations Division. West Central Africa Department.
A history of wind mill Technology; Richard Leslie Hills, p.67, 172-178]

ANNEXURE I
APPROVED TERMS OF REFERENCE (ToR)


APPENDIX I
LABORATORY ANALYSIS RESULTS

1 of 2
Analyst’s Certificate №: 1903007 [Institute of Public Analysts of Nigeria Decree 100 of 1992]
Methodology:
Samples of water collected from all the sites were analyzed using Standard methods of water and
wastewater analysis (APHA, 23rdedition) and HACH methods of analysis of water (12th edition). The
parameters examined are as contained in the result Table.
Sampling Locations
S/N Sample Code Description of Location Coordinates
1. BH1 Okomu Extension 2 Borehole 1 N06042’03.4” E005049’08.8”
2. BH2 Okomu Extension 2 Borehole 2 N06041’11.7” E005049’55.4”
3. BH3 (CTRL) Okomu Extension 2 Borehole 3 N06040’30.6” E005048’36.6”
Result of Analysis
The result of on-site measurements and laboratory analyses carried out on the water samples collected from
OKOMU Oil Palm Extension II while in the same condition as submitted to us is presented in Table 1:
Comments
Based on the result of analysis conducted on the samples, all the physico-chemical and microbiological
qualities of the water samples conformed to the Standard except for slight acidic content.
I, the undersigned Public Analyst, OYEDIRAN, L.O. (IPAN NO. 00155®), make this certification, as witnessed my hand this 11thday of March, 2019.
Name of Sample: Extension 2 Groundwater samples Project: Extension 2 POM EIA
Client: Foremost Development Services Limited
For: OKOMU Nig. PLC Benin City, Edo State.
Submission Date: 4 March 2019 Lab No.:EL/W/1903/31803-31805

2 of 2
TABLE 1: EXTENSION 2 GROUNDWATER SAMPLES Ex.: OKOMU Oil Palm Plc
PARAMETER/UNIT FMENV:
2015
Method,
APHA, 23Ed. BH1 BH2 BH3 (CTRL)
Appearance Clear &
colourless
Clear & colourless liquid
Odour Unobjectionable Unobjectionable
Taste Unobjectionable Unobjectionable
pH 6.5-8.5 4500-HB 5.25 5.20 5.84
Temperature, oC Ambient - 31.8 31.2 31.1
Conductivity, S/cm 1000 2500-B 50 40 60
Colour, Pt-Co 15 2120-C 2 <1 <1
Turbidity, NTU 5 2130-B 4 6 1
Total Solids, mg/L - 2540B 26.2 22 30
Total Dissolved solids, mg/L 500 2540-D 25.2 20 30
Total Suspended Solids, mg/L - 2540-C 1 2 <1
Total Hardness, mg/L 2340-C 4 4 12
Total Alkalinity, mg/L - 2320-B 23 19.2 21.1
Total acidity, mg/L - 2310-B 24.4 27.8 13.9
Calcium, mg/L - 3500-B 1.6 1.6 3.6
Magnesium, mg/L 20 3500-B <1 <1 0.7
Chloride, mg/L 250 4500-B 1.4 6.2 6.2
Nitrate, mg/L 50 4500-NO3--E 0.10 0.5 0.9
Nitrite, mg/L 0.2 4500-NO2--B <0.01 <0.01 <0.01
Sulphate, mg/L 100 4500-SO4-E 9 12 11
Phosphate, mg/L - 4500-E <0.1 <0.1 <0.1
Free carbon dioxide, mg/L - 4500-CO2-C 21.4 24.5 12.2
Iron (total), mg/L 0.3 3500-B <0.01 0.01 0.01
Fluoride, mg/L 1.5 4500-F-C <0.10 <0.1 <0.1
Lead, mg/L 0.01 3500 -Pb-B <0.001 <0.001 <0.001
Arsenic, mg/L 0.01 3500 -As-B <0.001 <0.001 <0.001
Manganese, mg/L 0.2 3500 -Mn-B <0.001 <0.001 <0.001
Copper, mg/L 1.0 3500 -Cu-B <0.001 <0.001 <0.001
Cadmium, mg/L 0. 03 3500 -Cd-B <0.001 <0.001 <0.001
Hydrogen Sulphide, mg/L 0.05 4500-S2-H 0 0 0
Chemical Oxygen Demand, mg/L 80 5220-D <1 <1 <1
Biochemical Oxygen Demand, mg/L 30 5210-B <1 <1 <1
Oil and Grease, mg/L 10 4500-G <1 <1 <1 Salinity as Chloride, mg/L 200 4500-B <0.01 <0.01 <0.01
Total coliform count, CFU/mL 10 9225-D 0 0 0
Faecal coliform (E.coli), CFU/100 mL Nil 9222-D 0 0 0
Clostridium perfringens, CFU/100 mL Nil AOAC 973.30 0 0 0
Salmonella/Shigella sp., CFU/100 mL Nil 9260-E 0 0 0
Staphylococcus sp. , CFU/100 mL Nil AOAC 995.12 0 0 0
Pseudomonas aureus, CFU/100 mL Nil 9213-E 0 0 0
Total plate count, CFU/100 mL 102 9215-B 6 4 8

[[IInnssttiittuuttee ooff PPuubblliicc AAnnaallyyssttss ooff NNiiggeerriiaa DDeeccrreeee 110000 ooff 11999922]]
Name of Sample: Extension 2 Surface River samples Project: OOPC Ext. 2 Mill EIA Client: Foremost Development Services Limited BC REF: 31977 - 31984
For: OKOMU Nig. Plc Benin City, Edo State. Submission Date: 5 March 2019 Lab No.: EL/W/1809/056-063
A. Methodology:
Samples of water collected from all the sites were analyzed using Standard methods of water and
wastewater analysis (APHA) (21st edition) and HACH methods of analysis of water (12th edition).
The parameters examined are as contained in the result Table.
B. Sampling Locations
S/N Code Description Coordinate
1. OKMEXT2G River Jemide (upstream) N06041’41.8” E005052’44.2”
2. OKMEXT2H1 Stream I (upstream) N06045’56.1” E005050’50.4”
3. OKMEXT2H2 Stream I (downstream-by G1-West) N06047’35.41” E005051’11.04”
C. Result of Analysis
The result of on-site measurements and laboratory analysis carried out on the samples collected from
Extension 2 area of OKOMU Oil Palm Plc while in the same condition as submitted to us is presented
in Table 1:
D. Comments: Based on the result of analysis conducted on the samples
• The pH of the samples conformed to the standard
• The aesthetic quality of sample OKMEXT2H as shown by the results of colour, turbidity and suspended solids differ from the limits
• Other physico-chemical and microbiological qualities of the samples conformed to the Standard.
I, the undersigned Public Analyst, OYEDIRAN, L.O. (IPAN NO. 00155®), make this
certification, as witnessed my hand this 14th day of March, 2019.
Analyst’s Certificate №№::000088221199

Table 1: Result of Analysis of Surface Water Samples at Extension 2
PARAMETER/UNIT METHOD, APHA
(21st Edn.) Jemide River Stream 1 Stream 1 FMEnv.
Upstream Upstream Downstream
Appearance Visual Faint brown
with tiny floc Clear liquid with trace particles
pH Electrometric 6.67 8.46 8.80 6-9
Temperature, oC Thermometer 28.4 28.7 28.5 Ambient
Conductivity, S/cm 2510-B 63.9 71.20 57.20 2000
Colour, Pt-Co 2120-C <1 2860 320 7.0
Turbidity, NTU 2130-B 45 117 160 10
Total Solids, mg/L 2540-B 17.9 1045 118.6 -
Total Dissolved solids,
mg/L
2540-D 16.9 980 20.6 1000
Total Suspended Solids,
mg/L
2540-C 1 65 98 30
Total Hardness, mg/L 2340-C 4 <1 20 -
Total Alkalinity, mg/L 2320-B 50.1 60.7 62.4 -
Total acidity, mg/L 2310-B 6.96 <1.0 6.96 -
Calcium, mg/L as Ca 3500-B 0.80 <1.0 3.20 -
Magnesium, mg/L as Mg 3500-B 0.49 <1.0 2.92 -
Salinity as Chloride, mg/L 4500-B 27.79 41.8 6.95 200
Nitrate, mg/L -
4500-NO3 -B 0.22 0.19 0.14 10-50
Nitrite, mg/L -
4500-NO2 -B <0.01 0.01 0.1 0.3
Sulphate, mg/L 4500-E 17 26.0 10 250
Phosphate, mg/L 4500-C 2.1 4.66 3.65 -
Iron (total), mg/L 3500-B 0.88 2.58 0.20 20
Lead, mg/L 3500 -Pb-B <0.001 <0.001 <0.001 <1.0
Copper, mg/L 3500 -Cu-B <0.001 <0.001 <0.001 <1.0
Manganese, mg/L 3500 -Mn-B <0.001 <0.001 <0.001 0.10
Cadmium, mg/L 3500 -Cd-B <0.01 <0.01 <0.01 <1.0
Nickel, mg/L 3500 -Ni-B <0.01 <0.01 <0.01 <1.0
Cobalt, mg/L 3500 -Co-B <0.01 <0.01 <0.01 <1.0
Arsenic, mg/L 3500 -As-B <0.01 <0.01 <0.01 <1.0
Chem. Oxygen Demand,
mg/L
5220-D 34 25 22 80
Biochem. Oxygen
Demand, mg/L 5210-B 23.8 17.5 15.4 30
Dissolved Oxygen, mg/L 4500-G 6.8 11.2 4.8 >2.0
Total Hydrocarbon, mg/L Spectrophotometer <0.01 <0.01 <0.01
Pesticides, mg/L Screening <0.01 <0.01 <0.01
Total coliform count,
MPN/mL
9225-D 6 2 3 102
Faecal coliform,
E.coli; CFU/mL 9222-D Nil Nil Nil -
Total plate count,
CFU/mL
9215-B 72 1.0 x 10² 1.0 x 10² 104

1 of 2
Analyst’s Certificate №№:: [[IInnssttiittuuttee ooff PPuubblliicc AAnnaallyyssttss ooff NNiiggeerriiaa DDeeccrreeee 110000 ooff 11999922]]
Methodology and result
Sampling and measurement of air quality and noise level were carried out using portable analyzers. Gaseous
components of the air were monitored using Mattheson Model IQ 1000 Gas Analyzer to measure the
concentration of carbon monoxide (CO), carbon dioxide (CO2), Sulphur dioxide (SO2), oxygen, hydrogen
sulphide (H2S) and volatile organic compounds (HNU-PID Monitor). Nitrogen oxides, NOx, were determined
using BWT gas alert meter. Handheld Aerosol Monitor PPM1055 was used for the measurement of suspended
particulate matter. Quest 2500 Sound Level Meter was used to measure the noise level within and around the
facility.
The result of on-site measurements carried out on the ambient air at the facility is presented in Table 1:
The result of measurements conducted around the site showed that:
• The baseline ambient air quality was within the regulatory limits as shown by the concentration of
particulate matter and gases present in the air;
• The noise level at all the locations also fell within the standard for 8-hour exposure.
I, the undersigned Public Analyst, OYEDIRAN, L.O. (IPAN NO. 00155®), make this certification, as witnessed my hand this 1st day of March 2019.
Name of Sample Proposed 60Tons FFB/Hr Palm Oil Mill Project at Extension II Client Foremost Development Services Limited
For: OKOMU Oil plc, Benin-City, Edo State.
Sampling Date 28 February 2019 Season: DRY

2 of 2
Table 1: Result of air quality measurement and noise level at Extension II Project site
Coordinate
Point A
Point B Point C Point D Point E Point F
(Odigiemute Community) - CTRL
FMEnv. Limit
31N
0811895 31N
0811767 31N
0810755 31N
0811193 31N
0811604 31N
0805970
0739708 0739617 0738737 0738659 0741609 0738130
Elevation, m 258m 252m 285m 291m 214m 260m
Noise, dB(A) 32.6 36.0 44.4 40.5 52.4 47.8 90
SPM (µg/m3) 80 110 110 80 70 70 250
Humidity (%) 51.7 41.5 45.4 44.2 39.6 45.6 Ambient
Temperature (0C) 29.0 31.6 31.2 31.8 33.7 31.1 Ambient
Carbon monoxide, ppm <1.0 <1.0 <1.0 <1.0 <1.0 <1.0 10-20
Carbon dioxide, % 0.32 0.31 0.30 0.32 0.31 0.32 Ambient
Hydrogen sulphide, ppm <0.1 <0.1 <0.1 <0.1 <0.1 <0.1 -
Hydrocarbon, % <0.1 <0.1 <0.1 <0.1 <0.1 <0.1 -
Oxygen, % 21.0 21.0 21.0 21.0 21.0 21.0 21.0
Sulphur dioxide, ppm <0.01 <0.01 <0.01 <0.01 <0.01 <0.01 0.01
Nitrogen dioxide, ppm <0.01 <0.01 <0.01 <0.01 <0.01 <0.01 0.04 – 0.06
VOC, ppm <0.01 <0.01 <0.01 <0.01 <0.01 <0.01 -
VOC = Volatile organic compounds; SPM = Suspended particulate matter

APPENDIX II
GEOTECHNICAL AND SOIL REPORTS

JEFFA GEOTECH
GEOTECHNICAL ENGINEERING CONSULTANTS:
JEFFA GEOSURVEYS & TECHNICAL SERVICES LIMITED,
248 UGBOWO-LAGOS ROAD,
BENIN CITY, EDO STATE.
JUNE, 2018
1

JEFFA GEOTECH
REPORT OF GEOTECHNICAL INVESTIGATION FOR PROPOSED OKOMU
EXTENSION II MILL, BENIN CITY
FIELD & LAB TECHNICIAN MR. UWAILA N. G.
SOIL SPECIALIST ENGR. E. IZILIEN
GEOTECH ANALYST ENGR. DR. O. R. OGIRIGBO
QC VERIFIED BY: PROF. EHIOROBO J.O.
REVISION REV-0.00
DATE MAY, 2018
2

JEFFA GEOTECH
TABLE OF CONTENT
CHAPTER ONE 5
1.0 INTRODUCTION 5
1.2 OBJECTIVE OF GEOTECHNICAL INVESTIGATION 5
1.3 SCOPE OF WORK 5
CHAPTER TWO 7
2.0 FIELDWORK 7
2.1 EQUIPMENT FOR SOIL EXPLORATION 7
2.2 SOIL EXPLORATION 7
2.3 CONE PENETROMETER TESTS 7
2.4 DESCRIPTION OF SOIL SAMPLES BY VISUAL INSPECTION 7
CHAPTER THREE 11
3.0 LABORATORY TESTING 11
3.1 SPECIFIC GRAVITY TEST. 11
3.2 PARTICLE SIZE ANALYSIS 11
3.3 ATTERBERG/ CONSISTENCY TESTS 12
3.4 COMPACTION TESTS 12
3.5 UNDRAINED TRIAXIAL TESTS 12
3.6 CALIFORNIA BEARING RATIO TEST 13
3

JEFFA GEOTECH
CHAPTER FOUR 14
4.0 PRESENTATION OF RESULTS 14
4.1 SPECIFIC GRAVITY TEST RESULTS 14
4.2 PARTICLE SIZE DISTRIBUTION TESTS RESULTS 17
4.3 ATTERBERG/CONSISTENCY LIMITS TEST RESULTS 20
4.4 COMPACTION TESTS RESULTS 23
4.5 UNDRAINED TRIAXIAL TESTS RESULTS 26
4.6 DUTCH CONE PENETROMETER TEST RESULTS 30
4.7 CALIFORNIA BEARING RATIO TEST RESULT 33
CHAPTER FIVE 35
5.0 DISCUSSION 35
5.1 GENERAL DISCUSSION OF INDEX PROPERTIES AND SOIL CLASSIFICATION 35
5.2 GENERAL DISCUSSION OF STRENGTH RESULTS 36
CHAPTER SIX 38
6.0 CONCLUSION AND RECOMMENDATION 38
6.1 CONCLUSION 38
6.2 RECOMMENDATIONS 38
REFERENCES 41
4

JEFFA GEOTECH
CHAPTER ONE
1.0 INTRODUCTION
Jeffa Geosurveys and Technical Services Ltd was commissioned by the proprietors of OKOMU
MILL PLC to carryout geotechnical investigation on the proposed site for Okomu Extension
Mill II. Exploration works was conducted in the site in the month of May, 2018. This investigation
was conducted during the wet season of the year.
The output from this investigation will be employed for the economic design of the foundation
structure to carry surface load in line with client’s developmental objectives for the site location.
The output from this investigation will also be employed for the economic design of the
foundation structure to carry surface load in line with client’s developmental objectives for the
site location.
1.2 OBJECTIVE OF GEOTECHNICAL INVESTIGATION
The objectives of the geotechnical investigation included the following:
(i) To investigate and give details about the soil profile to a maximum depth of about 15 m
below the natural ground level
(ii) To determine the index and strength properties of the soil required for foundation design
(iii) To collect disturbed and undisturbed samples of the soil by drilling ten boreholes to 15.0
m depth and three road points to depths of 1.5m each for laboratory testing and analysis
(iv) To carry out Dutch Cone Penetrometer Testing (CPT) to depth of refusal or anchorage
(v) Recommendation for further improvement of the geotechnical properties of the
investigated site soil where necessary.
1.3 SCOPE OF WORK
The scope of work includes the following:
1. Mobilization of equipment and personnel to site
5

JEFFA GEOTECH
2. Drilling of ten (10) boreholes to 15 m depths at each test point using the Shell and Augar
Technique with a Percussion Rig mounted equipment and also collect samples from
three road points at depths 1.5m each.
3. Laboratory testing of recovered soil samples from the location. The laboratory test shall
include:
I. Specific gravity test
II. Sieve analysis test
III. Consistency test
IV. Compaction test
V. Undrained Triaxial test
VI. California Bearing ratio
4. Cone penetrometer tests
5. Bearing capacity calculations at specific depths
6. Analysis of the tests results with recommendation for improvement and economic design
7. Preparation and submission of detailed Geotechnical Report with Appendices.
6

JEFFA GEOTECH
CHAPTER TWO
2.0 FIELDWORK
2.1 EQUIPMENT FOR SOIL EXPLORATION
The equipment deployed to the site for soil exploration includes:
1. Pilcon Drilling Equipment
2. Measuring Tapes and Steel Rule
3. Dutch Cone Penetrometer
4. Shovels
2.2 SOIL EXPLORATION
Soil samples were drilled from ten deep boreholes up to a depth of 15 m and to depths of 1.5m
for the road samples. Water table was not reached in the course of this investigation. The
recovered soil samples were then taken to the Geotechnical and Highway Materials Testing
Laboratory of the University of Benin for testing and analysis.
2.3 CONE PENETROMETER TESTS
The field work also involved the execution of three Cone Penetrometer Tests. The apparatus
consisted of a cylindrical probe of 1000 mm2 cross sectional area, and a conic head of apex
angle of 60o. The probe was forced down through the soil at a steady rate of about 20 mm/s in
the closed position by exerting pressure force on outer sounding tube. The point resistance and
the resistance to side friction were measured separately from the attached gauge.
2.4 DESCRIPTION OF SOIL SAMPLES BY VISUAL INSPECTION
Both soil description and classification require knowledge of grading and plasticity. Grading and
plasticity can be assessed using a rapid procedure which involves personal judgements based
on the appearance and feel of the soil.
7

JEFFA GEOTECH
Most of the soil samples collected were dark to light reddish brown in colouration depicting
lateritic nature. A table showing a complete description of the soil samples obtained at the
various depths investigated is shown below in Table 2.1.
Most of the samples are smooth when rubbed between fingers indicating a lower size limit for
coarse soils and is also evident on sight when moist. The soils could easily be moulded to a
firm mass when some amount of water is added indicating its cohesiveness and could deform
without severely cracking or crumbling.
Table 2.1: Detailed Soil Description by Visual Inspection
Location Borehole ID Depth (m) Physical Description
Okomu Road
Point 1 1.5 Dark reddish brown fine grained silty clay
Point 2 1.5 Reddish brown coarse grained silty clay
Point 3 1.5 Reddish brown coarse grained silty clay
Okomu Boiler BHI
1.0 Reddish brown fine grained sandy silt
3.0 Reddish brown fine grained sandy silt
6.0 Reddish brown fine grained sandy silt
9.0 Reddish brown fine grained sandy silt
12.0 Reddish brown fine grained sandy silt
15.0 Reddish brown fine grained sandy silt
Okomu Power
House
BHII
2.0 Reddish brown fine grained silty clay
5.0 Reddish brown fine grained sandy silt
8.0 Reddish brown fine grained sandy silt
11.0 Reddish brown fine grained sandy silt
15.0 Reddish brown fine grained silty clay
8

JEFFA GEOTECH
Location Borehole ID Depth (m) Physical Description
Okomu
Clarification
Station
BHIII
2.5 Reddish brown fine grained sandy silt
5.5 Reddish brown fine grained sandy silt
8.5 Reddish brown fine grained sandy silt
11.5 Reddish brown fine grained sandy silt
14.5 Reddish brown fine grained sandy silt
Okomu
Sterilizer BHIV
0.5 Reddish brown fine grained silty clay
3.5 Reddish brown fine grained sandy silt
6.5 Reddish brown fine grained silty clay
9.5 Reddish brown fine grained silty clay
12.5 Reddish brown fine grained silty sand
15.0 Reddish brown coarse grained silty sand
Okomu
Pressing
Station
BHV
1.5 Reddish brown fine grained silty clay
4.5 Reddish brown coarse grained silty clay
7.5 Reddish brown fine grained silty clay
10.5 Reddish brown fine grained silty clay
14.5 Reddish brown fine grained silty clay
Okomu
Storage Tank BHVI
1.0 Reddish brown fine grained silty clay
4.0 Reddish brown fine grained silty clay
7.0 Reddish brown fine grained silty clay
10.0 Reddish brown fine grained silty clay
13.0 Reddish brown fine grained silty clay
15.0 Reddish brown fine grained silty clay
9

JEFFA GEOTECH
Location Borehole ID Depth (m) Physical Description
Okomu Weigh
Bridge BHVII
1.0 Reddish brown fine grained sandy silt
4.0 Reddish brown fine grained sandy silt
7.0 Reddish brown fine grained sandy silt
10.0 Reddish brown fine grained sandy silt
13.0 Reddish brown fine grained sandy silt
15.0 Reddish brown fine grained silty sand
Okomu Water
Tank BHVIII
3.0 Reddish brown coarse grained silty sand
6.0 Reddish brown coarse grained silty sand
9.0 Reddish brown coarse grained silty sand
12.0 Reddish brown coarse grained silty sand
15.0 Reddish brown coarse grained silty sand
Okomu Ramp
I BHIX
2.0 Reddish brown fine grained silty clay
5.0 Reddish brown coarse grained silty sand
8.0 Reddish brown coarse grained silty sand
11.0 Reddish brown fine grained sandy silt
14.0 Reddish brown fine grained sandy silt
Okomu Ramp
II BHX
1.5 Reddish brown fine grained sandy silt
4.5 Reddish brown fine grained sandy silt
7.5 Reddish brown fine grained sandy silt
10.5 Reddish brown fine grained sandy silt
13.5 Reddish brown fine grained sandy silt
15.0 Reddish brown fine grained sandy silt
10

JEFFA GEOTECH
CHAPTER THREE
3.0 LABORATORY TESTING
All the laboratory tests were done in accordance with the general specification given in the
British standard specification BS EN 1997-1-2004 and BS EN 1997-2-2007, Geotechnics
Designs (General Rules and Ground Investigation and Testing respectively).
Disturbed samples were selected for standard laboratory classification and other tests which
included the following:
• Specific Gravity Test
• Particle Size Analysis Test
• Atterberg Limit Test
• Compaction Test
• Undrained Triaxial Test
3.1 Specific Gravity Test.
Specific gravity tests were carried out on samples recovered from specified depths of borehole.
The tests were performed as per procedures laid out in BS EN 1997-1-2004 and BS EN 1997-
2-2007, Geotechnics Designs (General Rules and Ground Investigation and testing
respectively).
The specific gravity of a soil is the ratio of the weight or mass of a volume of the material to the
weight or mass of an equal volume of water. For soils, it is specified to use one litre gas jar
fitted with a rubber bung and a mechanical shaker apparatus which rotates the jar at a constant
rate. An oven dried sample was placed into the gas jar along with some 500 ml of water. The
jar was sealed and shaken. Subsequently, following established procedures, specific gravity of
the soil can be calculated.
3.2 Particle Size Analysis
This test is to determine the percentage quantity of individual grain sizes as they occur in a
particular soil layer. British Standard Sieves (BS – Sieves) were used on the mechanical sieve
shaker to separate these grains into their various sizes. These were then weighed and their
percentage weights calculated. The result of this test is of value when used for classification
11

JEFFA GEOTECH
purposes and it enables soil groupings to be delineated and their properties inferred. Further
tests to determine the size of the grain particle was undertaken with the aid of the Hydrometer
tests. These were carried out in accordance with BS EN 1997-2-2007.
3.3 Atterberg/ Consistency Tests
Atterberg limits were determined on soil specimens with very fine particles, i.e. the clay
samples. The Atterberg limits are boundaries between the liquid limit and plastic states (Liquid
Limit, LL), and between the plastic and brittle states (Plastic Limit, PL). They are expressed as
water content, in percentage.
The liquid limit is the water content at which a part of soil placed in a standard cup and cut by
a groove of standard dimensions flow together at the base of the groove, when the cup is
subjected to 25 standard shocks. The one-point liquid test was carried out. Distilled water was
added during soil mixing to achieve the required consistency. The plastic limit is the water
content at which a soil can no longer be deformed by rolling into 3 mm diameter threads without
crumbling. The range of water contents over which a soil behaves plastically is the Plasticity
Index, Ip. This is the difference between the liquid limit and the plasticity limit (WL-WP). The
Reference test standard used for this test was BS EN 1997-2-2007.
3.4 Compaction Tests
Compaction is the process of increasing the density of a soil by packing the particles of the soil
closer together, with a reduction in the volume of air. Two parameters are usually obtained from
this test – optimum moisture content (OMC) and maximum dry density (MDD). The compaction
tests were carried out in accordance with BS EN 1997-2-2007.
3.5 Undrained Triaxial Tests
This test was used were to obtain the drained shear parameters (i.e. c’ and �’) of the sand
layers in the investigation. It involves the shearing of a cylindrical column of soil obtained in-
situ to determine its resistance to pressure. Triaxial machine is used, from where two important
parameters namely; angle of internal friction and cohesion are obtained. With these, the bearing
capacity of the soil is calculated. The test was carried out in accordance with BS 1377:75 Test
13.
12

JEFFA GEOTECH
3.6 California Bearing Ratio Test
The CBR test was conducted using the compaction energy as for compaction test. The
California Bearing Ratio test was carried out in accordance with BS EN 1997-1-2004 and BS
EN 1997-2-2007, Geotechnics Designs (General Rules and Ground Investigation and Testing
respectively).
13

JEFFA GEOTECH
CHAPTER FOUR
4.0 PRESENTATION OF RESULTS
The recovered samples from the sites were taken to the Geotechnical Engineering
Laboratory in the Civil Engineering Department of the University of Benin. The following
laboratory tests and analysis were conducted alongside the in situ cone penetrometer
test (CPT):
• Specific gravity test
• Particle size analysis
• Atterberg limit test
• Compaction
• Unconsolidated Undrained Triaxial test
4.1 Specific Gravity Test Results
The Average Specific Gravity (A.GS) values for the deep borehole (BH) are presented
in Table 4.1 and in Appendix I.
Table 4.1: Specific Gravity Test Results
S/N LOCATION BOREHOLE ID DEPTH (m) AGs
1
Okomu Road
Point 1 1.5 2.57
2 Point 2 1.5 2.55
3 Point 3 1.5 2.42
4
Okomu Boiler BHI
1.0 2.34
5 3.0 2.46
6 6.0 2.50
7 9.0 2.44
8 12.0 2.52
9 15.0 2.43
14

JEFFA GEOTECH
S/N LOCATION BOREHOLE ID DEPTH (m) AGs
10
Okomu Power
House BHII
2.0 2.47
11 5.0 2.56
12 8.0 2.43
13 11.0 2.50
14 15.0 2.47
15
Okomu
Clarification
Station
BHIII
2.5 2.44
16 5.5 2.51
17 8.5 2.42
18 11.5 2.44
19 14.5 2.36
20
Okomu Sterilizer BHIV
0.5 2.38
21 3.5 2.30
22 6.5 2.30
23 9.5 2.11
24 12.5 2.21
25 15.0 2.23
26
Okomu Pressing
Station BHV
1.5 2.28
27 4.5 2.24
28 7.5 2.28
29 10.5 2.34
30 14.5 2.51
31 BHVI 1.0 2.47
15

JEFFA GEOTECH
S/N LOCATION BOREHOLE ID DEPTH (m) AGs
32 Okomu Storage
Tank
BHVI
4.0 2.47
33 7.0 2.35
34 10.0 2.17
35 13.0 2.42
36 15.0 2.28
37
Okomu Weigh
Bridge BHVII
1.0 2.40
38 4.0 2.44
39 7.0 2.19
40 10.0 2.23
41 13.0 2.18
42 15.0 2.25
43
Okomu Water
Tank BHVIII
3.0 2.22
44 6.0 2.49
45 9.0 2.47
46 12.0 2.50
47 15.0 2.46
48
Okomu Ramp I BHIX
2.0 2.31
49 5.0 2.33
50 8.0 2.36
51 11.0 2.37
52 14.0 2.37
53 Okomu Ramp II BHX 1.5 2.24
16

JEFFA GEOTECH
S/N LOCATION BOREHOLE ID DEPTH (m) AGs
54
Okomu Ramp II BHX
4.5 2.52
55 7.5 2.35
56 10.5 2.36
57 13.5 2.42
58 15.0 2.42
4.2 Particle Size Distribution Tests Results
The tests were conducted to determine the percentage quantity of individual grain sizes
as they occur in particular soil layers. The test results are presented in Table 4.2 and
Appendix II. Mechanical sieving was carried out up to 0.075mm sieve.
Table 4.2: Sieve Analysis Test Results
S/N LOCATION BOREHOLE ID DEPTH(m) PERCENTAGE PASSING
SIEVE NO.
1.18mm 0.425mm 0.075mm
1
Okomu Road
Point 1 1.5 99.24 78.00 44.12
2 Point 2 1.5 98.50 82.00 60.52
3 Point 3 1.5 97.97 81.00 57.64
4
Okomu Boiler BHI
1.0 97.89 72.85 47.75
5 3.0 98.37 82.60 63.31
6 6.0 98.22 83.53 60.40
7 9.0 97.71 81.64 56.69
8 12.0 98.43 86.63 64.66
9 15.0 98.29 92.29 67.98
17

JEFFA GEOTECH
S/N LOCATION BOREHOLE ID DEPTH(m) PERCENTAGE PASSING
SIEVE NO.
1.18mm 0.425mm 0.075mm
10
Okomu Power
House BHII
2.0 98.49 79.35 55.91
11 5.0 98.11 81.60 58.98
12 8.0 98.58 85.17 63.56
13 11.0 98.24 85.05 63.50
14 15.0 98.40 85.21 62.82
15
Okomu
Clarification
Station
BHIII
2.5 97.88 79.23 54.02
16 5.5 98.42 84.54 61.61
17 8.5 98.22 83.22 53.89
18 11.5 98.08 82.46 56.82
19 14.5 98.13 83.00 56.21
20
Okomu Sterilizer BHIV
0.5 98.64 75.15 43.64
21 3.5 97.94 78.50 53.02
22 6.5 97.99 80.74 55.49
23 9.5 97.74 80.85 52.77
24 12.5 98.02 81.71 53.43
25 15.0 98.29 81.61 57.31
26 Okomu Pressing
Station
BHV
1.5 98.78 78.34 48.57
27 4.5 98.11 83.33 61.53
28 7.5 97.48 81.56 50.86
29 10.5 98.08 83.62 53.97
18

JEFFA GEOTECH
S/N LOCATION BOREHOLE ID DEPTH(m) PERCENTAGE PASSING
SIEVE NO.
1.18mm 0.425mm 0.075mm
30 14.5 97.43 79.25 49.12
31
Okomu Storage
Tank BHVI
1.0 98.28 79.23 51.11
32 4.0 97.91 81.69 55.45
33 7.0 98.03 82.39 54.61
34 10.0 97.08 77.91 49.07
35 13.0 98.38 84.54 60.22
36 15.0 98.05 84.11 58.56
37
Okomu Weigh
Bridge BHVII
1.0 98.51 80.57 54.55
38 4.0 98.50 85.03 64.05
39 7.0 95.51 80.57 54.55
40 10.0 97.65 81.40 52.78
41 13.0 98.29 83.44 59.45
42 15.0 98.20 84.12 57.55
43
Okomu Water
Tank BHVIII
3.0 97.68 78.90 51.92
44 6.0 97.35 79.06 53.39
45 9.0 98.27 83.99 55.83
46 12.0 98.51 83.18 57.53
47 15.0 97.97 82.64 60.51
48 Okomu Ramp I BHIX
2.0 98.43 76.66 47.32
49 5.0 98.69 73.77 40.11
19

JEFFA GEOTECH
S/N LOCATION BOREHOLE ID DEPTH(m) PERCENTAGE PASSING
SIEVE NO.
1.18mm 0.425mm 0.075mm
50
Okomu Ramp I BHIX
8.0 98.60 76.55 49.19
51 11.0 97.49 75.05 47.17
52 14.0 97.30 73.20 48.95
53
Okomu Ramp II BHX
1.5 98.97 80.96 51.98
54 4.5 98.67 69.82 35.01
55 7.5 98.34 73.89 43.18
56 10.5 97.88 76.93 55.73
57 13.5 98.17 78.08 52.83
58 15.0 98.29 78.27 47.49
4.3 Atterberg/Consistency Limits Test Results
The tests carried out under this heading includes Liquid Limit (LL), Plastic Limit (PL),
Plasticity Index (PI) and Linear shrinkage (LS), all of which make up the Atterberg Limit
test. The results of these tests are presented in Table 4.3 and Appendix III.
20

JEFFA GEOTECH
Table 4.3: Atterberg Limit Test Results
LOCATION BOREHOLE
ID DEPTH
(m)
ATTERBERG LIMIT TESTS
LL (%) PL (%) PI (%) PLASTICITY
Okomu Road
Point 1 1.5 36.46 22.03 16.43 CI
Point 2 1.5 56.85 28.61 28.25 CH
Point 3 1.5 52.88 27.77 25.12 CH
Okomu Boiler BHI
1.0 50.15 27.44 22.71 MH
3.0 52.13 27.79 24.33 MH
6.0 49.32 25.47 23.85 MH
9.0 54.48 28.48 25.66 MH
12.0 52.48 29.94 22.54 MH
15.0 54.19 25.86 28.33 MH
Okomu Power
House BHII
2.0 49.29 23.37 25.92 CI
5.0 48.97 27.80 21.17 MI
8.0 53.43 28.16 25.27 MH
11.0 50.65 27.78 22.86 MH
15.0 45.23 25.69 22.54 CI
Okomu
Clarification
Station
BHIII
2.5 47.28 27.97 20.31 MI
5.5 53.87 27.02 26.85 MH
8.5 51.06 27.24 23.82 MH
11.5 51.85 27.22 24.64 MH
14.5 52.51 30.23 22.27 MH
21

JEFFA GEOTECH
Okomu Sterilizer
BHIV
0.5 45.34 24.55 20.80 CI
3.5 29.50 27.03 2.47 ML
9.5 53.35 27.22 26.13 CH
12.5 45.34 24.55 20.80 CI
Okomu Pressing
Station
BHV
7.5
53.32 26.85 26.46 CH
14.5 51.30 28.67 22.63 MH
Okomu Storage
Tank BHVI 10.0 54.13 25.74 28.39
CH
Okomu Weigh Bridge
BHVII
7.0 52.37 28.09 24.30 MH
15.0 54.79 29.11 25.69 MH
Okomu Water
Tank
BHVIII
6.0 50.87 30.87 20.28 MH
9.0 49.79 26.38 23.41 CI
12.0 51.21 27.97 23.24 MH
15.0 51.41 26.16 25.26 MH
Okomu Ramp I
BHIX
2.0 54.63 27.44 27.19 CH
5.0 56.70 31.28 25.43 MH
8.0 56.17 28.50 27.67 MH
11.0 48.41 27.23 21.18 MI
22

JEFFA GEOTECH
C=CLAY, M= SILT (M-SOIL), I= INTERMEDIATE PLASTICITY, L= LOW PLASTICITY, H=HIGH PLASTICITY
4.4 Compaction Tests Results
Compaction tests is used to determine the density beyond which any increment in water
content will not have effect on the strength of the soil. From the test, the optimum
moisture content and maximum dry densities were obtained as shown below in Table
4.4 and Appendix IV for the samples that were tested.
Table 4.4: Compaction Test Results
LOCATION BOREHOLE ID DEPTH (m) MDD (g/cm3) OMC (%)
Okomu Road
Point 1 1.5 1.74 13.40
Point 2 1.5 1.51 21.90
Point 3 1.5 1.47 25.30
Okomu Boiler BHI
1.0 1.51 22.50
3.0 1.48 24.0
6.0 1.50 23.40
9.0 1.48 20.60
12.0 1.44 24.70
15.0 1.48 23.40
Okomu Ramp II BHX
1.5 48.14 28.19 19.95 MI
7.5 49.50 28.46 21.04 MI
10.5 48.85 27.23 21.63 MI
13.5 55.34 25.62 29.73 MH
23

JEFFA GEOTECH
LOCATION BOREHOLE ID DEPTH (m) MDD (g/cm3) OMC (%)
Okomu Power
House BHII
2.0 1.47 20.60
5.0 1.49 20.10
8.0 1.49 19.40
11.0 1.53 24.30
15.0 1.44 24.80
Okomu
Clarification
Station
BHIII
2.5 1.51 22.30
5.5 1.52 22.30
8.5 1.58 22.30
11.5 1.49 21.90
14.5 1.51 22.60
Okomu
Sterilizer BHIV
0.5 1.58 18.90
3.5 1.48 21.70
6.5 1.61 18.90
9.5 1.50 21.60
12.5 1.55 21.40
15.0 1.51 21.20
Okomu
Pressing
Station
BHV
1.5 1.56 19.20
4.5 1.47 21.60
7.5 1.55 21.40
10.5 1.52 23.50
14.5 1.58 22.00
24

JEFFA GEOTECH
LOCATION BOREHOLE ID DEPTH (m) MDD (g/cm3) OMC (%)
Okomu
Storage Tank
BHVI
1.0 1.47 19.60
4.0 1.48 20.80
7.0 1.50 21.20
10.0 1.51 24.90
13.0 1.49 21.90
15.0 1.58 21.80
Okomu Weigh
Bridge BHVII
1.0 1.50 20.00
4.0 1.52 23.50
7.0 1.49 22.30
10.0 1.46 24.70
13.0 1.46 25.30
15.0 1.55 23.40
Okomu Water
Tank BHVIII
3.0 1.48 26.40
6.0 1.48 26.40
9.0 1.49 23.20
12.0 1.48 21.70
15.0 1.58 21.80
Okomu Ramp
I BHIX
2.0 1.57 19.20
5.0 1.68 16.50
8.0 1.52 19.9
25

JEFFA GEOTECH
LOCATION BOREHOLE ID DEPTH (m) MDD (g/cm3) OMC (%)
11.0 1.54 17.80
14.0 1.51 21.60
Okomu Ramp
II BHX
1.5 1.58 18.70
4.5 1.73 15.00
7.5 1.65 17.90
10.5 1.54 18.90
13.5 1.62 19.30
15.0 1.56 20.50
4.5 Undrained Triaxial Tests Results
The results obtained from Undrained Triaxial Test performed on U2 soil samples recovered
from specific depths are presented in Table 4.5 and Appendix V.
Table 4.5: Shear Strength Test Results
Location Borehole ID Depth(m) Φ' (°) C' (KN/m2)
Okomu Boiler BH1
3.0 4.00 11.0
6.0 10.68 37.0
9.0 6.73 29.0
15.0 5.88 38.0
Okomu Power
House
BH2
2.0 12.68 12.0
5.0 6.66 58.0
15.0 9.93 17.0
26

JEFFA GEOTECH
Location Borehole ID Depth(m) Φ' (°) C' (KN/m2)
Okomu
Clarification
Station
BH3
2.5 12.48 46.0
8.5 11.49 38.0
14.5 10.36 37.0
Okomu Sterilizer BH4
0.5 6.46 18.0
6.5 7.57 15.0
12.5 6.16 5.0
Okomu Pressing
Station
BH5
7.5 15.64 9.0
10.5 11.62 18.0
14.5 10.28 5.0
Okomu Storage
Tank BH6
1.0 13.71 3.0
7.0 6.22 22.5
15.5 3.43 46.0
Okomu Weigh
Bridge BH7
4.0 7.97 15.0
13.0 3.94 24.0
15.0 22.64 13.0
Okomu Water
Tank BH8
3.0 12.64 45.0
9.0 5.94 45.0
12.0 5.0 11.43
Okomu Ramp I BH9
2.0 20.34 20.0
8.0 9.15 4.0
11.0 9.29 35.0
27

JEFFA GEOTECH
Location Borehole ID Depth(m) Φ' (°) C' (KN/m2)
Okomu Ramp II BH10
1.5 7.93 15.50
7.5 3.61 24.0
13.5 10.20 50.0
4.6 Bearing Capacity Computation Using Parameters from Undrained Triaxial Test:
The ultimate bearing capacity was calculated for a 1m square pad footing using Meyerhof’s
equations as shown below:
���� � ��� � ������ � 0.5 ������ (1)
�� � exp�� tan∅� !"#�45° � ∅2�
(2)
� � ��� ' 1� cot ∅ (3)
�� � ��� ' 1� tan�1.4∅� (4)
� 1 � 0.2+,�/. (5)
� � � � 1 � 0.1+,�/. (6)
� � 1 � 0.2/+,�/� (7)
�� � �� � 1 � 0.1/+,�/� (8)
+, � !"#�45 � ∅/2� (9)
Where
qult = Ultimate bearing capacity
c = Cohesion
Φ = Angle of internal friction
Nc, Nq, NƳ = Bearing capacity factors
sc, sq, sƳ = Shape correction factors
dc, dq, dƳ = Depth correction factors
28

JEFFA GEOTECH
Table 4.6 shows the allowable bearing capacity computed at various depths using a factor of
safety of 3.5, which is suitable for light industrial projects.
Table 4.6: Computed allowable bearing capacities at various depths
Location Borehole ID Depth (m)
Ultimate bearing
capacity (q,ult)
kN/m2
Allowable bearing
capacity (q,all) kN/m2
Okomu
Boiler
BH1
3.0 252 72
9.0 1453 415
15.0 1579 451
Okomu
Power
House
BH2
2.0 402 115
5.0 1376 393
15.0 2948 842
Okomu
Clarification
Station
BH3
2.5 1153 329
8.5 2403 687
14.5 3915 1119
Okomu
Sterilizer BH4
0.5 195 56
6.5 805 230
12.5 1218 348
Okomu
Pressing
Station
BH5
7.5 1758 502
10.5 2202 629
14.5 2326 665
29

JEFFA GEOTECH
4.6 Dutch Cone Penetrometer Test Results
Cone penetrometer test was carried out at three (3) points. The cone penetration resistance
(qc) obtained at specific depths for the three points are shown in Table 4.7. The complete results
are shown in Appendix VI.
Several correlations have been drawn to relate ultimate bearing capacity to cone penetration
resistance. Meyerhof (1976) suggested a direct method for estimating qult from cone
resistance as follows:
Okomu
Storage
Tank
BH6
1.0 143 41
7.0 939 268
15.5 2575 736
Okomu
Weight
Bridge
BH7
4.0 500 143
15.0 6284 1795
Okomu
Storage
Tank
BH8
3.0 1274 364
9.0 1764 504
12.0 1882 538
Okomu
Ramp I BH9
8.0 849 243
11.0 2495 713
Okomu
Ramp II BH10
1.5 273 78
7.5 839 240
13.5 4132 1181
30

JEFFA GEOTECH
���� � �0 1 �12.22 11 � �3
� 2 (10)
Where
q,ult = Ultimate bearing capacity in kN/m2
q̅c = Arithmetic average of qc values in a zone including footing base and 1.5B beneath
footing, in kN/m2
B = Width of footing, in m
Df = Depth of footing, in m
The computed allowable bearing capacities for the specific depths shown in Table 4.7 are
presented in Table 4.8, for a 1m square footing. It should be noted that depth was not
corrected for, and that a factor of safety of 3.5 was used in the calculations.
Table 4.6: Cone resistance obtained at specific depths for points 1, 2 and 3
Depth (m) CPT1 (kg/cm2) CPT2 (kg/cm2) CPT3 (kg/cm2)
1.0 25.0 65.0 47.0
2.0 50.0 200.0 65.0
3.0 55.0 220.0 68.0
4.0 64.0 205.0 70.0
5.0 83.0 220.0 75.0
6.0 110.0 250.0 92.0
7.0 130.0 - 105.0
8.0 150.0 - 135.0
9.0 175.0 - 180.0
10.0 200.0 - 220.0
11.0 230.0 - -
31

JEFFA GEOTECH
Table 4.8a: Bearing capacity computation from CPT from test point 1
Depth (m) Ave. qc(MN/m2) qult (kN/m2) qall (kN/m2)
1.0 2.45 402.05 114.87
2.0 4.91 1206.15 344.61
3.0 5.39 1769.00 505.43
4.0 6.28 2573.12 735.18
5.0 8.14 4004.41 1144.12
6.0 10.79 6191.56 1769.02
7.0 12.75 8362.62 2389.32
8.0 14.72 10855.33 3101.52
9.0 17.17 14071.72 4020.49
10.0 19.62 17690.16 5054.33
Table 4.8b: Bearing capacity computation from CPT from test point 2
Depth (m) Ave. qc (MN/m2) qult (kg/cm2) qall (kN/m2)
1.0 6.38 1045.33 298.67
2.0 19.62 4824.59 1378.45
3.0 21.58 7076.07 2021.73
4.0 20.11 8242.01 2354.86
5.0 21.58 10614.10 3032.60
6.0 24.53 14071.72 4020.49
32

JEFFA GEOTECH
Table 4.8c: Bearing capacity computation from CPT from test point 3
Depth (m) Ave. qc (MN/m2) qult (kg/cm2) qall (kN/m2)
1.0 4.61 755.85 215.96
2.0 6.38 1567.99 447.99
3.0 6.67 2187.15 624.89
4.0 6.87 2814.34 804.09
5.0 7.36 3618.44 1033.84
6.0 9.03 5178.39 1479.54
7.0 10.30 6754.43 1929.84
8.0 13.24 9769.79 2791.37
9.0 17.66 14473.77 4135.36
10.0 21.58 19459.18 5559.77
4.7 CALIFORNIA BEARING RATIO TEST RESULT
The California Bearing Ratio test is a depth penetration test for determining the mechanical
strength of subgrade beneath new carriageway construction. The CBR test is described in
ASTM Standards D1883-05 (for soils place in field), and AASTO T193. The CBR Test is fully
described in BS 1377: Soils for civil engineering purposes: Part 4, compaction related tests,
and in Part 9: Insitu tests. The California bearing ratio test results for samples tested are
presented in Table 4.9 below and Appendix VI.
33

JEFFA GEOTECH
Table 4.9: CBR Tests Results
S/N LOCATION SAMPLING DEPTH
PRESSURE LAYER
UNSOAKED SOAKED
2.5mm 5.0mm 2.5mm 5.0mm
1 POINT 1
0.5m BOTTOM 8.67 8.06 6.44 5.86
TOP 6.69 6.90 5.53 5.86
2 POINT 2
0.5m BOTTOM 12.30 10.96 7.52 8.88
TOP 11.81 11.07 7.59 8.49
3 POINT 3
0.5m BOTTOM 8.84 10.47 8.59 8.49
TOP 10.24 10.79 5.45 8.27
34

JEFFA GEOTECH
CHAPTER FIVE
5.0 DISCUSSION
5.1 General Discussion of Index Properties and Soil Classification
Geotechnical investigation to understand the subsurface at the proposed location showed that
the site passed most of the criteria that characterises a suitable soil for Civil Engineering
construction.
1. Specific Gravity
The specific gravity results from the boreholes presented in Table 4.1 ranged from 2.34 to 2.52
for borehole 1, 2.47 to 2.56 for borehole 2, 2.36 to 2.51 for borehole 3, 2.11 to 2.38 for borehole
4, 2.28 to 2.51 for borehole 5, 2.17 to 2.47 borehole 6, 2.18 to 2.44 for borehole 7, 2.22 to 2.50
for borehole 8, 2.31 to 2.37 for borehole 9 and 2.24 to 2.52 for borehole 10 while the road points
have specific gravity values ranging from 2.42 to 2.57. The highest specific value of 2.57 was
recorded in road point 1, 1.5m .These results obtained from the specific gravity tests indeed
show the suitability of the soils as a construction material especially as subgrade materials with
respect to the road points.
2. Particle Size Distribution
Particle size distribution tests carried out on the Auger Samples showed that the soils have
many similarities irrespective of depth. The range of the soil passing the 0.075 mm sieve for
borehole I is , borehole II IS 55.91% to 63.56%, borehole III IS 53.89% to 61.61% , borehole IV
is 43.64% to 55.49%, borehole V is 48.57% to 61.53% , borehole VI is 49.07% to 60.22%,
borehole VII is 52.78% to 64.05 , borehole VIII is 51.92% to 60.51% , borehole IX is , borehole
X is 47.49% to 53.77% .For the road points: point I, point II and point III have maximum of
44.92%, 60.52% and 57.64% passing through 0.075 mm sieve. This indicates that the soils
contain both fines and sands. According to the American Association of State Highway and
Transportation Officials (AASHTO), these soils can be classified as A-7-6.
35

JEFFA GEOTECH
3. Consistency Limit Tests
The extent of fine material in the soil mix was also ascertained using the consistency or
Atterberg limit tests. The results obtained showed that the soils from all the boreholes ranges
within intermediate to high plasticity silty clay/ sandy silty soil with a maximum plasticity index
of 29.73% and liquid limit of 56.85%.
4. Compaction Tests
The maximum dry density (MDD) and optimal moisture content (OMC) values which are used
to determine the dry unit weight of the soil were obtained from the standard proctor compaction
tests carried out on recovered soil samples from specific depths for all the borehole locations.
The results show that the range of maximum dry density and optimum moisture content values
for road points is 1.47 g/cm3 to 1.74 g/cm3 and 13.40% to 25.30% , borehole 1 is 1.44 g/cm3
to 1.51 g/cm3 and 20.60% to 24.70%, borehole 2 is 1.44 g/cm3 to 1.49 g/cm3 and 19.40% to
24.80%, borehole 3 is 1.49 g/cm3 to 1.58 g/cm3 and 21.90% to 22.60 %, borehole 4 is 1.48
g/cm3 to 1.58 g/cm3 and 18.90% to 21.70%, borehole 5 is 1.47 g/cm3 to 1.58 g/cm3 and 19.20%
to 23.50%, borehole 6 is 1.47 g/cm3 to 1.58 g/cm3 and 19.60% to 24.90%, borehole 7 is 1.46
g/cm3 to 1.55 g/cm3 and 20.00% to 25.30%, borehole 8 is 1.48 g/cm3 to 1.58 g/cm3 and 21.70%
to 26.40%, borehole 9 is 1.51 g/cm3 to 1.68 g/cm3 and 16.50% to 21.60% while borehole 10
maximum dry density values range from 1.54 g/cm3 to 1.65 g/cm3 with optimum moisture
content values from 15.0% to 20.50%. Their compaction curves are typical for sandy silt soils
and silty clay soils with high plasticity clay as obtained in literature.
5.2 General Discussion of Strength Results
The allowable bearing capacity of the soil was determined using shear parameters obtained
from laboratory triaxial tests and cone penetration resistance obtained from in situ cone
penetrometer test (CPT), both of which are shown in Tables 4.6 and 4.8a - 4.8c respectively. It
should be noted that the calculations were done assuming a 1m x 1m square footing and a
factor of safety of 3.5. In the foundation analysis and design, actual sizes of footings should be
used alongside the shear parameters to obtain the adequate bearing capacity.
36

JEFFA GEOTECH
Comparing the allowable bearing capacities shown in Table 4.6 to those in Table 4.8a – 4.8c,
it can be seen that both agree to certain levels. However, the values obtained via calculation
using the shear parameters obtained from laboratory tests appear to be more conservative and
should therefore be used in the foundation analysis and design. In general, the results of the
bearing capacity showed that the soil is relatively firm and high strength foundation can be
obtained with a minimum bearing capacity of 110 kN/m2 at depth 2.0m and factor of safety of
3.5 employed.
5.3 California Bearing Ratio Results
The result of California Bearing Ratio (CBR) test revealed that the sub-surface strength varies
along the road as could be seen in Table 6.1. These should be further checked with moving
load of vehicles that will ply this route for adequacy as subgrade material.
It was observed that both the unsoaked CBR values and the soaked CBR values were less
than 15%, although the unsoaked CBR values recorded higher values than the soaked CBR
values. The soaked CBR values were used in this analysis of which the highest value was taken
as the CBR value for each chainage. Table 5.1 shows the minimum value of soaked CBR for
various road pavement layer. For a subgrade layer, the minimum is between 5 – 11% which is
the focal point of this report (see Table 5.1). Any value found below this range will be subject
to capping or subgrade treatment. Recommendations for capping and sub-base layer have
been presented in Table 6.1. This fill material should be appropriately compacted by roller
compactor after spreading.
37

JEFFA GEOTECH
CHAPTER SIX
6.0 CONCLUSION AND RECOMMENDATION
6.1 CONCLUSION
From the results and analysis, it was observed that the location for the proposed school is
comprised mainly of both fines and sands with high to low plasticity. According to AASHTO and
USSC soil classification systems, the soil was classed as A-7-6. This shows that the soil
consists of both fines and sands, having low to high degree of plasticity.
In terms of strength, the allowable bearing capacity calculated using shear parameters obtained
from laboratory triaxial tests revealed that the soil possesses great potential for an economic
foundation.
6.2 RECOMMENDATIONS
From the analysis, it is evident that the location can provide economic foundation for most
infrastructures, including the school that will be built on the site. Though bearing capacity
computations from CPT showed that the bearing pressure at depth 2.0 to 6m is higher than
200kN/m2, the value of 110kN/m2 should be used as the design bearing pressure. With
adequate scarification and compaction, the whole of the site will be put to good use
construction-wise.
6.2. 1 Subgrade Treatment
In exceptional circumstances where the CBR value falls below 2%, a value below which the
subgrade would deform under construction traffic, there are several options open to the
designer:
The material can be removed and replaced with a more suitable material. The thickness
replaced should be between 0.5m and 1.0m. Irrespective of the quality of the new material a
CBR value of just below 2% should be assumed for the subgrade.
With these soils having cohesive properties, it may be possible to treat the soils using lime. The
sub-base and capping is again designed assuming a subgrade CBR of just below 2%.
38

JEFFA GEOTECH
For subgrades with CBR values of 15% and above, the sub-base should have a standard
thickness of 150mm, a value determined as the minimum practical for spreading and
compaction. This is in accordance with the Design Manual for Roads And Bridges, HD 23/99,
Road Note RD/GN/ 042 (Pavement Design for Carriageway Construction), Federal ministry of
works, Highway manual and the AASHTO 1993 (Design of Pavement Structures). This is
summarised in Table 6.1 for the chainages tested. For subgrade of elastic modulus below 50
MPa or 5% CBR, strengthening measures are required in order to provide a strong and uniform
support for the pavement and to allow road construction vehicles to pass over the subgrade
without damaging the layer. This can be achieved by providing a thick layer of sub-base on the
subgrade but it may be more economical to provide a capping layer of selected materials. The
provision of a capping layer over a weak subgrade avoids the necessity of an extraordinarily
thick sub-base, and provides an adequate working platform for sub-base compaction as well
as reduces the risk of damage to the subgrade during construction. The CBR value of the
capping layer shall be of at least 15%.
The recommended thicknesses of the capping layer for various CBR values of subgrade for
flexible and rigid pavements are shown in Table 6.1. The capping layer can be specified as
granular fill material in accordance with Section 6 of the General Specification for Civil
Engineering Works.
6.2.2 Sub - Base
Sub-base shall be specified as granular material in accordance with Section 9 of the General
Specification for Civil Engineering Works. Lean concrete is generally not recommended for sub-
base application. For flexible pavements, localised shrinkage cracks developed in the lean
concrete sub-base would likely propagate upwards through the bituminous surfacing causing
reflective cracking at the pavement surface, which reduces the service life of pavement. For
rigid pavements, the high rigidity and flexural strength of concrete itself contribute to most of
the load bearing function, resulting in very small deflections and pressures induced by vehicular
loading on the sub-layers. The purpose of sub-base on rigid pavements is primarily for
controlling pumping, which can be achieved by using granular materials.
39

JEFFA GEOTECH
The thickness of the sub-base layer is determined primarily from the strength of the subgrade,
i.e. the CBR value. The recommended thicknesses and type of sub-base for flexible and rigid
pavements are shown in Table 6.1.
Table 6.1: Subgrade strength class and recommended minimum thickness for capping and granular sub-base
LOCATION DEPTH OF
SAMPLING
(m)
PI (%) CBR % CAPPING
LAYER
(mm)
GRANULAR
SUB-BASE
LAYER (mm)
SUBGRADE
STRENGTH
CLASS
POINT 1 1.5 16.43 6.44 N/A 200 S3
POINT 2 1.5 28.25 8.88 N/A 200 S4
POINT 3 1.5 25.12 8.59 N/A 200 S4
40

JEFFA GEOTECH
REFERENCES
1. British Standards Institution, ‘Code of Practice for Site Investigations’, BS5930.
London, 1981
2. British Standards Institution, ‘British Standards Methods of Test for Soil for Civil
Engineering Purposes’, BS1377, London, 1990.
3. British Standards Institution, ‘Code of Practice for Foundation’, BS8004, London, 1986.
4. Federal Ministry of Works and Housing, ‘General Specification for Roads and Bridges’,
1994
5. G. N. Smith and Ian G. N Smith ‘Elements of Soil Mechanics’, 7th Edition. Blackwell
Science, USA, 1998.
6. International Standards Organization, ‘Geotechnical Investigation And Testing –
Identification And Classification Of Soil – Rent 1: Identification And Description’,
ISO14688-1. 2002.
7. J. E Boyles, ‘Physical and Geotechnical Properties of Soils’ Second Edition. McGraw-
Hill International Book Company, Japan. 1981.
8. J. E. Bowles, ‘Foundation Analysis’, 4th Edition, McGraw-Hill International Book
Company, Japan, 1988.
9. Kaufman, A. A., & Hoekstra, P. (2001). Electromagnetic soundings. Amsterdam:
Elsevier Science B.V.
10. R. F. Craig, ‘Craig’s Soil Mechanics’, 7th Edition, Spon Press, Taylor & Francis Group,
London, 2005.
11. Roberge, P.R. (2007). Corrosion Inspection and Monitoring. John Wiley & Sons Inc.,
New Jersey, 2007.
41

JEFFA GEOTECH
APPENDICES
42

JEFFA GEOTECH
APPENDIX I
43

LOCATION
BHI
S/N LOCATION DEPTH BN B+W B+S+W B+S B Ad. W WWAS WS WOWDS Gs AGs
RA 76.82 91.89 48.04 23.18 53.64 43.85 24.86 9.79 2.54
TT 73.50 88.24 44.98 21.07 52.43 43.26 23.91 9.17 2.61
EI 76.62 90.05 44.29 22.26 54.36 45.76 22.03 8.60 2.56
TN 74.84 89.53 44.30 20.02 54.82 45.23 24.28 9.59 2.53
TT 73.40 88.20 46.50 21.00 52.40 41.70 25.50 10.70 2.38
RA 76.70 91.80 48.70 23.30 53.40 43.10 25.40 10.30 2.47
RK 77.10 92.50 47.90 20.70 56.40 44.60 27.20 11.80 2.31
MO 74.80 90.10 48.60 22.10 52.70 41.50 26.50 11.20 2.37
FO 74.71 89.49 47.77 22.74 51.97 41.72 25.03 10.25 2.44
EJ 77.13 92.86 48.86 22.55 54.58 44.00 26.31 10.58 2.49
MI 73.93 90.52 48.27 20.65 53.28 42.25 27.62 11.03 2.50
RP 76.18 91.39 48.01 22.67 53.51 43.38 25.34 10.13 2.50
RW 76.30 94.60 51.60 21.00 55.30 43.00 30.60 12.30 2.49
RD 73.00 91.30 50.50 19.00 54.00 40.80 31.50 13.20 2.39
I3I4 37.19 45.50 24.74 10.95 26.24 20.76 13.79 5.48 2.52
UB 37.49 44.77 24.09 12.06 25.43 20.68 12.03 4.75 2.53
TO 74.21 87.59 44.27 21.65 52.56 43.32 22.62 9.24 2.45
RW 76.26 92.05 47.80 20.88 55.38 44.25 26.92 11.13 2.42
VP 75.85 91.57 48.38 22.01 53.84 43.19 26.37 10.65 2.48
EF 77.56 93.60 48.31 21.26 56.30 45.29 27.05 11.01 2.46
TQ 75.75 91.78 47.82 21.56 54.19 43.96 26.26 10.23 2.57
RD 73.53 89.97 46.08 19.01 54.52 43.89 27.07 10.63 2.55
RL 75.73 91.44 48.10 21.48 54.25 43.34 26.62 10.91 2.44
RV 75.33 88.82 45.46 22.50 52.83 43.36 22.96 9.47 2.42
EB 73.65 88.05 44.66 20.77 52.88 43.39 23.89 9.49 2.52
RK 77.47 91.86 44.91 20.87 56.60 46.95 24.04 9.65 2.49
RQ 75.34 88.85 45.14 22.30 53.04 43.71 22.84 9.33 2.45
RD 75.93 91.93 48.61 21.85 54.08 43.32 26.76 10.76 2.49
EB 73.50 88.90 47.20 20.80 52.70 41.70 26.40 11.00 2.40
QJ 76.60 92.40 48.50 22.00 54.60 43.90 26.50 10.70 2.48
QJ 76.73 92.63 48.55 22.06 54.67 44.08 26.49 10.59 2.50
MO 74.91 88.31 44.29 22.08 52.83 44.02 22.21 8.81 2.52
VH 67.92 85.53 48.22 17.20 50.72 37.31 31.02 13.41 2.31
VE 74.00 86.45 43.41 22.80 51.20 43.04 20.61 8.16 2.53
IZ 38.00 47.86 28.22 11.40 26.60 19.64 16.82 6.96 2.42
VR 38.26 47.49 28.76 13.20 25.06 18.73 15.56 6.33 2.46
RL 75.60 93.40 52.50 21.40 54.20 40.90 31.10 13.30 2.34
RV 75.40 92.60 52.00 22.40 53.00 40.60 29.60 12.40 2.39
VW 70.61 86.80 47.40 19.60 51.01 39.40 27.80 11.61 2.39
JO4 69.65 84.30 45.70 20.30 49.35 38.60 25.40 10.75 2.36
UP 66.00 82.80 44.70 14.80 51.20 38.10 29.90 13.10 2.28
MB 68.55 86.60 49.40 17.70 50.85 37.20 31.70 13.65 2.32
VZ 73.89 88.60 49.20 23.10 50.79 39.40 26.10 11.39 2.29
GS 68.44 85.10 48.70 19.30 49.14 36.40 29.40 12.74 2.31
I9Z0 39.00 47.70 28.30 11.50 27.50 19.40 16.80 8.10 2.07
S6 39.62 48.10 28.70 12.80 26.82 19.40 15.90 7.42 2.14
GC 67.80 82.50 44.70 18.00 49.80 37.80 26.70 12.00 2.23
PH 70.34 86.00 49.40 20.60 49.74 36.60 28.80 13.14 2.19
III2 39.09 46.50 26.70 12.70 26.39 19.80 14.00 6.59 2.12
7B 39.10 47.60 26.50 11.60 27.50 21.10 14.90 6.40 2.33
Q8 45.20 56.50 34.80 14.50 30.70 21.70 20.30 9.00 2.26
Q1 48.70 60.50 39.10 18.20 30.50 21.40 20.90 9.10 2.30
MZ 71.64 84.60 44.10 20.90 50.74 40.50 23.20 10.24 2.27
GP 68.67 80.80 41.00 18.80 49.87 39.80 22.20 10.07 2.20
DA 73.06 86.90 46.50 22.30 50.76 40.40 24.20 10.36 2.34
ZIZZ 69.20 84.70 47.70 19.60 49.60 37.00 28.10 12.60 2.23
EI 76.60 94.10 53.10 22.30 54.30 41.00 30.80 13.30 2.32
EJ 77.30 93.50 50.50 22.40 54.90 43.00 28.10 11.90 2.36
Q5 47.20 54.50 28.70 16.50 30.70 25.80 12.20 4.90 2.49
Q7 45.40 54.10 31.50 17.10 28.30 22.60 14.40 5.70 2.53
JQ 75.52 89.30 44.70 21.60 53.92 44.60 23.10 9.32 2.48
RD 75.70 90.90 47.30 21.70 54.00 43.60 25.60 10.40 2.46
EF 77.40 91.50 44.40 21.30 56.10 47.10 23.10 9.00 2.57
VP 75.26 89.00 45.70 22.00 53.26 43.30 23.70 9.96 2.38
IZ 38.10 46.50 25.80 11.30 26.80 20.70 14.50 6.10 2.38
UR 38.50 45.40 25.30 13.20 25.30 20.10 12.10 5.20 2.33
RQ 75.20 92.00 54.00 22.40 52.80 38.00 31.60 14.80 2.14
TN 74.80 92.80 52.90 20.00 54.80 39.90 32.90 14.90 2.21
I3I4 69.12 82.20 42.90 20.50 48.62 39.30 22.40 9.32 2.40
C 68.72 82.60 42.70 19.10 49.62 39.90 23.60 9.72 2.43
EE 77.80 92.70 49.70 22.90 54.90 43.00 26.80 11.90 2.25
TZ 77.20 93.00 48.80 20.90 56.30 44.20 27.90 12.10 2.31
1.5m 2.57
ROAD, POINT 2 1.5m 2.55
ROAD, POINT 3 1.5m 2.42
ROAD, POINT 11
2
3
BH6 STORAGE TANK
10.0m 2.17
13.0m
15.0m
34
35
36
2.2828
29
30
2.34
2.51
7.5m
10.5m
14.5m
BH5 PRESSING STATION
2.11
2.21
2.23
2.28
2.24
1.5m
4.5m
15.0m25
26
27
0.5m
3.5m
6.5m
9.5m
12.5m
BH4 STERILIZER
23
22
20
BH3 CLARIFICATION
STATION 17
24
2.30
18 2.44
19
3.0m
6.0m
9.0m
12.0m
15.0m
2.30
11.0m
15.0m
2.36
2.47
2.5m
5.5m
8.5m
11.5m
14.5m
2.50
2.52
7
8
2.43
10 2.47
12
BH1 BOILER
4
5
6
2.44
2.34
2.46
1.00
9 2.43
13 2.50
11 2.56
BH2 POWER HOUSE
2.0m
5.0m
8.0m
7.0m 2.35
14
15
16
2.44
2.51
2.42
2.38
21
2.42
2.28
31
32
33
1.0m 2.47
4.0m 2.47
DETERMINATION OF SPECIFIC GRAVITY OF SOIL PARTICLES(Standard Laboratory Method)
OPERATOR:SOIL NO:
DATE: 08-06-2018
LOCATION: OKOMU
44

I3I4 37.25 45.60 25.10 10.80 26.45 20.50 14.30 5.95 2.40
UB 37.72 45.70 25.80 12.10 25.62 19.90 13.70 5.72 2.40
RP 76.10 90.50 47.00 22.50 53.60 43.50 24.50 10.10 2.43
TO 74.40 88.90 46.20 21.70 52.70 42.70 24.50 10.00 2.45
VH 68.14 84.50 47.80 17.20 50.94 36.70 30.60 14.24 2.15
VE 74.26 90.60 52.60 22.90 51.36 38.00 29.70 13.36 2.22
CV 75.20 89.30 48.70 23.40 51.80 40.60 25.30 11.20 2.26
VI 77.60 91.30 47.40 22.20 55.40 43.90 25.20 11.50 2.19
FO 70.36 85.10 47.00 20.30 50.06 38.10 26.70 11.96 2.23
DI 70.12 85.40 48.30 19.50 50.62 37.10 28.80 13.52 2.13
MI 73.90 90.00 49.40 20.50 53.40 40.60 28.90 12.80 2.26
FO 74.50 89.90 50.40 22.70 51.80 39.50 27.70 12.30 2.25
BZ 73.08 90.60 52.50 21.60 51.48 38.10 30.90 13.38 2.31
GZ 73.08 90.40 53.00 20.30 52.78 37.40 32.70 15.38 2.13
EC 73.60 87.10 43.00 20.10 53.50 44.10 22.90 9.40 2.44
RN 75.00 90.10 47.50 22.60 52.40 42.60 24.90 9.80 2.54
OG 75.90 92.90 51.60 22.80 53.10 41.30 28.80 11.80 2.44
CD 77.10 92.10 48.20 23.20 53.90 43.90 25.00 10.00 2.50
JO 76.25 89.00 44.10 22.50 53.75 44.90 21.60 8.85 2.44
CO 75.30 91.70 46.90 20.00 55.30 44.80 26.90 10.50 2.56
E 67.23 81.50 40.80 16.80 50.43 40.70 24.00 9.73 2.47
VR 67.65 83.50 44.30 17.60 50.05 39.20 26.70 10.85 2.46
Q2 48.80 61.30 37.30 15.60 33.20 24.00 21.70 9.20 2.36
Q4 49.30 60.60 37.60 17.30 32.00 23.00 20.30 9.00 2.26
BED 37.99 47.80 28.30 11.70 26.29 19.50 16.60 6.79 2.44
BOB 38.75 48.10 28.90 11.90 26.85 19.20 17.00 7.65 2.22
BA 72.57 90.90 53.90 22.20 50.37 37.00 31.70 13.37 2.37
Z3Z4 72.46 88.90 50.50 21.80 50.66 38.40 28.70 12.26 2.34
EK 74.40 89.00 46.70 20.70 53.70 42.30 26.00 11.40 2.28
RM 76.40 88.20 40.80 20.90 55.50 47.40 19.90 8.10 2.46
RY 73.30 87.90 44.80 19.80 53.50 43.10 25.00 10.40 2.40
RS 79.50 93.20 49.00 25.00 54.50 44.20 24.00 10.30 2.33
RC 74.20 89.30 45.20 17.90 56.30 44.10 27.30 12.20 2.24
TW 77.20 93.10 50.80 22.10 55.10 42.30 28.70 12.80 2.24
EJ 76.50 95.80 54.40 22.40 54.10 41.40 32.00 12.70 2.52
EH 75.40 95.20 55.90 23.00 52.40 39.30 32.90 13.10 2.51
HP 76.12 92.90 51.80 22.70 53.42 41.10 29.10 12.32 2.36
DP 75.50 91.10 48.90 21.70 53.80 42.20 27.20 11.60 2.34
PA 69.58 84.10 44.60 19.80 49.78 39.50 24.80 10.28 2.41
VY 70.23 86.30 47.30 19.00 51.23 39.00 28.30 12.23 2.31
A 48.21 59.20 37.10 18.20 30.01 22.10 18.90 7.91 2.39
B 50.80 63.60 41.00 19.40 31.40 22.60 21.60 8.80 2.45
S2 73.60 92.00 53.00 21.40 52.20 39.00 31.60 13.20 2.39
EA 77.20 93.30 49.80 22.50 54.70 43.50 27.30 11.20 2.44
BH10 RAMP II
1.5m
BH7 WEIGH BRIDGE
BH8 WATER TANK
BH9 RAMP I
2.42
54
55
56
57
15.0m
13.5m
58
2.52
2.35
15.0m
2.36
2.42
2.0m
2.46
4.5m
7.5m
10.5m
2.24
8.0m 2.36
11.0m 2.37
2.37
2.31
5.0m 2.33
14.0m
2.25
3.0m 2.22
6.0m 2.49
12.0m 2.50
9.0m 2.47
4.0m 2.44
7.0m 2.19
10.0m 2.23
13.0m
15.0m
52
53
1.0m 2.40
46
47
48
49
50
51
40
41
42
43
44
45
37
38
39
2.18
B+W = Wt. of Bottle + Water (full) W4B+S+W = Wt. of Bottle + Soil+ Water W3B+S = Wt. of Bottle + Soil W2B = Wt. of Bottle W1Ad.W = Wt. of Added Water (full) (W4-W1)WWAS = Wt. of Water added to Soil (W3-W2)WS = Wt. of Soil (W2-W1)WOWDS = Wt. of Water Displaced by Soil (W4-W1)-(W3-W2) = WGS = Specific Gravity (W2-W1)/W
45

JEFFA GEOTECH
APPENDIX II
46

SIEVE NO.
APPROX IMPERIAL
EQUIV (Seive No.)
BRITISH STANDARD
SIEVE SIZES (mm) RETAINED IN gm PASSING IN gm
PASSING IN
(%)
3 75
2 ½
2 50
1 ½ 37.5
1 26.5
¾ 20
½ 14
⅜ 10
¼ 6.3
3/16 5
⅛ 3.35 100 100
7 2.36 100 100
10 2 100 100
14 1.18 0.76 99.24 99.24
25 0.6 12.78 86.46 86.46
36 0.425 8.35 78 78
52 0.3 15.97 62.14 62.14
72 0.212 9.55 52.59 52.59
100 0.15 3.44 49.15 49.15
200 0.075 4.23 44.92 44.92
UNIBEN GEOTECH RESEARCH
GRAIN SIZE ANALYSIS BY WET-SIEVING
SITE: … OKOMU JOB:.............
LOCATION: ROAD POINT 1... DATE: 08-06--2018………
DEPTH: ……. 1.5m…… TESTED BY:……WET SIEVE………
0
10
20
30
40
50
60
70
80
90
100
0.0001 0.001 0.01 0.1 1 10 100
Perc
enta
ge P
assin
g
British Standard Sieve SizeSieve Analysis
73
mm
50
37
.5
26
.5
20
100.1
5
6.353.3
5
2.3
6
1.7
1.1
8
0.0
6
0.4
25
0.3
0.2
12
0.0
75
0.0
63
SILT
MEDIUMFINE COARSE FINE MEDIUM COARSE FINE MEDIUM COARSE
SAND GRAVELCLAY
CO
BB
LE
47

SIEVE NO.
APPROX IMPERIAL
EQUIV (inches)
BRITISH STANDARD
SIEVE SIZES (mm) RETAINED IN gm PASSING IN gm
PASSING IN
(%)
3 75
2 ½
2 50
1 ½ 37.5
1 26.5
¾ 20
½ 14
⅜ 10
¼ 6.3
3/16 5
⅛ 3.35 100 100
7 2.36 100 100
10 2 100 100
14 1.18 1.5 98.5 98.5
25 0.6 10.85 87.65 87.65
36 0.425 5.43 82 82
52 0.3 9.78 72.44 72.44
72 0.212 6.02 66.42 66.42
100 0.15 2.39 64.03 64.03
200 0.075 3.51 60.52 60.52
UNIBEN GEOTECH RESEARCH
GRAIN SIZE ANALYSIS BY WET-SIEVING
SITE: … OKOMU JOB:.............
LOCATION: .ROAD POINT 2. DATE: 08-06--2018………
DEPTH: ……. 1.5m…… TESTED BY:……WET SIEVE………
0
10
20
30
40
50
60
70
80
90
100
0.0001 0.001 0.01 0.1 1 10 100
Pe
rce
nta
ge
Pa
ssin
g
British Standard Sieve SizeSieve Analysis
73
mm
50
37
.5
26
.5
20
100.1
5
6.353.3
5
2.3
6
1.7
1.1
8
0.0
6
0.4
25
0.3
0.2
12
0.0
75
0.0
63
SILT
MEDIUMFINE COARSE FINE MEDIUM COARSE FINE MEDIUM COARSE
SAND GRAVELCLAY
CO
BB
LE
S
48

SIEVE NO.
APPROX IMPERIAL
EQUIV (Seive No.)
BRITISH STANDARD
SIEVE SIZES (mm) RETAINED IN gm PASSING IN gm
PASSING IN
(%)
3 75
2 ½
2 50
1 ½ 37.5
1 26.5
¾ 20
½ 14
⅜ 10
¼ 6.3
3/16 5
⅛ 3.35 100 100
7 2.36 100 100
10 2 100 100
14 1.18 2.03 97.97 97.97
25 0.6 10.75 87.22 87.22
36 0.425 6.17 81 81
52 0.3 9.33 71.72 71.72
72 0.212 6.37 65.35 65.35
100 0.15 3.41 61.94 61.94
200 0.075 4.3 57.64 57.64
UNIBEN GEOTECH RESEARCH
GRAIN SIZE ANALYSIS BY WET-SIEVING
SITE: … OKOMU JOB:.............
LOCATION: .ROAD POINT 3. DATE: 08-06--2018………
DEPTH: ……. 1.5m…… TESTED BY:……WET SIEVE………
0
10
20
30
40
50
60
70
80
90
100
0.0001 0.001 0.01 0.1 1 10 100
Perc
enta
ge P
assin
g
British Standard Sieve SizeSieve Analysis
73
mm
50
37
.5
26
.5
20
100.1
5
6.353.3
5
2.3
6
1.7
1.1
8
0.0
6
0.4
25
0.3
0.2
12
0.0
75
0.0
63
SILT
MEDIUMFINE COARSE FINE MEDIUM COARSE FINE MEDIUM COARSE
SAND GRAVELCLAY
CO
BB
LE
49

SIEVE NO.
APPROX IMPERIAL
EQUIV (Seive No.)
BRITISH STANDARD
SIEVE SIZES (mm) RETAINED IN gm PASSING IN gm
PASSING IN
(%)
3 75
2 ½
2 50
1 ½ 37.5
1 26.5
¾ 20
½ 14
⅜ 10
¼ 6.3
3/16 5
⅛ 3.35 100 100
7 2.36 100 100
10 2 100 100
14 1.18 2.01 97.99 97.99
25 0.6 16.05 81.94 81.94
36 0.425 9.09 72.85 72.85
52 0.3 10.93 61.92 61.92
72 0.212 6.49 55.43 55.43
100 0.15 3.46 51.97 51.97
200 0.075 4.22 47.75 47.75
UNIBEN GEOTECH RESEARCH
GRAIN SIZE ANALYSIS BY WET-SIEVINGSITE: … OKOMU JOB:.............
LOCATION: .....BOILER , BH1. DATE: 08-06--2018………
DEPTH: ……. 1.0m…… TESTED BY:……WET SIEVE………
0
10
20
30
40
50
60
70
80
90
100
0.0001 0.001 0.01 0.1 1 10 100
Perc
enta
ge P
assin
g
British Standard Sieve SizeSieve Analysis
73
mm
50
37
.5
26
.5
20
100.1
5
6.353.3
5
2.3
6
1.7
1.1
8
0.0
6
0.4
25
0.3
0.2
12
0.0
75
0.0
63
SILT
MEDIUMFINE COARSE FINE MEDIUM COARSE FINE MEDIUM COARSE
SAND GRAVELCLAY
CO
BB
LE
50

SIEVE NO.
APPROX IMPERIAL
EQUIV (Seive No.)
BRITISH STANDARD
SIEVE SIZES (mm) RETAINED IN gm PASSING IN gm
PASSING IN
(%)
3 75
2 ½
2 50
1 ½ 37.5
1 26.5
¾ 20
½ 14
⅜ 10
¼ 6.3
3/16 5
⅛ 3.35 100 100
7 2.36 100 100
10 2 100 100
14 1.18 1.63 98.37 98.37
25 0.6 10.43 87.94 87.94
36 0.425 5.34 82.60 82.60
52 0.3 8.7 73.9 73.9
72 0.212 4.88 69.02 69.02
100 0.15 2.29 66.73 66.73
200 0.075 3.42 63.31 63.31
UNIBEN GEOTECH RESEARCH
GRAIN SIZE ANALYSIS BY WET-SIEVING
SITE: … OKOMU JOB:.............
LOCATION: .....BOILER , BH1. DATE: 08-06--2018………
DEPTH: ……. 3.0m…… TESTED BY:……WET SIEVE………
0
10
20
30
40
50
60
70
80
90
100
0.0001 0.001 0.01 0.1 1 10 100
Pe
rce
nta
ge
Pa
ssin
g
British Standard Sieve SizeSieve Analysis
73
mm
50
37
.5
26
.5
20
100.1
5
6.353.3
5
2.3
6
1.7
1.1
8
0.0
6
0.4
25
0.3
0.2
12
0.0
75
0.0
63
SILT
MEDIUMFINE COARSE FINE MEDIUM COARSE FINE MEDIUM COARSE
SAND GRAVELCLAY
CO
BB
LE
S
51

SIEVE NO.
APPROX IMPERIAL
EQUIV (Seive No.)
BRITISH STANDARD
SIEVE SIZES (mm) RETAINED IN gm PASSING IN gm
PASSING IN
(%)
3 75
2 ½
2 50
1 ½ 37.5
1 26.5
¾ 20
½ 14
⅜ 10
¼ 6.3
3/16 5
⅛ 3.35 100 100
7 2.36 100 100
10 2 100 100
14 1.18 1.78 98.22 98.22
25 0.6 9.87 88.35 88.35
36 0.425 4.82 83.53 83.53
52 0.3 9.05 74.48 74.48
72 0.212 6.43 68.05 68.05
100 0.15 2.95 65.1 65.1
200 0.075 4.7 60.4 60.4
UNIBEN GEOTECH RESEARCH
GRAIN SIZE ANALYSIS BY WET-SIEVING
SITE: … OKOMU JOB:.............
LOCATION: .....BOILER , BH1. DATE: 08-06--2018………
DEPTH: ……. 6.0m…… TESTED BY:……WET SIEVE………
0
10
20
30
40
50
60
70
80
90
100
0.0001 0.001 0.01 0.1 1 10 100
Pe
rce
nta
ge
Pa
ssin
g
British Standard Sieve SizeSieve Analysis
73
mm
50
37
.5
26
.5
20
100.1
5
6.353.3
5
2.3
6
1.7
1.1
8
0.0
6
0.4
25
0.3
0.2
12
0.0
75
0.0
63
SILT
MEDIUMFINE COARSE FINE MEDIUM COARSE FINE MEDIUM COARSE
SAND GRAVELCLAY
CO
BB
LE
S
52

SIEVE NO.
APPROX IMPERIAL
EQUIV (inches)
BRITISH STANDARD
SIEVE SIZES (mm) RETAINED IN gm PASSING IN gm
PASSING IN
(%)
3 75
2 ½
2 50
1 ½ 37.5
1 26.5
¾ 20
½ 14
⅜ 10
¼ 6.3
3/16 5
⅛ 3.35 100 100
7 2.36 100 100
10 2 0.32 99.68 99.68
14 1.18 1.97 97.71 97.71
25 0.6 10.63 87.08 87.08
36 0.425 5.44 81.64 81.64
52 0.3 8.97 72.67 72.67
72 0.212 6.93 65.74 65.74
100 0.15 3.35 62.39 62.39
200 0.075 5.7 56.69 56.69
UNIBEN GEOTECH RESEARCH
GRAIN SIZE ANALYSIS BY WET-SIEVING
SITE: … OKOMU JOB:.............
LOCATION: .....BOILER , BH1. DATE: 08-06--2018………
DEPTH: ……. 9.0m…… TESTED BY:……WET SIEVE………
0
10
20
30
40
50
60
70
80
90
100
0.0001 0.001 0.01 0.1 1 10 100
Pe
rce
nta
ge
Pa
ssin
g
British Standard Sieve SizeSieve Analysis
73
mm
50
37
.5
26
.5
20
100.1
5
6.353.3
5
2.3
6
1.7
1.1
8
0.0
6
0.4
25
0.3
0.2
12
0.0
75
0.0
63
SILT
MEDIUMFINE COARSE FINE MEDIUM COARSE FINE MEDIUM COARSE
SAND GRAVELCLAY
CO
BB
LE
S
53

SIEVE NO.
APPROX IMPERIAL
EQUIV (Seive No.)
BRITISH STANDARD
SIEVE SIZES (mm) RETAINED IN gm PASSING IN gm
PASSING IN
(%)
3 75
2 ½
2 50
1 ½ 37.5
1 26.5
¾ 20
½ 14
⅜ 10
¼ 6.3
3/16 5
⅛ 3.35 100 100
7 2.36 100 100
10 2 0.09 99.91 99.91
14 1.18 1.48 98.43 98.43
25 0.6 7.57 90.86 90.86
36 0.425 4.23 86.63 86.63
52 0.3 8.98 77.65 77.65
72 0.212 6.42 71.23 71.23
100 0.15 2.54 68.69 68.69
200 0.075 4.03 64.66 64.66
UNIBEN GEOTECH RESEARCH
GRAIN SIZE ANALYSIS BY WET-SIEVINGSITE: … OKOMU JOB:.............
LOCATION: .....BOILER , BH1. DATE: 08-06--2018………
DEPTH: ……. 12.0m…… TESTED BY:……WET SIEVE………
0
10
20
30
40
50
60
70
80
90
100
0.0001 0.001 0.01 0.1 1 10 100
Perc
enta
ge P
assin
g
British Standard Sieve SizeSieve Analysis
73
mm
50
37
.5
26
.5
20
100.1
5
6.353.3
5
2.3
6
1.7
1.1
8
0.0
6
0.4
25
0.3
0.2
12
0.0
75
0.0
63
SILT
MEDIUMFINE COARSE FINE MEDIUM COARSE FINE MEDIUM COARSE
SAND GRAVELCLAY
CO
BB
LE
54

SIEVE NO.
APPROX IMPERIAL
EQUIV (Sieve No.)
BRITISH STANDARD
SIEVE SIZES (mm) RETAINED IN gm PASSING IN gm
PASSING IN
(%)
3 75
2 ½
2 50
1 ½ 37.5
1 26.5
¾ 20
½ 14
⅜ 10
¼ 6.3
3/16 5
⅛ 3.35 100 100
7 2.36 100 100
10 2 0.07 99.93 99.93
14 1.18 1.64 98.29 98.29
25 0.6 0.71 97.58 97.58
36 0.425 5.23 92.35 92.35
52 0.3 9.4 82.95 82.95
72 0.212 6.99 75.96 75.96
100 0.15 3.39 72.57 72.57
200 0.075 4.59 67.98 67.98
UNIBEN GEOTECH RESEARCH
GRAIN SIZE ANALYSIS BY WET-SIEVING
SITE: … OKOMU JOB:.............
LOCATION: .....BOILER , BH1. DATE: 08-06--2018………
DEPTH: ……. 15m…… TESTED BY:……WET SIEVE………
0
10
20
30
40
50
60
70
80
90
100
0.0001 0.001 0.01 0.1 1 10 100
Pe
rce
nta
ge
Pa
ssin
g
British Standard Sieve SizeSieve Analysis
73
mm
50
37
.5
26
.5
20
100.1
5
6.353.3
5
2.3
6
1.7
1.1
8
0.0
6
0.4
25
0.3
0.2
12
0.0
75
0.0
63
SILT
MEDIUMFINE COARSE FINE MEDIUM COARSE FINE MEDIUM COARSE
SAND GRAVELCLAY
CO
BB
LE
S
55

SIEVE NO.
APPROX IMPERIAL
EQUIV (Seive No)
BRITISH STANDARD
SIEVE SIZES (mm) RETAINED IN gm PASSING IN gm
PASSING IN
(%)
3 75
2 ½
2 50
1 ½ 37.5
1 26.5
¾ 20
½ 14
⅜ 10
¼ 6.3
3/16 5
⅛ 3.35 100 100
7 2.36 100 100
10 2 100 100
14 1.18 1.51 98.49 98.49
25 0.6 12.26 86.23 86.23
36 0.425 6.88 79.35 79.35
52 0.3 10.53 68.82 68.82
72 0.212 6.48 62.34 62.34
100 0.15 2.73 59.61 59.61
200 0.075 3.7 55.91 55.91
UNIBEN GEOTECH RESEARCH
GRAIN SIZE ANALYSIS BY WET-SIEVING
SITE: … OKOMU JOB:.............
LOCATION: .....POWER HOUSE , BH2. DATE: 08-06--2018………
DEPTH: ……. 2.0m…… TESTED BY:……WET SIEVE………
0
10
20
30
40
50
60
70
80
90
100
0.0001 0.001 0.01 0.1 1 10 100
Pe
rce
nta
ge
Pa
ssin
g
British Standard Sieve SizeSieve Analysis
73
mm
50
37
.5
26
.5
20
100.1
5
6.353.3
5
2.3
6
1.7
1.1
8
0.0
6
0.4
25
0.3
0.2
12
0.0
75
0.0
63
SILT
MEDIUMFINE COARSE FINE MEDIUM COARSE FINE MEDIUM COARSE
SAND GRAVELCLAY
CO
BB
LE
S
56

SIEVE NO.
APPROX IMPERIAL
EQUIV (Seive No.)
BRITISH STANDARD
SIEVE SIZES (mm) RETAINED IN gm PASSING IN gm
PASSING IN
(%)
3 75
2 ½
2 50
1 ½ 37.5
1 26.5
¾ 20
½ 14
⅜ 10
¼ 6.3
3/16 5
⅛ 3.35 100 100
7 2.36 100 100
10 2 0.08 99.92 99.92
14 1.18 1.81 98.11 98.11
25 0.6 10.7 87.41 87.41
36 0.425 5.81 81.60 81.60
52 0.3 9.04 72.56 72.56
72 0.212 6.17 66.39 66.39
100 0.15 2.86 63.53 63.53
200 0.075 4.55 58.98 58.98
UNIBEN GEOTECH RESEARCH
GRAIN SIZE ANALYSIS BY WET-SIEVING
SITE: … OKOMU JOB:.............
LOCATION: .....POWER HOUSE , BH2. DATE: 08-06--2018………
DEPTH: ……. 5.0m…… TESTED BY:……WET SIEVE………
0
10
20
30
40
50
60
70
80
90
100
0.0001 0.001 0.01 0.1 1 10 100
Pe
rce
nta
ge
Pa
ssin
g
British Standard Sieve SizeSieve Analysis
73
mm
50
37
.5
26
.5
20
100.1
5
6.353.3
5
2.3
6
1.7
1.1
8
0.0
6
0.4
25
0.3
0.2
12
0.0
75
0.0
63
SILT
MEDIUMFINE COARSE FINE MEDIUM COARSE FINE MEDIUM COARSE
SAND GRAVELCLAY
CO
BB
LE
S
57

SIEVE NO.
APPROX IMPERIAL
EQUIV (Seive No.)
BRITISH STANDARD
SIEVE SIZES (mm) RETAINED IN gm PASSING IN gm
PASSING IN
(%)
3 75
2 ½
2 50
1 ½ 37.5
1 26.5
¾ 20
½ 14
⅜ 10
¼ 6.3
3/16 5
⅛ 3.35 100 100
7 2.36 100 100
10 2 100 100
14 1.18 1.42 98.58 98.58
25 0.6 8.45 90.13 90.13
36 0.425 4.96 85.17 85.17
52 0.3 8.95 76.22 76.22
72 0.212 6.24 69.98 69.98
100 0.15 2.83 67.15 67.15
200 0.075 3.59 63.56 63.56
UNIBEN GEOTECH RESEARCH
GRAIN SIZE ANALYSIS BY WET-SIEVINGSITE: … OKOMU JOB:.............
LOCATION: .....POWER HOUSE , BH2. DATE: 08-06--2018………
DEPTH: ……. 8.0m…… TESTED BY:……WET SIEVE………
0
10
20
30
40
50
60
70
80
90
100
0.0001 0.001 0.01 0.1 1 10 100
Perc
enta
ge P
assin
g
British Standard Sieve SizeSieve Analysis
73
mm
50
37
.5
26
.5
20
100.1
5
6.353.3
5
2.3
6
1.7
1.1
8
0.0
6
0.4
25
0.3
0.2
12
0.0
75
0.0
63
SILT
MEDIUMFINE COARSE FINE MEDIUM COARSE FINE MEDIUM COARSE
SAND GRAVELCLAY
CO
BB
LE
58

SIEVE NO.
APPROX IMPERIAL
EQUIV (Seive No.)
BRITISH STANDARD
SIEVE SIZES (mm) RETAINED IN gm PASSING IN gm
PASSING IN
(%)
3 75
2 ½
2 50
1 ½ 37.5
1 26.5
¾ 20
½ 14
⅜ 10
¼ 6.3
3/16 5
⅛ 3.35 100 100
7 2.36 100 100
10 2 0.07 99.93 99.93
14 1.18 1.69 98.24 98.24
25 0.6 8.76 89.48 89.48
36 0.425 4.43 85.05 85.05
52 0.3 8.52 76.53 76.53
72 0.212 6.32 70.21 70.21
100 0.15 2.77 67.44 67.44
200 0.075 3.94 63.5 63.5
UNIBEN GEOTECH RESEARCH
GRAIN SIZE ANALYSIS BY WET-SIEVING
SITE: … OKOMU JOB:.............
LOCATION: .....POWER HOUSE , BH2. DATE: 08-06--2018………
DEPTH: ……. 11.0m…… TESTED BY:……WET SIEVE………
0
10
20
30
40
50
60
70
80
90
100
0.0001 0.001 0.01 0.1 1 10 100
Pe
rce
nta
ge
Pa
ssin
g
British Standard Sieve SizeSieve Analysis
73
mm
50
37
.5
26
.5
20
100.1
5
6.353.3
5
2.3
6
1.7
1.1
8
0.0
6
0.4
25
0.3
0.2
12
0.0
75
0.0
63
SILT
MEDIUMFINE COARSE FINE MEDIUM COARSE FINE MEDIUM COARSE
SAND GRAVELCLAY
CO
BB
LE
S
59

SIEVE NO.
APPROX IMPERIAL
EQUIV (Seive No.)
BRITISH STANDARD
SIEVE SIZES (mm) RETAINED IN gm PASSING IN gm
PASSING IN
(%)
3 75
2 ½
2 50
1 ½ 37.5
1 26.5
¾ 20
½ 14
⅜ 10
¼ 6.3
3/16 5
⅛ 3.35 100 100
7 2.36 100 100
10 2 0.04 99.96 99.96
14 1.18 1.56 98.4 98.4
25 0.6 9.15 89.25 89.25
36 0.425 4.04 85.21 85.21
52 0.3 9.24 75.97 75.97
72 0.212 6.41 69.56 69.56
100 0.15 2.7 66.86 66.86
200 0.075 4.04 62.82 62.82
UNIBEN GEOTECH RESEARCH
GRAIN SIZE ANALYSIS BY WET-SIEVING
SITE: … OKOMU JOB:.............
LOCATION: .....POWER HOUSE , BH2. DATE: 08-06--2018………
DEPTH: ……. 15.0m…… TESTED BY:……WET SIEVE………
0
10
20
30
40
50
60
70
80
90
100
0.0001 0.001 0.01 0.1 1 10 100
Pe
rce
nta
ge
Pa
ssin
g
British Standard Sieve SizeSieve Analysis
73
mm
50
37
.5
26
.5
20
100.1
5
6.353.3
5
2.3
6
1.7
1.1
8
0.0
6
0.4
25
0.3
0.2
12
0.0
75
0.0
63
SILT
MEDIUMFINE COARSE FINE MEDIUM COARSE FINE MEDIUM COARSE
SAND GRAVELCLAY
CO
BB
LE
S
60

SIEVE NO.
APPROX IMPERIAL
EQUIV (Seive No.)
BRITISH STANDARD
SIEVE SIZES (mm) RETAINED IN gm PASSING IN gm
PASSING IN
(%)
3 75
2 ½
2 50
1 ½ 37.5
1 26.5
¾ 20
½ 14
⅜ 10
¼ 6.3
3/16 5
⅛ 3.35 100 100
7 2.36 100 100
10 2 100 100
14 1.18 2.12 97.88 97.88
25 0.6 12.73 85.15 85.15
36 0.425 5.92 79.23 79.23
52 0.3 10.37 68.86 68.86
72 0.212 6.93 61.93 61.93
100 0.15 3.57 58.36 58.36
200 0.075 4.34 54.02 54.02
UNIBEN GEOTECH RESEARCH
GRAIN SIZE ANALYSIS BY WET-SIEVING
SITE: … OKOMU JOB:.............
LOCATION: .CLARIFICATION STATION, BH3. DATE: 08-06--2018………
DEPTH: ……. 2.5m…… TESTED BY:……WET SIEVE………
0
10
20
30
40
50
60
70
80
90
100
0.0001 0.001 0.01 0.1 1 10 100
Pe
rce
nta
ge
Pa
ssin
g
British Standard Sieve SizeSieve Analysis
73
mm
50
37
.5
26
.5
20
100.1
5
6.353.3
5
2.3
6
1.7
1.1
8
0.0
6
0.4
25
0.3
0.2
12
0.0
75
0.0
63
SILT
MEDIUMFINE COARSE FINE MEDIUM COARSE FINE MEDIUM COARSE
SAND GRAVELCLAY
CO
BB
LE
S
61

SIEVE NO.
APPROX IMPERIAL
EQUIV (Seive No.)
BRITISH STANDARD
SIEVE SIZES (mm) RETAINED IN gm PASSING IN gm
PASSING IN
(%)
3 75
2 ½
2 50
1 ½ 37.5
1 26.5
¾ 20
½ 14
⅜ 10
¼ 6.3
3/16 5
⅛ 3.35 100 100
7 2.36 100 100
10 2 0.06 99.94 99.94
14 1.18 1.52 98.42 98.42
25 0.6 9.09 89.33 89.33
36 0.425 4.79 84.54 84.54
52 0.3 9.48 75.06 75.06
72 0.212 6.81 68.25 68.25
100 0.15 2.73 65.52 65.52
200 0.075 3.91 61.61 61.61
UNIBEN GEOTECH RESEARCH
GRAIN SIZE ANALYSIS BY WET-SIEVING
SITE: … OKOMU JOB:.............
LOCATION: CLARIFICATION STATION, BH3. DATE: 08-06--2018………
DEPTH: ……. 5.5m…… TESTED BY:……WET SIEVE………
0
10
20
30
40
50
60
70
80
90
100
0.0001 0.001 0.01 0.1 1 10 100
Pe
rce
nta
ge
Pa
ssin
g
British Standard Sieve SizeSieve Analysis
73
mm
50
37
.5
26
.5
20
100.1
5
6.353.3
5
2.3
6
1.7
1.1
8
0.0
6
0.4
25
0.3
0.2
12
0.0
75
0.0
63
SILT
MEDIUMFINE COARSE FINE MEDIUM COARSE FINE MEDIUM COARSE
SAND GRAVELCLAY
CO
BB
LE
S
62

SIEVE NO.
APPROX IMPERIAL
EQUIV (Seive No.)
BRITISH STANDARD
SIEVE SIZES (mm) RETAINED IN gm PASSING IN gm
PASSING IN
(%)
3 75
2 ½
2 50
1 ½ 37.5
1 26.5
¾ 20
½ 14
⅜ 10
¼ 6.3
3/16 5
⅛ 3.35 100 100
7 2.36 100 100
10 2 100 100
14 1.18 1.78 98.22 98.22
25 0.6 9.99 88.23 88.23
36 0.425 5.01 83.22 83.22
52 0.3 9.69 73.53 73.53
72 0.212 7.25 66.28 66.28
100 0.15 3.09 63.19 63.19
200 0.075 4.3 58.89 58.89
UNIBEN GEOTECH RESEARCH
GRAIN SIZE ANALYSIS BY WET-SIEVING
SITE: … OKOMU JOB:.............
LOCATION: CLARIFICATION STATION, BH3. DATE: 08-06--2018………
DEPTH: ……. 8.5m…… TESTED BY:……WET SIEVE………
0
10
20
30
40
50
60
70
80
90
100
0.0001 0.001 0.01 0.1 1 10 100
Pe
rce
nta
ge
Pa
ssin
g
British Standard Sieve SizeSieve Analysis
73
mm
50
37
.5
26
.5
20
100.1
5
6.353.3
5
2.3
6
1.7
1.1
8
0.0
6
0.4
25
0.3
0.2
12
0.0
75
0.0
63
SILT
MEDIUMFINE COARSE FINE MEDIUM COARSE FINE MEDIUM COARSE
SAND GRAVELCLAY
CO
BB
LE
S
63

SIEVE NO.
APPROX IMPERIAL
EQUIV (Seive No.)
BRITISH STANDARD
SIEVE SIZES (mm) RETAINED IN gm PASSING IN gm
PASSING IN
(%)
3 75
2 ½
2 50
1 ½ 37.5
1 26.5
¾ 20
½ 14
⅜ 10
¼ 6.3
3/16 5
⅛ 3.35 100 100
7 2.36 100 100
10 2 0.1 99.9 99.9
14 1.18 1.82 98.08 98.08
25 0.6 10.3 87.78 87.78
36 0.425 5.32 82.46 82.46
52 0.3 10.15 72.31 72.31
72 0.212 7.23 65.08 65.08
100 0.15 2.99 62.09 62.09
200 0.075 5.27 56.82 56.82
UNIBEN GEOTECH RESEARCH
GRAIN SIZE ANALYSIS BY WET-SIEVING
SITE: … OKOMU JOB:.............
LOCATION: CLARIFICATION STATION, BH3. DATE: 08-06--2018………
DEPTH: ……. 11.5m…… TESTED BY:……WET SIEVE………
0
10
20
30
40
50
60
70
80
90
100
0.0001 0.001 0.01 0.1 1 10 100
Pe
rce
nta
ge
Pa
ssin
g
British Standard Sieve SizeSieve Analysis
73
mm
50
37
.5
26
.5
20
100.1
5
6.353.3
5
2.3
6
1.7
1.1
8
0.0
6
0.4
25
0.3
0.2
12
0.0
75
0.0
63
SILT
MEDIUMFINE COARSE FINE MEDIUM COARSE FINE MEDIUM COARSE
SAND GRAVELCLAY
CO
BB
LE
S
64

SIEVE NO.
APPROX IMPERIAL
EQUIV (Seive No.)
BRITISH STANDARD
SIEVE SIZES (mm) RETAINED IN gm PASSING IN gm
PASSING IN
(%)
3 75
2 ½
2 50
1 ½ 37.5
1 26.5
¾ 20
½ 14
⅜ 10
¼ 6.3
3/16 5
⅛ 3.35 100 100
7 2.36 100 100
10 2 100 100
14 1.18 1.87 98.13 98.13
25 0.6 9.81 88.32 88.32
36 0.425 5.49 83 83
52 0.3 10.11 72.72 72.72
72 0.212 7.13 65.59 65.59
100 0.15 4.38 61.21 61.21
200 0.075 5 56.21 56.21
UNIBEN GEOTECH RESEARCH
GRAIN SIZE ANALYSIS BY WET-SIEVING
SITE: … OKOMU JOB:.............
LOCATION: CLARIFICATION STATION, BH3. DATE: 08-06--2018………
DEPTH: ……. 14.5m…… TESTED BY:……WET SIEVE………
0
10
20
30
40
50
60
70
80
90
100
0.0001 0.001 0.01 0.1 1 10 100
Pe
rce
nta
ge
Pa
ssin
g
British Standard Sieve SizeSieve Analysis
73
mm
50
37
.5
26
.5
20
100.1
5
6.353.3
5
2.3
6
1.7
1.1
8
0.0
6
0.4
25
0.3
0.2
12
0.0
75
0.0
63
SILT
MEDIUMFINE COARSE FINE MEDIUM COARSE FINE MEDIUM COARSE
SAND GRAVELCLAY
CO
BB
LE
S
65

SIEVE NO.
APPROX IMPERIAL
EQUIV (Seive No)
BRITISH STANDARD
SIEVE SIZES (mm) RETAINED IN gm PASSING IN gm
PASSING IN
(%)
3 75
2 ½
2 50
1 ½ 37.5
1 26.5
¾ 20
½ 14
⅜ 10
¼ 6.3
3/16 5
⅛ 3.35 100 100
7 2.36 0.06 99.94 99.94
10 2 0.07 99.87 99.87
14 1.18 2.03 97.84 97.84
25 0.6 10.36 87.48 87.48
36 0.425 6.42 81.06 81.06
52 0.3 10.19 70.87 70.87
72 0.212 7.49 63.38 63.38
100 0.15 4.65 58.73 58.73
200 0.075 5.79 52.94 52.94
UNIBEN GEOTECH RESEARCH
GRAIN SIZE ANALYSIS BY WET-SIEVING
SITE: … OKOMU JOB:.............
LOCATION: ...STERILIZER , BH4. DATE: 08-06--2018………
DEPTH: ……. 15.0m…… TESTED BY:……WET SIEVE………
0
10
20
30
40
50
60
70
80
90
100
0.0001 0.001 0.01 0.1 1 10 100
Pe
rce
nta
ge
Pa
ssin
g
British Standard Sieve SizeSieve Analysis
73
mm
50
37
.5
26
.5
20
100.1
5
6.353.3
5
2.3
6
1.7
1.1
8
0.0
6
0.4
25
0.3
0.2
12
0.0
75
0.0
63
SILT
MEDIUMFINE COARSE FINE MEDIUM COARSE FINE MEDIUM COARSE
SAND GRAVELCLAY
CO
BB
LE
S
66

SIEVE NO.
APPROX IMPERIAL
EQUIV (Seive No.)
BRITISH STANDARD
SIEVE SIZES (mm) RETAINED IN gm PASSING IN gm
PASSING IN
(%)
3 75
2 ½
2 50
1 ½ 37.5
1 26.5
¾ 20
½ 14
⅜ 10
¼ 6.3
3/16 5
⅛ 3.35 100 100
7 2.36 100 100
10 2 0.14 99.86 99.86
14 1.18 1.92 97.94 97.94
25 0.6 12.9 85.04 85.04
36 0.425 6.54 78.50 78.50
52 0.3 11.39 67.11 67.11
72 0.212 7.22 59.89 59.89
100 0.15 2.97 56.92 56.92
200 0.075 3.9 53.02 53.02
UNIBEN GEOTECH RESEARCH
GRAIN SIZE ANALYSIS BY WET-SIEVINGSITE: … OKOMU JOB:.............
LOCATION: ...STERILIZER , BH4. DATE: 08-06--2018………
DEPTH: ……. 3.5m…… TESTED BY:……WET SIEVE………
0
10
20
30
40
50
60
70
80
90
100
0.0001 0.001 0.01 0.1 1 10 100
Perc
enta
ge P
assin
g
British Standard Sieve SizeSieve Analysis
73
mm
50
37
.5
26
.5
20
100.1
5
6.353.3
5
2.3
6
1.7
1.1
8
0.0
6
0.4
25
0.3
0.2
12
0.0
75
0.0
63
SILT
MEDIUMFINE COARSE FINE MEDIUM COARSE FINE MEDIUM COARSE
SAND GRAVELCLAY
CO
BB
LE
67

SIEVE NO.
APPROX IMPERIAL
EQUIV (Seive No.)
BRITISH STANDARD
SIEVE SIZES (mm) RETAINED IN gm PASSING IN gm
PASSING IN
(%)
3 75
2 ½
2 50
1 ½ 37.5
1 26.5
¾ 20
½ 14
⅜ 10
¼ 6.3
3/16 5
⅛ 3.35 100 100
7 2.36 100 100
10 2 0.09 99.91 99.91
14 1.18 1.92 97.99 97.99
25 0.6 11.23 86.76 86.76
36 0.425 6.02 80.74 80.74
52 0.3 10.27 70.47 70.47
72 0.212 6.71 63.76 63.76
100 0.15 3.96 59.8 59.8
200 0.075 4.31 55.49 55.49
UNIBEN GEOTECH RESEARCH
GRAIN SIZE ANALYSIS BY WET-SIEVINGSITE: … OKOMU JOB:.............
LOCATION: ...STERILIZER , BH4. DATE: 08-06--2018………
DEPTH: ……. 6.5m…… TESTED BY:……WET SIEVE………
0
10
20
30
40
50
60
70
80
90
100
0.0001 0.001 0.01 0.1 1 10 100
Perc
enta
ge P
assin
g
British Standard Sieve SizeSieve Analysis
73
mm
50
37
.5
26
.5
20
100.1
5
6.353.3
5
2.3
6
1.7
1.1
8
0.0
6
0.4
25
0.3
0.2
12
0.0
75
0.0
63
SILT
MEDIUMFINE COARSE FINE MEDIUM COARSE FINE MEDIUM COARSE
SAND GRAVELCLAY
CO
BB
LE
68

SIEVE NO.
APPROX IMPERIAL
EQUIV (Seive No.)
BRITISH STANDARD
SIEVE SIZES (mm) RETAINED IN gm PASSING IN gm
PASSING IN
(%)
3 75
2 ½
2 50
1 ½ 37.5
1 26.5
¾ 20
½ 14
⅜ 10
¼ 6.3
3/16 5
⅛ 3.35 100 100
7 2.36 100 100
10 2 100 100
14 1.18 2.26 97.74 97.74
25 0.6 11.19 86.55 86.55
36 0.425 5.7 80.85 80.85
52 0.3 11.16 69.69 69.69
72 0.212 8.13 61.56 61.56
100 0.15 3.6 57.96 57.96
200 0.075 5.19 52.77 52.77
UNIBEN GEOTECH RESEARCH
GRAIN SIZE ANALYSIS BY WET-SIEVING
SITE: … OKOMU JOB:.............
LOCATION: ...STERILIZER , BH4. DATE: 08-06--2018………
DEPTH: ……. 9.5m…… TESTED BY:……WET SIEVE………
0
10
20
30
40
50
60
70
80
90
100
0.0001 0.001 0.01 0.1 1 10 100
Pe
rce
nta
ge
Pa
ssin
g
British Standard Sieve SizeSieve Analysis
73
mm
50
37
.5
26
.5
20
100.1
5
6.353.3
5
2.3
6
1.7
1.1
8
0.0
6
0.4
25
0.3
0.2
12
0.0
75
0.0
63
SILT
MEDIUMFINE COARSE FINE MEDIUM COARSE FINE MEDIUM COARSE
SAND GRAVELCLAY
CO
BB
LE
S
69

SIEVE NO.
APPROX IMPERIAL
EQUIV (Seive No.)
BRITISH STANDARD
SIEVE SIZES (mm) RETAINED IN gm PASSING IN gm
PASSING IN
(%)
3 75
2 ½
2 50
1 ½ 37.5
1 26.5
¾ 20
½ 14
⅜ 10
¼ 6.3
3/16 5
⅛ 3.35 100 100
7 2.36 100 100
10 2 100 100
14 1.18 1.98 98.02 98.02
25 0.6 11 87.02 87.02
36 0.425 5.31 81.71 81.71
52 0.3 11.24 70.47 70.47
72 0.212 7.79 62.68 62.68
100 0.15 3.96 58.72 58.72
200 0.075 5.29 53.43 53.43
UNIBEN GEOTECH RESEARCH
GRAIN SIZE ANALYSIS BY WET-SIEVING
SITE: … OKOMU JOB:.............
LOCATION: ...STERILIZER , BH4. DATE: 08-06--2018………
DEPTH: ……. 12.5m…… TESTED BY:……WET SIEVE………
0
10
20
30
40
50
60
70
80
90
100
0.0001 0.001 0.01 0.1 1 10 100
Pe
rce
nta
ge
Pa
ssin
g
British Standard Sieve SizeSieve Analysis
73
mm
50
37
.5
26
.5
20
100.1
5
6.353.3
5
2.3
6
1.7
1.1
8
0.0
6
0.4
25
0.3
0.2
12
0.0
75
0.0
63
SILT
MEDIUMFINE COARSE FINE MEDIUM COARSE FINE MEDIUM COARSE
SAND GRAVELCLAY
CO
BB
LE
S
70

SIEVE NO.
APPROX IMPERIAL
EQUIV (inches)
BRITISH STANDARD
SIEVE SIZES (mm) RETAINED IN gm PASSING IN gm
PASSING IN
(%)
3 75
2 ½
2 50
1 ½ 37.5
1 26.5
¾ 20
½ 14
⅜ 10
¼ 6.3
3/16 5
⅛ 3.35 100 100
7 2.36 100 100
10 2 100 100
14 1.18 1.71 98.29 98.29
25 0.6 10.32 87.97 87.97
36 0.425 6.36 81.61 81.61
52 0.3 8.95 72.66 72.66
72 0.212 7.58 65.08 65.08
100 0.15 3.18 61.9 61.9
200 0.075 4.59 57.31 57.31
UNIBEN GEOTECH RESEARCH
GRAIN SIZE ANALYSIS BY WET-SIEVING
SITE: … OKOMU JOB:.............
LOCATION: ...STERILIZER , BH4. DATE: 08-06--2018………
DEPTH: ……. 15.0m…… TESTED BY:……WET SIEVE………
0
10
20
30
40
50
60
70
80
90
100
0.0001 0.001 0.01 0.1 1 10 100
Pe
rce
nta
ge
Pa
ssin
g
British Standard Sieve SizeSieve Analysis
73
mm
50
37
.5
26
.5
20
100.1
5
6.353.3
5
2.3
6
1.7
1.1
8
0.0
6
0.4
25
0.3
0.2
12
0.0
75
0.0
63
SILT
MEDIUMFINE COARSE FINE MEDIUM COARSE FINE MEDIUM COARSE
SAND GRAVELCLAY
CO
BB
LE
S
71

SIEVE NO.
APPROX IMPERIAL
EQUIV (Seive No.)
BRITISH STANDARD
SIEVE SIZES (mm) RETAINED IN gm PASSING IN gm
PASSING IN
(%)
3 75
2 ½
2 50
1 ½ 37.5
1 26.5
¾ 20
½ 14
⅜ 10
¼ 6.3
3/16 5
⅛ 3.35 100 100
7 2.36 100 100
10 2 100 100
14 1.18 1.22 98.78 98.78
25 0.6 12.27 86.51 86.51
36 0.425 8.17 78.34 78.34
52 0.3 12.19 66.15 66.15
72 0.212 9.52 56.63 56.63
100 0.15 3.39 53.24 53.24
200 0.075 4.67 48.57 48.57
UNIBEN GEOTECH RESEARCH
GRAIN SIZE ANALYSIS BY WET-SIEVING
SITE: … OKOMU JOB:.............
LOCATION: .....PRESSING STATION , BH5. DATE: 08-06--2018………
DEPTH: ……. 1.5m…… TESTED BY:……WET SIEVE………
0
10
20
30
40
50
60
70
80
90
100
0.0001 0.001 0.01 0.1 1 10 100
Pe
rce
nta
ge
Pa
ssin
g
British Standard Sieve SizeSieve Analysis
73
mm
50
37
.5
26
.5
20
100.1
5
6.353.3
5
2.3
6
1.7
1.1
8
0.0
6
0.4
25
0.3
0.2
12
0.0
75
0.0
63
SILT
MEDIUMFINE COARSE FINE MEDIUM COARSE FINE MEDIUM COARSE
SAND GRAVELCLAY
CO
BB
LE
S
72

SIEVE NO.
APPROX IMPERIAL
EQUIV (Seive No.)
BRITISH STANDARD
SIEVE SIZES (mm) RETAINED IN gm PASSING IN gm
PASSING IN
(%)
3 75
2 ½
2 50
1 ½ 37.5
1 26.5
¾ 20
½ 14
⅜ 10
¼ 6.3
3/16 5
⅛ 3.35 100 100
7 2.36 100 100
10 2 0.06 99.94 99.94
14 1.18 1.83 98.11 98.11
25 0.6 9.12 88.99 88.99
36 0.425 5.66 83.33 83.33
52 0.3 8.15 75.18 75.18
72 0.212 5.65 69.53 69.53
100 0.15 3.95 65.58 65.58
200 0.075 4.05 61.53 61.53
UNIBEN GEOTECH RESEARCH
GRAIN SIZE ANALYSIS BY WET-SIEVING
SITE: … OKOMU JOB:.............
LOCATION: .....PRESSING STATION , BH5. DATE: 08-06--2018………
DEPTH: ……. 4.5m…… TESTED BY:……WET SIEVE………
0
10
20
30
40
50
60
70
80
90
100
0.0001 0.001 0.01 0.1 1 10 100
Pe
rce
nta
ge
Pa
ssin
g
British Standard Sieve SizeSieve Analysis
73
mm
50
37
.5
26
.5
20
100.1
5
6.353.3
5
2.3
6
1.7
1.1
8
0.0
6
0.4
25
0.3
0.2
12
0.0
75
0.0
63
SILT
MEDIUMFINE COARSE FINE MEDIUM COARSE FINE MEDIUM COARSE
SAND GRAVELCLAY
CO
BB
LE
S
73

SIEVE NO.
APPROX IMPERIAL
EQUIV (Seive No.)
BRITISH STANDARD
SIEVE SIZES (mm) RETAINED IN gm PASSING IN gm
PASSING IN
(%)
3 75
2 ½
2 50
1 ½ 37.5
1 26.5
¾ 20
½ 14
⅜ 10
¼ 6.3
3/16 5
⅛ 3.35 100 100
7 2.36 100 100
10 2 100 100
14 1.18 2.52 97.48 97.48
25 0.6 11.14 86.34 86.34
36 0.425 4.78 81.56 81.56
52 0.3 10.95 70.61 70.61
72 0.212 8.62 61.99 61.99
100 0.15 4.55 57.44 57.44
200 0.075 6.58 50.86 50.86
UNIBEN GEOTECH RESEARCH
GRAIN SIZE ANALYSIS BY WET-SIEVING
SITE: … OKOMU JOB:.............
LOCATION: .....PRESSING STATION , BH5. DATE: 08-06--2018………
DEPTH: ……. 7.5m…… TESTED BY:……WET SIEVE………
0
10
20
30
40
50
60
70
80
90
100
0.0001 0.001 0.01 0.1 1 10 100
Pe
rce
nta
ge
Pa
ssin
g
British Standard Sieve SizeSieve Analysis
73
mm
50
37
.5
26
.5
20
100.1
5
6.353.3
5
2.3
6
1.7
1.1
8
0.0
6
0.4
25
0.3
0.2
12
0.0
75
0.0
63
SILT
MEDIUMFINE COARSE FINE MEDIUM COARSE FINE MEDIUM COARSE
SAND GRAVELCLAY
CO
BB
LE
S
74

SIEVE NO.
APPROX IMPERIAL
EQUIV (Seive No.)
BRITISH STANDARD
SIEVE SIZES (mm) RETAINED IN gm PASSING IN gm
PASSING IN
(%)
3 75
2 ½
2 50
1 ½ 37.5
1 26.5
¾ 20
½ 14
⅜ 10
¼ 6.3
3/16 5
⅛ 3.35 100 100
7 2.36 100 100
10 2 100 100
14 1.18 2.57 97.43 97.43
25 0.6 11.61 85.82 85.82
36 0.425 6.57 79.25 79.25
52 0.3 11.82 67.43 67.43
72 0.212 7.72 59.71 59.71
100 0.15 4.37 55.34 55.34
200 0.075 6.22 49.12 49.12
UNIBEN GEOTECH RESEARCH
GRAIN SIZE ANALYSIS BY WET-SIEVING
SITE: … OKOMU JOB:.............
LOCATION: .....PRESSING STATION , BH5. DATE: 08-06--2018………
DEPTH: ……. 14.5m…… TESTED BY:……WET SIEVE………
0
10
20
30
40
50
60
70
80
90
100
0.0001 0.001 0.01 0.1 1 10 100
Pe
rce
nta
ge
Pa
ssin
g
British Standard Sieve SizeSieve Analysis
73
mm
50
37
.5
26
.5
20
100.1
5
6.353.3
5
2.3
6
1.7
1.1
8
0.0
6
0.4
25
0.3
0.2
12
0.0
75
0.0
63
SILT
MEDIUMFINE COARSE FINE MEDIUM COARSE FINE MEDIUM COARSE
SAND GRAVELCLAY
CO
BB
LE
S
75

SIEVE NO.
APPROX IMPERIAL
EQUIV (Seive No.)
BRITISH STANDARD
SIEVE SIZES (mm) RETAINED IN gm PASSING IN gm
PASSING IN
(%)
3 75
2 ½
2 50
1 ½ 37.5
1 26.5
¾ 20
½ 14
⅜ 10
¼ 6.3
3/16 5
⅛ 3.35 100 100
7 2.36 0.08 99.92 99.92
10 2 0.06 99.86 99.86
14 1.18 1.78 98.08 98.08
25 0.6 9.15 88.93 88.93
36 0.425 5.31 83.62 83.62
52 0.3 10.85 72.77 72.77
72 0.212 7.12 65.65 65.65
100 0.15 4.72 60.93 60.93
200 0.075 6.96 53.97 53.97
UNIBEN GEOTECH RESEARCH
GRAIN SIZE ANALYSIS BY WET-SIEVING
SITE: … OKOMU JOB:.............
LOCATION: .....PRESSING STATION , BH5. DATE: 08-06--2018………
DEPTH: ……. 10.5m…… TESTED BY:……WET SIEVE………
0
10
20
30
40
50
60
70
80
90
100
0.0001 0.001 0.01 0.1 1 10 100
Pe
rce
nta
ge
Pa
ssin
g
British Standard Sieve SizeSieve Analysis
73
mm
50
37
.5
26
.5
20
100.1
5
6.353.3
5
2.3
6
1.7
1.1
8
0.0
6
0.4
25
0.3
0.2
12
0.0
75
0.0
63
SILT
MEDIUMFINE COARSE FINE MEDIUM COARSE FINE MEDIUM COARSE
SAND GRAVELCLAY
CO
BB
LE
S
76

SIEVE NO.
APPROX IMPERIAL
EQUIV (Seive No.)
BRITISH STANDARD
SIEVE SIZES (mm) RETAINED IN gm PASSING IN gm
PASSING IN
(%)
3 75
2 ½
2 50
1 ½ 37.5
1 26.5
¾ 20
½ 14
⅜ 10
¼ 6.3
3/16 5
⅛ 3.35 100 100
7 2.36 100 100
10 2 100 100
14 1.18 1.72 98.28 98.28
25 0.6 12.1 86.18 86.18
36 0.425 6.95 79.23 79.23
52 0.3 12.79 66.44 66.44
72 0.212 5.95 60.49 60.49
100 0.15 4.54 55.95 55.95
200 0.075 4.84 51.11 51.11
UNIBEN GEOTECH RESEARCH
GRAIN SIZE ANALYSIS BY WET-SIEVINGSITE: … OKOMU JOB:.............
LOCATION: .....STORAGE TANK , BH6. DATE: 08-06--2018………
DEPTH: ……. 1.0m…… TESTED BY:……WET SIEVE………
0
10
20
30
40
50
60
70
80
90
100
0.0001 0.001 0.01 0.1 1 10 100
Perc
enta
ge P
assin
g
British Standard Sieve SizeSieve Analysis
73
mm
50
37
.5
26
.5
20
100.1
5
6.353.3
5
2.3
6
1.7
1.1
8
0.0
6
0.4
25
0.3
0.2
12
0.0
75
0.0
63
SILT
MEDIUMFINE COARSE FINE MEDIUM COARSE FINE MEDIUM COARSE
SAND GRAVELCLAY
CO
BB
LE
77

SIEVE NO.
APPROX IMPERIAL
EQUIV (Seive No.)
BRITISH STANDARD
SIEVE SIZES (mm) RETAINED IN gm PASSING IN gm
PASSING IN
(%)
3 75
2 ½
2 50
1 ½ 37.5
1 26.5
¾ 20
½ 14
⅜ 10
¼ 6.3
3/16 5
⅛ 3.35 100 100
7 2.36 100 100
10 2 100 100
14 1.18 2.09 97.91 97.91
25 0.6 10.55 87.36 87.36
36 0.425 5.67 81.69 81.69
52 0.3 9.94 71.75 71.75
72 0.212 6.66 65.09 65.09
100 0.15 4.34 60.75 60.75
200 0.075 5.3 55.45 55.45
UNIBEN GEOTECH RESEARCH
GRAIN SIZE ANALYSIS BY WET-SIEVINGSITE: … OKOMU JOB:.............
LOCATION: .....STORAGE TANK , BH6. DATE: 08-06--2018………
DEPTH: ……. 4.0m…… TESTED BY:……WET SIEVE………
0
10
20
30
40
50
60
70
80
90
100
0.0001 0.001 0.01 0.1 1 10 100
Perc
enta
ge P
assin
g
British Standard Sieve SizeSieve Analysis
73
mm
50
37
.5
26
.5
20
100.1
5
6.353.3
5
2.3
6
1.7
1.1
8
0.0
6
0.4
25
0.3
0.2
12
0.0
75
0.0
63
SILT
MEDIUMFINE COARSE FINE MEDIUM COARSE FINE MEDIUM COARSE
SAND GRAVELCLAY
CO
BB
LE
78

SIEVE NO.
APPROX IMPERIAL
EQUIV (Seive No.)
BRITISH STANDARD
SIEVE SIZES (mm) RETAINED IN gm PASSING IN gm
PASSING IN
(%)
3 75
2 ½
2 50
1 ½ 37.5
1 26.5
¾ 20
½ 14
⅜ 10
¼ 6.3
3/16 5
⅛ 3.35 100 100
7 2.36 100 100
10 2 100 100
14 1.18 1.97 98.03 98.03
25 0.6 9.79 88.24 88.24
36 0.425 5.85 82.39 82.39
52 0.3 10.21 72.18 72.18
72 0.212 7.16 65.02 65.02
100 0.15 4.52 60.5 60.5
200 0.075 5.89 54.61 54.61
UNIBEN GEOTECH RESEARCH
GRAIN SIZE ANALYSIS BY WET-SIEVINGSITE: … OKOMU JOB:.............
LOCATION: .....STORAGE TANK , BH6. DATE: 08-06--2018………
DEPTH: ……. 7.0m…… TESTED BY:……WET SIEVE………
0
10
20
30
40
50
60
70
80
90
100
0.0001 0.001 0.01 0.1 1 10 100
Perc
enta
ge P
assin
g
British Standard Sieve SizeSieve Analysis
73
mm
50
37
.5
26
.5
20
100.1
5
6.353.3
5
2.3
6
1.7
1.1
8
0.0
6
0.4
25
0.3
0.2
12
0.0
75
0.0
63
SILT
MEDIUMFINE COARSE FINE MEDIUM COARSE FINE MEDIUM COARSE
SAND GRAVELCLAY
CO
BB
LE
79

SIEVE NO.
APPROX IMPERIAL
EQUIV (Seive No.)
BRITISH STANDARD
SIEVE SIZES (mm) RETAINED IN gm PASSING IN gm
PASSING IN
(%)
3 75
2 ½
2 50
1 ½ 37.5
1 26.5
¾ 20
½ 14
⅜ 10
¼ 6.3
3/16 5
⅛ 3.35 100 100
7 2.36 100 100
10 2 0.36 99.64 99.64
14 1.18 2.56 97.08 97.08
25 0.6 12.85 84.23 84.23
36 0.425 6.32 77.91 77.91
52 0.3 10.78 67.13 67.13
72 0.212 7.02 60.11 60.11
100 0.15 4.1 56.01 56.01
200 0.075 6.94 49.07 49.07
UNIBEN GEOTECH RESEARCH
GRAIN SIZE ANALYSIS BY WET-SIEVINGSITE: … OKOMU JOB:.............
LOCATION: .....STORAGE TANK , BH6. DATE: 08-06--2018………
DEPTH: ……. 10.0m…… TESTED BY:……WET SIEVE………
0
10
20
30
40
50
60
70
80
90
100
0.0001 0.001 0.01 0.1 1 10 100
Perc
enta
ge P
assin
g
British Standard Sieve SizeSieve Analysis
73
mm
50
37
.5
26
.5
20
100.1
5
6.353.3
5
2.3
6
1.7
1.1
8
0.0
6
0.4
25
0.3
0.2
12
0.0
75
0.0
63
SILT
MEDIUMFINE COARSE FINE MEDIUM COARSE FINE MEDIUM COARSE
SAND GRAVELCLAY
CO
BB
LE
80

SIEVE NO.
APPROX IMPERIAL
EQUIV (Seive No.)
BRITISH STANDARD
SIEVE SIZES (mm) RETAINED IN gm PASSING IN gm
PASSING IN
(%)
3 75
2 ½
2 50
1 ½ 37.5
1 26.5
¾ 20
½ 14
⅜ 10
¼ 6.3
3/16 5
⅛ 3.35 100 100
7 2.36 100 100
10 2 100 100
14 1.18 1.62 98.38 98.38
25 0.6 8.82 89.56 89.56
36 0.425 5.02 84.54 84.54
52 0.3 8.87 75.67 75.67
72 0.212 6.62 69.05 69.05
100 0.15 3.54 65.51 65.51
200 0.075 5.29 60.22 60.22
UNIBEN GEOTECH RESEARCH
GRAIN SIZE ANALYSIS BY WET-SIEVINGSITE: … OKOMU JOB:.............
LOCATION: .....STORAGE TANK , BH6. DATE: 08-06--2018………
DEPTH: ……. 13.0m…… TESTED BY:……WET SIEVE………
0
10
20
30
40
50
60
70
80
90
100
0.0001 0.001 0.01 0.1 1 10 100
Perc
enta
ge P
assin
g
British Standard Sieve SizeSieve Analysis
73
mm
50
37
.5
26
.5
20
100.1
5
6.353.3
5
2.3
6
1.7
1.1
8
0.0
6
0.4
25
0.3
0.2
12
0.0
75
0.0
63
SILT
MEDIUMFINE COARSE FINE MEDIUM COARSE FINE MEDIUM COARSE
SAND GRAVELCLAY
CO
BB
LE
81

SIEVE NO.
APPROX IMPERIAL
EQUIV (Seive No.)
BRITISH STANDARD
SIEVE SIZES (mm) RETAINED IN gm PASSING IN gm
PASSING IN
(%)
3 75
2 ½
2 50
1 ½ 37.5
1 26.5
¾ 20
½ 14
⅜ 10
¼ 6.3
3/16 5
⅛ 3.35 100 100
7 2.36 0.09 99.91 99.91
10 2 0.1 99.81 99.81
14 1.18 1.76 98.05 98.05
25 0.6 8.39 89.66 89.66
36 0.425 5.55 84.11 84.11
52 0.3 8.67 75.44 75.44
72 0.212 7.29 68.15 68.15
100 0.15 3.53 64.62 64.62
200 0.075 6.06 58.56 58.56
UNIBEN GEOTECH RESEARCH
GRAIN SIZE ANALYSIS BY WET-SIEVINGSITE: … OKOMU JOB:.............
LOCATION: .....STORAGE TANK , BH6. DATE: 08-06--2018………
DEPTH: ……. 15.0m…… TESTED BY:……WET SIEVE………
0
10
20
30
40
50
60
70
80
90
100
0.0001 0.001 0.01 0.1 1 10 100
Perc
enta
ge P
assin
g
British Standard Sieve SizeSieve Analysis
73
mm
50
37
.5
26
.5
20
100.1
5
6.353.3
5
2.3
6
1.7
1.1
8
0.0
6
0.4
25
0.3
0.2
12
0.0
75
0.0
63
SILT
MEDIUMFINE COARSE FINE MEDIUM COARSE FINE MEDIUM COARSE
SAND GRAVELCLAY
CO
BB
LE
82

SIEVE NO.
APPROX IMPERIAL
EQUIV (Seive No.)
BRITISH STANDARD
SIEVE SIZES (mm) RETAINED IN gm PASSING IN gm
PASSING IN
(%)
3 75
2 ½
2 50
1 ½ 37.5
1 26.5
¾ 20
½ 14
⅜ 10
¼ 6.3
3/16 5
⅛ 3.35 100 100
7 2.36 100 100
10 2 100 100
14 1.18 1.49 98.51 98.51
25 0.6 8.73 89.78 89.78
36 0.425 9.21 80.57 80.57
52 0.3 10.12 70.45 70.45
72 0.212 6.9 63.55 63.55
100 0.15 3.82 59.73 59.73
200 0.075 5.18 54.55 54.55
UNIBEN GEOTECH RESEARCH
GRAIN SIZE ANALYSIS BY WET-SIEVINGSITE: … OKOMU JOB:.............
LOCATION: .....WEIGH BRIDGE , BH7. DATE: 08-06--2018………
DEPTH: ……. 7.0m…… TESTED BY:……WET SIEVE………
0
10
20
30
40
50
60
70
80
90
100
0.0001 0.001 0.01 0.1 1 10 100
Perc
enta
ge P
assin
g
British Standard Sieve SizeSieve Analysis
73
mm
50
37
.5
26
.5
20
100.1
5
6.353.3
5
2.3
6
1.7
1.1
8
0.0
6
0.4
25
0.3
0.2
12
0.0
75
0.0
63
SILT
MEDIUMFINE COARSE FINE MEDIUM COARSE FINE MEDIUM COARSE
SAND GRAVELCLAY
CO
BB
LE
83

SIEVE NO.
APPROX IMPERIAL
EQUIV (Seive No.)
BRITISH STANDARD
SIEVE SIZES (mm) RETAINED IN gm PASSING IN gm
PASSING IN
(%)
3 75
2 ½
2 50
1 ½ 37.5
1 26.5
¾ 20
½ 14
⅜ 10
¼ 6.3
3/16 5
⅛ 3.35 100 100
7 2.36 100 100
10 2 0.04 99.96 99.96
14 1.18 1.46 98.5 98.5
25 0.6 8.98 89.52 89.52
36 0.425 4.49 85.03 85.03
52 0.3 9.23 75.8 75.8
72 0.212 5.48 70.32 70.32
100 0.15 2.66 67.66 67.66
200 0.075 3.61 64.05 64.05
UNIBEN GEOTECH RESEARCH
GRAIN SIZE ANALYSIS BY WET-SIEVINGSITE: … OKOMU JOB:.............
LOCATION: .....WEIGH BRIDGE , BH7. DATE: 08-06--2018………
DEPTH: ……. 4.0m…… TESTED BY:……WET SIEVE………
0
10
20
30
40
50
60
70
80
90
100
0.0001 0.001 0.01 0.1 1 10 100
Perc
enta
ge P
assin
g
British Standard Sieve SizeSieve Analysis
73
mm
50
37
.5
26
.5
20
100.1
5
6.353.3
5
2.3
6
1.7
1.1
8
0.0
6
0.4
25
0.3
0.2
12
0.0
75
0.0
63
SILT
MEDIUMFINE COARSE FINE MEDIUM COARSE FINE MEDIUM COARSE
SAND GRAVELCLAY
CO
BB
LE
84
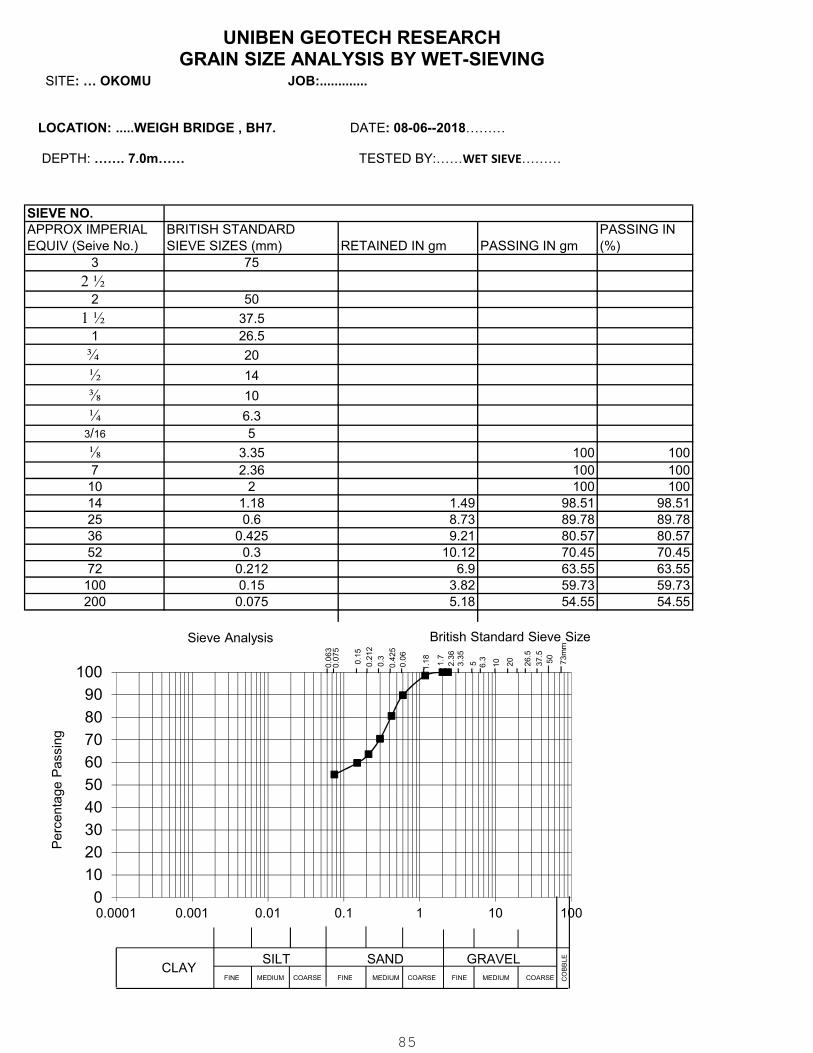
SIEVE NO.
APPROX IMPERIAL
EQUIV (Seive No.)
BRITISH STANDARD
SIEVE SIZES (mm) RETAINED IN gm PASSING IN gm
PASSING IN
(%)
3 75
2 ½
2 50
1 ½ 37.5
1 26.5
¾ 20
½ 14
⅜ 10
¼ 6.3
3/16 5
⅛ 3.35 100 100
7 2.36 100 100
10 2 100 100
14 1.18 1.49 98.51 98.51
25 0.6 8.73 89.78 89.78
36 0.425 9.21 80.57 80.57
52 0.3 10.12 70.45 70.45
72 0.212 6.9 63.55 63.55
100 0.15 3.82 59.73 59.73
200 0.075 5.18 54.55 54.55
UNIBEN GEOTECH RESEARCH
GRAIN SIZE ANALYSIS BY WET-SIEVINGSITE: … OKOMU JOB:.............
LOCATION: .....WEIGH BRIDGE , BH7. DATE: 08-06--2018………
DEPTH: ……. 7.0m…… TESTED BY:……WET SIEVE………
0
10
20
30
40
50
60
70
80
90
100
0.0001 0.001 0.01 0.1 1 10 100
Perc
enta
ge P
assin
g
British Standard Sieve SizeSieve Analysis
73
mm
50
37
.5
26
.5
20
100.1
5
6.353.3
5
2.3
6
1.7
1.1
8
0.0
6
0.4
25
0.3
0.2
12
0.0
75
0.0
63
SILT
MEDIUMFINE COARSE FINE MEDIUM COARSE FINE MEDIUM COARSE
SAND GRAVELCLAY
CO
BB
LE
85

SIEVE NO.
APPROX IMPERIAL
EQUIV (Seive No.)
BRITISH STANDARD
SIEVE SIZES (mm) RETAINED IN gm PASSING IN gm
PASSING IN
(%)
3 75
2 ½
2 50
1 ½ 37.5
1 26.5
¾ 20
½ 14
⅜ 10
¼ 6.3
3/16 5
⅛ 3.35 100 100
7 2.36 100 100
10 2 100 100
14 1.18 2.35 97.65 97.65
25 0.6 11.02 86.63 86.63
36 0.425 5.23 81.40 81.40
52 0.3 10.47 70.93 70.93
72 0.212 7.71 63.22 63.22
100 0.15 4.18 59.04 59.04
200 0.075 6.26 52.78 52.78
UNIBEN GEOTECH RESEARCH
GRAIN SIZE ANALYSIS BY WET-SIEVINGSITE: … OKOMU JOB:.............
LOCATION: .....WEIGH BRIDGE , BH7. DATE: 08-06--2018………
DEPTH: ……. 10.0m…… TESTED BY:……WET SIEVE………
0
10
20
30
40
50
60
70
80
90
100
0.0001 0.001 0.01 0.1 1 10 100
Perc
enta
ge P
assin
g
British Standard Sieve SizeSieve Analysis
73
mm
50
37
.5
26
.5
20
100.1
5
6.353.3
5
2.3
6
1.7
1.1
8
0.0
6
0.4
25
0.3
0.2
12
0.0
75
0.0
63
SILT
MEDIUMFINE COARSE FINE MEDIUM COARSE FINE MEDIUM COARSE
SAND GRAVELCLAY
CO
BB
LE
86

SIEVE NO.
APPROX IMPERIAL
EQUIV (Seive No.)
BRITISH STANDARD
SIEVE SIZES (mm) RETAINED IN gm PASSING IN gm
PASSING IN
(%)
3 75
2 ½
2 50
1 ½ 37.5
1 26.5
¾ 20
½ 14
⅜ 10
¼ 6.3
3/16 5
⅛ 3.35 100 100
7 2.36 0.1 99.9 99.9
10 2 0.05 99.85 99.85
14 1.18 1.56 98.29 98.29
25 0.6 9.59 88.7 88.7
36 0.425 5.26 83.44 83.44
52 0.3 8.76 74.68 74.68
72 0.212 6.34 68.34 68.34
100 0.15 3.86 64.48 64.48
200 0.075 5.03 59.45 59.45
UNIBEN GEOTECH RESEARCH
GRAIN SIZE ANALYSIS BY WET-SIEVINGSITE: … OKOMU JOB:.............
LOCATION: .....WEIGH BRIDGE , BH7. DATE: 08-06--2018………
DEPTH: ……. 13.0m…… TESTED BY:……WET SIEVE………
0
10
20
30
40
50
60
70
80
90
100
0.0001 0.001 0.01 0.1 1 10 100
Perc
enta
ge P
assin
g
British Standard Sieve SizeSieve Analysis
73
mm
50
37
.5
26
.5
20
100.1
5
6.353.3
5
2.3
6
1.7
1.1
8
0.0
6
0.4
25
0.3
0.2
12
0.0
75
0.0
63
SILT
MEDIUMFINE COARSE FINE MEDIUM COARSE FINE MEDIUM COARSE
SAND GRAVELCLAY
CO
BB
LE
87

SIEVE NO.
APPROX IMPERIAL
EQUIV (Seive No.)
BRITISH STANDARD
SIEVE SIZES (mm) RETAINED IN gm PASSING IN gm
PASSING IN
(%)
3 75
2 ½
2 50
1 ½ 37.5
1 26.5
¾ 20
½ 14
⅜ 10
¼ 6.3
3/16 5
⅛ 3.35 100 100
7 2.36 100 100
10 2 100 100
14 1.18 1.8 98.2 98.2
25 0.6 9.9 88.3 88.3
36 0.425 4.18 84.12 84.12
52 0.3 10.16 73.96 73.96
72 0.212 7.35 66.61 66.61
100 0.15 3.86 62.75 62.75
200 0.075 5.2 57.55 57.55
UNIBEN GEOTECH RESEARCH
GRAIN SIZE ANALYSIS BY WET-SIEVINGSITE: … OKOMU JOB:.............
LOCATION: .....WEIGH BRIDGE , BH7. DATE: 08-06--2018………
DEPTH: ……. 15.0m…… TESTED BY:……WET SIEVE………
0
10
20
30
40
50
60
70
80
90
100
0.0001 0.001 0.01 0.1 1 10 100
Perc
enta
ge P
assin
g
British Standard Sieve SizeSieve Analysis
73
mm
50
37
.5
26
.5
20
100.1
5
6.353.3
5
2.3
6
1.7
1.1
8
0.0
6
0.4
25
0.3
0.2
12
0.0
75
0.0
63
SILT
MEDIUMFINE COARSE FINE MEDIUM COARSE FINE MEDIUM COARSE
SAND GRAVELCLAY
CO
BB
LE
88

SIEVE NO.
APPROX IMPERIAL
EQUIV (Seive No.)
BRITISH STANDARD
SIEVE SIZES (mm) RETAINED IN gm PASSING IN gm
PASSING IN
(%)
3 75
2 ½
2 50
1 ½ 37.5
1 26.5
¾ 20
½ 14
⅜ 10
¼ 6.3
3/16 5
⅛ 3.35 100 100
7 2.36 100 100
10 2 100 100
14 1.18 2.32 97.68 97.68
25 0.6 12.88 84.8 84.8
36 0.425 5.9 78.90 78.90
52 0.3 10.27 68.63 68.63
72 0.212 7.79 60.84 60.84
100 0.15 3.9 56.94 56.94
200 0.075 5.02 51.92 51.92
UNIBEN GEOTECH RESEARCH
GRAIN SIZE ANALYSIS BY WET-SIEVINGSITE: … OKOMU JOB:.............
LOCATION: .....WATER TANK , BH8. DATE: 08-06--2018………
DEPTH: ……. 3.0m…… TESTED BY:……WET SIEVE………
0
10
20
30
40
50
60
70
80
90
100
0.0001 0.001 0.01 0.1 1 10 100
Perc
enta
ge P
assin
g
British Standard Sieve SizeSieve Analysis
73
mm
50
37
.5
26
.5
20
100.1
5
6.353.3
5
2.3
6
1.7
1.1
8
0.0
6
0.4
25
0.3
0.2
12
0.0
75
0.0
63
SILT
MEDIUMFINE COARSE FINE MEDIUM COARSE FINE MEDIUM COARSE
SAND GRAVELCLAY
CO
BB
LE
89

SIEVE NO.
APPROX IMPERIAL
EQUIV (Seive No.)
BRITISH STANDARD
SIEVE SIZES (mm) RETAINED IN gm PASSING IN gm
PASSING IN
(%)
3 75
2 ½
2 50
1 ½ 37.5
1 26.5
¾ 20
½ 14
⅜ 10
¼ 6.3
3/16 5
⅛ 3.35 100 100
7 2.36 100 100
10 2 100 100
14 1.18 2.65 97.35 97.35
25 0.6 12.79 84.56 84.56
36 0.425 5.5 79.06 79.06
52 0.3 10.69 68.37 68.37
72 0.212 6.27 62.1 62.1
100 0.15 3.74 58.36 58.36
200 0.075 4.97 53.39 53.39
UNIBEN GEOTECH RESEARCH
GRAIN SIZE ANALYSIS BY WET-SIEVINGSITE: … OKOMU JOB:.............
LOCATION: .....WATER TANK , BH8. DATE: 08-06--2018………
DEPTH: ……. 6.0m…… TESTED BY:……WET SIEVE………
0
10
20
30
40
50
60
70
80
90
100
0.0001 0.001 0.01 0.1 1 10 100
Perc
enta
ge P
assin
g
British Standard Sieve SizeSieve Analysis
73
mm
50
37
.5
26
.5
20
100.1
5
6.353.3
5
2.3
6
1.7
1.1
8
0.0
6
0.4
25
0.3
0.2
12
0.0
75
0.0
63
SILT
MEDIUMFINE COARSE FINE MEDIUM COARSE FINE MEDIUM COARSE
SAND GRAVELCLAY
CO
BB
LE
90

SIEVE NO.
APPROX IMPERIAL
EQUIV (Seive No.)
BRITISH STANDARD
SIEVE SIZES (mm) RETAINED IN gm PASSING IN gm
PASSING IN
(%)
3 75
2 ½
2 50
1 ½ 37.5
1 26.5
¾ 20
½ 14
⅜ 10
¼ 6.3
3/16 5
⅛ 3.35 100 100
7 2.36 100 100
10 2 0.06 99.94 99.94
14 1.18 1.67 98.27 98.27
25 0.6 9.84 88.43 88.43
36 0.425 4.44 83.99 83.99
52 0.3 11.42 72.57 72.57
72 0.212 7.23 65.34 65.34
100 0.15 4.01 61.33 61.33
200 0.075 5.5 55.83 55.83
UNIBEN GEOTECH RESEARCH
GRAIN SIZE ANALYSIS BY WET-SIEVINGSITE: … OKOMU JOB:.............
LOCATION: .....WATER TANK , BH8. DATE: 08-06--2018………
DEPTH: ……. 9.0m…… TESTED BY:……WET SIEVE………
0
10
20
30
40
50
60
70
80
90
100
0.0001 0.001 0.01 0.1 1 10 100
Perc
enta
ge P
assin
g
British Standard Sieve SizeSieve Analysis
73
mm
50
37
.5
26
.5
20
100.1
5
6.353.3
5
2.3
6
1.7
1.1
8
0.0
6
0.4
25
0.3
0.2
12
0.0
75
0.0
63
SILT
MEDIUMFINE COARSE FINE MEDIUM COARSE FINE MEDIUM COARSE
SAND GRAVELCLAY
CO
BB
LE
91

SIEVE NO.
APPROX IMPERIAL
EQUIV (Seive No.)
BRITISH STANDARD
SIEVE SIZES (mm) RETAINED IN gm PASSING IN gm
PASSING IN
(%)
3 75
2 ½
2 50
1 ½ 37.5
1 26.5
¾ 20
½ 14
⅜ 10
¼ 6.3
3/16 5
⅛ 3.35 100 100
7 2.36 100 100
10 2 100 100
14 1.18 1.49 98.51 98.51
25 0.6 10.01 88.5 88.5
36 0.425 5.32 83.18 83.18
52 0.3 9.9 73.28 73.28
72 0.212 7.12 66.16 66.16
100 0.15 3.54 62.62 62.62
200 0.075 5.09 57.53 57.53
UNIBEN GEOTECH RESEARCH
GRAIN SIZE ANALYSIS BY WET-SIEVINGSITE: … OKOMU JOB:.............
LOCATION: .....WATER TANK , BH8. DATE: 08-06--2018………
DEPTH: ……. 12.0m…… TESTED BY:……WET SIEVE………
0
10
20
30
40
50
60
70
80
90
100
0.0001 0.001 0.01 0.1 1 10 100
Perc
enta
ge P
assin
g
British Standard Sieve SizeSieve Analysis
73
mm
50
37
.5
26
.5
20
100.1
5
6.353.3
5
2.3
6
1.7
1.1
8
0.0
6
0.4
25
0.3
0.2
12
0.0
75
0.0
63
SILT
MEDIUMFINE COARSE FINE MEDIUM COARSE FINE MEDIUM COARSE
SAND GRAVELCLAY
CO
BB
LE
92

SIEVE NO.
APPROX IMPERIAL
EQUIV (inches)
BRITISH STANDARD
SIEVE SIZES (mm) RETAINED IN gm PASSING IN gm
PASSING IN
(%)
3 75
2 ½
2 50
1 ½ 37.5
1 26.5
¾ 20
½ 14
⅜ 10
¼ 6.3
3/16 5
⅛ 3.35 100 100
7 2.36 0.29 99.71 99.71
10 2 99.71 99.71
14 1.18 1.74 97.97 97.97
25 0.6 9.91 88.06 88.06
36 0.425 5.42 82.64 82.64
52 0.3 8.22 74.42 74.42
72 0.212 6.6 67.82 67.82
100 0.15 3.14 64.68 64.68
200 0.075 4.17 60.51 60.51
UNIBEN GEOTECH RESEARCH
GRAIN SIZE ANALYSIS BY WET-SIEVING
SITE: … OKOMU JOB:.............
LOCATION: .....WATER TANK , BH8. DATE: 08-06--2018………
DEPTH: ……. 15.0m…… TESTED BY:……WET SIEVE………
0
10
20
30
40
50
60
70
80
90
100
0.0001 0.001 0.01 0.1 1 10 100
Pe
rce
nta
ge
Pa
ssin
g
British Standard Sieve SizeSieve Analysis
73
mm
50
37
.5
26
.5
20
100.1
5
6.353.3
5
2.3
6
1.7
1.1
8
0.0
6
0.4
25
0.3
0.2
12
0.0
75
0.0
63
SILT
MEDIUMFINE COARSE FINE MEDIUM COARSE FINE MEDIUM COARSE
SAND GRAVELCLAY
CO
BB
LE
S
93

SIEVE NO.
APPROX IMPERIAL
EQUIV (Seive No.)
BRITISH STANDARD
SIEVE SIZES (mm) RETAINED IN gm PASSING IN gm
PASSING IN
(%)
3 75
2 ½
2 50
1 ½ 37.5
1 26.5
¾ 20
½ 14
⅜ 10
¼ 6.3
3/16 5
⅛ 3.35 100 100
7 2.36 100 100
10 2 100 100
14 1.18 1.57 98.43 98.43
25 0.6 13.37 85.06 85.06
36 0.425 8.4 76.66 76.66
52 0.3 13.82 62.84 62.84
72 0.212 8.44 54.4 54.4
100 0.15 3.38 51.02 51.02
200 0.075 3.7 47.32 47.32
UNIBEN GEOTECH RESEARCH
GRAIN SIZE ANALYSIS BY WET-SIEVINGSITE: … OKOMU JOB:.............
LOCATION: ...RAMP1 , BH9. DATE: 08-06--2018………
DEPTH: ……. 2.0m…… TESTED BY:……WET SIEVE………
0
10
20
30
40
50
60
70
80
90
100
0.0001 0.001 0.01 0.1 1 10 100
Perc
enta
ge P
assin
g
British Standard Sieve SizeSieve Analysis
73
mm
50
37
.5
26
.5
20
100.1
5
6.353.3
5
2.3
6
1.7
1.1
8
0.0
6
0.4
25
0.3
0.2
12
0.0
75
0.0
63
SILT
MEDIUMFINE COARSE FINE MEDIUM COARSE FINE MEDIUM COARSE
SAND GRAVELCLAY
CO
BB
LE
94

SIEVE NO.
APPROX IMPERIAL
EQUIV (Seive No.)
BRITISH STANDARD
SIEVE SIZES (mm) RETAINED IN gm PASSING IN gm
PASSING IN
(%)
3 75
2 ½
2 50
1 ½ 37.5
1 26.5
¾ 20
½ 14
⅜ 10
¼ 6.3
3/16 5
⅛ 3.35 100 100
7 2.36 100 100
10 2 100 100
14 1.18 1.31 98.69 98.69
25 0.6 14.87 83.82 83.82
36 0.425 10.05 73.77 73.77
52 0.3 15.44 58.33 58.33
72 0.212 9.4 48.93 48.93
100 0.15 3.97 44.96 44.96
200 0.075 4.85 40.11 40.11
UNIBEN GEOTECH RESEARCH
GRAIN SIZE ANALYSIS BY WET-SIEVING
SITE: … OKOMU JOB:.............
LOCATION: ...RAMP1 , BH9. DATE: 08-06--2018………
DEPTH: ……. 5.0m…… TESTED BY:……WET SIEVE………
0
10
20
30
40
50
60
70
80
90
100
0.0001 0.001 0.01 0.1 1 10 100
Pe
rce
nta
ge
Pa
ssin
g
British Standard Sieve SizeSieve Analysis
73
mm
50
37
.5
26
.5
20
100.1
5
6.353.3
5
2.3
6
1.7
1.1
8
0.0
6
0.4
25
0.3
0.2
12
0.0
75
0.0
63
SILT
MEDIUMFINE COARSE FINE MEDIUM COARSE FINE MEDIUM COARSE
SAND GRAVELCLAY
CO
BB
LE
S
95

SIEVE NO.
APPROX IMPERIAL
EQUIV (Seive No.)
BRITISH STANDARD
SIEVE SIZES (mm) RETAINED IN gm PASSING IN gm
PASSING IN
(%)
3 75
2 ½
2 50
1 ½ 37.5
1 26.5
¾ 20
½ 14
⅜ 10
¼ 6.3
3/16 5
⅛ 3.35 100 100
7 2.36 100 100
10 2 100 100
14 1.18 1.4 98.6 98.6
25 0.6 13.45 85.15 85.15
36 0.425 8.6 76.55 76.55
52 0.3 13.02 63.53 63.53
72 0.212 7.59 55.94 55.94
100 0.15 3.27 52.67 52.67
200 0.075 3.48 49.19 49.19
UNIBEN GEOTECH RESEARCH
GRAIN SIZE ANALYSIS BY WET-SIEVINGSITE: … OKOMU JOB:.............
LOCATION: ...RAMP1 , BH9. DATE: 08-06--2018………
DEPTH: ……. 8.0m…… TESTED BY:……WET SIEVE………
0
10
20
30
40
50
60
70
80
90
100
0.0001 0.001 0.01 0.1 1 10 100
Perc
enta
ge P
assin
g
British Standard Sieve SizeSieve Analysis
73
mm
50
37
.5
26
.5
20
100.1
5
6.353.3
5
2.3
6
1.7
1.1
8
0.0
6
0.4
25
0.3
0.2
12
0.0
75
0.0
63
SILT
MEDIUMFINE COARSE FINE MEDIUM COARSE FINE MEDIUM COARSE
SAND GRAVELCLAY
CO
BB
LE
96

SIEVE NO.
APPROX IMPERIAL
EQUIV (Seive No.)
BRITISH STANDARD
SIEVE SIZES (mm) RETAINED IN gm PASSING IN gm
PASSING IN
(%)
3 75
2 ½
2 50
1 ½ 37.5
1 26.5
¾ 20
½ 14
⅜ 10
¼ 6.3
3/16 5
⅛ 3.35 100 100
7 2.36 100 100
10 2 0.27 99.73 99.73
14 1.18 2.24 97.49 97.49
25 0.6 14.76 82.73 82.73
36 0.425 7.68 75.05 75.05
52 0.3 12.74 62.31 62.31
72 0.212 6.99 55.32 55.32
100 0.15 3.68 51.64 51.64
200 0.075 4.47 47.17 47.17
UNIBEN GEOTECH RESEARCH
GRAIN SIZE ANALYSIS BY WET-SIEVINGSITE: … OKOMU JOB:.............
LOCATION: ...RAMP1 , BH9. DATE: 08-06--2018………
DEPTH: ……. 11.0m…… TESTED BY:……WET SIEVE………
0
10
20
30
40
50
60
70
80
90
100
0.0001 0.001 0.01 0.1 1 10 100
Perc
enta
ge P
assin
g
British Standard Sieve SizeSieve Analysis
73
mm
50
37
.5
26
.5
20
100.1
5
6.353.3
5
2.3
6
1.7
1.1
8
0.0
6
0.4
25
0.3
0.2
12
0.0
75
0.0
63
SILT
MEDIUMFINE COARSE FINE MEDIUM COARSE FINE MEDIUM COARSE
SAND GRAVELCLAY
CO
BB
LE
97

SIEVE NO.
APPROX IMPERIAL
EQUIV (Seive No.)
BRITISH STANDARD
SIEVE SIZES (mm) RETAINED IN gm PASSING IN gm
PASSING IN
(%)
3 75
2 ½
2 50
1 ½ 37.5
1 26.5
¾ 20
½ 14
⅜ 10
¼ 6.3
3/16 5
⅛ 3.35 100 100
7 2.36 100 100
10 2 100 100
14 1.18 1.4 98.6 98.6
25 0.6 13.45 85.15 85.15
36 0.425 8.6 76.55 76.55
52 0.3 13.02 63.53 63.53
72 0.212 7.59 55.94 55.94
100 0.15 3.27 52.67 52.67
200 0.075 3.48 49.19 49.19
UNIBEN GEOTECH RESEARCH
GRAIN SIZE ANALYSIS BY WET-SIEVING
SITE: … OKOMU JOB:.............
LOCATION: ...RAMP1 , BH9. DATE: 08-06--2018………
DEPTH: ……. 8.0m…… TESTED BY:……WET SIEVE………
0
10
20
30
40
50
60
70
80
90
100
0.0001 0.001 0.01 0.1 1 10 100
Pe
rce
nta
ge
Pa
ssin
g
British Standard Sieve SizeSieve Analysis
73
mm
50
37
.5
26
.5
20
100.1
5
6.353.3
5
2.3
6
1.7
1.1
8
0.0
6
0.4
25
0.3
0.2
12
0.0
75
0.0
63
SILT
MEDIUMFINE COARSE FINE MEDIUM COARSE FINE MEDIUM COARSE
SAND GRAVELCLAY
CO
BB
LE
S
98

SIEVE NO.
APPROX IMPERIAL
EQUIV (Seive No.)
BRITISH STANDARD
SIEVE SIZES (mm) RETAINED IN gm PASSING IN gm
PASSING IN
(%)
3 75
2 ½
2 50
1 ½ 37.5
1 26.5
¾ 20
½ 14
⅜ 10
¼ 6.3
3/16 5
⅛ 3.35 100 100
7 2.36 100 100
10 2 100 100
14 1.18 1.03 98.97 98.97
25 0.6 11.32 87.65 87.65
36 0.425 6.69 80.96 80.96
52 0.3 13.4 67.56 67.56
72 0.212 7.93 59.63 59.63
100 0.15 3.69 55.94 55.94
200 0.075 3.96 51.98 51.98
UNIBEN GEOTECH RESEARCH
GRAIN SIZE ANALYSIS BY WET-SIEVING
SITE: … OKOMU JOB:.............
LOCATION: ...RAMPII , BH10. DATE: 08-06--2018………
DEPTH: ……. 1.5m…… TESTED BY:……WET SIEVE………
0
10
20
30
40
50
60
70
80
90
100
0.0001 0.001 0.01 0.1 1 10 100
Pe
rce
nta
ge
Pa
ssin
g
British Standard Sieve SizeSieve Analysis
73
mm
50
37
.5
26
.5
20
100.1
5
6.353.3
5
2.3
6
1.7
1.1
8
0.0
6
0.4
25
0.3
0.2
12
0.0
75
0.0
63
SILT
MEDIUMFINE COARSE FINE MEDIUM COARSE FINE MEDIUM COARSE
SAND GRAVELCLAY
CO
BB
LE
S
99

SIEVE NO.
APPROX IMPERIAL
EQUIV (Seive No.)
BRITISH STANDARD
SIEVE SIZES (mm) RETAINED IN gm PASSING IN gm
PASSING IN
(%)
3 75
2 ½
2 50
1 ½ 37.5
1 26.5
¾ 20
½ 14
⅜ 10
¼ 6.3
3/16 5
⅛ 3.35 100 100
7 2.36 100 100
10 2 100 100
14 1.18 1.33 98.67 98.67
25 0.6 17.5 81.17 81.17
36 0.425 11.35 69.82 69.82
52 0.3 20.26 49.56 49.56
72 0.212 8.1 41.46 41.46
100 0.15 3.32 38.14 38.14
200 0.075 3.13 35.01 35.01
UNIBEN GEOTECH RESEARCH
GRAIN SIZE ANALYSIS BY WET-SIEVING
SITE: … OKOMU JOB:.............
LOCATION: ...RAMPII , BH10. DATE: 08-06--2018………
DEPTH: ……. 4.5m…… TESTED BY:……WET SIEVE………
0
10
20
30
40
50
60
70
80
90
100
0.0001 0.001 0.01 0.1 1 10 100
Pe
rce
nta
ge
Pa
ssin
g
British Standard Sieve SizeSieve Analysis
73
mm
50
37
.5
26
.5
20
100.1
5
6.353.3
5
2.3
6
1.7
1.1
8
0.0
6
0.4
25
0.3
0.2
12
0.0
75
0.0
63
SILT
MEDIUMFINE COARSE FINE MEDIUM COARSE FINE MEDIUM COARSE
SAND GRAVELCLAY
CO
BB
LE
S
100

SIEVE NO.
APPROX IMPERIAL
EQUIV (Seive No.)
BRITISH STANDARD
SIEVE SIZES (mm) RETAINED IN gm PASSING IN gm
PASSING IN
(%)
3 75
2 ½
2 50
1 ½ 37.5
1 26.5
¾ 20
½ 14
⅜ 10
¼ 6.3
3/16 5
⅛ 3.35 100 100
7 2.36 100 100
10 2 100 100
14 1.18 1.66 98.34 98.34
25 0.6 15.05 83.29 83.29
36 0.425 9.4 73.89 73.89
52 0.3 15.22 58.67 58.67
72 0.212 8.08 50.59 50.59
100 0.15 3.96 46.63 46.63
200 0.075 3.45 43.18 43.18
UNIBEN GEOTECH RESEARCH
GRAIN SIZE ANALYSIS BY WET-SIEVINGSITE: … OKOMU JOB:.............
LOCATION: ...RAMPII , BH10. DATE: 08-06--2018………
DEPTH: ……. 7.5m…… TESTED BY:……WET SIEVE………
0
10
20
30
40
50
60
70
80
90
100
0.0001 0.001 0.01 0.1 1 10 100
Perc
enta
ge P
assin
g
British Standard Sieve SizeSieve Analysis
73
mm
50
37
.5
26
.5
20
100.1
5
6.353.3
5
2.3
6
1.7
1.1
8
0.0
6
0.4
25
0.3
0.2
12
0.0
75
0.0
63
SILT
MEDIUMFINE COARSE FINE MEDIUM COARSE FINE MEDIUM COARSE
SAND GRAVELCLAY
CO
BB
LE
101

SIEVE NO.
APPROX IMPERIAL
EQUIV (Seive No.)
BRITISH STANDARD
SIEVE SIZES (mm) RETAINED IN gm PASSING IN gm
PASSING IN
(%)
3 75
2 ½
2 50
1 ½ 37.5
1 26.5
¾ 20
½ 14
⅜ 10
¼ 6.3
3/16 5
⅛ 3.35 100 100
7 2.36 100 100
10 2 100 100
14 1.18 1.72 98.28 98.28
25 0.6 12.66 85.62 85.62
36 0.425 6.4 79.22 79.22
52 0.3 11.58 67.64 67.64
72 0.212 7.13 60.51 60.51
100 0.15 2.91 57.6 57.6
200 0.075 3.83 53.77 53.77
UNIBEN GEOTECH RESEARCH
GRAIN SIZE ANALYSIS BY WET-SIEVINGSITE: … OKOMU JOB:.............
LOCATION: ...RAMPII , BH10. DATE: 08-06--2018………
DEPTH: ……. 10.0m…… TESTED BY:……WET SIEVE………
0
10
20
30
40
50
60
70
80
90
100
0.0001 0.001 0.01 0.1 1 10 100
Perc
enta
ge P
assin
g
British Standard Sieve SizeSieve Analysis
73
mm
50
37
.5
26
.5
20
100.1
5
6.353.3
5
2.3
6
1.7
1.1
8
0.0
6
0.4
25
0.3
0.2
12
0.0
75
0.0
63
SILT
MEDIUMFINE COARSE FINE MEDIUM COARSE FINE MEDIUM COARSE
SAND GRAVELCLAY
CO
BB
LE
102

SIEVE NO.
APPROX IMPERIAL
EQUIV (inches)
BRITISH STANDARD
SIEVE SIZES (mm) RETAINED IN gm PASSING IN gm
PASSING IN
(%)
3 75
2 ½
2 50
1 ½ 37.5
1 26.5
¾ 20
½ 14
⅜ 10
¼ 6.3
3/16 5
⅛ 3.35 100 100
7 2.36 100 100
10 2 100 100
14 1.18 2.12 97.88 97.88
25 0.6 13.87 84.01 84.01
36 0.425 7.08 76.93 76.93
52 0.3 9.8 67.13 67.13
72 0.212 6.43 60.7 60.7
100 0.15 2.24 58.46 58.46
200 0.075 2.73 55.73 55.73
UNIBEN GEOTECH RESEARCH
GRAIN SIZE ANALYSIS BY WET-SIEVING
SITE: … OKOMU JOB:.............
LOCATION: ...RAMPII , BH10. DATE: 08-06--2018………
DEPTH: ……. 10.5m…… TESTED BY:……WET SIEVE………
0
10
20
30
40
50
60
70
80
90
100
0.0001 0.001 0.01 0.1 1 10 100
Pe
rce
nta
ge
Pa
ssin
g
British Standard Sieve SizeSieve Analysis
73
mm
50
37
.5
26
.5
20
100.1
5
6.353.3
5
2.3
6
1.7
1.1
8
0.0
6
0.4
25
0.3
0.2
12
0.0
75
0.0
63
SILT
MEDIUMFINE COARSE FINE MEDIUM COARSE FINE MEDIUM COARSE
SAND GRAVELCLAY
CO
BB
LE
S
103

SIEVE NO.
APPROX IMPERIAL
EQUIV (Seive No.)
BRITISH STANDARD
SIEVE SIZES (mm) RETAINED IN gm PASSING IN gm
PASSING IN
(%)
3 75
2 ½
2 50
1 ½ 37.5
1 26.5
¾ 20
½ 14
⅜ 10
¼ 6.3
3/16 5
⅛ 3.35 100 100
7 2.36 100 100
10 2 100 100
14 1.18 1.83 98.17 98.17
25 0.6 13.59 84.58 84.58
36 0.425 6.5 78.08 78.08
52 0.3 11.38 66.7 66.7
72 0.212 6.37 60.33 60.33
100 0.15 3.43 56.9 56.9
200 0.075 4.07 52.83 52.83
UNIBEN GEOTECH RESEARCH
GRAIN SIZE ANALYSIS BY WET-SIEVINGSITE: … OKOMU JOB:.............
LOCATION: ...RAMPII , BH10. DATE: 08-06--2018………
DEPTH: ……. 13.5m…… TESTED BY:……WET SIEVE………
0
10
20
30
40
50
60
70
80
90
100
0.0001 0.001 0.01 0.1 1 10 100
Perc
enta
ge P
assin
g
British Standard Sieve SizeSieve Analysis
73
mm
50
37
.5
26
.5
20
100.1
5
6.353.3
5
2.3
6
1.7
1.1
8
0.0
6
0.4
25
0.3
0.2
12
0.0
75
0.0
63
SILT
MEDIUMFINE COARSE FINE MEDIUM COARSE FINE MEDIUM COARSE
SAND GRAVELCLAY
CO
BB
LE
104

SIEVE NO.
APPROX IMPERIAL
EQUIV (Seive No.)
BRITISH STANDARD
SIEVE SIZES (mm) RETAINED IN gm PASSING IN gm
PASSING IN
(%)
3 75
2 ½
2 50
1 ½ 37.5
1 26.5
¾ 20
½ 14
⅜ 10
¼ 6.3
3/16 5
⅛ 3.35 100 100
7 2.36 100 100
10 2 100 100
14 1.18 1.71 98.29 98.29
25 0.6 13.52 84.77 84.77
36 0.425 6.5 78.27 78.27
52 0.3 14.01 64.26 64.26
72 0.212 8.48 55.78 55.78
100 0.15 3.57 52.21 52.21
200 0.075 4.72 47.49 47.49
UNIBEN GEOTECH RESEARCH
GRAIN SIZE ANALYSIS BY WET-SIEVING
SITE: … OKOMU JOB:.............
LOCATION: ...RAMPII , BH10. DATE: 08-06--2018………
DEPTH: ……. 15.0m…… TESTED BY:……WET SIEVE………
0
10
20
30
40
50
60
70
80
90
100
0.0001 0.001 0.01 0.1 1 10 100
Pe
rce
nta
ge
Pa
ssin
g
British Standard Sieve SizeSieve Analysis
73
mm
50
37
.5
26
.5
20
100.1
5
6.353.3
5
2.3
6
1.7
1.1
8
0.0
6
0.4
25
0.3
0.2
12
0.0
75
0.0
63
SILT
MEDIUMFINE COARSE FINE MEDIUM COARSE FINE MEDIUM COARSE
SAND GRAVELCLAY
CO
BB
LE
S
105

JEFFA GEOTECH
APPENDIX III
106

Type of Test LL LL LL LL LL
No. of Blows/shrinkage % 45.00 35.00 24.00 17.00 12.00
Container No. O6 BA OK OK NN
Wt of wet soil & container (g) 59.00 56.19 58.50 56.99 55.18
Wt of dried soil & container (g) 44.12 41.89 44.15 41.89 40.35
Wt of container (g) 15.00 15.90 19.10 15.90 15.90
Wt of dry soil (Wd) (g) 29.12 25.99 25.05 25.99 24.45
Wt of moisture (Wm) (g) 14.88 14.30 14.35 15.10 14.83
Moisture contain 100 (Wm/Wd) 51.10 55.02 57.29 58.10 60.65
Type of Test PL PL PL PL PL
No. of Blows/shrinkage %
Container No. HF OK Z4
Wt of wet soil & container (g) 30.12 26.75 30.00
Wt of dried soil & container (g) 27.58 24.20 27.58
Wt of container (g) 18.60 15.60 18.90
Wt of dry soil (Wd) (g) 8.98 8.60 8.68
Wt of moisture (Wm) (g) 2.54 2.55 2.42
Moisture contain 100 (Wm/Wd) 28.29 29.65 27.88
LIQUID AND PLASTIC LIMITS,LINEAR SHRINKAGE
Sample No. POINT 2, 1.5m... Liquid Limit : 56.85 Plastic Limit: 28.61
Date: 25/06/2018………. Plastic Index: 28.25... Linear Shrinkage
Job…. Description of Soil…
Site: OKOMU……
L.L. Machine No..................... Operator......................................
Proportion of sample retained on No. 36 B.S. Steve = Per centNo. of blows refers to liquid limit determination.Shrinkage % refers to linear Shrinkage.Liquid limit marked L.L. plastic limit marked P.L. Linear shrinkage marked L.S.
y = -0.2632x + 63.434
05
101520253035404550556065707580859095
100
0 5 10 15 20 25 30 35 40 45 50 55 60
MO
IST
UR
E C
ON
TE
NT
%
NUMBER OF BLOWS
LIQUID LIMIT
107

56.854
28.61
28.25
108

Type of Test LL LL LL LL LL
No. of Blows/shrinkage % 47.00 33.00 24.00 18.00 8.00
Container No. O6 BA OK OK NN
Wt of wet soil & container (g) 58.50 57.90 56.10 56.10 53.70
Wt of dried soil & container (g) 43.80 44.50 42.10 42.10 40.50
Wt of container (g) 15.00 19.10 15.90 15.90 15.80
Wt of dry soil (Wd) (g) 28.80 25.40 26.20 26.20 24.70
Wt of moisture (Wm) (g) 14.70 13.40 14.00 14.00 13.20
Moisture contain 100 (Wm/Wd) 51.04 52.76 53.44 53.44 53.44
Type of Test PL PL PL PL PL
No. of Blows/shrinkage %
Container No. HF OK Z4
Wt of wet soil & container (g) 30.10 25.30 29.50
Wt of dried soil & container (g) 27.60 23.10 27.30
Wt of container (g) 18.60 15.60 18.90
Wt of dry soil (Wd) (g) 9.00 7.50 8.40
Wt of moisture (Wm) (g) 2.50 2.20 2.20
Moisture contain 100 (Wm/Wd) 27.78 29.33 26.19
LIQUID AND PLASTIC LIMITS,LINEAR SHRINKAGE
Sample No. POINT 3, 1.5m... Liquid Limit : 52.88 Plastic Limit: 27.77
Date: 25/06/2018………. Plastic Index: 25.12... Linear Shrinkage
Job…. Description of Soil…
Site: OKOMU……
L.L. Machine No..................... Operator......................................
Proportion of sample retained on No. 36 B.S. Steve = Per centNo. of blows refers to liquid limit determination.Shrinkage % refers to linear Shrinkage.Liquid limit marked L.L. plastic limit marked P.L. Linear shrinkage marked L.S.
y = -0.0625x + 54.447
05
101520253035404550556065707580859095
100
0 5 10 15 20 25 30 35 40 45 50 55 60
MO
IST
UR
E C
ON
TE
NT
%
NUMBER OF BLOWS
LIQUID LIMIT
109

Type of Test LL LL LL LL LL
No. of Blows/shrinkage % 44.00 32.00 25.00 18.00 11.00
Container No. W ST OH QO SI
Wt of wet soil & container (g) 48.00 52.50 51.80 57.20 54.60
Wt of dried soil & container (g) 39.30 42.40 43.00 46.60 44.00
Wt of container (g) 16.00 15.60 19.80 18.70 18.10
Wt of dry soil (Wd) (g) 23.30 26.80 23.20 27.90 25.90
Wt of moisture (Wm) (g) 8.70 10.10 8.80 10.60 10.60
Moisture contain 100 (Wm/Wd) 37.34 37.69 37.93 37.99 40.93
Type of Test PL PL PL PL PL
No. of Blows/shrinkage %
Container No. IE N OB
Wt of wet soil & container (g) 27.60 25.70 25.50
Wt of dried soil & container (g) 25.90 24.30 24.00
Wt of container (g) 18.50 18.10 16.70
Wt of dry soil (Wd) (g) 7.40 6.20 7.30
Wt of moisture (Wm) (g) 1.70 1.40 1.50
Moisture contain 100 (Wm/Wd) 22.97 22.58 20.55
LIQUID AND PLASTIC LIMITS,LINEAR SHRINKAGE
Sample No. OKOMU ROAD, POINT 1, 1.5m... Liquid Limit : 38.46 Plastic Limit: 22.03
Date: 25/06/2018………. Plastic Index: 16.43... Linear Shrinkage
Job…. Description of Soil…
Site: OKOMU……
L.L. Machine No..................... Operator......................................
Proportion of sample retained on No. 36 B.S. Steve = Per centNo. of blows refers to liquid limit determination.Shrinkage % refers to linear Shrinkage.Liquid limit marked L.L. plastic limit marked P.L. Linear shrinkage marked L.S.
y = -0.0885x + 40.677
05
101520253035404550556065707580859095
100
0 5 10 15 20 25 30 35 40 45 50 55 60
MO
IST
UR
E C
ON
TE
NT
%
NUMBER OF BLOWS
LIQUID LIMIT
110

Type of Test LL LL LL LL LL
No. of Blows/shrinkage % 46.00 31.00 25.00 16.00 10.00
Container No. LA AL KK TH BP
Wt of wet soil & container (g) 51.00 52.70 56.00 59.10 55.40
Wt of dried soil & container (g) 40.20 40.40 41.60 43.40 41.70
Wt of container (g) 18.90 17.60 15.00 15.00 18.00
Wt of dry soil (Wd) (g) 21.30 22.80 26.60 28.40 23.70
Wt of moisture (Wm) (g) 10.80 12.30 14.40 15.70 13.70
Moisture contain 100 (Wm/Wd) 50.70 53.95 54.14 55.28 57.81
Type of Test PL PL PL PL PL
No. of Blows/shrinkage %
Container No. BH II AI
Wt of wet soil & container (g) 26.90 24.90 25.90
Wt of dried soil & container (g) 25.20 23.20 23.90
Wt of container (g) 19.60 17.20 16.70
Wt of dry soil (Wd) (g) 5.60 6.00 7.20
Wt of moisture (Wm) (g) 1.70 1.70 2.00
Moisture contain 100 (Wm/Wd) 30.36 28.33 27.78
LIQUID AND PLASTIC LIMITS,LINEAR SHRINKAGE
Sample No. BOILER, BH1, 9.0m... Liquid Limit : 54.48 Plastic Limit: 28.48
Date: 25/06/2018………. Plastic Index: 25.66... Linear Shrinkage
Job…. Description of Soil…
Site: OKOMU……
L.L. Machine No..................... Operator......................................
Proportion of sample retained on No. 36 B.S. Steve = Per centNo. of blows refers to liquid limit determination.Shrinkage % refers to linear Shrinkage.Liquid limit marked L.L. plastic limit marked P.L. Linear shrinkage marked L.S.
y = -0.1783x + 58.939
05
101520253035404550556065707580859095
100
0 5 10 15 20 25 30 35 40 45 50 55 60
MO
IST
UR
E C
ON
TE
NT
%
NUMBER OF BLOWS
LIQUID LIMIT
111

Type of Test LL LL LL LL LL
No. of Blows/shrinkage % 47.00 33.00 25.00 18.00 12.00
Container No. FN OH ZO TA DT
Wt of wet soil & container (g) 58.40 58.20 53.40 59.10 58.20
Wt of dried soil & container (g) 44.40 44.50 41.40 45.00 43.10
Wt of container (g) 16.10 18.10 18.50 18.20 15.50
Wt of dry soil (Wd) (g) 28.30 26.40 22.90 26.80 27.60
Wt of moisture (Wm) (g) 14.00 13.70 12.00 14.10 15.10
Moisture contain 100 (Wm/Wd) 49.47 51.89 52.40 52.61 54.71
Type of Test PL PL PL PL PL
No. of Blows/shrinkage %
Container No. TH WW FH
Wt of wet soil & container (g) 26.90 22.50 26.50
Wt of dried soil & container (g) 24.80 20.90 24.40
Wt of container (g) 18.10 15.10 17.60
Wt of dry soil (Wd) (g) 6.70 5.80 6.80
Wt of moisture (Wm) (g) 2.10 1.60 2.10
Moisture contain 100 (Wm/Wd) 31.34 27.59 30.88
LIQUID AND PLASTIC LIMITS,LINEAR SHRINKAGE
Sample No. BOILER, BH1, 12.0m... Liquid Limit : 52.48 Plastic Limit: 29.94
Date: 25/06/2018………. Plastic Index: 22.54... Linear Shrinkage
Job…. Description of Soil…
Site: OKOMU……
L.L. Machine No..................... Operator......................................
Proportion of sample retained on No. 36 B.S. Steve = Per centNo. of blows refers to liquid limit determination.Shrinkage % refers to linear Shrinkage.Liquid limit marked L.L. plastic limit marked P.L. Linear shrinkage marked L.S.
y = -0.1316x + 55.772
05
101520253035404550556065707580859095
100
0 5 10 15 20 25 30 35 40 45 50 55 60
MO
IST
UR
E C
ON
TE
NT
%
NUMBER OF BLOWS
LIQUID LIMIT
112

Type of Test LL LL LL LL LL
No. of Blows/shrinkage % 45.00 32.00 25.00 17.00 10.00
Container No. GL UW IA CC SA
Wt of wet soil & container (g) 56.30 56.30 58.30 57.10 56.10 54.60
Wt of dried soil & container (g) 43.80 43.80 44.40 43.50 41.70 41.00
Wt of container (g) 20.30 20.30 18.70 18.50 15.30 16.10
Wt of dry soil (Wd) (g) 23.50 25.70 25.00 26.40 24.90
Wt of moisture (Wm) (g) 12.50 13.90 13.60 14.40 13.60
Moisture contain 100 (Wm/Wd) 53.19 54.09 54.40 54.55 54.62
Type of Test PL PL PL PL PL
No. of Blows/shrinkage %
Container No. OR NK KC
Wt of wet soil & container (g) 22.50 24.00 23.90
Wt of dried soil & container (g) 20.85 22.20 22.40
Wt of container (g) 14.30 15.30 16.70
Wt of dry soil (Wd) (g) 6.55 6.90 5.70
Wt of moisture (Wm) (g) 1.65 1.80 1.50
Moisture contain 100 (Wm/Wd) 25.19 26.09 26.32
LIQUID AND PLASTIC LIMITS,LINEAR SHRINKAGE
Sample No. BOILER, BH1, 15.0m... Liquid Limit : 54.19 Plastic Limit: 25.86
Date: 25/06/2018………. Plastic Index: 28.33... Linear Shrinkage
Job…. Description of Soil…
Site: OKOMU……
L.L. Machine No..................... Operator......................................
Proportion of sample retained on No. 36 B.S. Steve = Per centNo. of blows refers to liquid limit determination.Shrinkage % refers to linear Shrinkage.Liquid limit marked L.L. plastic limit marked P.L. Linear shrinkage marked L.S.
y = -0.0407x + 55.217
05
101520253035404550556065707580859095
100
0 5 10 15 20 25 30 35 40 45 50 55 60
MO
IST
UR
E C
ON
TE
NT
%
NUMBER OF BLOWS
LIQUID LIMIT
113

Type of Test LL LL LL LL LL
No. of Blows/shrinkage % 47.00 34.00 25.00 16.00 9.00
Container No. UK ZB TH WN KL
Wt of wet soil & container (g) 51.70 57.90 55.20 53.10 56.00
Wt of dried soil & container (g) 39.40 43.10 42.40 40.40 42.80
Wt of container (g) 16.20 15.70 18.70 16.90 18.40
Wt of dry soil (Wd) (g) 23.20 27.40 23.70 23.50 24.40
Wt of moisture (Wm) (g) 12.30 14.80 12.80 12.70 13.20
Moisture contain 100 (Wm/Wd) 53.02 54.01 54.01 54.04 54.10
Type of Test PL PL PL PL PL
No. of Blows/shrinkage %
Container No. AL MO KI
Wt of wet soil & container (g) 24.00 25.10 27.20
Wt of dried soil & container (g) 22.00 23.40 25.00
Wt of container (g) 14.90 16.30 17.40
Wt of dry soil (Wd) (g) 7.10 7.10 7.60
Wt of moisture (Wm) (g) 2.00 1.70 2.20
Moisture contain 100 (Wm/Wd) 28.17 23.94 28.95
LIQUID AND PLASTIC LIMITS,LINEAR SHRINKAGE
Sample No. CLARIFICATION STATION, BH3, 5.5m... Liquid Limit : 53.87 Plastic Limit: 27.02
Date: 25/06/2018………. Plastic Index: 26.85... Linear Shrinkage
Job…. Description of Soil…
Site: OKOMU……
L.L. Machine No..................... Operator......................................
Proportion of sample retained on No. 36 B.S. Steve = Per centNo. of blows refers to liquid limit determination.Shrinkage % refers to linear Shrinkage.Liquid limit marked L.L. plastic limit marked P.L. Linear shrinkage marked L.S.
y = -0.0251x + 54.494
05
101520253035404550556065707580859095
100
0 5 10 15 20 25 30 35 40 45 50 55 60
MO
IST
UR
E C
ON
TE
NT
%
NUMBER OF BLOWS
LIQUID LIMIT
114

Type of Test LL LL LL LL LL
No. of Blows/shrinkage % 45.00 33.00 24.00 17.00 11.00
Container No. XE W TH ST OS
Wt of wet soil & container (g) 48.30 50.90 47.80 50.50 48.20
Wt of dried soil & container (g) 37.60 40.70 37.90 38.50 36.30
Wt of container (g) 14.50 19.20 18.30 15.80 15.30
Wt of dry soil (Wd) (g) 23.10 21.50 19.60 22.70 21.00
Wt of moisture (Wm) (g) 10.70 10.20 9.90 12.00 11.90
Moisture contain 100 (Wm/Wd) 46.32 47.44 50.51 52.86 56.67
Type of Test PL PL PL PL PL
No. of Blows/shrinkage %
Container No. WO OG RO
Wt of wet soil & container (g) 25.90 23.50 21.80
Wt of dried soil & container (g) 24.00 22.40 20.40
Wt of container (g) 17.10 18.20 15.40
Wt of dry soil (Wd) (g) 6.90 4.20 5.00
Wt of moisture (Wm) (g) 1.90 1.10 1.40
Moisture contain 100 (Wm/Wd) 27.54 26.19 28.00
LIQUID AND PLASTIC LIMITS,LINEAR SHRINKAGE
Sample No. CLARIFICATION STATION, BH3, 8.5m... Liquid Limit : 51.06 Plastic Limit: 27.24
Date: 25/06/2018………. Plastic Index: 23.82... Linear Shrinkage
Job…. Description of Soil…
Site: OKOMU……
L.L. Machine No..................... Operator......................................
Proportion of sample retained on No. 36 B.S. Steve = Per centNo. of blows refers to liquid limit determination.Shrinkage % refers to linear Shrinkage.Liquid limit marked L.L. plastic limit marked P.L. Linear shrinkage marked L.S.
y = -0.2981x + 58.51
05
101520253035404550556065707580859095
100
0 5 10 15 20 25 30 35 40 45 50 55 60
MO
IST
UR
E C
ON
TE
NT
%
NUMBER OF BLOWS
LIQUID LIMIT
115

Type of Test LL LL LL LL LL
No. of Blows/shrinkage % 45.00 32.00 24.00 18.00 9.00
Container No. NZ IB SG ST CP
Wt of wet soil & container (g) 56.00 49.60 56.00 51.20 51.20
Wt of dried soil & container (g) 42.90 38.60 42.10 40.40 38.80
Wt of container (g) 16.30 16.70 14.50 19.40 17.20
Wt of dry soil (Wd) (g) 26.60 21.90 27.60 21.00 21.60
Wt of moisture (Wm) (g) 13.10 11.00 13.90 10.80 12.40
Moisture contain 100 (Wm/Wd) 49.25 50.23 50.36 51.43 57.41
Type of Test PL PL PL PL PL
No. of Blows/shrinkage %
Container No. IK TH OK
Wt of wet soil & container (g) 24.20 26.50 23.30
Wt of dried soil & container (g) 22.20 24.75 21.70
Wt of container (g) 14.90 18.30 15.80
Wt of dry soil (Wd) (g) 7.30 6.45 5.90
Wt of moisture (Wm) (g) 2.00 1.75 1.60
Moisture contain 100 (Wm/Wd) 27.40 27.13 27.12
LIQUID AND PLASTIC LIMITS,LINEAR SHRINKAGE
Sample No. CLARIFICATION STATION, BH3, 11.5m... Liquid Limit : 51.85 Plastic Limit: 27.22
Date: 25/06/2018………. Plastic Index: 24.64... Linear Shrinkage
Job…. Description of Soil…
Site: OKOMU……
L.L. Machine No..................... Operator......................................
Proportion of sample retained on No. 36 B.S. Steve = Per centNo. of blows refers to liquid limit determination.Shrinkage % refers to linear Shrinkage.Liquid limit marked L.L. plastic limit marked P.L. Linear shrinkage marked L.S.
y = -0.1959x + 56.749
05
101520253035404550556065707580859095
100
0 5 10 15 20 25 30 35 40 45 50 55 60
MO
IST
UR
E C
ON
TE
NT
%
NUMBER OF BLOWS
LIQUID LIMIT
116

Type of Test LL LL LL LL LL
No. of Blows/shrinkage % 46.00 31.00 24.00 16.00 11.00
Container No. OH RO PA CA IE
Wt of wet soil & container (g) 52.40 55.10 47.60 50.80 51.80
Wt of dried soil & container (g) 41.40 43.50 37.30 39.70 40.30
Wt of container (g) 17.70 18.80 15.40 18.10 18.40
Wt of dry soil (Wd) (g) 23.70 24.70 21.90 21.60 21.90
Wt of moisture (Wm) (g) 11.00 11.60 10.30 11.10 11.50
Moisture contain 100 (Wm/Wd) 46.41 46.96 47.03 51.39 52.51
Type of Test PL PL PL PL PL
No. of Blows/shrinkage %
Container No. OX UL CA
Wt of wet soil & container (g) 24.40 23.90 27.10
Wt of dried soil & container (g) 22.90 22.60 25.10
Wt of container (g) 17.20 17.90 18.30
Wt of dry soil (Wd) (g) 5.70 4.70 6.80
Wt of moisture (Wm) (g) 1.50 1.30 2.00
Moisture contain 100 (Wm/Wd) 26.32 27.66 29.41
LIQUID AND PLASTIC LIMITS,LINEAR SHRINKAGE
Sample No. POWER HOUSE, BH2, 5.0m... Liquid Limit : 48.97 Plastic Limit: 27.80
Date: 25/06/2018………. Plastic Index: 21.17... Linear Shrinkage
Job…. Description of Soil…
Site: OKOMU……
L.L. Machine No..................... Operator......................................
Proportion of sample retained on No. 36 B.S. Steve = Per centNo. of blows refers to liquid limit determination.Shrinkage % refers to linear Shrinkage.Liquid limit marked L.L. plastic limit marked P.L. Linear shrinkage marked L.S.
y = -0.179x + 53.444
05
101520253035404550556065707580859095
100
0 5 10 15 20 25 30 35 40 45 50 55 60
MO
IST
UR
E C
ON
TE
NT
%
NUMBER OF BLOWS
LIQUID LIMIT
117

Type of Test LL LL LL LL LL
No. of Blows/shrinkage % 47.00 33.00 25.00 17.00 9.00
Container No. MA ET BZ TH CV
Wt of wet soil & container (g) 49.50 52.20 53.00 48.20 45.30
Wt of dried soil & container (g) 38.00 39.60 40.30 37.30 34.40
Wt of container (g) 14.90 14.60 15.30 17.50 16.12
Wt of dry soil (Wd) (g) 23.10 25.00 25.00 19.80 18.28
Wt of moisture (Wm) (g) 11.50 12.60 12.70 10.90 10.90
Moisture contain 100 (Wm/Wd) 49.78 50.40 50.80 55.05 59.63
Type of Test PL PL PL PL PL
No. of Blows/shrinkage %
Container No. CA UB TO
Wt of wet soil & container (g) 25.50 23.40 24.00
Wt of dried soil & container (g) 23.90 21.60 22.30
Wt of container (g) 18.10 15.30 16.30
Wt of dry soil (Wd) (g) 5.80 6.30 6.00
Wt of moisture (Wm) (g) 1.60 1.80 1.70
Moisture contain 100 (Wm/Wd) 27.59 28.57 28.33
LIQUID AND PLASTIC LIMITS,LINEAR SHRINKAGE
Sample No. POWER HOUSE, BH2, 8.0m... Liquid Limit : 53.43 Plastic Limit: 28.16
Date: 25/06/2018………. Plastic Index: 25.27... Linear Shrinkage
Job…. Description of Soil…
Site: OKOMU……
L.L. Machine No..................... Operator......................................
Proportion of sample retained on No. 36 B.S. Steve = Per centNo. of blows refers to liquid limit determination.Shrinkage % refers to linear Shrinkage.Liquid limit marked L.L. plastic limit marked P.L. Linear shrinkage marked L.S.
y = -0.2495x + 59.67
05
101520253035404550556065707580859095
100
0 5 10 15 20 25 30 35 40 45 50 55 60
MO
IST
UR
E C
ON
TE
NT
%
NUMBER OF BLOWS
LIQUID LIMIT
118

Type of Test LL LL LL LL LL
No. of Blows/shrinkage % 46.00 35.00 25.00 16.00 8.00
Container No. IA ZU YZ CV HI
Wt of wet soil & container (g) 55.20 59.00 58.50 57.80 59.20
Wt of dried soil & container (g) 41.50 44.10 44.20 42.80 44.90
Wt of container (g) 15.80 16.20 17.50 15.50 18.90
Wt of dry soil (Wd) (g) 25.70 27.90 26.70 27.30 26.00
Wt of moisture (Wm) (g) 13.70 14.90 14.30 15.00 14.30
Moisture contain 100 (Wm/Wd) 53.31 53.41 53.56 54.95 55.00
Type of Test PL PL PL PL PL
No. of Blows/shrinkage %
Container No. EM OH ZA
Wt of wet soil & container (g) 26.20 26.80 27.80
Wt of dried soil & container (g) 24.50 25.10 25.80
Wt of container (g) 18.00 18.80 17.50
Wt of dry soil (Wd) (g) 6.50 6.30 8.30
Wt of moisture (Wm) (g) 1.70 1.70 2.00
Moisture contain 100 (Wm/Wd) 26.15 26.98 24.10
LIQUID AND PLASTIC LIMITS,LINEAR SHRINKAGE
Sample No. STORAGE TANK, BH6, 10.0m... Liquid Limit : 54.09 Plastic Limit: 25.74
Date: 25/06/2018………. Plastic Index: 28.35... Linear Shrinkage
Job…. Description of Soil…
Site: OKOMU……
L.L. Machine No..................... Operator......................................
Proportion of sample retained on No. 36 B.S. Steve = Per centNo. of blows refers to liquid limit determination.Shrinkage % refers to linear Shrinkage.Liquid limit marked L.L. plastic limit marked P.L. Linear shrinkage marked L.S.
y = -0.051x + 55.369
05
101520253035404550556065707580859095
100
0 5 10 15 20 25 30 35 40 45 50 55 60
MO
IST
UR
E C
ON
TE
NT
%
NUMBER OF BLOWS
LIQUID LIMIT
119

Type of Test LL LL LL LL LL
No. of Blows/shrinkage % 46.00 32.00 24.00 17.00 9.00
Container No. CO ZU RB 7Z 8Z
Wt of wet soil & container (g) 56.70 55.10 55.10 56.20 59.20
Wt of dried soil & container (g) 43.90 42.20 42.00 43.40 43.70
Wt of container (g) 17.40 15.70 15.20 18.60 14.40
Wt of dry soil (Wd) (g) 26.50 26.50 26.80 24.80 29.30
Wt of moisture (Wm) (g) 12.80 12.90 13.10 12.80 15.50
Moisture contain 100 (Wm/Wd) 48.30 48.68 48.88 51.61 52.90
Type of Test PL PL PL PL PL
No. of Blows/shrinkage %
Container No. PP RI PX
Wt of wet soil & container (g) 26.10 25.80 25.40
Wt of dried soil & container (g) 23.90 23.80 23.40
Wt of container (g) 16.20 16.10 16.20
Wt of dry soil (Wd) (g) 7.70 7.70 7.20
Wt of moisture (Wm) (g) 2.20 2.00 2.00
Moisture contain 100 (Wm/Wd) 28.57 25.97 27.78
LIQUID AND PLASTIC LIMITS,LINEAR SHRINKAGE
Sample No. BOILER, BH1, 1.0m... Liquid Limit : 50.15 Plastic Limit: 27.44
Date: 25/06/2018………. Plastic Index: 22.71... Linear Shrinkage
Job…. Description of Soil…
Site: OKOMU……
L.L. Machine No..................... Operator......................................
Proportion of sample retained on No. 36 B.S. Steve = Per centNo. of blows refers to liquid limit determination.Shrinkage % refers to linear Shrinkage.Liquid limit marked L.L. plastic limit marked P.L. Linear shrinkage marked L.S.
y = -0.1277x + 53.344
05
101520253035404550556065707580859095
100
0 5 10 15 20 25 30 35 40 45 50 55 60
MO
IST
UR
E C
ON
TE
NT
%
NUMBER OF BLOWS
LIQUID LIMIT
120

Type of Test LL LL LL LL LL
No. of Blows/shrinkage % 45.00 34.00 25.00 17.00 10.00
Container No. ON P5 MP QP VC
Wt of wet soil & container (g) 58.00 58.10 55.70 52.60 58.80
Wt of dried soil & container (g) 43.70 44.20 42.50 40.20 43.50
Wt of container (g) 14.60 16.30 17.60 17.00 15.30
Wt of dry soil (Wd) (g) 29.10 27.90 24.90 23.20 28.20
Wt of moisture (Wm) (g) 14.30 13.90 13.20 12.40 15.30
Moisture contain 100 (Wm/Wd) 49.14 49.82 53.01 53.45 54.26
Type of Test PL PL PL PL PL
No. of Blows/shrinkage %
Container No. EE TT MA
Wt of wet soil & container (g) 26.30 27.40 24.00
Wt of dried soil & container (g) 24.30 24.80 22.00
Wt of container (g) 16.90 15.30 15.10
Wt of dry soil (Wd) (g) 7.40 9.50 6.90
Wt of moisture (Wm) (g) 2.00 2.60 2.00
Moisture contain 100 (Wm/Wd) 27.03 27.37 28.99
LIQUID AND PLASTIC LIMITS,LINEAR SHRINKAGE
Sample No. BOILER, BH1, 3.0m... Liquid Limit : 52.13 Plastic Limit: 27.79
Date: 25/06/2018………. Plastic Index: 24.33... Linear Shrinkage
Job…. Description of Soil…
Site: OKOMU……
L.L. Machine No..................... Operator......................................
Proportion of sample retained on No. 36 B.S. Steve = Per centNo. of blows refers to liquid limit determination.Shrinkage % refers to linear Shrinkage.Liquid limit marked L.L. plastic limit marked P.L. Linear shrinkage marked L.S.
y = -0.1597x + 56.12
05
101520253035404550556065707580859095
100
0 5 10 15 20 25 30 35 40 45 50 55 60
MO
IST
UR
E C
ON
TE
NT
%
NUMBER OF BLOWS
LIQUID LIMIT
121

Type of Test LL LL LL LL LL
No. of Blows/shrinkage % 44.00 32.00 24.00 17.00 10.00
Container No. TM NM OY WR TT
Wt of wet soil & container (g) 54.80 49.00 45.30 51.40 57.00
Wt of dried soil & container (g) 42.40 37.80 35.40 40.00 43.00
Wt of container (g) 17.20 15.40 14.90 16.50 15.30
Wt of dry soil (Wd) (g) 25.20 22.40 20.50 23.50 27.70
Wt of moisture (Wm) (g) 12.40 11.20 9.90 11.40 14.00
Moisture contain 100 (Wm/Wd) 49.21 50.00 48.29 48.51 50.54
Type of Test PL PL PL PL PL
No. of Blows/shrinkage %
Container No. FY UM SG
Wt of wet soil & container (g) 25.30 23.30 25.80
Wt of dried soil & container (g) 23.80 21.50 24.60
Wt of container (g) 18.10 14.60 19.60
Wt of dry soil (Wd) (g) 5.70 6.90 5.00
Wt of moisture (Wm) (g) 1.50 1.80 1.20
Moisture contain 100 (Wm/Wd) 26.32 26.09 24.00
LIQUID AND PLASTIC LIMITS,LINEAR SHRINKAGE
Sample No. BOILER, BH1, 6.0m... Liquid Limit : 49.32 Plastic Limit: 25.47
Date: 25/06/2018………. Plastic Index: 23..85... Linear Shrinkage
Job…. Description of Soil…
Site: OKOMU……
L.L. Machine No..................... Operator......................................
Proportion of sample retained on No. 36 B.S. Steve = Per centNo. of blows refers to liquid limit determination.Shrinkage % refers to linear Shrinkage.Liquid limit marked L.L. plastic limit marked P.L. Linear shrinkage marked L.S.
y = -0.0117x + 49.608
05
101520253035404550556065707580859095
100
0 5 10 15 20 25 30 35 40 45 50 55 60
MO
IST
UR
E C
ON
TE
NT
%
NUMBER OF BLOWS
LIQUID LIMIT
122

Type of Test LL LL LL LL LL
No. of Blows/shrinkage % 47.00 32.00 24.00 18.00 10.00
Container No. PO CN Z6 OG 7Z
Wt of wet soil & container (g) 55.90 56.80 58.40 55.10 58.50
Wt of dried soil & container (g) 43.00 43.60 45.60 42.80 43.50
Wt of container (g) 15.60 15.60 18.80 17.10 14.10
Wt of dry soil (Wd) (g) 27.40 28.00 26.80 25.70 29.40
Wt of moisture (Wm) (g) 12.90 13.20 12.80 12.30 15.00
Moisture contain 100 (Wm/Wd) 47.08 47.14 47.76 47.86 51.02
Type of Test PL PL PL PL PL
No. of Blows/shrinkage %
Container No. TA AL X
Wt of wet soil & container (g) 28.10 24.90 25.20
Wt of dried soil & container (g) 26.30 22.80 23.60
Wt of container (g) 20.00 15.10 17.90
Wt of dry soil (Wd) (g) 6.30 7.70 5.70
Wt of moisture (Wm) (g) 1.80 2.10 1.60
Moisture contain 100 (Wm/Wd) 28.57 27.27 28.07
LIQUID AND PLASTIC LIMITS,LINEAR SHRINKAGE
Sample No. CLARIFICATION STATION, BH3, 2.5m... Liquid Limit : 47.28 Plastic Limit: 27.97
Date: 25/06/2018………. Plastic Index: 20.31... Linear Shrinkage
Job…. Description of Soil…
Site: OKOMU……
L.L. Machine No..................... Operator......................................
Proportion of sample retained on No. 36 B.S. Steve = Per centNo. of blows refers to liquid limit determination.Shrinkage % refers to linear Shrinkage.Liquid limit marked L.L. plastic limit marked P.L. Linear shrinkage marked L.S.
y = -0.0891x + 50.508
05
101520253035404550556065707580859095
100
0 5 10 15 20 25 30 35 40 45 50 55 60
MO
IST
UR
E C
ON
TE
NT
%
NUMBER OF BLOWS
LIQUID LIMIT
123

Type of Test LL LL LL LL LL
No. of Blows/shrinkage % 46.00 33.00 24.00 15.00 8.00
Container No. NN RZ IP PI KK
Wt of wet soil & container (g) 57.30 60.50 59.30 56.90 55.80
Wt of dried soil & container (g) 43.30 46.90 44.70 43.20 42.90
Wt of container (g) 15.80 20.30 16.80 17.20 19.60
Wt of dry soil (Wd) (g) 27.50 26.60 27.90 26.00 23.30
Wt of moisture (Wm) (g) 14.00 13.60 14.60 13.70 12.90
Moisture contain 100 (Wm/Wd) 50.91 51.13 52.33 52.69 55.36
Type of Test PL PL PL PL PL
No. of Blows/shrinkage %
Container No. IA A 8Z
Wt of wet soil & container (g) 25.40 26.70 26.60
Wt of dried soil & container (g) 23.00 24.10 24.00
Wt of container (g) 15.30 15.70 14.90
Wt of dry soil (Wd) (g) 7.70 8.40 9.10
Wt of moisture (Wm) (g) 2.40 2.60 2.60
Moisture contain 100 (Wm/Wd) 31.17 30.95 28.57
LIQUID AND PLASTIC LIMITS,LINEAR SHRINKAGE
Sample No. CLARIFICATION STATION, BH3, 14.5m... Liquid Limit : 52.51 Plastic Limit: 30.23
Date: 25/06/2018………. Plastic Index: 22.27... Linear Shrinkage
Job…. Description of Soil…
Site: OKOMU……
L.L. Machine No..................... Operator......................................
Proportion of sample retained on No. 36 B.S. Steve = Per centNo. of blows refers to liquid limit determination.Shrinkage % refers to linear Shrinkage.Liquid limit marked L.L. plastic limit marked P.L. Linear shrinkage marked L.S.
y = -0.106x + 55.155
05
101520253035404550556065707580859095
100
0 5 10 15 20 25 30 35 40 45 50 55 60
MO
IST
UR
E C
ON
TE
NT
%
NUMBER OF BLOWS
LIQUID LIMIT
124

Type of Test LL LL LL LL LL
No. of Blows/shrinkage % 46.00 34.00 24.00 18.00 12.00
Container No. AL 9O OR IZ IB
Wt of wet soil & container (g) 55.70 52.40 58.10 54.60 57.20
Wt of dried soil & container (g) 43.60 40.30 43.60 41.30 43.40
Wt of container (g) 15.50 16.00 14.60 15.00 16.40
Wt of dry soil (Wd) (g) 28.10 24.30 29.00 26.30 27.00
Wt of moisture (Wm) (g) 12.10 12.10 14.50 13.30 13.80
Moisture contain 100 (Wm/Wd) 43.06 49.79 50.00 50.57 51.11
Type of Test PL PL PL PL PL
No. of Blows/shrinkage %
Container No. OB CP EX
Wt of wet soil & container (g) 24.80 24.40 25.60
Wt of dried soil & container (g) 23.60 23.00 24.30
Wt of container (g) 18.40 17.40 18.40
Wt of dry soil (Wd) (g) 5.20 5.60 5.90
Wt of moisture (Wm) (g) 1.20 1.40 1.30
Moisture contain 100 (Wm/Wd) 23.08 25.00 22.03
LIQUID AND PLASTIC LIMITS,LINEAR SHRINKAGE
Sample No. POWER HOUSE, BH2, 2.0m.... Liquid Limit : 49.29 Plastic Limit: 23.37
Date: 25/06/2018………. Plastic Index: 25.92... Linear Shrinkage
Job…. Description of Soil…
Site: OKOMU……
L.L. Machine No..................... Operator......................................
Proportion of sample retained on No. 36 B.S. Steve = Per centNo. of blows refers to liquid limit determination.Shrinkage % refers to linear Shrinkage.Liquid limit marked L.L. plastic limit marked P.L. Linear shrinkage marked L.S.
y = -0.2155x + 54.682
05
101520253035404550556065707580859095
100
0 5 10 15 20 25 30 35 40 45 50 55 60
MO
IST
UR
E C
ON
TE
NT
%
NUMBER OF BLOWS
LIQUID LIMIT
125

Type of Test LL LL LL LL LL
No. of Blows/shrinkage % 47.00 34.00 24.00 16.00 8.00
Container No. IA GG VO CA AL
Wt of wet soil & container (g) 51.60 46.50 51.10 58.00 52.70
Wt of dried soil & container (g) 40.50 36.30 40.00 43.90 39.40
Wt of container (g) 15.60 15.00 17.90 18.00 15.20
Wt of dry soil (Wd) (g) 24.90 21.30 22.10 25.90 24.20
Wt of moisture (Wm) (g) 11.10 10.20 11.10 14.10 13.30
Moisture contain 100 (Wm/Wd) 44.58 47.89 50.23 54.44 54.96
Type of Test PL PL PL PL PL
No. of Blows/shrinkage %
Container No. LI JO PK
Wt of wet soil & container (g) 26.10 24.10 24.90
Wt of dried soil & container (g) 24.70 22.00 22.90
Wt of container (g) 19.60 14.90 15.30
Wt of dry soil (Wd) (g) 5.10 7.10 7.60
Wt of moisture (Wm) (g) 1.40 2.10 2.00
Moisture contain 100 (Wm/Wd) 27.45 29.58 26.32
LIQUID AND PLASTIC LIMITS,LINEAR SHRINKAGE
Sample No. POWER HOUSE, BH2, 11.0m.... Liquid Limit : 50.65 Plastic Limit: 27.78
Date: 25/06/2018………. Plastic Index: 22.86... Linear Shrinkage
Job…. Description of Soil…
Site: OKOMU……
L.L. Machine No..................... Operator......................................
Proportion of sample retained on No. 36 B.S. Steve = Per centNo. of blows refers to liquid limit determination.Shrinkage % refers to linear Shrinkage.Liquid limit marked L.L. plastic limit marked P.L. Linear shrinkage marked L.S.
y = -0.2835x + 57.732
05
101520253035404550556065707580859095
100
0 5 10 15 20 25 30 35 40 45 50 55 60
MO
IST
UR
E C
ON
TE
NT
%
NUMBER OF BLOWS
LIQUID LIMIT
126

Type of Test LL LL LL LL LL
No. of Blows/shrinkage % 46.00 34.00 24.00 17.00 11.00
Container No. PP EM TA IZ OF
Wt of wet soil & container (g) 47.40 51.10 48.90 54.60 59.20
Wt of dried soil & container (g) 37.10 39.90 39.50 41.60 45.50
Wt of container (g) 14.60 15.80 19.80 15.40 18.40
Wt of dry soil (Wd) (g) 22.50 24.10 19.70 26.20 27.10
Wt of moisture (Wm) (g) 10.30 11.20 9.40 13.00 13.70
Moisture contain 100 (Wm/Wd) 45.78 46.47 47.72 49.62 50.55
Type of Test PL PL PL PL PL
No. of Blows/shrinkage %
Container No. PA KK I9
Wt of wet soil & container (g) 28.50 26.40 28.60
Wt of dried soil & container (g) 26.30 24.60 26.80
Wt of container (g) 17.90 17.90 19.30
Wt of dry soil (Wd) (g) 8.40 6.70 7.50
Wt of moisture (Wm) (g) 2.20 1.80 1.80
Moisture contain 100 (Wm/Wd) 26.19 26.87 24.00
LIQUID AND PLASTIC LIMITS,LINEAR SHRINKAGE
Sample No. POWER HOUSE, BH2, 15.0m.... Liquid Limit : 45.23 Plastic Limit: 25.69
Date: 25/06/2018………. Plastic Index: 22.54... Linear Shrinkage
Job…. Description of Soil…
Site: OKOMU……
L.L. Machine No..................... Operator......................................
Proportion of sample retained on No. 36 B.S. Steve = Per centNo. of blows refers to liquid limit determination.Shrinkage % refers to linear Shrinkage.Liquid limit marked L.L. plastic limit marked P.L. Linear shrinkage marked L.S.
y = -0.141x + 51.75
05
101520253035404550556065707580859095
100
0 5 10 15 20 25 30 35 40 45 50 55 60
MO
IST
UR
E C
ON
TE
NT
%
NUMBER OF BLOWS
LIQUID LIMIT
127

Type of Test LL LL LL LL LL
No. of Blows/shrinkage % 47.00 33.00 24.00 16.00 8.00
Container No. A9 LO PB UZ ZA
Wt of wet soil & container (g) 56.60 54.90 54.60 57.30 53.70
Wt of dried soil & container (g) 42.40 42.00 41.40 44.30 41.20
Wt of container (g) 14.60 17.80 16.70 20.30 18.20
Wt of dry soil (Wd) (g) 27.80 24.20 24.70 24.00 23.00
Wt of moisture (Wm) (g) 14.20 12.90 13.20 13.00 12.50
Moisture contain 100 (Wm/Wd) 51.08 53.31 53.44 54.17 54.35
Type of Test PL PL PL PL PL
No. of Blows/shrinkage %
Container No. CA OS ON
Wt of wet soil & container (g) 27.30 24.80 26.60
Wt of dried soil & container (g) 25.20 23.00 24.60
Wt of container (g) 17.80 16.30 16.70
Wt of dry soil (Wd) (g) 7.40 6.70 7.90
Wt of moisture (Wm) (g) 2.10 1.80 2.00
Moisture contain 100 (Wm/Wd) 28.38 26.87 25.32
LIQUID AND PLASTIC LIMITS,LINEAR SHRINKAGE
Sample No. PRESSING STATION, BH5, 7.5m... Liquid Limit : 53.32 Plastic Limit: 26.85
Date: 25/06/2018………. Plastic Index: 26.46... Linear Shrinkage
Job…. Description of Soil…
Site: OKOMU……
L.L. Machine No..................... Operator......................................
Proportion of sample retained on No. 36 B.S. Steve = Per centNo. of blows refers to liquid limit determination.Shrinkage % refers to linear Shrinkage.Liquid limit marked L.L. plastic limit marked P.L. Linear shrinkage marked L.S.
y = -0.0812x + 55.347
05
101520253035404550556065707580859095
100
0 5 10 15 20 25 30 35 40 45 50 55 60
MO
IST
UR
E C
ON
TE
NT
%
NUMBER OF BLOWS
LIQUID LIMIT
128

Type of Test LL LL LL LL LL
No. of Blows/shrinkage % 45.00 34.00 24.00 17.00 12.00
Container No. EM 7Z BO FR 4TH
Wt of wet soil & container (g) 54.30 56.00 56.60 53.20 57.10
Wt of dried soil & container (g) 42.90 42.90 43.50 40.10 42.50
Wt of container (g) 20.00 16.60 17.20 14.80 15.70
Wt of dry soil (Wd) (g) 22.90 26.30 26.30 25.30 26.80
Wt of moisture (Wm) (g) 11.40 13.10 13.10 13.10 14.60
Moisture contain 100 (Wm/Wd) 49.78 49.81 49.81 51.78 54.48
Type of Test PL PL PL PL PL
No. of Blows/shrinkage %
Container No. MA JA MO
Wt of wet soil & container (g) 25.20 27.80 25.00
Wt of dried soil & container (g) 23.00 25.60 23.10
Wt of container (g) 15.00 18.20 16.50
Wt of dry soil (Wd) (g) 8.00 7.40 6.60
Wt of moisture (Wm) (g) 2.20 2.20 1.90
Moisture contain 100 (Wm/Wd) 27.50 29.73 28.79
LIQUID AND PLASTIC LIMITS,LINEAR SHRINKAGE
Sample No. PRESSING STATION, BH5, 14.5m... Liquid Limit : 51.30 Plastic Limit: 28.67
Date: 25/06/2018………. Plastic Index: 22.63... Linear Shrinkage
Job…. Description of Soil…
Site: OKOMU……
L.L. Machine No..................... Operator......................................
Proportion of sample retained on No. 36 B.S. Steve = Per centNo. of blows refers to liquid limit determination.Shrinkage % refers to linear Shrinkage.Liquid limit marked L.L. plastic limit marked P.L. Linear shrinkage marked L.S.
y = -0.1223x + 54.36
05
101520253035404550556065707580859095
100
0 5 10 15 20 25 30 35 40 45 50 55 60
MO
IST
UR
E C
ON
TE
NT
%
NUMBER OF BLOWS
LIQUID LIMIT
129

51.3025
28.67
22.63
130

Type of Test LL LL LL LL LL
No. of Blows/shrinkage % 43.00 32.00 25.00 17.00 11.00
Container No. II EX KI IK B4
Wt of wet soil & container (g) 53.30 50.90 58.00 48.30 50.00
Wt of dried soil & container (g) 40.90 39.60 43.70 36.40 38.85
Wt of container (g) 16.70 18.50 17.50 15.00 19.50
Wt of dry soil (Wd) (g) 24.20 21.10 26.20 21.40 19.35
Wt of moisture (Wm) (g) 12.40 11.30 14.30 11.90 11.15
Moisture contain 100 (Wm/Wd) 51.24 53.55 54.58 55.61 57.62
Type of Test PL PL PL PL PL
No. of Blows/shrinkage %
Container No. Z OB UB
Wt of wet soil & container (g) 24.30 26.60 23.90
Wt of dried soil & container (g) 22.30 24.80 22.10
Wt of container (g) 15.20 18.30 15.30
Wt of dry soil (Wd) (g) 7.10 6.50 6.80
Wt of moisture (Wm) (g) 2.00 1.80 1.80
Moisture contain 100 (Wm/Wd) 28.17 27.69 26.47
LIQUID AND PLASTIC LIMITS,LINEAR SHRINKAGE
Sample No. RAMP 1, BH9, 2.0m... Liquid Limit : 54.63 Plastic Limit: 27.44
Date: 25/06/2018………. Plastic Index: 27.19... Linear Shrinkage
Job…. Description of Soil…
Site: OKOMU……
L.L. Machine No..................... Operator......................................
Proportion of sample retained on No. 36 B.S. Steve = Per centNo. of blows refers to liquid limit determination.Shrinkage % refers to linear Shrinkage.Liquid limit marked L.L. plastic limit marked P.L. Linear shrinkage marked L.S.
y = -0.1869x + 59.304
05
101520253035404550556065707580859095
100
0 5 10 15 20 25 30 35 40 45 50 55 60
MO
IST
UR
E C
ON
TE
NT
%
NUMBER OF BLOWS
LIQUID LIMIT
131

Type of Test LL LL LL LL LL
No. of Blows/shrinkage % 43.00 33.00 25.00 17.00 10.00
Container No. KC OB HF N 8I
Wt of wet soil & container (g) 48.60 57.50 52.70 53.30 52.40
Wt of dried soil & container (g) 37.20 43.00 40.40 40.60 39.50
Wt of container (g) 16.40 16.80 18.40 18.10 18.20
Wt of dry soil (Wd) (g) 20.80 26.20 22.00 22.50 21.30
Wt of moisture (Wm) (g) 11.40 14.50 12.30 12.70 12.90
Moisture contain 100 (Wm/Wd) 54.81 55.34 55.91 56.44 60.56
Type of Test PL PL PL PL PL
No. of Blows/shrinkage %
Container No. LI PK MO
Wt of wet soil & container (g) 27.60 25.20 24.50
Wt of dried soil & container (g) 25.80 22.90 22.40
Wt of container (g) 19.50 15.30 16.40
Wt of dry soil (Wd) (g) 6.30 7.60 6.00
Wt of moisture (Wm) (g) 1.80 2.30 2.10
Moisture contain 100 (Wm/Wd) 28.57 30.26 35.00
LIQUID AND PLASTIC LIMITS,LINEAR SHRINKAGE
Sample No. RAMP 1, BH9, 5.0m... Liquid Limit : 56.70 Plastic Limit: 31.28
Date: 25/06/2018………. Plastic Index: 25.43... Linear Shrinkage
Job…. Description of Soil…
Site: OKOMU……
L.L. Machine No..................... Operator......................................
Proportion of sample retained on No. 36 B.S. Steve = Per centNo. of blows refers to liquid limit determination.Shrinkage % refers to linear Shrinkage.Liquid limit marked L.L. plastic limit marked P.L. Linear shrinkage marked L.S.
y = -0.1489x + 60.426
05
101520253035404550556065707580859095
100
0 5 10 15 20 25 30 35 40 45 50 55 60
MO
IST
UR
E C
ON
TE
NT
%
NUMBER OF BLOWS
LIQUID LIMIT
132
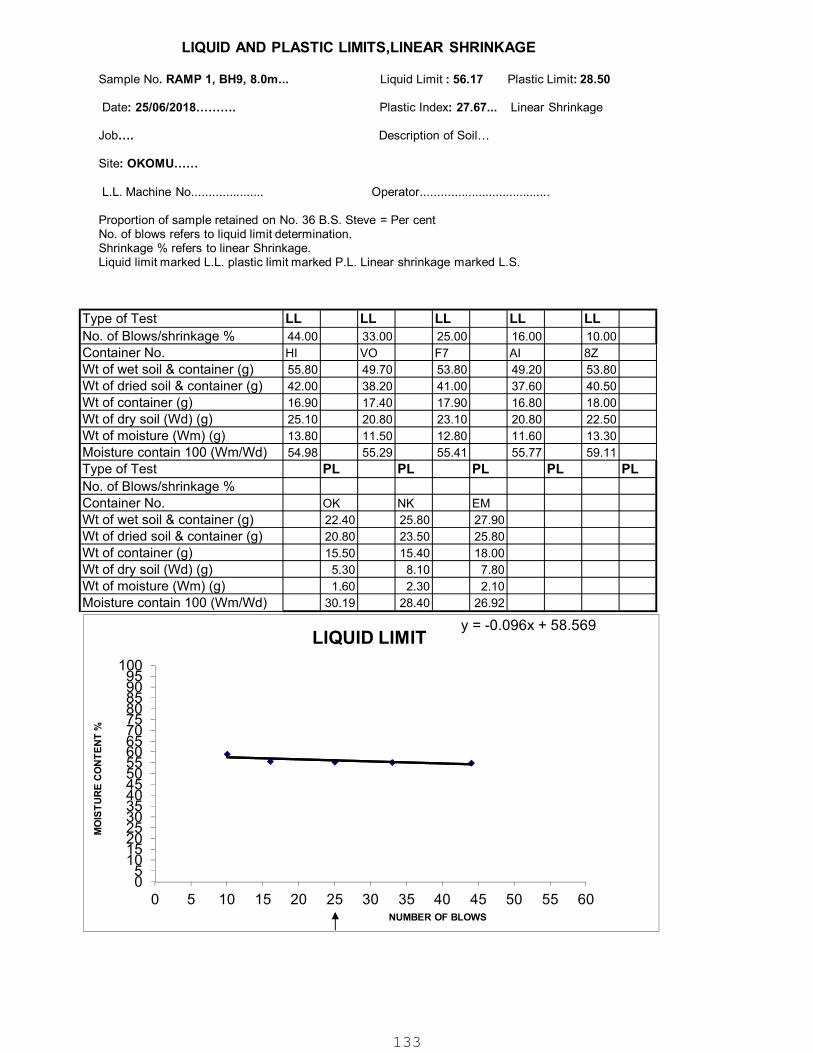
Type of Test LL LL LL LL LL
No. of Blows/shrinkage % 44.00 33.00 25.00 16.00 10.00
Container No. HI VO F7 AI 8Z
Wt of wet soil & container (g) 55.80 49.70 53.80 49.20 53.80
Wt of dried soil & container (g) 42.00 38.20 41.00 37.60 40.50
Wt of container (g) 16.90 17.40 17.90 16.80 18.00
Wt of dry soil (Wd) (g) 25.10 20.80 23.10 20.80 22.50
Wt of moisture (Wm) (g) 13.80 11.50 12.80 11.60 13.30
Moisture contain 100 (Wm/Wd) 54.98 55.29 55.41 55.77 59.11
Type of Test PL PL PL PL PL
No. of Blows/shrinkage %
Container No. OK NK EM
Wt of wet soil & container (g) 22.40 25.80 27.90
Wt of dried soil & container (g) 20.80 23.50 25.80
Wt of container (g) 15.50 15.40 18.00
Wt of dry soil (Wd) (g) 5.30 8.10 7.80
Wt of moisture (Wm) (g) 1.60 2.30 2.10
Moisture contain 100 (Wm/Wd) 30.19 28.40 26.92
LIQUID AND PLASTIC LIMITS,LINEAR SHRINKAGE
Sample No. RAMP 1, BH9, 8.0m... Liquid Limit : 56.17 Plastic Limit: 28.50
Date: 25/06/2018………. Plastic Index: 27.67... Linear Shrinkage
Job…. Description of Soil…
Site: OKOMU……
L.L. Machine No..................... Operator......................................
Proportion of sample retained on No. 36 B.S. Steve = Per centNo. of blows refers to liquid limit determination.Shrinkage % refers to linear Shrinkage.Liquid limit marked L.L. plastic limit marked P.L. Linear shrinkage marked L.S.
y = -0.096x + 58.569
05
101520253035404550556065707580859095
100
0 5 10 15 20 25 30 35 40 45 50 55 60
MO
IST
UR
E C
ON
TE
NT
%
NUMBER OF BLOWS
LIQUID LIMIT
133

Type of Test LL LL LL LL LL
No. of Blows/shrinkage % 44.00 33.00 25.00 16.00 10.00
Container No. PO P4 TA BO PR
Wt of wet soil & container (g) 53.30 59.50 57.60 58.70 50.80
Wt of dried soil & container (g) 42.30 45.30 45.10 45.30 39.40
Wt of container (g) 17.80 14.70 18.30 18.70 17.90
Wt of dry soil (Wd) (g) 24.50 30.60 26.80 26.60 21.50
Wt of moisture (Wm) (g) 11.00 14.20 12.50 13.40 11.40
Moisture contain 100 (Wm/Wd) 44.90 46.41 46.64 50.38 53.02
Type of Test PL PL PL PL
No. of Blows/shrinkage %
Container No. WN AN O6
Wt of wet soil & container (g) 25.50 25.80 23.70
Wt of dried soil & container (g) 23.30 23.40 22.00
Wt of container (g) 15.40 14.60 15.60
Wt of dry soil (Wd) (g) 7.90 8.80 6.40
Wt of moisture (Wm) (g) 2.20 2.40 1.70
Moisture contain 100 (Wm/Wd) 27.85 27.27 26.56
LIQUID AND PLASTIC LIMITS,LINEAR SHRINKAGE
Sample No. RAMP 1, BH9, 11.0m... Liquid Limit : 48.41 Plastic Limit: 27.23
Date: 25/06/2018………. Plastic Index: 21.18... Linear Shrinkage
Job…. Description of Soil…
Site: OKOMU……
L.L. Machine No..................... Operator......................................
Proportion of sample retained on No. 36 B.S. Steve = Per centNo. of blows refers to liquid limit determination.Shrinkage % refers to linear Shrinkage.Liquid limit marked L.L. plastic limit marked P.L. Linear shrinkage marked L.S.
y = -0.2321x + 54.21
05
101520253035404550556065707580859095
100
0 5 10 15 20 25 30 35 40 45 50 55 60
MO
IST
UR
E C
ON
TE
NT
%
NUMBER OF BLOWS
LIQUID LIMIT
134

Type of Test LL LL LL LL LL
No. of Blows/shrinkage % 43.00 32.00 25.00 17.00 9.00
Container No. TI JO OZ PI H
Wt of wet soil & container (g) 53.10 55.60 58.70 56.90 56.20
Wt of dried soil & container (g) 40.60 43.40 45.50 43.80 43.30
Wt of container (g) 13.50 17.00 17.60 17.00 18.50
Wt of dry soil (Wd) (g) 27.10 26.40 27.90 26.80 24.80
Wt of moisture (Wm) (g) 12.50 12.20 13.20 13.10 12.90
Moisture contain 100 (Wm/Wd) 46.13 46.21 47.31 48.88 52.02
Type of Test PL PL PL PL PL
No. of Blows/shrinkage %
Container No. WR MO RE
Wt of wet soil & container (g) 29.30 23.60 26.50
Wt of dried soil & container (g) 26.60 21.60 24.70
Wt of container (g) 16.60 15.00 18.10
Wt of dry soil (Wd) (g) 10.00 6.60 6.60
Wt of moisture (Wm) (g) 2.70 2.00 1.80
Moisture contain 100 (Wm/Wd) 27.00 30.30 27.27
LIQUID AND PLASTIC LIMITS,LINEAR SHRINKAGE
Sample No. RAMP 11, BH10, 1.5m... Liquid Limit : 48.14 Plastic Limit: 28.19
Date: 25/06/2018………. Plastic Index: 19.95... Linear Shrinkage
Job…. Description of Soil…
Site: OKOMU……
L.L. Machine No..................... Operator......................................
Proportion of sample retained on No. 36 B.S. Steve = Per centNo. of blows refers to liquid limit determination.Shrinkage % refers to linear Shrinkage.Liquid limit marked L.L. plastic limit marked P.L. Linear shrinkage marked L.S.
y = -0.1698x + 52.389
05
101520253035404550556065707580859095
100
0 5 10 15 20 25 30 35 40 45 50 55 60
MO
IST
UR
E C
ON
TE
NT
%
NUMBER OF BLOWS
LIQUID LIMIT
135

Type of Test LL LL LL LL LL
No. of Blows/shrinkage % 44.00 33.00 25.00 17.00 11.00
Container No. 4TH N UZ KK FA
Wt of wet soil & container (g) 53.20 52.10 55.50 52.70 50.90
Wt of dried soil & container (g) 42.50 40.00 44.00 39.80 39.60
Wt of container (g) 17.80 14.50 19.80 15.80 18.60
Wt of dry soil (Wd) (g) 24.70 25.50 24.20 24.00 21.00
Wt of moisture (Wm) (g) 10.70 12.10 11.50 12.90 11.30
Moisture contain 100 (Wm/Wd) 43.32 47.45 47.52 53.75 53.81
Type of Test PL PL PL PL PL
No. of Blows/shrinkage %
Container No. EM OF CA
Wt of wet soil & container (g) 23.60 28.90 26.60
Wt of dried soil & container (g) 21.80 26.70 24.60
Wt of container (g) 15.60 18.40 17.90
Wt of dry soil (Wd) (g) 6.20 8.30 6.70
Wt of moisture (Wm) (g) 1.80 2.20 2.00
Moisture contain 100 (Wm/Wd) 29.03 26.51 29.85
LIQUID AND PLASTIC LIMITS,LINEAR SHRINKAGE
Sample No. RAMP 11, BH10, 7.5m... Liquid Limit : 49.50 Plastic Limit: 28.46
Date: 25/06/2018………. Plastic Index: 21.04... Linear Shrinkage
Job…. Description of Soil…
Site: OKOMU……
L.L. Machine No..................... Operator......................................
Proportion of sample retained on No. 36 B.S. Steve = Per centNo. of blows refers to liquid limit determination.Shrinkage % refers to linear Shrinkage.Liquid limit marked L.L. plastic limit marked P.L. Linear shrinkage marked L.S.
y = -0.3331x + 57.83
05
101520253035404550556065707580859095
100
0 5 10 15 20 25 30 35 40 45 50 55 60
MO
IST
UR
E C
ON
TE
NT
%
NUMBER OF BLOWS
LIQUID LIMIT
136

Type of Test LL LL LL LL LL
No. of Blows/shrinkage % 45.00 32.00 24.00 18.00 9.00
Container No. IE EM VI BA AR
Wt of wet soil & container (g) 51.30 57.10 53.60 50.30 48.70
Wt of dried soil & container (g) 40.70 45.20 42.00 39.40 37.90
Wt of container (g) 18.00 20.10 18.10 17.40 17.00
Wt of dry soil (Wd) (g) 22.70 25.10 23.90 22.00 20.90
Wt of moisture (Wm) (g) 10.60 11.90 11.60 10.90 10.80
Moisture contain 100 (Wm/Wd) 46.70 47.41 48.54 49.55 51.67
Type of Test PL PL PL PL PL
No. of Blows/shrinkage %
Container No. ZZ ET IZ
Wt of wet soil & container (g) 25.80 27.40 25.10
Wt of dried soil & container (g) 23.40 25.40 22.99
Wt of container (g) 14.80 17.70 15.40
Wt of dry soil (Wd) (g) 8.60 7.70 7.59
Wt of moisture (Wm) (g) 2.40 2.00 2.11
Moisture contain 100 (Wm/Wd) 27.91 25.97 27.80
LIQUID AND PLASTIC LIMITS,LINEAR SHRINKAGE
Sample No. RAMP 11, BH10, 10.5m... Liquid Limit : 48.85 Plastic Limit: 27.23
Date: 25/06/2018………. Plastic Index: 21.63... Linear Shrinkage
Job…. Description of Soil…
Site: OKOMU……
L.L. Machine No..................... Operator......................................
Proportion of sample retained on No. 36 B.S. Steve = Per centNo. of blows refers to liquid limit determination.Shrinkage % refers to linear Shrinkage.Liquid limit marked L.L. plastic limit marked P.L. Linear shrinkage marked L.S.
y = -0.1363x + 52.262
05
101520253035404550556065707580859095
100
0 5 10 15 20 25 30 35 40 45 50 55 60
MO
IST
UR
E C
ON
TE
NT
%
NUMBER OF BLOWS
LIQUID LIMIT
137

Type of Test LL LL LL LL LL
No. of Blows/shrinkage % 45.00 34.00 24.00 18.00 10.00
Container No. RA ZA UL OR TO
Wt of wet soil & container (g) 50.30 48.30 50.00 51.80 51.90
Wt of dried soil & container (g) 38.90 37.30 38.60 38.40 38.90
Wt of container (g) 17.70 17.20 17.80 14.30 16.20
Wt of dry soil (Wd) (g) 21.20 20.10 20.80 24.10 22.70
Wt of moisture (Wm) (g) 11.40 11.00 11.40 13.40 13.00
Moisture contain 100 (Wm/Wd) 53.77 54.73 54.81 55.60 57.27
Type of Test PL PL PL PL PL
No. of Blows/shrinkage %
Container No. WW OX WO
Wt of wet soil & container (g) 23.50 25.70 26.40
Wt of dried soil & container (g) 21.40 23.80 24.20
Wt of container (g) 13.00 17.00 15.00
Wt of dry soil (Wd) (g) 8.40 6.80 9.20
Wt of moisture (Wm) (g) 2.10 1.90 2.20
Moisture contain 100 (Wm/Wd) 25.00 27.94 23.91
LIQUID AND PLASTIC LIMITS,LINEAR SHRINKAGE
Sample No. RAMP 11, BH10, 13.5m... Liquid Limit : 55.34 Plastic Limit: 25.62
Date: 25/06/2018………. Plastic Index: 29.73... Linear Shrinkage
Job…. Description of Soil…
Site: OKOMU……
L.L. Machine No..................... Operator......................................
Proportion of sample retained on No. 36 B.S. Steve = Per centNo. of blows refers to liquid limit determination.Shrinkage % refers to linear Shrinkage.Liquid limit marked L.L. plastic limit marked P.L. Linear shrinkage marked L.S.
y = -0.0887x + 57.561
05
101520253035404550556065707580859095
100
0 5 10 15 20 25 30 35 40 45 50 55 60
MO
IST
UR
E C
ON
TE
NT
%
NUMBER OF BLOWS
LIQUID LIMIT
138

Type of Test LL LL LL LL LL
No. of Blows/shrinkage % 45.00 34.00 24.00 18.00 10.00
Container No. RA ZA UL OR TO
Wt of wet soil & container (g) 50.30 48.30 50.00 51.80 51.90
Wt of dried soil & container (g) 38.90 37.30 38.60 38.40 38.90
Wt of container (g) 17.70 17.20 17.80 14.30 16.20
Wt of dry soil (Wd) (g) 21.20 20.10 20.80 24.10 22.70
Wt of moisture (Wm) (g) 11.40 11.00 11.40 13.40 13.00
Moisture contain 100 (Wm/Wd) 53.77 54.73 54.81 55.60 57.27
Type of Test PL PL PL PL PL
No. of Blows/shrinkage %
Container No. WW OX WO
Wt of wet soil & container (g) 23.50 25.70 26.40
Wt of dried soil & container (g) 21.40 23.80 24.20
Wt of container (g) 13.00 17.00 15.00
Wt of dry soil (Wd) (g) 8.40 6.80 9.20
Wt of moisture (Wm) (g) 2.10 1.90 2.20
Moisture contain 100 (Wm/Wd) 25.00 27.94 23.91
LIQUID AND PLASTIC LIMITS,LINEAR SHRINKAGE
Sample No. RAMP 11, BH10, 13.5m... Liquid Limit : 55.34 Plastic Limit: 25.62
Date: 25/06/2018………. Plastic Index: 29.73... Linear Shrinkage
Job…. Description of Soil…
Site: OKOMU……
L.L. Machine No..................... Operator......................................
Proportion of sample retained on No. 36 B.S. Steve = Per centNo. of blows refers to liquid limit determination.Shrinkage % refers to linear Shrinkage.Liquid limit marked L.L. plastic limit marked P.L. Linear shrinkage marked L.S.
y = -0.0887x + 57.561
05
101520253035404550556065707580859095
100
0 5 10 15 20 25 30 35 40 45 50 55 60
MO
IST
UR
E C
ON
TE
NT
%
NUMBER OF BLOWS
LIQUID LIMIT
139

Type of Test LL LL LL LL LL
No. of Blows/shrinkage % 47.00 35.00 25.00 17.00 11.00
Container No. TW VC VI HO BT
Wt of wet soil & container (g) 57.70 56.50 52.30 51.50 50.50
Wt of dried soil & container (g) 46.40 44.20 41.70 40.30 38.70
Wt of container (g) 16.50 14.80 18.10 17.30 15.10
Wt of dry soil (Wd) (g) 29.90 29.40 23.60 23.00 23.60
Wt of moisture (Wm) (g) 11.30 12.30 10.60 11.20 11.80
Moisture contain 100 (Wm/Wd) 37.79 41.84 44.92 48.70 50.00
Type of Test PL PL PL PL PL
No. of Blows/shrinkage %
Container No. CP NI VO
Wt of wet soil & container (g) 26.00 21.40 27.50
Wt of dried soil & container (g) 24.30 19.90 25.50
Wt of container (g) 17.20 13.90 17.40
Wt of dry soil (Wd) (g) 7.10 6.00 8.10
Wt of moisture (Wm) (g) 1.70 1.50 2.00
Moisture contain 100 (Wm/Wd) 23.94 25.00 24.69
LIQUID AND PLASTIC LIMITS,LINEAR SHRINKAGE
Sample No. STERBILIZER, BH4, 0.5m.... Liquid Limit : 45.34 Plastic Limit: 24.55
Date: 25/06/2018………. Plastic Index: 20.80... Linear Shrinkage
Job…. Description of Soil…
Site: OKOMU……
L.L. Machine No..................... Operator......................................
Proportion of sample retained on No. 36 B.S. Steve = Per centNo. of blows refers to liquid limit determination.Shrinkage % refers to linear Shrinkage.Liquid limit marked L.L. plastic limit marked P.L. Linear shrinkage marked L.S.
y = -0.3474x + 54.027
05
101520253035404550556065707580859095
100
0 5 10 15 20 25 30 35 40 45 50 55 60
MO
IST
UR
E C
ON
TE
NT
%
NUMBER OF BLOWS
LIQUID LIMIT
140

Type of Test LL LL LL LL LL
No. of Blows/shrinkage % 44.00 31.00 23.00 15.00 10.00
Container No. PX 7Z 9TH BA QZ
Wt of wet soil & container (g) 56.70 51.30 47.70 49.00 54.80
Wt of dried soil & container (g) 43.60 40.40 37.70 38.10 42.60
Wt of container (g) 17.30 18.70 18.10 17.10 19.70
Wt of dry soil (Wd) (g) 26.30 21.70 19.60 21.00 22.90
Wt of moisture (Wm) (g) 13.10 10.90 10.00 10.90 12.20
Moisture contain 100 (Wm/Wd) 49.81 50.23 51.02 51.90 53.28
Type of Test PL PL PL PL PL
No. of Blows/shrinkage %
Container No. ZI RI TA
Wt of wet soil & container (g) 22.80 28.40 29.10
Wt of dried soil & container (g) 21.00 26.30 26.80
Wt of container (g) 14.30 18.90 17.90
Wt of dry soil (Wd) (g) 6.70 7.40 8.90
Wt of moisture (Wm) (g) 1.80 2.10 2.30
Moisture contain 100 (Wm/Wd) 26.87 28.38 25.84
LIQUID AND PLASTIC LIMITS,LINEAR SHRINKAGE
Sample No. STERBILIZER, BH4, 3.5m.... Liquid Limit : 29.50 Plastic Limit: 27.03
Date: 25/06/2018………. Plastic Index: 2.47... Linear Shrinkage
Job…. Description of Soil…
Site: OKOMU……
L.L. Machine No..................... Operator......................................
Proportion of sample retained on No. 36 B.S. Steve = Per centNo. of blows refers to liquid limit determination.Shrinkage % refers to linear Shrinkage.Liquid limit marked L.L. plastic limit marked P.L. Linear shrinkage marked L.S.
y = -0.0965x + 53.621
05
101520253035404550556065707580859095
100
0 5 10 15 20 25 30 35 40 45 50 55 60
MO
IST
UR
E C
ON
TE
NT
%
NUMBER OF BLOWS
LIQUID LIMIT
141

Type of Test LL LL LL LL LL
No. of Blows/shrinkage % 46.00 33.00 25.00 16.00 9.00
Container No. MP OZ FA F7 6Z
Wt of wet soil & container (g) 56.80 56.90 56.90 55.30 51.00
Wt of dried soil & container (g) 43.80 43.40 43.40 42.10 38.00
Wt of container (g) 17.60 17.80 18.60 17.90 14.30
Wt of dry soil (Wd) (g) 26.20 25.60 24.80 24.20 23.70
Wt of moisture (Wm) (g) 13.00 13.50 13.50 13.20 13.00
Moisture contain 100 (Wm/Wd) 49.62 52.73 54.44 54.55 54.85
Type of Test PL PL PL PL PL
No. of Blows/shrinkage %
Container No. OO OH UK
Wt of wet soil & container (g) 28.70 29.10 27.10
Wt of dried soil & container (g) 26.00 26.90 24.80
Wt of container (g) 16.70 18.60 16.00
Wt of dry soil (Wd) (g) 9.30 8.30 8.80
Wt of moisture (Wm) (g) 2.70 2.20 2.30
Moisture contain 100 (Wm/Wd) 29.03 26.51 26.14
LIQUID AND PLASTIC LIMITS,LINEAR SHRINKAGE
Sample No. STERBILIZER, BH4, 9.5m... Liquid Limit : 53.35 Plastic Limit: 27.22
Date: 25/06/2018………. Plastic Index: 26.13... Linear Shrinkage
Job…. Description of Soil…
Site: OKOMU……
L.L. Machine No..................... Operator......................................
Proportion of sample retained on No. 36 B.S. Steve = Per centNo. of blows refers to liquid limit determination.Shrinkage % refers to linear Shrinkage.Liquid limit marked L.L. plastic limit marked P.L. Linear shrinkage marked L.S.
y = -0.1402x + 56.855
05
101520253035404550556065707580859095
100
0 5 10 15 20 25 30 35 40 45 50 55 60
MO
IST
UR
E C
ON
TE
NT
%
NUMBER OF BLOWS
LIQUID LIMIT
142

Type of Test LL LL LL LL LL
No. of Blows/shrinkage % 45.00 32.00 25.00 18.00 11.00
Container No. HI PO CO ST CN
Wt of wet soil & container (g) 54.40 51.00 56.10 54.00 56.00
Wt of dried soil & container (g) 42.10 38.80 43.30 41.90 42.10
Wt of container (g) 17.20 15.50 18.00 18.10 15.60
Wt of dry soil (Wd) (g) 24.90 23.30 25.30 23.80 26.50
Wt of moisture (Wm) (g) 12.30 12.20 12.80 12.10 13.90
Moisture contain 100 (Wm/Wd) 49.40 52.36 50.59 50.84 52.45
Type of Test PL PL PL PL PL
No. of Blows/shrinkage %
Container No. CP NI VO
Wt of wet soil & container (g) 26.00 21.40 27.50
Wt of dried soil & container (g) 24.30 19.90 25.50
Wt of container (g) 17.20 13.90 17.40
Wt of dry soil (Wd) (g) 7.10 6.00 8.10
Wt of moisture (Wm) (g) 1.70 1.50 2.00
Moisture contain 100 (Wm/Wd) 23.94 25.00 24.69
LIQUID AND PLASTIC LIMITS,LINEAR SHRINKAGE
Sample No. STERILIZER, BH4, 12.5m.... Liquid Limit : 45.34 Plastic Limit: 24.55
Date: 25/06/2018………. Plastic Index: 20.80... Linear Shrinkage
Job…. Description of Soil…
Site: OKOMU……
L.L. Machine No..................... Operator......................................
Proportion of sample retained on No. 36 B.S. Steve = Per centNo. of blows refers to liquid limit determination.Shrinkage % refers to linear Shrinkage.Liquid limit marked L.L. plastic limit marked P.L. Linear shrinkage marked L.S.
y = -0.0619x + 52.751
05
101520253035404550556065707580859095
100
0 5 10 15 20 25 30 35 40 45 50 55 60
MO
IST
UR
E C
ON
TE
NT
%
NUMBER OF BLOWS
LIQUID LIMIT
143

Type of Test LL LL LL LL LL
No. of Blows/shrinkage % 46.00 35.00 25.00 16.00 11.00
Container No. IA CV ZU HI YZ
Wt of wet soil & container (g) 55.20 59.00 58.50 57.80 59.20
Wt of dried soil & container (g) 41.50 44.10 44.20 42.80 44.90
Wt of container (g) 15.80 16.20 17.50 15.50 18.90
Wt of dry soil (Wd) (g) 25.70 27.90 26.70 27.30 26.00
Wt of moisture (Wm) (g) 13.70 14.90 14.30 15.00 14.30
Moisture contain 100 (Wm/Wd) 53.31 53.41 53.56 54.95 55.00
Type of Test PL PL PL PL PL
No. of Blows/shrinkage %
Container No. EM O4 ZA
Wt of wet soil & container (g) 26.20 26.80 27.80
Wt of dried soil & container (g) 24.50 25.10 25.80
Wt of container (g) 18.00 18.80 17.50
Wt of dry soil (Wd) (g) 6.50 6.30 8.30
Wt of moisture (Wm) (g) 1.70 1.70 2.00
Moisture contain 100 (Wm/Wd) 26.15 26.98 24.10
LIQUID AND PLASTIC LIMITS,LINEAR SHRINKAGE
Sample No. STORAGE TANK, BH6, 10.0m... Liquid Limit : 54.13 Plastic Limit: 25.74
Date: 25/06/2018………. Plastic Index: 28.39... Linear Shrinkage
Job…. Description of Soil…
Site: OKOMU……
L.L. Machine No..................... Operator......................................
Proportion of sample retained on No. 36 B.S. Steve = Per centNo. of blows refers to liquid limit determination.Shrinkage % refers to linear Shrinkage.Liquid limit marked L.L. plastic limit marked P.L. Linear shrinkage marked L.S.
y = -0.0538x + 55.475
05
101520253035404550556065707580859095
100
0 5 10 15 20 25 30 35 40 45 50 55 60
MO
IST
UR
E C
ON
TE
NT
%
NUMBER OF BLOWS
LIQUID LIMIT
144

Type of Test LL LL LL LL LL
No. of Blows/shrinkage % 45.00 31.00 25.00 16.00 10.00
Container No. JO JJ IA GO JO
Wt of wet soil & container (g) 46.40 50.40 53.70 57.40 52.50
Wt of dried soil & container (g) 36.60 39.30 40.80 43.80 40.40
Wt of container (g) 16.20 17.10 15.20 17.80 17.70
Wt of dry soil (Wd) (g) 20.40 22.20 25.60 26.00 22.70
Wt of moisture (Wm) (g) 9.80 11.10 12.90 13.60 12.10
Moisture contain 100 (Wm/Wd) 48.04 50.00 50.39 52.31 53.30
Type of Test PL PL PL PL PL
No. of Blows/shrinkage %
Container No. VO IJ TM
Wt of wet soil & container (g) 26.90 25.20 25.70
Wt of dried soil & container (g) 24.70 23.40 23.70
Wt of container (g) 18.10 17.00 17.10
Wt of dry soil (Wd) (g) 6.60 6.40 6.60
Wt of moisture (Wm) (g) 2.20 1.80 2.00
Moisture contain 100 (Wm/Wd) 33.33 28.13 30.30
LIQUID AND PLASTIC LIMITS,LINEAR SHRINKAGE
Sample No. WATER TANK, BH8, 6.0m... Liquid Limit : 50.87 Plastic Limit: 30.87
Date: 25/06/2018………. Plastic Index: 20.28... Linear Shrinkage
Job…. Description of Soil…
Site: OKOMU……
L.L. Machine No..................... Operator......................................
Proportion of sample retained on No. 36 B.S. Steve = Per centNo. of blows refers to liquid limit determination.Shrinkage % refers to linear Shrinkage.Liquid limit marked L.L. plastic limit marked P.L. Linear shrinkage marked L.S.
y = -0.15x + 54.618
05
101520253035404550556065707580859095
100
0 5 10 15 20 25 30 35 40 45 50 55 60
MO
IST
UR
E C
ON
TE
NT
%
NUMBER OF BLOWS
LIQUID LIMIT
145

Type of Test LL LL LL LL LL
No. of Blows/shrinkage % 44.00 31.00 25.00 17.00 11.00
Container No. 8I KO FO OZ 7O
Wt of wet soil & container (g) 56.40 58.40 55.60 56.40 56.20
Wt of dried soil & container (g) 44.20 44.60 42.10 42.90 43.50
Wt of container (g) 17.90 16.30 15.40 16.50 18.90
Wt of dry soil (Wd) (g) 26.30 28.30 26.70 26.40 24.60
Wt of moisture (Wm) (g) 12.20 13.80 13.50 13.50 12.70
Moisture contain 100 (Wm/Wd) 46.39 48.76 50.56 51.14 51.63
Type of Test PL PL PL PL PL
No. of Blows/shrinkage %
Container No. CV JO GO
Wt of wet soil & container (g) 23.70 28.50 28.70
Wt of dried soil & container (g) 22.20 26.30 26.30
Wt of container (g) 16.20 17.70 17.90
Wt of dry soil (Wd) (g) 6.00 8.60 8.40
Wt of moisture (Wm) (g) 1.50 2.20 2.40
Moisture contain 100 (Wm/Wd) 25.00 25.58 28.57
LIQUID AND PLASTIC LIMITS,LINEAR SHRINKAGE
Sample No. WATER TANK, BH8, 9.0m... Liquid Limit : 49.79 Plastic Limit: 26.38
Date: 25/06/2018………. Plastic Index: 23.41... Linear Shrinkage
Job…. Description of Soil…
Site: OKOMU……
L.L. Machine No..................... Operator......................................
Proportion of sample retained on No. 36 B.S. Steve = Per centNo. of blows refers to liquid limit determination.Shrinkage % refers to linear Shrinkage.Liquid limit marked L.L. plastic limit marked P.L. Linear shrinkage marked L.S.
y = -0.1633x + 53.875
05
101520253035404550556065707580859095
100
0 5 10 15 20 25 30 35 40 45 50 55 60
MO
IST
UR
E C
ON
TE
NT
%
NUMBER OF BLOWS
LIQUID LIMIT
146

Type of Test LL LL LL LL LL
No. of Blows/shrinkage % 44.00 32.00 24.00 17.00 9.00
Container No. KI JO 4M CA F3
Wt of wet soil & container (g) 47.50 55.50 56.90 56.90 58.20
Wt of dried soil & container (g) 37.00 42.15 42.50 43.40 44.00
Wt of container (g) 14.20 14.80 15.30 18.30 17.80
Wt of dry soil (Wd) (g) 22.80 27.35 27.20 25.10 26.20
Wt of moisture (Wm) (g) 10.50 13.35 14.40 13.50 14.20
Moisture contain 100 (Wm/Wd) 46.05 48.81 52.94 53.78 54.20
Type of Test PL PL PL PL PL
No. of Blows/shrinkage %
Container No. TA AL X
Wt of wet soil & container (g) 28.10 24.90 25.20
Wt of dried soil & container (g) 26.30 22.80 23.60
Wt of container (g) 20.00 15.10 17.90
Wt of dry soil (Wd) (g) 6.30 7.70 5.70
Wt of moisture (Wm) (g) 1.80 2.10 1.60
Moisture contain 100 (Wm/Wd) 28.57 27.27 28.07
LIQUID AND PLASTIC LIMITS,LINEAR SHRINKAGE
Sample No. WATER TANK, BH8, 12.0m... Liquid Limit : 51.21 Plastic Limit: 27.97
Date: 25/06/2018………. Plastic Index: 23.24... Linear Shrinkage
Job…. Description of Soil…
Site: OKOMU……
L.L. Machine No..................... Operator......................................
Proportion of sample retained on No. 36 B.S. Steve = Per centNo. of blows refers to liquid limit determination.Shrinkage % refers to linear Shrinkage.Liquid limit marked L.L. plastic limit marked P.L. Linear shrinkage marked L.S.
y = -0.253x + 57.533
05
101520253035404550556065707580859095
100
0 5 10 15 20 25 30 35 40 45 50 55 60
MO
IST
UR
E C
ON
TE
NT
%
NUMBER OF BLOWS
LIQUID LIMIT
147

Type of Test LL LL LL LL LL
No. of Blows/shrinkage % 42.00 32.00 23.00 16.00 16.00
Container No. LO ZA K 6TH AA
Wt of wet soil & container (g) 59.50 53.60 54.90 58.50 54.70
Wt of dried soil & container (g) 45.00 41.70 41.20 44.80 40.99
Wt of container (g) 16.00 18.10 14.20 18.40 15.40
Wt of dry soil (Wd) (g) 29.00 23.60 27.00 26.40 25.59
Wt of moisture (Wm) (g) 14.50 11.90 13.70 13.70 13.71
Moisture contain 100 (Wm/Wd) 50.00 50.42 50.74 51.89 53.58
Type of Test PL PL PL PL PL
No. of Blows/shrinkage %
Container No. GG IN PX
Wt of wet soil & container (g) 26.10 25.80 25.40
Wt of dried soil & container (g) 23.90 23.80 23.40
Wt of container (g) 15.00 16.10 16.20
Wt of dry soil (Wd) (g) 8.90 7.70 7.20
Wt of moisture (Wm) (g) 2.20 2.00 2.00
Moisture contain 100 (Wm/Wd) 24.72 25.97 27.78
LIQUID AND PLASTIC LIMITS,LINEAR SHRINKAGE
Sample No. WATER TANK, BH8, 15.0m... Liquid Limit : 51.41 Plastic Limit: 26.16
Date: 25/06/2018………. Plastic Index: 25.26... Linear Shrinkage
Job…. Description of Soil…
Site: OKOMU……
L.L. Machine No..................... Operator......................................
Proportion of sample retained on No. 36 B.S. Steve = Per centNo. of blows refers to liquid limit determination.Shrinkage % refers to linear Shrinkage.Liquid limit marked L.L. plastic limit marked P.L. Linear shrinkage marked L.S.
y = -0.1059x + 54.06
05
101520253035404550556065707580859095
100
0 5 10 15 20 25 30 35 40 45 50 55 60
MO
IST
UR
E C
ON
TE
NT
%
NUMBER OF BLOWS
LIQUID LIMIT
148

Type of Test LL LL LL LL LL
No. of Blows/shrinkage % 44.00 31.00 24.00 17.00 11.00
Container No. P5 CL IJ 8Z D
Wt of wet soil & container (g) 58.20 51.20 57.50 52.30 53.50
Wt of dried soil & container (g) 44.70 39.40 43.80 39.30 40.90
Wt of container (g) 18.30 16.40 17.40 15.00 17.50
Wt of dry soil (Wd) (g) 26.40 23.00 26.40 24.30 23.40
Wt of moisture (Wm) (g) 13.50 11.80 13.70 13.00 12.60
Moisture contain 100 (Wm/Wd) 51.14 51.30 51.89 53.50 53.85
Type of Test PL PL PL PL PL
No. of Blows/shrinkage %
Container No. LB PA NZ
Wt of wet soil & container (g) 23.10 25.60 25.90
Wt of dried soil & container (g) 21.60 23.90 23.80
Wt of container (g) 16.00 17.70 16.80
Wt of dry soil (Wd) (g) 5.60 6.20 7.00
Wt of moisture (Wm) (g) 1.50 1.70 2.10
Moisture contain 100 (Wm/Wd) 26.79 27.42 30.00
LIQUID AND PLASTIC LIMITS,LINEAR SHRINKAGE
Sample No. WEIGH BRIGDE, BH7, 7.0m... Liquid Limit : 52.37 Plastic Limit: 28.07
Date: 25/06/2018………. Plastic Index: 24.30... Linear Shrinkage
Job…. Description of Soil…
Site: OKOMU……
L.L. Machine No..................... Operator......................................
Proportion of sample retained on No. 36 B.S. Steve = Per centNo. of blows refers to liquid limit determination.Shrinkage % refers to linear Shrinkage.Liquid limit marked L.L. plastic limit marked P.L. Linear shrinkage marked L.S.
y = -0.0897x + 54.615
05
101520253035404550556065707580859095
100
0 5 10 15 20 25 30 35 40 45 50 55 60
MO
IST
UR
E C
ON
TE
NT
%
NUMBER OF BLOWS
LIQUID LIMIT
149

Type of Test LL LL LL LL LL
No. of Blows/shrinkage % 47.00 31.00 23.00 17.00 9.00
Container No. OS OB ED JI NA
Wt of wet soil & container (g) 52.40 49.00 52.60 51.50 52.30
Wt of dried soil & container (g) 40.40 39.10 40.20 39.20 38.80
Wt of container (g) 16.90 20.20 17.20 17.90 15.70
Wt of dry soil (Wd) (g) 23.50 18.90 23.00 21.30 23.10
Wt of moisture (Wm) (g) 12.00 9.90 12.40 12.30 13.50
Moisture contain 100 (Wm/Wd) 51.06 52.38 53.91 57.75 58.44
Type of Test PL PL PL PL PL
No. of Blows/shrinkage %
Container No. FO OK OS
Wt of wet soil & container (g) 27.50 25.40 23.60
Wt of dried soil & container (g) 25.30 23.50 21.70
Wt of container (g) 18.10 17.00 14.80
Wt of dry soil (Wd) (g) 7.20 6.50 6.90
Wt of moisture (Wm) (g) 2.20 1.90 1.90
Moisture contain 100 (Wm/Wd) 30.56 29.23 27.54
LIQUID AND PLASTIC LIMITS,LINEAR SHRINKAGE
Sample No. WEIGH BRIGDE, BH7, 4.0m... Liquid Limit : 54.79 Plastic Limit: 29.11
Date: 25/06/2018………. Plastic Index: 25.69... Linear Shrinkage
Job…. Description of Soil…
Site: OKOMU……
L.L. Machine No..................... Operator......................................
Proportion of sample retained on No. 36 B.S. Steve = Per centNo. of blows refers to liquid limit determination.Shrinkage % refers to linear Shrinkage.Liquid limit marked L.L. plastic limit marked P.L. Linear shrinkage marked L.S.
y = -0.2094x + 60.029
05
101520253035404550556065707580859095
100
0 5 10 15 20 25 30 35 40 45 50 55 60
MO
IST
UR
E C
ON
TE
NT
%
NUMBER OF BLOWS
LIQUID LIMIT
150

JEFFA GEOTECH
APPENDIX III
151

Wt. of mould & wet Soil (W2) g
Wt. of mould (W1) g
Wt. of wet soil (W2-W1) g
Bulk Density (Pb) (W2-W1)/x g/cm3
Container No. AC LH AZ SU II PK MO UB AB AI
Wt. of wet soil & container (g) 37.70 44.10 45.30 40.90 47.60 51.10 46.90 46.60 41.50 47.30
Wt. of Dry soil & container (g) 35.50 41.50 42.30 38.10 43.60 46.60 42.80 42.20 37.90 42.80
Wt. of Container (g) 15.00 18.70 16.80 14.70 16.80 15.20 18.30 15.10 17.10 16.70
Wt. of dry soil (Wd) g 20.50 22.80 25.50 23.40 26.80 31.40 24.50 27.10 20.80 26.10
Wt. of Moisture (Wm) g 2.20 2.60 3.00 2.80 4.00 4.50 4.10 4.40 3.60 4.50
Moistur Content 100(Wm/Wd) % 10.73 11.40 11.76 11.97 14.93 14.33 16.73 16.24 17.31 17.24
Average Moisture Content (m) %
Dry Density = Pb/1+ (m/100) (g/cm3)
C.B.R. (mseen of top & bottom) %
6320.00
4723.00
1597.00
1.60
6670.00
4723.00
1947.00
1.96
6543.00
4723.00
1820.00
1.83
6568.00
4723.00
1845.00
1.85
6600.00
4723.00
1877.00
1.88
+
1.44 1.63 1.71 1.62
MOISTURE CONTENT DETERMINATIONS for B.S. Mould, X = 1000cm3
11.07 11.87 14.63 16.49 17.27
1.58
DETERMINATION OF THE MOISTURE/DENSITY RELATION OF SOILUSING STANDARD/HEAVY COMPACTION
Job… OKOMU Sample No:....ROAD POINT 1... Operator…………
3g/cm1.74MDD:…2018/05/25…:Date……m1.5… Dept....…Site
Amount retained on 20mm B.S. Sieve……… Total weight of Sample…… OPT.MC:13.4%
B.S. / C.B.R. Mould……4723g……………...............................
1.40
1.50
1.60
1.70
1.80
1.90
10 11 12 13 14 15 16 17 18
DR
Y D
EN
SIT
Y g
/cm
3
AVERAGE MOISTURE CONTENT
COMPACTION
152

Wt. of mould & wet Soil (W2) g
Wt. of mould (W1) g
Wt. of wet soil (W2-W1) g
Bulk Density (Pb) (W2-W1)/x g/cm3
Container No. III RO JK BE Z3 Z4 ZA NZ IN RO
Wt. of wet soil & container (g) 52.00 52.68 52.71 52.02 51.80 55.50 51.30 54.63 55.68 53.17
Wt. of Dry soil & container (g) 46.20 47.00 46.50 46.10 45.50 48.20 44.60 47.00 47.10 44.80
Wt. of Container (g) 16.90 18.00 17.20 17.61 17.71 17.49 18.02 16.71 15.16 13.95
Wt. of dry soil (Wd) g 29.30 29.00 29.30 28.49 27.79 30.71 26.58 30.29 31.94 30.85
Wt. of Moisture (Wm) g 5.80 5.68 6.21 5.92 6.30 7.30 6.70 7.63 8.58 8.37
Moistur Content 100(Wm/Wd) % 19.80 19.59 21.19 20.78 22.67 23.77 25.21 25.19 26.86 27.13
Average Moisture Content (m) %
Dry Density = Pb/1+ (m/100) (g/cm3)
C.B.R. (mseen of top & bottom) %
4890.00
3250.00
1640.00
1.65
5074.00
3250.00
1824.00
1.83
5044.00
3250.00
1794.00
1.80
4994.00
3250.00
1744.00
1.75
5029.00
3250.00
1779.00
1.79
1.38 1.49 1.49 1.43
MOISTURE CONTENT DETERMINATIONS for B.S. Mould, X = 1000cm3
19.69 20.99 23.22 25.20 27.00
1.38
DETERMINATION OF THE MOISTURE/DENSITY RELATION OF SOILUSING STANDARD/HEAVY COMPACTION
Job… OKOMU Sample No:....ROAD POINT 2... Operator…………
3g/cm1.51MDD:…2018/05/25…:Date……m1.50…Dept....…Site
Amount retained on 20mm B.S. Sieve……… Total weight of Sample…… OPT.MC:21.9%
B.S. / C.B.R. Mould……3252g……………...............................
1.20
1.30
1.40
1.50
1.60
1.70
19 20 21 22 23 24 25 26 27 28
DR
Y D
EN
SIT
Y g
/cm
3
AVERAGE MOISTURE CONTENT
COMPACTION
153

Wt. of mould & wet Soil (W2) g
Wt. of mould (W1) g
Wt. of wet soil (W2-W1) g
Bulk Density (Pb) (W2-W1)/x g/cm3
Container No. CP OB B4 OH MN EI NI Z8 PB AZ
Wt. of wet soil & container (g) 57.21 59.53 55.32 49.96 54.60 53.05 49.94 55.55 52.12 50.55
Wt. of Dry soil & container (g) 49.91 51.55 47.81 43.37 46.70 45.86 42.23 47.78 44.28 42.99
Wt. of Container (g) 17.41 16.31 16.91 16.79 16.03 17.71 14.07 19.67 16.75 16.75
Wt. of dry soil (Wd) g 32.50 35.24 30.90 26.58 30.67 28.15 28.16 28.11 27.53 26.24
Wt. of Moisture (Wm) g 7.30 7.98 7.51 6.59 7.90 7.19 7.71 7.77 7.84 7.56
Moistur Content 100(Wm/Wd) % 22.46 22.64 24.30 24.79 25.76 25.54 27.38 27.64 28.48 28.81
Average Moisture Content (m) %
Dry Density = Pb/1+ (m/100) (g/cm3)
C.B.R. (mseen of top & bottom) %1.351.41 1.45 1.46 1.38
MOISTURE CONTENT DETERMINATIONS for B.S. Mould, X = 1000cm3
22.55 24.55 25.65 27.51 28.64
1804.00
1.81
4974.00
3250.00
1724.00
1.73
4999.00
3250.00
1749.00
1.76
4965.00
3250.00
1715.00
1.72
5081.00
3250.00
1831.00
1.84
5054.00
3250.00
DETERMINATION OF THE MOISTURE/DENSITY RELATION OF SOILUSING STANDARD/HEAVY COMPACTION
Job… OKOMU Sample No:....ROAD POINT 3... Operator…………
3g/cm1.47MDD:…2018/05/25…:Date……m1.50…Dept....…Site
Amount retained on 20mm B.S. Sieve……… Total weight of Sample…… OPT.MC:25.3%
B.S. / C.B.R. Mould……3252g……………...............................
1.20
1.30
1.40
1.50
1.60
1.70
22 23 24 25 26 27 28 29 30
DR
Y D
EN
SIT
Y g
/cm
3
AVERAGE MOISTURE CONTENT
COMPACTION
154

Wt. of mould & wet Soil (W2) g
Wt. of mould (W1) g
Wt. of wet soil (W2-W1) g
Bulk Density (Pb) (W2-W1)/x g/cm3
Container No. BA 64M OX UN 7S PT T PO SO ST
Wt. of wet soil & container (g) 44.51 41.62 54.62 54.85 53.97 54.13 52.55 53.01 53.91 54.84
Wt. of Dry soil & container (g) 40.35 37.54 48.10 48.32 46.82 46.68 45.60 45.50 46.34 46.40
Wt. of Container (g) 18.13 15.50 17.21 17.21 15.51 15.21 17.95 16.35 18.40 15.36
Wt. of dry soil (Wd) g 22.22 22.04 30.89 31.11 31.31 31.47 27.65 29.15 27.94 31.04
Wt. of Moisture (Wm) g 4.16 4.08 6.52 6.53 7.15 7.45 6.95 7.51 7.57 8.44
Moistur Content 100(Wm/Wd) % 18.72 18.51 21.11 20.99 22.84 23.67 25.14 25.76 27.09 27.19
Average Moisture Content (m) %
Dry Density = Pb/1+ (m/100) (g/cm3)
C.B.R. (mseen of top & bottom) %
4810.00
3250.00
1560.00
1.57
5092.00
3250.00
1842.00
1.85
5032.00
3250.00
1782.00
1.79
5004.00
3250.00
1754.00
1.76
5035.00
3250.00
1785.00
1.79
1.32 1.48 1.50 1.43
MOISTURE CONTENT DETERMINATIONS for B.S. Mould, X = 1000cm3
18.62 21.05 23.25 25.45 27.14
1.39
DETERMINATION OF THE MOISTURE/DENSITY RELATION OF SOILUSING STANDARD/HEAVY COMPACTION
Job… OKOMU Sample No:....BOILER, BH1... Operator…………
3g/cm1.51MDD:…2018/05/25…:Date……m1.0…Dept....…Site
Amount retained on 20mm B.S. Sieve……… Total weight of Sample…… OPT.MC:22.5%
B.S. / C.B.R. Mould……3252g……………...............................
1.20
1.30
1.40
1.50
1.60
1.70
18 19 20 21 22 23 24 25 26 27 28
DR
Y D
EN
SIT
Y g
/cm
3
AVERAGE MOISTURE CONTENT
COMPACTION
155

Wt. of mould & wet Soil (W2) g
Wt. of mould (W1) g
Wt. of wet soil (W2-W1) g
Bulk Density (Pb) (W2-W1)/x g/cm3
Container No. OY LB LK RO UC LO IP NI XX GZ
Wt. of wet soil & container (g) 51.55 53.95 56.54 51.49 48.28 50.50 56.22 51.52 51.39 57.20
Wt. of Dry soil & container (g) 45.32 47.23 49.52 45.54 41.62 43.73 47.64 44.72 44.23 48.91
Wt. of Container (g) 15.43 15.75 19.62 19.75 14.60 15.62 16.49 18.12 18.09 19.90
Wt. of dry soil (Wd) g 29.89 31.48 29.90 25.79 27.02 28.11 31.15 26.60 26.14 29.01
Wt. of Moisture (Wm) g 6.23 6.72 7.02 5.95 6.66 6.77 8.58 6.80 7.16 8.29
Moistur Content 100(Wm/Wd) % 20.84 21.35 23.48 23.07 24.65 24.08 27.54 25.56 27.39 28.58
Average Moisture Content (m) %
Dry Density = Pb/1+ (m/100) (g/cm3)
C.B.R. (mseen of top & bottom) %1.341.39 1.47 1.48 1.39
MOISTURE CONTENT DETERMINATIONS for B.S. Mould, X = 1000cm3
21.09 23.27 24.37 26.55 27.98
1807.00
1.81
4952.00
3250.00
1702.00
1.71
4996.00
3250.00
1746.00
1.75
4928.00
3250.00
1678.00
1.69
5080.00
3250.00
1830.00
1.84
5057.00
3250.00
DETERMINATION OF THE MOISTURE/DENSITY RELATION OF SOILUSING STANDARD/HEAVY COMPACTION
Job… OKOMU Sample No:....BOILER, BH1... Operator…………
3g/cm1.48MDD:…2018/05/25…:Date……m3.0…Dept....…Site
Amount retained on 20mm B.S. Sieve……… Total weight of Sample…… OPT.MC:24.0%
B.S. / C.B.R. Mould……3252g……………...............................
1.20
1.30
1.40
1.50
1.60
1.70
20 21 22 23 24 25 26 27 28 29
DR
Y D
EN
SIT
Y g
/cm
3
AVERAGE MOISTURE CONTENT
COMPACTION
156

Wt. of mould & wet Soil (W2) g
Wt. of mould (W1) g
Wt. of wet soil (W2-W1) g
Bulk Density (Pb) (W2-W1)/x g/cm3
Container No. PA JO JN LA IE VO OG MP OY F7
Wt. of wet soil & container (g) 57.92 53.56 50.44 50.65 52.22 52.72 54.26 55.35 52.88 57.09
Wt. of Dry soil & container (g) 51.28 47.10 44.46 44.17 45.68 45.74 46.78 47.55 44.99 48.73
Wt. of Container (g) 17.81 14.78 17.84 15.10 18.47 17.47 18.23 17.61 16.41 17.97
Wt. of dry soil (Wd) g 33.47 32.32 26.62 29.07 27.21 28.27 28.55 29.94 28.58 30.76
Wt. of Moisture (Wm) g 6.64 6.46 5.98 6.48 6.54 6.98 7.48 7.80 7.89 8.36
Moistur Content 100(Wm/Wd) % 19.84 19.99 22.46 22.29 24.04 24.69 26.20 26.05 27.61 27.18
Average Moisture Content (m) %
Dry Density = Pb/1+ (m/100) (g/cm3)
C.B.R. (mseen of top & bottom) %
4862.00
3250.00
1612.00
1.62
5093.00
3250.00
1843.00
1.85
5050.00
3250.00
1800.00
1.81
5002.00
3250.00
1752.00
1.76
5022.00
3250.00
1772.00
1.78
1.35 1.48 1.49 1.41
MOISTURE CONTENT DETERMINATIONS for B.S. Mould, X = 1000cm3
19.91 22.38 24.36 26.13 27.39
1.38
DETERMINATION OF THE MOISTURE/DENSITY RELATION OF SOILUSING STANDARD/HEAVY COMPACTION
Job… OKOMU Sample No:....BOILER, BH1... Operator…………
3g/cm1.50MDD:…2018/05/25…:Date……m6.0…Dept....…Site
Amount retained on 20mm B.S. Sieve……… Total weight of Sample…… OPT.MC:23.4%
B.S. / C.B.R. Mould……3252g……………...............................
1.20
1.30
1.40
1.50
1.60
1.70
19 20 21 22 23 24 25 26 27 28
DR
Y D
EN
SIT
Y g
/cm
3
AVERAGE MOISTURE CONTENT
COMPACTION
157

Wt. of mould & wet Soil (W2) g
Wt. of mould (W1) g
Wt. of wet soil (W2-W1) g
Bulk Density (Pb) (W2-W1)/x g/cm3
Container No. AG MI EV ZU QO FO CO AF IP AD
Wt. of wet soil & container (g) 42.63 53.77 48.75 39.47 46.23 35.80 43.93 40.04 43.88 44.31
Wt. of Dry soil & container (g) 38.10 47.31 42.52 34.94 40.83 31.62 38.54 35.05 38.41 38.60
Wt. of Container (g) 18.05 18.08 16.84 15.85 18.67 15.32 17.75 16.26 18.50 17.38
Wt. of dry soil (Wd) g 20.05 29.23 25.68 19.09 22.16 16.30 20.79 18.79 19.91 21.22
Wt. of Moisture (Wm) g 4.53 6.46 6.23 4.53 5.40 4.18 5.39 4.99 5.47 5.71
Moistur Content 100(Wm/Wd) % 22.59 22.10 24.26 23.73 24.37 25.64 25.93 26.56 27.47 26.91
Average Moisture Content (m) %
Dry Density = Pb/1+ (m/100) (g/cm3)
C.B.R. (mseen of top & bottom) %
6361.00
4726.00
1635.00
1.64
6515.00
4726.00
1789.00
1.80
6485.00
4726.00
1759.00
1.77
6430.00
4726.00
1704.00
1.71
6465.00
4726.00
1739.00
1.75
1.34 1.42 1.44 1.38
MOISTURE CONTENT DETERMINATIONS for B.S. Mould, X = 1000cm3
22.35 23.99 25.01 26.24 27.19
1.35
DETERMINATION OF THE MOISTURE/DENSITY RELATION OF SOILUSING STANDARD/HEAVY COMPACTION
Job… OKOMU Sample No:....BOILER, BH1... Operator…………
3g/cm1.44MDD:…2018/05/25…:Date……m12.0…Dept....…Site
Amount retained on 20mm B.S. Sieve……… Total weight of Sample…… OPT.MC:24.7%
B.S. / C.B.R. Mould……4726g……………...............................
1.20
1.30
1.40
1.50
1.60
22 23 24 25 26 27 28
DR
Y D
EN
SIT
Y g
/cm
3
AVERAGE MOISTURE CONTENT
COMPACTION
158

Wt. of mould & wet Soil (W2) g
Wt. of mould (W1) g
Wt. of wet soil (W2-W1) g
Bulk Density (Pb) (W2-W1)/x g/cm3
Container No. OB AZ OH UM CP ST OB BO EB E6
Wt. of wet soil & container (g) 39.65 45.90 47.12 51.65 53.97 45.35 54.18 56.74 49.97 47.62
Wt. of Dry soil & container (g) 36.21 41.59 42.14 45.48 47.17 39.80 46.74 49.03 43.02 41.16
Wt. of Container (g) 16.40 16.72 16.83 14.68 17.35 15.32 16.87 18.25 17.34 17.71
Wt. of dry soil (Wd) g 19.81 24.87 25.31 30.80 29.82 24.48 29.87 30.78 25.68 23.45
Wt. of Moisture (Wm) g 3.44 4.31 4.98 6.17 6.80 5.55 7.44 7.71 6.95 6.46
Moistur Content 100(Wm/Wd) % 17.36 17.33 19.68 20.03 22.80 22.67 24.91 25.05 27.06 27.55
Average Moisture Content (m) %
Dry Density = Pb/1+ (m/100) (g/cm3)
C.B.R. (mseen of top & bottom) %1.261.34 1.47 1.46 1.41
MOISTURE CONTENT DETERMINATIONS for B.S. Mould, X = 1000cm3
17.35 19.85 22.74 24.98 27.31
1759.00
1.77
6320.00
4718.00
1602.00
1.61
6470.00
4718.00
1752.00
1.76
6288.00
4718.00
1570.00
1.58
6500.00
4718.00
1782.00
1.79
6477.00
4718.00
DETERMINATION OF THE MOISTURE/DENSITY RELATION OF SOILUSING STANDARD/HEAVY COMPACTION
Job… OKOMU Sample No:....BOILER, BH1... Operator……
3g/cm1.48MDD:…2018/05/25…:Date……m9.0Dept........…Site
Amount retained on 20mm B.S. Sieve……… Total weight of Sample…… OPT.MC:20.6%
B.S. / C.B.R. Mould……4718g……………...............................
1.20
1.30
1.40
1.50
1.60
1.70
17 18 19 20 21 22 23 24 25 26 27 28
DR
Y D
EN
SIT
Y g
/cm
3
AVERAGE MOISTURE CONTENT
COMPACTION
159
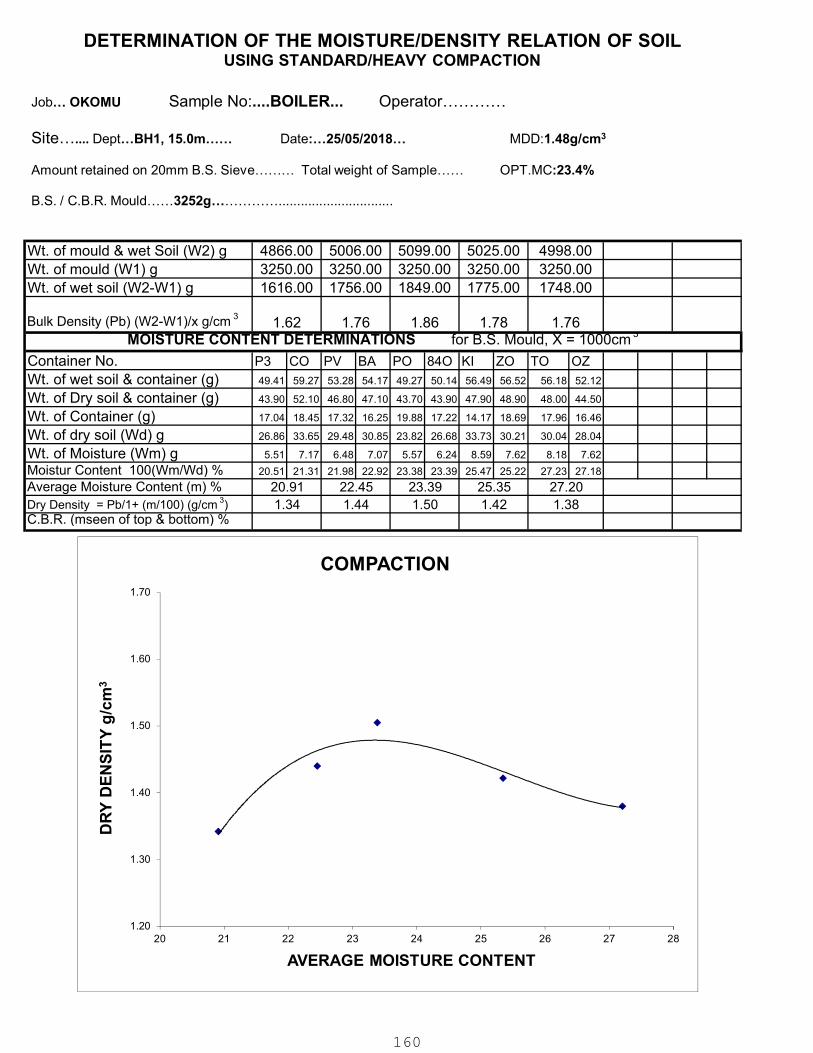
Wt. of mould & wet Soil (W2) g
Wt. of mould (W1) g
Wt. of wet soil (W2-W1) g
Bulk Density (Pb) (W2-W1)/x g/cm3
Container No. P3 CO PV BA PO 84O KI ZO TO OZ
Wt. of wet soil & container (g) 49.41 59.27 53.28 54.17 49.27 50.14 56.49 56.52 56.18 52.12
Wt. of Dry soil & container (g) 43.90 52.10 46.80 47.10 43.70 43.90 47.90 48.90 48.00 44.50
Wt. of Container (g) 17.04 18.45 17.32 16.25 19.88 17.22 14.17 18.69 17.96 16.46
Wt. of dry soil (Wd) g 26.86 33.65 29.48 30.85 23.82 26.68 33.73 30.21 30.04 28.04
Wt. of Moisture (Wm) g 5.51 7.17 6.48 7.07 5.57 6.24 8.59 7.62 8.18 7.62
Moistur Content 100(Wm/Wd) % 20.51 21.31 21.98 22.92 23.38 23.39 25.47 25.22 27.23 27.18
Average Moisture Content (m) %
Dry Density = Pb/1+ (m/100) (g/cm3)
C.B.R. (mseen of top & bottom) %
4866.00
3250.00
1616.00
1.62
5099.00
3250.00
1849.00
1.86
5006.00
3250.00
1756.00
1.76
4998.00
3250.00
1748.00
1.76
5025.00
3250.00
1775.00
1.78
1.34 1.44 1.50 1.42
MOISTURE CONTENT DETERMINATIONS for B.S. Mould, X = 1000cm3
20.91 22.45 23.39 25.35 27.20
1.38
DETERMINATION OF THE MOISTURE/DENSITY RELATION OF SOILUSING STANDARD/HEAVY COMPACTION
Job… OKOMU Sample No:....BOILER... Operator…………
3g/cm1.48MDD:…2018/05/25…:Date……m15.0, 1BH…Dept....…Site
Amount retained on 20mm B.S. Sieve……… Total weight of Sample…… OPT.MC:23.4%
B.S. / C.B.R. Mould……3252g……………...............................
1.20
1.30
1.40
1.50
1.60
1.70
20 21 22 23 24 25 26 27 28
DR
Y D
EN
SIT
Y g
/cm
3
AVERAGE MOISTURE CONTENT
COMPACTION
160

Wt. of mould & wet Soil (W2) g
Wt. of mould (W1) g
Wt. of wet soil (W2-W1) g
Bulk Density (Pb) (W2-W1)/x g/cm3
Container No. III P3 8I BE Z3 PO PV IN TO KI
Wt. of wet soil & container (g) 51.76 50.99 53.40 57.93 54.60 50.79 55.34 56.42 57.60 51.02
Wt. of Dry soil & container (g) 46.20 45.45 47.29 50.83 47.64 44.92 47.75 48.33 49.29 43.29
Wt. of Container (g) 16.97 17.14 17.19 17.62 17.72 19.83 17.30 15.13 17.97 14.19
Wt. of dry soil (Wd) g 29.23 28.31 30.10 33.21 29.92 25.09 30.45 33.20 31.32 29.10
Wt. of Moisture (Wm) g 5.56 5.54 6.11 7.10 6.96 5.87 7.59 8.09 8.31 7.73
Moistur Content 100(Wm/Wd) % 19.02 19.57 20.30 21.38 23.26 23.40 24.93 24.37 26.53 26.56
Average Moisture Content (m) %
Dry Density = Pb/1+ (m/100) (g/cm3)
C.B.R. (mseen of top & bottom) %1.371.40 1.48 1.49 1.43
MOISTURE CONTENT DETERMINATIONS for B.S. Mould, X = 1000cm3
19.30 20.84 23.33 24.65 26.55
1776.00
1.78
4982.00
3250.00
1732.00
1.74
5024.00
3250.00
1774.00
1.78
4915.00
3250.00
1665.00
1.67
5078.00
3250.00
1828.00
1.84
5026.00
3250.00
DETERMINATION OF THE MOISTURE/DENSITY RELATION OF SOILUSING STANDARD/HEAVY COMPACTION
Job… OKOMU Sample No:....CLARIFICATION STATION, BH3... Operator…………
3g/cm1.51MDD:…2018/05/25…:Date……m2.50…Dept....…Site
Amount retained on 20mm B.S. Sieve……… Total weight of Sample…… OPT.MC:22.3%
B.S. / C.B.R. Mould……3252g……………...............................
1.20
1.30
1.40
1.50
1.60
1.70
19 20 21 22 23 24 25 26 27
DR
Y D
EN
SIT
Y g
/cm
3
AVERAGE MOISTURE CONTENT
COMPACTION
161

Wt. of mould & wet Soil (W2) g
Wt. of mould (W1) g
Wt. of wet soil (W2-W1) g
Bulk Density (Pb) (W2-W1)/x g/cm3
Container No. CO QA ZA JK RO ZO ZA NZ RO BA
Wt. of wet soil & container (g) 50.87 54.76 53.94 53.33 52.83 56.43 54.81 52.20 56.80 53.07
Wt. of Dry soil & container (g) 45.60 48.21 47.59 46.91 45.63 49.38 47.34 44.91 48.50 44.98
Wt. of Container (g) 18.50 15.16 17.47 17.29 14.12 18.77 18.02 16.72 18.04 16.39
Wt. of dry soil (Wd) g 27.10 33.05 30.12 29.62 31.51 30.61 29.32 28.19 30.46 28.59
Wt. of Moisture (Wm) g 5.27 6.55 6.35 6.42 7.20 7.05 7.47 7.29 8.30 8.09
Moistur Content 100(Wm/Wd) % 19.45 19.82 21.08 21.67 22.85 23.03 25.48 25.86 27.25 28.30
Average Moisture Content (m) %
Dry Density = Pb/1+ (m/100) (g/cm3)
C.B.R. (mseen of top & bottom) %1.361.33 1.50 1.51 1.43
MOISTURE CONTENT DETERMINATIONS for B.S. Mould, X = 1000cm3
19.63 21.38 22.94 25.67 27.77
1812.00
1.82
4978.00
3250.00
1728.00
1.74
5034.00
3250.00
1784.00
1.79
4830.00
3250.00
1580.00
1.59
5100.00
3250.00
1850.00
1.86
5062.00
3250.00
DETERMINATION OF THE MOISTURE/DENSITY RELATION OF SOILUSING STANDARD/HEAVY COMPACTION
Job… OKOMU Sample No:....CLARIFICATION STATION, BH3... Operator…………
3g/cm1.52MDD:…2018/05/25…:Date……m5.50…Dept....…Site
Amount retained on 20mm B.S. Sieve……… Total weight of Sample…… OPT.MC:22.3%
B.S. / C.B.R. Mould……3252g……………...............................
1.20
1.30
1.40
1.50
1.60
1.70
19 20 21 22 23 24 25 26 27 28
DR
Y D
EN
SIT
Y g
/cm
3
AVERAGE MOISTURE CONTENT
COMPACTION
162

Wt. of mould & wet Soil (W2) g
Wt. of mould (W1) g
Wt. of wet soil (W2-W1) g
Bulk Density (Pb) (W2-W1)/x g/cm3
Container No. GL UN AI ID 8TH AA E5 PX DO Z3
Wt. of wet soil & container (g) 50.25 49.74 44.27 61.67 53.54 55.93 54.87 53.79 42.45 45.81
Wt. of Dry soil & container (g) 44.52 44.73 37.98 54.20 46.91 48.32 48.21 46.91 37.78 40.10
Wt. of Container (g) 14.69 20.35 7.57 18.50 18.01 15.37 18.57 18.21 18.37 16.40
Wt. of dry soil (Wd) g 29.83 24.38 30.41 35.70 28.90 32.95 29.64 28.70 19.41 23.70
Wt. of Moisture (Wm) g 5.73 5.01 6.29 7.47 6.63 7.61 6.66 6.88 4.67 5.71
Moistur Content 100(Wm/Wd) % 19.21 20.55 20.68 20.92 22.94 23.10 22.47 23.97 24.06 24.09
Average Moisture Content (m) %
Dry Density = Pb/1+ (m/100) (g/cm3)
C.B.R. (mseen of top & bottom) %
6370.00
4726.00
1644.00
1.65
6502.00
4726.00
1776.00
1.78
6468.00
4726.00
1742.00
1.75
6460.00
4726.00
1734.00
1.74
6490.00
4726.00
1764.00
1.77
1.38 1.45 1.45 1.44
MOISTURE CONTENT DETERMINATIONS for B.S. Mould, X = 1000cm3
19.88 20.80 23.02 23.22 24.08
1.40
DETERMINATION OF THE MOISTURE/DENSITY RELATION OF SOILUSING STANDARD/HEAVY COMPACTION
Job… OKOMU Sample No:....CLARIFICATION STATION, BH3... Operator…………
3g/cm1.49MDD:…2018/05/25…:Date……m11.5…Dept....…Site
Amount retained on 20mm B.S. Sieve……… Total weight of Sample…… OPT.MC:21.9%
B.S. / C.B.R. Mould……4726g……………...............................
1.30
1.40
1.50
1.60
19 20 21 22 23 24 25
DR
Y D
EN
SIT
Y g
/cm
3
AVERAGE MOISTURE CONTENT
COMPACTION
163

Wt. of mould & wet Soil (W2) g
Wt. of mould (W1) g
Wt. of wet soil (W2-W1) g
Bulk Density (Pb) (W2-W1)/x g/cm3
Container No. ED BO OA IO EI EV TK WO EB UN
Wt. of wet soil & container (g) 54.92 56.02 56.57 61.20 57.79 46.66 45.50 56.70 53.14 55.80
Wt. of Dry soil & container (g) 48.57 49.87 49.80 53.50 50.14 40.61 39.28 48.62 45.51 46.90
Wt. of Container (g) 17.03 18.32 17.75 17.72 17.86 14.92 14.92 17.05 17.37 14.74
Wt. of dry soil (Wd) g 31.54 31.55 32.05 35.78 32.28 25.69 24.36 31.57 28.14 32.16
Wt. of Moisture (Wm) g 6.35 6.15 6.77 7.70 7.65 6.05 6.22 8.08 7.63 8.90
Moistur Content 100(Wm/Wd) % 20.13 19.49 21.12 21.52 23.70 23.55 25.53 25.59 27.11 27.67
Average Moisture Content (m) %
Dry Density = Pb/1+ (m/100) (g/cm3)
C.B.R. (mseen of top & bottom) %1.381.34 1.48 1.50 1.42
MOISTURE CONTENT DETERMINATIONS for B.S. Mould, X = 1000cm3
19.81 21.32 23.62 25.56 27.39
1788.00
1.80
4999.00
3252.00
1747.00
1.75
5028.00
3252.00
1776.00
1.78
4856.00
3252.00
1604.00
1.61
5096.00
3252.00
1844.00
1.85
5040.00
3252.00
DETERMINATION OF THE MOISTURE/DENSITY RELATION OF SOILUSING STANDARD/HEAVY COMPACTION
Job… OKOMU Sample No:....CLARIFICATION, BH3... Operator…………
3g/cm1.51MDD:…2018/05/25…:Date……m14.5…Dept....…Site
Amount retained on 20mm B.S. Sieve……… Total weight of Sample…… OPT.MC:22.6%
B.S. / C.B.R. Mould……3252g……………...............................
1.30
1.40
1.50
1.60
1.70
19 20 21 22 23 24 25 26 27 28
DR
Y D
EN
SIT
Y g
/cm
3
AVERAGE MOISTURE CONTENT
COMPACTION
164

165

Wt. of mould & wet Soil (W2) g
Wt. of mould (W1) g
Wt. of wet soil (W2-W1) g
Bulk Density (Pb) (W2-W1)/x g/cm3
Container No. PO JO Z5 ZA UN SO PT UI BO MO
Wt. of wet soil & container (g) 51.25 50.29 53.14 51.87 51.68 58.85 48.36 47.33 56.17 54.59
Wt. of Dry soil & container (g) 45.51 44.91 47.26 45.94 45.05 51.18 41.64 40.60 47.99 46.47
Wt. of Container (g) 16.26 17.13 19.38 17.73 17.16 18.26 14.86 14.36 17.02 15.27
Wt. of dry soil (Wd) g 29.25 27.78 27.88 28.21 27.89 32.92 26.78 26.24 30.97 31.20
Wt. of Moisture (Wm) g 5.74 5.38 5.88 5.93 6.63 7.67 6.72 6.73 8.18 8.12
Moistur Content 100(Wm/Wd) % 19.62 19.37 21.09 21.02 23.77 23.30 25.09 25.65 26.41 26.03
Average Moisture Content (m) %
Dry Density = Pb/1+ (m/100) (g/cm3)
C.B.R. (mseen of top & bottom) %1.381.48 1.55 1.54 1.40
MOISTURE CONTENT DETERMINATIONS for B.S. Mould, X = 1000cm3
19.50 21.06 23.54 25.37 26.22
1863.00
1.87
4986.00
3252.00
1734.00
1.74
5006.00
3252.00
1754.00
1.76
5012.00
3252.00
1760.00
1.77
5151.00
3252.00
1899.00
1.91
5115.00
3252.00
DETERMINATION OF THE MOISTURE/DENSITY RELATION OF SOILUSING STANDARD/HEAVY COMPACTION
Job… OKOMU Sample No:....CLARIFICATION STATION, BH3... Operator……
3g/cm1.58MDD:…2018/05/25…:Date……m8.5Dept........…Site
Amount retained on 20mm B.S. Sieve……… Total weight of Sample…… OPT.MC:22.3%
B.S. / C.B.R. Mould……3252g……………...............................
1.30
1.40
1.50
1.60
1.70
19 20 21 22 23 24 25 26 27
DR
Y D
EN
SIT
Y g
/cm
3
AVERAGE MOISTURE CONTENT
COMPACTION
166

Wt. of mould & wet Soil (W2) g
Wt. of mould (W1) g
Wt. of wet soil (W2-W1) g
Bulk Density (Pb) (W2-W1)/x g/cm3
Container No. OF 3A UI ZS SG JO ZE MT ZA JI
Wt. of wet soil & container (g) 51.73 56.76 52.25 64.61 61.35 52.97 53.70 54.25 54.87 53.66
Wt. of Dry soil & container (g) 45.77 49.90 45.24 56.04 53.04 45.52 45.73 46.01 47.15 45.45
Wt. of Container (g) 17.55 17.12 14.41 19.36 19.45 17.15 16.21 15.24 19.40 16.07
Wt. of dry soil (Wd) g 28.22 32.78 30.83 36.68 33.59 28.37 29.52 30.77 27.75 29.38
Wt. of Moisture (Wm) g 5.96 6.86 7.01 8.57 8.31 7.45 7.97 8.24 7.72 8.21
Moistur Content 100(Wm/Wd) % 21.12 20.93 22.74 23.36 24.74 26.26 27.00 26.78 27.82 27.94
Average Moisture Content (m) %
Dry Density = Pb/1+ (m/100) (g/cm3)
C.B.R. (mseen of top & bottom) %1.361.39 1.49 1.50 1.39
MOISTURE CONTENT DETERMINATIONS for B.S. Mould, X = 1000cm3
21.02 23.05 25.50 26.89 27.88
1825.00
1.83
4981.00
3250.00
1731.00
1.74
5011.00
3250.00
1761.00
1.77
4922.00
3250.00
1672.00
1.68
5120.00
3250.00
1870.00
1.88
5075.00
3250.00
DETERMINATION OF THE MOISTURE/DENSITY RELATION OF SOILUSING STANDARD/HEAVY COMPACTION
Job… OKOMU Sample No:....POWER HOUSE, BH2... Operator…………
3g/cm1.53MDD:…2018/05/25…:Date……m11.0…Dept....…Site
Amount retained on 20mm B.S. Sieve……… Total weight of Sample…… OPT.MC:24.3%
B.S. / C.B.R. Mould……3252g……………...............................
1.20
1.30
1.40
1.50
1.60
1.70
20 21 22 23 24 25 26 27 28 29
DR
Y D
EN
SIT
Y g
/cm
3
AVERAGE MOISTURE CONTENT
COMPACTION
167

Wt. of mould & wet Soil (W2) g
Wt. of mould (W1) g
Wt. of wet soil (W2-W1) g
Bulk Density (Pb) (W2-W1)/x g/cm3
Container No. UK PK O4 IK KC XE B4 EM LE OR
Wt. of wet soil & container (g) 48.10 52.80 57.70 59.10 52.60 50.40 57.70 53.30 58.10 49.80
Wt. of Dry soil & container (g) 43.20 47.58 51.40 52.00 46.40 44.30 51.10 46.70 50.80 43.00
Wt. of Container (g) 14.60 17.40 18.50 14.90 16.50 14.90 19.80 17.60 19.30 14.30
Wt. of dry soil (Wd) g 28.60 30.18 32.90 37.10 29.90 29.40 31.30 29.10 31.50 28.70
Wt. of Moisture (Wm) g 4.90 5.22 6.30 7.10 6.20 6.10 6.60 6.60 7.30 6.80
Moistur Content 100(Wm/Wd) % 17.13 17.30 19.15 19.14 20.74 20.75 21.09 22.68 23.17 23.69
Average Moisture Content (m) %
Dry Density = Pb/1+ (m/100) (g/cm3)
C.B.R. (mseen of top & bottom) %1.441.37 1.45 1.48 1.46
MOISTURE CONTENT DETERMINATIONS for B.S. Mould, X = 1000cm3
17.21 19.14 20.74 21.88 23.43
1717.00
1.72
6487.00
4723.00
1764.00
1.77
6490.00
4723.00
1767.00
1.77
6325.00
4723.00
1602.00
1.61
6497.00
4723.00
1774.00
1.78
6440.00
4723.00
DETERMINATION OF THE MOISTURE/DENSITY RELATION OF SOILUSING STANDARD/HEAVY COMPACTION
Job… OKOMU Sample No:....POWER HOUSE... Operator…………
3g/cm1.47MDD:…2018/05/25…:Date……m2.0,2BH… Dept....…Site
Amount retained on 20mm B.S. Sieve……… Total weight of Sample…… OPT.MC:20.6%
B.S. / C.B.R. Mould……4723g……………...............................
1.30
1.40
1.50
1.60
17 18 19 20 21 22 23 24
DR
Y D
EN
SIT
Y g
/cm
3
AVERAGE MOISTURE CONTENT
COMPACTION
168
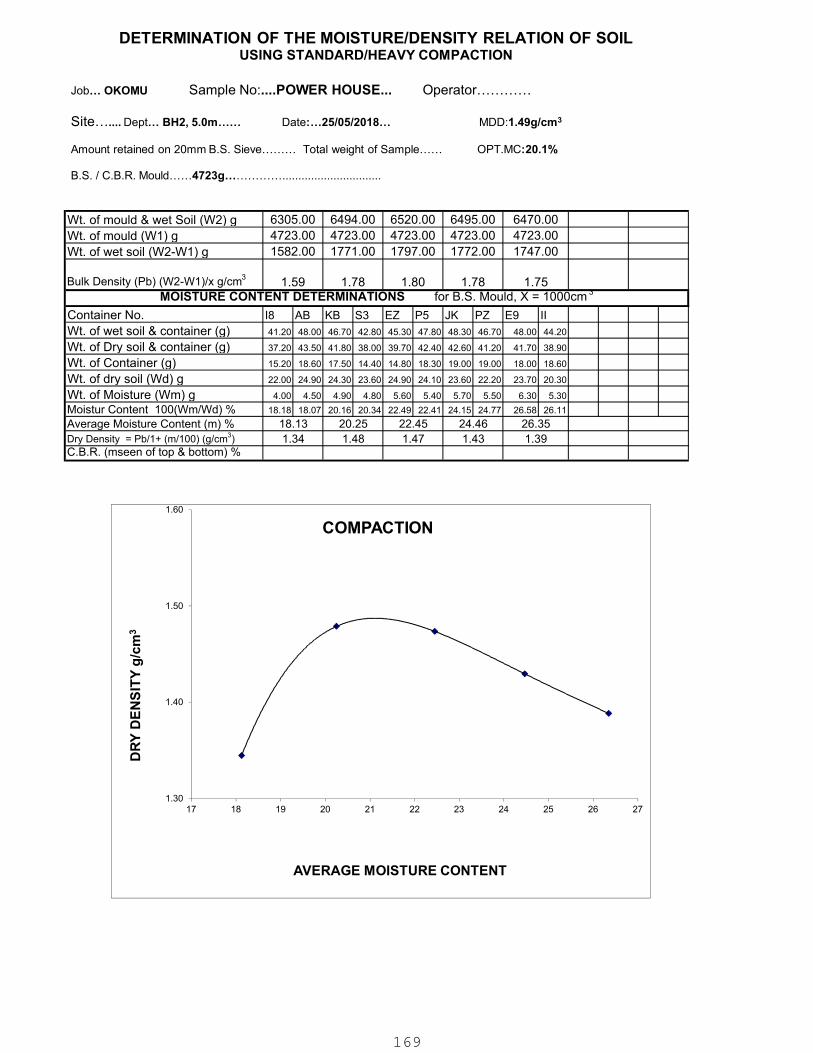
Wt. of mould & wet Soil (W2) g
Wt. of mould (W1) g
Wt. of wet soil (W2-W1) g
Bulk Density (Pb) (W2-W1)/x g/cm3
Container No. I8 AB KB S3 EZ P5 JK PZ E9 II
Wt. of wet soil & container (g) 41.20 48.00 46.70 42.80 45.30 47.80 48.30 46.70 48.00 44.20
Wt. of Dry soil & container (g) 37.20 43.50 41.80 38.00 39.70 42.40 42.60 41.20 41.70 38.90
Wt. of Container (g) 15.20 18.60 17.50 14.40 14.80 18.30 19.00 19.00 18.00 18.60
Wt. of dry soil (Wd) g 22.00 24.90 24.30 23.60 24.90 24.10 23.60 22.20 23.70 20.30
Wt. of Moisture (Wm) g 4.00 4.50 4.90 4.80 5.60 5.40 5.70 5.50 6.30 5.30
Moistur Content 100(Wm/Wd) % 18.18 18.07 20.16 20.34 22.49 22.41 24.15 24.77 26.58 26.11
Average Moisture Content (m) %
Dry Density = Pb/1+ (m/100) (g/cm3)
C.B.R. (mseen of top & bottom) %1.391.34 1.48 1.47 1.43
MOISTURE CONTENT DETERMINATIONS for B.S. Mould, X = 1000cm3
18.13 20.25 22.45 24.46 26.35
1771.00
1.78
6470.00
4723.00
1747.00
1.75
6495.00
4723.00
1772.00
1.78
6305.00
4723.00
1582.00
1.59
6520.00
4723.00
1797.00
1.80
6494.00
4723.00
DETERMINATION OF THE MOISTURE/DENSITY RELATION OF SOILUSING STANDARD/HEAVY COMPACTION
Job… OKOMU Sample No:....POWER HOUSE... Operator…………
3g/cm1.49MDD:…2018/05/25…:Date……m5.0,2BH… Dept....…Site
Amount retained on 20mm B.S. Sieve……… Total weight of Sample…… OPT.MC:20.1%
B.S. / C.B.R. Mould……4723g……………...............................
1.30
1.40
1.50
1.60
17 18 19 20 21 22 23 24 25 26 27
DR
Y D
EN
SIT
Y g
/cm
3
AVERAGE MOISTURE CONTENT
COMPACTION
169

Wt. of mould & wet Soil (W2) g
Wt. of mould (W1) g
Wt. of wet soil (W2-W1) g
Bulk Density (Pb) (W2-W1)/x g/cm3
Container No. GB OX OE QZ 8I UK 8Z OQ FU LE
Wt. of wet soil & container (g) 47.42 50.60 48.24 46.62 47.19 43.54 47.82 41.64 40.90 54.71
Wt. of Dry soil & container (g) 43.10 46.20 43.10 42.30 42.10 38.90 42.00 36.60 35.40 47.10
Wt. of Container (g) 14.90 17.71 13.92 18.72 18.04 16.77 18.10 14.91 15.50 18.35
Wt. of dry soil (Wd) g 28.20 28.49 29.18 23.58 24.06 22.13 23.90 21.69 19.90 28.75
Wt. of Moisture (Wm) g 4.32 4.40 5.14 4.32 5.09 4.64 5.82 5.04 5.50 7.61
Moistur Content 100(Wm/Wd) % 15.32 15.44 17.61 18.32 21.16 20.97 24.35 23.24 27.64 26.47
Average Moisture Content (m) %
Dry Density = Pb/1+ (m/100) (g/cm3)
C.B.R. (mseen of top & bottom) %1.361.38 1.47 1.48 1.43
MOISTURE CONTENT DETERMINATIONS for B.S. Mould, X = 1000cm3
15.38 17.97 21.06 23.79 27.05
1731.00
1.74
6448.00
4723.00
1725.00
1.73
6488.00
4723.00
1765.00
1.77
6314.00
4723.00
1591.00
1.60
6510.00
4723.00
1787.00
1.79
6454.00
4723.00
DETERMINATION OF THE MOISTURE/DENSITY RELATION OF SOILUSING STANDARD/HEAVY COMPACTION
Job… OKOMU Sample No:....POWER HOUSE... Operator…………
3g/cm1.49MDD:…2018/05/25…:Date……m8.0,2BH… Dept....…Site
Amount retained on 20mm B.S. Sieve……… Total weight of Sample…… OPT.MC:19.4%
B.S. / C.B.R. Mould……4723g……………...............................
1.30
1.40
1.50
1.60
15 16 17 18 19 20 21 22 23 24 25 26 27 28
DR
Y D
EN
SIT
Y g
/cm
3
AVERAGE MOISTURE CONTENT
COMPACTION
170

Wt. of mould & wet Soil (W2) g
Wt. of mould (W1) g
Wt. of wet soil (W2-W1) g
Bulk Density (Pb) (W2-W1)/x g/cm3
Container No. IL NN AF NA EH OV ZO MI BC K7 OK ST
Wt. of wet soil & container (g) 47.60 48.30 52.00 53.20 55.50 48.10 53.20 47.20 54.90 53.60 50.10 47.60
Wt. of Dry soil & container (g) 42.80 43.30 46.00 46.90 48.00 42.70 46.40 41.10 46.99 45.69 42.90 41.40
Wt. of Container (g) 16.60 15.70 16.10 15.40 15.00 18.20 18.40 16.20 16.70 15.50 15.60 18.00
Wt. of dry soil (Wd) g 26.20 27.60 29.90 31.50 33.00 24.50 28.00 24.90 30.29 30.19 27.30 23.40
Wt. of Moisture (Wm) g 4.80 5.00 6.00 6.30 7.50 5.40 6.80 6.10 7.91 7.91 7.20 6.20
Moistur Content 100(Wm/Wd) % 18.32 18.12 20.07 20.00 22.73 22.04 24.29 24.50 26.11 26.20 26.37 26.50
Average Moisture Content (m) %
Dry Density = Pb/1+ (m/100) (g/cm3)
C.B.R. (mseen of top & bottom) %1.41 1.391.21 1.35 1.41 1.44
MOISTURE CONTENT DETERMINATIONS for B.S. Mould, X = 1000cm3
18.22 20.03 22.38 24.39 26.16 26.43
5004.00
3252.00
1752.00
1.76
1619.00
1.63
5028.00
3252.00
1776.00
1.78
5034.00
3252.00
1782.00
1.79
4678.00
3252.00
1426.00
1.43
4972.00
3252.00
1720.00
1.73
4871.00
3252.00
DETERMINATION OF THE MOISTURE/DENSITY RELATION OF SOILUSING STANDARD/HEAVY COMPACTION
Job… OKOMU Sample No:....POWER HOUSE... Operator…………
3g/cm1.44MDD:…2018/05/25…:Date……m15.0,2BH… Dept....…Site
Amount retained on 20mm B.S. Sieve……… Total weight of Sample…… OPT.MC:24.8%
B.S. / C.B.R. Mould……3252g……………...............................
1.00
1.10
1.20
1.30
1.40
1.50
1.60
17 18 19 20 21 22 23 24 25 26 27
DR
Y D
EN
SIT
Y g
/cm
3
AVERAGE MOISTURE CONTENT
COMPACTION
171

172

Wt. of mould & wet Soil (W2) g
Wt. of mould (W1) g
Wt. of wet soil (W2-W1) g
Bulk Density (Pb) (W2-W1)/x g/cm3
Container No. SE F5 AA SO E6 WD 8YH JA AH BA
Wt. of wet soil & container (g) 49.65 54.42 49.74 49.52 60.04 53.16 54.85 49.17 52.94 52.07
Wt. of Dry soil & container (g) 44.17 48.64 44.17 43.64 52.74 46.47 48.15 42.48 46.49 44.84
Wt. of Container (g) 15.67 17.79 16.48 15.05 17.70 16.27 17.95 14.42 17.32 15.76
Wt. of dry soil (Wd) g 28.50 30.85 27.69 28.59 35.04 30.20 30.20 28.06 29.17 29.08
Wt. of Moisture (Wm) g 5.48 5.78 5.57 5.88 7.30 6.69 6.70 6.69 6.45 7.23
Moistur Content 100(Wm/Wd) % 19.23 18.74 20.12 20.57 20.83 22.15 22.19 23.84 22.11 24.86
Average Moisture Content (m) %
Dry Density = Pb/1+ (m/100) (g/cm3)
C.B.R. (mseen of top & bottom) %
4900.00
3248.00
1652.00
1.66
5119.00
3248.00
1871.00
1.88
5037.00
3248.00
1789.00
1.80
4985.00
3248.00
1737.00
1.74
5012.00
3248.00
1764.00
1.77
1.39 1.49 1.55 1.44
MOISTURE CONTENT DETERMINATIONS for B.S. Mould, X = 1000cm3
18.98 20.34 21.49 23.01 23.49
1.41
DETERMINATION OF THE MOISTURE/DENSITY RELATION OF SOILUSING STANDARD/HEAVY COMPACTION
Job… OKOMU Sample No:....PRESSING STATION, BH5... Operator…………
3g/cm1.55MDD:…2018/05/25…:Date……m7.5…Dept....…Site
Amount retained on 20mm B.S. Sieve……… Total weight of Sample…… OPT.MC:21.4%
B.S. / C.B.R. Mould……3248g……………...............................
1.20
1.30
1.40
1.50
1.60
1.70
1.80
18 19 20 21 22 23 24
DR
Y D
EN
SIT
Y g
/cm
3
AVERAGE MOISTURE CONTENT
COMPACTION
173

Wt. of mould & wet Soil (W2) g
Wt. of mould (W1) g
Wt. of wet soil (W2-W1) g
Bulk Density (Pb) (W2-W1)/x g/cm3
Container No. OX JI BZ Z5 PZ JO TU P5 CA ME
Wt. of wet soil & container (g) 45.56 51.99 49.15 45.39 42.00 41.99 44.65 47.11 46.33 54.11
Wt. of Dry soil & container (g) 40.85 46.55 44.00 40.70 37.40 37.34 38.84 41.23 40.35 46.66
Wt. of Container (g) 15.88 17.88 18.53 17.82 16.70 16.54 14.55 16.55 17.93 18.37
Wt. of dry soil (Wd) g 24.97 28.67 25.47 22.88 20.70 20.80 24.29 24.68 22.42 28.29
Wt. of Moisture (Wm) g 4.71 5.44 5.15 4.69 4.60 4.65 5.81 5.88 5.98 7.45
Moistur Content 100(Wm/Wd) % 18.86 18.97 20.22 20.50 22.22 22.36 23.92 23.82 26.67 26.33
Average Moisture Content (m) %
Dry Density = Pb/1+ (m/100) (g/cm3)
C.B.R. (mseen of top & bottom) %1.361.29 1.44 1.46 1.43
MOISTURE CONTENT DETERMINATIONS for B.S. Mould, X = 1000cm3
18.92 20.36 22.29 23.87 26.50
1723.00
1.73
6440.00
4722.00
1718.00
1.73
6480.00
4722.00
1758.00
1.77
6250.00
4722.00
1528.00
1.53
6502.00
4722.00
1780.00
1.79
6445.00
4722.00
DETERMINATION OF THE MOISTURE/DENSITY RELATION OF SOILUSING STANDARD/HEAVY COMPACTION
Job… OKOMU Sample No:....PRESSING STATION, BH5... Operator…………
3g/cm1.47MDD:…2018/05/25…:Date……m4.5…Dept....…Site
Amount retained on 20mm B.S. Sieve……… Total weight of Sample…… OPT.MC:21.6%
B.S. / C.B.R. Mould……4722g……………...............................
1.20
1.30
1.40
1.50
1.60
1.70
18 19 20 21 22 23 24 25 26 27
DR
Y D
EN
SIT
Y g
/cm
3
AVERAGE MOISTURE CONTENT
COMPACTION
174

Wt. of mould & wet Soil (W2) g
Wt. of mould (W1) g
Wt. of wet soil (W2-W1) g
Bulk Density (Pb) (W2-W1)/x g/cm3
Container No. 3R OO JE OX OR OB NB QR JA BA
Wt. of wet soil & container (g) 49.79 50.19 50.11 58.38 48.19 47.55 44.40 45.38 42.67 43.48
Wt. of Dry soil & container (g) 44.39 44.91 44.42 51.73 42.51 41.70 38.90 40.18 37.37 38.63
Wt. of Container (g) 18.01 17.62 17.50 18.78 18.12 16.27 18.08 15.49 16.16 17.76
Wt. of dry soil (Wd) g 26.38 27.29 26.92 32.95 24.39 25.43 20.82 24.69 21.21 20.87
Wt. of Moisture (Wm) g 5.40 5.28 5.69 6.65 5.68 5.85 5.50 5.20 5.30 4.85
Moistur Content 100(Wm/Wd) % 20.47 19.35 21.14 20.18 23.29 23.00 26.42 21.06 24.99 23.24
Average Moisture Content (m) %
Dry Density = Pb/1+ (m/100) (g/cm3)
C.B.R. (mseen of top & bottom) %1.411.36 1.46 1.50 1.43
MOISTURE CONTENT DETERMINATIONS for B.S. Mould, X = 1000cm3
19.91 20.66 23.15 23.74 24.11
1758.00
1.77
6460.00
4722.00
1738.00
1.75
6485.00
4722.00
1763.00
1.77
6350.00
4722.00
1628.00
1.63
6560.00
4722.00
1838.00
1.85
6480.00
4722.00
DETERMINATION OF THE MOISTURE/DENSITY RELATION OF SOILUSING STANDARD/HEAVY COMPACTION
Job… OKOMU Sample No:....PRESSING STATION, BH5.. Operator…………
3g/cm1.58MDD:…2018/05/25…:Date……m14.5.0…Dept....…Site
Amount retained on 20mm B.S. Sieve……… Total weight of Sample…… OPT.MC:22.0%
B.S. / C.B.R. Mould……4722g……………...............................
1.30
1.40
1.50
1.60
1.70
19 20 21 22 23 24 25
DR
Y D
EN
SIT
Y g
/cm
3
AVERAGE MOISTURE CONTENT
COMPACTION
175

Wt. of mould & wet Soil (W2) g
Wt. of mould (W1) g
Wt. of wet soil (W2-W1) g
Bulk Density (Pb) (W2-W1)/x g/cm3
Container No. ZO CC ID SA NI OE UW CL AC OZ
Wt. of wet soil & container (g) 60.60 55.90 54.50 57.60 48.00 49.60 48.90 48.90 50.50 50.10
Wt. of Dry soil & container (g) 54.48 50.67 49.05 51.99 42.43 44.28 43.50 43.14 44.29 44.14
Wt. of Container (g) 18.40 18.50 18.60 20.50 14.00 17.50 18.80 16.50 18.00 19.00
Wt. of dry soil (Wd) g 36.08 32.17 30.45 31.49 28.43 26.78 24.70 26.64 26.29 25.14
Wt. of Moisture (Wm) g 6.12 5.23 5.45 5.61 5.57 5.32 5.40 5.76 6.21 5.96
Moistur Content 100(Wm/Wd) % 16.96 16.26 17.90 17.82 19.59 19.87 21.86 21.62 23.62 23.71
Average Moisture Content (m) %
Dry Density = Pb/1+ (m/100) (g/cm3)
C.B.R. (mseen of top & bottom) %1.441.36 1.52 1.55 1.50
MOISTURE CONTENT DETERMINATIONS for B.S. Mould, X = 1000cm3
16.61 17.86 19.73 21.74 23.66
1780.00
1.79
6495.00
4720.00
1775.00
1.78
6540.00
4720.00
1820.00
1.83
6295.00
4720.00
1575.00
1.58
6570.00
4720.00
1850.00
1.86
6500.00
4720.00
DETERMINATION OF THE MOISTURE/DENSITY RELATION OF SOILUSING STANDARD/HEAVY COMPACTION
Job… OKOMU Sample No:....PRESSING STATION, BH5.. Operator…………
3g/cm1.56MDD:…2018/05/25…:Date……m1.5…Dept....…Site
Amount retained on 20mm B.S. Sieve……… Total weight of Sample…… OPT.MC:19.2%
B.S. / C.B.R. Mould……4720g……………...............................
1.30
1.40
1.50
1.60
1.70
1.80
16 17 18 19 20 21 22 23 24
DR
Y D
EN
SIT
Y g
/cm
3
AVERAGE MOISTURE CONTENT
COMPACTION
176

Wt. of mould & wet Soil (W2) g
Wt. of mould (W1) g
Wt. of wet soil (W2-W1) g
Bulk Density (Pb) (W2-W1)/x g/cm3
Container No. BA UK YZ OZ LO OO OE P5 PK HI
Wt. of wet soil & container (g) 56.20 51.00 53.00 57.60 47.50 52.20 49.80 48.60 50.30 51.80
Wt. of Dry soil & container (g) 49.91 45.31 46.90 50.67 41.60 45.72 42.83 42.53 43.46 44.13
Wt. of Container (g) 19.50 17.00 18.80 19.10 16.60 18.60 15.60 18.40 17.60 15.50
Wt. of dry soil (Wd) g 30.41 28.31 28.10 31.57 25.00 27.12 27.23 24.13 25.86 28.63
Wt. of Moisture (Wm) g 6.29 5.69 6.10 6.93 5.90 6.48 6.97 6.07 6.84 7.67
Moistur Content 100(Wm/Wd) % 20.68 20.10 21.71 21.95 23.60 23.89 25.60 25.16 26.45 26.79
Average Moisture Content (m) %
Dry Density = Pb/1+ (m/100) (g/cm3)
C.B.R. (mseen of top & bottom) %1.391.33 1.46 1.52 1.46
MOISTURE CONTENT DETERMINATIONS for B.S. Mould, X = 1000cm3
20.39 21.83 23.75 25.38 26.62
1768.00
1.78
6475.00
4720.00
1755.00
1.76
6540.00
4720.00
1820.00
1.83
6314.00
4720.00
1594.00
1.60
6590.00
4720.00
1870.00
1.88
6488.00
4720.00
DETERMINATION OF THE MOISTURE/DENSITY RELATION OF SOILUSING STANDARD/HEAVY COMPACTION
Job… OKOMU Sample No:....PRESSING STATION, BH5.. Operator…………
3g/cm1.52MDD:…2018/05/25…:Date……m10.5…Dept....…Site
Amount retained on 20mm B.S. Sieve……… Total weight of Sample…… OPT.MC:23.5%
B.S. / C.B.R. Mould……4720g……………...............................
1.30
1.40
1.50
1.60
1.70
20 21 22 23 24 25 26 27
DR
Y D
EN
SIT
Y g
/cm
3
AVERAGE MOISTURE CONTENT
COMPACTION
177

Wt. of mould & wet Soil (W2) g
Wt. of mould (W1) g
Wt. of wet soil (W2-W1) g
Bulk Density (Pb) (W2-W1)/x g/cm3
Container No. TJ JA SL F5 EI VI PI JO FZ BF
Wt. of wet soil & container (g) 47.94 47.84 48.96 55.14 50.51 50.07 50.22 50.95 56.55 51.42
Wt. of Dry soil & container (g) 43.07 43.09 43.09 48.96 44.38 44.27 44.10 44.51 48.82 44.99
Wt. of Container (g) 17.53 18.12 14.21 19.06 17.24 18.19 17.83 17.45 17.35 18.81
Wt. of dry soil (Wd) g 25.54 24.97 28.88 29.90 27.14 26.08 26.27 27.06 31.47 26.18
Wt. of Moisture (Wm) g 4.87 4.75 5.87 6.18 6.13 5.80 6.12 6.44 7.73 6.43
Moistur Content 100(Wm/Wd) % 19.07 19.02 20.33 20.67 22.59 22.24 23.30 23.80 24.56 24.56
Average Moisture Content (m) %
Dry Density = Pb/1+ (m/100) (g/cm3)
C.B.R. (mseen of top & bottom) %
6385.00
4722.00
1663.00
1.67
6538.00
4722.00
1816.00
1.82
6495.00
4722.00
1773.00
1.78
6410.00
4722.00
1688.00
1.70
6457.00
4722.00
1735.00
1.74
1.40 1.48 1.49 1.41
MOISTURE CONTENT DETERMINATIONS for B.S. Mould, X = 1000cm3
19.05 20.50 22.41 23.55 24.56
1.36
DETERMINATION OF THE MOISTURE/DENSITY RELATION OF SOILUSING STANDARD/HEAVY COMPACTION
Job… OKOMU Sample No:....PRESSING STATION, BH5... Operator……
3g/cm1.51MDD:…2018/05/25…:Date……m14.5Dept........…Site
Amount retained on 20mm B.S. Sieve……… Total weight of Sample…… OPT.MC:21.6%
B.S. / C.B.R. Mould……4722g……………...............................
1.30
1.40
1.50
1.60
18 19 20 21 22 23 24 25
DR
Y D
EN
SIT
Y g
/cm
3
AVERAGE MOISTURE CONTENT
COMPACTION
178

Wt. of mould & wet Soil (W2) g
Wt. of mould (W1) g
Wt. of wet soil (W2-W1) g
Bulk Density (Pb) (W2-W1)/x g/cm3
Container No. IG PZ S4 GA BZ CE NI JO TI MT
Wt. of wet soil & container (g) 53.16 39.70 46.21 57.78 49.87 44.52 42.00 52.02 46.09 47.86
Wt. of Dry soil & container (g) 47.75 36.44 41.26 51.55 44.59 40.12 36.80 45.52 40.45 41.40
Wt. of Container (g) 15.35 16.78 14.30 17.73 18.58 17.93 13.68 16.60 17.87 15.26
Wt. of dry soil (Wd) g 32.40 19.66 26.96 33.82 26.01 22.19 23.12 28.92 22.58 26.14
Wt. of Moisture (Wm) g 5.41 3.26 4.95 6.23 5.28 4.40 5.20 6.50 5.64 6.46
Moistur Content 100(Wm/Wd) % 16.70 16.58 18.36 18.42 20.30 19.83 22.49 22.48 24.98 24.71
Average Moisture Content (m) %
Dry Density = Pb/1+ (m/100) (g/cm3)
C.B.R. (mseen of top & bottom) %
6337.00
4722.00
1615.00
1.62
6590.00
4722.00
1868.00
1.88
6560.00
4722.00
1838.00
1.85
6520.00
4722.00
1798.00
1.81
6562.00
4722.00
1840.00
1.85
1.39 1.56 1.56 1.51
MOISTURE CONTENT DETERMINATIONS for B.S. Mould, X = 1000cm3
16.64 18.39 20.06 22.48 24.85
1.45
DETERMINATION OF THE MOISTURE/DENSITY RELATION OF SOILUSING STANDARD/HEAVY COMPACTION
Job… OKOMU Sample No:....RAMP I, BH9.. Operator…………
3g/cm1.57MDD:…2018/05/25…:Date……m2.0…Dept....…Site
Amount retained on 20mm B.S. Sieve……… Total weight of Sample…… OPT.MC:19.2%
B.S. / C.B.R. Mould……4722g……………...............................
1.30
1.40
1.50
1.60
1.70
1.80
16 17 18 19 20 21 22 23 24 25
DR
Y D
EN
SIT
Y g
/cm
3
AVERAGE MOISTURE CONTENT
COMPACTION
179

Wt. of mould & wet Soil (W2) g
Wt. of mould (W1) g
Wt. of wet soil (W2-W1) g
Bulk Density (Pb) (W2-W1)/x g/cm3
Container No. II TO IL TH IX 6Z ME PZ RO AB
Wt. of wet soil & container (g) 47.22 50.58 51.02 44.77 41.44 41.48 50.67 56.47 49.07 49.97
Wt. of Dry soil & container (g) 43.65 46.70 46.50 41.00 38.00 37.60 46.00 50.30 44.10 44.99
Wt. of Container (g) 18.53 17.88 16.66 18.11 16.71 15.68 19.88 19.00 18.05 18.67
Wt. of dry soil (Wd) g 25.12 28.82 29.84 22.89 21.29 21.92 26.12 31.30 26.05 26.32
Wt. of Moisture (Wm) g 3.57 3.88 4.52 3.77 3.44 3.88 4.67 6.17 4.97 4.98
Moistur Content 100(Wm/Wd) % 14.21 13.46 15.15 16.47 16.16 17.70 17.88 19.71 19.08 18.92
Average Moisture Content (m) %
Dry Density = Pb/1+ (m/100) (g/cm3)
C.B.R. (mseen of top & bottom) %1.531.52 1.66 1.67 1.54
MOISTURE CONTENT DETERMINATIONS for B.S. Mould, X = 1000cm3
13.84 15.81 16.93 18.80 19.00
1910.00
1.92
5067.00
3250.00
1817.00
1.82
5067.00
3250.00
1817.00
1.82
4971.00
3250.00
1721.00
1.73
5189.00
3250.00
1939.00
1.95
5160.00
3250.00
DETERMINATION OF THE MOISTURE/DENSITY RELATION OF SOILUSING STANDARD/HEAVY COMPACTION
Job… OKOMU Sample No:....RAMP I, BH9... Operator…………
3g/cm1.68MDD:…2018/05/25…:Date……m5.0…Dept....…Site
Amount retained on 20mm B.S. Sieve……… Total weight of Sample…… OPT.MC:16.5%
B.S. / C.B.R. Mould……3250g……………...............................
1.40
1.50
1.60
1.70
1.80
1.90
13 14 15 16 17 18 19 20
DR
Y D
EN
SIT
Y g
/cm
3
AVERAGE MOISTURE CONTENT
COMPACTION
180

Wt. of mould & wet Soil (W2) g
Wt. of mould (W1) g
Wt. of wet soil (W2-W1) g
Bulk Density (Pb) (W2-W1)/x g/cm3
Container No. XX AZ PZ TT JA CH F6 OE CH SU
Wt. of wet soil & container (g) 53.77 54.47 56.01 52.43 47.17 54.89 54.06 59.10 51.91 55.05
Wt. of Dry soil & container (g) 48.41 48.87 49.91 46.83 41.78 48.34 47.37 51.70 44.78 47.88
Wt. of Container (g) 17.80 16.72 17.56 17.21 15.44 15.64 17.85 18.55 14.64 17.06
Wt. of dry soil (Wd) g 30.61 32.15 32.35 29.62 26.34 32.70 29.52 33.15 30.14 30.82
Wt. of Moisture (Wm) g 5.36 5.60 6.10 5.60 5.39 6.55 6.69 7.40 7.13 7.17
Moistur Content 100(Wm/Wd) % 17.51 17.42 18.86 18.91 20.46 20.03 22.66 22.32 23.66 23.26
Average Moisture Content (m) %
Dry Density = Pb/1+ (m/100) (g/cm3)
C.B.R. (mseen of top & bottom) %
6325.00
4722.00
1603.00
1.61
6535.00
4722.00
1813.00
1.82
6495.00
4722.00
1773.00
1.78
6477.00
4722.00
1755.00
1.76
6510.00
4722.00
1788.00
1.80
1.37 1.50 1.51 1.47
MOISTURE CONTENT DETERMINATIONS for B.S. Mould, X = 1000cm3
17.46 18.88 20.25 22.49 23.46
1.43
DETERMINATION OF THE MOISTURE/DENSITY RELATION OF SOILUSING STANDARD/HEAVY COMPACTION
Job… OKOMU Sample No:....RAMP I, BH9.. Operator…………
3g/cm1.52MDD:…2018/05/25…:Date……m8.0…Dept....…Site
Amount retained on 20mm B.S. Sieve……… Total weight of Sample…… OPT.MC:19.9%
B.S. / C.B.R. Mould……4722g……………...............................
1.30
1.40
1.50
1.60
1.70
17 18 19 20 21 22 23 24
DR
Y D
EN
SIT
Y g
/cm
3
AVERAGE MOISTURE CONTENT
COMPACTION
181

Wt. of mould & wet Soil (W2) g
Wt. of mould (W1) g
Wt. of wet soil (W2-W1) g
Bulk Density (Pb) (W2-W1)/x g/cm3
Container No. CU CR PO MO SI I8 AI TO AA PM
Wt. of wet soil & container (g) 45.79 48.43 46.52 56.19 51.61 48.68 51.61 51.40 65.12 59.23
Wt. of Dry soil & container (g) 42.09 44.14 42.85 50.76 46.44 43.40 45.64 45.73 56.40 51.70
Wt. of Container (g) 17.33 14.98 20.82 17.40 17.95 15.48 16.93 18.36 16.54 18.24
Wt. of dry soil (Wd) g 24.76 29.16 22.03 33.36 28.49 27.92 28.71 27.37 39.86 33.46
Wt. of Moisture (Wm) g 3.70 4.29 3.67 5.43 5.17 5.28 5.97 5.67 8.72 7.53
Moistur Content 100(Wm/Wd) % 14.94 14.71 16.66 16.28 18.15 18.91 20.79 20.72 21.88 22.50
Average Moisture Content (m) %
Dry Density = Pb/1+ (m/100) (g/cm3)
C.B.R. (mseen of top & bottom) %1.351.42 1.52 1.53 1.47
MOISTURE CONTENT DETERMINATIONS for B.S. Mould, X = 1000cm3
14.83 16.47 18.53 20.76 22.19
1761.00
1.77
6366.00
4722.00
1644.00
1.65
6484.00
4722.00
1762.00
1.77
6345.00
4722.00
1623.00
1.63
6532.00
4722.00
1810.00
1.82
6483.00
4722.00
DETERMINATION OF THE MOISTURE/DENSITY RELATION OF SOILUSING STANDARD/HEAVY COMPACTION
Job… OKOMU Sample No:....RAMP I, BH9.. Operator…………
3g/cm1.54MDD:…2018/05/25…:Date……m11.0…Dept....…Site
Amount retained on 20mm B.S. Sieve……… Total weight of Sample…… OPT.MC:17.8%
B.S. / C.B.R. Mould……4722g……………...............................
1.30
1.40
1.50
1.60
1.70
14 15 16 17 18 19 20 21 22 23
DR
Y D
EN
SIT
Y g
/cm
3
AVERAGE MOISTURE CONTENT
COMPACTION
182

Wt. of mould & wet Soil (W2) g
Wt. of mould (W1) g
Wt. of wet soil (W2-W1) g
Bulk Density (Pb) (W2-W1)/x g/cm3
Container No. TJ JA SL F5 EI VI PI JO FZ BF
Wt. of wet soil & container (g) 47.94 47.84 48.96 55.14 50.51 50.07 50.22 50.95 56.55 51.42
Wt. of Dry soil & container (g) 43.07 43.09 43.09 48.96 44.38 44.27 44.10 44.51 48.82 44.99
Wt. of Container (g) 17.53 18.12 14.21 19.06 17.24 18.19 17.83 17.45 17.35 18.81
Wt. of dry soil (Wd) g 25.54 24.97 28.88 29.90 27.14 26.08 26.27 27.06 31.47 26.18
Wt. of Moisture (Wm) g 4.87 4.75 5.87 6.18 6.13 5.80 6.12 6.44 7.73 6.43
Moistur Content 100(Wm/Wd) % 19.07 19.02 20.33 20.67 22.59 22.24 23.30 23.80 24.56 24.56
Average Moisture Content (m) %
Dry Density = Pb/1+ (m/100) (g/cm3)
C.B.R. (mseen of top & bottom) %1.361.40 1.48 1.49 1.41
MOISTURE CONTENT DETERMINATIONS for B.S. Mould, X = 1000cm3
19.05 20.50 22.41 23.55 24.56
1773.00
1.78
6410.00
4722.00
1688.00
1.70
6457.00
4722.00
1735.00
1.74
6385.00
4722.00
1663.00
1.67
6538.00
4722.00
1816.00
1.82
6495.00
4722.00
DETERMINATION OF THE MOISTURE/DENSITY RELATION OF SOILUSING STANDARD/HEAVY COMPACTION
Job… OKOMU Sample No:....OKOMU RAMP I, BH9... Operator……
3g/cm1.51MDD:…2018/05/25…:Date……m14.0Dept........…Site
Amount retained on 20mm B.S. Sieve……… Total weight of Sample…… OPT.MC:21.6%
B.S. / C.B.R. Mould……4722g……………...............................
1.30
1.40
1.50
1.60
18 19 20 21 22 23 24 25
DR
Y D
EN
SIT
Y g
/cm
3
AVERAGE MOISTURE CONTENT
COMPACTION
183

Wt. of mould & wet Soil (W2) g
Wt. of mould (W1) g
Wt. of wet soil (W2-W1) g
Bulk Density (Pb) (W2-W1)/x g/cm3
Container No. AB MA H8 P5 OE MQ JN IN DI S3
Wt. of wet soil & container (g) 50.57 48.92 44.29 45.39 38.09 42.30 47.34 39.12 42.44 47.40
Wt. of Dry soil & container (g) 45.80 44.20 40.40 41.00 34.00 38.20 41.70 35.30 37.70 40.80
Wt. of Container (g) 17.31 15.85 17.02 18.48 14.27 18.10 17.81 18.10 17.51 14.49
Wt. of dry soil (Wd) g 28.49 28.35 23.38 22.52 19.73 20.10 23.89 17.20 20.19 26.31
Wt. of Moisture (Wm) g 4.77 4.72 3.89 4.39 4.09 4.10 5.64 3.82 4.74 6.60
Moistur Content 100(Wm/Wd) % 16.74 16.65 16.64 19.49 20.73 20.40 23.61 22.21 23.48 25.09
Average Moisture Content (m) %
Dry Density = Pb/1+ (m/100) (g/cm3)
C.B.R. (mseen of top & bottom) %1.441.49 1.57 1.54 1.47
MOISTURE CONTENT DETERMINATIONS for B.S. Mould, X = 1000cm3
16.70 18.07 20.56 22.91 24.28
1847.00
1.85
5032.00
3250.00
1782.00
1.79
5052.00
3250.00
1802.00
1.81
4977.00
3250.00
1727.00
1.73
5100.00
3250.00
1850.00
1.86
5097.00
3250.00
DETERMINATION OF THE MOISTURE/DENSITY RELATION OF SOILUSING STANDARD/HEAVY COMPACTION
Job… OKOMU Sample No:....RAMP II, BH10... Operator…………
3g/cm1.58MDD:…2018/05/25…:Date……m1.5…Dept....…Site
Amount retained on 20mm B.S. Sieve……… Total weight of Sample…… OPT.MC:18.7%
B.S. / C.B.R. Mould……3250g……………...............................
1.40
1.50
1.60
1.70
16 17 18 19 20 21 22 23 24 25
DR
Y D
EN
SIT
Y g
/cm
3
AVERAGE MOISTURE CONTENT
COMPACTION
184

Wt. of mould & wet Soil (W2) g
Wt. of mould (W1) g
Wt. of wet soil (W2-W1) g
Bulk Density (Pb) (W2-W1)/x g/cm3
Container No. JI RO ZE DO EX E3 IO OT 4O EI
Wt. of wet soil & container (g) 45.62 48.14 54.40 49.99 57.34 59.19 45.34 50.92 50.75 54.74
Wt. of Dry soil & container (g) 42.11 44.38 50.15 45.99 51.70 53.75 41.32 45.38 45.67 48.93
Wt. of Container (g) 16.49 16.45 19.09 17.76 15.87 17.67 17.66 16.91 18.41 17.80
Wt. of dry soil (Wd) g 25.62 27.93 31.06 28.23 35.83 36.08 23.66 28.47 27.26 31.13
Wt. of Moisture (Wm) g 3.51 3.76 4.25 4.00 5.64 5.44 4.02 5.54 5.08 5.81
Moistur Content 100(Wm/Wd) % 13.70 13.46 13.68 14.17 15.74 15.08 16.99 19.46 18.64 18.66
Average Moisture Content (m) %
Dry Density = Pb/1+ (m/100) (g/cm3)
C.B.R. (mseen of top & bottom) %1.581.67 1.70 1.72 1.62
MOISTURE CONTENT DETERMINATIONS for B.S. Mould, X = 1000cm3
13.58 13.93 15.41 18.22 18.65
1930.00
1.94
6590.00
4722.00
1868.00
1.88
6625.00
4722.00
1903.00
1.91
6610.00
4722.00
1888.00
1.90
6695.00
4722.00
1973.00
1.98
6652.00
4722.00
DETERMINATION OF THE MOISTURE/DENSITY RELATION OF SOILUSING STANDARD/HEAVY COMPACTION
Job… OKOMU Sample No:....RAMP II, BH10.. Operator…………
3g/cm1.73MDD:…2018/05/25…:Date……m4.5…Dept....…Site
Amount retained on 20mm B.S. Sieve……… Total weight of Sample…… OPT.MC:15.0%
B.S. / C.B.R. Mould……4722g……………...............................
1.50
1.60
1.70
1.80
1.90
13 14 15 16 17 18 19
DR
Y D
EN
SIT
Y g
/cm
3
AVERAGE MOISTURE CONTENT
COMPACTION
185

Wt. of mould & wet Soil (W2) g
Wt. of mould (W1) g
Wt. of wet soil (W2-W1) g
Bulk Density (Pb) (W2-W1)/x g/cm3
Container No. JO F5 EI SO AN VO OY AH SE LO
Wt. of wet soil & container (g) 58.76 53.88 48.46 50.95 54.13 47.36 44.40 46.39 52.07 47.89
Wt. of Dry soil & container (g) 53.18 49.05 44.32 45.94 49.08 42.91 39.67 41.65 45.77 42.78
Wt. of Container (g) 16.89 17.61 19.07 15.08 19.90 17.42 16.41 17.34 15.72 18.28
Wt. of dry soil (Wd) g 36.29 31.44 25.25 30.86 29.18 25.49 23.26 24.31 30.05 24.50
Wt. of Moisture (Wm) g 5.58 4.83 4.14 5.01 5.05 4.45 4.73 4.74 6.30 5.11
Moistur Content 100(Wm/Wd) % 15.38 15.36 16.40 16.23 17.31 17.46 20.34 19.50 20.97 20.86
Average Moisture Content (m) %
Dry Density = Pb/1+ (m/100) (g/cm3)
C.B.R. (mseen of top & bottom) %
6378.00
4722.00
1656.00
1.66
6638.00
4722.00
1916.00
1.92
6534.00
4722.00
1812.00
1.82
6540.00
4722.00
1818.00
1.83
6575.00
4722.00
1853.00
1.86
1.44 1.56 1.64 1.55
MOISTURE CONTENT DETERMINATIONS for B.S. Mould, X = 1000cm3
15.37 16.32 17.38 19.92 20.91
1.51
DETERMINATION OF THE MOISTURE/DENSITY RELATION OF SOILUSING STANDARD/HEAVY COMPACTION
Job… OKOMU Sample No:....RAMP II, BH10.. Operator…………
3g/cm1.65MDD:…2018/05/25…:Date……m7.5…Dept....…Site
Amount retained on 20mm B.S. Sieve……… Total weight of Sample…… OPT.MC:17.9%
B.S. / C.B.R. Mould……4722g……………...............................
1.40
1.50
1.60
1.70
1.80
15 16 17 18 19 20 21
DR
Y D
EN
SIT
Y g
/cm
3
AVERAGE MOISTURE CONTENT
COMPACTION
186

Wt. of mould & wet Soil (W2) g
Wt. of mould (W1) g
Wt. of wet soil (W2-W1) g
Bulk Density (Pb) (W2-W1)/x g/cm3
Container No. Z3 GT JK SO OV EZ Z9 DO IN AC
Wt. of wet soil & container (g) 50.26 50.24 53.42 44.18 50.90 48.07 44.86 52.03 47.98 42.88
Wt. of Dry soil & container (g) 45.60 45.50 48.30 40.10 45.40 42.65 40.32 46.00 42.00 38.00
Wt. of Container (g) 17.74 16.47 19.29 16.15 16.66 14.98 19.38 18.28 15.50 16.40
Wt. of dry soil (Wd) g 27.86 29.03 29.01 23.95 28.74 27.67 20.94 27.72 26.50 21.60
Wt. of Moisture (Wm) g 4.66 4.74 5.12 4.08 5.50 5.42 4.54 6.03 5.98 4.88
Moistur Content 100(Wm/Wd) % 16.73 16.33 17.65 17.04 19.14 19.59 21.68 21.75 22.57 22.59
Average Moisture Content (m) %
Dry Density = Pb/1+ (m/100) (g/cm3)
C.B.R. (mseen of top & bottom) %
4868.00
3250.00
1618.00
1.62
5080.00
3250.00
1830.00
1.84
4992.00
3250.00
1742.00
1.75
5022.00
3250.00
1772.00
1.78
5060.00
3250.00
1810.00
1.82
1.39 1.49 1.54 1.49
MOISTURE CONTENT DETERMINATIONS for B.S. Mould, X = 1000cm3
16.53 17.34 19.36 21.72 22.58
1.45
DETERMINATION OF THE MOISTURE/DENSITY RELATION OF SOILUSING STANDARD/HEAVY COMPACTION
Job… OKOMU Sample No:....RAMP II, BH10. Operator…………
3g/cm1.54MDD:…2018/05/25…:Date……m10.5…Dept....…Site
Amount retained on 20mm B.S. Sieve……… Total weight of Sample…… OPT.MC:18.9%
B.S. / C.B.R. Mould……3250g……………...............................
1.30
1.40
1.50
1.60
1.70
16 17 18 19 20 21 22 23
DR
Y D
EN
SIT
Y g
/cm
3
AVERAGE MOISTURE CONTENT
COMPACTION
187

Wt. of mould & wet Soil (W2) g
Wt. of mould (W1) g
Wt. of wet soil (W2-W1) g
Bulk Density (Pb) (W2-W1)/x g/cm3
Container No. ST PE BA EB TK OO IB IP JA MA
Wt. of wet soil & container (g) 45.39 40.43 38.88 38.96 44.96 40.92 50.19 48.39 42.68 47.03
Wt. of Dry soil & container (g) 41.87 37.54 35.55 35.90 41.10 37.22 44.90 42.93 37.20 40.90
Wt. of Container (g) 18.10 17.29 15.74 17.32 19.76 16.67 20.97 18.48 14.40 15.48
Wt. of dry soil (Wd) g 23.77 20.25 19.81 18.58 21.34 20.55 23.93 24.45 22.80 25.42
Wt. of Moisture (Wm) g 3.52 2.89 3.33 3.06 3.86 3.70 5.29 5.46 5.48 6.13
Moistur Content 100(Wm/Wd) % 14.81 14.27 16.81 16.47 18.09 18.00 22.11 22.33 24.04 24.11
Average Moisture Content (m) %
Dry Density = Pb/1+ (m/100) (g/cm3)
C.B.R. (mseen of top & bottom) %
4872.00
3250.00
1622.00
1.63
5118.00
3250.00
1868.00
1.88
5010.00
3250.00
1760.00
1.77
5001.00
3250.00
1751.00
1.76
5075.00
3250.00
1825.00
1.83
1.42 1.52 1.59 1.50
MOISTURE CONTENT DETERMINATIONS for B.S. Mould, X = 1000cm3
14.54 16.64 18.05 22.22 24.07
1.42
DETERMINATION OF THE MOISTURE/DENSITY RELATION OF SOILUSING STANDARD/HEAVY COMPACTION
Job… OKOMU Sample No:....RAMP II, BH10.. Operator…………
3g/cm1.62MDD:…2018/05/25…:Date……m13.5…Dept....…Site
Amount retained on 20mm B.S. Sieve……… Total weight of Sample…… OPT.MC:19.3%
B.S. / C.B.R. Mould……3250g……………...............................
1.30
1.40
1.50
1.60
1.70
1.80
14 15 16 17 18 19 20 21 22 23 24 25
DR
Y D
EN
SIT
Y g
/cm
3
AVERAGE MOISTURE CONTENT
COMPACTION
188

Wt. of mould & wet Soil (W2) g
Wt. of mould (W1) g
Wt. of wet soil (W2-W1) g
Bulk Density (Pb) (W2-W1)/x g/cm3
Container No. 3A NA PB FA OG NO FU N8 BA CO
Wt. of wet soil & container (g) 47.66 46.02 50.41 54.67 62.67 46.11 55.97 58.60 58.44 47.69
Wt. of Dry soil & container (g) 43.10 41.59 45.04 48.83 55.03 40.75 48.93 51.06 50.73 41.99
Wt. of Container (g) 17.27 15.76 16.70 17.73 18.04 14.33 17.89 17.30 17.80 17.45
Wt. of dry soil (Wd) g 25.83 25.83 28.34 31.10 36.99 26.42 31.04 33.76 32.93 24.54
Wt. of Moisture (Wm) g 4.56 4.43 5.37 5.84 7.64 5.36 7.04 7.54 7.71 5.70
Moistur Content 100(Wm/Wd) % 17.65 17.15 18.95 18.78 20.65 20.29 22.68 22.33 23.41 23.23
Average Moisture Content (m) %
Dry Density = Pb/1+ (m/100) (g/cm3)
C.B.R. (mseen of top & bottom) %1.441.43 1.50 1.56 1.47
MOISTURE CONTENT DETERMINATIONS for B.S. Mould, X = 1000cm3
17.40 18.86 20.47 22.51 23.32
1773.00
1.78
6495.00
4722.00
1773.00
1.78
6520.00
4722.00
1798.00
1.81
6390.00
4722.00
1668.00
1.68
6595.00
4722.00
1873.00
1.88
6495.00
4722.00
DETERMINATION OF THE MOISTURE/DENSITY RELATION OF SOILUSING STANDARD/HEAVY COMPACTION
Job… OKOMU Sample No:....RAMP II, BH10... Operator…………
3g/cm1.56MDD:…2018/05/25…:Date……m15.0…Dept....…Site
Amount retained on 20mm B.S. Sieve……… Total weight of Sample…… OPT.MC:20.5%
B.S. / C.B.R. Mould……4722g……………...............................
1.30
1.40
1.50
1.60
1.70
17 18 19 20 21 22 23 24
DR
Y D
EN
SIT
Y g
/cm
3
AVERAGE MOISTURE CONTENT
COMPACTION
189

Wt. of mould & wet Soil (W2) g
Wt. of mould (W1) g
Wt. of wet soil (W2-W1) g
Bulk Density (Pb) (W2-W1)/x g/cm3
Container No. AI ME Z8 ZO MO 7O EI NM TU SU
Wt. of wet soil & container (g) 49.28 52.85 65.24 56.83 54.16 56.04 54.73 47.88 50.93 47.96
Wt. of Dry soil & container (g) 44.42 47.72 58.23 50.29 47.70 49.65 47.96 41.81 43.99 41.99
Wt. of Container (g) 16.96 18.34 19.67 17.45 17.39 18.77 19.08 15.45 14.53 17.90
Wt. of dry soil (Wd) g 27.46 29.38 38.56 32.84 30.31 30.88 28.88 26.36 29.46 24.09
Wt. of Moisture (Wm) g 4.86 5.13 7.01 6.54 6.46 6.39 6.77 6.07 6.94 5.97
Moistur Content 100(Wm/Wd) % 17.70 17.46 18.18 19.91 21.31 20.69 23.44 23.03 23.56 24.78
Average Moisture Content (m) %
Dry Density = Pb/1+ (m/100) (g/cm3)
C.B.R. (mseen of top & bottom) %1.411.48 1.57 1.60 1.45
MOISTURE CONTENT DETERMINATIONS for B.S. Mould, X = 1000cm3
17.58 19.05 21.00 23.23 24.17
1859.00
1.87
4994.00
3248.00
1746.00
1.75
5023.00
3248.00
1775.00
1.78
4976.00
3248.00
1728.00
1.74
5172.00
3248.00
1924.00
1.93
5107.00
3248.00
DETERMINATION OF THE MOISTURE/DENSITY RELATION OF SOILUSING STANDARD/HEAVY COMPACTION
Job… OKOMU Sample No:....STERILIZER, BH4... Operator…………
3g/cm1.55MDD:…2018/05/25…:Date……m12.5…Dept....…Site
Amount retained on 20mm B.S. Sieve……… Total weight of Sample…… OPT.MC:21.4%
B.S. / C.B.R. Mould……3248g……………...............................
1.30
1.40
1.50
1.60
1.70
1.80
17 18 19 20 21 22 23 24 25
DR
Y D
EN
SIT
Y g
/cm
3
AVERAGE MOISTURE CONTENT
COMPACTION
190

Wt. of mould & wet Soil (W2) g
Wt. of mould (W1) g
Wt. of wet soil (W2-W1) g
Bulk Density (Pb) (W2-W1)/x g/cm3
Container No. CL P3 BE AF Z3 KL CE GL CL PX
Wt. of wet soil & container (g) 51.00 53.40 45.50 45.30 49.50 51.60 53.60 50.00 49.50 48.60
Wt. of Dry soil & container (g) 46.85 48.69 41.53 41.18 44.10 46.23 47.33 43.68 42.70 42.60
Wt. of Container (g) 17.40 17.10 17.80 16.20 16.30 18.50 19.50 16.10 14.40 18.10
Wt. of dry soil (Wd) g 29.45 31.59 23.73 24.98 27.80 27.73 27.83 27.58 28.30 24.50
Wt. of Moisture (Wm) g 4.15 4.71 3.97 4.12 5.40 5.37 6.27 6.32 6.80 6.00
Moistur Content 100(Wm/Wd) % 14.09 14.91 16.73 16.49 19.42 19.37 22.53 22.92 24.03 24.49
Average Moisture Content (m) %
Dry Density = Pb/1+ (m/100) (g/cm3)
C.B.R. (mseen of top & bottom) %1.451.50 1.55 1.57 1.51
MOISTURE CONTENT DETERMINATIONS for B.S. Mould, X = 1000cm3
14.50 16.61 19.39 22.72 24.26
1800.00
1.81
6517.00
4720.00
1797.00
1.80
6560.00
4720.00
1840.00
1.85
6425.00
4720.00
1705.00
1.71
6591.00
4720.00
1871.00
1.88
6520.00
4720.00
DETERMINATION OF THE MOISTURE/DENSITY RELATION OF SOILUSING STANDARD/HEAVY COMPACTION
Job… OKOMU Sample No:....STERILIZER, BH4... Operator…………
3g/cm1.58MDD:…2018/05/25…:Date……m0.5…Dept....…Site
Amount retained on 20mm B.S. Sieve……… Total weight of Sample…… OPT.MC:18.9%
B.S. / C.B.R. Mould……4720g……………...............................
1.30
1.40
1.50
1.60
1.70
1.80
14 15 16 17 18 19 20 21 22 23 24 25
DR
Y D
EN
SIT
Y g
/cm
3
AVERAGE MOISTURE CONTENT
COMPACTION
191

Wt. of mould & wet Soil (W2) g
Wt. of mould (W1) g
Wt. of wet soil (W2-W1) g
Bulk Density (Pb) (W2-W1)/x g/cm3
Container No. PD S9 3R X T FY EX TK UF SO
Wt. of wet soil & container (g) 53.18 48.20 60.22 69.33 53.44 58.31 54.85 51.32 59.10 54.43
Wt. of Dry soil & container (g) 47.20 42.88 53.08 60.35 47.11 50.45 47.72 44.35 49.68 46.76
Wt. of Container (g) 15.14 14.56 18.38 17.58 19.21 15.19 17.80 15.13 14.36 18.22
Wt. of dry soil (Wd) g 32.06 28.32 34.70 42.77 27.90 35.26 29.92 29.22 35.32 28.54
Wt. of Moisture (Wm) g 5.98 5.32 7.14 8.98 6.33 7.86 7.13 6.97 9.42 7.67
Moistur Content 100(Wm/Wd) % 18.65 18.79 20.58 21.00 22.69 22.29 23.83 23.85 26.67 26.87
Average Moisture Content (m) %
Dry Density = Pb/1+ (m/100) (g/cm3)
C.B.R. (mseen of top & bottom) %
6300.00
4722.00
1578.00
1.58
6515.00
4722.00
1793.00
1.80
6485.00
4722.00
1763.00
1.77
6457.00
4722.00
1735.00
1.74
6495.00
4722.00
1773.00
1.78
1.33 1.47 1.47 1.44
MOISTURE CONTENT DETERMINATIONS for B.S. Mould, X = 1000cm3
18.72 20.79 22.49 23.84 26.77
1.37
DETERMINATION OF THE MOISTURE/DENSITY RELATION OF SOILUSING STANDARD/HEAVY COMPACTION
Job… OKOMU Sample No:....STERILIZER, BH4... Operator…………
3g/cm1.48MDD:…2018/05/25…:Date……m3.5…Dept....…Site
Amount retained on 20mm B.S. Sieve……… Total weight of Sample…… OPT.MC:21.7%
B.S. / C.B.R. Mould……4722g……………...............................
1.20
1.30
1.40
1.50
1.60
1.70
18 19 20 21 22 23 24 25 26 27
DR
Y D
EN
SIT
Y g
/cm
3
AVERAGE MOISTURE CONTENT
COMPACTION
192

Wt. of mould & wet Soil (W2) g
Wt. of mould (W1) g
Wt. of wet soil (W2-W1) g
Bulk Density (Pb) (W2-W1)/x g/cm3
Container No. KO EN AN LO BO I6 SK OO 8Z PO
Wt. of wet soil & container (g) 49.52 52.92 53.53 56.81 53.61 59.14 56.86 56.07 55.16 51.77
Wt. of Dry soil & container (g) 44.90 47.80 48.40 51.00 47.63 52.76 50.32 49.26 48.69 45.78
Wt. of Container (g) 16.28 17.42 19.91 18.27 16.16 18.15 18.17 16.69 17.58 17.84
Wt. of dry soil (Wd) g 28.62 30.38 28.49 32.73 31.47 34.61 32.15 32.57 31.11 27.94
Wt. of Moisture (Wm) g 4.62 5.12 5.13 5.81 5.98 6.38 6.54 6.81 6.47 5.99
Moistur Content 100(Wm/Wd) % 16.14 16.85 18.01 17.75 19.00 18.43 20.34 20.91 20.80 21.44
Average Moisture Content (m) %
Dry Density = Pb/1+ (m/100) (g/cm3)
C.B.R. (mseen of top & bottom) %
4974.00
3248.00
1726.00
1.73
5152.00
3248.00
1904.00
1.91
5095.00
3248.00
1847.00
1.85
5028.00
3248.00
1780.00
1.79
5065.00
3248.00
1817.00
1.82
1.49 1.57 1.61 1.51
MOISTURE CONTENT DETERMINATIONS for B.S. Mould, X = 1000cm3
16.50 17.88 18.72 20.63 21.12
1.48
DETERMINATION OF THE MOISTURE/DENSITY RELATION OF SOILUSING STANDARD/HEAVY COMPACTION
Job… OKOMU Sample No:....STERILIZER, BH4... Operator…………
3g/cm1.61MDD:…2018/05/25…:Date……m6.5…Dept....…Site
Amount retained on 20mm B.S. Sieve……… Total weight of Sample…… OPT.MC:18.9%
B.S. / C.B.R. Mould……3248g……………...............................
1.40
1.50
1.60
1.70
1.80
16 17 18 19 20 21 22
DR
Y D
EN
SIT
Y g
/cm
3
AVERAGE MOISTURE CONTENT
COMPACTION
193

Wt. of mould & wet Soil (W2) g
Wt. of mould (W1) g
Wt. of wet soil (W2-W1) g
Bulk Density (Pb) (W2-W1)/x g/cm3
Container No. OK OR GS ZO OF AB AI PO DA E
Wt. of wet soil & container (g) 48.66 52.08 52.22 51.36 46.42 51.36 44.35 59.14 60.00 52.18
Wt. of Dry soil & container (g) 43.46 46.49 46.49 45.40 41.26 45.67 38.52 50.85 51.69 44.91
Wt. of Container (g) 15.60 16.57 17.98 16.14 17.57 18.44 13.94 17.56 19.20 16.69
Wt. of dry soil (Wd) g 27.86 29.92 28.51 29.26 23.69 27.23 24.58 33.29 32.49 28.22
Wt. of Moisture (Wm) g 5.20 5.59 5.73 5.96 5.16 5.69 5.83 8.29 8.31 7.27
Moistur Content 100(Wm/Wd) % 18.66 18.68 20.10 20.37 21.78 20.90 23.72 24.90 25.58 25.76
Average Moisture Content (m) %
Dry Density = Pb/1+ (m/100) (g/cm3)
C.B.R. (mseen of top & bottom) %1.401.38 1.48 1.50 1.44
MOISTURE CONTENT DETERMINATIONS for B.S. Mould, X = 1000cm3
18.67 20.23 21.34 24.31 25.67
1768.00
1.78
6480.00
4722.00
1758.00
1.77
6500.00
4722.00
1778.00
1.79
6357.00
4722.00
1635.00
1.64
6535.00
4722.00
1813.00
1.82
6490.00
4722.00
DETERMINATION OF THE MOISTURE/DENSITY RELATION OF SOILUSING STANDARD/HEAVY COMPACTION
Job… OKOMU Sample No:....STERILIZER, BH4.. Operator…………
3g/cm1.50MDD:…2018/05/25…:Date……m9.5.0…Dept....…Site
Amount retained on 20mm B.S. Sieve……… Total weight of Sample…… OPT.MC:21.6%
B.S. / C.B.R. Mould……4722g……………...............................
1.20
1.30
1.40
1.50
1.60
1.70
18 19 20 21 22 23 24 25 26
DR
Y D
EN
SIT
Y g
/cm
3
AVERAGE MOISTURE CONTENT
COMPACTION
194

Wt. of mould & wet Soil (W2) g
Wt. of mould (W1) g
Wt. of wet soil (W2-W1) g
Bulk Density (Pb) (W2-W1)/x g/cm3
Container No. PI I6 AI IG NM FS EI VI KO TJ
Wt. of wet soil & container (g) 47.33 50.75 50.57 50.77 56.90 53.45 57.73 51.96 44.00 45.09
Wt. of Dry soil & container (g) 42.52 45.39 44.82 44.82 49.65 47.20 50.50 45.58 38.65 39.75
Wt. of Container (g) 17.52 18.12 16.90 15.26 15.46 17.83 19.06 18.11 16.32 17.44
Wt. of dry soil (Wd) g 25.00 27.27 27.92 29.56 34.19 29.37 31.44 27.47 22.33 22.31
Wt. of Moisture (Wm) g 4.81 5.36 5.75 5.95 7.25 6.25 7.23 6.38 5.35 5.34
Moistur Content 100(Wm/Wd) % 19.24 19.66 20.59 20.13 21.21 21.28 23.00 23.23 23.96 23.94
Average Moisture Content (m) %
Dry Density = Pb/1+ (m/100) (g/cm3)
C.B.R. (mseen of top & bottom) %1.411.43 1.49 1.51 1.43
MOISTURE CONTENT DETERMINATIONS for B.S. Mould, X = 1000cm3
19.45 20.36 21.24 23.11 23.95
1786.00
1.79
6460.00
4722.00
1738.00
1.75
6480.00
4722.00
1758.00
1.77
6425.00
4722.00
1703.00
1.71
6545.00
4722.00
1823.00
1.83
6508.00
4722.00
DETERMINATION OF THE MOISTURE/DENSITY RELATION OF SOILUSING STANDARD/HEAVY COMPACTION
Job… OKOMU Sample No:....STERILIZER, BH4... Operator…………
3g/cm1.51MDD:…2018/05/25…:Date……m15.0…Dept....…Site
Amount retained on 20mm B.S. Sieve……… Total weight of Sample…… OPT.MC:21.2%
B.S. / C.B.R. Mould……4722g……………...............................
1.30
1.40
1.50
1.60
1.70
19 20 21 22 23 24
DR
Y D
EN
SIT
Y g
/cm
3
AVERAGE MOISTURE CONTENT
COMPACTION
195

Wt. of mould & wet Soil (W2) g
Wt. of mould (W1) g
Wt. of wet soil (W2-W1) g
Bulk Density (Pb) (W2-W1)/x g/cm3
Container No. 3R OR OE NB TP CH QR XX JR CH
Wt. of wet soil & container (g) 49.80 49.60 53.70 58.20 57.00 52.10 48.90 53.80 54.60 50.70
Wt. of Dry soil & container (g) 43.90 44.00 47.00 50.30 48.80 44.70 41.50 45.80 46.20 42.60
Wt. of Container (g) 18.30 18.40 18.30 18.10 17.10 15.50 15.30 17.70 17.40 14.50
Wt. of dry soil (Wd) g 25.60 25.60 28.70 32.20 31.70 29.20 26.20 28.10 28.80 28.10
Wt. of Moisture (Wm) g 5.90 5.60 6.70 7.90 8.20 7.40 7.40 8.00 8.40 8.10
Moistur Content 100(Wm/Wd) % 23.05 21.88 23.34 24.53 25.87 25.34 28.24 28.47 29.17 28.83
Average Moisture Content (m) %
Dry Density = Pb/1+ (m/100) (g/cm3)
C.B.R. (mseen of top & bottom) %
5002.00
3252.00
1750.00
1.76
5130.00
3252.00
1878.00
1.89
5096.00
3252.00
1844.00
1.85
4926.00
3252.00
1674.00
1.68
4950.00
3252.00
1698.00
1.71
1.44 1.49 1.50 1.33
MOISTURE CONTENT DETERMINATIONS for B.S. Mould, X = 1000cm3
22.46 23.94 25.60 28.36 29.00
1.30
DETERMINATION OF THE MOISTURE/DENSITY RELATION OF SOILUSING STANDARD/HEAVY COMPACTION
Job… OKOMU Sample No:....STORAGE TANK, BH6... Operator…………
3g/cm1.51MDD:…2018/05/25…:Date……m10.0…Dept....…Site
Amount retained on 20mm B.S. Sieve……… Total weight of Sample…… OPT.MC:24.9%
B.S. / C.B.R. Mould……3252g……………...............................
1.20
1.30
1.40
1.50
1.60
1.70
22 23 24 25 26 27 28 29
DR
Y D
EN
SIT
Y g
/cm
3
AVERAGE MOISTURE CONTENT
COMPACTION
196

Wt. of mould & wet Soil (W2) g
Wt. of mould (W1) g
Wt. of wet soil (W2-W1) g
Bulk Density (Pb) (W2-W1)/x g/cm3
Container No. PM TW PD OS GA PO SO N ZI NI
Wt. of wet soil & container (g) 41.83 53.30 55.09 48.54 45.31 53.42 54.57 53.65 53.69 51.35
Wt. of Dry soil & container (g) 38.25 47.81 48.82 43.57 40.64 47.44 47.67 46.70 47.27 44.29
Wt. of Container (g) 17.81 16.42 15.00 17.13 17.67 17.78 14.80 14.57 17.48 13.71
Wt. of dry soil (Wd) g 20.44 31.39 33.82 26.44 22.97 29.66 32.87 32.13 29.79 30.58
Wt. of Moisture (Wm) g 3.58 5.49 6.27 4.97 4.67 5.98 6.90 6.95 6.42 7.06
Moistur Content 100(Wm/Wd) % 17.51 17.49 18.54 18.80 20.33 20.16 20.99 21.63 21.55 23.09
Average Moisture Content (m) %
Dry Density = Pb/1+ (m/100) (g/cm3)
C.B.R. (mseen of top & bottom) %1.401.34 1.45 1.47 1.43
MOISTURE CONTENT DETERMINATIONS for B.S. Mould, X = 1000cm3
17.50 18.67 20.25 21.31 22.32
1715.00
1.72
6425.00
4722.00
1703.00
1.71
6450.00
4722.00
1728.00
1.74
6285.00
4722.00
1563.00
1.57
6480.00
4722.00
1758.00
1.77
6437.00
4722.00
DETERMINATION OF THE MOISTURE/DENSITY RELATION OF SOILUSING STANDARD/HEAVY COMPACTION
Job… OKOMU Sample No:....STORAGE TANK, BH6... Operator…………
3g/cm1.47MDD:…2018/05/25…:Date……m1.0Dept....…Site
Amount retained on 20mm B.S. Sieve……… Total weight of Sample…… OPT.MC:19.6%
B.S. / C.B.R. Mould……4722g……………...............................
1.20
1.30
1.40
1.50
1.60
1.70
17 18 19 20 21 22 23
DR
Y D
EN
SIT
Y g
/cm
3
AVERAGE MOISTURE CONTENT
COMPACTION
197

Wt. of mould & wet Soil (W2) g
Wt. of mould (W1) g
Wt. of wet soil (W2-W1) g
Bulk Density (Pb) (W2-W1)/x g/cm3
Container No. X PO S9 FY QP 4O OS JJ 3RD CE
Wt. of wet soil & container (g) 47.41 39.81 36.54 41.82 45.27 42.90 47.25 45.01 39.72 46.65
Wt. of Dry soil & container (g) 42.88 36.02 32.94 37.42 40.32 38.21 41.34 39.32 35.46 40.91
Wt. of Container (g) 17.63 15.45 14.56 15.15 17.02 16.45 16.88 16.12 18.41 18.02
Wt. of dry soil (Wd) g 25.25 20.57 18.38 22.27 23.30 21.76 24.46 23.20 17.05 22.89
Wt. of Moisture (Wm) g 4.53 3.79 3.60 4.40 4.95 4.69 5.91 5.69 4.26 5.74
Moistur Content 100(Wm/Wd) % 17.94 18.42 19.59 19.76 21.24 21.55 24.16 24.53 24.99 25.08
Average Moisture Content (m) %
Dry Density = Pb/1+ (m/100) (g/cm3)
C.B.R. (mseen of top & bottom) %1.401.37 1.47 1.48 1.43
MOISTURE CONTENT DETERMINATIONS for B.S. Mould, X = 1000cm3
18.18 19.67 21.40 24.34 25.03
1750.00
1.76
6465.00
4722.00
1743.00
1.75
6495.00
4722.00
1773.00
1.78
6340.00
4722.00
1618.00
1.62
6510.00
4722.00
1788.00
1.80
6472.00
4722.00
DETERMINATION OF THE MOISTURE/DENSITY RELATION OF SOILUSING STANDARD/HEAVY COMPACTION
Job… OKOMU Sample No:....STORAGE TANK, BH6... Operator…………
3g/cm1.48MDD:…2018/05/25…:Date……m4.0…Dept....…Site
Amount retained on 20mm B.S. Sieve……… Total weight of Sample…… OPT.MC:20.8%
B.S. / C.B.R. Mould……4722g……………...............................
1.20
1.30
1.40
1.50
1.60
1.70
17 18 19 20 21 22 23 24 25 26
DR
Y D
EN
SIT
Y g
/cm
3
AVERAGE MOISTURE CONTENT
COMPACTION
198

Wt. of mould & wet Soil (W2) g
Wt. of mould (W1) g
Wt. of wet soil (W2-W1) g
Bulk Density (Pb) (W2-W1)/x g/cm3
Container No. RO JA BA FZ UO NO SL JI FU 7Z
Wt. of wet soil & container (g) 45.70 46.45 47.81 49.48 50.79 46.26 44.38 54.92 49.92 47.70
Wt. of Dry soil & container (g) 41.07 41.93 42.43 44.20 44.60 40.53 38.97 47.39 43.68 41.99
Wt. of Container (g) 16.45 18.11 15.73 17.36 17.41 14.37 14.16 16.53 17.89 18.42
Wt. of dry soil (Wd) g 24.62 23.82 26.70 26.84 27.19 26.16 24.81 30.86 25.79 23.57
Wt. of Moisture (Wm) g 4.63 4.52 5.38 5.28 6.19 5.73 5.41 7.53 6.24 5.71
Moistur Content 100(Wm/Wd) % 18.81 18.98 20.15 19.67 22.77 21.90 21.81 24.40 24.20 24.23
Average Moisture Content (m) %
Dry Density = Pb/1+ (m/100) (g/cm3)
C.B.R. (mseen of top & bottom) %1.391.33 1.45 1.47 1.43
MOISTURE CONTENT DETERMINATIONS for B.S. Mould, X = 1000cm3
18.89 19.91 22.33 23.10 24.21
1731.00
1.74
6443.00
4722.00
1721.00
1.73
6478.00
4722.00
1756.00
1.76
6295.00
4722.00
1573.00
1.58
6515.00
4722.00
1793.00
1.80
6453.00
4722.00
DETERMINATION OF THE MOISTURE/DENSITY RELATION OF SOILUSING STANDARD/HEAVY COMPACTION
Job… OKOMU Sample No:....STORAGE TANK, BH6... Operator…………
3g/cm1.50MDD:…2018/05/25…:Date……m7.0Dept....…Site
Amount retained on 20mm B.S. Sieve……… Total weight of Sample…… OPT.MC:21.2%
B.S. / C.B.R. Mould……4722g……………...............................
1.20
1.30
1.40
1.50
1.60
1.70
18 19 20 21 22 23 24 25
DR
Y D
EN
SIT
Y g
/cm
3
AVERAGE MOISTURE CONTENT
COMPACTION
199

Wt. of mould & wet Soil (W2) g
Wt. of mould (W1) g
Wt. of wet soil (W2-W1) g
Bulk Density (Pb) (W2-W1)/x g/cm3
Container No. LO F3 BA 4O Z S4 EX JA OB SI
Wt. of wet soil & container (g) 51.97 53.70 49.02 55.12 51.44 58.28 58.14 57.48 53.66 50.83
Wt. of Dry soil & container (g) 46.05 48.02 43.64 48.56 44.65 50.12 50.27 49.20 46.20 44.05
Wt. of Container (g) 15.97 18.03 17.93 17.45 15.24 14.30 18.47 15.50 18.33 17.98
Wt. of dry soil (Wd) g 30.08 29.99 25.71 31.11 29.41 35.82 31.80 33.70 27.87 26.07
Wt. of Moisture (Wm) g 5.92 5.68 5.38 6.56 6.79 8.16 7.87 8.28 7.46 6.78
Moistur Content 100(Wm/Wd) % 19.68 18.94 20.93 21.09 23.09 22.78 24.75 24.57 26.77 26.01
Average Moisture Content (m) %
Dry Density = Pb/1+ (m/100) (g/cm3)
C.B.R. (mseen of top & bottom) %1.371.36 1.48 1.48 1.42
MOISTURE CONTENT DETERMINATIONS for B.S. Mould, X = 1000cm3
19.31 21.01 22.93 24.66 26.39
1785.00
1.79
6450.00
4722.00
1728.00
1.74
6480.00
4722.00
1758.00
1.77
6335.00
4722.00
1613.00
1.62
6530.00
4722.00
1808.00
1.82
6507.00
4722.00
DETERMINATION OF THE MOISTURE/DENSITY RELATION OF SOILUSING STANDARD/HEAVY COMPACTION
Job… OKOMU Sample No:....STORAGE TANK, BH6... Operator……
3g/cm1.49MDD:…2018/05/25…:Date……m13.0Dept........…Site
Amount retained on 20mm B.S. Sieve……… Total weight of Sample…… OPT.MC:21.9%
B.S. / C.B.R. Mould……4722g……………...............................
1.30
1.40
1.50
1.60
19 20 21 22 23 24 25 26 27
DR
Y D
EN
SIT
Y g
/cm
3
AVERAGE MOISTURE CONTENT
COMPACTION
200

Wt. of mould & wet Soil (W2) g
Wt. of mould (W1) g
Wt. of wet soil (W2-W1) g
Bulk Density (Pb) (W2-W1)/x g/cm3
Container No. BF BA OG JO DO LO VI MO OT T
Wt. of wet soil & container (g) 53.90 49.40 51.10 52.93 46.77 42.75 58.62 54.91 52.58 60.06
Wt. of Dry soil & container (g) 47.84 44.04 45.03 46.50 41.06 37.91 50.27 47.16 44.86 51.40
Wt. of Container (g) 18.80 17.80 18.02 17.46 17.78 18.28 18.18 17.40 16.90 19.18
Wt. of dry soil (Wd) g 29.04 26.24 27.01 29.04 23.28 19.63 32.09 29.76 27.96 32.22
Wt. of Moisture (Wm) g 6.06 5.36 6.07 6.43 5.71 4.84 8.35 7.75 7.72 8.66
Moistur Content 100(Wm/Wd) % 20.87 20.43 22.47 22.14 24.53 24.66 26.02 26.04 27.61 26.88
Average Moisture Content (m) %
Dry Density = Pb/1+ (m/100) (g/cm3)
C.B.R. (mseen of top & bottom) %1.331.38 1.46 1.46 1.38
MOISTURE CONTENT DETERMINATIONS for B.S. Mould, X = 1000cm3
20.65 22.31 24.59 26.03 27.24
1773.00
1.78
6410.00
4722.00
1688.00
1.70
6457.00
4722.00
1735.00
1.74
6385.00
4722.00
1663.00
1.67
6538.00
4722.00
1816.00
1.82
6495.00
4722.00
DETERMINATION OF THE MOISTURE/DENSITY RELATION OF SOILUSING STANDARD/HEAVY COMPACTION
Job… OKOMU Sample No:....STORAGE TANK, BH6... Operator……
3g/cm1.49MDD:…2018/05/25…:Date……m15.0Dept........…Site
Amount retained on 20mm B.S. Sieve……… Total weight of Sample…… OPT.MC:23.5%
B.S. / C.B.R. Mould……4722g……………...............................
1.30
1.40
1.50
1.60
20 21 22 23 24 25 26 27 28
DR
Y D
EN
SIT
Y g
/cm
3
AVERAGE MOISTURE CONTENT
COMPACTION
201

Wt. of mould & wet Soil (W2) g
Wt. of mould (W1) g
Wt. of wet soil (W2-W1) g
Bulk Density (Pb) (W2-W1)/x g/cm3
Container No. 6T OO MQ TF WI H4 OK D X AI
Wt. of wet soil & container (g) 52.10 55.30 46.20 48.70 49.90 55.70 54.30 49.40 53.90 40.10
Wt. of Dry soil & container (g) 45.93 48.92 40.76 42.40 43.06 48.70 46.47 42.80 46.09 33.14
Wt. of Container (g) 16.20 17.80 16.30 14.20 16.50 17.40 16.40 17.70 18.00 7.50
Wt. of dry soil (Wd) g 29.73 31.12 24.46 28.20 26.56 31.30 30.07 25.10 28.09 25.64
Wt. of Moisture (Wm) g 6.17 6.38 5.44 6.30 6.84 7.00 7.83 6.60 7.81 6.96
Moistur Content 100(Wm/Wd) % 20.75 20.50 22.24 22.34 25.75 22.36 26.04 26.29 27.80 27.15
Average Moisture Content (m) %
Dry Density = Pb/1+ (m/100) (g/cm3)
C.B.R. (mseen of top & bottom) %
6385.00
4720.00
1665.00
1.67
6545.00
4720.00
1825.00
1.83
6518.00
4720.00
1798.00
1.81
6451.00
4720.00
1731.00
1.74
6490.00
4720.00
1770.00
1.78
1.39 1.48 1.48 1.41
MOISTURE CONTENT DETERMINATIONS for B.S. Mould, X = 1000cm3
20.63 22.29 24.06 26.17 27.47
1.36
DETERMINATION OF THE MOISTURE/DENSITY RELATION OF SOILUSING STANDARD/HEAVY COMPACTION
Job… OKOMU Sample No:....WATER TANK, BH8.. Operator…………
3g/cm1.49MDD:…2018/05/25…:Date……m9.0…Dept....…Site
Amount retained on 20mm B.S. Sieve……… Total weight of Sample…… OPT.MC:23.2%
B.S. / C.B.R. Mould……4720g……………...............................
1.30
1.40
1.50
1.60
1.70
20 21 22 23 24 25 26 27 28
DR
Y D
EN
SIT
Y g
/cm
3
AVERAGE MOISTURE CONTENT
COMPACTION
202

Wt. of mould & wet Soil (W2) g
Wt. of mould (W1) g
Wt. of wet soil (W2-W1) g
Bulk Density (Pb) (W2-W1)/x g/cm3
Container No. AH AI EX BA FA I9 AA IK BO NA
Wt. of wet soil & container (g) 50.72 42.51 47.72 50.34 46.97 54.00 53.36 57.92 49.51 46.63
Wt. of Dry soil & container (g) 45.54 37.90 42.39 44.62 41.80 47.77 46.87 50.63 42.99 40.81
Wt. of Container (g) 17.31 13.98 15.89 16.73 17.87 19.47 19.30 18.88 16.04 15.81
Wt. of dry soil (Wd) g 28.23 23.92 26.50 27.89 23.93 28.30 27.57 31.75 26.95 25.00
Wt. of Moisture (Wm) g 5.18 4.61 5.33 5.72 5.17 6.23 6.49 7.29 6.52 5.82
Moistur Content 100(Wm/Wd) % 18.35 19.27 20.11 20.51 21.60 22.01 23.54 22.96 24.19 23.28
Average Moisture Content (m) %
Dry Density = Pb/1+ (m/100) (g/cm3)
C.B.R. (mseen of top & bottom) %
6378.00
4720.00
1658.00
1.67
6638.00
4720.00
1918.00
1.93
6534.00
4720.00
1814.00
1.82
6540.00
4720.00
1820.00
1.83
6575.00
4720.00
1855.00
1.86
1.40 1.51 1.58 1.51
MOISTURE CONTENT DETERMINATIONS for B.S. Mould, X = 1000cm3
18.81 20.31 21.81 23.25 23.74
1.48
DETERMINATION OF THE MOISTURE/DENSITY RELATION OF SOILUSING STANDARD/HEAVY COMPACTION
Job… OKOMU Sample No:....WATER TANK, BH8.. Operator…………
3g/cm1.58MDD:…2018/05/25…:Date……m15.0…Dept....…Site
Amount retained on 20mm B.S. Sieve……… Total weight of Sample…… OPT.MC:21.8%
B.S. / C.B.R. Mould……4720g……………...............................
1.30
1.40
1.50
1.60
1.70
1.80
18 19 20 21 22 23 24
DR
Y D
EN
SIT
Y g
/cm
3
AVERAGE MOISTURE CONTENT
COMPACTION
203

Wt. of mould & wet Soil (W2) g
Wt. of mould (W1) g
Wt. of wet soil (W2-W1) g
Bulk Density (Pb) (W2-W1)/x g/cm3
Container No. AZ OR ZO CA PO SU E3 O5 AB JO
Wt. of wet soil & container (g) 47.70 45.80 43.60 49.90 56.00 48.60 57.40 54.40 46.66 46.18
Wt. of Dry soil & container (g) 42.48 41.23 38.86 44.42 48.82 42.87 50.21 46.37 40.89 40.36
Wt. of Container (g) 15.11 16.61 16.12 18.32 17.51 18.01 20.03 13.70 18.41 17.12
Wt. of dry soil (Wd) g 27.37 24.62 22.74 26.10 31.31 24.86 30.18 32.67 22.48 23.24
Wt. of Moisture (Wm) g 5.22 4.57 4.74 5.48 7.18 5.73 7.19 8.03 5.77 5.82
Moistur Content 100(Wm/Wd) % 19.07 18.56 20.84 21.00 22.93 23.05 23.82 24.58 25.67 25.04
Average Moisture Content (m) %
Dry Density = Pb/1+ (m/100) (g/cm3)
C.B.R. (mseen of top & bottom) %1.381.42 1.51 1.50 1.42
MOISTURE CONTENT DETERMINATIONS for B.S. Mould, X = 1000cm3
18.82 20.92 22.99 24.20 25.36
1816.00
1.82
6445.00
4722.00
1723.00
1.73
6475.00
4722.00
1753.00
1.76
6398.00
4722.00
1676.00
1.68
6558.00
4722.00
1836.00
1.84
6538.00
4722.00
DETERMINATION OF THE MOISTURE/DENSITY RELATION OF SOILUSING STANDARD/HEAVY COMPACTION
Job… OKOMU Sample No:....WATER TANK, BH8... Operator…………
3g/cm1.48MDD:…2018/05/25…:Date……m3.0…Dept....…Site
Amount retained on 20mm B.S. Sieve……… Total weight of Sample…… OPT.MC:26.4%
B.S. / C.B.R. Mould……4722g……………...............................
1.30
1.40
1.50
1.60
1.70
18 19 20 21 22 23 24 25 26
DR
Y D
EN
SIT
Y g
/cm
3
AVERAGE MOISTURE CONTENT
COMPACTION
204

Wt. of mould & wet Soil (W2) g
Wt. of mould (W1) g
Wt. of wet soil (W2-W1) g
Bulk Density (Pb) (W2-W1)/x g/cm3
Container No. ZO JA E3 EI PZ OO JA OX OG SU
Wt. of wet soil & container (g) 52.10 57.30 55.20 52.70 54.20 48.30 47.60 52.30 53.10 49.00
Wt. of Dry soil & container (g) 45.45 49.80 47.45 45.60 46.40 41.60 40.55 44.80 45.10 41.70
Wt. of Container (g) 17.40 17.30 17.60 17.20 17.60 17.60 16.10 18.70 18.30 17.00
Wt. of dry soil (Wd) g 28.05 32.50 29.85 28.40 28.80 24.00 24.45 26.10 26.80 24.70
Wt. of Moisture (Wm) g 6.65 7.50 7.75 7.10 7.80 6.70 7.05 7.50 8.00 7.30
Moistur Content 100(Wm/Wd) % 23.71 23.08 25.96 25.00 27.08 27.92 28.83 28.74 29.85 29.55
Average Moisture Content (m) %
Dry Density = Pb/1+ (m/100) (g/cm3)
C.B.R. (mseen of top & bottom) %
4920.00
3252.00
1668.00
1.68
5097.00
3252.00
1845.00
1.85
5076.00
3252.00
1824.00
1.83
4929.00
3252.00
1677.00
1.68
5001.00
3252.00
1749.00
1.76
1.36 1.46 1.45 1.36
MOISTURE CONTENT DETERMINATIONS for B.S. Mould, X = 1000cm3
23.39 25.48 27.50 28.78 29.70
1.30
DETERMINATION OF THE MOISTURE/DENSITY RELATION OF SOILUSING STANDARD/HEAVY COMPACTION
Job… OKOMU Sample No:....WATER TANK, BH8... Operator…………
3g/cm1.48MDD:…2018/05/25…:Date……m6.0…Dept....…Site
Amount retained on 20mm B.S. Sieve……… Total weight of Sample…… OPT.MC:26.4%
B.S. / C.B.R. Mould……3252g……………...............................
1.20
1.30
1.40
1.50
1.60
1.70
23 24 25 26 27 28 29 30
DR
Y D
EN
SIT
Y g
/cm
3
AVERAGE MOISTURE CONTENT
COMPACTION
205

Wt. of mould & wet Soil (W2) g
Wt. of mould (W1) g
Wt. of wet soil (W2-W1) g
Bulk Density (Pb) (W2-W1)/x g/cm3
Container No. TI SO 7O M JA ZE OO SK TK I4
Wt. of wet soil & container (g) 45.66 49.42 43.66 54.58 42.82 53.39 45.87 56.74 43.74 55.08
Wt. of Dry soil & container (g) 40.83 43.84 39.29 48.24 37.54 47.13 40.36 49.50 37.96 48.01
Wt. of Container (g) 17.85 15.63 18.97 18.24 14.37 19.13 16.70 18.12 15.19 19.25
Wt. of dry soil (Wd) g 22.98 28.21 20.32 30.00 23.17 28.00 23.66 31.38 22.77 28.76
Wt. of Moisture (Wm) g 4.83 5.58 4.37 6.34 5.28 6.26 5.51 7.24 5.78 7.07
Moistur Content 100(Wm/Wd) % 21.02 19.78 21.51 21.13 22.79 22.36 23.29 23.07 25.38 24.58
Average Moisture Content (m) %
Dry Density = Pb/1+ (m/100) (g/cm3)
C.B.R. (mseen of top & bottom) %1.401.39 1.47 1.46 1.44
MOISTURE CONTENT DETERMINATIONS for B.S. Mould, X = 1000cm3
20.40 21.32 22.57 23.18 24.98
1775.00
1.78
6460.00
4720.00
1740.00
1.75
6492.00
4720.00
1772.00
1.78
6385.00
4720.00
1665.00
1.67
6505.00
4720.00
1785.00
1.79
6495.00
4720.00
DETERMINATION OF THE MOISTURE/DENSITY RELATION OF SOILUSING STANDARD/HEAVY COMPACTION
Job… OKOMU Sample No:....WATER TANK, BH8... Operator…………
3g/cm1.48MDD:…2018/05/25…:Date……m12.0…Dept....…Site
Amount retained on 20mm B.S. Sieve……… Total weight of Sample…… OPT.MC:21.7%
B.S. / C.B.R. Mould……4720g……………...............................
1.20
1.30
1.40
1.50
1.60
1.70
20 21 22 23 24 25
DR
Y D
EN
SIT
Y g
/cm
3
AVERAGE MOISTURE CONTENT
COMPACTION
206

Wt. of mould & wet Soil (W2) g
Wt. of mould (W1) g
Wt. of wet soil (W2-W1) g
Bulk Density (Pb) (W2-W1)/x g/cm3
Container No. PE JO SI BO LO BA OG EB CU HO
Wt. of wet soil & container (g) 53.56 51.38 49.64 51.08 53.04 50.90 52.92 54.61 45.95 48.62
Wt. of Dry soil & container (g) 47.32 45.37 43.82 45.15 45.88 44.37 46.09 46.94 39.88 42.60
Wt. of Container (g) 17.32 16.95 17.99 18.23 15.98 17.86 18.19 17.34 17.36 17.48
Wt. of dry soil (Wd) g 30.00 28.42 25.83 26.92 29.90 26.51 27.90 29.60 22.52 25.12
Wt. of Moisture (Wm) g 6.24 6.01 5.82 5.93 7.16 6.53 6.83 7.67 6.07 6.02
Moistur Content 100(Wm/Wd) % 20.80 21.15 22.53 22.03 23.95 24.63 24.48 25.91 26.95 23.96
Average Moisture Content (m) %
Dry Density = Pb/1+ (m/100) (g/cm3)
C.B.R. (mseen of top & bottom) %
4968.00
3248.00
1720.00
1.73
5119.00
3248.00
1871.00
1.88
5074.00
3248.00
1826.00
1.83
4959.00
3248.00
1711.00
1.72
5003.00
3248.00
1755.00
1.76
1.43 1.50 1.51 1.41
MOISTURE CONTENT DETERMINATIONS for B.S. Mould, X = 1000cm3
20.97 22.28 24.29 25.20 25.46
1.37
DETERMINATION OF THE MOISTURE/DENSITY RELATION OF SOILUSING STANDARD/HEAVY COMPACTION
Job… OKOMU Sample No:....WEIGH BRIDGE, BH7... Operator…………
3g/cm1.55MDD:…2018/05/25…:Date……m15.0…Dept....…Site
Amount retained on 20mm B.S. Sieve……… Total weight of Sample…… OPT.MC:23.4%
B.S. / C.B.R. Mould……3248g……………...............................
1.20
1.30
1.40
1.50
1.60
1.70
1.80
20 21 22 23 24 25 26
DR
Y D
EN
SIT
Y g
/cm
3
AVERAGE MOISTURE CONTENT
COMPACTION
207

Wt. of mould & wet Soil (W2) g
Wt. of mould (W1) g
Wt. of wet soil (W2-W1) g
Bulk Density (Pb) (W2-W1)/x g/cm3
Container No. EI Z8 PB SG WO IO OX 4M 3A OF
Wt. of wet soil & container (g) 51.87 53.72 50.36 53.84 48.30 49.83 48.87 48.85 51.68 46.89
Wt. of Dry soil & container (g) 46.18 48.01 44.20 47.58 42.16 43.51 42.30 41.96 44.51 40.78
Wt. of Container (g) 17.82 19.65 16.71 19.49 17.03 17.67 17.17 15.44 17.21 17.54
Wt. of dry soil (Wd) g 28.36 28.36 27.49 28.09 25.13 25.84 25.13 26.52 27.30 23.24
Wt. of Moisture (Wm) g 5.69 5.71 6.16 6.26 6.14 6.32 6.57 6.89 7.17 6.11
Moistur Content 100(Wm/Wd) % 20.06 20.13 22.41 22.29 24.43 24.46 26.14 25.98 26.26 26.29
Average Moisture Content (m) %
Dry Density = Pb/1+ (m/100) (g/cm3)
C.B.R. (mseen of top & bottom) %1.361.46 1.50 1.50 1.39
MOISTURE CONTENT DETERMINATIONS for B.S. Mould, X = 1000cm3
20.10 22.35 24.45 26.06 26.28
1831.00
1.84
4964.00
3252.00
1712.00
1.72
4997.00
3252.00
1745.00
1.75
5004.00
3252.00
1752.00
1.76
5115.00
3252.00
1863.00
1.87
5083.00
3252.00
DETERMINATION OF THE MOISTURE/DENSITY RELATION OF SOILUSING STANDARD/HEAVY COMPACTION
Job… OKOMU Sample No:....WEIGH BRIDGE, BH7... Operator…………
3g/cm1.52MDD:…2018/05/25…:Date……m4.0…Dept....…Site
Amount retained on 20mm B.S. Sieve……… Total weight of Sample…… OPT.MC:23.5%
B.S. / C.B.R. Mould……3252g……………...............................
1.30
1.40
1.50
1.60
1.70
19 20 21 22 23 24 25 26 27
DR
Y D
EN
SIT
Y g
/cm
3
AVERAGE MOISTURE CONTENT
COMPACTION
208

Wt. of mould & wet Soil (W2) g
Wt. of mould (W1) g
Wt. of wet soil (W2-W1) g
Bulk Density (Pb) (W2-W1)/x g/cm3
Container No. 4TH OQ LH LA GB AZ F4 SU SO TA
Wt. of wet soil & container (g) 49.93 35.97 57.74 63.75 52.58 52.88 51.03 43.88 50.47 62.58
Wt. of Dry soil & container (g) 44.65 32.44 50.38 55.30 45.45 45.90 43.51 37.73 42.77 52.49
Wt. of Container (g) 19.33 15.17 18.18 17.25 15.85 17.20 15.46 14.78 15.69 17.35
Wt. of dry soil (Wd) g 25.32 17.27 32.20 38.05 29.60 28.70 28.05 22.95 27.08 35.14
Wt. of Moisture (Wm) g 5.28 3.53 7.36 8.45 7.13 6.98 7.52 6.15 7.70 10.09
Moistur Content 100(Wm/Wd) % 20.85 20.44 22.86 22.21 24.09 24.32 26.81 26.80 28.43 28.71
Average Moisture Content (m) %
Dry Density = Pb/1+ (m/100) (g/cm3)
C.B.R. (mseen of top & bottom) %1.371.32 1.40 1.45 1.41
MOISTURE CONTENT DETERMINATIONS for B.S. Mould, X = 1000cm3
20.65 22.53 24.20 26.80 28.57
1704.00
1.71
6473.00
4722.00
1751.00
1.76
6505.00
4722.00
1783.00
1.79
6306.00
4722.00
1584.00
1.59
6521.00
4722.00
1799.00
1.81
6426.00
4722.00
DETERMINATION OF THE MOISTURE/DENSITY RELATION OF SOILUSING STANDARD/HEAVY COMPACTION
Job… OKOMU Sample No:....WEIGH BRIDGE, BH9.. Operator…………
3g/cm1.46MDD:…2018/05/25…:Date……m10.0…Dept....…Site
Amount retained on 20mm B.S. Sieve……… Total weight of Sample…… OPT.MC:24.7%
B.S. / C.B.R. Mould……4722g……………...............................
1.20
1.30
1.40
1.50
1.60
1.70
20 21 22 23 24 25 26 27 28 29
DR
Y D
EN
SIT
Y g
/cm
3
AVERAGE MOISTURE CONTENT
COMPACTION
209

Wt. of mould & wet Soil (W2) g
Wt. of mould (W1) g
Wt. of wet soil (W2-W1) g
Bulk Density (Pb) (W2-W1)/x g/cm3
Container No. CU AN F5 CO PM OK HO PO GS SE Z UL
Wt. of wet soil & container (g) 40.92 52.24 52.97 64.36 53.48 56.87 55.64 53.84 49.95 45.90 49.80 49.89
Wt. of Dry soil & container (g) 37.53 47.59 47.87 57.30 47.81 50.16 49.12 47.09 43.97 40.21 43.53 43.54
Wt. of Container (g) 17.42 19.92 19.08 17.46 18.25 15.64 18.41 15.44 18.01 15.72 18.17 17.90
Wt. of dry soil (Wd) g 20.11 27.67 28.79 39.84 29.56 34.52 30.71 31.65 25.96 24.49 25.36 25.64
Wt. of Moisture (Wm) g 3.39 4.65 5.10 7.06 5.67 6.71 6.52 6.75 5.98 5.69 6.27 6.35
Moistur Content 100(Wm/Wd) % 16.86 16.81 17.71 17.72 19.18 19.44 21.23 21.33 23.04 23.23 24.72 24.77
Average Moisture Content (m) %
Dry Density = Pb/1+ (m/100) (g/cm3)
C.B.R. (mseen of top & bottom) %
6240.00
4720.00
1520.00
1.53
6495.00
4720.00
1775.00
1.78
6387.00
4720.00
1667.00
1.67
6495.00
4720.00
1775.00
1.78
6522.00
4720.00
1802.00
1.81
24.74
6470.00
4720.00
1750.00
1.76
1.31 1.42 1.49 1.49
MOISTURE CONTENT DETERMINATIONS for B.S. Mould, X = 1000cm3
16.83 17.72 19.31 21.28 23.13
1.45 1.41
DETERMINATION OF THE MOISTURE/DENSITY RELATION OF SOILUSING STANDARD/HEAVY COMPACTION
Job… OKOMU Sample No:....WEIGH BRIGDE, BH7.. Operator…………
3g/cm1.50MDD:…2018/05/25…:Date……m1.0…Dept....…Site
Amount retained on 20mm B.S. Sieve……… Total weight of Sample…… OPT.MC:20.0%
B.S. / C.B.R. Mould……4720g……………...............................
1.30
1.40
1.50
1.60
1.70
16 17 18 19 20 21 22 23 24 25 26
DR
Y D
EN
SIT
Y g
/cm
3
AVERAGE MOISTURE CONTENT
COMPACTION
210

Wt. of mould & wet Soil (W2) g
Wt. of mould (W1) g
Wt. of wet soil (W2-W1) g
Bulk Density (Pb) (W2-W1)/x g/cm3
Container No. WD KK 8Z N8 F6 EX PE AA BA F4
Wt. of wet soil & container (g) 47.31 49.00 45.79 46.77 55.71 52.36 55.89 50.70 52.02 48.30
Wt. of Dry soil & container (g) 42.34 44.00 40.86 41.58 48.56 45.92 48.00 44.16 44.94 41.99
Wt. of Container (g) 16.21 17.83 17.61 17.32 17.82 17.71 17.22 16.41 17.73 17.74
Wt. of dry soil (Wd) g 26.13 26.17 23.25 24.26 30.74 28.21 30.78 27.75 27.21 24.25
Wt. of Moisture (Wm) g 4.97 5.00 4.93 5.19 7.15 6.44 7.89 6.54 7.08 6.31
Moistur Content 100(Wm/Wd) % 19.02 19.11 21.20 21.39 23.26 22.83 25.63 23.57 26.02 26.02
Average Moisture Content (m) %
Dry Density = Pb/1+ (m/100) (g/cm3)
C.B.R. (mseen of top & bottom) %1.361.38 1.47 1.48 1.41
MOISTURE CONTENT DETERMINATIONS for B.S. Mould, X = 1000cm3
19.06 21.30 23.04 24.60 26.02
1773.00
1.78
6430.00
4722.00
1708.00
1.72
6475.00
4722.00
1753.00
1.76
6355.00
4722.00
1633.00
1.64
6535.00
4722.00
1813.00
1.82
6495.00
4722.00
DETERMINATION OF THE MOISTURE/DENSITY RELATION OF SOILUSING STANDARD/HEAVY COMPACTION
Job… OKOMU Sample No:....WEIGH BRIDGE, BH7... Operator……
3g/cm1.49MDD:…2018/05/25…:Date……m7.0Dept........…Site
Amount retained on 20mm B.S. Sieve……… Total weight of Sample…… OPT.MC:22.3%
B.S. / C.B.R. Mould……4722g……………...............................
1.30
1.40
1.50
1.60
19 20 21 22 23 24 25 26 27
DR
Y D
EN
SIT
Y g
/cm
3
AVERAGE MOISTURE CONTENT
COMPACTION
211
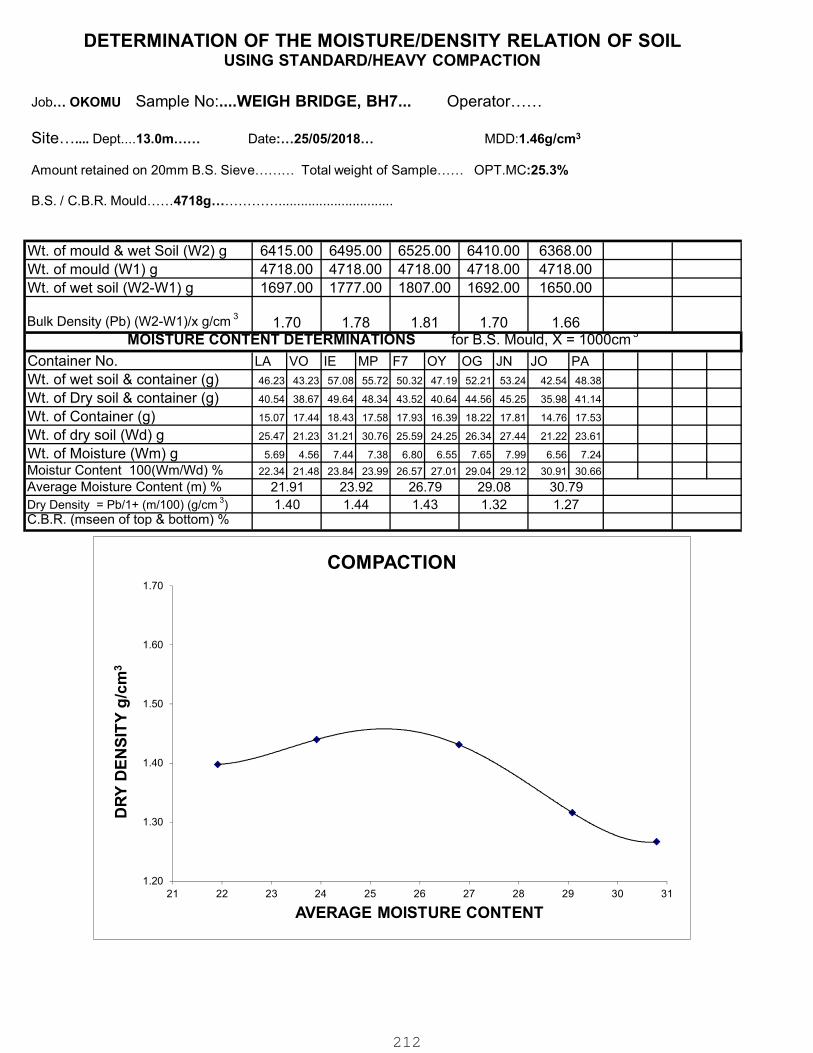
Wt. of mould & wet Soil (W2) g
Wt. of mould (W1) g
Wt. of wet soil (W2-W1) g
Bulk Density (Pb) (W2-W1)/x g/cm3
Container No. LA VO IE MP F7 OY OG JN JO PA
Wt. of wet soil & container (g) 46.23 43.23 57.08 55.72 50.32 47.19 52.21 53.24 42.54 48.38
Wt. of Dry soil & container (g) 40.54 38.67 49.64 48.34 43.52 40.64 44.56 45.25 35.98 41.14
Wt. of Container (g) 15.07 17.44 18.43 17.58 17.93 16.39 18.22 17.81 14.76 17.53
Wt. of dry soil (Wd) g 25.47 21.23 31.21 30.76 25.59 24.25 26.34 27.44 21.22 23.61
Wt. of Moisture (Wm) g 5.69 4.56 7.44 7.38 6.80 6.55 7.65 7.99 6.56 7.24
Moistur Content 100(Wm/Wd) % 22.34 21.48 23.84 23.99 26.57 27.01 29.04 29.12 30.91 30.66
Average Moisture Content (m) %
Dry Density = Pb/1+ (m/100) (g/cm3)
C.B.R. (mseen of top & bottom) %1.271.40 1.44 1.43 1.32
MOISTURE CONTENT DETERMINATIONS for B.S. Mould, X = 1000cm3
21.91 23.92 26.79 29.08 30.79
1777.00
1.78
6368.00
4718.00
1650.00
1.66
6410.00
4718.00
1692.00
1.70
6415.00
4718.00
1697.00
1.70
6525.00
4718.00
1807.00
1.81
6495.00
4718.00
DETERMINATION OF THE MOISTURE/DENSITY RELATION OF SOILUSING STANDARD/HEAVY COMPACTION
Job… OKOMU Sample No:....WEIGH BRIDGE, BH7... Operator……
3g/cm1.46MDD:…2018/05/25…:Date……m13.0Dept........…Site
Amount retained on 20mm B.S. Sieve……… Total weight of Sample…… OPT.MC:25.3%
B.S. / C.B.R. Mould……4718g……………...............................
1.20
1.30
1.40
1.50
1.60
1.70
21 22 23 24 25 26 27 28 29 30 31
DR
Y D
EN
SIT
Y g
/cm
3
AVERAGE MOISTURE CONTENT
COMPACTION
212

JEFFA GEOTECH
APPENDIX V
213

Strai
n Dial
Stress
Dial SD2 SD3
Stress
Dial Diff SDD2 SDD3
Area Sq
m
Compres
sive
Stress CS2 CS3
Strain
%
0 0 0 0 0.00 0.00 0.00 0.00114 0.00 0.00 0.00 0.00
15 4.7 3 6 0.02 0.01 0.03 0.00115 17.44 11.13 22.26 0.50
30 5.8 10 7.5 0.02 0.04 0.03 0.00115 21.52 37.11 27.83 1.00
45 6.5 11.9 8 0.03 0.05 0.03 0.00116 23.91 43.78 29.43 1.50
60 7.5 13.5 15.3 0.03 0.06 0.07 0.00116 27.59 49.66 56.28 2.00
75 8.3 14.9 17 0.04 0.06 0.07 0.00117 30.27 54.34 62.00 2.50
90 9 16 18.9 0.04 0.07 0.08 0.00118 32.55 57.86 68.35 3.00
105 9.8 17.3 20.5 0.04 0.07 0.09 0.00118 35.44 62.56 74.14 3.50
120 10.3 18.5 22 0.04 0.08 0.09 0.00119 36.94 66.34 78.89 4.00
135 11 20 23.3 0.05 0.09 0.10 0.00119 39.45 71.72 83.55 4.50
150 11.8 21.3 24.8 0.05 0.09 0.11 0.00120 41.96 75.75 88.19 5.00
165 12.5 22.5 26 0.05 0.10 0.11 0.00121 44.08 79.35 91.70 5.50
180 13 23.9 27.5 0.06 0.10 0.12 0.00121 45.85 84.29 96.99 6.00
210 14 26 29.8 0.06 0.11 0.13 0.00122 48.97 90.94 104.24 7.00
240 15 28.3 30.5 0.13 0.12 0.13 0.00124 103.24 97.39 104.96 8.00
270 30 30.5 33.8 0.07 0.13 0.14 0.00125 56.33 104.12 115.39 9.00
300 16.5 32 36 0.07 0.14 0.15 0.00127 58.80 107.52 120.96 10.00
330 17.5 33.5 37.5 0.08 0.14 0.16 0.00128 61.68 111.68 125.02 11.00
360 18.5 34.8 39.3 0.08 0.15 0.17 0.00130 62.37 114.23 129.01 12.00
390 19 36 41 0.08 0.15 0.17 0.00131 62.87 117.27 133.56 12.00
420 19.3 37 42 0.08 0.16 0.18 0.00131 62.87 120.53 136.82 13.00
450 19.3 38 43.1 0.08 0.16 0.18 0.00133 61.92 121.92 138.29 14.00
480 19.3 39 44 0.08 0.17 0.19 0.00134 61.46 124.20 140.12 15.00
510 19.3 40 44.5 0.08 0.17 0.19 0.00136 60.56 125.51 139.63 16.00
540 19.3 40.8 45 0.08 0.17 0.19 0.00137 60.12 127.09 140.17 17.00
570 19.3 41 45 0.08 0.17 0.19 0.00139 59.25 125.87 138.15 18.00
600 19.3 41.8 45 0.08 0.18 0.19 0.00139 59.25 128.33 138.15 19.00
630 19.3 42 45 0.08 0.18 0.19 0.00143 57.59 125.33 134.29 20.00
660 19.3 42.8 45 0.08 0.18 0.19 0.00144 57.19 126.84 133.35 21.00
690 19.3 43 45 0.08 0.18 0.19 0.00146 56.41 125.68 131.53 22.00
720 19.3 43.9 45 0.08 0.19 0.19 0.00150 54.91 124.89 128.02 24.00
750 19.3 44.8 45 0.08 0.19 0.19 0.00152 54.18 125.77 126.34 25.00
∂3 ∂2 ∂1 Radius Centre1 100.00 103.24 203.24 51.6212 151.621
0.00 28.55 38.46 44.70 48.68 50.90 51.62 50.90 48.68 44.70 38.46 28.55 0.00
100.00 108.62 117.19 125.81 134.43 143.00 151.62 160.24 168.81 177.43 186.05 194.62 203.24
2 205.00 128.33 333.33 64.1638 269.164
0.00 35.48 47.80 55.57 60.51 63.27 64.16 63.27 60.51 55.57 47.80 35.48 0.00
205.00 215.72 226.37 237.08 247.80 258.45 269.16 279.88 290.53 301.25 311.96 322.61 333.33
3 310.00 140.17 450.17 70.0842 380.084
0.00 38.76 52.21 60.69 66.09 69.10 70.08 69.10 66.09 60.69 52.21 38.76 0.00
310.00 321.70 333.34 345.04 356.75 368.38 380.08 391.79 403.42 415.13 426.83 438.46 450.17
38 110
0 700
GEOTECHNICAL ENGINEERING LABORATORY TEST
TRIAXIAL COMPRESSION TESTJOB…. OKOMU BOILER DATE…24/06/2018………
2KN/m310, 205, 100CELL PRESSURE:…… DIAMETER…… LENGTH…… m15.0,1BH… SAMPLE NO
FRICTION ANGLE:. ....5.88º..... COHESION:...38.0kN/m²..... WET WEIGHT:..142g,148g,152g.... DRY WEIGHTg,g.... MOISTURE CONTENT:..........
DESCRIPTION OF SAMPLE
……………………………………………………
…………………………………………………..
SKETCH OF SAMPLE AFTER SHEAR
Compressive Sress
Corresponding Strain
y = 0.1029x + 38
0
50
100
150
200
250
300
350
400
0 50 100 150 200 250 300 350 400 450 500 550 600 650 700
SH
EA
R
ST
RE
SS
(τ)
NORMAL STRESS(σ)
TRIAXIAL COMPRESSION TEST CHART
214

Strai
n Dial
Stress
Dial SD2 SD3
Stress
Dial Diff SDD2 SDD3
Area Sq
m
Compres
sive
Stress CS2 CS3
Strain
%
0 0 0 0 0.00 0.00 0.00 0.00114 0.00 0.00 0.00 0.00
15 1.5 1.2 2 0.01 0.01 0.01 0.00115 5.57 4.45 7.42 0.50
30 2 2 6 0.01 0.01 0.03 0.00115 7.42 7.42 22.26 1.00
45 2.5 3 8.5 0.01 0.01 0.04 0.00116 9.20 11.04 31.27 1.50
60 3 3.5 9 0.01 0.01 0.04 0.00116 11.04 12.88 33.11 2.00
75 3.5 4 10 0.01 0.02 0.04 0.00117 12.77 14.59 36.47 2.50
90 4 4.5 11 0.02 0.02 0.05 0.00118 14.47 16.27 39.78 3.00
105 4.8 5 11.5 0.02 0.02 0.05 0.00118 17.36 18.08 41.59 3.50
120 5.5 5.5 12 0.02 0.02 0.05 0.00119 19.72 19.72 43.03 4.00
135 6 6 12.5 0.03 0.03 0.05 0.00119 21.52 21.52 44.83 4.50
150 6.5 6.5 13.2 0.03 0.03 0.06 0.00120 23.11 23.11 46.94 5.00
165 7 7 14 0.03 0.03 0.06 0.00121 24.69 24.69 49.37 5.50
180 7.5 8 14.5 0.03 0.03 0.06 0.00121 26.45 28.21 51.14 6.00
210 8.5 9 15.8 0.04 0.04 0.07 0.00122 29.73 31.48 55.27 7.00
240 9.2 10 17 0.04 0.04 0.07 0.00124 34.41 34.41 58.50 8.00
270 10 10.5 18 0.05 0.04 0.08 0.00125 36.87 35.85 61.45 9.00
300 10.8 11 18.8 0.05 0.05 0.08 0.00127 36.96 36.96 63.17 10.00
330 11 11.5 19.5 0.05 0.05 0.08 0.00128 37.34 38.34 65.01 11.00
360 11.2 11.8 20 0.05 0.05 0.09 0.00130 37.75 38.73 65.65 12.00
390 11.5 12 20.5 0.05 0.05 0.09 0.00131 38.44 39.09 66.78 12.00
420 11.8 12 21 0.05 0.05 0.09 0.00131 38.44 39.09 68.41 13.00
450 11.8 12 21.5 0.05 0.05 0.09 0.00133 37.86 38.50 68.98 14.00
480 11.8 12 22 0.05 0.05 0.09 0.00134 37.58 38.22 70.06 15.00
510 11.8 12 22.2 0.05 0.05 0.09 0.00136 37.03 37.65 69.66 16.00
540 11.8 12 22.5 0.05 0.05 0.10 0.00137 36.76 37.38 70.08 17.00
570 11.8 12 22.5 0.05 0.05 0.10 0.00139 36.23 36.84 69.08 18.00
600 11.8 12 22.5 0.05 0.05 0.10 0.00139 36.23 36.84 69.08 19.00
630 11.8 12 22.5 0.05 0.05 0.10 0.00143 35.21 35.81 67.14 20.00
660 11.8 12 22.5 0.05 0.05 0.10 0.00144 34.97 35.56 66.68 21.00
690 11.8 12 22.5 0.05 0.05 0.10 0.00146 34.49 35.07 65.76 22.00
720 11.8 12 22.5 0.05 0.05 0.10 0.00150 33.57 34.14 64.01 24.00
750 11.8 12 22.5 0.05 0.05 0.10 0.00152 33.13 33.69 63.17 25.00
∂3 ∂2 ∂1 Radius Centre1 100.00 38.44 138.44 19.2194 119.219
0.00 10.63 14.32 16.64 18.12 18.95 19.22 18.95 18.12 16.64 14.32 10.63 0.00
100.00 103.21 106.40 109.61 112.82 116.01 119.22 122.43 125.62 128.83 132.04 135.23 138.44
2 205.00 39.09 244.09 19.5451 224.545
0.00 10.81 14.56 16.93 18.43 19.27 19.55 19.27 18.43 16.93 14.56 10.81 0.00
205.00 208.26 211.51 214.77 218.04 221.28 224.55 227.81 231.05 234.32 237.58 240.83 244.09
3 310.00 70.08 380.08 35.0421 345.042
0.00 19.38 26.11 30.35 33.04 34.55 35.04 34.55 33.04 30.35 26.11 19.38 0.00
310.00 315.85 321.67 327.52 333.37 339.19 345.04 350.89 356.71 362.56 368.42 374.23 380.08
11 60
0 700
GEOTECHNICAL ENGINEERING LABORATORY TEST
TRIAXIAL COMPRESSION TESTJOB…. OKOMU BOILER DATE…24/06/2018………
2KN/m310, 205, 100CELL PRESSURE:…… DIAMETER…… LENGTH…… m3.0,1BH… SAMPLE NO
FRICTION ANGLE:. ....4.00º..... COHESION:...11.0kN/m²..... WET WEIGHT:..135g,157g,156g.... DRY WEIGHTg,g.... MOISTURE CONTENT:..........
DESCRIPTION OF SAMPLE
……………………………………………………
…………………………………………………..
SKETCH OF SAMPLE AFTER SHEAR
Compressive Sress
Corresponding Strain
y = 0.07x + 11
0
20
40
60
80
100
120
140
160
180
200
0 50 100 150 200 250 300 350 400 450
SH
EA
R
ST
RE
SS
(τ)
NORMAL STRESS(σ)
TRIAXIAL COMPRESSION TEST CHART
215

Strai
n Dial
Stress
Dial SD2 SD3
Stress
Dial Diff SDD2 SDD3
Area Sq
m
Compres
sive
Stress CS2 CS3
Strain
%
0 0 0 0 0.00 0.00 0.00 0.00114 0.00 0.00 0.00 0.00
15 1 3 4 0.00 0.01 0.02 0.00115 3.71 11.13 14.84 0.50
30 1.5 4.5 7 0.01 0.02 0.03 0.00115 5.57 16.70 25.98 1.00
45 1.7 7 10 0.01 0.03 0.04 0.00116 6.25 25.75 36.79 1.50
60 2 9 12 0.01 0.04 0.05 0.00116 7.36 33.11 44.15 2.00
75 2.3 12 14 0.01 0.05 0.06 0.00117 8.39 43.77 51.06 2.50
90 2.8 14 16 0.01 0.06 0.07 0.00118 10.13 50.63 57.86 3.00
105 3 16 17.5 0.01 0.07 0.07 0.00118 10.85 57.86 63.29 3.50
120 4 18 19 0.02 0.08 0.08 0.00119 14.34 64.55 68.13 4.00
135 4.5 19.5 20 0.02 0.08 0.09 0.00119 16.14 69.93 71.72 4.50
150 5 21 21.5 0.02 0.09 0.09 0.00120 17.78 74.68 76.46 5.00
165 5.5 22 23 0.02 0.09 0.10 0.00121 19.40 77.59 81.11 5.50
180 6 23.5 24 0.03 0.10 0.10 0.00121 21.16 82.88 84.64 6.00
210 6.5 25.5 26 0.03 0.11 0.11 0.00122 22.74 89.19 90.94 7.00
240 7 27.5 28 0.03 0.12 0.12 0.00124 27.53 94.64 96.36 8.00
270 8 29 30 0.03 0.12 0.13 0.00125 27.99 99.00 102.42 9.00
300 8.2 30.2 32 0.04 0.13 0.14 0.00127 30.24 101.48 107.52 10.00
330 9 31.2 33.5 0.04 0.13 0.14 0.00128 30.67 104.02 111.68 11.00
360 9.2 32.5 35 0.04 0.14 0.15 0.00130 32.83 106.68 114.89 12.00
390 10 33.5 37 0.04 0.14 0.16 0.00131 33.23 109.13 120.53 12.00
420 10.2 34.5 38.5 0.05 0.15 0.16 0.00131 35.83 112.38 125.41 13.00
450 11 35 40 0.05 0.15 0.17 0.00133 36.90 112.30 128.34 14.00
480 11.5 36 42 0.05 0.15 0.18 0.00134 38.22 114.65 133.75 15.00
510 12 37 44 0.05 0.16 0.19 0.00136 39.22 116.10 138.06 16.00
540 12.5 38 45 0.06 0.16 0.19 0.00137 40.49 118.36 140.17 17.00
570 13 38.5 46 0.06 0.16 0.20 0.00139 41.45 118.20 141.22 18.00
600 13.5 39 47.5 0.06 0.17 0.20 0.00139 42.98 119.73 145.83 19.00
630 14 40 48.5 0.06 0.17 0.21 0.00143 43.27 119.37 144.73 20.00
660 14.5 40.8 49 0.07 0.17 0.21 0.00144 45.93 120.91 145.21 21.00
690 15.5 41.5 50.5 0.07 0.18 0.22 0.00146 46.77 121.30 147.60 22.00
720 16 42.5 51.5 0.07 0.18 0.22 0.00150 46.94 120.91 146.51 24.00
750 16.5 43 52.5 0.07 0.18 0.22 0.00152 46.32 120.72 147.39 25.00
∂3 ∂2 ∂1 Radius Centre1 100.00 46.94 146.94 23.4704 123.47
0.00 12.98 17.49 20.33 22.13 23.14 23.47 23.14 22.13 20.33 17.49 12.98 0.00
100.00 103.92 107.82 111.74 115.65 119.55 123.47 127.39 131.29 135.21 139.13 143.02 146.94
2 205.00 121.30 326.30 60.649 265.649
0.00 33.54 45.18 52.52 57.19 59.80 60.65 59.80 57.19 52.52 45.18 33.54 0.00
205.00 215.13 225.20 235.32 245.45 255.52 265.65 275.78 285.85 295.97 306.10 316.17 326.30
3 310.00 147.60 457.60 73.8018 383.802
0.00 40.81 54.98 63.91 69.60 72.77 73.80 72.77 69.60 63.91 54.98 40.81 0.00
310.00 322.32 334.58 346.90 359.23 371.48 383.80 396.13 408.38 420.70 433.03 445.28 457.60
29 100
0 600
GEOTECHNICAL ENGINEERING LABORATORY TEST
TRIAXIAL COMPRESSION TESTJOB…. OKOMU BOILER DATE…24/06/2018………
2KN/m310, 205, 100CELL PRESSURE:…… DIAMETER…… LENGTH…… m9.0,1BH… SAMPLE NO
FRICTION ANGLE:. ....6.73º..... COHESION:...29.0kN/m²..... WET WEIGHT:..157g,160g,157g.... DRY WEIGHTg,g.... MOISTURE CONTENT:..........
DESCRIPTION OF SAMPLE
……………………………………………………
…………………………………………………..
SKETCH OF SAMPLE AFTER SHEAR
Compressive Sress
Corresponding Strain
y = 0.1183x + 29
0
50
100
150
200
250
0 50 100 150 200 250 300 350 400 450 500 550 600
SH
EA
R
ST
RE
SS
(τ)
NORMAL STRESS(σ)
TRIAXIAL COMPRESSION TEST CHART
216

Strai
n Dial
Stress
Dial SD2 SD3
Stress
Dial Diff SDD2 SDD3
Area Sq
m
Compres
sive
Stress CS2 CS3
Strain
%
0 0 0 0 0.00 0.00 0.00 0.00114 0.00 0.00 0.00 0.00
15 4.7 3 6 0.02 0.01 0.03 0.00115 17.44 11.13 22.26 0.50
30 5.8 10 7.5 0.02 0.04 0.03 0.00115 21.52 37.11 27.83 1.00
45 6.5 11.9 8 0.03 0.05 0.03 0.00116 23.91 43.78 29.43 1.50
60 7.5 13.5 15.3 0.03 0.06 0.07 0.00116 27.59 49.66 56.28 2.00
75 8.3 14.9 17 0.04 0.06 0.07 0.00117 30.27 54.34 62.00 2.50
90 9 16 18.9 0.04 0.07 0.08 0.00118 32.55 57.86 68.35 3.00
105 9.8 17.3 20.5 0.04 0.07 0.09 0.00118 35.44 62.56 74.14 3.50
120 10.3 18.5 22 0.04 0.08 0.09 0.00119 36.94 66.34 78.89 4.00
135 11 20 23.3 0.05 0.09 0.10 0.00119 39.45 71.72 83.55 4.50
150 11.8 21.3 24.8 0.05 0.09 0.11 0.00120 41.96 75.75 88.19 5.00
165 12.5 22.5 26 0.05 0.10 0.11 0.00121 44.08 79.35 91.70 5.50
180 13 23.9 27.5 0.06 0.10 0.12 0.00121 45.85 84.29 96.99 6.00
210 14 26 29.8 0.06 0.11 0.13 0.00122 48.97 90.94 104.24 7.00
240 15 28.3 30.5 0.13 0.12 0.13 0.00124 103.24 97.39 104.96 8.00
270 30 30.5 33.8 0.07 0.13 0.14 0.00125 56.33 104.12 115.39 9.00
300 16.5 32 36 0.07 0.14 0.15 0.00127 58.80 107.52 120.96 10.00
330 17.5 33.5 37.5 0.08 0.14 0.16 0.00128 61.68 111.68 125.02 11.00
360 18.5 34.8 39.3 0.08 0.15 0.17 0.00130 62.37 114.23 129.01 12.00
390 19 36 41 0.08 0.15 0.17 0.00131 62.87 117.27 133.56 12.00
420 19.3 37 42 0.08 0.16 0.18 0.00131 62.87 120.53 136.82 13.00
450 19.3 38 43.1 0.08 0.16 0.18 0.00133 61.92 121.92 138.29 14.00
480 19.3 39 44 0.08 0.17 0.19 0.00134 61.46 124.20 140.12 15.00
510 19.3 40 44.5 0.08 0.17 0.19 0.00136 60.56 125.51 139.63 16.00
540 19.3 40.8 45 0.08 0.17 0.19 0.00137 60.12 127.09 140.17 17.00
570 19.3 41 45 0.08 0.17 0.19 0.00139 59.25 125.87 138.15 18.00
600 19.3 41.8 45 0.08 0.18 0.19 0.00139 59.25 128.33 138.15 19.00
630 19.3 42 45 0.08 0.18 0.19 0.00143 57.59 125.33 134.29 20.00
660 19.3 42.8 45 0.08 0.18 0.19 0.00144 57.19 126.84 133.35 21.00
690 19.3 43 45 0.08 0.18 0.19 0.00146 56.41 125.68 131.53 22.00
720 19.3 43.9 45 0.08 0.19 0.19 0.00150 54.91 124.89 128.02 24.00
750 19.3 44.8 45 0.08 0.19 0.19 0.00152 54.18 125.77 126.34 25.00
∂3 ∂2 ∂1 Radius Centre1 100.00 103.24 203.24 51.6212 151.621
0.00 28.55 38.46 44.70 48.68 50.90 51.62 50.90 48.68 44.70 38.46 28.55 0.00
100.00 108.62 117.19 125.81 134.43 143.00 151.62 160.24 168.81 177.43 186.05 194.62 203.24
2 205.00 128.33 333.33 64.1638 269.164
0.00 35.48 47.80 55.57 60.51 63.27 64.16 63.27 60.51 55.57 47.80 35.48 0.00
205.00 215.72 226.37 237.08 247.80 258.45 269.16 279.88 290.53 301.25 311.96 322.61 333.33
3 310.00 140.17 450.17 70.0842 380.084
0.00 38.76 52.21 60.69 66.09 69.10 70.08 69.10 66.09 60.69 52.21 38.76 0.00
310.00 321.70 333.34 345.04 356.75 368.38 380.08 391.79 403.42 415.13 426.83 438.46 450.17
38 110
0 700
GEOTECHNICAL ENGINEERING LABORATORY TEST
TRIAXIAL COMPRESSION TESTJOB…. OKOMU BOILER DATE…24/06/2018………
2KN/m310, 205, 100CELL PRESSURE:…… DIAMETER…… LENGTH…… m15.0,1BH… SAMPLE NO
FRICTION ANGLE:. ....5.88º..... COHESION:...38.0kN/m²..... WET WEIGHT:..142g,148g,152g.... DRY WEIGHTg,g.... MOISTURE CONTENT:..........
DESCRIPTION OF SAMPLE
……………………………………………………
…………………………………………………..
SKETCH OF SAMPLE AFTER SHEAR
Compressive Sress
Corresponding Strain
y = 0.1029x + 38
0
50
100
150
200
250
300
350
400
0 50 100 150 200 250 300 350 400 450 500 550 600 650 700
SH
EA
R
ST
RE
SS
(τ)
NORMAL STRESS(σ)
TRIAXIAL COMPRESSION TEST CHART
217

Strai
n Dial
Stress
Dial SD2 SD3
Stress
Dial Diff SDD2 SDD3
Area Sq
m
Compres
sive
Stress CS2 CS3
Strain
%
0 0 0 0 0.00 0.00 0.00 0.00114 0.00 0.00 0.00 0.00
15 7 5 6.5 0.03 0.02 0.03 0.00115 25.98 18.55 24.12 0.50
30 8 9 9.5 0.03 0.04 0.04 0.00115 29.69 33.40 35.25 1.00
45 10.3 14.9 21 0.04 0.06 0.09 0.00116 37.89 54.81 77.25 1.50
60 12.8 18 25 0.05 0.08 0.11 0.00116 47.09 66.22 91.97 2.00
75 14.5 20 27.5 0.06 0.09 0.12 0.00117 52.89 72.95 100.30 2.50
90 16.1 21.9 29 0.07 0.09 0.12 0.00118 58.22 79.20 104.88 3.00
105 18 23 30.5 0.08 0.10 0.13 0.00118 65.10 83.18 110.30 3.50
120 19.5 24 31.9 0.08 0.10 0.14 0.00119 69.93 86.06 114.39 4.00
135 21 25 33 0.09 0.11 0.14 0.00119 75.31 89.65 118.34 4.50
150 22.7 26 34.8 0.10 0.11 0.15 0.00120 80.72 92.46 123.75 5.00
165 24 27 36 0.10 0.12 0.15 0.00121 84.64 95.22 126.96 5.50
180 25.9 28.3 37.3 0.11 0.12 0.16 0.00121 91.34 99.81 131.55 6.00
210 28.2 30 40 0.12 0.13 0.17 0.00122 98.64 104.93 139.91 7.00
240 29.5 32 42.5 0.13 0.14 0.18 0.00124 103.24 110.13 146.26 8.00
270 30 33.9 45 0.13 0.14 0.19 0.00125 105.83 115.73 153.62 9.00
300 31 35 47.8 0.14 0.15 0.20 0.00127 107.52 117.60 160.61 10.00
330 32 36.5 50 0.14 0.16 0.21 0.00128 111.02 121.69 166.69 11.00
360 33.3 38 52.3 0.15 0.16 0.22 0.00130 111.61 124.74 171.68 12.00
390 34 39.3 54.8 0.15 0.17 0.23 0.00131 115.64 128.02 178.51 12.00
420 35.5 40.5 56.5 0.16 0.17 0.24 0.00131 118.90 131.93 184.05 13.00
450 36.5 41.3 58.5 0.16 0.18 0.25 0.00133 120.32 132.51 187.70 14.00
480 37.5 42.5 60 0.16 0.18 0.26 0.00134 121.97 135.35 191.08 15.00
510 38.3 43.9 61.9 0.17 0.19 0.26 0.00136 122.37 137.75 194.23 16.00
540 39 44.8 63.5 0.17 0.19 0.27 0.00137 123.04 139.55 197.79 17.00
570 39.5 45.3 65 0.17 0.19 0.28 0.00139 122.80 139.07 199.55 18.00
600 40 46 66.5 0.17 0.20 0.28 0.00139 125.87 141.22 204.16 19.00
630 41 46.8 67.5 0.18 0.20 0.29 0.00143 126.83 139.66 201.43 20.00
660 42.5 47.1 69 0.19 0.20 0.29 0.00144 130.09 139.58 204.48 21.00
690 43.9 47.9 69.9 0.19 0.20 0.30 0.00146 131.24 140.00 204.31 22.00
720 44.9 48.5 71 0.19 0.21 0.30 0.00150 129.73 137.98 201.99 24.00
750 45.6 49.5 72.5 0.19 0.21 0.31 0.00152 128.02 138.97 203.54 25.00
∂3 ∂2 ∂1 Radius Centre1 100.00 131.24 231.24 65.6178 165.618
0.00 36.29 48.89 56.83 61.88 64.70 65.62 64.70 61.88 56.83 48.89 36.29 0.00
100.00 110.96 121.85 132.81 143.77 154.66 165.62 176.58 187.47 198.43 209.38 220.28 231.24
2 205.00 141.22 346.22 70.6108 275.611
0.00 39.05 52.61 61.15 66.59 69.62 70.61 69.62 66.59 61.15 52.61 39.05 0.00
205.00 216.79 228.51 240.31 252.10 263.82 275.61 287.40 299.12 310.92 322.71 334.43 346.22
3 310.00 204.48 514.48 102.239 412.239
0.00 56.54 76.17 88.54 96.41 100.81 102.24 100.81 96.41 88.54 76.17 56.54 0.00
310.00 327.07 344.05 361.12 378.19 395.16 412.24 429.31 446.28 463.36 480.43 497.40 514.48
12 170
0 700
GEOTECHNICAL ENGINEERING LABORATORY TEST
TRIAXIAL COMPRESSION TESTJOB…. OKOMU POWER HOUSE DATE…24/06/2018………
2KN/m310, 205, 100CELL PRESSURE:…… DIAMETER…… LENGTH…… m2.0,2BH… SAMPLE NO
FRICTION ANGLE:. ....12.68º..... COHESION:...12.0kN/m²..... WET WEIGHT:..154g,156g,162g.... DRY WEIGHTg,g.... MOISTURE CONTENT:..........
DESCRIPTION OF SAMPLE
……………………………………………………
…………………………………………………..
SKETCH OF SAMPLE AFTER SHEAR
Compressive Sress
Corresponding Strain
y = 0.2257x + 12
0
50
100
150
200
250
300
350
400
0 50 100 150 200 250 300 350 400 450 500 550 600 650 700
SH
EA
R
ST
RE
SS
(τ)
NORMAL STRESS(σ)
TRIAXIAL COMPRESSION TEST CHART
218

Strai
n Dial
Stress
Dial SD2 SD3
Stress
Dial Diff SDD2 SDD3
Area Sq
m
Compres
sive
Stress CS2 CS3
Strain
%
0 0 0 0 0.00 0.00 0.00 0.00114 0.00 0.00 0.00 0.00
15 32 7 4.8 0.14 0.03 0.02 0.00115 118.74 25.98 17.81 0.50
30 34 11 8.5 0.15 0.05 0.04 0.00115 126.17 40.82 31.54 1.00
45 38 21.5 30 0.16 0.09 0.13 0.00116 139.79 79.09 110.36 1.50
60 39.5 27 31 0.17 0.12 0.13 0.00116 145.31 99.33 114.04 2.00
75 40 31 31 0.17 0.13 0.13 0.00117 145.89 113.07 113.07 2.50
90 41 33 31 0.17 0.14 0.13 0.00118 148.27 119.34 112.11 3.00
105 42 34 33 0.18 0.15 0.14 0.00118 151.89 122.96 119.34 3.50
120 42.5 35.5 33.5 0.18 0.15 0.14 0.00119 152.41 127.30 120.13 4.00
135 43 37 34 0.18 0.16 0.15 0.00119 154.20 132.68 121.92 4.50
150 43 38 36 0.18 0.16 0.15 0.00120 152.91 135.13 128.02 5.00
165 43 39 37 0.18 0.17 0.16 0.00121 151.65 137.54 130.49 5.50
180 43 40 37.5 0.18 0.17 0.16 0.00121 151.65 141.07 132.25 6.00
210 43 42 38 0.18 0.18 0.16 0.00122 150.41 146.91 132.92 7.00
240 43 43.5 38.5 0.18 0.19 0.16 0.00124 147.98 149.70 132.49 8.00
270 43 45 39 0.18 0.19 0.17 0.00125 146.80 153.62 133.14 9.00
300 43 47 39.5 0.18 0.20 0.17 0.00127 144.49 157.93 132.72 10.00
330 43 49 41 0.18 0.21 0.17 0.00128 143.36 163.36 136.69 11.00
360 43 50 43 0.18 0.21 0.18 0.00130 141.15 164.13 141.15 12.00
390 43 51.5 45 0.18 0.22 0.19 0.00131 140.07 167.76 146.59 12.00
420 43 53 47 0.18 0.23 0.20 0.00131 140.07 172.65 153.10 13.00
450 43 54 49 0.18 0.23 0.21 0.00133 137.97 173.26 157.22 14.00
480 43 55 50 0.18 0.23 0.21 0.00134 136.94 175.15 159.23 15.00
510 43 56 52 0.18 0.24 0.22 0.00136 134.92 175.71 163.16 16.00
540 43 57 53.5 0.18 0.24 0.23 0.00137 133.94 177.55 166.64 17.00
570 43 58 55 0.18 0.25 0.23 0.00139 132.01 178.06 168.85 18.00
600 43 58.8 57 0.18 0.25 0.24 0.00139 132.01 180.52 174.99 19.00
630 43 59.8 59 0.18 0.26 0.25 0.00143 128.32 178.45 176.07 20.00
660 43 60.8 61 0.18 0.26 0.26 0.00144 127.43 180.18 180.77 21.00
690 43 62 62 0.18 0.26 0.26 0.00146 125.68 181.22 181.22 22.00
720 43 62.5 64 0.18 0.27 0.27 0.00150 122.33 177.81 182.07 24.00
750 43 62.5 65 0.18 0.27 0.28 0.00152 120.72 175.47 182.49 25.00
∂3 ∂2 ∂1 Radius Centre1 100.00 154.20 254.20 77.0992 177.099
0.00 42.64 57.44 66.77 72.70 76.02 77.10 76.02 72.70 66.77 57.44 42.64 0.00
100.00 112.88 125.67 138.55 151.43 164.22 177.10 189.97 202.77 215.65 228.52 241.32 254.20
2 205.00 181.22 386.22 90.6081 295.608
0.00 50.11 67.50 78.47 85.44 89.34 90.61 89.34 85.44 78.47 67.50 50.11 0.00
205.00 220.13 235.17 250.30 265.44 280.48 295.61 310.74 325.78 340.91 356.04 371.08 386.22
3 310.00 182.49 492.49 91.2427 401.243
0.00 50.46 67.98 79.02 86.04 89.97 91.24 89.97 86.04 79.02 67.98 50.46 0.00
310.00 325.24 340.38 355.62 370.86 386.01 401.24 416.48 431.63 446.86 462.10 477.25 492.49
58 128
0 600
GEOTECHNICAL ENGINEERING LABORATORY TEST
TRIAXIAL COMPRESSION TESTJOB…. OKOMU POWER HOUSE DATE…24/06/2018………
2KN/m310, 205, 100CELL PRESSURE:…… DIAMETER…… LENGTH…… m5.0,2BH… SAMPLE NO
FRICTION ANGLE:. ....6.66º..... COHESION:... 58.0kN/m²..... WET WEIGHT:..160g,169g,166g.... DRY WEIGHTg,g.... MOISTURE CONTENT:..........
DESCRIPTION OF SAMPLE
……………………………………………………
…………………………………………………..
SKETCH OF SAMPLE AFTER SHEAR
Compressive Sress
Corresponding Strain
y = 0.1167x + 58
0
50
100
150
200
250
0 50 100 150 200 250 300 350 400 450 500 550 600
SH
EA
R
ST
RE
SS
(τ)
NORMAL STRESS(σ)
TRIAXIAL COMPRESSION TEST CHART
219

Strai
n Dial
Stress
Dial SD2 SD3
Stress
Dial Diff SDD2 SDD3
Area Sq
m
Compres
sive
Stress CS2 CS3
Strain
%
0 0 0 0 0.00 0.00 0.00 0.00114 0.00 0.00 0.00 0.00
15 8.2 6 15.8 0.03 0.03 0.07 0.00115 30.43 22.26 58.63 0.50
30 11 10 19 0.05 0.04 0.08 0.00115 40.82 37.11 70.50 1.00
45 13 17 21.2 0.06 0.07 0.09 0.00116 47.82 62.54 77.99 1.50
60 15.3 21 23 0.07 0.09 0.10 0.00116 56.28 77.25 84.61 2.00
75 17.5 24 24 0.07 0.10 0.10 0.00117 63.83 87.54 87.54 2.50
90 18.9 26.5 24.3 0.08 0.11 0.10 0.00118 68.35 95.83 87.88 3.00
105 20 28 24.6 0.09 0.12 0.10 0.00118 72.33 101.26 88.96 3.50
120 20.5 29 24.9 0.09 0.12 0.11 0.00119 73.51 103.99 89.29 4.00
135 20.6 30 25 0.09 0.13 0.11 0.00119 73.87 107.58 89.65 4.50
150 20.8 30.8 26 0.09 0.13 0.11 0.00120 73.97 109.53 92.46 5.00
165 20.9 31.5 27 0.09 0.13 0.12 0.00121 73.71 111.09 95.22 5.50
180 21.2 32 27.8 0.09 0.14 0.12 0.00121 74.77 112.86 98.04 6.00
210 21.5 33.5 29.2 0.09 0.14 0.12 0.00122 75.20 117.18 102.14 7.00
240 22 34.5 30.5 0.10 0.15 0.13 0.00124 77.43 118.73 104.96 8.00
270 22.5 35 32 0.10 0.15 0.14 0.00125 78.52 119.49 109.24 9.00
300 23 36.5 33.5 0.10 0.16 0.14 0.00127 79.97 122.64 112.56 10.00
330 23.8 37 35 0.10 0.16 0.15 0.00128 80.01 123.35 116.69 11.00
360 24 37.5 36.2 0.10 0.16 0.15 0.00130 79.77 123.10 118.83 12.00
390 24.3 38 37.5 0.11 0.16 0.16 0.00131 80.79 123.79 122.16 12.00
420 24.8 38.2 38.5 0.11 0.16 0.16 0.00131 81.44 124.44 125.41 13.00
450 25 38.5 39.5 0.11 0.16 0.17 0.00133 80.21 123.53 126.74 14.00
480 25 39 40.5 0.11 0.17 0.17 0.00134 80.57 124.20 128.98 15.00
510 25.3 39.3 41.5 0.11 0.17 0.18 0.00136 80.01 123.31 130.22 16.00
540 25.5 39.8 42.3 0.11 0.17 0.18 0.00137 80.36 123.97 131.76 17.00
570 25.8 40 43 0.11 0.17 0.18 0.00139 79.82 122.80 132.01 18.00
600 26 40 43.9 0.11 0.17 0.19 0.00139 79.82 122.80 134.77 19.00
630 26 40 44.3 0.11 0.17 0.19 0.00143 77.59 119.37 132.20 20.00
660 26 40 44.9 0.11 0.17 0.19 0.00144 77.05 118.54 133.06 21.00
690 26 40 45.3 0.11 0.17 0.19 0.00146 75.99 116.91 132.40 22.00
720 26 40 46 0.11 0.17 0.20 0.00150 73.97 113.80 130.87 24.00
750 26 40 46.9 0.11 0.17 0.20 0.00152 72.99 112.30 131.67 25.00
∂3 ∂2 ∂1 Radius Centre1 100.00 81.44 181.44 40.719 140.719
0.00 22.52 30.34 35.26 38.40 40.15 40.72 40.15 38.40 35.26 30.34 22.52 0.00
100.00 106.80 113.56 120.36 127.16 133.92 140.72 147.52 154.28 161.08 167.88 174.64 181.44
2 205.00 124.44 329.44 62.2186 267.219
0.00 34.41 46.35 53.88 58.67 61.35 62.22 61.35 58.67 53.88 46.35 34.41 0.00
205.00 215.39 225.72 236.11 246.50 256.83 267.22 277.61 287.94 298.33 308.72 319.05 329.44
3 310.00 134.77 444.77 67.3873 377.387
0.00 37.27 50.20 58.36 63.55 66.44 67.39 66.44 63.55 58.36 50.20 37.27 0.00
310.00 321.25 332.44 343.69 354.95 366.13 377.39 388.64 399.83 411.08 422.33 433.52 444.77
17 140
0 700
GEOTECHNICAL ENGINEERING LABORATORY TEST
TRIAXIAL COMPRESSION TESTJOB…. OKOMU POWER HOUSE DATE…24/06/2018………
2KN/m310, 205, 100CELL PRESSURE:…… DIAMETER…… LENGTH…… m15.0,2BH… SAMPLE NO
FRICTION ANGLE:. ....9.93º..... COHESION:... 17.0kN/m²..... WET WEIGHT:..150g,156g,158g.... DRY WEIGHTg,g.... MOISTURE CONTENT:..........
DESCRIPTION OF SAMPLE
……………………………………………………
…………………………………………………..
SKETCH OF SAMPLE AFTER SHEAR
Compressive Sress
Corresponding Strain
y = 0.1757x + 17
0
50
100
150
200
250
300
0 50 100 150 200 250 300 350 400 450 500 550 600 650 700
SH
EA
R
ST
RE
SS
(τ)
NORMAL STRESS(σ)
TRIAXIAL COMPRESSION TEST CHART
220

Strai
n Dial
Stress
Dial SD2 SD3
Stress
Dial Diff SDD2 SDD3
Area Sq
m
Compres
sive
Stress CS2 CS3
Strain
%
0 0 0 0 0.00 0.00 0.00 0.00114 0.00 0.00 0.00 0.00
15 7 8 6.3 0.03 0.03 0.03 0.00115 25.98 29.69 23.38 0.50
30 9.8 11.5 8.3 0.04 0.05 0.04 0.00115 36.37 42.67 30.80 1.00
45 11.6 15 15.5 0.05 0.06 0.07 0.00116 42.67 55.18 57.02 1.50
60 13.5 16.8 16.5 0.06 0.07 0.07 0.00116 49.66 61.80 60.70 2.00
75 15 18.5 20 0.06 0.08 0.09 0.00117 54.71 67.48 72.95 2.50
90 16.5 19.8 22 0.07 0.08 0.09 0.00118 59.67 71.60 79.56 3.00
105 18.2 21 23.5 0.08 0.09 0.10 0.00118 65.82 75.94 84.99 3.50
120 20 22.5 24.5 0.09 0.10 0.10 0.00119 71.72 80.69 87.86 4.00
135 22 24 26 0.09 0.10 0.11 0.00119 78.89 86.06 93.24 4.50
150 23.5 25.7 27 0.10 0.11 0.12 0.00120 83.57 91.39 96.02 5.00
165 25.5 27.3 28.5 0.11 0.12 0.12 0.00121 89.93 96.28 100.51 5.50
180 27 29 30 0.12 0.12 0.13 0.00121 95.22 102.28 105.80 6.00
210 30 32.5 33 0.13 0.14 0.14 0.00122 104.93 113.68 115.43 7.00
240 32.5 35.8 36 0.15 0.15 0.15 0.00124 122.17 123.20 123.89 8.00
270 35.5 38.5 39 0.16 0.16 0.17 0.00125 129.73 131.43 133.14 9.00
300 38 41.3 41.5 0.16 0.18 0.18 0.00127 127.68 138.77 139.44 10.00
330 38 44 44.9 0.16 0.19 0.19 0.00128 126.69 146.69 149.69 11.00
360 38 46.5 47.9 0.16 0.20 0.20 0.00130 124.74 152.64 157.24 12.00
390 38 48.5 50.3 0.16 0.21 0.21 0.00131 123.79 157.99 163.85 12.00
420 38 50.8 52.5 0.16 0.22 0.22 0.00131 123.79 165.48 171.02 13.00
450 38 52.9 54.9 0.16 0.23 0.23 0.00133 121.92 169.73 176.15 14.00
480 38 55 57 0.16 0.23 0.24 0.00134 121.01 175.15 181.52 15.00
510 38 55 58.5 0.16 0.23 0.25 0.00136 119.23 172.58 183.56 16.00
540 38 55 60.8 0.16 0.23 0.26 0.00137 118.36 171.32 189.38 17.00
570 38 55 62.5 0.16 0.23 0.27 0.00139 116.66 168.85 191.88 18.00
600 38 55 64 0.16 0.23 0.27 0.00139 116.66 168.85 196.48 19.00
630 38 55 65 0.16 0.23 0.28 0.00143 113.40 164.13 193.97 20.00
660 38 55 65.9 0.16 0.23 0.28 0.00144 112.61 162.99 195.29 21.00
690 38 55 65.9 0.16 0.23 0.28 0.00146 111.07 160.76 192.62 22.00
720 38 55 66.2 0.16 0.23 0.28 0.00150 108.11 156.47 188.33 24.00
750 38 55 66.9 0.16 0.23 0.29 0.00152 106.68 154.41 187.82 25.00
∂3 ∂2 ∂1 Radius Centre1 100.00 129.73 229.73 64.8637 164.864
0.00 35.87 48.32 56.17 61.17 63.96 64.86 63.96 61.17 56.17 48.32 35.87 0.00
100.00 110.83 121.60 132.43 143.26 154.03 164.86 175.70 186.46 197.30 208.13 218.90 229.73
2 205.00 175.15 380.15 87.5762 292.576
0.00 48.43 65.24 75.84 82.58 86.35 87.58 86.35 82.58 75.84 65.24 48.43 0.00
205.00 219.63 234.16 248.79 263.41 277.95 292.58 307.20 321.74 336.36 350.99 365.53 380.15
3 310.00 196.48 506.48 98.2412 408.241
0.00 54.33 73.19 85.08 92.64 96.87 98.24 96.87 92.64 85.08 73.19 54.33 0.00
310.00 326.41 342.71 359.12 375.53 391.83 408.24 424.65 440.96 457.36 473.77 490.08 506.48
37 165
0 700
GEOTECHNICAL ENGINEERING LABORATORY TEST
TRIAXIAL COMPRESSION TESTJOB…. OKOMU CLARIFICATION STATION DATE…24/06/2018………
2KN/m310, 205, 100CELL PRESSURE:…… DIAMETER…… LENGTH…… m14.5,3BH… SAMPLE NO
FRICTION ANGLE:. ....10.36º..... COHESION:... 37.0kN/m²..... WET WEIGHT:..159g,161g,162g.... DRY WEIGHTg,g.... MOISTURE CONTENT:..........
DESCRIPTION OF SAMPLE
……………………………………………………
…………………………………………………..
SKETCH OF SAMPLE AFTER SHEAR
Compressive Sress
Corresponding Strain
y = 0.1829x + 37
0
50
100
150
200
250
0 50 100 150 200 250 300 350 400 450 500 550 600
SH
EA
R
ST
RE
SS
(τ)
NORMAL STRESS(σ)
TRIAXIAL COMPRESSION TEST CHART
221

Strai
n Dial
Stress
Dial SD2 SD3
Stress
Dial Diff SDD2 SDD3
Area Sq
m
Compres
sive
Stress CS2 CS3
Strain
%
0 0 0 0 0.00 0.00 0.00 0.00114 0.00 0.00 0.00 0.00
15 10.5 6 17 0.04 0.03 0.07 0.00115 38.96 22.26 63.08 0.50
30 13 20.5 25.5 0.06 0.09 0.11 0.00115 48.24 76.07 94.62 1.00
45 14.5 22.5 30.6 0.06 0.10 0.13 0.00116 53.34 82.77 112.57 1.50
60 16 24.5 33.5 0.07 0.10 0.14 0.00116 58.86 90.13 123.24 2.00
75 18 26.5 35.7 0.08 0.11 0.15 0.00117 65.65 96.65 130.21 2.50
90 19 28.5 37.5 0.08 0.12 0.16 0.00118 68.71 103.07 135.61 3.00
105 21 30 39.5 0.09 0.13 0.17 0.00118 75.94 108.49 142.85 3.50
120 23 31.5 41.2 0.10 0.13 0.18 0.00119 82.48 112.96 147.74 4.00
135 25 32.8 43 0.11 0.14 0.18 0.00119 89.65 117.62 154.20 4.50
150 26.5 34 45 0.11 0.15 0.19 0.00120 94.24 120.91 160.03 5.00
165 28.5 35 46.9 0.12 0.15 0.20 0.00121 100.51 123.44 165.40 5.50
180 30 36.7 48.5 0.13 0.16 0.21 0.00121 105.80 129.43 171.05 6.00
210 33.5 39.5 52.5 0.14 0.17 0.22 0.00122 117.18 138.16 183.64 7.00
240 36.3 42.2 55.3 0.17 0.18 0.24 0.00124 134.22 145.23 190.31 8.00
270 39 45 59 0.17 0.19 0.25 0.00125 139.97 153.62 201.42 9.00
300 41 46.5 61.5 0.18 0.20 0.26 0.00127 144.49 156.25 206.65 10.00
330 43 48.3 64 0.19 0.21 0.27 0.00128 148.36 161.03 213.37 11.00
360 44.5 49.5 66.5 0.20 0.21 0.28 0.00130 151.00 162.49 218.29 12.00
390 46 50.9 68.9 0.20 0.22 0.29 0.00131 153.10 165.81 224.44 12.00
420 47 52 70.5 0.21 0.22 0.30 0.00131 156.69 169.39 229.66 13.00
450 48.1 53.3 73 0.21 0.23 0.31 0.00133 157.22 171.01 234.22 14.00
480 49 54.3 76.5 0.21 0.23 0.33 0.00134 160.18 172.92 243.62 15.00
510 50.3 55.5 80.3 0.22 0.24 0.34 0.00136 160.65 174.15 251.96 16.00
540 51.2 56.9 83 0.22 0.24 0.35 0.00137 161.97 177.24 258.53 17.00
570 52 58 86 0.23 0.25 0.37 0.00139 162.71 178.06 264.02 18.00
600 53 60 88.5 0.23 0.26 0.38 0.00139 166.09 184.20 271.70 19.00
630 54.1 61.9 91 0.23 0.26 0.39 0.00143 164.13 184.72 271.56 20.00
660 55 63.5 93.5 0.24 0.27 0.40 0.00144 165.06 188.18 277.08 21.00
690 55.7 64.5 96 0.24 0.28 0.41 0.00146 166.31 188.52 280.59 22.00
720 56.9 65.5 98.5 0.25 0.28 0.42 0.00150 165.00 186.34 280.22 24.00
750 58 67 100.5 0.25 0.29 0.43 0.00152 162.83 188.10 282.15 25.00
∂3 ∂2 ∂1 Radius Centre1 100.00 166.31 266.31 83.1549 183.155
0.00 45.98 61.95 72.01 78.42 81.99 83.15 81.99 78.42 72.01 61.95 45.98 0.00
100.00 113.89 127.69 141.58 155.46 169.27 183.15 197.04 210.85 224.73 238.62 252.42 266.31
2 205.00 188.52 393.52 94.2617 299.262
0.00 52.13 70.22 81.63 88.89 92.94 94.26 92.94 88.89 81.63 70.22 52.13 0.00
205.00 220.74 236.39 252.13 267.87 283.52 299.26 315.00 330.65 346.39 362.13 377.78 393.52
3 310.00 282.15 592.15 141.075 451.075
0.00 78.01 105.10 122.17 133.03 139.10 141.08 139.10 133.03 122.17 105.10 78.01 0.00
310.00 333.56 356.98 380.54 404.10 427.52 451.08 474.63 498.05 521.61 545.17 568.59 592.15
46 201
0 700
GEOTECHNICAL ENGINEERING LABORATORY TEST
TRIAXIAL COMPRESSION TESTJOB…. OKOMU WATER TANK DATE…24/06/2018………
2KN/m310, 205, 100CELL PRESSURE:…… DIAMETER…… LENGTH…… m2.5,3BH… SAMPLE NO
FRICTION ANGLE:. ....12.48º..... COHESION:... 46.0kN/m²..... WET WEIGHT:..156g,160g,160g.... DRY WEIGHTg,g.... MOISTURE CONTENT:..........
DESCRIPTION OF SAMPLE
……………………………………………………
…………………………………………………..
SKETCH OF SAMPLE AFTER SHEAR
Compressive Sress
Corresponding Strain
y = 0.2214x + 46
0
50
100
150
200
250
300
0 50 100 150 200 250 300 350 400 450 500 550 600 650 700
SH
EA
R
ST
RE
SS
(τ)
NORMAL STRESS(σ)
TRIAXIAL COMPRESSION TEST CHART
222

Strai
n Dial
Stress
Dial SD2 SD3
Stress
Dial Diff SDD2 SDD3
Area Sq
m
Compres
sive
Stress CS2 CS3
Strain
%
0 0 0 0 0.00 0.00 0.00 0.00114 0.00 0.00 0.00 0.00
15 4 3 5 0.02 0.01 0.02 0.00115 14.84 11.13 18.55 0.50
30 6 5 15 0.03 0.02 0.06 0.00115 22.26 18.55 55.66 1.00
45 7.5 9 21 0.03 0.04 0.09 0.00116 27.59 33.11 77.25 1.50
60 9 13.5 25 0.04 0.06 0.11 0.00116 33.11 49.66 91.97 2.00
75 11 17 29 0.05 0.07 0.12 0.00117 40.12 62.00 105.77 2.50
90 13 20 31 0.06 0.09 0.13 0.00118 47.01 72.33 112.11 3.00
105 15 23 34 0.06 0.10 0.15 0.00118 54.25 83.18 122.96 3.50
120 16.5 25 36 0.07 0.11 0.15 0.00119 59.17 89.65 129.10 4.00
135 18 28 38 0.08 0.12 0.16 0.00119 64.55 100.41 136.27 4.50
150 20 31 40 0.09 0.13 0.17 0.00120 71.12 110.24 142.25 5.00
165 22 33 42 0.09 0.14 0.18 0.00121 77.59 116.38 148.12 5.50
180 23 34.5 44 0.10 0.15 0.19 0.00121 81.11 121.67 155.18 6.00
210 26 38.5 48 0.11 0.16 0.20 0.00122 90.94 134.67 167.90 7.00
240 29 41.5 51 0.13 0.18 0.22 0.00124 106.68 142.82 175.51 8.00
270 31 44 54 0.14 0.19 0.23 0.00125 112.66 150.21 184.35 9.00
300 33 46 57 0.15 0.20 0.24 0.00127 115.92 154.57 191.53 10.00
330 34.5 48 58 0.15 0.20 0.25 0.00128 120.02 160.03 193.36 11.00
360 36 49.5 62 0.16 0.21 0.26 0.00130 124.74 162.49 203.52 12.00
390 38 50.5 64.5 0.17 0.22 0.28 0.00131 128.67 164.50 210.11 12.00
420 39.5 51 68 0.17 0.22 0.29 0.00131 131.93 166.13 221.51 13.00
450 40.5 52 70 0.18 0.22 0.30 0.00133 132.19 166.84 224.60 14.00
480 41.2 52.2 72 0.18 0.22 0.31 0.00134 133.75 166.24 229.29 15.00
510 42 52.5 74 0.18 0.22 0.32 0.00136 133.35 164.73 232.19 16.00
540 42.5 53 76 0.18 0.23 0.32 0.00137 133.94 165.09 236.73 17.00
570 43 53 78 0.19 0.23 0.33 0.00139 135.08 162.71 239.46 18.00
600 44 53 79 0.19 0.23 0.34 0.00139 138.15 162.71 242.53 19.00
630 45 53 80 0.20 0.23 0.34 0.00143 137.27 158.16 238.73 20.00
660 46 53 81 0.20 0.23 0.35 0.00144 137.80 157.06 240.04 21.00
690 46.5 53 82 0.20 0.23 0.35 0.00146 137.37 154.91 239.67 22.00
720 47 53 82 0.20 0.23 0.35 0.00150 136.56 150.78 233.28 24.00
750 48 53 82 0.20 0.23 0.35 0.00152 134.76 148.80 230.21 25.00
∂3 ∂2 ∂1 Radius Centre1 100.00 138.15 238.15 69.0758 169.076
0.00 38.20 51.46 59.82 65.14 68.11 69.08 68.11 65.14 59.82 51.46 38.20 0.00
100.00 111.54 123.00 134.54 146.07 157.54 169.08 180.61 192.08 203.61 215.15 226.62 238.15
2 205.00 166.84 371.84 83.4219 288.422
0.00 46.13 62.15 72.24 78.67 82.25 83.42 82.25 78.67 72.24 62.15 46.13 0.00
205.00 218.93 232.78 246.71 260.64 274.49 288.42 302.35 316.20 330.13 344.06 357.91 371.84
3 310.00 242.53 552.53 121.266 431.266
0.00 67.06 90.34 105.02 114.35 119.57 121.27 119.57 114.35 105.02 90.34 67.06 0.00
310.00 330.25 350.38 370.63 390.88 411.01 431.27 451.52 471.65 491.90 512.15 532.28 552.53
38 160
0 600
GEOTECHNICAL ENGINEERING LABORATORY TEST
TRIAXIAL COMPRESSION TEST
JOB…. OKOMU CLARIFICATION STATION DATE…24/06/2018………
2KN/m310, 205, 100CELL PRESSURE:…… DIAMETER…… LENGTH…… m8.5,3BH… SAMPLE NO
FRICTION ANGLE:. ....11.49º..... COHESION:...38.0kN/m²..... WET WEIGHT:..158g,156g,163g.... DRY WEIGHTg,g.... MOISTURE CONTENT:..........
DESCRIPTION OF SAMPLE
……………………………………………………
…………………………………………………..
SKETCH OF SAMPLE AFTER SHEAR
Compressive Sress
Corresponding Strain
y = 0.2033x + 38
50
100
150
200
250
SH
EA
R
ST
RE
SS
(τ)
TRIAXIAL COMPRESSION TEST CHART
223

Strai
n Dial
Stress
Dial SD2 SD3
Stress
Dial Diff SDD2 SDD3
Area Sq
m
Compres
sive
Stress CS2 CS3
Strain
%
0 0 0 0 0.00 0.00 0.00 0.00114 0.00 0.00 0.00 0.00
15 1 1.5 3.5 0.00 0.01 0.01 0.00115 3.71 5.57 12.99 0.50
30 1.8 2 6.5 0.01 0.01 0.03 0.00115 6.68 7.42 24.12 1.00
45 2.5 3 9 0.01 0.01 0.04 0.00116 9.20 11.04 33.11 1.50
60 3 4 10.5 0.01 0.02 0.04 0.00116 11.04 14.72 38.63 2.00
75 4 4.5 12 0.02 0.02 0.05 0.00117 14.59 16.41 43.77 2.50
90 4.5 5.2 14 0.02 0.02 0.06 0.00118 16.27 18.81 50.63 3.00
105 5.2 6 16 0.02 0.03 0.07 0.00118 18.81 21.70 57.86 3.50
120 6 7 18 0.03 0.03 0.08 0.00119 21.52 25.10 64.55 4.00
135 6.5 8 20 0.03 0.03 0.09 0.00119 23.31 28.69 71.72 4.50
150 7 8.5 22 0.03 0.04 0.09 0.00120 24.89 30.23 78.23 5.00
165 8 9 23 0.03 0.04 0.10 0.00121 28.21 31.74 81.11 5.50
180 8.5 10 25 0.04 0.04 0.11 0.00121 29.98 35.27 88.17 6.00
210 9.5 11.5 27 0.04 0.05 0.12 0.00122 33.23 40.23 94.44 7.00
240 11 13.5 29 0.05 0.06 0.12 0.00124 41.30 46.46 99.80 8.00
270 12 15 31 0.05 0.06 0.13 0.00125 42.67 51.21 105.83 9.00
300 12.5 16 31.5 0.06 0.07 0.13 0.00127 45.36 53.76 105.84 10.00
330 13.5 18 33 0.06 0.08 0.14 0.00128 48.34 60.01 110.02 11.00
360 14.5 19 33.5 0.07 0.08 0.14 0.00130 50.88 62.37 109.97 12.00
390 15.5 20.5 34 0.07 0.09 0.15 0.00131 52.12 66.78 110.76 12.00
420 16 21.5 35 0.07 0.09 0.15 0.00131 55.38 70.04 114.01 13.00
450 17 22.5 36 0.07 0.10 0.15 0.00133 55.19 72.19 115.51 14.00
480 17.2 24 36.5 0.08 0.10 0.16 0.00134 57.32 76.43 116.24 15.00
510 18 25 36.8 0.08 0.11 0.16 0.00136 59.62 78.44 115.47 16.00
540 19 26 37 0.08 0.11 0.16 0.00137 61.67 80.99 115.25 17.00
570 19.8 27 37.2 0.09 0.12 0.16 0.00139 62.01 82.89 114.21 18.00
600 20.2 27.5 37.5 0.09 0.12 0.16 0.00139 64.47 84.43 115.13 19.00
630 21 28 37.5 0.09 0.12 0.16 0.00143 65.65 83.56 111.91 20.00
660 22 29 37.5 0.10 0.12 0.16 0.00144 68.16 85.94 111.13 21.00
690 23 30 37.5 0.10 0.13 0.16 0.00146 68.69 87.69 109.61 22.00
720 23.5 31 37.5 0.10 0.13 0.16 0.00150 68.28 88.19 106.68 24.00
750 24 32 37.5 0.10 0.14 0.16 0.00152 67.38 89.84 105.28 25.00
∂3 ∂2 ∂1 Radius Centre1 100.00 68.69 168.69 34.3434 134.343
0.00 18.99 25.59 29.74 32.39 33.86 34.34 33.86 32.39 29.74 25.59 18.99 0.00
100.00 105.74 111.44 117.17 122.91 128.61 134.34 140.08 145.78 151.52 157.25 162.95 168.69
2 205.00 89.84 294.84 44.9195 249.919
0.00 24.84 33.47 38.90 42.36 44.29 44.92 44.29 42.36 38.90 33.47 24.84 0.00
205.00 212.50 219.96 227.46 234.96 242.42 249.92 257.42 264.88 272.38 279.88 287.34 294.84
3 310.00 116.24 426.24 58.1188 368.119
0.00 32.14 43.30 50.33 54.81 57.31 58.12 57.31 54.81 50.33 43.30 32.14 0.00
310.00 319.71 329.35 339.06 348.77 358.41 368.12 377.82 387.47 397.18 406.88 416.53 426.24
18 86
0 600
GEOTECHNICAL ENGINEERING LABORATORY TEST
TRIAXIAL COMPRESSION TESTJOB…. OKOMU STERILIZER DATE…24/06/2018………
2KN/m310, 205, 100CELL PRESSURE:…… DIAMETER…… LENGTH…… m0.5,4BH… SAMPLE NO
FRICTION ANGLE:. ....6.46º..... COHESION:...18.0kN/m²..... WET WEIGHT:..151g,160g,151g.... DRY WEIGHTg,g.... MOISTURE CONTENT:..........
DESCRIPTION OF SAMPLE
……………………………………………………
…………………………………………………..
SKETCH OF SAMPLE AFTER SHEAR
Compressive Sress
Corresponding Strain
y = 0.1133x + 18
0
50
100
150
200
250
0 50 100 150 200 250 300 350 400 450 500 550 600
SH
EA
R
ST
RE
SS
(τ)
NORMAL STRESS(σ)
TRIAXIAL COMPRESSION TEST CHART
224

Strai
n Dial
Stress
Dial SD2 SD3
Stress
Dial Diff SDD2 SDD3
Area Sq
m
Compres
sive
Stress CS2 CS3
Strain
%
0 0 0 0 0.00 0.00 0.00 0.00114 0.00 0.00 0.00 0.00
15 10.5 5.8 3 0.04 0.02 0.01 0.00115 38.96 21.52 11.13 0.50
30 13.8 6.5 6 0.06 0.03 0.03 0.00115 51.21 24.12 22.26 1.00
45 16 8.2 8.5 0.07 0.03 0.04 0.00116 58.86 30.17 31.27 1.50
60 17 8.8 11 0.07 0.04 0.05 0.00116 62.54 32.37 40.47 2.00
75 17 9 12.5 0.07 0.04 0.05 0.00117 62.00 32.83 45.59 2.50
90 17 9.3 14.2 0.07 0.04 0.06 0.00118 61.48 33.63 51.35 3.00
105 17 9.8 16 0.07 0.04 0.07 0.00118 61.48 35.44 57.86 3.50
120 17 10 17.8 0.07 0.04 0.08 0.00119 60.96 35.86 63.83 4.00
135 17 10.2 19.5 0.07 0.04 0.08 0.00119 60.96 36.58 69.93 4.50
150 17 10.5 21.2 0.07 0.04 0.09 0.00120 60.45 37.34 75.39 5.00
165 17 10.8 22.5 0.07 0.05 0.10 0.00121 59.95 38.09 79.35 5.50
180 17 11.1 23.8 0.07 0.05 0.10 0.00121 59.95 39.15 83.94 6.00
210 17 12 26 0.07 0.05 0.11 0.00122 59.46 41.97 90.94 7.00
240 17 12.9 27.5 0.07 0.06 0.12 0.00124 58.50 44.39 94.64 8.00
270 17 13.8 29 0.07 0.06 0.12 0.00125 58.04 47.11 99.00 9.00
300 17 15 31.8 0.07 0.06 0.14 0.00127 57.12 50.40 106.85 10.00
330 17 15.7 32 0.07 0.07 0.14 0.00128 56.68 52.34 106.68 11.00
360 17 16 33 0.07 0.07 0.14 0.00130 55.80 52.52 108.33 12.00
390 17 17.8 34.5 0.07 0.08 0.15 0.00131 55.38 57.98 112.38 12.00
420 17 18.8 35.8 0.07 0.08 0.15 0.00131 55.38 61.24 116.62 13.00
450 17 19.7 37 0.07 0.08 0.16 0.00133 54.55 63.21 118.72 14.00
480 17 20.3 38 0.07 0.09 0.16 0.00134 54.14 64.65 121.01 15.00
510 17 21 39 0.07 0.09 0.17 0.00136 53.34 65.89 122.37 16.00
540 17 21.8 39.8 0.07 0.09 0.17 0.00137 52.95 67.90 123.97 17.00
570 17 22 40.3 0.07 0.09 0.17 0.00139 52.19 67.54 123.72 18.00
600 17 22.2 41 0.07 0.09 0.17 0.00139 52.19 68.15 125.87 19.00
630 17 23 41.5 0.07 0.10 0.18 0.00143 50.73 68.64 123.84 20.00
660 17 24 42 0.07 0.10 0.18 0.00144 50.38 71.12 124.46 21.00
690 17 24.8 42.5 0.07 0.11 0.18 0.00146 49.69 72.49 124.22 22.00
720 17 25 43 0.07 0.11 0.18 0.00150 48.36 71.12 122.33 24.00
750 17 25.7 43.8 0.07 0.11 0.19 0.00152 47.73 72.15 122.97 25.00
∂3 ∂2 ∂1 Radius Centre1 100.00 62.54 162.54 31.2694 131.269
0.00 17.29 23.30 27.08 29.49 30.83 31.27 30.83 29.49 27.08 23.30 17.29 0.00
100.00 105.22 110.41 115.63 120.86 126.05 131.27 136.49 141.68 146.90 152.13 157.32 162.54
2 205.00 72.49 277.49 36.2432 241.243
0.00 20.04 27.00 31.39 34.18 35.74 36.24 35.74 34.18 31.39 27.00 20.04 0.00
205.00 211.05 217.07 223.12 229.17 235.19 241.24 247.30 253.31 259.36 265.42 271.43 277.49
3 310.00 125.87 435.87 62.9357 372.936
0.00 34.80 46.89 54.50 59.35 62.05 62.94 62.05 59.35 54.50 46.89 34.80 0.00
310.00 320.51 330.96 341.47 351.98 362.43 372.94 383.45 393.89 404.40 414.91 425.36 435.87
15 108
0 700
GEOTECHNICAL ENGINEERING LABORATORY TEST
TRIAXIAL COMPRESSION TESTJOB…. OKOMU STERILIZER DATE…24/06/2018………
2KN/m310, 205, 100CELL PRESSURE:…… DIAMETER…… LENGTH…… m6.5,4BH… SAMPLE NO
FRICTION ANGLE:. ....7.57º..... COHESION:... 15.0kN/m²..... WET WEIGHT:..139g,130g,150g.... DRY WEIGHTg,g.... MOISTURE CONTENT:..........
DESCRIPTION OF SAMPLE
……………………………………………………
…………………………………………………..
SKETCH OF SAMPLE AFTER SHEAR
Compressive Sress
Corresponding Strain
y = 0.1329x + 15
0
50
100
150
200
250
300
0 50 100 150 200 250 300 350 400 450 500 550 600 650 700
SH
EA
R
ST
RE
SS
(τ)
NORMAL STRESS(σ)
TRIAXIAL COMPRESSION TEST CHART
225

Strai
n Dial
Stress
Dial SD2 SD3
Stress
Dial Diff SDD2 SDD3
Area Sq
m
Compres
sive
Stress CS2 CS3
Strain
%
0 0 0 0 0.00 0.00 0.00 0.00114 0.00 0.00 0.00 0.00
15 3 2 2 0.01 0.01 0.01 0.00115 11.13 7.42 7.42 0.50
30 3.5 2.5 3 0.01 0.01 0.01 0.00115 12.99 9.28 11.13 1.00
45 4 3 3.5 0.02 0.01 0.01 0.00116 14.72 11.04 12.88 1.50
60 5 3.8 4 0.02 0.02 0.02 0.00116 18.39 13.98 14.72 2.00
75 5.5 4 5 0.02 0.02 0.02 0.00117 20.06 14.59 18.24 2.50
90 6 5 5.5 0.03 0.02 0.02 0.00118 21.70 18.08 19.89 3.00
105 6.5 6 6 0.03 0.03 0.03 0.00118 23.51 21.70 21.70 3.50
120 7 7 7 0.03 0.03 0.03 0.00119 25.10 25.10 25.10 4.00
135 7.5 7.5 7.5 0.03 0.03 0.03 0.00119 26.90 26.90 26.90 4.50
150 8 8 8 0.03 0.03 0.03 0.00120 28.45 28.45 28.45 5.00
165 8.2 8.5 8.5 0.03 0.04 0.04 0.00121 28.92 29.98 29.98 5.50
180 8.5 9 9.5 0.04 0.04 0.04 0.00121 29.98 31.74 33.50 6.00
210 9 10 11 0.04 0.04 0.05 0.00122 31.48 34.98 38.48 7.00
240 9.8 11 12 0.04 0.05 0.05 0.00124 34.41 37.86 41.30 8.00
270 10 12 13 0.04 0.05 0.06 0.00125 34.14 40.97 44.38 9.00
300 10 12.8 14 0.04 0.05 0.06 0.00127 33.60 43.01 47.04 10.00
330 10 13 15 0.04 0.06 0.06 0.00128 33.34 43.34 50.01 11.00
360 10 13.5 16 0.04 0.06 0.07 0.00130 32.83 44.31 52.52 12.00
390 10 14 16.5 0.04 0.06 0.07 0.00131 32.58 45.61 53.75 12.00
420 10 15 17 0.04 0.06 0.07 0.00131 32.58 48.86 55.38 13.00
450 10 15.5 18 0.04 0.07 0.08 0.00133 32.09 49.73 57.75 14.00
480 10 16 18.5 0.04 0.07 0.08 0.00134 31.85 50.95 58.91 15.00
510 10 16.5 19.5 0.04 0.07 0.08 0.00136 31.38 51.77 61.19 16.00
540 10 17 20.2 0.04 0.07 0.09 0.00137 31.15 52.95 62.92 17.00
570 10 18 20.5 0.04 0.08 0.09 0.00139 30.70 55.26 62.94 18.00
600 10 18.5 21 0.04 0.08 0.09 0.00139 30.70 56.80 64.47 19.00
630 10 19 21.5 0.04 0.08 0.09 0.00143 29.84 56.70 64.16 20.00
660 10 19.5 22.5 0.04 0.08 0.10 0.00144 29.63 57.79 66.68 21.00
690 10 20 23 0.04 0.09 0.10 0.00146 29.23 58.46 67.23 22.00
720 10 20.5 24 0.04 0.09 0.10 0.00150 28.45 58.32 68.28 24.00
750 10 21 25 0.04 0.09 0.11 0.00152 28.07 58.96 70.19 25.00
∂3 ∂2 ∂1 Radius Centre1 100.00 34.41 134.41 17.2071 117.207
0.00 9.52 12.82 14.90 16.23 16.97 17.21 16.97 16.23 14.90 12.82 9.52 0.00
100.00 102.87 105.73 108.60 111.48 114.33 117.21 120.08 122.94 125.81 128.68 131.54 134.41
2 205.00 58.96 263.96 29.4784 234.478
0.00 16.30 21.96 25.53 27.80 29.07 29.48 29.07 27.80 25.53 21.96 16.30 0.00
205.00 209.92 214.82 219.74 224.66 229.56 234.48 239.40 244.29 249.22 254.14 259.03 263.96
3 310.00 70.19 380.19 35.0933 345.093
0.00 19.41 26.14 30.39 33.09 34.60 35.09 34.60 33.09 30.39 26.14 19.41 0.00
310.00 315.86 321.69 327.55 333.41 339.23 345.09 350.95 356.78 362.64 368.50 374.33 380.19
5 70
0 600
GEOTECHNICAL ENGINEERING LABORATORY TEST
TRIAXIAL COMPRESSION TESTJOB…. OKOMU STERILIZER DATE…24/06/2018………
2KN/m310, 205, 100CELL PRESSURE:…… DIAMETER…… LENGTH…… m12.5,4BH… SAMPLE NO
FRICTION ANGLE:. ....6.16º..... COHESION:...5.0kN/m²..... WET WEIGHT:..145g,133g,155g.... DRY WEIGHTg,g.... MOISTURE CONTENT:..........
DESCRIPTION OF SAMPLE
……………………………………………………
…………………………………………………..
SKETCH OF SAMPLE AFTER SHEAR
Compressive Sress
Corresponding Strain
y = 0.1083x + 5
0
20
40
60
80
100
120
140
160
180
200
0 50 100 150 200 250 300 350 400 450
SH
EA
R
ST
RE
SS
(τ)
NORMAL STRESS(σ)
TRIAXIAL COMPRESSION TEST CHART
226

Strai
n Dial
Stress
Dial SD2 SD3
Stress
Dial Diff SDD2 SDD3
Area Sq
m
Compres
sive
Stress CS2 CS3
Strain
%
0 0 0 0 0.00 0.00 0.00 0.00114 0.00 0.00 0.00 0.00
15 6.5 4.5 9 0.03 0.02 0.04 0.00115 24.12 16.70 33.40 0.50
30 8.5 5 20 0.04 0.02 0.09 0.00115 31.54 18.55 74.21 1.00
45 10.5 7 26 0.04 0.03 0.11 0.00116 38.63 25.75 95.65 1.50
60 12.5 8.5 29 0.05 0.04 0.12 0.00116 45.98 31.27 106.68 2.00
75 14 10 32 0.06 0.04 0.14 0.00117 51.06 36.47 116.71 2.50
90 16 12 34 0.07 0.05 0.15 0.00118 57.86 43.40 122.96 3.00
105 17.5 14 36 0.07 0.06 0.15 0.00118 63.29 50.63 130.19 3.50
120 18.5 16 38 0.08 0.07 0.16 0.00119 66.34 57.38 136.27 4.00
135 20 18 40 0.09 0.08 0.17 0.00119 71.72 64.55 143.44 4.50
150 21.5 20 42 0.09 0.09 0.18 0.00120 76.46 71.12 149.36 5.00
165 22.5 22 44 0.10 0.09 0.19 0.00121 79.35 77.59 155.18 5.50
180 23 23.5 46 0.10 0.10 0.20 0.00121 81.11 82.88 162.23 6.00
210 24 27 50.5 0.10 0.12 0.22 0.00122 83.95 94.44 176.64 7.00
240 24.5 31 55 0.11 0.13 0.23 0.00124 89.48 106.68 189.28 8.00
270 26 33 58 0.12 0.14 0.25 0.00125 92.17 112.66 198.01 9.00
300 27 36 62 0.12 0.15 0.26 0.00127 94.08 120.96 208.33 10.00
330 28 38 65.5 0.12 0.16 0.28 0.00128 93.35 126.69 218.37 11.00
360 28 40 68 0.12 0.17 0.29 0.00130 91.91 131.30 223.22 12.00
390 28 42.5 72.5 0.12 0.18 0.31 0.00131 91.21 138.44 236.17 12.00
420 28 44.5 75.5 0.12 0.19 0.32 0.00131 91.21 144.96 245.94 13.00
450 28 46 78 0.12 0.20 0.33 0.00133 89.84 147.59 250.27 14.00
480 28 48 80 0.12 0.20 0.34 0.00134 89.17 152.86 254.77 15.00
510 28 50 82 0.12 0.21 0.35 0.00136 87.86 156.89 257.30 16.00
540 28 51 84 0.12 0.22 0.36 0.00137 87.22 158.86 261.65 17.00
570 28 52 85.5 0.12 0.22 0.36 0.00139 85.96 159.64 262.49 18.00
600 28 54 88 0.12 0.23 0.38 0.00139 85.96 165.78 270.16 19.00
630 28 55 89 0.12 0.23 0.38 0.00143 83.56 164.13 265.59 20.00
660 28 57 90.5 0.12 0.24 0.39 0.00144 82.98 168.92 268.19 21.00
690 28 58 92.5 0.12 0.25 0.39 0.00146 81.84 169.52 270.36 22.00
720 28 59.5 94.5 0.12 0.25 0.40 0.00150 79.66 169.27 268.84 24.00
750 28 61 96 0.12 0.26 0.41 0.00152 78.61 171.26 269.52 25.00
∂3 ∂2 ∂1 Radius Centre1 100.00 94.08 194.08 47.0417 147.042
0.00 26.01 35.05 40.74 44.36 46.38 47.04 46.38 44.36 40.74 35.05 26.01 0.00
100.00 107.86 115.66 123.52 131.38 139.19 147.04 154.90 162.71 170.56 178.42 186.23 194.08
2 205.00 171.26 376.26 85.6277 290.628
0.00 47.35 63.79 74.15 80.75 84.43 85.63 84.43 80.75 74.15 63.79 47.35 0.00
205.00 219.30 233.51 247.81 262.11 276.33 290.63 304.93 319.14 333.44 347.74 361.96 376.26
3 310.00 270.36 580.36 135.181 445.181
0.00 74.76 100.71 117.07 127.48 133.29 135.18 133.29 127.48 117.07 100.71 74.76 0.00
310.00 332.58 355.02 377.59 400.17 422.61 445.18 467.76 490.20 512.77 535.35 557.79 580.36
9 177
0 600
GEOTECHNICAL ENGINEERING LABORATORY TEST
TRIAXIAL COMPRESSION TESTJOB…. OKOMU PRESSING STATION DATE…24/06/2018………
2KN/m310, 205, 100CELL PRESSURE:…… DIAMETER…… LENGTH…… m7.5,5BH… SAMPLE NO
FRICTION ANGLE:. ....15.64º..... COHESION:...9.0kN/m²..... WET WEIGHT:..160g,155g,155g.... DRY WEIGHTg,g.... MOISTURE CONTENT:..........
DESCRIPTION OF SAMPLE
……………………………………………………
…………………………………………………..
SKETCH OF SAMPLE AFTER SHEAR
Compressive Sress
Corresponding Strain
y = 0.28x + 9
0
50
100
150
200
250
0 50 100 150 200 250 300 350 400 450 500 550 600
SH
EA
R
ST
RE
SS
(τ)
NORMAL STRESS(σ)
TRIAXIAL COMPRESSION TEST CHART
227

Strai
n Dial
Stress
Dial SD2 SD3
Stress
Dial Diff SDD2 SDD3
Area Sq
m
Compres
sive
Stress CS2 CS3
Strain
%
0 0 0 0 0.00 0.00 0.00 0.00114 0.00 0.00 0.00 0.00
15 7 7.7 11 0.03 0.03 0.05 0.00115 25.98 28.57 40.82 0.50
30 9.3 9 15 0.04 0.04 0.06 0.00115 34.51 33.40 55.66 1.00
45 10.5 10 17 0.04 0.04 0.07 0.00116 38.63 36.79 62.54 1.50
60 12 11 19.5 0.05 0.05 0.08 0.00116 44.15 40.47 71.74 2.00
75 13 11.8 24 0.06 0.05 0.10 0.00117 47.42 43.04 87.54 2.50
90 14 12.5 26 0.06 0.05 0.11 0.00118 50.63 45.20 94.03 3.00
105 15.1 14 28 0.06 0.06 0.12 0.00118 54.61 50.63 101.26 3.50
120 16.2 15 30 0.07 0.06 0.13 0.00119 58.09 53.79 107.58 4.00
135 17.5 16 31.5 0.07 0.07 0.13 0.00119 62.76 57.38 112.96 4.50
150 19 17 33.3 0.08 0.07 0.14 0.00120 67.57 60.45 118.42 5.00
165 20.8 17.8 35.2 0.09 0.08 0.15 0.00121 73.36 62.78 124.14 5.50
180 22 19.3 37.2 0.09 0.08 0.16 0.00121 77.59 68.07 131.19 6.00
210 24.2 21.5 40.8 0.10 0.09 0.17 0.00122 84.65 75.20 142.71 7.00
240 26.5 23.8 43.9 0.12 0.10 0.19 0.00124 98.77 81.91 151.08 8.00
270 28.7 25.8 46.5 0.13 0.11 0.20 0.00125 104.12 88.08 158.75 9.00
300 30.5 28.2 49.8 0.14 0.12 0.21 0.00127 109.20 94.76 167.33 10.00
330 32.5 30.3 52.5 0.15 0.13 0.22 0.00128 114.35 101.02 175.03 11.00
360 34.3 32.5 54.8 0.15 0.14 0.23 0.00130 118.17 106.68 179.89 12.00
390 36 34.2 56.6 0.16 0.15 0.24 0.00131 121.18 111.41 184.38 12.00
420 37.2 36.1 58.8 0.16 0.15 0.25 0.00131 123.79 117.60 191.54 13.00
450 38 38 59.2 0.17 0.16 0.25 0.00133 125.77 121.92 189.95 14.00
480 39.2 39.7 61 0.17 0.17 0.26 0.00134 128.02 126.43 194.26 15.00
510 40.2 41 62.5 0.17 0.17 0.27 0.00136 128.65 128.65 196.11 16.00
540 41 42.7 63.5 0.18 0.18 0.27 0.00137 130.82 133.00 197.79 17.00
570 42 44 64.2 0.18 0.19 0.27 0.00139 131.40 135.08 197.10 18.00
600 42.8 45.3 64.5 0.19 0.19 0.28 0.00139 134.47 139.07 198.02 19.00
630 43.8 46.8 65.5 0.19 0.20 0.28 0.00143 133.99 139.66 195.46 20.00
660 44.9 48 66.5 0.19 0.20 0.28 0.00144 134.84 142.25 197.07 21.00
690 45.5 48.9 67.5 0.20 0.21 0.29 0.00146 137.08 142.93 197.29 22.00
720 46.9 50 67.8 0.20 0.21 0.29 0.00150 136.56 142.25 192.88 24.00
750 48 51.2 68.1 0.20 0.22 0.29 0.00152 134.76 143.74 191.19 25.00
∂3 ∂2 ∂1 Radius Centre1 100.00 137.08 237.08 68.5407 168.541
0.00 37.90 51.06 59.36 64.63 67.58 68.54 67.58 64.63 59.36 51.06 37.90 0.00
100.00 111.45 122.82 134.27 145.72 157.09 168.54 179.99 191.36 202.81 214.26 225.64 237.08
2 205.00 143.74 348.74 71.8712 276.871
0.00 39.74 53.54 62.24 67.77 70.86 71.87 70.86 67.77 62.24 53.54 39.74 0.00
205.00 217.00 228.93 240.94 252.94 264.87 276.87 288.87 300.80 312.81 324.81 336.74 348.74
3 310.00 198.02 508.02 99.0087 409.009
0.00 54.75 73.76 85.74 93.37 97.62 99.01 97.62 93.37 85.74 73.76 54.75 0.00
310.00 326.53 342.97 359.50 376.04 392.47 409.01 425.54 441.98 458.51 475.05 491.48 508.02
18 162
0 700
GEOTECHNICAL ENGINEERING LABORATORY TEST
TRIAXIAL COMPRESSION TESTJOB…. OKOMU PRESSING STATION DATE…24/06/2018………
2KN/m310, 205, 100CELL PRESSURE:…… DIAMETER…… LENGTH…… m10.5,5BH… SAMPLE NO
FRICTION ANGLE:. ....11.62º..... COHESION:... 18.0kN/m²..... WET WEIGHT:..155g,135g,160g.... DRY WEIGHTg,g.... MOISTURE CONTENT:..........
DESCRIPTION OF SAMPLE
……………………………………………………
…………………………………………………..
SKETCH OF SAMPLE AFTER SHEAR
Compressive Sress
Corresponding Strain
y = 0.2057x + 18
0
50
100
150
200
250
300
0 50 100 150 200 250 300 350 400 450 500 550 600 650 700
SH
EA
R
ST
RE
SS
(τ)
NORMAL STRESS(σ)
TRIAXIAL COMPRESSION TEST CHART
228

Strai
n Dial
Stress
Dial SD2 SD3
Stress
Dial Diff SDD2 SDD3
Area Sq
m
Compres
sive
Stress CS2 CS3
Strain
%
0 0 0 0 0.00 0.00 0.00 0.00114 0.00 0.00 0.00 0.00
15 3.2 4 9 0.01 0.02 0.04 0.00115 11.87 14.84 33.40 0.50
30 4 6 12.8 0.02 0.03 0.05 0.00115 14.84 22.26 47.50 1.00
45 5 6.8 15.9 0.02 0.03 0.07 0.00116 18.39 25.02 58.49 1.50
60 5.8 8 17.2 0.02 0.03 0.07 0.00116 21.34 29.43 63.27 2.00
75 6.5 8.9 19 0.03 0.04 0.08 0.00117 23.71 32.46 69.30 2.50
90 7.1 9 20.2 0.03 0.04 0.09 0.00118 25.68 32.55 73.05 3.00
105 8 10 21.5 0.03 0.04 0.09 0.00118 28.93 36.16 77.75 3.50
120 8.8 10.5 22.8 0.04 0.04 0.10 0.00119 31.56 37.65 81.76 4.00
135 9.2 11 23.9 0.04 0.05 0.10 0.00119 32.99 39.45 85.71 4.50
150 9.8 11.9 25 0.04 0.05 0.11 0.00120 34.85 42.32 88.90 5.00
165 10.3 12.5 26.1 0.04 0.05 0.11 0.00121 36.33 44.08 92.05 5.50
180 11 13.2 27.2 0.05 0.06 0.12 0.00121 38.79 46.55 95.93 6.00
210 11.8 14.5 29.5 0.05 0.06 0.13 0.00122 41.27 50.72 103.19 7.00
240 13 15.8 31.2 0.06 0.07 0.13 0.00124 48.18 54.37 107.37 8.00
270 14 17 33 0.06 0.07 0.14 0.00125 50.53 58.04 112.66 9.00
300 14.8 17.8 34.5 0.07 0.08 0.15 0.00127 51.41 59.81 115.92 10.00
330 15.3 19.3 36.2 0.07 0.08 0.15 0.00128 53.34 64.34 120.69 11.00
360 16 20.3 37.8 0.07 0.09 0.16 0.00130 53.51 66.64 124.08 12.00
390 16.3 21.5 39.8 0.07 0.09 0.17 0.00131 53.10 70.04 129.65 12.00
420 16.3 22.5 41.1 0.07 0.10 0.18 0.00131 53.10 73.29 133.88 13.00
450 16.3 23.2 42.5 0.07 0.10 0.18 0.00133 52.30 74.44 136.36 14.00
480 16.3 24.5 43.8 0.07 0.10 0.19 0.00134 51.91 78.02 139.49 15.00
510 16.3 25.2 44.5 0.07 0.11 0.19 0.00136 51.15 79.07 139.63 16.00
540 16.3 26.1 45.5 0.07 0.11 0.19 0.00137 50.77 81.30 141.73 17.00
570 16.3 27 46.1 0.07 0.12 0.20 0.00139 50.04 82.89 141.53 18.00
600 16.3 27.8 47 0.07 0.12 0.20 0.00139 50.04 85.35 144.29 19.00
630 16.3 28 47.8 0.07 0.12 0.20 0.00143 48.64 83.56 142.64 20.00
660 16.3 28.8 48.7 0.07 0.12 0.21 0.00144 48.30 85.35 144.32 21.00
690 16.3 29.2 49.2 0.07 0.12 0.21 0.00146 47.64 85.35 143.80 22.00
720 16.3 30 49.5 0.07 0.13 0.21 0.00150 46.37 85.35 140.82 24.00
750 16.3 30.7 50.1 0.07 0.13 0.21 0.00152 45.76 86.19 140.65 25.00
∂3 ∂2 ∂1 Radius Centre1 100.00 53.51 153.51 26.753 126.753
0.00 14.79 19.93 23.17 25.23 26.38 26.75 26.38 25.23 23.17 19.93 14.79 0.00
100.00 104.47 108.91 113.38 117.84 122.29 126.75 131.22 135.66 140.13 144.60 149.04 153.51
2 205.00 86.19 291.19 43.0946 248.095
0.00 23.83 32.11 37.32 40.64 42.49 43.09 42.49 40.64 37.32 32.11 23.83 0.00
205.00 212.20 219.35 226.55 233.74 240.90 248.09 255.29 262.45 269.64 276.84 283.99 291.19
3 310.00 144.32 454.32 72.1597 382.16
0.00 39.90 53.76 62.49 68.05 71.15 72.16 71.15 68.05 62.49 53.76 39.90 0.00
310.00 322.05 334.03 346.08 358.13 370.11 382.16 394.21 406.19 418.24 430.29 442.27 454.32
5 132
0 700
GEOTECHNICAL ENGINEERING LABORATORY TEST
TRIAXIAL COMPRESSION TESTJOB…. OKOMU PRESSING STATION DATE…24/06/2018………
2KN/m310, 205, 100CELL PRESSURE:…… DIAMETER…… LENGTH…… m14.5,5BH… SAMPLE NO
FRICTION ANGLE:. ...10.28º..... COHESION:... 5.0kN/m²..... WET WEIGHT:..123g,137g,155g.... DRY WEIGHTg,g.... MOISTURE CONTENT:..........
DESCRIPTION OF SAMPLE
……………………………………………………
…………………………………………………..
SKETCH OF SAMPLE AFTER SHEAR
Compressive Sress
Corresponding Strain
y = 0.1814x + 5
0
50
100
150
200
0 50 100 150 200 250 300 350 400 450 500 550
SH
EA
R
ST
RE
SS
(τ)
NORMAL STRESS(σ)
TRIAXIAL COMPRESSION TEST CHART
229

Strai
n Dial
Stress
Dial SD2 SD3
Stress
Dial Diff SDD2 SDD3
Area Sq
m
Compres
sive
Stress CS2 CS3
Strain
%
0 0 0 0 0.00 0.00 0.00 0.00114 0.00 0.00 0.00 0.00
15 2 2 5 0.01 0.01 0.02 0.00115 7.42 7.42 18.55 0.50
30 3 4 9 0.01 0.02 0.04 0.00115 11.13 14.84 33.40 1.00
45 4.1 5.5 10.5 0.02 0.02 0.04 0.00116 15.08 20.23 38.63 1.50
60 4.7 7 12 0.02 0.03 0.05 0.00116 17.29 25.75 44.15 2.00
75 4.7 8 14 0.02 0.03 0.06 0.00117 17.14 29.18 51.06 2.50
90 5 11 15 0.02 0.05 0.06 0.00118 18.08 39.78 54.25 3.00
105 5.2 13 16.5 0.02 0.06 0.07 0.00118 18.81 47.01 59.67 3.50
120 5.5 15 18 0.02 0.06 0.08 0.00119 19.72 53.79 64.55 4.00
135 5.7 16.5 21 0.02 0.07 0.09 0.00119 20.44 59.17 75.31 4.50
150 6 19 21.5 0.03 0.08 0.09 0.00120 21.34 67.57 76.46 5.00
165 6.4 21 22.5 0.03 0.09 0.10 0.00121 22.57 74.06 79.35 5.50
180 7 22 23 0.03 0.09 0.10 0.00121 24.69 77.59 81.11 6.00
210 7.5 24 25 0.03 0.10 0.11 0.00122 26.23 83.95 87.45 7.00
240 8 27 28 0.04 0.12 0.12 0.00124 29.25 92.92 96.36 8.00
270 8.5 30 31 0.04 0.13 0.13 0.00125 30.72 102.42 105.83 9.00
300 9 32 32 0.04 0.14 0.14 0.00127 31.92 107.52 107.52 10.00
330 9.5 33 33 0.04 0.14 0.14 0.00128 32.34 110.02 110.02 11.00
360 9.7 34.5 35 0.04 0.15 0.15 0.00130 32.83 113.25 114.89 12.00
390 10 35 37.5 0.04 0.15 0.16 0.00131 32.58 114.01 122.16 12.00
420 10 36 39 0.04 0.15 0.17 0.00131 32.58 117.27 127.04 13.00
450 10 36.8 41 0.04 0.16 0.17 0.00133 32.09 118.07 131.55 14.00
480 10 37 42 0.04 0.16 0.18 0.00134 31.85 117.83 133.75 15.00
510 10 38.5 43 0.04 0.16 0.18 0.00136 31.38 120.80 134.92 16.00
540 10 39 43 0.04 0.17 0.18 0.00137 31.15 121.48 133.94 17.00
570 10 39.5 43 0.04 0.17 0.18 0.00139 30.70 121.27 132.01 18.00
600 10 40 43 0.04 0.17 0.18 0.00139 30.70 122.80 132.01 19.00
630 10 40 43 0.04 0.17 0.18 0.00143 29.84 119.37 128.32 20.00
660 10 40 43 0.04 0.17 0.18 0.00144 29.63 118.54 127.43 21.00
690 10 40 43 0.04 0.17 0.18 0.00146 29.23 116.91 125.68 22.00
720 10 40 43 0.04 0.17 0.18 0.00150 28.45 113.80 122.33 24.00
750 10 40 43 0.04 0.17 0.18 0.00152 28.07 112.30 120.72 25.00
∂3 ∂2 ∂1 Radius Centre1 100.00 32.83 132.83 16.4129 116.413
0.00 9.08 12.23 14.21 15.48 16.18 16.41 16.18 15.48 14.21 12.23 9.08 0.00
100.00 102.74 105.47 108.21 110.95 113.67 116.41 119.15 121.88 124.62 127.36 130.08 132.83
2 205.00 122.80 327.80 61.4007 266.401
0.00 33.95 45.74 53.17 57.90 60.54 61.40 60.54 57.90 53.17 45.74 33.95 0.00
205.00 215.25 225.45 235.70 245.95 256.15 266.40 276.65 286.85 297.10 307.35 317.55 327.80
3 310.00 134.92 444.92 67.4618 377.462
0.00 37.31 50.26 58.42 63.62 66.52 67.46 66.52 63.62 58.42 50.26 37.31 0.00
310.00 321.27 332.46 343.73 355.00 366.20 377.46 388.73 399.93 411.19 422.46 433.66 444.92
46 76
0 500
GEOTECHNICAL ENGINEERING LABORATORY TEST
TRIAXIAL COMPRESSION TESTJOB…. OKOMU STORAGE TANK DATE…24/06/2018………
2KN/m310, 205, 100CELL PRESSURE:…… DIAMETER…… LENGTH…… m15.5,6BH… SAMPLE NO
FRICTION ANGLE:. ....3.43º..... COHESION:...46.0kN/m²..... WET WEIGHT:..152g,157g,166g.... DRY WEIGHTg,g.... MOISTURE CONTENT:..........
DESCRIPTION OF SAMPLE
……………………………………………………
…………………………………………………..
SKETCH OF SAMPLE AFTER SHEAR
Compressive Sress
Corresponding Strain
y = 0.06x + 46
0
20
40
60
80
100
120
140
160
180
200
0 50 100 150 200 250 300 350 400 450 500
SH
EA
R
ST
RE
SS
(τ)
NORMAL STRESS(σ)
TRIAXIAL COMPRESSION TEST CHART
230

Strai
n Dial
Stress
Dial SD2 SD3
Stress
Dial Diff SDD2 SDD3
Area Sq
m
Compres
sive
Stress CS2 CS3
Strain
%
0 0 0 0 0.00 0.00 0.00 0.00114 0.00 0.00 0.00 0.00
15 2.5 4 4 0.01 0.02 0.02 0.00115 9.28 14.84 14.84 0.50
30 3 8 11.5 0.01 0.03 0.05 0.00115 11.13 29.69 42.67 1.00
45 3.5 9 14 0.01 0.04 0.06 0.00116 12.88 33.11 51.50 1.50
60 4.2 10 16 0.02 0.04 0.07 0.00116 15.45 36.79 58.86 2.00
75 5 18 17.5 0.02 0.08 0.07 0.00117 18.24 65.65 63.83 2.50
90 5.8 21 19 0.02 0.09 0.08 0.00118 20.98 75.94 68.71 3.00
105 6.3 23 20 0.03 0.10 0.09 0.00118 22.78 83.18 72.33 3.50
120 7 24 21 0.03 0.10 0.09 0.00119 25.10 86.06 75.31 4.00
135 8 25.5 22 0.03 0.11 0.09 0.00119 28.69 91.44 78.89 4.50
150 8.5 27 23 0.04 0.12 0.10 0.00120 30.23 96.02 81.79 5.00
165 9.3 29 24.5 0.04 0.12 0.10 0.00121 32.80 102.28 86.41 5.50
180 10 30 25 0.04 0.13 0.11 0.00121 35.27 105.80 88.17 6.00
210 11.5 32 28 0.05 0.14 0.12 0.00122 40.23 111.93 97.94 7.00
240 13.1 34 30 0.06 0.15 0.13 0.00124 51.62 117.01 103.24 8.00
270 15 35.5 32 0.07 0.15 0.14 0.00125 56.33 121.19 109.24 9.00
300 16.5 37 34 0.08 0.16 0.15 0.00127 60.48 124.32 114.24 10.00
330 18 38 36 0.08 0.16 0.15 0.00128 64.34 126.69 120.02 11.00
360 19.3 38.5 37.5 0.09 0.16 0.16 0.00130 65.98 126.38 123.10 12.00
390 20.1 40 39 0.09 0.17 0.17 0.00131 67.76 130.30 127.04 12.00
420 20.8 40.5 40 0.09 0.17 0.17 0.00131 67.76 131.93 130.30 13.00
450 20.8 41 41.5 0.09 0.17 0.18 0.00133 66.74 131.55 133.15 14.00
480 20.8 41.8 42.8 0.09 0.18 0.18 0.00134 66.24 133.12 136.30 15.00
510 20.8 42 43.5 0.09 0.18 0.19 0.00136 65.27 131.79 136.49 16.00
540 20.8 42 44 0.09 0.18 0.19 0.00137 64.79 130.82 137.05 17.00
570 20.8 42.5 45 0.09 0.18 0.19 0.00139 63.86 130.48 138.15 18.00
600 20.8 42.5 45.5 0.09 0.18 0.19 0.00139 63.86 130.48 139.69 19.00
630 20.8 43 46 0.09 0.18 0.20 0.00143 62.07 128.32 137.27 20.00
660 20.8 43.5 47 0.09 0.19 0.20 0.00144 61.64 128.91 139.28 21.00
690 20.8 44 47.2 0.09 0.19 0.20 0.00146 60.80 128.61 137.96 22.00
720 20.8 44.2 48 0.09 0.19 0.20 0.00150 59.17 125.74 136.56 24.00
750 20.8 45 49 0.09 0.19 0.21 0.00152 58.40 126.34 137.57 25.00
∂3 ∂2 ∂1 Radius Centre1 100.00 67.76 167.76 33.8782 133.878
0.00 18.73 25.24 29.34 31.95 33.40 33.88 33.40 31.95 29.34 25.24 18.73 0.00
100.00 105.66 111.28 116.94 122.60 128.22 133.88 139.54 145.16 150.82 156.47 162.10 167.76
2 205.00 133.12 338.12 66.5579 271.558
0.00 36.81 49.59 57.64 62.76 65.63 66.56 65.63 62.76 57.64 49.59 36.81 0.00
205.00 216.12 227.16 238.28 249.39 260.44 271.56 282.67 293.72 304.84 315.95 327.00 338.12
3 310.00 139.69 449.69 69.8433 379.843
0.00 38.62 52.03 60.48 65.86 68.87 69.84 68.87 65.86 60.48 52.03 38.62 0.00
310.00 321.66 333.26 344.92 356.59 368.18 379.84 391.51 403.10 414.76 426.43 438.02 449.69
3 125
0 500
GEOTECHNICAL ENGINEERING LABORATORY TEST
TRIAXIAL COMPRESSION TESTJOB…. STORAGE TANK DATE…24/06/2018………
2KN/m310, 205, 100CELL PRESSURE:…… DIAMETER…… LENGTH…… m1.0,6BH… SAMPLE NO
FRICTION ANGLE:. ....13.71º..... COHESION:...3.00kN/m²..... WET WEIGHT:..135g,156g,158g.... DRY WEIGHTg,g.... MOISTURE CONTENT:..........
DESCRIPTION OF SAMPLE
……………………………………………………
…………………………………………………..
SKETCH OF SAMPLE AFTER SHEAR
Compressive Sress
Corresponding Strain
y = 0.244x + 3
0
20
40
60
80
100
120
140
160
180
200
0 50 100 150 200 250 300 350 400 450 500
SH
EA
R
ST
RE
SS
(τ)
NORMAL STRESS(σ)
TRIAXIAL COMPRESSION TEST CHART
231

Strai
n Dial
Stress
Dial SD2 SD3
Stress
Dial Diff SDD2 SDD3
Area Sq
m
Compres
sive
Stress CS2 CS3
Strain
%
0 0 0 0 0.00 0.00 0.00 0.00114 0.00 0.00 0.00 0.00
15 3 7.5 7 0.01 0.03 0.03 0.00115 11.13 27.83 25.98 0.50
30 5 8 10 0.02 0.03 0.04 0.00115 18.55 29.69 37.11 1.00
45 6 9.5 11.5 0.03 0.04 0.05 0.00116 22.07 34.95 42.31 1.50
60 7 10.8 12.5 0.03 0.05 0.05 0.00116 25.75 39.73 45.98 2.00
75 7.5 12 13.8 0.03 0.05 0.06 0.00117 27.35 43.77 50.33 2.50
90 8 13 14.5 0.03 0.06 0.06 0.00118 28.93 47.01 52.44 3.00
105 8.5 13.8 16 0.04 0.06 0.07 0.00118 30.74 49.91 57.86 3.50
120 9 14.7 17 0.04 0.06 0.07 0.00119 32.27 52.71 60.96 4.00
135 10 15.5 18 0.04 0.07 0.08 0.00119 35.86 55.58 64.55 4.50
150 11 16.1 19 0.05 0.07 0.08 0.00120 39.12 57.25 67.57 5.00
165 11.2 17 20 0.05 0.07 0.09 0.00121 39.50 59.95 70.53 5.50
180 12 17.8 20.5 0.05 0.08 0.09 0.00121 42.32 62.78 72.30 6.00
210 13.5 19.2 22.5 0.06 0.08 0.10 0.00122 47.22 67.16 78.70 7.00
240 15 20.8 24 0.07 0.09 0.10 0.00124 55.06 71.58 82.59 8.00
270 16 21.8 25.5 0.07 0.09 0.11 0.00125 58.04 74.42 87.05 9.00
300 17 23 27 0.08 0.10 0.12 0.00127 60.48 77.28 90.72 10.00
330 18 24 28.5 0.08 0.10 0.12 0.00128 65.01 80.01 95.02 11.00
360 19.5 25 30 0.09 0.11 0.13 0.00130 68.93 82.06 98.48 12.00
390 21 25.8 31 0.09 0.11 0.13 0.00131 71.67 84.04 100.98 12.00
420 22 26.7 32 0.10 0.11 0.14 0.00131 74.92 86.98 104.24 13.00
450 23 27.5 33.5 0.10 0.12 0.14 0.00133 75.40 88.23 107.49 14.00
480 23.5 28.5 35 0.10 0.12 0.15 0.00134 76.43 90.76 111.46 15.00
510 24 29.3 36 0.10 0.13 0.15 0.00136 76.88 91.94 112.96 16.00
540 24.5 30 37 0.10 0.13 0.16 0.00137 76.31 93.45 115.25 17.00
570 24.5 31 38 0.11 0.13 0.16 0.00139 76.75 95.17 116.66 18.00
600 25 31.5 39 0.11 0.13 0.17 0.00139 78.29 96.71 119.73 19.00
630 25.5 32.7 40.5 0.11 0.14 0.17 0.00143 77.59 97.58 120.86 20.00
660 26 33 41.5 0.11 0.14 0.18 0.00144 79.42 97.79 122.98 21.00
690 26.8 33.5 42 0.12 0.14 0.18 0.00146 80.38 97.92 122.76 22.00
720 27.5 34 43 0.12 0.15 0.18 0.00150 79.66 96.73 122.33 24.00
750 28 34 43.8 0.12 0.15 0.19 0.00152 78.61 95.45 122.97 25.00
∂3 ∂2 ∂1 Radius Centre1 100.00 80.38 180.38 40.1891 140.189
0.00 22.22 29.94 34.80 37.90 39.63 40.19 39.63 37.90 34.80 29.94 22.22 0.00
100.00 106.71 113.38 120.09 126.81 133.48 140.19 146.90 153.57 160.28 167.00 173.67 180.38
2 205.00 97.92 302.92 48.9576 253.958
0.00 27.07 36.47 42.40 46.17 48.27 48.96 48.27 46.17 42.40 36.47 27.07 0.00
205.00 213.18 221.30 229.48 237.65 245.78 253.96 262.13 270.26 278.44 286.61 294.74 302.92
3 310.00 122.98 432.98 61.4913 371.491
0.00 34.00 45.81 53.25 57.99 60.63 61.49 60.63 57.99 53.25 45.81 34.00 0.00
310.00 320.27 330.48 340.75 351.01 361.22 371.49 381.76 391.97 402.24 412.51 422.71 432.98
22.5 77
0 500
GEOTECHNICAL ENGINEERING LABORATORY TEST
TRIAXIAL COMPRESSION TESTJOB…. STORAGE TANK DATE…24/06/2018………
2KN/m310, 205, 100CELL PRESSURE:…… DIAMETER…… LENGTH…… m7.0,6BH… SAMPLE NO
FRICTION ANGLE:. ....6.22º..... COHESION:...22.5kN/m²..... WET WEIGHT:..129g,153g,155g.... DRY WEIGHTg,g.... MOISTURE CONTENT:..........
DESCRIPTION OF SAMPLE
……………………………………………………
…………………………………………………..
SKETCH OF SAMPLE AFTER SHEAR
Compressive Sress
Corresponding Strain
y = 0.109x + 22.5
0
20
40
60
80
100
120
140
160
180
200
0 50 100 150 200 250 300 350 400 450 500
SH
EA
R
ST
RE
SS
(τ)
NORMAL STRESS(σ)
TRIAXIAL COMPRESSION TEST CHART
232

Strai
n Dial
Stress
Dial SD2 SD3
Stress
Dial Diff SDD2 SDD3
Area Sq
m
Compres
sive
Stress CS2 CS3
Strain
%
0 0 0 0 0.00 0.00 0.00 0.00114 0.00 0.00 0.00 0.00
15 2 7 2.5 0.01 0.03 0.01 0.00115 7.42 25.98 9.28 0.50
30 2.2 8 4 0.01 0.03 0.02 0.00115 8.16 29.69 14.84 1.00
45 2.8 9 5 0.01 0.04 0.02 0.00116 10.30 33.11 18.39 1.50
60 3.5 10 6 0.01 0.04 0.03 0.00116 12.88 36.79 22.07 2.00
75 4 11 7.5 0.02 0.05 0.03 0.00117 14.59 40.12 27.35 2.50
90 4.8 12 9 0.02 0.05 0.04 0.00118 17.36 43.40 32.55 3.00
105 5.5 13 10 0.02 0.06 0.04 0.00118 19.89 47.01 36.16 3.50
120 6 14.5 11 0.03 0.06 0.05 0.00119 21.52 52.00 39.45 4.00
135 6.5 15.5 12 0.03 0.07 0.05 0.00119 23.31 55.58 43.03 4.50
150 7.5 16.5 13.5 0.03 0.07 0.06 0.00120 26.67 58.68 48.01 5.00
165 8 17.5 14.5 0.03 0.07 0.06 0.00121 28.21 61.72 51.14 5.50
180 8.8 19 16 0.04 0.08 0.07 0.00121 31.04 67.01 56.43 6.00
210 10 20.5 18.5 0.04 0.09 0.08 0.00122 34.98 71.71 64.71 7.00
240 11 21.5 21 0.05 0.09 0.09 0.00124 41.30 73.99 72.27 8.00
270 12 23 23 0.06 0.10 0.10 0.00125 44.38 78.52 78.52 9.00
300 13 24 24.5 0.06 0.10 0.10 0.00127 47.04 80.64 82.32 10.00
330 14 25 26 0.06 0.11 0.11 0.00128 50.01 83.35 86.68 11.00
360 15 26 28 0.07 0.11 0.12 0.00130 52.52 85.35 91.91 12.00
390 16 27 30 0.07 0.12 0.13 0.00131 54.73 87.95 97.73 12.00
420 16.8 28 31.5 0.07 0.12 0.13 0.00131 57.01 91.21 102.61 13.00
450 17.5 29 33 0.08 0.12 0.14 0.00133 59.36 93.05 105.88 14.00
480 18.5 30 34.5 0.08 0.13 0.15 0.00134 60.51 95.54 109.87 15.00
510 19 30.5 35.5 0.09 0.13 0.15 0.00136 62.76 95.70 111.39 16.00
540 20 31 36.5 0.09 0.13 0.16 0.00137 63.85 96.56 113.69 17.00
570 20.5 31.5 37 0.09 0.13 0.16 0.00139 64.47 96.71 113.59 18.00
600 21 32 38 0.09 0.14 0.16 0.00139 66.01 98.24 116.66 19.00
630 21.5 33 38.8 0.09 0.14 0.17 0.00143 65.65 98.48 115.79 20.00
660 22 33.5 39.2 0.09 0.14 0.17 0.00144 65.79 99.28 116.17 21.00
690 22.2 34 40 0.10 0.15 0.17 0.00146 65.76 99.38 116.91 22.00
720 22.5 34.5 41 0.10 0.15 0.17 0.00150 65.43 98.15 116.64 24.00
750 23 35 41 0.10 0.15 0.17 0.00152 64.57 98.26 115.11 25.00
∂3 ∂2 ∂1 Radius Centre1 100.00 66.01 166.01 33.0029 133.003
0.00 18.25 24.59 28.58 31.12 32.54 33.00 32.54 31.12 28.58 24.59 18.25 0.00
100.00 105.51 110.99 116.50 122.01 127.49 133.00 138.51 143.99 149.50 155.02 160.49 166.01
2 205.00 99.38 304.38 49.6883 254.688
0.00 27.48 37.02 43.03 46.86 48.99 49.69 48.99 46.86 43.03 37.02 27.48 0.00
205.00 213.30 221.55 229.84 238.14 246.39 254.69 262.99 271.23 279.53 287.83 296.08 304.38
3 310.00 116.91 426.91 58.4568 368.457
0.00 32.33 43.55 50.62 55.12 57.64 58.46 57.64 55.12 50.62 43.55 32.33 0.00
310.00 319.76 329.47 339.23 348.99 358.69 368.46 378.22 387.92 397.69 407.45 417.15 426.91
15 113
0 700
GEOTECHNICAL ENGINEERING LABORATORY TEST
TRIAXIAL COMPRESSION TESTJOB…. OKOMU WEIGH BRIDGE DATE…24/06/2018………
2KN/m310, 205, 100CELL PRESSURE:…… DIAMETER…… LENGTH…… m4.0,7BH… SAMPLE NO
FRICTION ANGLE:. ....7.97º..... COHESION:... 15.0kN/m²..... WET WEIGHT:..g,g,160g.... DRY WEIGHTg,g.... MOISTURE CONTENT:..........
DESCRIPTION OF SAMPLE
……………………………………………………
…………………………………………………..
SKETCH OF SAMPLE AFTER SHEAR
Compressive Sress
Corresponding Strain
y = 0.14x + 15
0
20
40
60
80
100
120
140
160
180
200
0 50 100 150 200 250 300 350 400 450
SH
EA
R
ST
RE
SS
(τ)
NORMAL STRESS(σ)
TRIAXIAL COMPRESSION TEST CHART
233

Strai
n Dial
Stress
Dial SD2 SD3
Stress
Dial Diff SDD2 SDD3
Area Sq
m
Compres
sive
Stress CS2 CS3
Strain
%
0 0 0 0 0.00 0.00 0.00 0.00114 0.00 0.00 0.00 0.00
15 6 12 11.5 0.03 0.05 0.05 0.00115 22.26 44.53 42.67 0.50
30 9 22 17 0.04 0.09 0.07 0.00115 33.40 81.64 63.08 1.00
45 11.5 28 22.5 0.05 0.12 0.10 0.00116 42.31 103.01 82.77 1.50
60 13 32.5 26 0.06 0.14 0.11 0.00116 47.82 119.56 95.65 2.00
75 14.8 36 29 0.06 0.15 0.12 0.00117 53.98 131.30 105.77 2.50
90 15.9 39.3 32 0.07 0.17 0.14 0.00118 57.50 142.12 115.72 3.00
105 17 42 33.7 0.07 0.18 0.14 0.00118 61.48 151.89 121.87 3.50
120 18.5 45 36.1 0.08 0.19 0.15 0.00119 66.34 161.37 129.45 4.00
135 20 47.5 38.5 0.09 0.20 0.16 0.00119 71.72 170.34 138.06 4.50
150 21.5 50 41 0.09 0.21 0.17 0.00120 76.46 177.81 145.80 5.00
165 23.1 52.5 43 0.10 0.22 0.18 0.00121 81.47 185.15 151.65 5.50
180 25 55 45 0.11 0.23 0.19 0.00121 88.17 193.97 158.70 6.00
210 28.8 59.3 49 0.12 0.25 0.21 0.00122 100.74 207.42 171.39 7.00
240 32 63.5 53.8 0.15 0.27 0.23 0.00124 122.17 218.53 185.15 8.00
270 35.5 68.8 58.1 0.17 0.29 0.25 0.00125 132.46 234.87 198.35 9.00
300 38.8 73.5 63 0.18 0.31 0.27 0.00127 139.44 246.97 211.69 10.00
330 41.5 77.8 69 0.19 0.33 0.29 0.00128 148.36 259.37 230.04 11.00
360 44.5 81.8 73.8 0.20 0.35 0.31 0.00130 153.30 268.51 242.25 12.00
390 46.7 84 78 0.21 0.36 0.33 0.00131 157.99 273.63 254.09 12.00
420 48.5 87.5 80.3 0.21 0.37 0.34 0.00131 162.88 285.03 261.58 13.00
450 50 87.5 84 0.22 0.37 0.36 0.00133 162.99 280.75 269.52 14.00
480 50.8 87.5 87.5 0.22 0.37 0.37 0.00134 162.10 278.65 278.65 15.00
510 50.9 87.5 91 0.22 0.37 0.39 0.00136 159.71 274.55 285.54 16.00
540 50.9 87.5 93.5 0.22 0.37 0.40 0.00137 158.55 272.55 291.24 17.00
570 50.9 87.5 96.2 0.22 0.37 0.41 0.00139 156.26 268.63 295.34 18.00
600 50.9 87.5 97.1 0.22 0.37 0.41 0.00139 156.26 268.63 298.10 19.00
630 50.9 87.5 100 0.22 0.37 0.43 0.00143 151.89 261.11 298.42 20.00
660 50.9 87.5 102 0.22 0.37 0.44 0.00144 150.84 259.30 302.27 21.00
690 50.9 87.5 103.9 0.22 0.37 0.44 0.00146 148.77 255.75 303.68 22.00
720 50.9 87.5 105.2 0.22 0.37 0.45 0.00150 144.81 248.93 299.28 24.00
750 50.9 87.5 107 0.22 0.37 0.46 0.00152 142.90 245.65 300.40 25.00
∂3 ∂2 ∂1 Radius Centre1 100.00 162.99 262.99 81.4968 181.497
0.00 45.07 60.72 70.58 76.85 80.36 81.50 80.36 76.85 70.58 60.72 45.07 0.00
100.00 113.61 127.14 140.75 154.36 167.89 181.50 195.11 208.64 222.25 235.86 249.38 262.99
2 205.00 285.03 490.03 142.516 347.516
0.00 78.81 106.17 123.42 134.39 140.52 142.52 140.52 134.39 123.42 106.17 78.81 0.00
205.00 228.80 252.46 276.26 300.06 323.72 347.52 371.32 394.97 418.77 442.57 466.23 490.03
3 310.00 303.68 613.68 151.842 461.842
0.00 83.97 113.12 131.49 143.19 149.72 151.84 149.72 143.19 131.49 113.12 83.97 0.00
310.00 335.36 360.56 385.92 411.28 436.48 461.84 487.20 512.40 537.76 563.12 588.33 613.68
40 221
0 700
GEOTECHNICAL ENGINEERING LABORATORY TEST
TRIAXIAL COMPRESSION TESTJOB…. OKOMU WEIGH BRIDGE DATE…24/06/2018………
2KN/m310, 205, 100CELL PRESSURE:…… DIAMETER…… LENGTH…… m15.0,7BH… SAMPLE NO
FRICTION ANGLE:. ....14.49º..... COHESION:... 40.0kN/m²..... WET WEIGHT:..134g,155g,160g.... DRY WEIGHTg,g.... MOISTURE CONTENT:..........
DESCRIPTION OF SAMPLE
……………………………………………………
…………………………………………………..
SKETCH OF SAMPLE AFTER SHEAR
Compressive Sress
Corresponding Strain
y = 0.2586x + 40
0
50
100
150
200
250
300
0 50 100 150 200 250 300 350 400 450 500 550 600 650 700
SH
EA
R
ST
RE
SS
(τ)
NORMAL STRESS(σ)
TRIAXIAL COMPRESSION TEST CHART
234

Strai
n Dial
Stress
Dial SD2 SD3
Stress
Dial Diff SDD2 SDD3
Area Sq
m
Compres
sive
Stress CS2 CS3
Strain
%
0 0 0 0 0.00 0.00 0.00 0.00114 0.00 0.00 0.00 0.00
15 10.5 6 17 0.04 0.03 0.07 0.00115 38.96 22.26 63.08 0.50
30 13 20.5 25.5 0.06 0.09 0.11 0.00115 48.24 76.07 94.62 1.00
45 14.5 22.5 30.6 0.06 0.10 0.13 0.00116 53.34 82.77 112.57 1.50
60 16 24.5 33.5 0.07 0.10 0.14 0.00116 58.86 90.13 123.24 2.00
75 18 26.5 35.7 0.08 0.11 0.15 0.00117 65.65 96.65 130.21 2.50
90 19 28.5 37.5 0.08 0.12 0.16 0.00118 68.71 103.07 135.61 3.00
105 21 30 39.5 0.09 0.13 0.17 0.00118 75.94 108.49 142.85 3.50
120 23 31.5 41.2 0.10 0.13 0.18 0.00119 82.48 112.96 147.74 4.00
135 25 32.8 43 0.11 0.14 0.18 0.00119 89.65 117.62 154.20 4.50
150 26.5 34 45 0.11 0.15 0.19 0.00120 94.24 120.91 160.03 5.00
165 28.5 35 46.9 0.12 0.15 0.20 0.00121 100.51 123.44 165.40 5.50
180 30 36.7 48.5 0.13 0.16 0.21 0.00121 105.80 129.43 171.05 6.00
210 33.5 39.5 52.5 0.14 0.17 0.22 0.00122 117.18 138.16 183.64 7.00
240 36.3 42.2 55.3 0.17 0.18 0.24 0.00124 134.22 145.23 190.31 8.00
270 39 45 59 0.17 0.19 0.25 0.00125 139.97 153.62 201.42 9.00
300 41 46.5 61.5 0.18 0.20 0.26 0.00127 144.49 156.25 206.65 10.00
330 43 48.3 64 0.19 0.21 0.27 0.00128 148.36 161.03 213.37 11.00
360 44.5 49.5 66.5 0.20 0.21 0.28 0.00130 151.00 162.49 218.29 12.00
390 46 50.9 68.9 0.20 0.22 0.29 0.00131 153.10 165.81 224.44 12.00
420 47 52 70.5 0.21 0.22 0.30 0.00131 156.69 169.39 229.66 13.00
450 48.1 53.3 73 0.21 0.23 0.31 0.00133 157.22 171.01 234.22 14.00
480 49 54.3 76.5 0.21 0.23 0.33 0.00134 160.18 172.92 243.62 15.00
510 50.3 55.5 80.3 0.22 0.24 0.34 0.00136 160.65 174.15 251.96 16.00
540 51.2 56.9 83 0.22 0.24 0.35 0.00137 161.97 177.24 258.53 17.00
570 52 58 86 0.23 0.25 0.37 0.00139 162.71 178.06 264.02 18.00
600 53 60 88.5 0.23 0.26 0.38 0.00139 166.09 184.20 271.70 19.00
630 54.1 61.9 91 0.23 0.26 0.39 0.00143 164.13 184.72 271.56 20.00
660 55 63.5 93.5 0.24 0.27 0.40 0.00144 165.06 188.18 277.08 21.00
690 55.7 64.5 96 0.24 0.28 0.41 0.00146 166.31 188.52 280.59 22.00
720 56.9 65.5 98.5 0.25 0.28 0.42 0.00150 165.00 186.34 280.22 24.00
750 58 67 100.5 0.25 0.29 0.43 0.00152 162.83 188.10 282.15 25.00
∂3 ∂2 ∂1 Radius Centre1 100.00 166.31 266.31 83.1549 183.155
0.00 45.98 61.95 72.01 78.42 81.99 83.15 81.99 78.42 72.01 61.95 45.98 0.00
100.00 113.89 127.69 141.58 155.46 169.27 183.15 197.04 210.85 224.73 238.62 252.42 266.31
2 205.00 188.52 393.52 94.2617 299.262
0.00 52.13 70.22 81.63 88.89 92.94 94.26 92.94 88.89 81.63 70.22 52.13 0.00
205.00 220.74 236.39 252.13 267.87 283.52 299.26 315.00 330.65 346.39 362.13 377.78 393.52
3 310.00 282.15 592.15 141.075 451.075
0.00 78.01 105.10 122.17 133.03 139.10 141.08 139.10 133.03 122.17 105.10 78.01 0.00
310.00 333.56 356.98 380.54 404.10 427.52 451.08 474.63 498.05 521.61 545.17 568.59 592.15
45 202
0 700
GEOTECHNICAL ENGINEERING LABORATORY TEST
TRIAXIAL COMPRESSION TESTJOB…. OKOMU WATER TANK DATE…24/06/2018………
2KN/m310, 205, 100CELL PRESSURE:…… DIAMETER…… LENGTH…… m3.0,8BH… SAMPLE NO
FRICTION ANGLE:. ....12.64º..... COHESION:... 45.0kN/m².... WET WEIGHT:..156g,160g,160g.... DRY WEIGHTg,g.... MOISTURE CONTENT:..........
DESCRIPTION OF SAMPLE
……………………………………………………
…………………………………………………..
SKETCH OF SAMPLE AFTER SHEAR
Compressive Sress
Corresponding Strain
y = 0.2243x + 45
0
50
100
150
200
250
300
0 50 100 150 200 250 300 350 400 450 500 550 600 650 700
SH
EA
R
ST
RE
SS
(τ)
NORMAL STRESS(σ)
TRIAXIAL COMPRESSION TEST CHART
235

Strai
n Dial
Stress
Dial SD2 SD3
Stress
Dial Diff SDD2 SDD3
Area Sq
m
Compres
sive
Stress CS2 CS3
Strain
%
0 0 0 0 0.00 0.00 0.00 0.00114 0.00 0.00 0.00 0.00
15 6 7.5 6.5 0.03 0.03 0.03 0.00115 22.26 27.83 24.12 0.50
30 8 8.9 7.2 0.03 0.04 0.03 0.00115 29.69 33.03 26.72 1.00
45 10 10 8.5 0.04 0.04 0.04 0.00116 36.79 36.79 31.27 1.50
60 12 11 13.8 0.05 0.05 0.06 0.00116 44.15 40.47 50.77 2.00
75 14 12 15.5 0.06 0.05 0.07 0.00117 51.06 43.77 56.53 2.50
90 16 13.5 17 0.07 0.06 0.07 0.00118 57.86 48.82 61.48 3.00
105 18 14.5 18.5 0.08 0.06 0.08 0.00118 65.10 52.44 66.90 3.50
120 20 15 20 0.09 0.06 0.09 0.00119 71.72 53.79 71.72 4.00
135 21.5 16.8 21.9 0.09 0.07 0.09 0.00119 77.10 60.24 78.53 4.50
150 23 18 23.2 0.10 0.08 0.10 0.00120 81.79 64.01 82.50 5.00
165 24 19 25 0.10 0.08 0.11 0.00121 84.64 67.01 88.17 5.50
180 25 20 26.5 0.11 0.09 0.11 0.00121 88.17 70.53 93.46 6.00
210 26.5 23 29 0.11 0.10 0.12 0.00122 92.69 80.45 101.44 7.00
240 28.5 25.5 31.9 0.13 0.11 0.14 0.00124 103.24 87.76 109.78 8.00
270 30 28 34 0.13 0.12 0.15 0.00125 106.85 95.59 116.07 9.00
300 31.3 30 36.5 0.14 0.13 0.16 0.00127 109.20 100.80 122.64 10.00
330 32.5 32 38.5 0.14 0.14 0.16 0.00128 110.02 106.68 128.35 11.00
360 33 34 41 0.15 0.15 0.17 0.00130 111.61 111.61 134.59 12.00
390 34 36 42.5 0.15 0.15 0.18 0.00131 112.38 117.27 138.44 12.00
420 34.5 37.8 44.5 0.15 0.16 0.19 0.00131 115.64 123.13 144.96 13.00
450 35.5 39.2 46 0.15 0.17 0.20 0.00133 115.51 125.77 147.59 14.00
480 36 40.8 47.9 0.16 0.17 0.20 0.00134 117.83 129.93 152.54 15.00
510 37 42.2 49.1 0.16 0.18 0.21 0.00136 118.61 132.41 154.06 16.00
540 37.8 44 50.9 0.16 0.19 0.22 0.00137 119.92 137.05 158.55 17.00
570 38.5 45 52.5 0.17 0.19 0.22 0.00139 120.65 138.15 161.18 18.00
600 39.3 46 53.7 0.17 0.20 0.23 0.00139 122.19 141.22 164.86 19.00
630 39.8 47.3 55 0.17 0.20 0.23 0.00143 120.86 141.15 164.13 20.00
660 40.5 48.8 56 0.17 0.21 0.24 0.00144 121.50 144.62 165.95 21.00
690 41 50 57.2 0.18 0.21 0.24 0.00146 121.30 146.14 167.19 22.00
720 41.5 50.8 58.2 0.18 0.22 0.25 0.00150 119.77 144.52 165.57 24.00
750 42.1 51.9 59.3 0.18 0.22 0.25 0.00152 118.19 145.71 166.48 25.00
∂3 ∂2 ∂1 Radius Centre1 100.00 122.19 222.19 61.0937 161.094
0.00 33.78 45.51 52.91 57.61 60.24 61.09 60.24 57.61 52.91 45.51 33.78 0.00
100.00 110.20 120.34 130.55 140.75 150.89 161.09 171.30 181.44 191.64 201.84 211.98 222.19
2 205.00 146.14 351.14 73.0711 278.071
0.00 40.41 54.44 63.28 68.91 72.05 73.07 72.05 68.91 63.28 54.44 40.41 0.00
205.00 217.20 229.33 241.54 253.74 265.87 278.07 290.27 302.40 314.61 326.81 338.94 351.14
3 310.00 167.19 477.19 83.5933 393.593
0.00 46.23 62.28 72.39 78.83 82.42 83.59 82.42 78.83 72.39 62.28 46.23 0.00
310.00 323.96 337.84 351.80 365.76 379.63 393.59 407.55 421.43 435.39 449.35 463.23 477.19
45 118
0 700
GEOTECHNICAL ENGINEERING LABORATORY TEST
TRIAXIAL COMPRESSION TESTJOB…. OKOMU WATER TANK DATE…24/06/2018………
2KN/m310, 205, 100CELL PRESSURE:…… DIAMETER…… LENGTH…… m9.0,8BH… SAMPLE NO
FRICTION ANGLE:. ....5.94º..... COHESION:... 45.0kN/m²..... WET WEIGHT:..156g,158g,160g.... DRY WEIGHTg,g.... MOISTURE CONTENT:..........
DESCRIPTION OF SAMPLE
……………………………………………………
…………………………………………………..
SKETCH OF SAMPLE AFTER SHEAR
Compressive Sress
Corresponding Strain
y = 0.1043x + 45
0
50
100
150
200
250
300
0 50 100 150 200 250 300 350 400 450 500 550 600 650 700
SH
EA
R
ST
RE
SS
(τ)
NORMAL STRESS(σ)
TRIAXIAL COMPRESSION TEST CHART
236

Strai
n Dial
Stress
Dial SD2 SD3
Stress
Dial Diff SDD2 SDD3
Area Sq
m
Compres
sive
Stress CS2 CS3
Strain
%
0 0 0 0 0.00 0.00 0.00 0.00114 0.00 0.00 0.00 0.00
15 4 5 8 0.02 0.02 0.03 0.00115 14.84 18.55 29.69 0.50
30 4.5 6 10 0.02 0.03 0.04 0.00115 16.70 22.26 37.11 1.00
45 5.2 7.5 13 0.02 0.03 0.06 0.00116 19.13 27.59 47.82 1.50
60 5.3 8.8 14 0.02 0.04 0.06 0.00116 19.50 32.37 51.50 2.00
75 5.5 10 15 0.02 0.04 0.06 0.00117 20.06 36.47 54.71 2.50
90 5.5 11 16 0.02 0.05 0.07 0.00118 19.89 39.78 57.86 3.00
105 6 12 17 0.03 0.05 0.07 0.00118 21.70 43.40 61.48 3.50
120 6.2 13 18 0.03 0.06 0.08 0.00119 22.23 46.62 64.55 4.00
135 6.5 14 19.3 0.03 0.06 0.08 0.00119 23.31 50.20 69.21 4.50
150 7 15 20.5 0.03 0.06 0.09 0.00120 24.89 53.34 72.90 5.00
165 7.5 16 21.3 0.03 0.07 0.09 0.00121 26.45 56.43 75.12 5.50
180 8 17 22 0.03 0.07 0.09 0.00121 28.21 59.95 77.59 6.00
210 8.8 19 23 0.04 0.08 0.10 0.00122 30.78 66.46 80.45 7.00
240 9.5 21 24.5 0.04 0.09 0.10 0.00124 34.41 72.27 84.31 8.00
270 10 23 26 0.05 0.10 0.11 0.00125 37.55 78.52 88.76 9.00
300 11 24 27.2 0.05 0.10 0.12 0.00127 40.32 80.64 91.40 10.00
330 12 26 28.5 0.05 0.11 0.12 0.00128 40.67 86.68 95.02 11.00
360 12.2 27 29.5 0.06 0.12 0.13 0.00130 42.67 88.63 96.84 12.00
390 13 28.5 31 0.06 0.12 0.13 0.00131 43.98 92.84 100.98 12.00
420 13.5 29.2 31.5 0.06 0.12 0.13 0.00131 45.61 95.12 102.61 13.00
450 14 30.5 32.5 0.06 0.13 0.14 0.00133 46.52 97.86 104.28 14.00
480 14.5 31.5 34 0.06 0.13 0.15 0.00134 47.77 100.31 108.28 15.00
510 15 32.2 34.8 0.07 0.14 0.15 0.00136 48.64 101.04 109.19 16.00
540 15.5 33.5 35.8 0.07 0.14 0.15 0.00137 49.84 104.35 111.51 17.00
570 16 34.5 36.8 0.07 0.15 0.16 0.00139 52.19 105.92 112.98 18.00
600 17 35 38 0.08 0.15 0.16 0.00139 55.26 107.45 116.66 19.00
630 18 36.5 38.8 0.08 0.16 0.17 0.00143 55.21 108.92 115.79 20.00
660 18.5 37 40 0.08 0.16 0.17 0.00144 56.31 109.65 118.54 21.00
690 19 38 42 0.09 0.16 0.18 0.00146 58.46 111.07 122.76 22.00
720 20 39 43.5 0.09 0.17 0.19 0.00150 57.47 110.95 123.75 24.00
750 20.2 39 45 0.09 0.17 0.19 0.00152 56.71 109.49 126.34 25.00
∂3 ∂2 ∂1 Radius Centre1 100.00 58.46 158.46 29.2284 129.228
0.00 16.16 21.78 25.31 27.56 28.82 29.23 28.82 27.56 25.31 21.78 16.16 0.00
100.00 104.88 109.73 114.61 119.50 124.35 129.23 134.11 138.96 143.84 148.72 153.58 158.46
2 205.00 111.07 316.07 55.534 260.534
0.00 30.71 41.37 48.09 52.37 54.76 55.53 54.76 52.37 48.09 41.37 30.71 0.00
205.00 214.27 223.49 232.77 242.04 251.26 260.53 269.81 279.03 288.30 297.58 306.79 316.07
3 310.00 126.34 436.34 63.168 373.168
0.00 34.93 47.06 54.70 59.57 62.28 63.17 62.28 59.57 54.70 47.06 34.93 0.00
310.00 320.55 331.03 341.58 352.13 362.62 373.17 383.72 394.20 404.75 415.30 425.79 436.34
40 69
0 450
GEOTECHNICAL ENGINEERING LABORATORY TEST
TRIAXIAL COMPRESSION TESTJOB…. WATER TANK DATE…24/06/2018………
2KN/m310, 205, 100CELL PRESSURE:…… DIAMETER…… LENGTH…… m12.0,8BH… SAMPLE NO
FRICTION ANGLE:. ....3.68º..... COHESION:..40.0kN/m²..... WET WEIGHT:..128g,155g,165g.... DRY WEIGHTg,g.... MOISTURE CONTENT:..........
DESCRIPTION OF SAMPLE
……………………………………………………
…………………………………………………..
SKETCH OF SAMPLE AFTER SHEAR
Compressive Sress
Corresponding Strain
y = 0.0644x + 40
0
20
40
60
80
100
120
140
160
180
200
0 50 100 150 200 250 300 350 400 450
SH
EA
R
ST
RE
SS
(τ)
NORMAL STRESS(σ)
TRIAXIAL COMPRESSION TEST CHART
237

Strai
n Dial
Stress
Dial SD2 SD3
Stress
Dial Diff SDD2 SDD3
Area Sq
m
Compres
sive
Stress CS2 CS3
Strain
%
0 0 0 0 0.00 0.00 0.00 0.00114 0.00 0.00 0.00 0.00
15 1 1.2 2 0.00 0.01 0.01 0.00115 3.71 4.45 7.42 0.50
30 1.5 1.8 6 0.01 0.01 0.03 0.00115 5.57 6.68 22.26 1.00
45 2 2 11 0.01 0.01 0.05 0.00116 7.36 7.36 40.47 1.50
60 2.5 2.5 13 0.01 0.01 0.06 0.00116 9.20 9.20 47.82 2.00
75 3 2.8 14.5 0.01 0.01 0.06 0.00117 10.94 10.21 52.89 2.50
90 3.5 3 15 0.01 0.01 0.06 0.00118 12.66 10.85 54.25 3.00
105 4 3.5 16 0.02 0.01 0.07 0.00118 14.47 12.66 57.86 3.50
120 4.5 4 17 0.02 0.02 0.07 0.00119 16.14 14.34 60.96 4.00
135 5 4.5 18 0.02 0.02 0.08 0.00119 17.93 16.14 64.55 4.50
150 5.5 4.8 19 0.02 0.02 0.08 0.00120 19.56 17.07 67.57 5.00
165 6 5 20 0.03 0.02 0.09 0.00121 21.16 17.63 70.53 5.50
180 6.5 5.5 21 0.03 0.02 0.09 0.00121 22.92 19.40 74.06 6.00
210 7.5 6.5 23 0.03 0.03 0.10 0.00122 26.23 22.74 80.45 7.00
240 8.5 7.5 25 0.04 0.03 0.11 0.00124 30.97 25.81 86.04 8.00
270 9 8 26.5 0.04 0.03 0.11 0.00125 34.14 27.31 90.47 9.00
300 10 9 28 0.04 0.04 0.12 0.00127 35.28 30.24 94.08 10.00
330 10.5 10 30 0.05 0.04 0.13 0.00128 36.67 33.34 100.02 11.00
360 11 11 31.5 0.05 0.05 0.13 0.00130 37.75 36.11 103.40 12.00
390 11.5 11.8 32.5 0.05 0.05 0.14 0.00131 39.09 38.44 105.87 12.00
420 12 12.5 34 0.05 0.05 0.15 0.00131 39.74 40.72 110.76 13.00
450 12.2 13 35.2 0.05 0.06 0.15 0.00133 40.11 41.71 112.94 14.00
480 12.5 13.5 36.5 0.06 0.06 0.16 0.00134 41.40 42.99 116.24 15.00
510 13 14 37 0.06 0.06 0.16 0.00136 42.36 43.93 116.10 16.00
540 13.5 14.5 38 0.06 0.06 0.16 0.00137 43.61 45.17 118.36 17.00
570 14 15 39 0.06 0.06 0.17 0.00139 43.59 46.05 119.73 18.00
600 14.2 15.2 40 0.06 0.06 0.17 0.00139 44.52 46.66 122.80 19.00
630 14.5 15.8 40.8 0.06 0.07 0.17 0.00143 44.76 47.15 121.75 20.00
660 15 16 41.2 0.06 0.07 0.18 0.00144 45.04 47.42 122.09 21.00
690 15.2 16.5 43 0.07 0.07 0.18 0.00146 46.77 48.23 125.68 22.00
720 16 16.8 44 0.07 0.07 0.19 0.00150 45.52 47.79 125.18 24.00
750 16 17.5 45 0.07 0.07 0.19 0.00152 44.92 49.13 126.34 25.00
∂3 ∂2 ∂1 Radius Centre1 100.00 46.77 146.77 23.3827 123.383
0.00 12.93 17.42 20.25 22.05 23.06 23.38 23.06 22.05 20.25 17.42 12.93 0.00
100.00 103.90 107.79 111.69 115.60 119.48 123.38 127.29 131.17 135.07 138.98 142.86 146.77
2 205.00 49.13 254.13 24.5653 229.565
0.00 13.58 18.30 21.27 23.17 24.22 24.57 24.22 23.17 21.27 18.30 13.58 0.00
205.00 209.10 213.18 217.28 221.39 225.46 229.57 233.67 237.75 241.85 245.95 250.03 254.13
3 310.00 126.34 436.34 63.168 373.168
0.00 34.93 47.06 54.70 59.57 62.28 63.17 62.28 59.57 54.70 47.06 34.93 0.00
310.00 320.55 331.03 341.58 352.13 362.62 373.17 383.72 394.20 404.75 415.30 425.79 436.34
4 117
0 700
GEOTECHNICAL ENGINEERING LABORATORY TEST
TRIAXIAL COMPRESSION TESTJOB…. OKOMU RAMP 1 DATE…24/06/2018………
2KN/m310, 205, 100CELL PRESSURE:…… DIAMETER…… LENGTH…… m8.0,9BH… SAMPLE NO
FRICTION ANGLE:. ....9.15º..... COHESION:... 4.0kN/m²..... WET WEIGHT:..140g,127g,153g.... DRY WEIGHTg,g.... MOISTURE CONTENT:..........
DESCRIPTION OF SAMPLE
……………………………………………………
…………………………………………………..
SKETCH OF SAMPLE AFTER SHEAR
Compressive Sress
Corresponding Strain
y = 0.1614x + 4
0
20
40
60
80
100
120
140
160
180
200
0 50 100 150 200 250 300 350 400 450
SH
EA
R
ST
RE
SS
(τ)
NORMAL STRESS(σ)
TRIAXIAL COMPRESSION TEST CHART
238

Strai
n Dial
Stress
Dial SD2 SD3
Stress
Dial Diff SDD2 SDD3
Area Sq
m
Compres
sive
Stress CS2 CS3
Strain
%
0 0 0 0 0.00 0.00 0.00 0.00114 0.00 0.00 0.00 0.00
15 4 6 5 0.02 0.03 0.02 0.00115 14.84 22.26 18.55 0.50
30 5 7.5 8.5 0.02 0.03 0.04 0.00115 18.55 27.83 31.54 1.00
45 6.1 9.5 13 0.03 0.04 0.06 0.00116 22.44 34.95 47.82 1.50
60 7.2 11.5 15.5 0.03 0.05 0.07 0.00116 26.49 42.31 57.02 2.00
75 8.2 14.7 17 0.03 0.06 0.07 0.00117 29.91 53.62 62.00 2.50
90 9.2 17.2 18.5 0.04 0.07 0.08 0.00118 33.27 62.20 66.90 3.00
105 10.2 19.7 20 0.04 0.08 0.09 0.00118 36.89 71.24 72.33 3.50
120 11.1 22 21.3 0.05 0.09 0.09 0.00119 39.80 78.89 76.38 4.00
135 12.1 24.8 22.7 0.05 0.11 0.10 0.00119 43.39 88.93 81.40 4.50
150 13.2 26.9 24 0.06 0.11 0.10 0.00120 46.94 95.66 85.35 5.00
165 14.2 28.9 25.2 0.06 0.12 0.11 0.00121 50.08 101.92 88.87 5.50
180 15.5 31 26.3 0.07 0.13 0.11 0.00121 54.66 109.33 92.75 6.00
210 17.9 34 28.8 0.08 0.15 0.12 0.00122 62.61 118.93 100.74 7.00
240 19.8 36 31 0.09 0.15 0.13 0.00124 73.99 123.89 106.68 8.00
270 21.5 38 33 0.10 0.16 0.14 0.00125 80.23 129.73 112.66 9.00
300 23.5 40 35 0.11 0.17 0.15 0.00127 85.68 134.40 117.60 10.00
330 25.5 42 36.8 0.12 0.18 0.16 0.00128 90.68 140.02 122.69 11.00
360 27.2 43 38.5 0.12 0.18 0.16 0.00130 93.55 141.15 126.38 12.00
390 28.5 44 40 0.13 0.19 0.17 0.00131 96.10 143.33 130.30 12.00
420 29.5 44.6 41.9 0.13 0.19 0.18 0.00131 99.35 145.29 136.49 13.00
450 30.5 45.3 43.3 0.14 0.19 0.18 0.00133 102.67 145.35 138.93 14.00
480 32 46.1 45 0.14 0.20 0.19 0.00134 103.50 146.81 143.31 15.00
510 32.5 47 46.9 0.15 0.20 0.20 0.00136 109.82 147.47 147.16 16.00
540 35 48.3 48.3 0.15 0.21 0.21 0.00137 113.07 150.45 150.45 17.00
570 36.3 49.7 50 0.16 0.21 0.21 0.00139 115.13 152.58 153.50 18.00
600 37.5 51.1 51 0.17 0.22 0.22 0.00139 118.81 156.88 156.57 19.00
630 38.7 52.5 52.2 0.17 0.22 0.22 0.00143 117.28 156.67 155.77 20.00
660 39.3 53.3 53.5 0.17 0.23 0.23 0.00144 120.02 157.95 158.54 21.00
690 40.5 54.5 54.9 0.18 0.23 0.23 0.00146 120.13 159.29 160.46 22.00
720 41.1 55.9 56.2 0.18 0.24 0.24 0.00150 120.05 159.03 159.88 24.00
750 42.2 56.5 57.5 0.18 0.24 0.25 0.00152 118.48 158.62 161.43 25.00
∂3 ∂2 ∂1 Radius Centre1 100.00 120.13 220.13 60.0644 160.064
0.00 33.22 44.75 52.02 56.64 59.22 60.06 59.22 56.64 52.02 44.75 33.22 0.00
100.00 110.03 120.00 130.03 140.06 150.03 160.06 170.10 180.07 190.10 200.13 210.10 220.13
2 205.00 159.29 364.29 79.6475 284.647
0.00 44.05 59.34 68.97 75.11 78.53 79.65 78.53 75.11 68.97 59.34 44.05 0.00
205.00 218.30 231.52 244.82 258.12 271.35 284.65 297.95 311.17 324.47 337.77 350.99 364.29
3 310.00 161.43 471.43 80.7147 390.715
0.00 44.64 60.13 69.90 76.11 79.58 80.71 79.58 76.11 69.90 60.13 44.64 0.00
310.00 323.48 336.88 350.36 363.84 377.24 390.71 404.19 417.59 431.07 444.55 457.95 471.43
35 125
0 550
GEOTECHNICAL ENGINEERING LABORATORY TEST
TRIAXIAL COMPRESSION TESTJOB…. OKOMU RAMP 1 DATE…24/06/2018………
2KN/m310, 205, 100CELL PRESSURE:…… DIAMETER…… LENGTH…… m11.0,9BH… SAMPLE NO
FRICTION ANGLE:. ....9.29º..... COHESION:... 35.0kN/m²..... WET WEIGHT:..159g,160g,160g.... DRY WEIGHTg,g.... MOISTURE CONTENT:..........
DESCRIPTION OF SAMPLE
……………………………………………………
…………………………………………………..
SKETCH OF SAMPLE AFTER SHEAR
Compressive Sress
Corresponding Strain
y = 0.1636x + 35
0
50
100
150
200
250
0 50 100 150 200 250 300 350 400 450 500 550
SH
EA
R
ST
RE
SS
(τ)
NORMAL STRESS(σ)
TRIAXIAL COMPRESSION TEST CHART
239

Strai
n Dial
Stress
Dial SD2 SD3
Stress
Dial Diff SDD2 SDD3
Area Sq
m
Compres
sive
Stress CS2 CS3
Strain
%
0 0 0 0 0.00 0.00 0.00 0.00114 0.00 0.00 0.00 0.00
15 6 4 4 0.03 0.02 0.02 0.00115 22.26 14.84 14.84 0.50
30 8.8 7.5 6 0.04 0.03 0.03 0.00115 32.65 27.83 22.26 1.00
45 11 16 7 0.05 0.07 0.03 0.00116 40.47 58.86 25.75 1.50
60 12.8 28 10 0.05 0.12 0.04 0.00116 47.09 103.01 36.79 2.00
75 14.5 32 26 0.06 0.14 0.11 0.00117 52.89 116.71 94.83 2.50
90 16 37 35 0.07 0.16 0.15 0.00118 57.86 133.81 126.57 3.00
105 17.8 40 40 0.08 0.17 0.17 0.00118 64.37 144.66 144.66 3.50
120 19.8 43 44 0.08 0.18 0.19 0.00119 71.00 154.20 157.78 4.00
135 21.3 45 46 0.09 0.19 0.20 0.00119 76.38 161.37 164.96 4.50
150 23 47 48.5 0.10 0.20 0.21 0.00120 81.79 167.14 172.47 5.00
165 24.8 49 50 0.11 0.21 0.21 0.00121 87.46 172.81 176.34 5.50
180 26.3 50.5 52 0.11 0.22 0.22 0.00121 92.75 178.10 183.39 6.00
210 29.3 53 56.5 0.13 0.23 0.24 0.00122 102.49 185.38 197.63 7.00
240 31.5 56 60 0.15 0.24 0.26 0.00124 117.01 192.72 206.48 8.00
270 34 58 64 0.15 0.25 0.27 0.00125 123.92 198.01 218.49 9.00
300 36.3 61.5 66.5 0.16 0.26 0.28 0.00127 128.69 206.65 223.45 10.00
330 38.3 64 69.5 0.17 0.27 0.30 0.00128 133.35 213.37 231.70 11.00
360 40 67 72 0.18 0.29 0.31 0.00130 137.87 219.93 236.35 12.00
390 42 69.5 74 0.19 0.30 0.32 0.00131 142.68 226.40 241.06 12.00
420 43.8 72 76 0.19 0.31 0.32 0.00131 147.24 234.54 247.57 13.00
450 45.2 74.5 79 0.20 0.32 0.34 0.00133 153.37 239.04 253.47 14.00
480 47.8 77 81 0.21 0.33 0.35 0.00134 153.18 245.21 257.95 15.00
510 48.1 79 83.5 0.21 0.34 0.36 0.00136 154.38 247.88 262.00 16.00
540 49.2 81.5 85.5 0.21 0.35 0.36 0.00137 156.37 253.86 266.32 17.00
570 50.2 84 87 0.22 0.36 0.37 0.00139 156.57 257.88 267.09 18.00
600 51 86 89 0.22 0.37 0.38 0.00139 159.64 264.02 273.23 19.00
630 52 88 91 0.23 0.38 0.39 0.00143 158.16 262.61 271.56 20.00
660 53 91 93 0.23 0.39 0.40 0.00144 160.03 269.67 275.60 21.00
690 54 93 95 0.23 0.40 0.41 0.00146 160.76 271.82 277.67 22.00
720 55 93 97 0.24 0.40 0.41 0.00150 159.31 264.58 275.96 24.00
750 56 95 98.5 0.24 0.41 0.42 0.00152 157.22 266.71 276.54 25.00
∂3 ∂2 ∂1 Radius Centre1 100.00 160.76 260.76 80.3782 180.378
0.00 44.45 59.88 69.61 75.80 79.25 80.38 79.25 75.80 69.61 59.88 44.45 0.00
100.00 113.42 126.77 140.19 153.61 166.96 180.38 193.80 207.14 220.57 233.99 247.33 260.76
2 205.00 271.82 476.82 135.912 340.912
0.00 75.16 101.25 117.70 128.17 134.01 135.91 134.01 128.17 117.70 101.25 75.16 0.00
205.00 227.70 250.26 272.96 295.65 318.21 340.91 363.61 386.17 408.87 431.57 454.13 476.82
3 310.00 277.67 587.67 138.835 448.835
0.00 76.78 103.43 120.23 130.92 136.89 138.84 136.89 130.92 120.23 103.43 76.78 0.00
310.00 333.19 356.23 379.42 402.60 425.65 448.84 472.02 495.07 518.25 541.44 564.48 587.67
20 261
0 650
GEOTECHNICAL ENGINEERING LABORATORY TEST
TRIAXIAL COMPRESSION TESTJOB…. RAMP 1 DATE…24/06/2018………
2KN/m310, 205, 100CELL PRESSURE:…… DIAMETER…… LENGTH…… m2.0,9BH… SAMPLE NO
FRICTION ANGLE:. ....20.34º..... COHESION:...20.0kN/m²..... WET WEIGHT:..159g,169g,169g.... DRY WEIGHTg,g.... MOISTURE CONTENT:..........
DESCRIPTION OF SAMPLE
……………………………………………………
…………………………………………………..
SKETCH OF SAMPLE AFTER SHEAR
Compressive Sress
Corresponding Strain
y = 0.3708x + 20
0
20
40
60
80
100
120
140
160
180
200
0 50 100 150 200 250 300 350 400 450 500 550 600 650
SH
EA
R
ST
RE
SS
(τ)
NORMAL STRESS(σ)
TRIAXIAL COMPRESSION TEST CHART
240

Strai
n Dial
Stress
Dial SD2 SD3
Stress
Dial Diff SDD2 SDD3
Area Sq
m
Compres
sive
Stress CS2 CS3
Strain
%
0 0 0 0 0.00 0.00 0.00 0.00114 0.00 0.00 0.00 0.00
15 2 7 2.5 0.01 0.03 0.01 0.00115 7.42 25.98 9.28 0.50
30 2.2 8 4 0.01 0.03 0.02 0.00115 8.16 29.69 14.84 1.00
45 2.8 9 5 0.01 0.04 0.02 0.00116 10.30 33.11 18.39 1.50
60 3.5 10 6 0.01 0.04 0.03 0.00116 12.88 36.79 22.07 2.00
75 4 11 7.5 0.02 0.05 0.03 0.00117 14.59 40.12 27.35 2.50
90 4.8 12 9 0.02 0.05 0.04 0.00118 17.36 43.40 32.55 3.00
105 5.5 13 10 0.02 0.06 0.04 0.00118 19.89 47.01 36.16 3.50
120 6 14.5 11 0.03 0.06 0.05 0.00119 21.52 52.00 39.45 4.00
135 6.5 15.5 12 0.03 0.07 0.05 0.00119 23.31 55.58 43.03 4.50
150 7.5 16.5 13.5 0.03 0.07 0.06 0.00120 26.67 58.68 48.01 5.00
165 8 17.5 14.5 0.03 0.07 0.06 0.00121 28.21 61.72 51.14 5.50
180 8.8 19 16 0.04 0.08 0.07 0.00121 31.04 67.01 56.43 6.00
210 10 20.5 18.5 0.04 0.09 0.08 0.00122 34.98 71.71 64.71 7.00
240 11 21.5 21 0.05 0.09 0.09 0.00124 41.30 73.99 72.27 8.00
270 12 23 23 0.06 0.10 0.10 0.00125 44.38 78.52 78.52 9.00
300 13 24 24.5 0.06 0.10 0.10 0.00127 47.04 80.64 82.32 10.00
330 14 25 26 0.06 0.11 0.11 0.00128 50.01 83.35 86.68 11.00
360 15 26 28 0.07 0.11 0.12 0.00130 52.52 85.35 91.91 12.00
390 16 27 30 0.07 0.12 0.13 0.00131 54.73 87.95 97.73 12.00
420 16.8 28 31.5 0.07 0.12 0.13 0.00131 57.01 91.21 102.61 13.00
450 17.5 29 33 0.08 0.12 0.14 0.00133 59.36 93.05 105.88 14.00
480 18.5 30 34.5 0.08 0.13 0.15 0.00134 60.51 95.54 109.87 15.00
510 19 30.5 35.5 0.09 0.13 0.15 0.00136 62.76 95.70 111.39 16.00
540 20 31 36.5 0.09 0.13 0.16 0.00137 63.85 96.56 113.69 17.00
570 20.5 31.5 37 0.09 0.13 0.16 0.00139 64.47 96.71 113.59 18.00
600 21 32 38 0.09 0.14 0.16 0.00139 66.01 98.24 116.66 19.00
630 21.5 33 38.8 0.09 0.14 0.17 0.00143 65.65 98.48 115.79 20.00
660 22 33.5 39.2 0.09 0.14 0.17 0.00144 65.79 99.28 116.17 21.00
690 22.2 34 40 0.10 0.15 0.17 0.00146 65.76 99.38 116.91 22.00
720 22.5 34.5 41 0.10 0.15 0.17 0.00150 65.43 98.15 116.64 24.00
750 23 35 41 0.10 0.15 0.17 0.00152 64.57 98.26 115.11 25.00
∂3 ∂2 ∂1 Radius Centre1 100.00 66.01 166.01 33.0029 133.003
0.00 18.25 24.59 28.58 31.12 32.54 33.00 32.54 31.12 28.58 24.59 18.25 0.00
100.00 105.51 110.99 116.50 122.01 127.49 133.00 138.51 143.99 149.50 155.02 160.49 166.01
2 205.00 99.38 304.38 49.6883 254.688
0.00 27.48 37.02 43.03 46.86 48.99 49.69 48.99 46.86 43.03 37.02 27.48 0.00
205.00 213.30 221.55 229.84 238.14 246.39 254.69 262.99 271.23 279.53 287.83 296.08 304.38
3 310.00 116.91 426.91 58.4568 368.457
0.00 32.33 43.55 50.62 55.12 57.64 58.46 57.64 55.12 50.62 43.55 32.33 0.00
310.00 319.76 329.47 339.23 348.99 358.69 368.46 378.22 387.92 397.69 407.45 417.15 426.91
15.5 113
0 700
GEOTECHNICAL ENGINEERING LABORATORY TEST
TRIAXIAL COMPRESSION TESTJOB…. OKOMU RAMP II DATE…24/06/2018………
2KN/m310, 205, 100CELL PRESSURE:…… DIAMETER…… LENGTH…… m1.5,10BH… SAMPLE NO
FRICTION ANGLE:. ....7.93º..... COHESION:... 15.5kN/m²..... WET WEIGHT:..163g,169g,166g.... DRY WEIGHTg,g.... MOISTURE CONTENT:..........
DESCRIPTION OF SAMPLE
……………………………………………………
…………………………………………………..
SKETCH OF SAMPLE AFTER SHEAR
Compressive Sress
Corresponding Strain
y = 0.1393x + 15.5
0
20
40
60
80
100
120
140
160
180
200
0 50 100 150 200 250 300 350 400 450
SH
EA
R
ST
RE
SS
(τ)
NORMAL STRESS(σ)
TRIAXIAL COMPRESSION TEST CHART
241

Strai
n Dial
Stress
Dial SD2 SD3
Stress
Dial Diff SDD2 SDD3
Area Sq
m
Compres
sive
Stress CS2 CS3
Strain
%
0 0 0 0 0.00 0.00 0.00 0.00114 0.00 0.00 0.00 0.00
15 5 4.2 3.5 0.02 0.02 0.01 0.00115 18.55 15.59 12.99 0.50
30 6 5 7.8 0.03 0.02 0.03 0.00115 22.26 18.55 28.94 1.00
45 6.3 5.8 10.2 0.03 0.02 0.04 0.00116 23.18 21.34 37.52 1.50
60 6.9 6 15 0.03 0.03 0.06 0.00116 25.38 22.07 55.18 2.00
75 7.2 6.8 16 0.03 0.03 0.07 0.00117 26.26 24.80 58.36 2.50
90 7.5 7.5 18.8 0.03 0.03 0.08 0.00118 27.12 27.12 67.99 3.00
105 8 8.1 20 0.03 0.03 0.09 0.00118 28.93 29.29 72.33 3.50
120 8.3 8.8 21.2 0.04 0.04 0.09 0.00119 29.76 31.56 76.02 4.00
135 8.8 9.2 22.5 0.04 0.04 0.10 0.00119 31.56 32.99 80.69 4.50
150 9 9.8 23.8 0.04 0.04 0.10 0.00120 32.01 34.85 84.64 5.00
165 9.6 10.3 25 0.04 0.04 0.11 0.00121 33.86 36.33 88.17 5.50
180 10 11 26 0.04 0.05 0.11 0.00121 35.27 38.79 91.70 6.00
210 10.9 13 28.7 0.05 0.06 0.12 0.00122 38.13 45.47 100.39 7.00
240 11.5 14 31.8 0.05 0.06 0.14 0.00124 41.99 48.18 109.44 8.00
270 12.2 15.1 32.2 0.06 0.06 0.14 0.00125 44.04 51.55 109.93 9.00
300 12.9 16.1 34.5 0.06 0.07 0.15 0.00127 43.68 54.10 115.92 10.00
330 13 17.5 35.3 0.06 0.07 0.15 0.00128 43.34 58.34 117.69 11.00
360 13 18 38.2 0.06 0.08 0.16 0.00130 45.30 59.09 125.39 12.00
390 13.8 19.6 40 0.06 0.08 0.17 0.00131 45.61 63.85 130.30 12.00
420 14 20.5 42 0.06 0.09 0.18 0.00131 47.23 66.78 136.82 13.00
450 14.5 21.2 43.5 0.06 0.09 0.19 0.00133 48.13 68.02 139.57 14.00
480 15 21.7 45.2 0.07 0.09 0.19 0.00134 51.59 69.11 143.94 15.00
510 16.2 22.3 47 0.08 0.10 0.20 0.00136 55.85 69.97 147.47 16.00
540 17.8 23.1 48.3 0.08 0.10 0.21 0.00137 61.67 71.95 150.45 17.00
570 19.8 23.1 50.9 0.08 0.10 0.22 0.00139 60.79 70.92 156.26 18.00
600 19.8 23.1 53.3 0.08 0.10 0.23 0.00139 60.79 70.92 163.63 19.00
630 19.8 23.1 55.8 0.08 0.10 0.24 0.00143 59.09 68.93 166.52 20.00
660 19.8 23.1 58.2 0.08 0.10 0.25 0.00144 58.68 68.46 172.47 21.00
690 19.8 23.1 61.3 0.08 0.10 0.26 0.00146 57.87 67.52 179.17 22.00
720 19.8 23.1 64.8 0.08 0.10 0.28 0.00150 56.33 65.72 184.35 24.00
750 19.8 23.1 67.3 0.08 0.10 0.29 0.00152 55.59 64.85 188.94 25.00
∂3 ∂2 ∂1 Radius Centre1 100.00 61.67 161.67 30.8371 130.837
0.00 17.05 22.97 26.70 29.08 30.41 30.84 30.41 29.08 26.70 22.97 17.05 0.00
100.00 105.15 110.27 115.42 120.57 125.69 130.84 135.99 141.11 146.26 151.41 156.52 161.67
2 205.00 71.95 276.95 35.9766 240.977
0.00 19.90 26.80 31.16 33.93 35.47 35.98 35.47 33.93 31.16 26.80 19.90 0.00
205.00 211.01 216.98 222.99 229.00 234.97 240.98 246.98 252.96 258.96 264.97 270.95 276.95
3 310.00 188.94 498.94 94.4713 404.471
0.00 52.24 70.38 81.81 89.09 93.15 94.47 93.15 89.09 81.81 70.38 52.24 0.00
310.00 325.78 341.46 357.24 373.01 388.69 404.47 420.25 435.93 451.71 467.48 483.17 498.94
24 65
0 650
GEOTECHNICAL ENGINEERING LABORATORY TEST
TRIAXIAL COMPRESSION TESTJOB…. OKOMU RAMP II DATE…24/06/2018………
2KN/m310, 205, 100CELL PRESSURE:…… DIAMETER…… LENGTH…… m7.5,10BH… SAMPLE NO
FRICTION ANGLE:. ....3.61º..... COHESION:... 24.0kN/m²..... WET WEIGHT:..130g,134g,156g.... DRY WEIGHTg,g.... MOISTURE CONTENT:..........
DESCRIPTION OF SAMPLE
……………………………………………………
…………………………………………………..
SKETCH OF SAMPLE AFTER SHEAR
Compressive Sress
Corresponding Strain
y = 0.0631x + 24
0
50
100
150
200
0 50 100 150 200 250 300 350 400 450 500 550 600
SH
EA
R
ST
RE
SS
(τ)
NORMAL STRESS(σ)
TRIAXIAL COMPRESSION TEST CHART
242

Strai
n Dial
Stress
Dial SD2 SD3
Stress
Dial Diff SDD2 SDD3
Area Sq
m
Compres
sive
Stress CS2 CS3
Strain
%
0 0 0 0 0.00 0.00 0.00 0.00114 0.00 0.00 0.00 0.00
15 6.3 9 5.5 0.03 0.04 0.02 0.00115 23.38 33.40 20.41 0.50
30 8.5 10 10.5 0.04 0.04 0.04 0.00115 31.54 37.11 38.96 1.00
45 10 11.5 19 0.04 0.05 0.08 0.00116 36.79 42.31 69.90 1.50
60 11.9 16.9 25 0.05 0.07 0.11 0.00116 43.78 62.17 91.97 2.00
75 14 18.9 27.5 0.06 0.08 0.12 0.00117 51.06 68.93 100.30 2.50
90 16 20.5 28.2 0.07 0.09 0.12 0.00118 57.86 74.14 101.98 3.00
105 18 22 30.5 0.08 0.09 0.13 0.00118 65.10 79.56 110.30 3.50
120 20 24 32 0.09 0.10 0.14 0.00119 71.72 86.06 114.75 4.00
135 22 25.8 33.5 0.09 0.11 0.14 0.00119 78.89 92.52 120.13 4.50
150 24 27.5 34.8 0.10 0.12 0.15 0.00120 85.35 97.79 123.75 5.00
165 26 29 36.2 0.11 0.12 0.15 0.00121 91.70 102.28 127.67 5.50
180 27.8 30.5 37.5 0.12 0.13 0.16 0.00121 98.04 107.57 132.25 6.00
210 31.5 33.5 41 0.13 0.14 0.17 0.00122 110.18 117.18 143.41 7.00
240 34.8 36.5 44.3 0.16 0.16 0.19 0.00124 128.36 125.61 152.45 8.00
270 37.3 39.3 46.9 0.17 0.17 0.20 0.00125 132.80 134.17 160.11 9.00
300 38.9 42 49.9 0.18 0.18 0.21 0.00127 139.44 141.12 167.67 10.00
330 41.5 44.9 52.9 0.18 0.19 0.23 0.00128 144.02 149.69 176.36 11.00
360 43.2 47.3 55 0.19 0.20 0.23 0.00130 146.73 155.27 180.54 12.00
390 44.7 49.5 58 0.19 0.21 0.25 0.00131 146.59 161.25 188.94 12.00
420 45 52 61 0.20 0.22 0.26 0.00131 150.82 169.39 198.71 13.00
450 46.3 45.2 62.5 0.20 0.19 0.27 0.00133 151.76 145.03 200.53 14.00
480 47.3 56.2 65 0.20 0.24 0.28 0.00134 152.86 178.97 207.00 15.00
510 48 58.3 67.9 0.21 0.25 0.29 0.00136 157.20 182.93 213.05 16.00
540 50.1 60.2 70.5 0.22 0.26 0.30 0.00137 158.23 187.51 219.60 17.00
570 50.8 62 72.8 0.22 0.26 0.31 0.00139 158.11 190.34 223.50 18.00
600 51.5 64 74.5 0.22 0.27 0.32 0.00139 159.33 196.48 228.72 19.00
630 51.9 65.7 78.8 0.22 0.28 0.34 0.00143 155.77 196.06 235.15 20.00
660 52.2 67.3 80 0.23 0.29 0.34 0.00144 157.95 199.44 237.08 21.00
690 53.3 69.8 82.5 0.23 0.30 0.35 0.00146 159.29 204.01 241.13 22.00
720 54.5 71.5 84.5 0.24 0.31 0.36 0.00150 157.04 203.41 240.39 24.00
750 55.2 73 86 0.24 0.31 0.37 0.00152 154.97 204.95 241.44 25.00
∂3 ∂2 ∂1 Radius Centre1 100.00 159.33 259.33 79.6674 179.667
0.00 44.06 59.35 68.99 75.13 78.55 79.67 78.55 75.13 68.99 59.35 44.06 0.00
100.00 113.30 126.53 139.83 153.14 166.36 179.67 192.97 206.20 219.50 232.81 246.03 259.33
2 205.00 204.95 409.95 102.473 307.473
0.00 56.67 76.34 88.74 96.63 101.04 102.47 101.04 96.63 88.74 76.34 56.67 0.00
205.00 222.11 239.12 256.24 273.35 290.36 307.47 324.59 341.60 358.71 375.82 392.83 409.95
3 310.00 241.44 551.44 120.721 430.721
0.00 66.76 89.94 104.54 113.84 119.03 120.72 119.03 113.84 104.54 89.94 66.76 0.00
310.00 330.16 350.20 370.36 390.52 410.56 430.72 450.88 470.92 491.08 511.24 531.28 551.44
50 167
0 650
GEOTECHNICAL ENGINEERING LABORATORY TEST
TRIAXIAL COMPRESSION TESTJOB…. OKOMU RAMP II DATE…24/06/2018………
2KN/m310, 205, 100CELL PRESSURE:…… DIAMETER…… LENGTH…… m13.5,10BH… SAMPLE NO
FRICTION ANGLE:. ....10.20º..... COHESION:... 50.0kN/m²..... WET WEIGHT:..159g,160g,160g.... DRY WEIGHTg,g.... MOISTURE CONTENT:..........
DESCRIPTION OF SAMPLE
……………………………………………………
…………………………………………………..
SKETCH OF SAMPLE AFTER SHEAR
Compressive Sress
Corresponding Strain
y = 0.18x + 50
0
50
100
150
200
250
0 50 100 150 200 250 300 350 400 450 500 550 600 650
SH
EA
R
ST
RE
SS
(τ)
NORMAL STRESS(σ)
TRIAXIAL COMPRESSION TEST CHART
243

JEFFA GEOTECH
APPENDIX VI
244

Penetration Depth Penetration Depth
24 -0.25
22 -0.5
20 -0.75
25 -1
35 -1.25
40 -1.5
45 -1.75
50 -2
45 -2.25
47 -2.5
55 -2.75
55 -3
60 -3.25
62 -3.5
65 -3.75
64 -4
72 -4.25
76 -4.5
80 -4.75
83 -5
90 -5.25
100 -5.5
105 -5.75
110 -6
115 -6.25
125 -6.5
125 -6.75
130 -7
130 -7.25
135 -7.5
140 -7.75
150 -8
155 -8.25
155 -8.5
170 -8.75
175 -9
185 -9.25
170 -9.5
175 -9.75
200 -10
180 -10.25
190 -10.5
220 -10.75
230 -11
250 -11.25
250 -11.5
CONE PENETROMETER
-20
-18
-16
-14
-12
-10
-8
-6
-4
-2
0
0 50 100 150 200 250 300
DE
PT
H O
F P
EN
ET
RA
TIO
N(M
)
CONE PENETROMRTER(0.981 KN/M2)
PENETROMETER
JOB: OKOMU LOCATION: ......... BOILER CPT PT1
30/05/2018DEPTH: 11.5m BEARING CAPACITY: DATE:
245

Penetration Depth Penetration Depth
50 -0.25
70 -0.5
65 -0.75
65 -1
70 -1.25
160 -1.5
170 -1.75
200 -2
170 -2.25
180 -2.5
200 -2.75
220 -3
180 -3.25
190 -3.5
205 -3.75
205 -4
170 -4.25
160 -4.5
160 -4.75
220 -5
160 -5.25
190 -5.5
200 -5.75
250 -6
225 -6.25
250 -6.5
CONE PENETROMETER
-20
-18
-16
-14
-12
-10
-8
-6
-4
-2
0
0 50 100 150 200 250 300
DE
PT
H O
F P
EN
ET
RA
TIO
N(M
)
CONE PENETROMRTER(0.981 KN/M2)
PENETROMETER
JOB: OKOMU LOCATION: .........(RAMP 1 ) CPT PT2
30/05/2018DEPTH: 6.5m BEARING CAPACITY: DATE:
246

Penetration Depth Penetration Depth
35 -0.25
37 -0.5
45 -0.75
47 -1
40 -1.25
40 -1.5
60 -1.75
65 -2
60 -2.25
65 -2.5
65 -2.75
68 -3
65 -3.25
65 -3.5
68 -3.75
70 -4
70 -4.25
70 -4.5
75 -4.75
75 -5
80 -5.25
88 -5.5
88 -5.75
92 -6
95 -6.25
100 -6.5
100 -6.75
105 -7
110 -7.25
115 -7.5
130 -7.75
135 -8
150 -8.25
165 -8.5
175 -8.75
180 -9
200 -9.25
198 -9.5
210 -9.75
210 -10
220 -10.25
220 -10.5
250 -10.75
CONE PENETROMETER
-20
-18
-16
-14
-12
-10
-8
-6
-4
-2
0
0 50 100 150 200 250 300
DE
PT
H O
F P
EN
ET
RA
TIO
N(M
)
CONE PENETROMRTER(0.981 KN/M2)
PENETROMETER
JOB: OKOMU LOCATION: ......... (CPO TANK) CPT PT3
30/05/2018DEPTH: 10.75m BEARING CAPACITY: DATE:
247

JEFFA GEOTECH
APPENDIX VII
248

SAMPLE NO
DESCRIPTION
NOTES O SOIL
SURCHARGE
Penetration (mm) 0.00 0.50 1.00 1.50 2.00 2.50 3.00 4.00 5.00 7.50 10.00 12.50
Load Indicator 0 54.00 69 82 94 105 115 131 147 183 210 218
Ditto corrected
Load (KN) 0 0.59066 0.75473 0.89693 1.02819 1.14851 1.25789 1.4329 1.60791 2.00168 2.29701 2.38452
C. B. R. %
SURCHARGE
Penetration (mm) 0.00 0.50 1.00 1.50 2.00 2.50 3.00 4.00 5.00 7.50 10.00 12.50
Load Indicator 0 38.00 50 60 71 81 90 108 126 167 208 224
Ditto corrected
Load (KN) 0 0.41565 0.54691 0.65629 0.77661 0.88599 0.98443 1.18132 1.37821 1.82667 2.27514 2.45015
C. B. R. %
SURCHARGE
Penetration (mm) 0.00 0.50 1.00 1.50 2.00 2.50 3.00 4.00 5.00 7.50 10.00 12.50
Load Indicator 0 43 54.00 63 71 78 84 98 107 134 163 177
Ditto corrected
Load (KN) 0 0.47034 0.59066 0.6891 0.77661 0.85318 0.9188 1.07194 1.17038 1.46571 1.78292 1.93605
C. B. R. %
SURCHARGE
Penetration (mm) 0.00 0.50 1.00 1.50 2.00 2.50 3.00 4.00 5.00 7.50 10.00 12.50
Load Indicator 0 31.00 42 51 59 67 77 92 107 146 183 195
Ditto corrected
Load (KN) 0 0.33908 0.4594 0.55785 0.64535 0.73286 0.84224 1.00631 1.17038 1.59697 2.00168 2.13294
C. B. R. %
2.5mm 5.0mm 2.5mm 5.0mm
BOTTOM 8.67 8.05562 6.44148 5.86361
TOP 6.68923 6.90482 5.53306 5.86361
CALIFONIA BEARING RATIO TEST
TEST ON BOTTOM ( UNSOAKED)
TEST ON TOP ( UNSOAKED)
TEST ON BOTTOM (SOAKED)
TEST ON TOP (SOAKED)
UNSOAKED SOAKED
OKOMU ROAD POINT 1, 1.5m
DATE: 11/06/2018
0
1
2
3
4
5
6
7
8
9
10
11
12
0 1 2 3 4 5 6 7 8 9 10 11 12
Fo
rce o
n P
lun
ger
( kN
)
Penetration of Plunger ( mm)
50
C.B.R. Per Cent
40
30
25
20
15
10
7.5
5
32
4
TOP (SOAKED)TOP (UNSOAKED)BOTTOM (UNSOAKED)
BOTTOM (SOAKED)
249

SAMPLE NO
DESCRIPTION
NOTES O SOIL
SURCHARGE
Penetration (mm) 0.00 0.50 1.00 1.50 2.00 2.50 3.00 4.00 5.00 7.50 10.00 12.50
Load Indicator 0 88 108.00 123 138 149 163 183 200 240 282 301
Ditto corrected
Load (KN) 0 0.96256 1.18132 1.34539 1.50946 1.62978 1.78292 2.00168 2.18763 2.62516 3.08456 3.29238
C. B. R. %
SURCHARGE
Penetration (mm) 0.00 0.50 1.00 1.50 2.00 2.50 3.00 4.00 5.00 7.50 10.00 12.50
Load Indicator 0 56.00 81 108 127 143 159 182 202 252 297 314
Ditto corrected
Load (KN) 0 0.61254 0.88599 1.18132 1.38915 1.56416 1.73917 1.99074 2.20951 2.75641 3.24863 3.43458
C. B. R. %
SURCHARGE
Penetration (mm) 0.00 0.50 1.00 1.50 2.00 2.50 3.00 4.00 5.00 7.50 10.00 12.50
Load Indicator 0 26.00 42 58 74 91 110 140 162 221 256 266
Ditto corrected
Load (KN) 0 0.28439 0.4594 0.63441 0.80942 0.99537 1.2032 1.53134 1.77198 2.41733 2.80017 2.90955
C. B. R. %
SURCHARGE
Penetration (mm) 0.00 0.50 1.00 1.50 2.00 2.50 3.00 4.00 5.00 7.50 10.00 12.50
Load Indicator 0 40.00 55 66 78 92 106 133 155 211 266 287
Ditto corrected
Load (KN) 0 0.43753 0.6016 0.72192 0.85318 1.00631 1.15944 1.45477 1.69541 2.30795 2.90955 3.13925
C. B. R. %
2.5mm 5.0mm 2.5mm 5.0mm
BOTTOM 12.30 10.96 7.51506 8.87762
TOP 11.8094 11.0696 7.59764 8.49402
CALIFONIA BEARING RATIO TEST
TEST ON BOTTOM ( UNSOAKED)
TEST ON TOP ( UNSOAKED)
TEST ON BOTTOM (SOAKED)
TEST ON TOP (SOAKED)
UNSOAKED SOAKED
OKOMU ROAD POINT 2, 1.5m
DATE: 11/06/2018
0
1
2
3
4
5
6
7
8
9
10
11
12
0 1 2 3 4 5 6 7 8 9 10 11 12
Fo
rce
on
Plu
ng
er
( k
N )
Penetration of Plunger ( mm)
50
C.B.R. Per Cent
40
30
25
20
15
10
7.5
5
3
2
4
TOP (SOAKED)
TOP (UNSOAKED)BOTTOM (UNSOAKED)
BOTTOM (SOAKED)
250

SAMPLE NO
DESCRIPTION
NOTES O SOIL
SURCHARGE
Penetration (mm) 0.00 0.50 1.00 1.50 2.00 2.50 3.00 4.00 5.00 7.50 10.00 12.50
Load Indicator 0 60 72.00 84 96 107 130 167 191 208 215 219
Ditto corrected
Load (KN) 0 0.65629 0.78755 0.9188 1.05006 1.17038 1.42196 1.82667 2.08919 2.27514 2.3517 2.39545
C. B. R. %
SURCHARGE
Penetration (mm) 0.00 0.50 1.00 1.50 2.00 2.50 3.00 4.00 5.00 7.50 10.00 12.50
Load Indicator 0 56.00 75 93 112 124 139 171 197 253 307 325
Ditto corrected
Load (KN) 0 0.61254 0.82036 1.01725 1.22507 1.35633 1.5204 1.87042 2.15482 2.76735 3.35801 3.5549
C. B. R. %
SURCHARGE
Penetration (mm) 0.00 0.50 1.00 1.50 2.00 2.50 3.00 4.00 5.00 7.50 10.00 12.50
Load Indicator 0 23.00 38 56 80 104 116 135 155 194 239 255
Ditto corrected
Load (KN) 0 0.25158 0.41565 0.61254 0.87505 1.13757 1.26883 1.47665 1.69541 2.122 2.61422 2.78923
C. B. R. %
SURCHARGE
Penetration (mm) 0.00 0.50 1.00 1.50 2.00 2.50 3.00 4.00 5.00 7.50 10.00 12.50
Load Indicator 0 15.00 23 34 48 66 90 132 151 192 227 243
Ditto corrected
Load (KN) 0 0.16407 0.25158 0.3719 0.52503 0.72192 0.98443 1.44384 1.65166 2.10012 2.48296 2.65797
C. B. R. %
2.5mm 5.0mm 2.5mm 5.0mm
BOTTOM 8.84 10.4668 8.58864 8.49402
TOP 10.2403 10.7956 5.45048 8.27482
CALIFONIA BEARING RATIO TEST
TEST ON BOTTOM ( UNSOAKED)
TEST ON TOP ( UNSOAKED)
TEST ON BOTTOM (SOAKED)
TEST ON TOP (SOAKED)
UNSOAKED SOAKED
OKOMU ROAD POINT 3, 1.5m
DATE: 11/06/2018
0
1
2
3
4
5
6
7
8
9
10
11
12
0 1 2 3 4 5 6 7 8 9 10 11 12
Fo
rce
on
Plu
ng
er
( k
N )
Penetration of Plunger ( mm)
50
C.B.R. Per Cent
40
30
25
20
15
10
7.5
5
32
4
TOP (SOAKED)
TOP (UNSOAKED)
BOTTOM (UNSOAKED)
BOTTOM (SOAKED)
251

APPENDIX III
EXTENSION TWO FPIC PROCESS REPORT

THE OKOMU OIL PALM COMPANY PLC
FREE, PRIOR, AND INFORMEND CONSENT (FPIC) OF THE
PROPOSED EXTENSION TWO OIL PALM DEVELOPMENT
PROJECT AT OVIA-NORTHEAST AND UHUNMWONDE
LOCAL GOVERNMENT AREAS, EDO STATE, NIGERIA
FINAL REPORT
October 2016

Free, Prior and Informed Consent (FPIC) of the Proposed
Extension Two Oil Palm Development Project at Ovia-
North East and Uhunmwonde Local Government Areas,
Edo State, Nigeria
Final Report
Prepared by
Foremost Development Services Limited
21 Mercy Eneli Street, Surulere, Lagos. Tel: 01-8981250, 08033314800.
Email:[email protected], Website: www.foremostdevelopmentservices.com
October 2016

Free, Prior, and Informed Consent (FPIC) Report Page i
TABLE OF CONTENT
CONTENT PAGE No.
List of Maps...............................................................................................................................................
List of Plates..............................................................................................................................................
List of Acronyms and Abbreviation...........................................................................................................
II
II
III
1.0 Introduction……………………………………………………………………………………… 3
2.0 Proposed Extension Two Project………………………………………………………………… 4
3.0 Extension Two Communities…………………………………………………………………… 5
3.1 Agbanikaka Community…………………………………………………………………………. 5
3.2 Owan Community………………………………………………………………………………. 5
3.3 Uhiere Community……………………………………………………………………………… 6
3.4 Odiguetue Community………………………………………………………………………….. 6
3.5 Odighi Community……………………………………………………………………………... 6
3.6 Ihrue Community………………………………………………………………………………. 6
3.7 Oke-Irhue Community………………………………………………………………………….. 6
3.8 Ekpan Community……………………………………………………………………………… 6
3.9 Umuokpe Community…………………………………………………………………………. 6
3.10 Orhua Community……………………………………………………………………………….. 7
4.0 Free, Prior and Informed Consent……………………………………………………………… 7
5.0 RSPO and FPIC Requirement…………………………………………………………………. 8
6.0 Approach and Methodology……………………………………………………………………. 12
7.0 Our FPIC Steps and Process……………………………………………………………………. 13
7.1 Initial Visits, Consultation and Engagement with Community Stakeholders………………….. 13
7.2 Providing information……………………………………………………………………………….. 14
7.3 Representative Organizations…………………………………………………………………... 15
7.4 Power of Attorney……………………………………………………………………………… 15
7.5 Participatory Mapping………………………………………………………………………….. 15
7.6 Legal Representation…………………………………………………………………………… 16
7.7 Iterative Meetings……………………………………………………………………………… 16
7.8 Engaging in Negotiation ………………………………………………………………………. 17
7.9 Compensation………………………………………………………………………………….. 19
7.10 Documenting Consent-Based Agreements…………………………………………………….. 19
8.0 FPIC Agreement Highlights……………………………………………………………………. 19
OOPC Plc: Proposed Extension Two Oil Palm Development Project October 2016

Free, Prior, and Informed Consent (FPIC) Report Page ii
9.0 Signing Consent-Based Agreements……………………………………………………………. 19
10.0 Presentation of Signed FPIC Agreement……………………………………………………….. 20
11.0 Joint Implementation Committee……………………………………………………………….. 24
12.0 Grievance and Dispute Resolution……………………………………………………………… 24
LIST OF MAPS
Map 1: Location Map of Extension Two Project…………………………………………………. .......... 5
Map 2: Location of Extension Two Communities…………………………………………………… ...... 7
LIST OF PLATES
Plate 1: Initial visits and consultations with the communities by the Managing Director, Agriculture
Coordinator, Community Liaison Officer and other staff of the company……………..………. 14
Plate 2: Project Information and Notice Boards at Extension Two Communities…………………… ......15
Plate 3: Community Representatives involved in Participatory Mapping………………………………. 16
Plate 4: Iterative Meetings…………………………………………………. ............................................17
Plate 5: Community Representatives and OOPC Representatives engaged in negotiation…………..…. 19
Plate 6: FPIC Agreement signing ceremony…………………………………………………. ..................20
Plate 7: Notarized FPIC Agreement display at Uhiere Community………………………………….…. 21
Plate 8: Notarized FPIC Agreement display at Owan Community…………………………………..…. 21
Plate 9: Notarized FPIC Agreement display at Agbanikaka Community…………………………… .......22
Plate 10: Notarized FPIC Agreement display at Irhue Community…………………………………….. 22
Plate 11: Notarized FPIC Agreement display at Ekpan Community………………………………….… 23
Plate 12: Notarized FPIC Agreement display at Odighi Community………………………………..…. 23
Plate 13: Notarized FPIC Agreement display at Odiguetue Community……………………………..… 24
OOPC Plc: Proposed Extension Two Oil Palm Development Project October 2016

Free, Prior, and Informed Consent (FPIC) Report Page iii
LIST OF ABBREVIATIONS AND ACRONYMS
FFB -Fresh Fruit Bunch
FPIC -Free, Prior and Informed Consent
HCV - High Conservation Value
HSE -Health Safety and Environment
JIC - Joint Implementation Committee
NIFOR - Nigerian Institute for Oil Palm Research
NPP -New planting procedure
NSE -Nigerian Stock Exchange
OOPC -Okomu Oil Palm Company
PAT -Profit After Tax
RSPO -Roundtable on Sustainable Palm Oil
TCPC -Technical Committee on Privatization and Commercialization
OOPC Plc: Proposed Extension Two Oil Palm Development Project October 2016

1
OKOMU OIL PALM COMPANY PLC
OUR FPIC PROCESS
Report on the Free, Prior and Informed Consent Process
of Extension Two Oil Palm Development Project
October 2016
Okomu Oil Palm Company Plc – Company Profile
The Okomu Oil Palm Company was established in 1976 as a Federal Government pilot project
aimed at rehabilitating oil palm production in Nigeria. At inception, the pilot project covered a
surveyed area of 15,580 hectares out of which 12,500 hectares could be planted with oil palm.
It was incorporated on December 3, 1979 as a limited liability company.
As part of efforts to shore up its revenue base, the company acquired and installed a 1.5-tonne
fresh Fruit Bunches /hour mill in 1985 to begin to process its FFB. Prior to the installation of
the mill, the company derived its revenue from the sale of FFB.
By December 31, 1989, 5,055 hectares of the estate had been planted. The company also began
infrastructural developments on the estate at that period. The facilities included office blocks,
workshops/stores, staff quarters, a petrol station, a powerhouse and a primary school for
children of the company’s staff members.
In 1990, the Technical Committee on Privatization and Commercialization (TCPC) privatized
The Okomu Oil Palm Company on behalf of the Federal Government of Nigeria. It has since
grown to become Nigeria’s leading oil palm company with 8,800 ha of mature palm, a young
extension of 4,000 ha of rubber, and a palm oil mill of 30 tons per hour capacity.
The privatization of the Okomu Oil Palm Company Plc has been a great success and a huge
encouragement for the Nigerian agricultural sector for the future, with profound positive
consequences of stable socioeconomic growth for the region where it is implanted. The success
of the company was further exemplified by the strong increase of its net income which allowed
doubling of its dividend.
This company has consistently posted profits in the last 10 years, a period during which most
other agricultural initiatives in the country had either folded –up or were performing sub-
optimally.

2
What is most inspiring is not just the growth and profitability of the company but the fact that
The Okomu Oil Palm Company Plc is ranked 10th among listed companies with the largest
turnovers quoted on the Nigerian Stock Exchange (NSE). It is the only agribusiness in the
NSE‟s top 16 companies with the largest turnovers. According to the June–July issue of the
Bottom line magazine, The Okomu Oil Palm Company Plc is the ninth company with the
highest profits before tax among companies quoted on the NSE, and the only agro-business on
the Exchange’s top 16.
Today, what is now known as The Okomu Oil Palm Company Plc has transformed into an
economic success, earning presidential commendation and recording over 300 percent rise in
profit after - tax (PAT) from the preceding year.
The excellent quality of oil produced by Okomu guarantees good selling price on the local
market, which absorbs the whole production.
Just as its expanding in size, its corporate environment is also expanding. Currently, the
company employs over 800 permanent staff and several independent sub-contractors. All these
have added up to place it on top in the burgeoning oil palm business and to position it as an
emerging leader in rubber production.
Okomu benefits from the quality management provided by its main shareholders and technical
partner (SOCFINAF). With a 53.32% share in Okomu Oil Palm Plc, SOCFINAF is the biggest
single shareholder in the company. SOCFINAF brings into Okomu Oil Palm Plc a little under a
century of sound acclaimed technical expertise in the world stage. SOCFINAF (Luxemburg) is
a global player in the cultivation of oil palm, rubber, coffee and tropical flower. SOCFIN S. A.
founded in 1912 was the first industrial company to plant oil palm in Africa and Indonesia. It
has ongoing plantation operations in Cote D’Ivoire, Liberia, Guinea, Cameroon, Kenya and
Indonesia.
Executive Summary
As a subsidiary of the Socfin group of companies, OOPC intends to ensure all of its existing oil
palm plantations and yet to be established plantations including the palm oil processing facilities
conform to the international standards and requirements of the Roundtable on Sustainable Palm
Oil (RSPO) including Free, Prior and Informed Consent (FPIC) in order to be able to service the
domestic, regional and international markets.
We initiated the FPIC process with initial visits to the communities starting from 2014 and
concluded it with the FPIC Agreement signing ceremony on 29 July 2016.
There are no settlements inside the Extension Two project land but there are ten main
communities located within 3-10 km from the closest boundaries of the project land. These

3
communities are located within two Local Government Areas of Ovia Northeast and the
Uhunmwonde Local Government Areas. There are five communities located within the Ovia
Northeast Local Government area namely: Agbanikaka, Owan, Uhiere, Odiguetue and Odighi,
while the remaining five communities including Ekpan, Oke, Umuokpe, Irhue and Orhua are
located within Uhunmwonde Local Government Area.We thus considered these communities as
having customary and/or user right over the project land and therefore need to obtain their free,
prior and informed consent.
The FPIC Guide for RSPO members (2015) guided our approach and methodology, which
focused on ensuring that consent if free, consent is prior, consent is informed, and consent is
given. We started the FPIC process in 2014 with initial visits and consultations with the
communities‟ leadership and stakeholders and followed it up with provision of information
about the proposed project. The communities seemed satisfied and liked to continue with the
project. The communities then appointed their representatives from the different organizations in
the communities. Each community later selected those very experienced on land matters to
represent them in the participatory mapping that followed. The outcome of the participatory
mapping revealed that there are no overlapping boundary issues.
The communities wanted equal treatment and agreed to a neutral and central meeting point. They
also agreed to a common legal representation. Iterative meetings were held followed by
negotiations. The communities‟ legal representative and the company legal representative drafted
the consent based agreements. The consent based agreement was signed by the representatives of
each community at a public ceremony on 29 July 2016.The signed agreement has provision for
Joint Implementation Committee and Grievance and dispute resolution mechanism.
1.0 Introduction
Free, Prior and Informed Consent (FPIC) is the right of indigenous peoples and other local
Communities to give or to withhold their consent to any project affecting their lands,
livelihoods and environment.
Indigenous Peoples‟ right to free, prior and informed consent (FPIC) has been recognized by a
number of intergovernmental organizations, international bodies, conventions and international
human rights law in varying degrees and increasingly in the laws of State.
The right to FPIC is enshrined in international law (in particular, the United Nations Declaration
on the Rights of Indigenous Peoples) and jurisprudence and national legal frameworks and
constitutions generally support the right of people to be consulted and given a choice in decision-
making when it comes to their lands, livelihoods and environment. Even where national laws do
not require FPIC in those particular terms, companies that have subscribed to certification
standards, such as the RSPO, are expected to go beyond domestic law to uphold the higher
international standards by seeking community consent.

4
International human rights laws and business best practices, recognize that – even where
national legal frameworks may provide weak or absent protections of customary rights to land
– plantations should not be established on indigenous peoples‟ lands without recognition of
their prior rights to the land and of their right to control what happens on that land.
As a subsidiary of the Socfin group of companies, OOPC intends to ensure all of its existing oil
palm plantations and yet to be established plantations including the palm oil processing
facilities conform to the international standards and requirements of the Roundtable on
Sustainable Palm Oil (RSPO) in order to be able to service the domestic, regional and
international markets. In this regard therefore, the development of the Extension Two project is
designed to follow the new planting procedure (NPP) of RSPO, thus making the obtaining of
the Free, Prior and Informed Consent of all the Extension Two communities a condition
precedent.
We initiated the FPIC process with initial visits to the communities starting from 2014 and
concluded it with the signing of the FPIC Agreement signing ceremony on 29 July 2016.The
entire process was undertaken and managed by our FPIC team led by the Managing Director.
The other team members included the Agriculture Coordinator, HSE Manager, Community
Liaison Officer and Communications Manager. In addition, the RSPO National Interpretation
Facilitator in Nigeria provided the necessary guidance and mediatory assistance to the process.
The following presentation summarizes our Extension Two FPIC process.
2.0 Proposed Extension Two Project
Extension Two is our latest acquisition in our expansion drive. It was acquired on 28 November
2013from A & Hatman Limited. The total land area of Extension Two is 11,416 ha assigned
for a period of 99 years and covered with a Certificate of Occupancy Number EDSR 15666
dated 3rd May 2006 and registered as No 40 at Page 40 in Volume B. 237 in the Land
Registry at Benin City, Edo State, Nigeria. Of the 11, 416 ha, about 760 ha was planted with
oil palm by the previous owners.
We plan to fully develop the land to oil palm including provisions for infrastructure over a
period of four years and install a state of the art palm oil mill of 60 tonnes per hour capacity to
process the fresh fruit bunches.

5
Map 1: Location Map of Extension Two Project
3.1 Extension Two Communities
There are no settlements inside the Extension Two project land but there are ten main
communities located within 3-10 km from the closest boundaries of the project land. These
communities are located within two Local Government Areas of Ovia Northeast and the
Uhunmwonde Local Government Areas. There are five communities located within the Ovia
Northeast Local Government area namely: Agbanikaka, Owan, Uhiere, Odiguetue and Odighi,
while the remaining five communities including Ekpan, Oke, Umuokpe, Irhue and Orhua are
located within Uhunmwonde Local Government Area.
We have thus considered the following communities as being within the area of influence of the
proposed Extension Two project and having customary and/or user right over the project land:
3.2 Agbanikaka Community
Agbanikaka, which translates to “The Land of Peace”, is an Uhobe community in Ovia North
East Local Government Area in Edo State, Nigeria. The community is in the North-West of the
Extension and shares boundaries with Sabogida, Ijagba, Owan, and Sobe in the North, South,
East and West respectively.
3.3 Owan Community
Owan, which translates to “The land that protects its children”, is an Uhebe community in Ovia
North East Local Government Area in Edo State, Nigeria. The community is in the North-West
of Extension Two, and shares boundaries with Sabongida, Ofutabe, Uhiere, and Agbanikaka in
the North, South, East and West respectively.

6
3.4 Uhiere Community
Uhiere, which translates to “The Land of Peace”, is an Ishan community in Ovia North East
Local Government Area in Edo State, Nigeria. The community is in the West of the project site
and shares boundaries with Oke, Ofutabe, Odigwetue and Owan, in the North, South, East and
West respectively.
3.5 Odiguetue Community
Odiguetue, which translates to “The Land of dignity”, is an Edo community in Ovia North East
Local Government Area in Edo State, Nigeria. The community is in the South-West of the
project site and shares boundaries with Okokhuo, Oke, Uhiere and Odighi in the North, South,
East and West respectively.
3.6 Odighi Community
Odighi, which translates to “The Land of honey”, is an Ozoguo community in Ovia North East
Local Government Area in Edo State, Nigeria. The community is in the South-West of the
project site and shares boundaries with Idunmowo, Oke, Osasimoba, and Uhiere in the North,
South, East and West respectively.
3.7 Ihrue Community
Ihrue, which translates to “The Land of evil blood”, is a Benin community in Uhunmwonde
Local Government Area in Edo State, Nigeria. The community is in the East of the project site
and shares boundaries with Oke, Iruekpe, Ekpan and Ikhuo in the North, South, East and West
respectively.
3.8 Oke-Irhue Community
Oke, translates to “The Land surrounded by hills”, is a Benin community in Uhunmwonde Local
Government Area in Edo State, Nigeria. The community is in the East of the project site and is
one of the oldest communities based on oral history.
3.9 Ekpan Community
Ekpan, which translates to “The Land of Peace”, is a Benin community in Uhunmwonde Local
Government Area in Edo State, Nigeria. The community is in the East of the project site. The
community which is about 2 square kilometers in size (in-dwelling) is made up of four quarters
namely Dumeso, Idueke, Ukpoka and Egohie. It shares boundaries with Isa West, Owan, Irhue
and Umukpe-Irhua in the North, South, East and West respectively.
3.10 Umuokpe Community
Umuokpe, which translates to “The Land of Prosperity”, is a Benin community in Uhunmwonde
Local Government Area in Edo State, Nigeria. The community is in the North-East of Extension
Two. It is about 2 square kilometers in size (in-dwelling) and is made up of three quarters and

7
seven compounds. The community shares boundaries with Orhua, Ekpan, Isan West and Owan
in the North, South, East and West respectively.
3.11 Orhua Community
Orhua, which translates to “The Land of humility”, is a combination of Ishan and Benin
community in Uhunmwonde Local Government Area in Edo State, Nigeria. The community is in
the North-East of the project site and shares boundaries with Iruekpen, Umuokpe, Isan West and
Owan in the North, South, East and West respectively.
Map 2: Location of Extension Two Communities
4.0 Free, Prior and Informed Consent
Free, Prior and Informed Consent (FPIC) is the right of indigenous peoples and other local
Communities to give or to withhold their consent to any project affecting their lands, livelihoods
and environment.
This consent should be given or withheld freely, meaning without coercion, intimidation or
manipulation, and through communities‟ own freely chosen representatives such as their
customary or other institutions. It should be sought prior to the project going ahead, meaning
sufficiently in advance of any authorization or commencement of activities and respecting the
time requirements of indigenous consultation processes. It should be informed, meaning that
communities must have access to and be provided with comprehensive and impartial information
on the project, including the nature and purpose of the project, its scale and location, duration,
reversibility, and scope; all possible economic, social, cultural and environmental impacts,
including potential risks and benefits, resulting from the project and that the costs and benefits of

8
alternative development options can be considered by the community with, or offered by, any
other parties who wish to do so, with whom the community is free to engage.
Key to respecting consent are iterative processes of collective consultation, the demonstration of
good faith in negotiations, transparent and mutually respectful dialogue, broad and equitable
participation, and free decision by the community to give or withhold consent, reached through
its self-chosen mode of decision making.
5.0 RSPO and FPIC Requirement
Respect for FPIC has been a central requirement of the RSPO Principles and Criteria since they
were first adopted in 2005. It seeks to ensure that RSPO certified sustainable palm oil comes
from areas without land conflicts or „land grabs‟ and that oil palm expansion takes place in ways
that do not destroy High Conservation Values (HCVs) or cause social conflict. FPIC is thus a
principle of best social practice and of best environmental practice, ensuring just land acquisition
and use.
The principle of Free, Prior and Informed Consent is central to the RSPO‟s Principles and
Criteria and guides the way companies deal with local communities (including indigenous
peoples), provide information, carry out impact assessments, acquire land, agree payments and
benefits, settle differences and resolve conflicts and pay compensation.
The key RSPO Principles & Criteria relating to FPIC provide that:
Criterion 2.2
The right to use the land is
demonstrated and is not
legitimately contested by
local people who can
demonstrate that they have
legal, customary or user
rights.
Indicators:
2.2.1 Documents showing legal ownership or lease, history of
land tenure and the actual legal use of the land shall be
available.
2.2.2 Legal boundaries shall be clearly demarcated and visibly
maintained.
2.2.3 Where there are or have been disputes, additional proof
of legal acquisition of title and evidence that fair compensation
has been made to previous owners and occupants shall be
available, and that these have been accepted with free, prior
and informed consent (FPIC).
2.2.4 There shall be an absence of significant land conflict,
unless requirements for acceptable conflict resolution
processes (see Criteria 6.3 and 6.4) are implemented and
accepted by the parties involved.
2.2.5 For any conflict or dispute over the land, the extent of the
disputed area shall be mapped out in a participatory way with
involvement of affected parties (including neighbouring
communities where applicable).

9
2.2.6 To avoid escalation of conflict, there shall be no
evidence that palm oil operations have instigated violence in
maintaining peace and order in their current and planned
operations.
Specific Guidance:
For 2.2.2: Plantation operations should cease on land planted
beyond the legally determined area and there should be
specific plans in place to address such issues for associated
smallholders.
For 2.2.6: Company policy should prohibit the use of
mercenaries and Para-militaries in their operations. Company
policy should prohibit extra-judicial intimidation and
harassment by contracted security forces (see Criterion 6.13).
Criterion 2.3
Use of the land for oil palm
does not diminish the legal,
customary or user rights
of other users without their
free, prior and informed
consent.
Indicators:
2.3.1 Maps of an appropriate scale showing the extent of
recognized legal, customary or user rights(Criteria 2.2, 7.5 and
7.6) shall be developed through participatory mapping
involving affected parties (including neighbouring
communities where applicable, and relevant authorities).
2.3.2 Copies of negotiated agreements detailing the process of
free, prior and informed consent (FPIC) (Criteria 2.2, 7.5
and7.6) shall be available and shall include:
a) Evidence that a plan has been developed through
consultation and discussion with all affected groups in the
communities, and that information has been provided to all
affected groups, including information on the steps that shall
be taken to involve them in decision making.
b) Evidence that the company has respected communities‟
decisions to give or withhold their consent to the operation at
the time that this decision was taken.
c) Evidence that the legal, economic, environmental and social
implications for permitting operations on their land have been
understood and accepted by affected communities, including
the implications for the legal status of their land at the expiry
of the company’s title, concession or lease on the land.
2.3.3 All relevant information shall be available in appropriate
forms and languages, including assessments of impacts,
proposed benefit sharing, and legal arrangements.

10
2.3.4 Evidence shall be available to show that communities are
represented through institutions or representatives of their own
choosing, including legal counsel.
Specific Guidance:
For 2.3.4: Evidence should be available from the companies,
communities or other relevant stakeholders.
Guidance:
All indicators will apply to current operations, but there are
exceptions for long-established plantations which may not
have records dating back to the time of the decision making, in
particular for compliance with Indicators 2.3.1 and 2.3.2.
Where there are legal or customary rights over land, the
grower should demonstrate that these rights are understood and
are not being threatened or reduced. This Criterion should be
considered in conjunction with Criteria 6.4, 7.5 and 7.6. Where
customary rights areas are unclear these should be established
through participatory mapping exercises involving affected
parties(including neighbouring communities and local
authorities).
This Criterion allows for sales and negotiated agreements to
compensate other users for lost benefits and/or relinquished
rights. Negotiated agreements should be non-coercive and
entered into voluntarily, carried out prior to new investments
or operations, and based on an open sharing of all relevant
information. There presentation of communities should be
transparent and in open communication with other community
members. Adequate t i m e s h o u l d b e given for customary
decision making and iterative negotiations allowed for, where
requested. Negotiated agreements should be binding on all
parties and enforceable in the courts.
Establishing certainty in land negotiations is of long-term
benefit for all parties. Companies should be especially careful
where they are offered lands acquired from the State by its
invoking the national interest (also known as „eminent
domain‟).
Growers and millers should refer to the RSPO approved FPIC
guidance (‘FPIC and the RSPO: A Guide for Companies’,
October 2008)

11
For National Interpretation:
Any commonly encountered situations should be identified.
Criterion 7.5
No new plantings are
established on local peoples‟
land where it can be
demonstrated that there are
legal, customary or user
rights, without their free,
prior and informed consent.
This is dealt with through a
documented system that
enables these and other
stakeholders to express their
views through their own
representative institutions.
Indicators:
7.5.1 Evidence shall be available that affected local peoples
understand they have the right to say „no‟ to operations
planned on their lands before and during initial discussions,
during the stage of information gathering and associated
consultations, during negotiations, and up until an agreement
with the grower/miller is signed and ratified by these local
peoples.
Refer also to criteria 2.2, 2.3, 6.2, 6.4 and 7.6 for Indicators
and Guidance on compliance.
Guidance:
This activity should be integrated with the Social and
Environmental Impact Assessment (SEIA) required by
Criterion 7.1.
Where new plantings are considered to be acceptable,
management plans and operations should maintain sacred sites.
Agreements with indigenous peoples, local communities and
other stakeholders should be made without coercion or other
undue influence (see Guidance for Criterion 2.3).
Relevant stakeholders include those affected by or concerned
with the new plantings.
Free, prior and informed consent (FPIC) is a guiding principle
and should be applied to all RSPO members throughout the
supply chain. Refer to RSPO approved FPIC guidance („FPIC
and the RSPO; A Guide for Companies’, October 2008).
Customary and user rights will be demonstrated through
participatory user mapping as part of the FPIC process.
Criterion 7.6
Where it can be
demonstrated that local
peoples have legal,
customary or user rights,
they are compensated for any
Indicators:
7.6.1 Documented identification and assessment of
demonstrable legal, customary and user rights shall be
available.
7.6.2 A system for identifying people entitled to compensation
shall be in place.

12
agreed land acquisitions and
relinquishment of rights,
subject to their free, prior
and informed consent and
negotiated agreements.
7.6.3 A system for calculating and distributing fair
compensation (monetary or otherwise) shall be in place.
7.6.4 Communities that have lost access and rights to land for
plantation expansion shall be given opportunities to benefit
from plantation development.
7.6.5 The process and outcome of any compensation claims
shall be documented and made publicly available.
7.6.6 Evidence shall be available that the affected communities
and rights holders have access to information and advice, that
is independent of the project proponent, concerning the legal,
economic, environmental and social implications of the
proposed operations on their lands.
Specific Guidance:
For 7.6.1: This activity shall be integrated with the social and
environmental impact assessment (SEIA)required by Criterion
7.1.
For 7.6.6: Growers and millers will confirm that the
communities (or their representatives) gave consent to the
initial planning phases of the operations prior to the new
issuance of a concession or land title to the operator.
Guidance:
Refer to Criteria 2.2, 2.3 and 6.4 and associated Guidance.
This requirement includes indigenous peoples (see Annex 1).
Refer to RSPO approved FPIC guidance („FPIC and the
RSPO; A Guide for Companies’, October 2008).
6.0 Approach and Methodology
In 2014 when we initiated our FPIC, we were guided by the 2008 RSPO guide for companies.
However, in the course of the FPIC process, the RSPO issued the FPIC Guide for RSPO
members (2015). The two publications formed the reference documents that guided our approach
and methodology. It was focused at ensuring that consent if free, consent is prior, consent is
informed, and consent is given. The process and steps are outlined below.

13
7.1 Our FPIC Steps and Process
7.2 Initial Visits, Consultation and Engagement with Community Stakeholders
We kick-started the FPIC process with initial visits to all the communities to introduce the
company and the proposed project. In all, we visited ten communities that were thought to have
long time relationship with the project land including customary and user rights. The ten
communities included to the east; Ekpan, Oke, Umuokpe, Irhue and Orhua, and to the west;
Agbanikaka, Owan, Uhiere, Odiguetue and Odighi.
We followed up on the initial visits with identifying and engaging with community stakeholders
especially the community based organizations including the traditional and elders‟ councils,
community development associations, women and youth associations. We introduced RSPO to
them and the requirement for and their rights under FPIC, especially, the right to say no if they
don’t like the proposed oil palm development.
In this particular instance, the communities welcomed the proposed development. They felt that
they were better off compared to the former owners and operators that did not accord them such
rights and consultations.

14
Plate 1: Initial visits and consultations with the communities by the Managing Director, Agriculture Coordinator,
Community Liaison Officer and other staff of the company.
7.2 Providing information.
We started providing information in earnest for us to comply with the FPIC principle that decision-
making and consent should be informed. We provided specific relevant information based on the different
stages of the project development including pre-construction, construction, operational and
decommissioning phases of the project and ensured that all information met the following guidelines:
• Open and transparent
• In locally appropriate languages and forms
• Delivered in culturally appropriate ways
It was further ensured that all the relevant and mandatory studies such as Environmental Impact
Assessment (EIA), Social Impact Assessment (SIA), High Conservation Value (HCV) Assessment were
carried out with the full participation of the communities, thus ensuring that the communities further
received the following information:
• Balanced treatment of potential positive and negative impacts
• An assessment of costs and benefits, and their distribution
• Alternatives and outcomes of different scenarios
• Information on community’s legal rights and legal implications of the proposed project.
• Benefit sharing

15
Plate 2: Project Information and Notice Boards at Extension Two Communities
7.3 Representative Organizations
The communities appointed their own representatives from their different community based
organization, ensuring that women and youth were included. The community representatives
thus came from organizations such as Community development Association, Elders Council,
Youth Association, Market Women Association etc. The representatives participated in the
iterative meetings and negotiations between the communities and OOPC Plc.
7.4 Power of Attorney
For all the communities, their representatives obtained the power of attorney to represent them
duly signed by the respective heads of the communities.
7.5 Participatory Mapping
Each community appointed their members who have good knowledge of the community user
rights within the project area and the extent of their lands. The community representatives and
company surveyors worked together to delineate the boundaries and identify areas of possible
boundary overlaps between the project and community’s land. In all the communities, no issues
of boundary overlap were raised during the participatory mapping exercise. However, the
outcome of the participatory mapping revealed that two communities namely Umuokpe and
Orhua are about 10 kilometers away from the boundary with insignificant claim to user right and
also outside of the project’s area of direct and indirect influence. They became disinterested and
opted out of the FPIC process, thus leaving us with eight communities to deal with.

16
Plate 3: Community Representatives involved in Participatory Mapping
7.6 Legal Representation
The remaining eight communities were availed the rights of technical and legal representation.
Whereas they felt no need for technical representation, they however chose to appoint one legal
representative, who is a member of one of the communities to provide legal advice and guidance
for all the communities. The communities thus procured and engaged the services of F. A. Osifo
& Co. (Solicitors), as their legal representative. The communities‟ legal representative
participated in the iterative meetings and negotiations. He subsequently drafted and finalized the
FPIC Agreement in conjunction with the OOPC Plc’s legal representative.
7.7 Iterative Meetings
The communities requested that all of them be treated equally and to ensure fairness and equity
they agreed that the iterative meetings be held in a central location. Iterative meetings were thus
held at the auditorium of the Nigerian Institute for Oil Palm Research. Reasonable time was
allowed in between the meetings for the community representatives to feedback and consult with
the larger community members. Most of the issues raised, discussed and resolved were cross-
cutting issues, while peculiar community issues were left for the negotiation meetings. The
iterative meetings were also recorded on video.

17
Plate 4: Iterative Meetings
7.8 Engaging in Negotiation
We then entered into negotiation phase involving a two-way dialogue between the communities‟
representatives and OOPC Plc’s representatives. Negotiations were done under a conducive
atmosphere; free from coercion or intimidation and the negotiation process was recorded on
video. Each community had their respective cubicles where they sat and engaged the company in
negotiation. Negotiation was done with full participation of both the community legal
representative and the company’s legal representative. The negotiation process provided good
support for decision making. The decisions reached at the negotiation table were documented
and they formed the cardinal elements of the subsequent FPIC agreement that was drafted.

18

19
Plate 5: Community Representatives and OOPC Representatives engaged in negotiation
7.9 Compensation
The communities and OOPC Plc resolved the issue of compensation at the iterative meetings and
negotiation. Both parties recalled that the former owners; A & Hatman had paid compensation to
community members who submitted legitimate claims for loss of crops. An understanding was
thus reached during negotiation that OOPC Plc is not liable to pay fresh compensation to
individual members of the communities but rather should provide support and assistance that
will benefit the entire communities.
7.10 Documenting Consent-Based Agreements
The community specific consent-based agreements were drafted jointly by the legal
representatives of the communities and the company. The agreements captured all the decisions
and obligations that were mutually agreed by both parties. The two legal representatives
submitted the draft agreements to the communities and OOPC Plc for their comments,
whereupon the final FPIC Agreements were produced and presented for signing by both parties.
8.0 FPIC Agreement Highlights
The FPIC agreement has provisions for clauses including preamble, the obligations of both
parties, Joint Implementation Committee, Force Majeure, Confidentiality and Grievance and
Dispute Resolution Mechanisms.
9.0 Signing Consent-Based Agreements
The signing of the FPIC Agreements was done in a public ceremony attended by the leadership
of the communities and the management of OOPC Plc on 29 July 2016. The signing ceremony
was witnessed by the Executive Director of the Nigerian Institute for Oil Palm Research
(NIFOR), while the Honorable Commissioner for Agriculture represented the Edo State
government. The event also made the news in both the print and electronic media as the very first
of its kind to happen in Edo State, if not Nigeria as a whole.

20
Plate 6: FPIC Agreement Signing Ceremony

21
10.0 Presentation of Signed FPIC Agreement
The signed FPIC Agreements were later notarized and delivered to the communities.
Plate 7: Notarized FPIC Agreement Display at Uhiere Community
Plate 8: Notarized FPIC Agreement Display at Owan Community

22
Plate 9: Notarized FPIC Agreement Display at Agbanikaka Community
Plate 10: Notarized FPIC Agreement Display at Irhue Community

23
Plate 11: Notarized FPIC Agreement Display at Ekpan Community
Plate 12: Notarized FPIC Agreement Display at Odighi Community

24
Plate 13: Notarized FPIC Agreement display at Odiguetue Community
11.0 Joint Implementation Committee
The FPIC agreement provides for the formation of Joint Implementation Committee (JIC) with
membership to be drawn from the representatives of each community and OOPC Plc. The JIC is
vested with the responsibility to plan and monitor the implementation of the FPIC Agreements
in their respective communities.
12.0 Grievance and Dispute Resolution
A grievance and dispute resolution mechanism provide a process for resolving differences that
may arise in the course of implementing the FPIC agreements. The FPIC Agreement provides for
clauses defining how differences will be communicated and resolved.

APPENDIX IV
OOPC STAKEHOLDERS’ ENGAGEMENT PROCEDURE

Document titleRevision: 2
PROCEDURESTAKEHOLDERS ENGAGEMENT Date: 11/05/18
Reference: GP28 Page 1 of 18
Action Name Function Date Signature
Prepared by Mikle George HSE Manager
Verified by
Olise Fidelis
IkponmwosaOsunbor
CommunicationOfficer
HRM
Approved by Dr. Graham Hefer Managing Director
OKOMU OIL PALM COMPANY PLC
PROCEDURE
STAKEHOLDERSENGAGEMENT

Document titleRevision: 2
PROCEDURESTAKEHOLDERS ENGAGEMENT Date: 11/05/18
Reference: GP28 Page 2 of 18
TABLE OF CONTENTS1. OBJECTIVE................................................................................................................ 32. APPLICATION FIELD ................................................................................................ 33. ABBREVIATIONS ......................................................................................................34. DEFINITIONS .............................................................................................................35. RESPONSIBILITY ......................................................................................................46. STAKEHOLDER ENGAGEMENT OVERVIEW .......................................................... 46.1. WHY STAKEHOLDERS ENGAGE............................................................................... 5
7. PROCEDURE (Stakeholder Engagement Strategy)................................................ 57.1. STAKEHOLDER IDENTIFICATION .............................................................................. 5
7.2. STAKEHOLDER PRIORITIZATION AND MAPPING ......................................................... 6
7.3. METHOD OF ENGAGEMENT .................................................................................... 6
7.4. INFORMATION DISCLOSURE ................................................................................... 7
7.5. STAKEHOLDER CONSULTATION .............................................................................. 8
7.6. VULNERABLE GROUPS AND GENDER CONSIDERATIONS ........................................... 8
7.7. ESTABLISH PARTNERSHIPS.................................................................................... 9
8. GRIEVANCE MANAGEMENT.................................................................................... 98.1. INTERNAL GRIEVANCE........................................................................................... 9
8.2. COLLECTIVE GRIEVANCE ....................................................................................... 9
8.3. INDIVIDUAL & COLLECTIVE GRIEVANCE MANAGEMENT PROCESS ............................ 11
8.4. EXTERNAL GRIEVANCE ........................................................................................ 12
9. RECORDS ................................................................................................................ 1710. REFERENCE............................................................................................................ 1711. REVISION STATUS..................................................................................................18

Document titleRevision: 2
PROCEDURESTAKEHOLDERS ENGAGEMENT Date: 11/05/18
Reference: GP28 Page 3 of 18
1. OBJECTIVEThe purpose of this procedure is to define how and why OOPC engages withinternal and external stakeholders for all OOPC operation.
2. APPLICATION FIELDThis procedure applies to all stakeholders associated with OOPC.
3. ABBREVIATIONSREC RecordMD Managing DirectorHSEM Health Safety& Environmental ManagerIMS Integrated Management SystemOOPC Okomu Oil Palm CompanyHRM Human Resources ManagerHRD Human Resource DepartmentHOD Head of DepartmentCLO Community Liaison OfficerGDP Gross Domestic ProductNGO Non-governmental organizationCO Communication Officer
4. DEFINITIONS Grievance: is a concern or complaint raised by an individual, group, or
community in relation to activities undertaken by OOPC. Collective Grievance: is a complaint raised by two or more employees in a
unionized workplace. Internal Stakeholders: Employees, Contractors, Suppliers, and Union. Internal Grievance mechanism: internal dispute resolution by which an
employee may have his or her grievances addressed. External Stakeholders: includes, inter alia, Communities, Government
organizations/institutions, NGOs, shareholders and customers that are affectedby or have an interest in OOPC activities, products and/or performance.
Engagement: actions taken by OOPC to communicate understand and involvestakeholders in the decision-making processes when appropriate.
Stakeholder Engagement Plan (SEP): system used to identify stakeholdersand manage engagement based on the level of interest and influence anindividual or group has on company operations.
Socioeconomic Indicator: A tool used to understand an individual or a group’sstatus within their local environment which can include GDP, life expectancy,literacy and levels of employment, in addition to freedom of expression, personalsafety and participation in civil society.

Document titleRevision: 2
PROCEDURESTAKEHOLDERS ENGAGEMENT Date: 11/05/18
Reference: GP28 Page 4 of 18
Partnership: Agreement between OOPC and a third party to develop projects orengagement activities through shared interests and/or resources.
Vulnerable Groups/Individuals: Vulnerable individuals and groups arepotentially more susceptible to negative impacts or have a limited ability to takeadvantage of positive impacts.
Union: A body under the Nigerian legislation responsible for workers withinOOPC.
5. RESPONSIBILITYHSEM is responsible for ensuring that this procedure is implemented andmonitored.
CLOs/CO will communicate with community leaders within OOPC footprint asstated in OOPC stakeholder management plan (OOPC/FORM 1.47, Annex 1&2).
CO/CLOs must provide minutes of meetings and photos, if applicable, to the HSEand MD of all meetings with the communities for documentation purpose.
CO will maintain constant open communication with all stakeholders and ensurethat all relevant information pertaining to OOPC is communicated.
MD will ensure constant communication with all stakeholders as stated in OOPCstakeholder management plan (OOPC/FORM 1.47, Annex 1&2).
HOD will communicate with stakeholders as stated in OOPC stakeholdermanagement plan (OOPC/FORM 1.47, Annex 1&2).
HRM will communicate with stakeholders as stated in OOPC stakeholdermanagement plan (OOPC/FORM 1.47, Annex 1&2).
PROJECT will ensure all OOPC approved projects are done according to plan andprovide updates to the MD, CO and the HSE department on at least a quarterlybasis to keep them abreast of developments with projects, and for documentationpurpose.
Company Secretary will provide relevant information to Security and ExchangeCommission on a quarterly basis and provide updates to the MD, CO and the HSEdepartment to keep them abreast of developments in respect of OOPC, and fordocumentation purpose.
6. STAKEHOLDER ENGAGEMENT OVERVIEWStakeholders are individuals and groups that are directly or indirectly affected byOOPC activities, in addition to those that may have interests in or influence overOOPC. This interest or influence can affect projects, activities, products or the

Document titleRevision: 2
PROCEDURESTAKEHOLDERS ENGAGEMENT Date: 11/05/18
Reference: GP28 Page 5 of 18
performance, either positively or negatively, of OOPC. Stakeholders include localcommunities or individuals living inside OOPC’s foot print, their representatives,national or local government authorities, politicians, religious leaders, civil societyorganizations and groups with special interests.
Stakeholder engagement is a broad term used to describe all activities andinteractions between OOPC and its stakeholders.
6.1. Why Stakeholders engageStakeholder engagement helps build trusting relationships and opens up lines ofcommunication between OOPC and stakeholders. Communication reduces risksto OOPC by identifying and dealing with issues as they arrive, thus improving thereputation of OOPC in the eyes of all stakeholders.
Stakeholder engagement spans all phases of the project and operation lifecycle,with different stakeholders able to influence each activity.
7. PROCEDURE (Stakeholder Engagement Strategy)OOPC uses this procedure to engage with stakeholders and it is driven by acommitment to openness and transparency and a respect for the views ofstakeholders. This procedure and strategy aims to harmonize stakeholderengagement procedures across all operations, opening communication channelsand improving working relationships with all stakeholders.
7.1. Stakeholder IdentificationStakeholder identification is the first stage of the engagement process. This willinclude those both directly affected, such as communities within OOPC’s footprintand those indirectly affected such as national or international NGOs. Stakeholderswill be determined through OOPC’s stakeholder engagement plan (SeeOOPC/FORM 1.47, Annex 1&2).
DescriptionInternalStakeholders
Board of Directors
Senior Management
Shareholders
Unions/employees
IndustryStakeholders
Suppliers
Customers
Industry associations

Document titleRevision: 2
PROCEDURESTAKEHOLDERS ENGAGEMENT Date: 11/05/18
Reference: GP28 Page 6 of 18
DescriptionGovernmentRegulators
Local agencies/officials
Regional/state agencies/officials
National agencies/officials
International organizations
Communities Directly affected communities within OOPC foot print
Community leaders
Civic Organizations Places of worship
Local trade or labour Unions
Educational or health organizations
Charitable organizations
Organizations supporting vulnerable groups
Non-governmentalOrganizations
Local/regional/state groups
National/international groups
Environmental Groups
7.2. Stakeholder prioritization and mappingNot every stakeholder group will require the same level of engagement in terms offrequency or method of communication. Once a stakeholder identificationexercise has been performed, it is therefore important to prioritize and mapgroups based on who they are and the level of risk they pose to OOPC operation.
7.3. Method of EngagementOnce stakeholder groups have been prioritized in terms of their level of influenceand/or operations, a different method of engagement should be developed foreach stakeholder if applicable. The reason for this is that individual stakeholdersand groups have different requirements in terms of language, communicationmaterials or method necessary to share and receive information.
Engagement can include: information sharing, where OOPC informs stakeholdersabout its performance or any changes; response (action), which is where OOPCresponds to stakeholder requests or complaints; or consultation, wherebycommunication with stakeholders is two-way and information gathered can beused to influence changes in operations.

Document titleRevision: 2
PROCEDURESTAKEHOLDERS ENGAGEMENT Date: 11/05/18
Reference: GP28 Page 7 of 18
Each stakeholder group may require different forms of engagement such as: Local Communities: consultative engagement may require written
communications in the main local languages, allowing communities to respondin the language they operate in. Some members of the community may alsorequire assistance with submitting or reading written materials. Communitiesmay require engagement with several subgroups separately including leadersand vulnerable groups.
Government Officials: Informative engagement is often required, such assharing of written materials in the national language. Meetings may also beheld where communication is verbal, but minutes should be taken and signedby all parties, where applicable and necessary.
International NGOs: Responsive engagement in the form of written reports andmedia communications aimed at assisting the building of relationships withinternational NGOs.The examples provided above are simplified for the purpose of this procedureand it is pertinent to note that some stakeholder groups will require a range ofengagement methods. Choosing an appropriate method of engagement foreach stakeholder group, depending on their need, will ensure thatcommunication is well received and understood, and can be responded toeffectively.
7.4. Information DisclosureDisclosure means making information accessible to stakeholders andcommunicating in a manner that is understandable. All types of engagement, fromconsultation to the resolution of grievances, will be more productive ifstakeholders, including affected communities, have accurate and timelyinformation about OOPC’s activities, impacts, and any other aspects that mayhave an effect on them. The type and level of information disclosed is dependenton the priority of each stakeholder, though OOPC will strive to be as transparentas possible as per OOPC code of ethics policy. Information disclosure is based onthe following key principles: Disclosure Timing: If feedback is required, it is important to share information
as early as possible to allow stakeholder’s adequate time to review andprocess what is presented and decide appropriately.
Meaningful Information: the information will need to be culturally appropriate ina format and language that is easily understandable by the stakeholder.
Accessibility: stakeholders will require information during engagement, butalso acknowledge on how they can access further information, if required.
Information Sensitivity: It is important to share risks and impacts with affectedstakeholders, but how this information is presented can influence their reactionto developments. When information is sensitive, it is important to present justthe facts and leave out any uncertainties.

Document titleRevision: 2
PROCEDURESTAKEHOLDERS ENGAGEMENT Date: 11/05/18
Reference: GP28 Page 8 of 18
7.5. Stakeholder ConsultationListening and understanding stakeholder concerns and feedback is a valuablesource of information, which can help improve OOPC operations, in addition tohelping to identify and address potential risks.
Once stakeholders have been identified and prioritized, and the method andfrequency of engagement determined, consultation requirements of eachstakeholder should be determined. Consultation with stakeholders will build trustwith communities within OOPC footprints and raises awareness.
Gender-inclusive: men and women often have different views and in somecultures it is not acceptable for women to be heard in public. Allowing womenthe time and space to participate is crucial.
Free: consultation should not be manipulated or coerced. Documented: tracking of consultation is important to ensuring key issues are
recorded and addressed Report back: those consulted will require information on time frame and when
they will receive feedback, further information/consultation. Consultation, participation and communication is achieved through one or
more of the following documents: minutes of meetings, management reviews,internal office meetings, circulars, memos, letters, emails, newsletter andboard meeting.
Ongoing: consultation is to be undertaken throughout the project lifecycle.
7.6. Vulnerable Groups and Gender ConsiderationsVulnerability is determined by the ability of an individual or group to cope or adaptto change and can be affected by the social, economic, technological, institutionaland cultural resources available. Vulnerable individuals and groups are potentiallymore susceptible to negative impacts or have a limited ability to take advantage ofpositive impacts. Vulnerability is often a pre-existing status that is independent ofOOPC and may be reflected in an existing low level of access to keysocioeconomic or environmental resources or a low status within certainsocioeconomic indicators (low or no education, poor health, low status within thecommunity etc.).Vulnerability varies from location to location and OOPC will determine who isconsidered vulnerable within their cultural context and consult with them on an adhoc basis as per OOPC/Form 1.47 and OOPC/Form 1.47 (Annex 1). Generallythere are some groups that are more likely to be vulnerable than others due totheir status within society and their ability to access resources. This includeswomen, elderly, disabled, indigenous groups and the poor.In many instances vulnerable groups will require special consideration in terms ofengagement, as they may not be able to participate in community wideconsultation or engagement activities. This will often require separate meetings
Document titleRevision: 2
PROCEDURESTAKEHOLDERS ENGAGEMENT Date: 11/05/18
Reference: GP28 Page 9 of 18
for vulnerable groups and consideration of whether they are fully represented bycommunity leaders.
7.7. Establish PartnershipsIn many instances, OOPC can benefit from strategic partnerships withcommunities, companies, government, NGOs or other stakeholders. This caninvolve joint activities and collaborative efforts based on a common interest. Thisis based on: Common objectives or strategic interests The pooling of cash or in-kind resources from all parties Sharing information, transparency and joint fact-finding Drawing in on core and complementary competencies Sharing risks and benefits, both financial and reputational.
8. GRIEVANCE MANAGEMENT
8.1. Internal Grievance Where an internal stakeholder feels aggrieved on any decision or action of
management, the issue must first be discussed with his/her immediatesuperior or manager or the HOD or HRD who will try to resolve the issue asquickly as possible within the time constraints of this procedure. If resolutionis accepted by the complainant, it should be stated in OOPC/Form 1.54
If the stakeholder is not satisfied with the outcome of the meeting with his/hersuperior or manager or the HOD or HRD, the stakeholder must make it knownto HRD or HOD in writing that he/she is not satisfied, stating the reason fortheir dissatisfaction and the HRD shall follow the procedure in clause 5.0.
If the stakeholder is not satisfied with the decision of the MD, the stakeholdermay write formally to the union for intervention.
Upon the receipt of a formal complaint, the Union shall check if thestakeholder had complied with the above stages.
If the Union is satisfied that the stakeholder has complied with the abovestages, the Union shall request a formal meeting with the MD to discuss theissue.
If the Union is not satisfied with the meeting with the MD, the union mustfollow their union constitution.
8.2. Collective Grievance Where the union observes, suspects or feels that an aspect of the subsisting
collective agreement or company’s policy and procedures have beenbreached, or acts on behalf of a stakeholder or union member, the union willformally write to HRD stating the aspect of the agreement, policies andprocedures that have been breached. The union shall fill OOPC/Form 1.53and send to the HSE Manager

Document titleRevision: 2
PROCEDURESTAKEHOLDERS ENGAGEMENT Date: 11/05/18
Reference: GP28 Page 10 of 18
On receipt of a formal union complaint, the HRD will investigate the claim andthereafter, invite the union representatives to a meeting to resolve thegrievance.
If the grievance is not resolved at the office of the HRD, the grievance will beupgraded to a major grievance and forwarded to the MD.
If the grievance is not resolved by the MD, the Branch union shall write to theState union executive informing them of the grievance.
The State union executive will schedule a time to hold a meeting with the MDto find an amicable resolution to the grievance.
If the grievance is not resolved at the State level, the State union executive willwrite to the National headquarters informing them of the impasse.
On receipt of the complaint from the state executive, the Nationalheadquarters of the union will strive to resolve the impasse/grievance byhaving an audience with the MD.
If the grievance or impasse is not resolved at the level of the Nationalheadquarters of the union, the National headquarter will declare a dispute andthe Statutory dispute resolution procedure will then be adhered to.
It will be an offence that will be sanctioned, not to comply with this grievanceprocedure and all processes of the grievance must be documented onOOPC/Form 1.53, 1.54 and minute, using OOPC Form GF15

Document titleRevision: 2
PROCEDURESTAKEHOLDERS ENGAGEMENT Date: 11/05/18
Reference: GP28 Page 11 of 18
8.3. Individual & Collective Grievance Management Process
GRIEVANCE SUBMISSION AND RECORDING
Take corrective Action/Track prog.ressUntil Resolution Found
& document on OOPC/Form 1.54….
Grievancesubmitted by
third party
Grievance submitted byemployee/UnionGrievance received by
HSE Manager
Identifydepartment/person toprovide information or
take action
Label grievance Minor Medium Major
Third party toInvestigate grievance
with all relevant partiesand document onOOPC/Form 1.54
HSE Manager registers Grievance: (when,where, who, how, date, place, name of
recipient, evidence) as stated onOOPC/Form 1.53 and pass the information
to the HRM
Record decision onOOPC/Form 1.54….,
include how, when and bywhom decision was made
Report to managementon actions taken toavoid recurrence.
If acceptedProvide outcome to
complainants
MD
If not accepted

Document titleRevision: 2
PROCEDURESTAKEHOLDERS ENGAGEMENT Date: 11/05/18
Reference: GP28 Page 12 of 18
8.4. RECEIPT OF GRIEVANCEThe HSE Manager receives all grievances and ensures OOPC/Form 1.53 iscompleted. Grievances can be submitted through the following channels: OOPC mail box at various locations within OOPC plantation (including
Extension 1 and 2). OOPC Website: http://www.okomunigeria.com/ E mail: [email protected] In writing: Okomu-Udo Ovia South west LGA P.M.B 1449, Benin
City, Edo State Nigeria Attention: HSE Department (Grievance section) Lagos office- Coscharis plaza, Adeola Odeku, Victoria Island, Lagos.
8.4.1 Registration of a GrievanceOnce a grievance is received by HRD, and OOPC form 1.53 is completed, itwill be officially acknowledged by HSEM, and then documented andrecorded in the HSE data base and passed to the MD for furtherinvestigation (see 8.3.3). After resolution, the HRD will respond to thecomplainant in written form of the resolution achieved (see 8.3.4).
8.4.2 Investigating unresolved and major GrievancesThe MD will assign all investigations to a relevant third party (such asconsultants) to resolve these grievances. All investigation should becompleted as quickly as possible, but will depend on the nature of thecomplaint or concern and the required action to be taken. The grievancedatabase should record all actions taken as part of the investigation process,including dates of communications with different departments, responsesand expected actions. In some instances, further evidence may be required,which will involve a third party outside of the organization. All grievanceinvestigations must be handled on a strictly confidential manner with noconflicts of interest, personal or professional gain or bias. The HSEM willtrack all grievances-minor, medium or major.
8.4.3 Recording and Reporting DecisionsAll decisions must be recorded on OOPC/Form 1.54 and communicated withall parties involved in writing to ensure that all parties are in agreement. Thecomplainant may not always be satisfied with the resolution on offer, which iswhy in some instances; several different resolution options may beadvisable.
8.5. External grievanceThis applies to an external stakeholder who wishes to register a grievance. Thegrievance should be submitted in writing with the stakeholders contact informationon community, government or NGOs letter head. The letter should state the natureand background to the dispute and the proposed solution to resolve the matter.

Document titleRevision: 2
PROCEDURESTAKEHOLDERS ENGAGEMENT Date: 11/05/18
Reference: GP28 Page 13 of 18
The submission of the grievance should, at a minimum, include provision of thefollowing:
Full Name Name of Organization (as applicable) Address Phone No./Fax No./Email Address (at least one contact point) Description of the grievance in details Evidences to support the grievance
External stakeholders can submit their grievances via the under listed channels: The Community Liaison Officer OOPC Website: http://www.okomunigeria.com/ E mail: [email protected] or [email protected] In writing to:
Okomu-Udo Ovia South west LGA P.M.B 1449, Benin City, EdoState Nigeria Attention: HSE Department (Grievance section) orthrough the Community Liaison Officer or CommunicationOfficer; or
Socfin S.A.Attn.: Grievance Coordination Team4, Avenue Guillaume1650 LuxembourgGrand-Duché de Luxembourg
OOPC’s grievance procedures and social and environmental standards shall becommunicated to all interested and affected stakeholders through strategiesidentified in its stakeholder communication strategy.

Document titleRevision: 2
PROCEDURESTAKEHOLDERS ENGAGEMENT Date: 11/05/18
Reference: GP28 Page 14 of 18
EXTERNAL GRIEVANCE MANAGEMENT PROCESS
Receiptby CLOs, CO & HSEM
Initial ReviewOOPC/Form 1.53
Case Closed
Interview (including witnesses) Meeting with stakeholders Stakeholder Engagement
Investigation
Priority Setting
Verify findings
Communications
Monitoring & ProgressUpdate
Resolution/SettlementOOPC/Form 1.54
Case Closed
Time-bound action plan
Complaint and Evidencefrom Stakeholders
(Local community, NGOs,Cooperative whistle blower)
Preliminary Fact Finding by compilingevidence/Proof and validation.
Acknowledgment/record by HSEM. IfMajor, pass to Socfin Grievance
Coordination Team. If Minor or medium,then forward to the HRM who passes it
to
No
Fact finding
To Proceed?
Yes
Review & UpdateAction Plan/Corrective and
Preventive Action
Grievance Type Minor Medium Major
MD
Importance to Company Importance to affected
Stakeholders Clarification of
grievances
Documented Evidences Fact Finding Summary Cause & Effect analysis
Guiding Principles ofComplaint Resolutionthrough StakeholderEngagement
Objective Fair & Equitable Integrity Balanced interest Constructive engagement
(win-win approach) No intimidation or
instigation of violence byall parties involved
Compliance to Law &Regulation
Clarify to complainant
If notaccepted

Document titleRevision: 2
PROCEDURESTAKEHOLDERS ENGAGEMENT Date: 11/05/18
Reference: GP28 Page 15 of 18
8.5.1.1 Interpretation of the External Grievance Management ProcessA Complaint/evidence is received from stakeholders through the recognizedchannels (see 8.5), with an initial review done by the HSEM, CO or CLOs andacknowledged by the HSEM, who will forward all to the MD to indicate whether toproceed. If “NO,” the grievance will be clarified to the complainant by the HSEMand closed, but if complainant is not satisfied it will be referred back to the MD forfurther decision. If “YES”, the grievance investigation will proceed using the factfinding approach by conducting various interviews (witnesses inclusive), meetingswith stakeholders and stakeholders’ engagement, if necessary. In addition togrievances submitted through the official channels listed in 8.5 above, issuesraised through unofficial channels, such as the media and the internet, will berecorded as grievances on request by either TFT or Socfin, as per described inthe following chart.

Document titleRevision: 2
PROCEDURESTAKEHOLDERS ENGAGEMENT Date: 11/05/18
Reference: GP28 Page 16 of 18
All information required to effectively process and investigate the grievance willalso be entered in the database (see OOPC/Form 1.55).During investigation and resolution processes: Communicate by arranging a meeting with the complainant and all affected
stakeholders. Discuss the investigation process and solutions and getcomplainants consent to the intervention.
Set priorities by indicating if complaint is Minor, Medium or Major as defined. Verify findings by reviewing and updating the action plan/corrective and
preventive action. Each case is expected to be addressed within 15 workingdays, beginning from the date of receipt. Depending on the proceduralcomplexity of the case, the time frame for each stage could be adjusted bythe head of the investigation team and a new time frame communicated tothe stakeholder and MD. Also review all relevant supporting documents,determine the underlying cause, engage all impacted stakeholders andcoordinate with the respective department and/or a specialist responsible foraddressing the complaints properly.
Monitor by continuously reviewing internal reports, and recommendations-recommendations may be an operational action plan, corrective actions, andimprovements to existing policies and/or continuous engagements withstakeholders.
Resolution options can require a one-off action or warrant ongoingprocedures depending on the nature of the complaint or concern. Thecomplainant may not always be satisfied with the resolution on offer, which iswhy in some instances, several resolutions are advisable.
Open communication with the complainant during the grievance process isimportant to present information transparently and in an appropriate format.Once presented with a set of responses, the complainant must decidewhether to accept or reject the resolution. If the resolution is accepted then itmust be recorded in the database with the grievance signed off as resolved.The complainant will also receive a written record of the resolution to ensurethat all parties are in agreement.
Close case if complainant and affected stakeholders are satisfied with theaction taken.
If the response is rejected, then additional responses will either be requiredor the grievance escalated to more senior management (MD). Alternatively,the complainant has the right to escalate the complaint to a third partyoutside the company, for assistance and finding a resolution.
OOPC will make every effort, to the extent appropriate, to resolve grievancesamicably. If grievances are not resolved, OOPC will seek the expertise of aneutral third party outside OOPC for assistance in finding a resolution in linewith the third party’s grievance management mechanism or framework.
All proposed actions to be taken must be presented to the MD for approvalbefore implementation.
Major grievances will be handled according to the below chart in conjunctionwith the Socfin Grievance Coordination Team

Document titleRevision: 2
PROCEDURESTAKEHOLDERS ENGAGEMENT Date: 11/05/18
Reference: GP28 Page 17 of 18
9. RECORDSa) OOPC/Form 1.53b) OOPC/Form 1.54c) OOPC/Form 1.55d) OOPC/Form 1.47e) OOPC/Form 1.47 (Annex 1)f) OOPC/Form 1.47 (Annex 2)g) Grievance letterh) Statements/evidence (if available)i) Form GF15 (minutes)
10. REFERENCEa) RSPO Criteria 6.3, 1.3b) ISO 14001:2004 Clause 4.4.3c) Socfin Group Grievance Management Processd) EBRD(2012) Grievance Management Guidance Notee) CAO (2008) The Office of the Compliance Advisor Ombudsman: A Guide to
Designing and Implementing Grievance Mechanisms For Development Projects.f) IFC (2007) Stakeholder Engagement: A Good Practice Handbook for Companies
Doing Business in Emerging Markets.g) IFC (2012) Performance Standard 1: Assessment and Management of
Environmental and Social Risks and Impacts

Document titleRevision: 2
PROCEDURESTAKEHOLDERS ENGAGEMENT Date: 11/05/18
Reference: GP28 Page 18 of 18
h) IFC (2009) Good Practice Note: Addressing Grievances from Project-AffectedCommunities: Guidance for Projects and Companies on Designing GrievanceMechanisms.
i) FSC Criteria 4.3, 4.4, 4.5.
11. REVISION STATUSRev. Date Details
0 17/09/15 Initial Release
1 24/05/17 Changed ISO 14001:2004 Clause 4.4.3 to ISO 14001:2015 Clause 7.4Changed logo in headerAdded a verifier in front pageChanged HRC to HRM in Section 5 – ResponsibilityChange HRM mail address and company’s website in § 8.4
2 11/05/18 Changed sentences in Section 8