Ifeanyi Jonas Ezema - University of Nigeria, Nsukka Open ...
Upload
khangminh22Category
view
0download
0
University of Nigeria Research Publications
EBE, Felix Edeoa A
utho
r
PG/Ph.D/98/25216
Title
Economic Study of Fuelwood Marketing and
Consumption in Enugu State, Nigeria
Facu
lty
Agricultural Sciences
Dep
artm
ent
Agricultural Economics
Dat
e
August, 2007
Sign
atur
e

ISCONOMIC SrI'U3Y OIT l~lJlSl,W001) MAKKE'I'INC; AND
CONSUMPTION IN ENUGU STATE, NIGERIA
DEPARTMENT OF AGKICULTUIL4L ECONOMICS UNIVERSITY OF NIGERIA, NSUKKA

l bc , 1:elix Edeoga, a postgrnduate student in the Department of Agricultural
I':conomics and with the registration number l'G/I'11.1/9/252 I 6 has satishctori ly
1:conomics. 'l'l~c work ~~nh~cl icc l in this D i s ~ ~ r t i l l i ~ ) ~ ~ is original and has not bccn
submitted in part or full for any other diploma or degree of this or any other university.
l'ro( 1 i . C ' ~ wagbo (Supcrvisor)
[l'ml'. I(.C.. Nwagho ,I
(Head of Department)
I'rof. KC. Okotji (Supervisor)

'I'l~is dissur~ation is dcdicaktl IO those who I ~ t l I W privilcgc to ucqilirc wcstcrn
education, let God in his mercy providt: them with anollier means of social change and
economic empowerment.

I wish to express my appreciation and gratitude to those who contributed
immensely througll their c~lcou~xgc~nei~t, and wise coi~nseling during the rcsearchcr's
graduate stutly. Among them wcre my supervisors, Prof: I:.C. Nwagbo and I'roE E.C.
Oktwji liw tiicir paillstaking cll'orls, i~icisivc commcnls arid co~lslructivc critisms in order
to see that this stutly came to fruition. I must not fail to extend my deep sense of
appreciation lo n~etiil~ers of slafT of l>epurtmcnl of Agricultural 13conomics, especially lhc
I lead of I)epartment, Dr. (Mrs.) A.1. Achike. No word is adequate to express my gratitude
to 1)r. I:.(). Agbo o f Agricu:lural IGm~omics I)cparlme~ll fbr his fatherly advise and
enco~~ragcmenI during the hcclic period ol'lhe researclicr's slutly.
At this juncture, 1 would like to extcnd my unalloyed thanks to my lovely wife,
Mrs. Rosemary Ehe, Children - N~la~ntli l'bc, I'zinne Ebe, Kclcchukwu Gbe and my
parents Mr. & Mrs. Moses Iibe Nwebe l'or heir endurance and suffering throughout thc
duration of the study. I am highly indebted to my brothers and Sisters, Bro. Augustine
Ebe, John Ebe, lion. Godwin Ogenyi, Y3ro. Joseph Anckcagbo and Sis. Florence Ebe for
lheir spirilud assislance through prayers.
I:inally, I acknowlctlgc the nssis!nncc and various conlributions either through
advise, eiicouragement or finance rendered to the researcher by Dr. Moses Ezike, Mr. Edc
Mathew, Mr. Ede Livinus, Chief (Ilon) Osita Ogene, I [on. lkechukwu Ome, Ven. T.N.
Nzelu, liev. 1:r. 1,ivinus Nn~ji , .Mr,&Mrs> Ilaniel Nwankwo and I Ion. & Mrs. Innocent
Ezeoha.
Ebe, Filex Edeogs Department of A~ricullural I~cononlics ,, , .: University of Nigeria, Nsukka. August, 2007

ABSTRACT
In the past, collection of f~~elwood was primarily for self consumption. In recent years,
filelwood has increasingly become a marketed commodity especially in the urban areas as
a 1-csi11t 0 1 ' incrcasc i l l the dcmancl ol' tlic wood procluct by the urban poor. 'l'liis has
encouraged the supply of fuelwood to the urban areas. The study examined the supply,
marketing and consumplion of firelwoocl in Unuga State. 'I'hc spccilic objectives ol' thc
study wcrc 1 0 : descrihc and analyze Ihc m d x t i n g channel and slruclurc, detcrminc lhc
markcling margin and prolikhility 01' litelwood in the hoc~seliolcls, determine the socio-
economic cliarnctcristics of li~clwood h:~rvesters and consulncrs, identify common
problenis being experienced by the people involved in fuelwood marketing and
ccinsitnlption and tnahc recomn~cnclirtions based on the findings of the study. Ninety
ti~elwood harvesters, 90 niiddlemcn (wholesalers and retailers) and 120 consumers were
chosen Sro~n the three agricultural zones ol' the state. 'l'licy wcre chosen througl~ clustcr
random sampling techniques. Primary data were collected through the use of
questionnaires designed differently for fuelwood harvesters, middlemen and consumers.
'['he questionnaires were administcrcd through intcrvicw sclicclulcs. Analytical tools used
were descriptive statistics, ordinary least squares, gini-coefficient, marketing margin and
gross margin analyses. 'I'llc result 01' the study showctl that 76% o r the fuelwcwd
Iiarvcstcrs wcrc m;~lcs while 62%) 01' wholcsalcrs and (17%) of rctailcrs wcre females. The
lindings indicated tliat mqjori t~ W"~IIC I~rirvcsters, wholesalers; retailers and consumers
wcre murricd with large lio~tschold sizcs ranging liom 0-10 persons. Also majority ol'
these respondents had low level of education and tlicy earned Pt20,000.00 or less
monthly. 'l'hc tnarkcting channel showed that .f~~elwood tnovcd l'rom the harvesters to the
wholesalers, rctailcrs and Iinally to the consulners. 'l'lie analysis of the market structure
showed that the harvesters, wholesalers and retailers had low concentration of 0.16, 0.24
ant1 0.1 1 rcspcctivcly. 'rhc mnrkcting margin result indicated tliat middlemen had a
mi~rgin 01'45. 1'%) wliilc the producers s1ii11.c was 54.0'%. ' 1 ' 1 ~ prolit analysis showed that
harvesters, had a net profit of #48, 072.00, wholesalers W71, 230. 17 while retailers had
#54. 344. 8 8 . 'l'hc rcsult irlso sl~owcd that 92 % of tlic I~ouscholds used f'uclwood Sor
cooking, 27% lbr Iic:rting, 17% drying while 4% usc i t I'or ironing. l 'he socio- econo~nics
cI,aractcristics that all'cctctl li~clwoocl supply signilicantly wcre hoi~scl~old sizcs, labour
ti~ne, priccs 01 ' the l'i~elwood, cost ol' transportation and age. Also household sizes and ' - . : . . . I ; ' . ; 1 , I~ l - .?nnl l

significantly. Com~iion problems of fi~clwood marketing and consumptions were high
cost of transportation, scarcity 01' fuclwood, bad road, lack of capital, and labour intensive
nature ol' llic trade. lack or space Ihr storage, poor working tools, health problc~iis and
;ltt~xcliot\ 01' I ~ ; I I ' I I ~ I ' ~ I I IIISC.C~S. I IIC' sli~dy C O I I C ~ ~ I ~ C ' ~ (11i1t ~ O V C I ' I I I I I C I I ~ policies O I I povc~~ty
scductio~i ~iccds to hc scvicwcd so as to iliclidc tlic cncourugcmcnt ol' pcoplc involved in
fuelwood business to gradually source for alternative means of livelihood and hence
discourage them from exploiting trees to ensure sustainable and management of forest
and trcc scsoi~rccs. 'l'lic sludy rcco~ii~ilc~ltlcd alllong ot llcrs li)nii;ition 01' coopcrat ivcs,
cstnblislimcnts or forests, inlbr~nation units, maintenance of feeder roads and provision of
altcrnativc cncrgy sources s~lcll as li~t.oscnc and cooking gas at clicapcr rate.

vii
TABLE OF CONTENT
CIIAPTKR ONE: Introduction
1 . I Rackground - - 1.2 I'rohlcm stattmcnl -
1.3 Ob-jectives of the study - 1.4 Research hypotheses-
1.5 Justificaticn of the study
1.6 Limitation of the study - 1.7 Plan of the report -
CIIAI'TEII TWO: Literature Review - . , I . , , . I
2.1 Concept of the study - - 2.1.1 Fuelwood - - - - 2.1.2 Fuelwood ~narket participants - 2.1.2.1 Fuelwood harvesters - - ,I -
2.1.2.2 Fuelwood wholesalers - - 2.1.2.3 Ihelwood retailers - - 2.1.3 Fuelwood consumers - - 2.3 Marketing - - - - 2.2.1 1:uelwood marketing - - - - - 2.2.2 Murkcting Chonnel - - - - -
I
2.2.3 Market structure and concentration - - - 2.2.4 Marketing cost and margin - - - -
I
2.2.5 Gross Margin - - - - -I 9 l ! ~ ~ ~ ~ l ~ ~ r n n A c n a n n l x r - - - - -
- 1
. . - 11
... - 111
- i v
- v
- vi i
- xi ... - X l l l

Scasonaiity of' li~clwooci supply - Factors that affect fuelwood supply -
'Types of Sirelwood available - Sou~.ccs of l ' i ~ c l w ~ ~ ~ d supply - Gcndcr issues in fuelwood supply - I:uelwood consumption - - 1 louschold fklwood consumption - No11 l~ouscl~old ft~clwooct consumption
Poverty and fuelwood consumption- - I'roblcms of fklwood consumption- - Ihvironmental problems - - Social problenls - - - Economic problems - - - I Jealth problems - - -
Problems of fuelwood marketing - Shortages o f fuclwood - -
Poor network of road - Cost of transportation - - Theoretical framework - - Analytical liamework - -
. , 4 . 4 "I. . . 'a . Multiple regression - -
Marketing margin -
Gross margin - - Gini cocl'ficicnt - -
,I
CHAPTER THREE: Research Methodology
3.1 Study area - - - - - 3.2 Sampling procedure - - - 3.3 Method of data collcction - - 3.4 Method of data analysis - -
3.5 Modcl specification - - 3.5.1 Multiple regression - -
3.5.2 Marketing margin - - - 3.5.3 Gross margin - - - -

Socio-economic characlcristics of liiclwood ~iinrkct participants
Gcnder of the Suclwood ~narket participants - ..
Age ol'the li~elwood market particip:t~~ts - - -
Maritdl r:atus of the fuelwood market participants - - I .cvcl ol'cducation ol'thc liiclwood niurkct participants -
()cciqx~tion ol' thc I'i~clwood ~nurkct lxwlicipants - - - 1 louscliold size of the I'uelwood market participants. - -
Montl~ly income level of the fuelwood market participants. - Markcling cxpcrience ol' li~clwood niarkct participants -
Socio-economic characteristics 01' tlic liielwood consumers
Marital status of the fuelwood consumers - - - I,evel of fornial education o f the li~clwood consumcrs - I lousehold size of fuelwood consi~nicrs - - - -
Primary occupation of the fuelwood consumers - - - Monthly income levcl OF the fi~clwood consumers - -
Marketing system and market structure - - - ., ,, . .'. ". .'P .
Sources of I'uelwood - - - - - - Markding channcl - - - - - - - Quality perception of fiielwood by tlie buyers and sellers -
I'rice lixing in fuelwood sales by the liarveslers, wholesalers and retailers 68
Sources of market infornialion in the study area - - - 6 9
Market structure - - - - - - - - 70
Analysis o f market struclurc - - - - - - - 70
Marketing margins and profitability - - - - 75
Marketing margin and Cost - - - - - - 75
1 Pt~rcllasing and sclling prices - - - - - 75
4.5.1.2 Marketing cost of llie fuelwood market participants - - 80
4.5.1.3 'The marketing margin - - - - - 82
4.5.2 1'rolit:ibility ol' liielwood ~nurkcting - - - - - 83
4.6 I lscs ol'li~clwoncl in rlomcstic scctors - - - - 88

I lscs of' li~cl wood in l~oi~scl>olds - - - - Markct participants lion1 wl~om thc consumers buy their fuclwood
Sources of alternative energy - - - - - - 1,ll'ccls of socio-cconon~ic Iclctors on tllc fuelwood supply - - IIl'lkds ol'socio-cconomic li~clors on li~c.lwood dcmnntl - -
\?oblcms ol' lilclwood markcling and consumptio~l. - - ('omnlon problc~ns ol' firelwood marketing - - - -
Con~mon problems of fuelwood consumption - - - -
CIIAP'TIZR FIVE: Summary, Conclusion and Rccommcndations - - - 5.1 Summary - - - - - -
5.2 Conclusion - - - - - - - 5.3 Recommendations - - - - - -

LIST OF TABLES
3.2 'l'he samplc for wl~olcsalcrs - - - - 46
3.3 'I'he sample fiw rctailcrs and consi~~ilcrs - - - 46
4.1 Distribution of fuelwood harvesters, wholesalers and retailers according to gcndcr - - - - 53
4.2 I:rcque~icy distribution oftlie fuelwood market participants according lo ages. - - - - - - - - 5 4
4 . 3 I Iistri hution oL' l'ucl wood Iii~rvcstcrs, wholcsalcrs nnd rctailcrs according to ~narital status - - - - - 5 3
4.4 Distribution of fuelwood harvesters, wholesalers and retailers according to level of formal education - - - - - 5 5
4.5 LXstribution of fuelwood harvesters, wholesalers and retailers according to occupation ofthe rcspondcnts - - - - - 5 6
4.6 Frequency distribution according to household size - - - 57
4.7 Ilistri bution of fuelwood hal-vcstcrs, wholesalers and rctailcrs according to montldy level of income - - - - - 5 8
4.8 Distribution of fuelwOMlkia'f~esPers, wholesalers and retailers according to itiarket experience - - - - - - 59
4.0 IIistribution ol'thc respondents according to thcir marital status - 60
4.10 Distribution of fuelwood user? according to level of formal education 60
4.1 1 Ilistribution of the fidwood consumers according to houschold size 6 1
4.12 1)istribution ol'the li~clwoocl co~isu~~ic~ .s according to thcir primary occupations - - - - - - - - 62
4.13 IXstribution of li~elwood consirlncrs according to their level of ~nontllly incomc. - - - - - - 62
4.14 Distribution according to sources of' fuelwood. - - - 6 3
4.13 Rural communities wlierc filelwood is sourced and thc three urban ~ual-kcts wlicrc hcy arc sold - - - - - - 64
A I I \ : .. r . . : l . . . r : .... . . l ' I ...... , .... 4 ...... ... I . . . ( ...... I ...... ...., I .... r . . : l . . . . . . .......,.-. I : . . . . i.. ,..:i,..;,.

xii
Distribution of fuelwood harvesters, wholesalers and retailers according to method of price fixing - - - - - - - 6 8
Analysis ol'<iini Cocllicient for dctcrmining the conccntration of halvestcrs i n fuclwood market- - - - - 7 1
Analysis of Gini Coefficient for determining the concentration of wholesalers in fuelwood niarkct - - - - - 72
Analysis of Gini Coeflicient 1i)r dctcrmining the concentration of relailcrs in fuelwood ~narkct - - - - - 7 3
Mean purchasing and selling priccs per tonne of Suelwood for harvcstcrs, wholesalers and r ~ t - 111 ' 1 crs - - - - - 76
Mean marketing costs per tonne of fuelwood by the harvesters, wliolesnlers and retailers. - - - - - - 8 1
Protits for the average Suelwood harvesters - - - - 84
Psolits h r the average luelwood wholesalers - - 8 5
Profit for the average fuelwood retuilers. - - - - 8 6
Distribution of households%c~ar~Nn~ to the uses of fuelwood - 88
Distribution according to fitelwood consumption by households - 88
1)istribution according to whom the consumers buy their li~elwood - 89
1)istribution according to sources of alternative energy - - 90
1)istribution of respondents according to proble~ns encountered in li~elwood nlorketing - - - - - 96
I>istribution of respondents according to common problems that were associated with fuelwood consunlption - - 98

xiii
LIST OF FIGUIWS
Vignrc I%gc
4.1 Marketing channel of'fiielwood in the study arca - - - 65
4.2 Graph showing thc seasonal supply of li~elwoocl in thc study area - 78
4.3 i;raph showing the seasonal price of fuelwood in the study area - 79

1.1 Ihckground
I'rccs are rcncwablc rcsoirrccs growing naturally in both rural and urban arcas
while some arc planted directly hy man within his enviro~i~ncnt. I'licy are integral parts ol'
tllc rural society and the subsistcncc economy. 'l'rccs provide services and amenity
functions, including soil maintenance thrwgli conservation, stabilization and protection
against water and wind erosion and also maintenance of' environmental quality (Garieth el
trl.2000; Okaliw, 1086; Okigbo, 1086). 'l'licsc arc indircct scrviccs and are not marketable.
'l'lie dircct and marketable scrviccs and prodi~cts fioin trees inclutlz the supply of timber,
I'i~clwood, polcs, wood pulp. food, nicdicinc, condi~ncnts, Iioney, gum, oil, fodder, latex
and so on. Among all these products provided by trccs li~clwood is mostly used i n
Nigcria. I t is Ii)uncl in the liwesl and sav:lnnil zoncs ofthc country (Itzcma, 20L ;,. I:i~clwootl is wood burlit directly as I'ucl (Agarwal, 1080). I;uelwood is obtained
from trunks, branches and other parts o f trees and shrubs (FAO, 1981). It is a bulky and
licavy ~ i~a t c~ - i i~ l 01' low unit value LIIKI low price C O I ~ P ~ I ~ C C I 10 conventional filels. It is very
simple and cheap to prepare and use. 'l'hc overall dircct cost of using fuelwood is
generally lowcr than that Sor ~lltcrnativc li~cls becuusc, unlikc thc latter, it requires only
little investment i n the purchase of secondary appliances. f:uelwood is regarded as
inferior, dirty and inconveniclit- fueb.to we,. at least by consumers who have access to
alternative energy sources (conventional li~els). It is the most accessible fuel even among
ilrhan lioi~scliol(is (f'ctcrs. 2 0 0 0 ) .
Nigcria, as n large developing country, has considerable fuelwood requirements.
In ternis o f volume, li~elwood is the most important wood item consumed in Nigeria as
well as i n other West African cortnlrics. 11 accounts Ii)r iiI3011t 95% 01' the total wood
consu~iicd i ~ r Nigeriir (Alan, 1000). Accordi~ig to IJdo ( I W7), C'liukwu (200 l ) , rnorc thm
70% of the ~otal popi~lation of Nigcria relies on f*i~lcwood o r charcoal as tlicir ma.jor
source 01' energy Sor cooking and Ilcati~ig purposes. It is tlic primary tile1 in developing
nations i n t c~ms ol'demirnd hy the consumers and the third most important fu'ucl after oil
and coal in the world (Openshaw, 1980). 1 lalf of the wood used in the world today is
burnt as fuel mainly i n the developing coirntries where it accounts I'or about 80% of wood
harvested (Ilan Junger 1984; Alan 1990). About 200 million people in the developing
~ialio~is iI~-pc~id 011 wood irs tlrcir ~iwiii x)t~rcc ol*c~icrgy ( 1 1;rns c( i l l , 1989). 11 is llic 11iajor

i ~ d ~ r s t r i c ~ and l'or conlmcrcial cntcrpriscs. In the urban arcas, low ~ I I C O I ~ C I!~~~!scholds use
tht: ti~elwoocl as their main source of' energy Ibr cooking and heating while the middle
inconic c*arners usc i t as suhst i t~~~cs or si~pplcn-rcnlary litel li)r tlonicstic cooking, heating
and c o ~ ~ l n ~ e r ~ i n l pi~rposes (l'andcy. 2002).
'I'he demand Sor Suelwood by the rural people and thc poor oncs in urban arcas is
~lcccssitatctl by tllc ~rati~rc, s i x and cooking habits ol' their Ii~milics. 'l'llcy hwe large si/c
of familics, cook large quantities of' food and most of thcse food require at least 30-60
minutcs cool\ing. 'l'lrcy also carry out processing which lasts 2-3 hours. 'I'hese activities
rccpire Iargc quantities of cncrgy whicll could easily bc obtained from fuelwood. As a
result 01' Illc i~lwvc lirctors, no st ol'tllc rural pcople ant1 the urban poor have to depcnd o n
li~clwood as ;I source ol'cncrgy as tllc ~)~oduct can he obrai~ictl at lower prices.
I:or about more than a tlccade now there had bccn rapid growth in urban
population. According to Bender and Smith (1 997), the percentage of developing country
rcsidcnts in 11rha11 ;lrc;Is is rising rapidly. In Nigeria illc rise i n the urban population could
bc a~tributcd to oil boom that was accompanied by industrial development. This
development led to migration from rural to urban ccntrcs i n search of greener pasture.
One of the effects of the rapid growth of the urban population is increase in the use of
li~clwoo~i 13s lx~lli 111c low w t l r ~ ~ i ( l t I l ~ - i~~conlc groi~ps. ( )I ' ICII 1Iw ~nigsmts carry their rural
ways of life and continue to rely on fuelwood for their domestic and commercial needs.
Other reasons behind the increase in the consumption of fuelwood in the urban areas are
the scarcity of convcntionnl 'Sticl? %itdli i s kerosene, cooking gas and the subsequent
increases i n the prices of thcse Si~cls.
I lowevcr, with this increasc in thc demand fix li~clwood in the urban areas, as
well as the existing local consuniption, and, with the developnient of feeder roads and
transport system, market opportunities' fo; fuelwood emerged. With the creation of this
opport~mily, many people I~otli i n rurul and 111-ban arcns cntcrcd into hclwood busincss
and new employment opportunities wcrc created.
Consequent upon the above dcvclopmcnt. shrubs and trecs i n rural area2 are being
harvested and inarkcted in the urban centres as f~~clwood. Altnosl all the fuelwood
hurvcstctl r i d supplictl to i~rb;rn c c i ~ t ~ ~ ~ comc from r~~ra l arcas. 'l'hcsc arc supplicd Srom
natural f'orests, farm trees, open rangelands, plantations and compound trees. The supply
involves getting the products lion1 rural to urban centres. l'he rural to urban fuelwood
trading and distrilwtion ncrwork involving nunicrous i~lt~rmcdiarics at various levcls
provide jobs, i~iconrc. trntl livclihootl 10 Irr~~idrccls of' Ihn~ilics ln)111 iri the rirrel nncl r ~ r l w ~

areas (Ahmed, 1996). With this development, not only has consumption of fuelwood
i~lcrcuscd hut lilelwt)od l~rrs Ixxonic :I ccbmmercial good that attracts high prices and
consumers have begun to pay for the tree products that were formerly free. In the past, the
only cost involvcd in filclwood was thc cost of collection. l'hcse days, in many
developing countries, l'uclwood is n o longer a Sreely available product especially in urban
centres. 'l'his has clearly den~onstrated the mergence 01' marketing system for fuelwood
in urban areas in Nigeria and distribution channels are created. Tt:e channel involves
small independent harvesters selling to thc wholesnlcrs who in turn sell to retailers or
consumers or the lrarvcsters selling to the consumers direct (Iicmcclio 2004).
With the g ~ . i ~ t l ~ i ~ l tlcvclopnlc~l~ ol' n~nrkcting in li~clwoocl many I'r~rtning
hoi~scholds i l l rural areas dcvclopetl intercs~ and engaged thcmselvcs in cutting of trees
cvcn livc oncs to ensure regular supply 01' the fuelwood to thc market, especially during
slack periods in farming activities. This activity provides supplementary income to the
harvcs~crs ol'tlle li~clwood as thcrc is r cdy market for the product throughout the year. In
recent years. many pcoplc Iwth in rural aml urbiin areas ol' clcvcloping countries (Nigeria
inclusive) are involved in fuelwood busincss and this has led to increase in the volume of
the trade. Studies carried out by FA0 (1 995) on fuelwood markets i n different developing
countries i111d regions had shown an cspa~ding li~clwood m;lrkcts. <
In Nigeria, the above trade development, both in rural and urban areas is rooted in
tlw Fact that the rural households dcpcncl o n the co~n~nodity Sor income generation, while
thc pocw i~rban dwellers rely on 'fi'iCliⅈd'for'cncrgy rcquircment. IJnequal distribution of
Ilw 11~11io1rs \vcalllr is also u ~ ~ ) t h c r cc~~~tril~utory iilctor that may have promptd the pcoplc
to depend on fuelwood.
1.2 Pro1)lem Statement , . ..
1:or some years now, most countries had Saccd tllc problcm of energy crisis, a
crisis arising from constant increases i n the prices of oil. 13ul thc vast majority of peopk
in developing countries (Nigeria inclusive) particularly the poor ones face a different kind
ol' ~'ncrgy crisis. 7'11~ crisis 01' I'wlwoocl slrort~~gcs. 'l'his is bccausc or thcir c o ~ ~ t i ~ l i ~ c d
dependence on fuel wood and rapid diminislling supplies of file1 wood and ch;moal (FAO,
1085). I n Nigcria, the scarcity oi'convcntional energy sources and the hike in the prices 01'
thcsc li~cls had also prompted the ccmlinuect dcpcnclcncc o n I'uelwood by many
1lousc.holcls in rclution to orhcr commercial li~cls even among urban households (Iwu,
I O O H ) . I'hc high consil~np[iorl 01' woocl p~otli~ct had crcatcd many problems in fuclwood
energy sector. 'I'he dcmand lix this tree product has bccome higher than the supply.

According lo Apscy and Reed (1005). llic cstirnatctl household fi~clwood energy clcniund
is put to be 4.5 billion m3 in the world whilc the supply is currently put at 2.5 billion m3.
I n Nigeria, Ayodclc (1992). estimated an~iual li~clwood energy supply to be ahout 17
~iiillion metric tonncs whilc the lotnl i11inui11 r;onsuniption is above 23 million mctric
tonnes. This has shown that in Nigeria, the fuelwood demand and supply imbalance is
widening. The inihalancc cot~stilt~lcs a great tlangcr to ~ h c environment, hccausc the
existing forests are diminishing and other li~clwood resources are being over exploited
witllout clue rcplaccnwnt. A study sulwy in solnc developing countries show that,
nnnunlly. li~clwood supplying tress ;~rc kllcd at a rate ol'about 8%;, per annum whereas tlic
growth 01' the trees range between 4-5% (Minhaj, 1996). In Nigeria the fuelwood
extraction rate is estimated at about 3.85 times tlie rate of regrowth and almost 10 times
the rate ol' rcgcncralion (Olialiw. 1090). 'l'hc conscclucnccs oS the supply-dcma~~d gap arc
delbrcstation, soil erosion and other ccological problems. These problems have many
implications on the economy ol' the poor I~ouscl~olds who arc the harvcstcrs ol' 111c
li~elwood.
developing countries. The business provides the poor households with extra income.
Marketing of fuelwood has compounded the problems of fuelwood availability. With the
'increase in the volume of fuelwood trade. many intermediaries have begun the trade. The
cntrancc 01' the middlcn~cn may not have lxcn to the best interest of' tlic poor harvesters.
as the ~narkct may 1101 be wcll..yrgs.ii/,c~b to the xivantage ol' the poor liouscholcls who
harvest and supply the product. Middlcmcn inllucncc the price and thc supply of the
li~clwood (Min1irl.j i. I 096). 'l'hc unequal bargaining power bctwccn the harvesters and the
buyers rcducc. the price. a situation in which the l'uclwood harvester is the loser.
Most ollen, fuelwood trade tends to be constrained by poor road network and
transporta~ion. In Nigeria. llicrc is inadccl~~alc and poor condition oS roads especially those
Iinki~~g I I I C 1.111~i\l i\I.c;lS wit11 I11c L I I . [ X I I I C L - I ~ I I L Y ( I I I C I I I C . 1007). 111 this siti~atio~i. cost 01'
~ r a ~ ~ s p o r l a t i i ) ~ ~ tclds to he lliyl~ L V I I ~ C I I L I I L ~ I I I ; I L ~ I ~ IVCIUCCS 1 1 1 ~ I~~~rvcstcrs' price and
increases the consumers' price. Sometimes tlie problem of transportation compel the
Suelwoocl liarvcstcrs to sell their products in tlic rural arcas at a low price instead ol'
conveying the commodity to the urb:m :~rc:~s where the pricc will he reli~tively highcr.
I<flicicnt niarlceting requires rclcvant quantitative and qualitative information that
will Iw ~.c.li;~l>lc. :I[ I I I C Iowc.sl c o \ ~ (I<ol~ls ; I I I C I 11111. 1072). In li~clwootl t~- ; l t lc . . lack 0 1 '
I I ~ ~ I I ~ , C I i ~ ~ l i ) r t ~ ~ a t i o ~ ~ i\l\\t)l\g I I I C I~;II.VL.SICI.S i i ~ I I I O S I ci\scs lI1i1y ~ C C I > ~ I W I I I i n tI\c ~ l i ~ r k i 1 1 ~ ) ~ t

price I l~~c lua t i o~~s in the urban ~~lilrkcts. A slucly hy ] :A0 (3003) i~dicutcs that only 10'%
01' the li~elwood harvesters have access or get information on prevailing markct prices
while the rest depend on the hiiycrs ;IS their source of' price inforn~ation. This situation
Icnves the liiclwood harvesters at the n~crcy ol'the middlc~iicn.
'I'lie problem that would likely all'ect fuclwood markcling i n Nigeria therefore
include poor market structure which leads to price instability, poor road network, high
cost ol' tra~wportation, fi~clwood scarcity, luck ol' hulunccd market information, low
inconic ol' the I~arvcstcrs and low prices rc.ccivcd by the li~clwood Ilarvestcrs which may
lead to low profit. These conditioiis discourage the fuelwood harvesters to supply more to
tlic markct and fi~rtlier aggravate tlic poverty level of the harvesters.
111 spite of tlic above problems, little or 110 rcscarch had hccn conducted as to
provide inl'ormation that would assist the luclwood harvcstcrs and middlemen to attain
efficiency i n their marketing i n Ihugu state. It is against this background that this
research was conducted to address fiicl wood markct ing with respect to sources,
collcctio~l. tlistribi~tion and consi~nlptio~l ol' li~clwooil with i\ view to idcnlifying the
factors that hinder the efficient marketing and consumption of the wood product and thus
make recommendations that will enhance their efficiency.
1.3 Objectives of the Study
'I'he broad objective of the study is to conduct an economic study of fi~elwood
marketing and consumption i n 1:nugu slate. ., ,, .*I. .>' > # '
The specific ~b~jectives are to:
I . describe and analyst. the marketing channel and market structure with a view
to determining the Ilarvestcrs and niiddle~ncn concentration in f..!elwood
market. ,I
. . 11. determine the profitability and marketing margins of fuelwood market
~x~rlicipitnts i l l the stt~dy ilrcil. ... 111. determine the lcvel ol'i~se ol'li~clwood in the households of the study area.
iv. determine the socio-economic hctors that affect li~clwood supply in the sti~dy
area.
v. dctcrminc the socio-ccono~nic li~ctors that inlli~cncc luclwood demand in the
study area.
vi. identify the problems being experienced by fuelwood market participants and
consumers.

1 .J Ilypolllcscs
'Thc li)llowing liypotlicscs wcrc lcslcd:
i . 'I'licrc is n o signilic:~nt dil'lkrcncc bctwccn the harvesters' and the
~l i i t l t i lc*l l lc*l i ' s c.ollc c * ~ i l ~ . ; ~ l ioll i l l l'\lcnl wood llli~rIi~'I. . . 1 1 . 'I'here is no significant dill'erence between the profits made by the fuelwood
liarvcstcrs and tlic rnicldlcnicn. . . . 111. Fuelwood supply is not affected by socio-economic factors.
iv. Fuelwood demand is 1101 al'lbclcd by socio-economic factors.
1.5 .Justil'icalio~~ of t I~c Study
1:uclwood rciiiains a globally important source ol'cnergy second to fossil l'uel in
their large-scale use (Omar and l'riya, 1006). I t is socially and environmentally accepted.
It is one of the most important sources of energy in rural as well as low income
population in urban areas.
In West A li.ic:t, lilclwood cotlsl itutcs about OO'% ol' cncrgy consu~ned in the region
(Iwayncnii. 1083). I:or Ihc timc bcing in Nigcria, oil, clcclricity and coal cannot provide
all the basic energy needs o l the poor household. 1;uelwood energy cooks food, provides
wmiitli and light. processes rood and docs tlic storagc; its snioke drics grains and kecps
insects out of thatched roof thereby protecting it from insect attack (Timberlake, 1981).
'I'he role this energy source plays can only be replaced by expensive electric power,
insccticidc and rood driers, which niost ils.ers of fuclwood cannot afford. . , ,, . , "1 . .?' .,?
continued dependence on fuelwood. As a result of this there is continual destruction and
ovcr-exploitation 01' trcc vcgctations, whkh lcads lo problems of deforestation and
ministries ignorc tlicsc problems. As u rcsull of'this ncgligcnce, very littlc information is
available on consumption of fuelwood, while data is lacking on supply, demand and

Enuyu S~utc. 'l'lie sti~rly will ulso contribuk to litcruturc in li~clwood studies and also
provide u basis for reference and li~rthcr rcscarcli.
1.6 Limitation of the Study
111 the process 01' data collection, many problenls were encountered but tlie
Thus those problems faced in the field during survey work are as follows:
I . Onc m+r limitation during tlic process of the study was financial constraints.
In the course ol' the study, tlicrc was massive rctrcchnicnt in Enugu State and
tlic retrcnclirncnt al'l'cctccl tlic rcscarchcr. 'l'hc efl'cct of' this was that tlic
rcscarcli work was IialtcJ tciiiporarily bccausc tlic rcscarclicr could not cope
with the situation financially. 'I'his hindered the progress of the work thereby
prolonging the period of tlie study. . . I I . Another prevalent problem was that most of the respondents did not keep
records as it concerned their I~usincsses. Sonw 01' the inl'ormation generated
li-om them came through oral interview. This had cfl'ect on the accuracy of thc
information which invariably affected the data collected. ... 1 1 1 . I.ow level of litcracy of some of thc respo~idc~its more especially thc
harvesters was a very big in~pcciiment. 'l'liis posed some constraints as sonie
of them wcre unwilling to 111ake available sonie or the information needed
from them, especially. ,their: .financial position. Some even thought that I was
sent by government for tux assessment.
Also I had problc~iis in getting inlimiia(ion lion1 some of the Swlwood
wholesalers in one of the urban centres particularly those that w x e in law
court with one of the 1,ocill IGovernment Chairmen in the State. They thought
that I was a security agent that was sent secretly to get inlbrmation from them.
'l'liis led to repeated trips to their association meetings and persistent appeal
made by one of' them who knew me very well. before they could yield to
ruclwood harvesters to get necessary data from them. This was becausc i t
?iappencd that tlie intensivc collection o!' thc data fell during the months of'
rainy season when the harvesters wcre busy in the farm. Therefore it took me
some h c to get some 01' them at home. 'l'hese repeated trips ii~rther increased

v. Also in t l~c course ol' data collection sonlc ol' thc rural communities could not
be reached easily with vehicle due to bad/poor condition of roads. In order not
to disrupt the progress of the study, I always charter commercial motor -cycle
(Okada) for easy and quickcr movement of the work. On some occasions rain
use to bcat us while o n the Okada.
vi . Some of the respondents that were given questionnaires did not return them
despite several visits made to thcir homes to recover the questionnaires.
1. 7 Plan of the Report
'l'he study, li~clwood marketing and consumption in Enugu State focused on the
marketing systcm and the consi~mption ol' fuelwood in the households. The study is
divided into live chapters.
C'haptcr one introduces the study. 'l'his includes bxkground of the study, problem
statement, ob.jectives of the study, research hypotheses and justification of the study,
limitation ol'lhe study, plan ofthc report. 'l'hc chapter starts Srom page I to 8.
Chapter two reviews the related literature on the study and the theoretical
framework. The related literature reviewed are marketing, fuelwood marketing, marketing
channel, marketing structure and concentration. Others are marketing cost and margins,
gross ~mrrgin. Si~clwood supply. scasonali~y ol' li~clwood, ~ypcs ol' l'i~clwood available,
sources of fuelwood, gender issues in Iuelwood supply. 'l'hc literature also includes
Iuelwood consumption by l ~ , o , ~ t l l and non-households, poverty and fuclwood
consumption. problems of fuelwood consumption and marketing, and theoretical
li-a~nework. 'l'he chnptcr starts lrom pagc 0 and ends on page 42.
Chapter three deals on methodology. I t includes study area, sampling procedure,
method of data collection and analysisltand IGodel specitication. 'I'he chapter is from page
43 to 52.
C'l~apter lbur discusscs results on socio-ccono~nic characteristics of fuuelwood
market participants and consumers, marketing system and structure, profitability and
marketing margins, uses of Si~clwood and problems of fuelwood marketing and
ccwsumption. 'l'he chapter bcgins liwn pagc 53 and cntls on pagc 0 8 .
('hapter five is on summury, conclusion and rccommcndations. This chapter is
from pagc 90 to 104.

CHAPTER TWO
1,itcratul-c Rcvicw
Wood as an cnergy source nccds to be studied because it has contributed much to
environmental degratlation as well as incomc generation. With regards to the work, the
stu(ly thcrclim reviews thc rclatcd i r t r c o n lilclwootl markcting, supply,
consumption, problenis associatcd with marketing and consumption and theoretical
framework.
2.1 Conccpts
2. I . I I'uclwood
1;uelwood is wood burnt directly as fuel (Agarwal, 1986). It is obtained from
trunks, branches and other parts of trees and shrubs (FAO, 198 1).
2.1.2 Fuelwood market participants
I:uclwood market pcrrticilxmts arc the pcoplc involved in the marketing ol' the
fuelwood. l'hey include fuelwood harvcstcrs, and middlemen (wholesalers and retailers).
2.1.2.1 Fuelwood h:rrvesters <
'They are the people that harvest the fuelwood from their sources and later sell
them to the wholesalers, rclnilers, tra~~sportcrs or consumers. 'l'hc sourccs of the f~~elwood . , 4 1 , . I ,
include natural forests, open woodland, agricultural land clearing, privately owned land
atid government plantation.
2.1.2.2 Firelwood wholesalers
They are the middlemen w1iose"role is to purchase large quantities of fuelwood
from the harvesters, and transporters. 1:uclwood wholcsalcrs can get the fuelwood from
thc sources directly. 'l'hey pi~rchasc ttic lilclwood in 1i)rtii 01' Inrgc pieces or trunk wood
and later sell such wood to retailers in small quantities or chop them into small pieces fbr
salt: to consumers.
2. I .2.3. lil~elwootl I-clnilcrs
1:uelwood retailers are the middlemen who purchase fuelwood at reasonable
qi~mtitics from harvesters, wholusalers or transporters and rcscll such wood primarily to
consulncrs. 'l'he rc~ailcrs olicn cluq3 the wood into smnllcr pieces and sell them to tile
cOI1SlIIIlcrS.

2.1.3 Fuelwood co~isumers.
'l'hcy urc tI1c I I O L I S ~ I I O I C I S t l l i ~ t l ~ y ~ I I C 1'u~Iwood li-om tlic Ilarvcsters, wholesalers,
retailers or transporters and use them for either cooking, proccssing, heating or ;roning.
2.2 Marketing
Marketing is one 01' the no st vital issues in thc production and distribution ol'
goods and services. Many scholars had dcfined it in different ways. According to Dixic
(1080). marketing is the series of services involved in moving a product (or commodity)
li.om the point ol' production to the point of cons~~niption. Ahmcd (1906) clcliilccl
marketing as the performance of business activities that directs thc flow of goods and
scrviccs l-rom the psotluccss lo the consumers. I le noted that the business activities that
are perlimned include physical handling, transporting, initial processing, packaging,
grading, quality control and delivery to satisfy sales transactions and to meet the
cl~stonlcss' scquirc~ncnt. i l'czuc ( 1000) stalctl that m~rrkcling is a psoccss, which idenlilics,
anticipates and satistics co~isumes nccds and wants through conception, promotion,
nlutual exchange and physical distribution of economic goods and services. Marketing
therefore is not only buying and sclling but involves a fmction that assesses consunler
needs and then satisfies them by creating an efkctive demand for and providing goods
and scsviccs at a prolit (Jollnson, 1000). Abbot (1993) obscrvccl that marketing is a link
with those who have surplus and those who have the need to buy. Osuntogun et al. (1981)
li~rther stressed that {'or a trade ta~dc~c'Iop'%dween any two locations, there must be a
marketable surplus in one arza and an cl'l'cctive demand in the other. Downey and Trockc
(1981) noted that marketing involves different activities that add value to a given product
as i t moves through the system. McCasthy and Perrault ( I 990) summarized marketing and 11 . ..
its li~nction to be buying, selling, rs,~nsporting, storing, stantlardising and grading, risk
laking a 1 ~ 1 1i1;lrket inli)rniation. ' I ' I i~rcf~rc, larkcl cling is a way 01' looking at the operations
and at the same time doing the business. I t adds value to goods by changing the form,
time and place in which they are available to meet an clt'ective demand. So marketing can
bc C O l l ~ i c l ~ S ~ c l ; I s i1 ~ 0 C i ; l l illld 111;lllilg~riill I)I.OCCSS 1h1.011gh ~ l l i d 1 Ol lC Ci l t l ~ i t t i ~ f y OIIC'S
needs in the exchange of product and value with others.
'I'lw distinction between nlarkct and marketing is li~nda~ncntal. Marketing is the
psocess o f buying and selling that altkcts changes in the ownership of goods and services.
Market setkss to an arena liw osganixing and facilitating busincss activities and lbr
answcri~lg the basic clucsrio~ls - what to produce, how much to produce, how to produce
and dislsihulc (Kollls il l l t l l l h l , 1072). M;lrkcr may be tlclincd by a location. product, time

and a level. It may be local, regional. national or international (Cramer et al, 1997).
Markct tl~crcliwc., cxists whcncvcr buycrs and scllcrs cun bc in touch with one another.
This could be done lhce -to-Tacc at somc physical locations or indirectly through a
C O I ~ ~ I > I L . Y IICI\VO& 01' nliddlc~~ict~ \ V I I O ill 'c li~r ~il)i\rt (M~(.'itt.tlly ~ I I K I I 'c~xii~lt, 1000). ' 1 ' 1 1 ~
rcquirenlents i n market is that ~ L I Y C I - S and sellers must bc ablc to communicate with onc
another, n~us t be capable of exchanging products with each other, and must be exposed to
similar price signals ( Kohls and l lhl. 1 W2).
2.2.1 Fuelwood Marketing
l'herc are two basic businesses in the tree economy. One is "productive that is the
provisio~l 01 ' goods and scrviccs li-on1 ~I.L'CS. 'l'llc otlicr is "nirrrkcting" which consists ol'
tlw activilies hy wllicll goods a ~ d scwiccs li.0111 trcc flow fi.om the protlucer to consumcr
(Adeyoju, 1975). Fuelwood marketing is the movement of fuelwood from the gatherers
(producers) to the consumers in ri~ral. semi-urban ant1 urban arcas. I lans et crl . (1 989)
noted that fi~clwood niarketing involves activities associated with producing, transporting.
sclling ancl buying of' tllc trcc based product. I;olcy a d Ilarnartt (I 984) indicated that
litelwood marketing involves rural suppliers transporting 1Lcl (wood) to lawn using
donkeys, carts, carrying it on buses or bringing it by headload. Thc rural to urban trading
and distribution network involves nitmcrous internicdiarics (Irvnedio, 2004). The
fklwood harvesters or gatherers. however. undertake very limited fuelwood niarketing.
'I'he lilcI\vo~d tradcrs (niiddlcmcn).~und , r o h t y fuelwood in L1,t-m of' large pieccs or trunk
wood which they scll i n that form to smaller traders or cut into smaller pieces to resell to
traders or directly 10 end-users (Ahmed 1996). In summary fuelwood marketing involves
thc 1110ve11ient 01' lilclwood li.om tlic gatlicrcrs to the consumers. I t is a function ol'
distance, transport system, wood and Ibrbst resources, supply and inarket demand of the
product.
In fi~clwood niarkcting. thcrc cxists the fi~clwond market, which are mostly
~lolicci~l)lc around ur\)an arcits aucl arc so~iictimcs conlp1c.s as tllcy involve a nctwork of'
Si~cl\vood ga11icrc1-s. dist~~ihi~tors. scllcrs i~ntl buycrs (Morgan, 1083). Mu~islow ct al
(1988) equally indicated that fuelwood niarkets are highly complex, starting from the
produccr to tlic consilliiur. Kntcrcrc (1002) in his study obscrvcd that markets for forest
products, fi~clwood inclusive arc poorly developed and arc few when compared with
m:~rkcrs Sbr othcr products. Lizcdimma (1009) further noted that domcstic tradc in wood
product is ruclinic~~tary. 'I'his i s because some Si~clwootl and charcoal are sold to
individual consumers along maior high wilys. in urban nlarkcl pli~ccs and othcr public

places. Onyeike (1 979), Leach and Means (1 988) equally indicated that an outstanding
I>;~tl~rc 0 1 ' litelwood ~iiarkcl is 1Iia1 tllcy :\re org:~nizctl in :111 open ~narlict or places.
2.2.2 Marketing channel
I:low 01' goods is a li~nclion ol' li~lkagcs. 'I'l~osc linIi:~gcs limi the clistril7r1tion
cliannel. 'l'lie distribution channel is dclincd as a route taken in transferring title to a
product from the initial owner of tlie product to its consumer. The channel consists of the
produccr, the ultirnatc consumer and tlic middlemen linked together in a special style,
which rcllcct owncr Ilow li,r a given prodi~ct ( I lkmc, 1000). I n a similar way Adcgcyc
and [ l i l ~ o l ~ (1082) view n~:rrkdin!: cl~anncl as 1I1c srucssion of' inlcrmctliarics throrlgh
which goods and scrviccs pass en-route li.oni tlic produccr to the ultimate consumer.
Marketing channel also is referred to as a set of inter-dependent organizations involved in
the proccss of ~iiaking a product or service available Ibr use or consumption (Stern and
El-Ansary, 1983). Mislira and Misliral ( 1082) noted that scrviccs of tlic intermediaries arc
inevitable feature in many markcting processes. as producers cannot have direct contact
wit11 tlic ~ ~ l t i i ~ i i ~ t c c~~isunicrs every ti~iic i111cI 111 all pluccs.
another. Johnson, (1990) observed that variance in marketing channel include farmers
supplying produce to processors and othcr bodies, farmers acting together in cooperative 5
societies to statutory marketing bodies or clioosing suitab!e distribution outlets through
wholwalers, retailers to consunicrs. I lc indicated that the simplest marketing channel is a ., , , . ."f . .V , . * X P
producer having direct contact with consuniers. In their own view Downey and Trocke
( \ O X 1 ) ~ ~ o l c d tlwt type and co~llplcsity 01' ~ ~ ~ : \ r I i ~ l i ~ i g ~ I i i l ~ l n ~ I VXY will1 dill'Crcli1
coniniodi~ics. 'I'licy ohscrvcd h u t ~uadsidc prodi~ct ni:lrkct is a very siniple markcting
channel, from producer to consumer, while many products undergo further processing at
dil'l'crcnt levels ol'tlic niarkcting channcl and pass through many firms before reaching tlic
ultinii~tc consnnicr.
In Iuelwood marketing cliannel, [jang (2000) and Onyeike (1979) identified the
linaliy ~ I . O ~ U C ~ I ' S supplying to wholcsalcrs who i n turn direct it to consumers. Ahmed
(1900) in his study observed that filclwood retailers mainly buy tlie fuelwood from the
wholcsi~lct~ or I~:~rvcstc.rs. 1 Ic li1rt1lc.r ~~ol iccd that this typc ol' trader sells directly to tlic
cnd-r~sc~ ~ior~l~al ly at a I~igll price. Ilc also nolcil t11i1l large co~~su~i icrs like bakery
industries olie11 buy dircc~ly l'rom 11ic I I ~ I I . V C S I C ~ S or suppliers or niiddlcmcn or employ
13
their own labour to cut and transport 111~: filclwood to the factory. Munslow el al. (1988),
also observed that an extended chain exists between tlie producer and the consumers. It
starts from land clearance and wood cutting. splitting of thc tnmks, branches,,gathcring of
the wood to tlic c~ l l cc t i~ l i point, tra~~sporlatiw to the cities and moves to wholesalers to
sub-wholcs:~lc :lnd rctuil tradcrs. 'l'llcy ~lotccl that ;I[ cvcry slagc, cquipmcnt, machincry,
and labourer all add to the cost along the chain. Olukosi and Isitor (1990) asserted that the
longcr tlic chain ol' distributio~i tlic liighcr thc pricc tlic consumcr would haw to pay.
l,c:~cli arid Mcms (1088) st:~tc.d t l i i ~ t li~c.lwootl ni:~rkcting climncl presents a brief'
overview of the main stages in the market network. They are about five or more stages in
li~clwootl murkcting clianncl. bctwccn tlic primary producers, the roadside ~narkcts,
rctnilcrs and consim~c.rs. In a nulslicll. milrlicling clli~nncl involvcs nltcrnativc routes of'
llow ol'produce Sroin producers to consumers.
2.2.3 Market structure and concentrution
I h i n (1068) dclinccl mi~rltct slructt~rc us the organizational ch:lracteristics which
determine the relation o l sellers in the iiiurhct to each other. of buyers in the market to
c;l~ll Otllcl'. 11lC S C ~ ~ C ~ S 1 0 t l l ~ hlycl's i l l l t I S L ' ~ ~ C ~ . S cstill~lisll~cl ill (Ilc 11 l : l l .k~~ (0 O l l l ~ ~ ' Xl l l ; l l ()I'
potc~ltiul suppliers ol' goocls including ncw limis which might cntcr tlic market. Okckc
(1988) rclkrccl to i t as the sct-up ol' the ~\lul'lict in tcrnis ol'nuniber of buyers and sellers,
thcir share of comniodi~ics bo~~ghr a d sold, product differentiation and vertical
integration. According to Kohl and Ulil (1?72), markcl slructurc iriclides riurnbcr of' ., ,1. . . f l d. .. .'C
firms; s i x o r tlic firms: and their s ix distribution: tlic degree of conccntratio~i and thc
ability o f lirms to dil'l'crcntiatc thcir protlucls :mcl thc barriers to entry into an industry.
Also ~iial.l,cl S I I ~ L I C ~ I I ~ C rclkrs to ~ I I C cIi;\r;~ct~~.istics 01' tlic ~liitrk~t, wliicli arc hclicvcd to
influence its nature of competition and,! the process of price formation (Adegeye and
Dittoh, 1982). Market structure is therefore the combination of those characteristics of the
orgunimlio~i 01' tlic ~ii;~rlxl, wl~icli S ~ C I I ~ S l o it~llwmcc sl~xlcgic~~!Iy tlic 11ul11rc or
competition and pricing in tlie market syutcm.
111 ulialyzing ~iinrkcl s t r t~cI~~ .c . I I I I X C tIicorc~ic;~I ~ i l i ~ r k ~ t IIIOCICIS arc ol'tcn LISCCI.
' I ' I ~ C S ~ pcrIkc~ly co~iipc~ilivc 1\1;1rl,c1. olip,opolis~ic 1 1 i i l r k ~ t : I I ~ nio~iopolistic tii:~rkct
(Adegeyc anti Ilitoh, 1082; Arenc 1008).
Oligopoly is a marhct stl~tcturc wlicrc tlicrc is a stnall number of' firms. 'l'he
competition is not perfect yet tlic rivalry among firms is high wliilc monopoly is a markc!
structure: in wliicli tlicrc is a single scllcr, tllcrc arc no close substitutes for thc commodity
i t protlr~ccs ant1 1I1c.r.c arc Ix~rricrs 1 0 cnlrv ( K o ~ ~ l s o v i : ~ n n i v . 1070). In pcrli.dly compclilivc

ornrkct structurc tliere are many small buq, rs and sclll.rs, free entry and exit a. 1 price
n~ccllunism is i n C O I I I ~ I C ( C C O I ) L I X ) I oI' ~Iic 111:11 L.I. Thctc is> I IO need l'or individual f i r ins to
behave coinpetitivcly with respect to onc ant her sincc none Iias any power over the
~ll;~rkc( (~I'CYLIC, 1900). In pure corilpcti~ivc 1nnrk1 ~~vcsy onc ~ilargcs or pays according to
the o n going priccs existing in thc market (I3ow~' ,n, 1086). 111 a similar way, Dunnct
( 1003) rcl'c~'rc'd to i lg l . i~~~l t~~r; \ l or li)rcbt j~~.od~cLs I l l ' .kc( ;IS k i n g aloniistic or pcrkctly
.ompetitive in nature.
Morga11 ( 1083) in a survey currid out obscrvccl t . l i ~ r in liiclwood markct, tliere are
murrirutlcs ol' rclativcly small I ' L I ~ I W O I ) ~ exploiters who engage tlicrnselves in sclling
fuel! ood in other to earn a living. Also 1,each and Means (1 988) indicated that there was
relati] ti.eedom ol'entry into Suel\vood trade and substantial degree of price competition.
In 111u1.b .ling of non-ti~nbcr ti)rcsl p ~ x d ~ ~ c t s (li~clwootl inclusive) i l l li)w ccologici~l zones
of Nigeria, Okafor el al. (1994) equally observed that any group of persons and or
individuals such as inciigcnc-s, strangers ilncl ~iiigral~ls can participale in the activity.
'I'licrcforc li~elwood market structl~rc sccnis to reflect that ol'pure con). ctitive market.
Okerckc and Antlionio ( 1988) i n their study on market structurL indicated that an
important variable in market structure analysis is concentration, which depicts a situation
i n which n few large firms have thc largest share of the business. I%onomists use this
term concentration ratio to indicate tlic number of sellers of a product. Bowden (1986)
detined the concentration ratio as tlie percentage of the total output of the product, which . . " 1 ,*, is prodt~cccl hy the Iiwr 1a1.gcst pj:iidu~crs: "C'o~~ccntration ratio is also a measure of markct
power that relates the size of firms to the size of the product market, or it is the proportion
of the total industry output produced by the largest firms (usually the four largest). By
using the ~oncc~ i t r :~ t io~~ r:~tio onc can dislinp*~~igli hc1wc.c-11 an industry cornposcd of s~nall 1 1 . .
relatively power less firms and another industry also composed of hundreds of firms but
do~ninutcd by a lkw Illat arc largc awl powcrfi~l (13radlcy. IW I). Morgan (1965), in his
study og. rctail side of ~narket, dcvclopcd concentration index that rcllccted on tlie intcr-
play betwet.-n tlie l'cw largc lirms in rctuil industry and the ~ i i m i y small ones. Ik noticed
that sniallcr iir~ns excrcisc political powcr lliroilgh groi~p i ~ t i o n in cooperatives and other
contractual agreement and from this action they exercised some economic power to
counter hi~larlcc thc economic powcr hcld hy the few largest Iirms in an arca.
In tllCir own study, Okcrckc and A~lllioriio ( I 0 8 % ) . conducted theirs on markct
structurc to both wi~olcsalc and relnil, using revcnue as tlic criterion of measuremenl. The
study indicated that there was some dcgscc of concentration in grain market but there was

a grealcr degree of concentration in the wholesale than in tlie retail sub-sector of the
niurkct. Some retai1cl.s arc know11 to be selling many products at the samc time. In
rclation to this, Ijowdcn (1086) ohscsvctl that onc would not expect a vcry high
conccntrntion ratio in road s~ands sclling con1 antl tomatoes. Wcrncr, el ul. (1987).
sumiiiarisctl i t by showing that llic si111i1iii11.y mcclsurcs oI'co~icc~it~.:~tio~i arc illustrated by
Gini-coefficient. (hi-coefficient is a nieasure of ineq~~ality or any form of uncvcn
distribution. I t is a number bctwccn 0 and 1, where 0 corrcsponds with perfect equality
(whcrc every one has snmc income) and 1 corrcsponds with pcrf'cct inequality (where onc
person has all the income, and every one else has zero income) (Wikipedia, 2005).
2.2.4 Marketing cost and margin
Mwkcting margin is il concept in 111:trketing. Many scholars had delincd this
concept i n different ways. According to Abott and Makeham ( 1 9791, marketing margin is
tile dil'lkrcncc betwccn thc price paid by tllc consumer and that rcccived by the producer.
Adegeye antl Tlittoli (1982) rel'errcd to i t as the dill'erencc in pricc paid to the first sellcr
and that paid by the tinal buyer, Adeyokunnu (1973) also noted that marketing margins
are returns i n tlie process ol' making goods produced available to the final consumer.
Downey and 'rrocke (1981) saw i t as the share of the consumers' fi~nd that is required to
cover the costs involved in tlie marketing process. Tomek and Robison (1990) defined
marketing margin as ( i ) a difference between the price paid by consumers and that
ol,tainctl hy pr~otluccrs o r its ( i i.) kkcllu:iou,o l: i1 collect ion 01 ' niarkct ing services, tI1;lt is t he
outco~nc ol'tlcmo~id li)r a i ~ l t l~c supply, processing, transporling uncl retailing. Kohl ant1
llhls (1972) also stated that thc price includes the expenses of perlorming fiinctions and
also (he liwcl-~iiarkcting firm's prolit. I'llcy noted h a t consunicrs lhcc two prices ior fbod:
the 181-111 gate pricc and the ~narkctink pricc. Osuji (1980) also referred to marketing
margin as the price for a collection of services and for the difference between the farm
gate pricc: and tlie retail price.
Ih th [he producers and consunlcrs i\rc concerned about the size and changcs in
111ill.l~~Ii11g I I I ; I I * ~ ~ I I , Ailcgcyc ; I I I ~ l) i11011 ( lOK2), ~ iol ic~i l 111al s i x 01% 1mtrgi11 so~~ ie t i~ncs
dcpcnds on the dcgscc ot' processing 01' the conimodily in question, its bulk valuc, unit
valuc :mI p~risliability. Tonick and Robinson (1990) also notcd tlial the nature of margins
obviously varies among products. a id the nlagnitudc of a cliangc i n rnargin depends on
the magni tudc of the change in per imit cost. Shepherd and Vutrell ( 1970) remarked that n
product costs Inorc to eonsunlcrs wlicii tl~crc arc niidcllc~llc~l who iliakc exoii,itanl prolit

or margin. 13111 Abott (1003) mt~intaincd that only a s~nall proportion of the consu~ncr's
spending gcscs to the middlcmcn.
Marketing costs according to CrawFord (1997). Olukosi and Isitor (1990) are
i~c l t~ i~ l cupc11sc.s i~~currcd in lhc pcrli)~.nli~~lcc of markcling li~nctions ils a commoclily
moves from the farm (producers) to tlic illtiliiate consumer. These costs include costs of
transportatio~~ and Iia~idling, market cliargcs, cost of assembling, processing, distribution,
cost of packaging. sales promotion and advertisement ( i T any) and other costs such as
taxes, levies, and exercise duties. 'I'onick and Robinson (1 990) also added that marketing
costs incl~~tlctl wi~stc, loss ant1 spoilage i l l lllc nli~rkcting process as wcll as typical costs.
'I'lle actual relationship betwccn ~mtrketing niargin and marketing cost is that
marketing iiiargin includes marketing costs plus the normal profit (or loss) carried by the
nlwkcl inlcrn~ccliarics i\s tlic conimotli~y pilsscs through the ~lii~rkcting system.
2.2.5 <;row Mirrgin
Gross margin is delined as the difl'erence between sales and the cost of goods
sold. It consists ~Soperatiiig expenses plus net profit (Evans and Barinan, 1994). It is the
moncy leli to cover the expclises o1'sclliiq.j the products and operating the business or the
nioney that is available to cover the fixed expenses and still leave a profit (McCarthy and
I'errairlt, 1990). Selling expcnses is conimonly the major expenses below the gross
nlargin. 'l'liey arc t l ~ c sclling, administrr~t ivc and gcncral cxpciiscs. Arene (1 998) stated
t11i1I ~ I I ) S S 111itt.gi11 i h C S C ( . S ~ 01: ~~I ]~> , , . I ' ~ ' . u~ ' I I~~IC O V C I I > I I I . C ~ I ~ I S C S , ( ;II)SS 111i1rgi11 I U ~ > I X S C I I I S
the dif'ference between 'Sotal Revenue ('I'K) and Total Variable costs (TVC). It involves
tlic estimation of costs anti returns in ~nurhcting. Gross margin is often expressed i n
pcrccntitgc. The percentage shows 111c proportion of nct sales allocated to operating
cxpcnscs and net prolit. ll'tlie perccntagc iS high a lirni has substantial revenue left lor the
~wotlucts. I f ' tI1c gross margin is not I;~rgc c11oi1gh t o cover IixctI costs of thc bi~si~icss,
losses and not prolit will be the result (Ilvans and Rcrman 1994). 'She higher the total
gross I I ~ ~ I I . ~ ~ I I . the s~n;~llcr is thc proportion ~~ccdcd to pay liscd costs, leaving more for
Ii~rm ~wolit. I t irsi~ally pays. t11crcli)rc to protlucc as much as pc~ssihlc (Ilplon i~nd
Anthonio, 1075). Pandey (2001) and C'allaghan (1994), in a siniilar vain noted that a high
gross margill rcliitivc to the firm's avcrugc in~plics that the lirm is ahlc to proc!uce for snlc
iit relatively lower cost, while a high gross margin is a sign of good management. They
l'i~rtl~cr 110tcc1 that :I gross n~i~rgin ralio 111i1y ~IICI.C;ISC tluC to illly ol'tl~c li)liowing l'nctors:
i . higher sulcs pricc. cost ol'goods sold remilining consti11~1; . . I I , lowcr cost 01' goods sold, salcs pricc rcn~aining ~Onsti111t;
... 111. a combination of variations in sales prices and cost, the margin widening;
iv. an increase in the proportionate volume of higher niargin itcms.
Gross ~iiargi~i is parliculi~rly illlporla~il lo retail agrihusincss hccausc such husincss
has rclativcly little control ovcr cost ol' goods sold (Downcy and Trockc, 1981).
According lo tlicni tlw p k C ol' Ilic- goods tli: i l all agrih~si~icss pi~rcliilscs is tlic ~liosl
~ t - i t i ~ i ~ l I~ICIOI. i ~ l ' l k ~ I i ~ ~ g ils 111i1rgi11. I ) i l'lkrcti~ ~ I X ) ~ L I ~ I S u s~~ i~ l ly Ilavc dil~fkrctil inclivicl~i:~l
gross margins so that the total gross margin for thc business will also depend on thc
particular combination or mix of products and their resources. Also they noted that to
enable k~rn~crs comparc the linancial pcrlimnancc of' their farms with those of similar
farms. and as an end to farm pliuining it is now comnian placc to use the gross margin
systems. 'l'lic gross margin syslcms ilrc tlic lirsl step i~scd i n deciding on tlic hcs~
ccmil~i~i:i~io~i 01. x-tivitics 0 1 1 :I 1;111ii ( A l ~ \ ( t i111(l M i ~ l ~ c l i : ~ ~ ~ . 1080). 'l'licy rc:~sol~i~l~lc,
straight forward and easily understood system, which stimulates the study of farm
management.
Thcrcliwc gross margin could hc ~.c.li.rrctl lo 21s llic m o ~ m t acldcd to the cost of
goods sold to arrive at the sclling pricc anel may hc cxprcssed either in naira or percentage
tcrins.
2.3 I~uclwood Supply !
Supply is dclined as a schedule showing the various quantities of a product
producers arc willing and able to proclucc and make available in a market under a given .. ),... 1. d . . $ 1 3 5 '
condition at each specilic price in a specific time or period (Halcrow, 1980). It is also
1~cl21.1.ccl 10 ils ;I scllctlulc ol 'v;~rio~~u c l~~; i~ i t i t i~s ( \ I ' ~ I col~iniodily, wllicl~ u seller is willing to
o1li.r in the ninrlcct a( various altcl-n;~(ivc prices ovcr il period ol'tilnc, and in a situation he
has no control over the price (Adegeye,,and Qittoh, (1982).
In the tropics, lrces of every age could be used as filelwood and most of thcm are
produced and silpplicd lo ilrhi~n ;ind sctni-11rh;ln nrc:is by si~hsistcncc fmmcrs. In rur i~ l
areas in Nigcria, Iuclwood is frcc to bc collectcd by any one who so wished and no
Sitrtllcr cl'li\rL is spcnl bcyoncl lhal ol'collc-clion (Okigbo. 1003).
'l'lic litelwood ncccls 01' thc ruri11 people arc suppliccl liom the dead- wood. the
I I U I I ~ \ S a ~ ~ t l I ua~~c l~cs , ~ ) r i t ~ ~ i ~ ~ g , loopctl wootl, lwtgs p i c l d 1i.on1 ground or cut li'om lrccs,
surpluses arising from agricultural fallow or slash and bum farming system and
agricultural land clearance, including rotational fallow system and agricultural crop waste
(Munslow o/ ( 1 1 . . IOHH; I .c:~ch i11ic1 Mcilns. I 08%).

F . I llc supply of fuel\vood to urban centres varies (ioln that ol' the rural areas. 'l'hc
stlpply 01' t l h 1 1 1 I ilcl~ood is i11111osl cscl~sively OII il collln~ercial lwsis (I:oIcy and
I3arnard. 1084). About 80% 01' the li~clwood harvested and siipplied to urban areas conw
li'o~ii 1'11ri1l populi\lion. Most 01' the ~ ~ ) ~ i ~ ~ l l ~ ~ ' ~ i i l l li1c1wood ~ I c ~ t i n c ~ l fiw cities are produced
tYom trees f'cll by rural people to supplement their income especially in slack agricultural
season or i n the years when rcturns li.0111 lilrlning are poor due lo drought or low i'ann
pricc ([jang, 3-000).
2.3.1 Scitso~~it l i ty of ~IICIWOO~I sl~pply
An important iactor in understanding the marketing system for any commodity is
the 1~lt111.c 01' i~ggreg;~t~' si~pply 01' ~Iic co~ii~no~lity. 'I'hc int~raction of this factor with
clcm;~ntl liw a p rod t~~t helps to ~ ~ t i ~ h l i ~ l ~ market prices in the market system. Movcnient in
the niarkul prices provides an immediate indication oS changes in supply and demand
situations (Wi~rdle and Palmieri, 1081). 111 the light of this Toniek and Robison (1990)
i!vlicatccl thal the most common pa ttcrn of' Iluctuation in firm product prices is a seasonal
tyl~c. l'llcy ~ I I ' ~ L I C ~ that most i~grici~lturi~l ~~roclilcts arc cllaractcrizccl by sonic seasonality
i n production and marketing patterns. 'l'hey further stressed that seasonality in demand
also exists for agricultural products and is related to factors such as climate and holiday.
Obi (1084) ccli~ally ~naintai~wcl tllat agricultilral products arc chi~ractcrized by seasonal
price pattcrn. Ile slated that livestock (shecp and goats) like other agricultural products
are rclatcd to seasons of the year, ., ,, .- +j+Gje . .the seasonal price differences could be
expli~incd by seasonal supply variations.
I:uelwood, like any otlicr agricultural products arc scnsonal i n nature. I n vicw of'
the seasonality of helwood, Armitage and Schramm (1904) observed that seasonality in
l'uolwootl supplies leads to sharp incrcascs~tin t41e real prices of the wood as well as the
actual shollage. The shortage in the supplies and the increase in the real prices especially
during rainy season is becausc ofthe licavy nature of rains which hinders the regular fetch
0 1 ' t l~c I'IICI\YOOCI ~ I I I C I S C C O I ~ C I I ~ ~lilril~g tllis period IIIOSL 01' t l i ~ 111lti11.r~d roads ~ X C O I N C
i~li~cccssihlc ;~nd ~llost pcoplc c o ~ l c ~ l l t r i ~ t ~ O I I fi~rnli~lg (I,iang, 3000). On thc snmc nolc.
Munslow cl c r l . (1988) cclually maintained that the seasonality nature oC fuelwood also
i11lc1.s 111c price pilid li)r the co~llnlotlily. 'I'llc price variation with season results to
rclativcly low price level during harvest and relatively higher prices in the lean or off-
scasoll pcriotl. 'l'lw reason hcliind this is that supply is cnvisagcd to be higher than
aggrcgi~tc* tlc~nantl clt~ring the liiirvcst scilson ancl vicc vcrsa Sor the oI'f-seas011 periods
( A ~ I ~ ; I I I I O I . . 1088).

(;cilcsirlly, tllc causes 01' ug~.icl~lti~ri~l proclucl variation is tlic supply response ol'a
producer to changes in prices. Even i n a situation where prices are low, farmers tend to
supply more ol'thcir produce to the market either for fkar of furthcr lBlls in price or the
quest 1i)s i~iitncdiirtc. need li)r ci~sll.
2.3.2 I'actors t h t affect frielwood supply
'I'lie supply of cornnlercial luel\\,ood destined for urban areas are affected !by many
lirctors. Accortli~rg to 1,c:rch :rnd M C ~ I ~ S (1988). qi~irntity 01' Suclwood transported or
supplied to the traders or consumers i n semi-urban and urban areas depend on condition
o f roircl, distirnce travcllctl, pricc, illconic 01' tlic Iiouscliolcl ant1 linic nccdccl Liw the
collection a id the sale ol'thc wood.
Amo~ig the lirctors that al'l'cct supply, price is one 01' tlic importmt variables. I'sicc
of a product is one or the most important variables that is used in deciding on what to
produce (Ilkme, 1900). Also. pricc ol'tloniestic energy is one of the Fxtors that determine
tlic souscc ol' energy to I~ouscliolds (Olalisi, 1099). Ayotlclc (1092) indicated that for
fuelwood 21s a protluct. price would scrvc ;IS a factor fiw guaranteeing fuelwood supply
and dc~ni~ncl. I3ut pricc ol' li~clwootl would rise as depletion 01' trccs continues and supply
becomes scarce (1701ey and I3crnard, 1984). Wardle and I'nlmicri (1 981) noted that price
of fuelwood is an inlportant factor to fuclwood exploiters who must decide on il~vestrnent
I ~ r f c t i l ~ g . t r r i o ~ i l i g i111tI 1.cplir111illg ~ I ' l l i c trees. 111 i I sti~tly co~ldl~clccl 011 li~clwood
~nnrhcting bli~~islow el L I I . ( I ~ ~ ~ ) , . U \ W I : W ~ J C I ~ ~ I ~ ~ I ~ very little is known about the price trend
of tklwood. They further noticed tliat prices of fiielwood tend to fluctuate according to
the relative priceslcost of alternative cnergy or fuel. Arguing in support, Hutsher (2003)
asscrtctl that priccs 01' li~clwood tend to hc high in i~rban centres ol' developing countries
because marketing systems ol' ii~elwood are liee'from government control especially with
regard to price form;ttion.
I ,irb011r time is motlics signilic:rnt dcterniinant 01' li~clwoocl supply. In their study
on tlonlcstic wcrgy S I I P ~ I Y i l l I~idiir. I lClOcrg OI (11. (2004) showed tliat i l l li~clwootl
collcction and sells, labour input and amount of energy consumed are the variables of
pri~n~rry intcrcst fos analysis 0 1 ' li~clwood collection and sales. Ki-Zcrbo ( 1 08 1 ) indicated
tliat in sccent days. fr~niilics have t o trawl farther anel ilrtlier to find fuclwood and devote
more a~icl Inore tinic lo its collcctio~i wI1ic11 is iisually 3-5 Iroilrs u day. I Ic Iurthcr pointed
out t l ~ t i n some coi~ntrics. Ii~milics Iiavc lo travel k m n r o i ~ ~ d a village bcforc the
li~clwootl is wllectcci. 11 is in vicw ol' h i s that Wardlc and I'almicri ( 1 98 I ) noted that one
ol'(Iic I~i~ltlcn cost 01' l'i~c.lwoocl is li11lli ly l ; rI~)i~r.

'l'he labour time put in the coIIecti011 of fuelwood are at times attributed to the
distance I ~ L I V C I I C ~ in t h ~ c ~ l l e e t i ~ n . W I I ~ C I I i~ivuriilbly affect the price. In response to this
(iluingcr ( 1000) in his stildy o n lilclwood harvesting, obscrvcci that distance is one of thc
mosl sigliilici~nt vil~ii~l)lcs t l ~ i ~ l ;~l'l>cl ni;lrl\cl price and tlic clu:~ntity ol' lilclwood that is
tiikcn to market. I lc noticed thu~ ( i ~ ~ I \ v o o ~ i is heavier i~nd costlier to transport over long
Jistal~ccs. i11it1 to i11~bi111 ccntscs cspccially wllcrc ncar1)y li)rcst rcsoilrccs to urban arcas
lia\lc been dc~plclctl. Ahmcd (100(?) also rcmarkccl I l l i ~ t dilc to the clcplction of fbrcst
rcsourccs, gatherers walk a distance of 9 -1 I km to reach a locLd market where the load of
rllc I'IIC\YOOC~ is t~.aiicd 10 il local ~I.~ICICS. 111 I i l ~ t I l ~ r i ~ l l ~ ~ to this, I ' ~ I I C I C Y (2002), inciicatcd
rliat as clisrancc from li)rcht incscascd, li~clwood bcco~i~cs scarce and the effect of lliis is
substitution of iiielwood with dung cake and kerosene.
Anotlw vi~rii~l)lc thiiI inl1ilc1ic.c tlic c lu iu~ t i ty 01' li~clwootl silpplicd is cost 01'
transportation. According to Olukosi and Ositor (1990), cost of transportation is dircctly
related to distance. 'l'hc cost of' trnnsportation incrc~~scs iIs clistancc incrcascs. Ahmed
(1996) in his stidy ohscrved that nlicn liiclwood gathcrcrs arc con~pelled to scll thcir
psod~lcls at a low pl.icc in ri~si~l i~scils d11c lo Il.an~polIi~Iio~l cost Ihcy woilld encounter i l '
tllc psoililc( is tr;~nsportcd to i111 i~rl>i~ll C C I I I ~ C loc~~tcd at ;I 11s d i ~ t i l l l ~ ~ . l ie noted that the
cost o f transportation bccoine very high which ultimately reduces the gatherer's price.
Another major determinant in file1 wood supply is income. According to Remedio
(2004) il~coliic Icvcl o f i I I~o~~scliolil is slill ;I signilicant vit~ii~I>lc in lilclwood track. 111 ri
stucly co~iclilctcd in Northern province rWC"hllics'iSon, ljang (2000) obscrved that i t was low
i!icomc Ic\~cls of hoi~scholtls tI1;1r cngagc tllc~nsclvcs i l l li~clwood cutting especially as it
had a ready market. In a similar vein I'andey (2002) stressed that people engaged
lIic~iiscl\/cs i l l the I'I~eI\vood I t ' i l t l ~ d i ~ c 10 cc'olwnlic .disI~.css. 1:r0111 this lie noted thal i l '
people are economically distressed and u n e n ~ ~ l ~ ~ e d , ~ f i i e l w o o d collcction will be done for
tritdil~g purposes, but il'tlie opporti~ni~y cost of labour is higher else where, people may
not l x attracted to li~clwoocl tratlc. 111 Illat case filelwood collcction will be lilnitcd to
domestic consi~mption only.
2.3.3 'I'ypes of fuelwood available
In 1I1c tropics. types 0 1 ' wood available as source of energy are socially and
envil-alimentally acceptable. They arc often locally avililahle (Srivastava, 1981).
All lrccs and shrilbs species tlliiy bc ilscd as 1ilc.I i l ' silllicicntly dry while olhcrs
C;II I 1)wn \vllilc grcc~i. I l o~vcvc~~ , the l ) i~~mi~ig propcrli~-s 01. 1~11cIwood 1 trees vary wiclcly,
some bur11 easily and cluickly and others bilrn slowly and with a small flame (Maydell,

Ic)80). Whc11 c1i011gh I ' L I ~ ~ W O O ~ is ~iot ~ I V ; I ~ I ~ I I > I C woliicn shil't lo ;l~tcr~ialivcs such as cillllc
clu~lg. crop rcsiducs, coconul Iii~sl\s, rice Iidls, millcl stalks or Iicrbs (Sniitli c/ rr l . , 1007).
Rural pcople collect and use a variety of ii~elwood whether it is of high quality or
not, proviclctl i t can cook tlicir li)otl wliilc i~rhan li~clwootl is i~sually solid wood which
comcs fro111 Selling (Dc.;liingk:ir. 1993). Sonic of tlic Sictors that dctcr~nine thc rli~nlity of
good wood ilrc Iiigh burning capacity, less sllloliy, ~naturity ol' tlic trccs, productio~i ol'
good cli:ircnal and Icss :~sli (liang, 2000).
111 the rainforest (South Eastern States) of Nigeria, households use low grades of
fuelwood especially in rural arcas when tlicrc is scarcity of fuels. Some of the bioruels
~ ~ s c d incluclc grasses, slirubs and agricultur:~l ~*csidues (Okafor e/ d. , 1994). Some of the
grasscs and slirubs include An(/ropogo17 /ec/orurn (Southeni Gamba) Penniseluni
pilrpz~rc~l~n (l'lcphant grass), ~'171~017?trltre17(r orkorcr/tr (siani wced) while the agriculti~ral
rcsidues incli~tlc dry c:issava sterns, 1i1: l ix stalks and cobs, coconut husks and shell, rice
11~111, ~iiillct shlk dc .
Some of the wood specics that arc used in rural areas and as well supplied to
urban centres include among others, 6'nwlinrn arhorcw (Gmelina), Azudirachta indca
(Neem), Aciou hurtcri (Ahnhtr), .4ntitrri.v trfiicrmtr (False iroko), Daniella oliveri (Soft
timber), ('crnwt.iwn sch~'v~inf i~r l l~ic (IJhv okpoko). 1:rylhrophezrm strue1cn.s (Red watcr <
tree), ~ v j ~ c t t r ~ I I / / I C ~ ' ( I ( I I J ~ L V S I ' I I I I ( I~:1111l~oo), / ' I ~ I I / L I C . ~ I O / ~ I I . ( I r~~(rc'ro/)i~yII(/ (oil bean). ( )thcrs
are Parkiu higlobom (African locust bean trce), Khana senegalensis, (Dry zone
mahogany), 7i.eculin qfrWMd."(Al?icim bread fruit). Afieliu ufricana (Akpulalu),
Brachy.v/egi~~ xpp (Achi) etc.(Okal'or, 2000; N wude 1 092).
A good nuniber of wood species are valuable food or fruit trees, but these trees are
often uscd Ibr hc l al'lcr tlic trccs or thcir I?ranchcs arc dcnd. Thcse trccs produce cxccllcnt I I .
li~clwootl. Sonic 01' tlicm i~icludc I\virr,q~c~ gtrhot~c,tr.~i.v (O,ql,r~otio). I ' / c ~ ~ L ~ ~ / ' I ) I I s s / )p (OIW) ,
I'sidiurt~ ~ I I L I ~ L I ~ L I (GLMW), M L I I ? ~ I / C I Y I it~~licw (Mango), .4n~rcardium occidunlule (cashew),
Dacryodes e h l i s (pear) (Maydell, 1986;0kafc1r, 2000).

Iq'clting of' t~ccs on p:.iva~cly ow11cd land is also an iniportant source ol'lilclwootl
(Agilrwal, 1 986). Forcslrics arc also importi~~it source o f ft~clw)ocl Lbr t1rbi111 cc1111.c~.
W l ~ c ~ i I~ IL I IL I I .~ fbrestlunci is bcing clca~~ccl, tlic climnlilics ol' wood produced are exlremcly
Iilrgc (I:olcy and n;~~.n;lrd, 1084). In tropical moist rorcst. 300 lon~ics or more of wood per
hectare could be realized (IIadley atid Lanly, 1983). In thc old Anambra Slate of Nigcria,
lirc\vood sold at O~ii~slia was mostly collcclcd liom li)rcs( mnd woodland in tlic
n~higll\>o~lr.i~ig rtlri~l towns 01' Ohosi, O h , Nsugbc while 1ll;lt sold at Awka and Amawhia
W C ~ C I M W L I ~ C ~ li.0111 l Jg~Ohil (Okaliw. I 0 8 0 ) .
'Ihe expansion of agriculture and clcaring of an area for developmental project by
gcwcrn~iicnt produce similar rcsi~lt to urban areas. Onycikc (1079) noted that one o r the
soi~rccs 01' li~.cwootl si~pply lo AIM [own i n Nigcria was liom liastcm Nigeria 'I'rcc Crop
Rehahilitation scheme, a schcmc cs~nhlislicd by Eastern region governnient. A study by
Van I3urc.n ( 1'184) in So~~l l icr~i N icoi~r;~gu;~ indicated that coll'cc project involving the
1;-lling oI'sl\;~dc trees ;lntl ~.c-pl;~nli~lp ol'col'l>c rclcilsctl ; I I:~rp,c clrlir~ilily ol' li~clwootl a ~ d
charcoal to urban market.
2.3.5 C;cndcr issues in fuelwood supply
In rural Iioirscholcls in ilic tlcvc.loping countries, division of'lubour by gendcr still
'holds. In Africa, lrce products are usually harvested by women, children and at times
I? nunciull y handicapped nien. In the case 01' collection of' file1 wood, women and childrcn
pri~i~arily carry i t 0111 with I ~ I C I ~ t~s t~r t iy pmvidi~~g some ~ i~ppIe~ i ie~ i t i i~y labour (Digcrncss,
1'977). 'l'he burden of the fuelwood is borne by women because they have the
r~spo~wihilily liw meeting I~ot~sclioltl cncrgy neccls ll~rougl~ lilcl collcclion, preparation
anti tlsc ( I ~ C I I C ;111d .10;111, 1007). 1:or ilis1;111cc~. i l is it ~0111111011 sight in tlcvcloping countries
to hcc n o~ncn undcr licuvy load ol' lislho&ci'trudge biick to their village (Super, 1 980).
I anhrcc l~ t ( 1978) obscrvctl that in Nsukka, womcn, cliildrc:i, and sometimes very old
I I I C I I i~si~illly SCC'II ca~.~.yi~ig IIOIII.C~S, I I O I I ~ I I S or I)r;~ncI~cs 01' C V O O ~ . In Morroco, the
st~pply 01' I'i~cIwood is tlic ~ ~ ~ ~ l ~ l ~ i ~ t i o ~ i 01' I'cmalcs ( bo~h womcn and girls) while
grandf'athers son~ctimes undertake f'uclwood collection when children are at school
(Mdi~glli. 1005). 111 In(1ia. V V O I ~ ~ C I I ' \ I X I I C :IS p,:~tIicrc~.s i ~ ~ ~ l t t d c the collcctio~~ 01' I ' L K ~ W O O ~
1i)r sale mltl scll~consunip~ion. li)drlcr li)r Ilvcstock, lboit. mcdicinc, sccds, leavcs :mtl
building materials (Madhu, 1995). Mcn in Rwanda occasionally cut down trees from their
woodctl land and bring large logs to 1l1c Iioi~schold but thc daily work of'gathering cicatl
~vood and transporting them are done hy wonicn and chilclrcn (1rc11c and Joan. 1997).

2 3
111 So~l l ic r .~~ ~ o ~ i c 0 1 ' Nigcl.ii1, lilclwood illtcrdctl l i~r donleutic PLW~CISCS LIIX
collcctccl by women and children h u t [lie collcction of ftrclwood li)r markct in the zone is
an exclusive task fix men (Okahr, 1986).
A 5 ~ I I L . clomwlic filcl Ixxonlcs morc conl~ncrcii~liscd and the collection is oricntctl
towal.cls Ii~rgc-scalc organi~ctl sale a11cl charcoal making, men's participation increases.
1li1t as lo~lg as ma~kcting is absent, the task ol' li~clwoocl gutllcring is rclcgarcd to womcn. , . I lierefore as Si~clwoocl hcco~iics commcscii~lisctl, its control and management shift from
womcn to mcn (C'arloni, 1084). 111 Ali-ica, i t has bccn noted tlmt it is wllen fuclwood
~ ~ C C ) I I I C S :I commercial gooel h t nlcn hccomc intcrcstccl in dcaling with it (Ki-Zerbo,
198 1 ). !:or inslancc, I .nmbrccht ( 1978) noticed that in I < I ~ ~ I ~ L I , nicn were oTtcn sccn back-
load tlicir hicycles with livc or ~liorc lm~cilcs ol' woocl ancl move dowl to the town, while
otllcrs pusll tl~cir bikes up sick lanes 10 tllc n~i~rkct. Notably Onyciltc ( 1079) also obscrvccl
in Aba that out 01' every three male suppliers, there was only one female supplier. I-le
a~trilw~cct i t to the lxrlki~icss 01' Iircwooct and the inconvcnicnccs involvcd in tlic
exploitation and transportatio~:.
AS WOOCI s~~pplics ~ C C O I I I C SC;IIXC. WOIIICII ~ i ~ l k S I I I > S I ~ I I ~ I ~ ~ I I I Y I O I I ~ C I . distal~ccs anel
spend more time and energy on fetching fuelwood. In Peruvia, 10% of women's time is
spent i n lidwood collcction, wllilc: in (;anl\ia, womcn spend from mid-day to night fall C
cvcry day g a l l d n g the evening supply (C'ccclski, 1085). 111 signilic:int number of cases
the time is 3-4 hours per day or more. In some cases as in Sahel region, women have to .# ,, ."l. .+. '
walk up to 4 kilorncters for this purpose.
111 Nigcria the collcc~io~i 01'
children even in rural areas because
product.
2.4 I'uclwood Clons~~mption
Iilc-lwoo(I is bccolilili~ ;I big task Tor womcn a~ld
01' population growth and commercialisation of the
Consumpiion in economic tern1 is the household expenditure on current goods and
services (Gwartney ct al, 1082). C'onsilmpliol~ also is seen as the purchasc of part of a
nalioli's finill goods nncl services protiucccl 1 ; ~ nlarkct cluring a given year by households.
('onstlmption greatly dcpc11cI5 OII ilidividi~al's s i x of' income. In developing
coullrics, income is Ihuncl to I I ~ one 0 1 ' 111c i~npo l~ i~~ i t csplal~atory variables in the
consunlpt ion 01' fbrcsl product (13uogiono, 1977). llunkerly and Itamsay (1 983) indicated
that countries with low-income groilps spcncl a high psoportion of their income on filcl
anti majority of tllis cxpenditurc is on fi~clwood, while higher income groups tend to
witIcl1 L . I I L * I ~ , J opliol~s S L I C I I ;I> [ I I C [ I ~ C (11 I , C I O S C I I C ( J C I I I I ~ I ~ I . , 1004). 111 :I s i ~ ~ i i l ; ~ ~ . loti;,

sludics li.o~ii Nor111cr11 Nigcri;~ s11owcd Il1i1I i l l i ~ r h ~ i ;trci~s wlicrc l'~~clwood is pi~rchasccl,
low-income groups consumcd mot*c than high incomc groups bccnuse of a switch to other
fuels by high incomc groups (Eckholnl, 1984; Openshaw, 1980).
I'ricc is also a significant determinant of consumer demand. According to
Opeiishaw (1080), the household consumption of' F~~elwood in developing countries
dcpcnds, among other l'r~ctors, on tlic priccs ol' lilclwood vis-A-vis other fucls. 170r
insla~~cc. i l l S~t(li111, tlic marlicl priccs ()I' li~clwootl arc consImitly increasing and this has
al'i'ected the demand for fuelwood by poor households. The effect is that many families
rcsort to tlic ilsc 01' low-gradc biolilcl (I:ligizouli, 1090). 13ut 13uogiono (1977) in his
cross-country study in United Kingdom (developed country) found out that price was a
non-signilicant explanatory variable in accounting for variation in their consumption ot'
cclectctl 1i)rcst procl~~cls, li~cl~voocl iilcl~~sivc.
I'opulution growth Icads lo Iliglw clclixmis liv the truclitiond cncrgy and the
result is iiicrcasc in dclorestation (I luniphrey and Duttle, 1982). In areas where population
densities arc low the demand for the product could easily be met than in areas with high
population densities (Foley and 13arnard. 1084). In areas of high densities, in order to
sntisly the substantial domestic nccds ol' liwl wood, the population exploits trees and
shrubs of all ngcs and this lcads to a very rapid dccreasc in wood species and continuous
, incscasc i l l lilvwoocl ant1 ti~i\l>cr clc~i~i~~itl (I<i~sol~g and K itsa, 1003).
Anothcr factor that influences tlic consun~ption ol' L'uelwood is the availability of
the product. Evans (1987) obsewed .that where forest resources are still plentiful and
casily accessible largc quantities of Si~clwcwd arc commonly consumcd, whcreas in arcas
ol'scurcity, tlic uli~oul~t consumcd arc gcncsally low. I:or instalice in the rich Sorest areas,
cons~~nlptio~i ol' wood is above :~vcri\g~, but in areas with low lbrcst cover, annual per
capita co~isumptioti may hc hall' a cubic nictrc (SoOkg) or even less (Ikkholm, 1075;
Graingel*. 1090). In Nigeria, the quantity ol' li~clwoocl consunwd in the Southern part ol'
the country is higher than in the Northern and also higher in the rural than in the urban
areas ~ L I C to differences in availability (Okafor, 1986).
A111011g ;111 1 1 1 ~ t I c (c~~~i i in ;~~~ls 0 1 ' I ' I I C I W O O ~ I C ~ I I S L I I I I ~ ~ ~ ~ I I IIOIIC scc~iis Io IX IIIOI'C
important than income bccausc it liliiits thc quantity of thc coniniodity onc consumes
cspccially il'thc individual dcpcncls on market p~irchascs (I'andey, 2002).

2.4. t Household fuelwood consumption
I n dcvcloping countries, tlic houschold is the must common unit of production as
wcll as consumption. A liouseliolcl is based on the arrangement made by persons either
i~d iv id~~:~l ly or i ~ ~ - g ~ u [ t p lib!. ~ I I ) \ J ~ ~ I I ~ l l ~ ~ ~ ~ ~ s c l v c s will1 l i ~ ~ l or t)llicr cssc~~ti:~ls lbr living.
A I~c~i~scl~olcl is a groi~p o l ' p ~ ~ p l ~ wllo live m ~ c i cat togetlicr (C'aslcy a~id lmy , 1'184).
There are two types of household: single and extended family households. Single
houschold includes married household whose children and wives live at a home place,
while cstcnclcd Iilnlily liouscholcl i~lcluclcs lion-relations. Icnunts, lirm labourcrs and
domestic servants who share some living and feeding arrangements with their host as well
~~clations 01' t Ire hi Ii~lc~xl ly pc i~rcluili~ig ilr-laws. coilsill. 1i~p11cw ctc. (Aclcpqju, 1 986).
111 terms of' cncrgy co~~sunlplio~l li~clwood niccls ovcr 85% ol' household energy
dcmand in most African coiuntrics (Ismail 1990; Dennis 1986). AFREPREN (1 990)
concluded that wood consumption by households in 1990 totalled 593,000 tonnes in
ccntl.nl region of S~~clun; 0111 ol' tllis ligurc, 87%) was co~tsumccl i l l rurr11 and 13% in urban
arcas.
'I'llc li~clwootl dc~li;l~ld ly tlic Ilo~~s~+olcl is li)r ~ooliilig. Iiwting. prokction and
for heating or warming water to wash. For instance in Thailand in 1980, fuelwood 4
consumption stood at 59% for cooking, 18% for washing, 15% heating, 5% protection
a~icl 3% Ii)r ironing, wl~ilc i l l t;;lnlhi;~. 54'!4 \V;IS Sor cooking, 35% liwting, 2% protcctio~i
and 1 0% for ironing ( O P ~ ~ i s ~ i c S : ''I 9'ftO): In cold climate, Iicating accounts for high
perccntagc because nights and c:lrly mornings are usually cold (Iambrecht, 1978).
' h r c arc ractors that li1cilit;ltc the dc~nand of Si~clwood by households. The local
availability of-fuelwood tends to be the primary determinant of how much fuel is used 1 . ,
where forest and woodland are plentiful. For example in Guatemala, the average per
capita consumption in rural areas has bccn estimated at 125kgfycar while annual figure of
woodland (Arnold, 1978). In arcas where wood is scarce, the quantity of firewood
consunicd is generally low. In a survey carried in six villages in Mali and Niger, i t was
1i)und that wood consumption range lioni 440-660kg pcr hcad per year. In India it was in
the mngc oT.509-826kg pcr head with a n avcragc of630kg (Samant el d., 1982).

A facror such as lilriiily size also has an imporrant influence on per capita fuel
rcquircnrcnr. Large fhmilics cooking bigger meals tend to bc more efficient in their use of
Ti~cl. A ~11rvcy in Nepal showctl tliat I'amilics with bctwccn 1-4 nlc~nbcrs uscd an average
only 340kg per person per year
I n many places thcrc arc also scasonal variations with consumption increasing in
I-louschold lcvcl of education also limits fuelwood consumption. As household
level of education increases, the less fuelwood consumption (Kumar and Hotchkiss,
1088). 'l'his is attributed lo the Iilct that morc years ofcclucation do lead to higher income
because the likelihood of improvclnent increases as person scales the educational ladder
(I\ra<llcy. 1002).
'I'hc type 01' liwd cooked and t l~c mcthocl of cooking also inllucnce houscholcl
consuniption of fuelwood. For example cereal or grain crop take longer hours to cook
than tuber crops (Moskins. 1979b).
2.4.2 Non-household fuelwood consumption C
Fuelwood is a soi~rcc of energy for rural industrics, com~ncrcial enterprise, and
~ ~ ~ h l i c or govc~*nmcnt instirutio~s ( ( )liali\~. I 000; Ircnc and .loan, 1007). Such industrics ., , , . . . I . ,v , *,* . incluclc tobacco curing, tea and cof'lkc drying, brick- making, sweet making, black-
smithing and many others (Openshaw, 1980). Fuelwood is also important in agricultural
crop processing such as garri Srying. piilnl oil production, rice processing, fish drying and
brewing oTlocal beer or distillation ol'1,ocal i in (Okafor el trl, 1994).
In towns, commercial enterprises such as restaurants, mobile eating stalls,
teashops, meat roasters, bakeries, md launcirics also acltl subslantially to the demand I'or
fi~elwooci and charcoal.
I11 governnient sector, Iuclwood is also used in community institutions such as
schools and health services for preparation of meals for school children, patients and
vulncsablc ~ I W L I ~ S si~cli as ~ l i i l l ~ i o l ~ ~ . i ~ I ~ ~ ~ i cllilcircn and dcstiturc (Ilachou, 1990; Ilans el
~ 1 . . I 980).
I,oc~~lly, rural i~~cliwtries dcplcrcd the growing stock, as rural industries and
ag9riculti~r~;~1 processing outsiclc I~oi~scl~olrl 11sc largc clw~~lli t i~~s 01' woocl cncrgy (Ircnc anel
Joan, 1997). In Nigeria about 15% - 25% of fuelwood consuniption is used in non-

households (Okafor el a/., 1994). In Kenya the demand from industries and small
commerciaI enterprises represent aromd 23% of total fuelwood use (O'Keefe, 1983). In
somc of the South Aliican countries i t can be as high as 40% of national fuelwood
consumpliu~i while in C'cntral America, intlustrics arc cstimrrtcd to account 16% ol' the
total (Bhagouan, 1984: Joans and Otarala. 1% I ).
'I'ohacco curing can he partictll:~rly a Iicuvy uscr of' li~cl wood. For instrrncc, in
Malawi 3 to 1 2kg 01' tobacco require I OOkg 01' firewood. In parts of Tanzania 50-60 cubic
metrcs of woods are rcquircd to cure a 475kg patch ol' tobacco grccn lcavcs. In Zambia it
requires 37 tonnes dry wood production to produce one tonne of tobacco flue (Mnzava,
198 1).
'l'ca drying rcquircs o ~ l e cubic 11ict1~ 01' wooti to wrc 150kg of green lcavcs
(Nkonoki. 1083). In 'I'alizanin 25.000 hricks nccdcd lix a11 average Samily house rcquirc
35 cubic riictrcs of wood (I~ckholin, 1084). 'l'lic fi~cl rccluiscmcnts ol'brick making dcpend
heavily on the quality of clay, its moisture content and the degree to which the clay is
burnt (Nkonoki, 1983).
Also i l l brewing, large quantities ol' luclwood arc rccluirccl. 1:or example Nkonoki
(1983) observed that brewing local beer from maize and other cereals require one cubic
metre ol' wood lor 400 litrcs ol' hccr and a typical village bccr shop makes 800 litres pcr
clay.
In bakery about 100kg of lircwood is needed to bakc 5Okg of bread in Guatemala
and also to dry fish, GGkg of.fresh dshnecded IOOkg of firewood to smoke it in Ivory
coast, while in Salicl rcgion. to dry a tonne of fish rcquircs about 3.25 tonne. of wood
(('ouricr. 1080; Mayclcll, I OXO: Wig~~itl . 1002). I
L
2.4.3 Povcrty and fuclwood co~rsu~nptios'
Poor people are those living under a struggle to obtain the necessities of life
within thcir cnvironlncnt and try to nlakc: both ends meet (Illife. 1983). They have low
incomc per annuni, low ratc of' savings. and low productivity because of lack of
education. skill, communication and poor health. They struggle to survive on income less
than $370.00 a year (Igun. 1072: 1)asgupta. 100.1; Scn 1081: World Bank, 1990). 111
tlc*vcloping ccounlrics tlicsc pcoplc- a c c o t ~ ~ ~ t li)r al~o\ll 70"4 - 80% ol' the population and
they are characterized by certain qualities (Miler, 1902; Lopex and Scoreria, 1996). In
Nigeria. ovcs 87%) or 93 illilliol~ Nigcri;~lis livc \XIOW poverty line. The c~untry is placed
154"' out ol' 172 countrics in thc worlA povcrty niarginal index (Nnamani, 2005). In
Nigeria they are characterizcd by:

i. large population bordering on explosion, . . 1 1 . low purchasing powcr. . . . 1 1 I . rhc 11i;!jority l ivc (ogc(licr i ~ ~ i t l clcpcnd on one anolhcr,
iv. poor nutrition with low cnlorics intake and
v. lack of in lkstructure.
In their own study, Obinnc and Mundi (1999) Ibund out that strong characteristic
of poverty anlong Nigerians, thcir families and communities are: (i) low annual income,
(ii) use ol'cliild labour. (iii) borrowing l'ro~ii local moncy lcndcr at high interest rates; (iv)
uncmploymcnt and i~~idcr-c~i iploy~iic~i t , (v) niisccllany ol' unskilled occupation, (vi) low
lcvcl 01' I~tcracy a d ctlucation, (v i i ) bclicl' in male supcriority, (viii) a great emphasis on
1.auiily solidarity, and (ix) chronic shortage ol' cash.
Thc poor direct1 y dcpcnd on tlicir environment for thcir daily survival, in that their
food comes from local field, their water from streams and wells and their fuel and
building niatcrials from trccs (1,loyd and I.cura, 1990). In poverty cyclc there arc sct of
fcaturcs tliat influence the consu~iiption ol' fuelwood.
0 1 1 ~ ' of tlicsc 1;';1t11rc-s is 1 1 ~ 1 1 ~ i i ; ~ j o r i l y ol'llic poo~. livc* i l l r11r;11 :Irc:Is. wliilc less
pcrcc~itagc livc i n tlic town. It is with this regard that World 13ank (1996) reported tliat
poverty is overwhelmingly rural and rcgional in outlook. The findings showed that in
Nigcrin ahout two-third of tlic poor livc in rural areas. I:orest and woodland are mostly
fo!lnd in rural arcas and thc prcscncc ol'tlicsc makes for easy acccssibility and availability
of fuelwood in thosc arcas. Thirsmcounts for the greater dependence of the people on
fuelwood as tlie major source of energy (Is~n:~il, 1990; Agrirw:il, 1986).
Occupatiot~ 01' ; I I ~ i ~ i c l i v i c l i ~ ; ~ l pl;~ys signilic;~nl role i l l acccssibility to economic
resource. Sollie of tlie poor work as cultivators, huntersl gatherers, small artisans, petty
traders and wage labourers at variousVtimes of the year (Arne 1996; Dasgupta 1993;
WOI-ld I3ank. 1900; I < ~ I I C S and 1 I ~ I ; I ~ I I ~ ~ I I I . 1002). 111 Ali.ica thc ahovc poor pcoplc can
casily al'liwd the cost 01' liwlwoocl. cliarcoul and animal dung to meet the basic encrgy
nccds ( I .ccch and Means, 1988).
111 Al'ric;~, Iic*;~tls ol' I io r~s~~l~ol t l olic.11 givc ; I I I i ~ d i c * ; ~ ~ i o r i to llic lcvcl t l~c l'i~~nily is
placed. According to Ashford (1995) wolncn headed liouscholds tend to be poorer than
those liouseliolds headed by mcn because many women have all the household
responsibilities without powcr or rcsourccs necessary to mcct than. Adcyeye (1 999) in
his study in Oyo state concluded t h ; ~ t origin of povcrty among rural women included
liniitcd ucccss to r;lctors ol'prod~~ction sr1c.h ;IS I;ind. i~sc ol' tc-clinology atid lock of savings

for investment. The above situations havc made somc women to be gatherers and
consumer.: ol' filelwood.
'I'l~c s i x : i t d tllc c o ~ ~ ~ p o s i t i o l ~ 0 1 ' Iio~~scl~olcl clctcr.rliiric llic Icvcl ol' povcrly and ils
fuelwood consumption. Thc poor with low income per person tend to be large with many
children. The poor in developing countries have an average of 7.7 members of whom 3.3
wcrc under nine ycilrs (Igiln, 1072). I loitscliold with Ii~rgcst nurnbcr ol' children would
tend to consume more I'~~cI\vooci (Igbozurihc, I08 1).
In sotiic poor counlrics, low-incomc groups spcr~d ;I higl~cr proportion 01' thcir
income o n i\lcI :~nd m;ijorily 01' this cspcniliturc is on I'i~clwood (.lcnnikr, 1994). 'llic
more affluent sections of' the society always prefer cleaner and more convenient cooking
fuuels to wood. They change I'rotn wood to charcoal to kcrosene to electricity or gas as
steps in the improvement of quality of thcir life (Reddy, 1983).
Education facilitatcs higher income earning as each increment in educational
alli~innicnl. cnh:~nccs I~ij.lwr. c-rlsninj: (. loli l i . 1994). 'Thcrc. i s siliiplc cw~rc1:ilioti hclwc.cv~
c ~ l ~ l c * i ~ l i c ) ~ ~ I I I I ( ~ illcolllt* (IIIC' (0 (11t+ 1 i 1 t * ( 1 1 1 1 1 1 I I I ~ I C Y ~ ~ I I I : ; 0 1 c . r l ~ ~ < ' i ~ ( i o l i d o Icl~eI 10 IligI~cr
income Ixcause thc likelihood of' imprc~vcmcnt i~~crcascs as a person scalcs the
educational ladder (Bradley, 1992). As household level of education increases the family
consumes lcss f~ielwood as a result of accepting alternativc source of energy (Kumar and
I-Iotchkios, 1988).
Most poor people especially the farmers do not have land tenure right, but where
tlicrc riglit csisls, i t is always oti.~~uixaulu;tl land IIicy rely o n ( I ,ope;. and Scoscria, 1006).
The rural households with no title on land can gather fuelwood free from trees located in
is own or tlic communily lands w l i c ~ ~ communal land tcnurc is obtainable. As income
declines the dependence for fuelwood collection from sources other than one's own
increases ( ~ ~ a n v a l , 1986). 1,
2.5 I ' I w I ) I ~ I ~ ~ s of l h ~ l w o o d ( ' O I I S I I I I I ~ ~ ion
2.5.1 Environmcnti~l PI-oblcms
In Africa 1.3 million hectares of closed Iorest and 2.3 million hectares of open
woodland :\re lost cach ycm.. More tliirn hall' of the loss takes place in West African
countries such as (;hanu. (;i~inca, Ivory ('oilst, 1,ibcria a ~ ~ t l Nigcria. (Kamanankasina,
1986). In Nigeria thc del'orcstation is grcalest in lhe South-East zone. This zone was
buildings (Myers, 1993).

'I'lic collcc~ion of li~clwootl li.ccl~lc.ntly leads 10 ccolop,ical damage to forest,
\voodlnncl and Iirnilund. I n tlic process ol' li~clwood collection, some trcc covcrs are badly
damaged, the ciTcct ol' this action is that vast areas of top-soil arc cxposcd to rains and
winds. 'I'his leads to occurrcncc 01' erosion which accclcratcs tlic loss to the land's
productivity (Sn~il and Knowland, 1080). 'l'llc clTect ol'thc loss of topsoil on agricultural
production has in~plic:ltion SOI. ~ h c socicly as a whole and the fi~rmers in particular
bczai~sc they depend on agricultt~sc liw their livcliliood (Agarwal, 1986), Bajrcicharya
( I 0 8 3 ) . ohscrvcd t 1 ~ 1 ~ l i o s ~ li~mls wirll good ~rccs as wi~iil-l)rci~kcrs or sllcllcr-l,clts Ili~vc
yielded 20 to 50 percent higher than those without tree cover. The disappearance of the
trecs and shrubs as a result 01' filclwood consumption produces a tendency for rainwatcr to
be rclcascd in lloods during rainy or wet scason. This is followcd by drought in dry
scason, wliicli leads to loss 01' watcr quality. and tliis all'ccts drinking watc;. supplies,
wak-r lijr w141i11g c lo~l~cs . i i ~ i i l W I ~ C I . for wpplics 10 fish (Noclccn, 1005; Eckholm. 1076).
'I'hc lowcv.inp. of tlw watts taldc 1i1~1li~s i r nii~cli 1110rc dil'lici~l~ :~nd ti~ric consuming li)r
wonmi to obtain watcr cspccially during thc dry season.
l'i~clwood scarcity is as much a consequence as a cause of the deforestation
(Eckholni, 1984). I11 Nigeria, the cviclcncc of tliis dclimstation is alrcady emerging in
parts of south-east where forest source products are becoming scarce (Eboh, 1991). This
r has I-aiscct tlic prohlcm o r subst;~ntial incrcnsc in thc time and cncrgy spent (especially
\ V O I I ~ L ~ I ~ : \ I I < I c l i i l d ~ . ~ ~ ~ i ) ~ > ; I I I ~ ~ . I * l ' ~ ~ c . l \ \ ~ j c ) ~ l ( N ~ ~ ~ l i ~ ~ i ~ l i ~ ~ ~ i ~ ~ i i111c1 Si~nil~rani. l083), ' 1 ' 11~
problcni has rcflcctcd i n tcrlns,,crt;.icicrx;ascd prices ol' I'uclwood, yam stakes and the
growing trade in forest related items (Eboh, 1998). This includcs not only fruits and
lijcldc~. h~r :~lxo hcrhs aticl pl:~~irs li)s Ioc:~l mctlicinc. (Gi~lii~. 1983).
2.5.2 Social problems I( , . I:i~elwood is an econoniic good as well as social good. The tree product is highly
intl ispcnsablc lo the ri~sal p c o ~ l c u i t l llic i~sban poor. 'l'hc cocAing habits of tlicsc pcoplc
~ecessitate the use ol' large quantity ol'cnergy, which could bc supplied by fuelwood at an
al'l'ordable price as the progression towards the use of modern fuel by the poor is difficult
(Arji~n, 1980). 'l'he inadcquacics ol' thc lire1 has drivcn some wonicn to adopt a mcthod o r
ccono~nising r lie li~clwoi~cl by liy.hrilig 0111 y r 11c ends 01' logs atitl hrt~nchcs placed l i kc
S ~ ) ~ C S 0 1 . N ~ I C C ! i11ii1 ~ 0 0 h \villi Iic;11 ~ C I I C I ~ I I C ~ I I ' I .OIII llic L Y I C I S 0 1 ' llic S I ) ( ) ~ C S i11it1 I I l i q
iiicthod takes grcatcs t in~c in coohi~ig ( I lowc atid SOIK', 1077). Also tlic irnbalancc i n
supply w c l tlc~nand of' tlic cu~n~noclity h is 111adc sonic o f thc poor people to shift towards
Iow-gr;dc li~cls si~cli as crop rc'sidi~t'. COC( ; I I~ IC I I ~ I S ~ S , ricc hulls, millct and maizc stalks.

Although these filels coilld casily be available but they take lol-~ger hours for cooking
(Irene and J o q 1097).
scarcity Jim Ietl to t he rcduct ion in lilcl intcnsi vc: l i d . proccssi ng, and storage
tech~iolo~:ics (I'inlcntcl anti I'imc~itcl. 1985). ]:or insta~~cc, i n (;ilatamala and some other
counlries, heans is the principal source of protein for the poor but ~nany fhmilies are
sl~iliilig iiwiiy Iioni I~cnlls Ijcci~tts~ ll~cy ti~kc longcs li111c lo cook (lloskin, 1970a;
I>ccua~laIo, 1083). Again in I'astcrn I Ippcr Volta attempts by the government to introduce
the cultivation of soyabcans is being resisted by the women because of longer cooking
Iioilrs and greater quantity ol' Sitel soyaheans require relative to traditional beans (Tloski~ls,
1070).
So111c liwtls such as ccrcals ilrc nlosc casily cligcslcd ulicr cooking. 'I'hcrcliw
proper cooking of food reduces man's exposure to many debilitating parasitic and disease
organisni. I t also improves thc llavoilr and digestibility ol' li~od and reduces the chances
ol' spoilage (Ilavid and I'ilnclilcl. !070). Also partially coolictl Sood due t o I x k ol'
appropriate fuel increases vulnerability to ill-health and infection (Agarwal, 1986).
snmller towns and some villages. tllc cost ol'thc fuel appro:rchcs thc cost of the food it is
Iiiglicr incrcase in the prices oS wood a~id Ilighcr expenditure incurred in using wood. In
semi-arid region the effect ol' co~~~mercialis;itioi-~ of fitelwood is seen in the diversion ol'
ct11rig liorn 1iwd production to cooking (Opelishaw, 1974). I'hc clivcrsion ol' lhc manure to
litel has al'l'ccted crop yield. I:or cvcsy tonhe oi: cattlc dung burnt mcans a loss of
i appropsiately 50kg of food grains and in the third world countries about 400 million
tonnes of' cattle dung are burnt arinu;illy. 'i'h:~t me;ins a loss ol' 20 nill lion tonncs of grain
each year (Spear, 1978).
Will1 ~l lc scarcity 01' li~clwoo~l i~ncl its coml~lc~.cialis;~Lio~~ nlainly in urbarl arcus
where prices have risen, urban fanlilics are paying up to 30% of thcir meager income for
cool,i~ig !,i~cl (I.'ostcs, I O H O ) . Accostlil~g to 0gho111ia (2000) I~ouscl~olcts i l l Nigeria ~iow
Ghana, women's income comes from the sale of smoked fish, but as fuel availability
decreases. these activities become less viahle. 'I'his is because they incur extra

1:or ~notllcss (women) tl~crc nlight be a resultant cconomic cost in terms of
crnploymcnt or other income earning opportunities foryunc (I loskins, 1983). When they
devote more and more time Lo obtaining fi~cl and water, they have less timc to dcvote lo
li)od prodtlctiol~, to illcrcasc tlw Iloilsc.lloltl inconic, to pursue tl~cis own cdi~cation and
in~provc Iilmily welSarc. 'l'licsc growing 11,urtlens can cuusc li~rtlicr adverse social and
economic consequences fiw thcnisclvcs ant1 their families (IINEI' and IJNDP, 1993).
2.5.4 1Ic:~llh prol)lcnis
When Iuelwood bccolncs scarce, people especially womcn face a lot of problcins,
wliich do not cntl in social, and economic hut include Ilcallli problcnis. In the process or
wood consunlption, rural people and urban poor use fi~elwood to boil water in the course
01' p111.i lj,ir~g i l liw clsi~ll\ing. I'llcy alho I>oil wa!cr li)r wasl~ing clotlw and oIIc11 use warm
water for bathing especially in cold weather. These practices are essential requirements
1'01- ~~~ailitaining go011 I~calth and germ lice environment. 13ut as lid diminishes, all these
hasic I~culth psactices are clwtailccl (Cccclski, 1985b). In a similar study conducted by
Super (1980) she noticed that shortage of wood still has significant effect on the health of
the rural pcople and i~rlmn poor hccause:
I . thcre is no refrigeration for leli over. Therefore the food could go sour; < ..
11. the increased consumption of raw foods or partially cooked food and unboiled
water may cause i~lcsci~sc in disci~sc inlbct ion.
As rl~c li~clwoocl sca1.ci~y~~1~L.fsi'srJ. womcn lbcc the task of' walking loligcr
d istanccs i l l collecting. cut ling and transporting the wood. 'l'liroughout the developing
countries women are seen carrying londs up to 35kg over distances as much as lOkm
l i o ~ ~ ~ Ilon~c. 'l'llc weight csccctls the niasin~unl weight pcnnissiblc by law i n many
countries, which typically prohihits r n m i l ~ l c;~ri'~ing by wornell of londs greater than 20kg
(ILO, 1966). These burdens damage the spine and causes problems with child bearing
(Ivcnc i 1 1 d .loan, 1007). 111 tllc psoccss 0 1 ' cooking, wolncrl illso lilcc a lot 01' Ilcalth
Ii:~/arcls. Whcn wolncn cook with hionlass 11cls during or par1 ol' the year, emissions that
come l i r~ l l tllcsc li~cls arc cli~ngcrous sources 01' air pollution at home. 1:uelwood is
capable of producing pollution concentration higher than hssil li~cls undes slow-burning
conditions. Studies have shown that cooks sufler from more smoke and pollutants than
rcsidcnls 0 1 ' tllc tlirticsr urha~l cnvirtrnlncllts (Smith C I (11, 1003). 111 one st~rtly quotctl !>y
the World llealth Organization (WIIO) a female cook can inhale an alnount of
bcnzopyrcnc (a poisonous gas Srom burning fi~el) equivalent to 20 packets of cigarette a
di~y. In a k w places chronic carbon monoxide, is also evident (WI 1 0 . 1984). Studies in

some ol' 111c IsI;in~i~ wi~n(rics wI1erc wolncn are conlincd in a place and they remain
inside doing domestic (ask ol'cooking, w;isliing and child care in the internal c~ivironmcnt
is olicn tlangcrous. 'l'his is hccat~sc they arc likely lo sirl'l'cr l'rom respiratory u i c l cyc
disease prohlc~n togctlicr with their clliltlrcli and thcsc arc causccl by wood and otlicr
bioinilss (lrcnc and .loan, 1907).
Ilsli~l~alcs intlicatc tha t smoke contributes to acutc respiratory infection that kills
four n-rillion infants and children a year. Such infection shows up in adults as chronic
Immchitis and cmpllysc~no, which can cvc~lIu;illy lcatl to heart I'ailiirc (Smith el trl, 1993).
Studics also show that where cnlission contain high concentration of cnrcinogcns,
nasopharyngcal cancer is common anlong young people who have been exposed since
i t l f i i t l ~ y (Wl 1 0 , 1984).
2.6 I'~wl)lcn~s of Iiuclwotrtl Marltcting
Marketing problems of forest products (fuelwood inclusive) in Nigeria arise
bcciiusc ol' sliortagcs ol' tllc procluc~, Ii~cli of csscntinl liictors such as good nctwork of
n~:~itdIkcclcr roads. ;idequ:itc trit~isport scrviccs, good 111:irket liicilitics and up-to-d~itc
market information system.
In reccnt time, the incrcasiilg denland lbr I'uclwood by the urban residents as well
as local consumption had created fuelwood scarcity in Nigeria. F A 0 study on fuelwood . ,, . "1. 5,' .Pi.
scarcity in developing countries classilied Nigcria as onc of the fuclwood deficit countries
in [lie world ( I l i t l i ~ ct i l l , 1980). 111 Nigcriii 1l1e si~pply or t h ~ MWKI product is diminishing
(Peters, 2000). 'l'hc scarcity 01' the trcc product is motivated by high cl land of the good
(Morgan, 1983). I (
One of the causes of the demand is increase in population, and as long as this
conliniics, ~ h c scarcity 01' wootl procluct wit l persist (NliS'l'. I 090). Folcy and I3crnand
(1084) noted that the high dcmand lhr rilclwood means that pcoplc will have slrong
niotivc to cut Irces.
'I'lle sign of thc scwcity of fi~clwootl i s that the wootl product which was formcrly
free from collection has given way for commercialization in which the tree product is
bought and sold (Cllauvin, 1981). 'I'llc incrcusc in the scarcity of wood supplies,
particularly arou~ltl areas of concentrated consumption (cities and a g o industries) has led
to sharp increase in real prices as well as actual shortage (Amlitage and Schramm, 1994).
A rl~~i( i~j :c . I I I I ~ I SC~II.IIIIIIII ( 1 00.1 ) O I ~ S L . I . V L ' ~ I t11i1I 1111' sl)t)~.lill!.~ 01 ' t l~ ~ o o t l llas consta~llly

Ic'llglllc'll lllch tlislilllcc O V C l ' \vll iCIl sl~pl>licl.s I I ~ I V C 10 I l ' i l ~ C l i111iI 1 1 1 ~ ( ~ ~ S ; ~ ~ P C ~ I I ; I I ~ C U S 0 1 ' Il-CcS
ospcciolly uround thc cities. 'l'he cause oL'thc above problem is that large numbers of trees
arc cut li-om lbrcst anel homcs[ead land but less number ol' trees arc planted. For instancc
rwlwootl supplying trccs arc kllctl ;II ;I r;~lc or i11)oul 8% per ilnnl~ni \ V ~ C T C ~ I S tIw grow111
01' lhc: lrccs r;\ilgc L ~ ~ ~ W L ' C ~ I I 4 to 5(% (Mil l l l i~j , 1006). 'l'llis action Icr~ds to clefiwesta[ion,
wllic11 is o~ i c 01 ' ~ I I C ~naior p~.ohlcms li~cccl i n over-exploitation 01' Ii~clwood. I n Nigeria the
deforestation of' woodland in the northern part runs to about 92,000 hcctares a year. This
ligwc gives i1 I ' O I I ~ I I itlca of' tllc ~ l l i ~ g ~ ~ i l l ~ t l ~ 01' pro1)lcnl anel clcgrcc ol' scvcrc populutiun
IWL'SSIII.C 011 woody species (Okali)r, 1000). 'l'llc cleplctio~~ 01' ~ I I C trees tias led I'ar~ncrs not
allowing neigbours to collect fuelwood from their land. The effect of this is restriction of
pcoplc ~x11~1iculady tllc poor to rcly 011 tlrc remaining communal resources thereby
spcctling lip ~hcir dcplction ( I'ho~nas, 1003). 11. the dcplclion contint~cs there will be i ~ n
aclditional social cost in that there will bc n gradual increase in the distance travelled and
tinie required to gather the wood (Ilclnedio, 2004).
2.6.2 Poor nctworlc of road
Among the problems cxpcricnced in fuelwood marketing, one of the major
constrains in this aspect is the dcl'cctive infrastructure particularly roads and
tlcarlspwlulion scrviccs (Mittcnclorl: 1003). A good ilctwork 01' romls lowers markct costs
power of locd monopolies (Abtltt,. .l.V93,),,,Madueke (1 988) in a market survey, poiiitctl
0111 that a n iniportant prerequisite Ibr expansion of market supplies is the openii~g up of'
rural arcas ~ h r o ~ ~ g h all season roads l h a ~ could witllstand the vagarics of'nature and/or lllc
estublishment of collection centres in the vicinity of producing areas. Arguing in support,
I'olcy ancl Ila~.nu~rcl (1084) stated tI1i1t !is Ii~r as trucks and vchicles arc usi~ally Ihc
predominant i~iethod of'transport liw l'uclwood supplics lo 11rha1l ilrcas, road networks has
a ~najor bearing on the source of' supply. This is because poor road network adds to the
~mhlcn i or li~clwootl rcliahilily (Ml~~islow, 1088). I:or i~isti~ncc in arcas where thcrc arc
dc~lsc li)rcsl, whclx atlctli~a(c li~clwooil could be S O L I I . C ~ C ~ , ( I I C ~ C won't bc access road to
gel to the place. 11 is in the same vein thal Ijang (2000) obscrved that heavy nature of
rains impede collection of v~oocl, and tlic transportation or the wood also becomes
dil'licult bec:iuse tlic untarred road bucon~cs inr~cccssil?lc. Oknlhr c! cil (1994) in thcir
sl~ltly in the Southern ecological zone of Nigeria where rains arc usunlly heavy during we1
season equally noted that one of the problems of fuelwood marketing to the local people
is p i ~ i i a r i l y Iiick 01' I2cdc1. ~.oiitls 1ijr c.ollt.csyit~g (hc ~i~clwootl 10 Ihc 111arkcts cslxcially

d~iring r i ~ i n y season. 'l'liey indicated t h n ~ thc cffcct is tlm rhc purchase cost is always
rn11cl1 IO\YCI. C O I I I ~ X ~ I - ~ C ~ to tI1cir ~ ' ~ t i l i l v;~lirc i l l tlw urban nwrkcts.
2.6.3 Cost of transportation
r:or ally good markcting or clistril~lltion to lakc place (Ilcrc must cxist a good
trmlsporl ~icI\vork. 'I'O(Iily tr;~i~s!)o~.l;~lioii co~isli t~~tcs one 01' the m:!jor l'caturcs ol'cconomic
tlcvclop~~cnt bcca~~sc: the movcnlcnt ol' goods and pcople haw become critical to h c
continued dcvelopn~eiit of a country's ccoiioi~iy (Filani, 1979). Transportation in some
ways ~xvvidcs a vilnl lubricnnr to trade and Iias permitted tl~c advantages of gcograpliicul
spcci;~lisutioil i11 procli~ction to Iw exploited liilly (Ilarnnistcr and T3utton, 1903).
'fransportniion is a crucial part of markcting. All surplus forest products necd some
t r . ans l~~I i~ t ic ,~~ tllat coulci l x p~uvidc~i Ily lilrnie~-s or middlcmcli to thc nlarkct place
(~lOl~g:lll, 1083).
'l'ransportation bears costs. 'l'lic costs that arc directly rclated to distancc arc
transportation costs. Transportation costs accolllit for the largest share of marketing costs
i n litelwood trade (Mittcnlivt, 1903). I lc stated that any el'lbrt to improve the eflicicncy
01' I 'LICI\YOOCI ll~ilrkctillg sysIc111 II~creli)~.~ will i i ~ ~ l i ~ ~ i c IIICLISLII~CS fix rcd~cing t1ic cost 01'
transportation in filelwood marketins. Transportation cost is very high because of the
Iy~lh incss ol' lllc prod~iet and poor conditio~i of' r o d s (Alimcd I 000. Adeyoju 1986, Abott
1000). Minliqj (1996) also poitlted out that the high cost of transportation is as a result of
tlilliciilt Icrraiii and the rciiiotciic?;s,,gJ~~I~~',~~;cas where tlicsc products are extracted.
2.7 Theoretical Ih-amework
'I'lic central theory ol' Walter C'l~ristilllcr post~ilates that location of cconomic
activity is largely determined by conditiop of . . supply and demand; other factors such as
relief; population, transport arc also iinportant ('l'oync and Ncwby, 1971). In every
society, u marketing system helps lo 111atcli supply and demand, as tlicrc exists, both
iieteroge~ieous supplies and dc~nands li)r goods and services. Marketing therefore is
dcliircd ils i I social j~occss, \ Y I ~ ~ c I I ( I ~ I C C I S ~ I I I C C O I I O I ~ I Y ' S 1 1 0 ~ 01' ~ O O ~ I S i111d serviecs l i . ~ l ~ l
the p~.otll~ccrs to consuincrs in a way tliat cll'ectivcly inatchcs supply and deinand and
accomplisl~cs tlie objectives 01' society (McCartliy and I'crrcault, l<)<)O). I11 a ~ilarkct
model, therefore pure competitive market system shows the market forces of demand,
st~pply and price niccl~niiisni.
An cl'licient marketing system mcruns getting prodiicts to the consumers at tlic
right time, in tlie right places and at priccs thcy are willing to pay. 'I'heoretically, for an

el'ficient markct systcm to occur, tllc fbrces of denland and supply must be guided by
price'. 111 li~ct, 1l1c ; I I I ~ O U I I ( 01' ;111y c o ~ l i ~ ~ ~ o d i i y C ~ I I S I I I I I C ~ ; I ( ally li~lic is a (il~iclion 0 1 ' lllc
inlcraclion ol'dCnland and s~rpply lllro~g11 llru price n~cclia~lis~ii.
I n a pure competitive market, prices guide corisuniers in the choice of goods they
~iiakc, and cluantily ol' goods they bily. 'I'radilionally consumer theory cven suggcst t l ~ a t
d c m d 1;)s m y commodity dc lw~ds o n the prices ol' the commodily and on t l~c total
cxl~cmii~wc ol' the consumers ('l'honlas, 1003). 'l'hen demand bcco i i~s thc rclation that
exists hctwec.11 series of quantities of ~~roduc~ts that will bc purchased and the
cosscsponding prices in n spccilicd period or lime. C1i:rngcs in tlcmancl also occur because
ol'distsibirtion in income, population, tastes, prices ofsilbstitutcs or complementary goods
(1Tungate and Sherman, 1979). Other factors that affect or influence the demand for
producls inc lde priccs ol' the products, consu~iics's inconlc, government policies,
wcatlicr, credit availability, habits, atlvc.rlising and past lcvcls ol'demand (Koutsoyiannis,
I 079).
'I'he demand function is expressed thus:
()(I' ==f(l' , 1'0, y 71
W 1lc.1.c Otl, is qunnlily of' conllllodily dcmantlctl, 1'. tllc pricc of the good, 1'0,
prices of related goods, Y, income, and T, tastes of tlie nienibers of the households.
Supply also plays signilicant role in a pure competitive marketing system. It is
~xwcly guitlctl by IN-icc 1iicch;1nis1n. 'I'llcorctically, s ~ ~ p p l y nicans file amount ol' that
commodity that producers are able a d - w i l t i q fo oUer for sale at a given price (Lipsey,
1972). Supply in its term could be physical or economic. Physical supply refers to the
availal,lc clilantities or stocks of tlic pro(1~1ct. while economic supply is the quantity of the
prod~~ct reaclling the market at a given price, time and place. (Enabor, 1999). 11 . .
Supply function is then exprcssc.d tliw:
Qs PO, PC, 111, wt, T, C't, 19
Where Qs, is the quanlity ol' the given prodilcl, I'o is Ihc product price, Pc is thc
average price of' tlie competing products, I It is the hectnrage in production, LVt is the
\ ~ ~ i ~ l I l C r v:rrii~I~lc, ' I ' is lllch icvcl 01. ~ u c l ~ ~ ~ ) l o g y , ( '1 is I I K c:~l)il;~l stock : r i d v rcprcsc~~ts
otllcr 0111ittc-(1 vi~l-i;~hl~s.
1 1 1 ill.c.ils ol' I\~clwootl ~ l~ i~~ .hc t i~ lg . ~ W O (I~c'oric's I K I V C I>CCII dcvcIop~'d to LISSC'SS t I l ~
l'actors that influence supply and dcmand for fi~elwood in developing countries:
I . (iap tl~cory; and . . 11. Indicator Ihcory.

I. Gap theory: Gap theory says that fuelwood reserves are being destroyed
because of the gap bclwccn supply and dcniand. 'l'lic theory estimates the gap
bctwccn supply ~ ~ n d J~lllii~~l(l using M ~ I ~ ~ ~ L I S ~ L I I I ' S 1110dcl approach by wliich
Iuclwood is basically iniluenced by thc total population and the supply of
I '~~~l\vootl is ~ l o r ~ ~ ~ a l l y ~licas~~rcxl I)y lllc i ~ ~ c r c ~ n c ~ ~ l or yield ol' l'i~clwootl (Worltl
Oank, 1085). 'l'lic flaws in the gap theory is that the gap between supply and
demand is not always easy to determine accurately. Secondly, the theory is
centred mainly on population :is the main factor thcrcby ignoring other factors
that determine the supply and deniand of fuelwood. Thirdly, if there is
increase in populatioll along with increase in thc disposal income 01' the
pcoplc. lx)pi~':\tion will I~avc less inlli~cncc on lllc tlcmand ol' li~clwood. 'l'his is
bcc:iusc people with IligIl i n c o ~ ~ ~ c will swilcl~ over lo u more convcnicnl I'ucl.
ii. Indicator theory: The indicator theory examines those factors that are
associated with fuelwood scarcity (supply and demand). Such factors are
lahour timc, co~isi~ml)(io~l 01' ICSS p r c l i ' ~ ~ ~ d types 01' hioli~cl. cutlillg 01' live
wood, and thc people's perception of li~clwood (Dewees, 1989). The indicator
tllcory Ilcrc considers ~lliiny viirial~lcs otlicr than population.
1 1 1 litelwood marketing. si~pplics sl~o\v a tlcgrcc ol'rcsponsivcncss to price change:
, thcy vary according to the distance, location, weight and volume of firewood. Other
factors includc: labour tinie, condition of roads, transportation cost and occupation.
Consumption is a chief4-m \of economic activity. Theoretically it is regarded as
the sum of cspcntlili~rcs o n non-di~rahl~ consu~i~c~r goods and lhc valw of llic Ilow 01'
scrviccs 011 tli~rublc consunicr gootls ('l'honxis, 1003). ('onsi~niption li~nction on its own
describes the rclationsliip bctwccn cxpcnditurc and all other factors that determine it. It is
;i fi~nction of wceltli. intcrcst ratc atid tiistc w'hich is cxprcsscd thus C = f (W, 1, T) where
W is wealth, I intcrcst ratc, and '1' taste. Consumption is influenced by the following
Iictors - I ~ o ~ ~ ~ e l i o l d inco~~lc, s to~l i 01' W C L I I ~ I I , availilbility ol' credit, weather etc (Lipscy,
1972).
I'ncrgy const~~i~ption, likc consumption ol' any good, is influenced by certain
s()ci()-'*c-o~lo~iiic* fiic*tot~. S O I I I ~ - 01' [ l l c ~ s c . I ~ I ~ . I O I Y . l ~ ) l l o \ v i t ~ ~ ~ , tlic s t ~ ~ * , ~ c s l i o ~ ~ s 01' C ~ ~ I I I I I I I C ~
theories, include, among others, level of economic activities, energy prices, population,
cnvironnlcnt, supply rclinhility, cost and availability of ciicrgy appli:inces (Chapman,
1989: Ayodclc, 1992). Aninim and Wilson ( 1 080) developed liypotliesis based on
consuniption ol'encrgy, wliich thcy linked to.cconomic sectors, productive and functional

consumption. 'I'hey staled that procluctivc consiuiiption is I ~ s c ~ on indus~rial and
co~llnlcrciul sectors whcrc the cncrgy is uscd as input for llic production of goods and
sc~wiccs, wliilc lirlictional cons\lmp~ion is l i~~kctl \vitl~ domestic sector whcrc tile
consumption patterns arise from variations in settlement pattern, income, and lifestyle.
( ' o ~ ~ s ~ ~ r n p t i o n ol' li~~-l\vood is tliLw tlctcr-tilincd hy:
I . ~hysical co~itlilion 01' ~ l i c ri1ri11 set1 ing S L I C ~ I ;IS cl imate, pliysic:~l wailabi 1 i ty 01'
wood and tlle liiclwood substi~uics; . . I I . tlc~nogral)liic vm~ial~lcs Iikc I~t~~scl io l t l size and coniposilion; ... 111. r n ~ c of ~~rbanization
iv. prices of li~clwood vis-ii-vis ollicr li~cls;
v . < ' ~ ~ l ~ \ i r a l p r i ~ ~ t i c . ~ ~ likc 111c rypc of li)od, cooking Ili~hits and prrrcticcs.
2 . Andy tical IG-imcwork
DiSScrcnt lnelhods ol'data analysis have been uscd by researchers to analyse their
works. In cases pertaining to consumption and mnrltc~ing, economists and statisticians
llavc dcvcloped a good nu~i~ber ol' ~nclhods i11 analyzing consumption determinants and
tools that ciihancc Ihc cl'licicncy ol'~iiarkcting syslcm. I lowcvcr, in ~ h c prcsent study, thc
following tools were employed:
, I . Mt~ltiplc rcgrcssions. . . 11. Mar-kcti~lg 111itr-gi11 ... 111. Gross margin , . . - a .
iv. Gini coefficient,
2.8.1 M ulliplc rcgrcssiorl I'urrctiorl
Multiple Regression by ordinary least &quare method is an economic tool, which
describes in ~iialhe~iialical Ibrm the relationship between variables. I t helps to detcrminr:
1I1c cslcrll lo which cllangcs i l l LI give11 variublc ul'l'ccl oll~cr variables, that i s i t dculs will1
cause-cll'ec~ relationship (Maddala, 1092).
Millhcmalically. regression ~nodcl is cxpresscd in i~nplicit Ihrm as:
1' - j (,Y,, ,V2, X-j, . . ..Yl1, 0)
or csplicilly as
1' - ho 1- hi d!'l 1 b2A'? t ~~3,Y.~...ll,lL\',l 4 [I.
In 111c nlotlcl, Y is the tlclxmclcnt vi~riablc; Xs arc i~ldepcndcnt variabIes, which arc
dctcrmincd outside tile ~iloticls. 'l'llcy i~iducc changc or- explain the bchaviour ol'
dcpcndcrlt variables hcncc li)rm thc 1,asis li)r the prediction 01' the rcgressard (Awoke,

200 1 ). I j , , , b,. . . I ) , , ilrc thc pil~*arlictcrs, which nrc tile Iwsic clcscriptivc mc*asurcs ol'
population o r the cxpcctcd value. The 13s are tlie cocfllcicnts which measi~res the
cl;~sticity 01' Y with rcspcct to X, that is tllc pcrccntage cllangc i l l Y for a given (sninli)
pc'rccnt;~ge change in X (Critjarali, 1902). For a price - qilanlity relationship, price
elasticity of clemancl measures the responsivcness of quantity clcmanded to a change in
~wicc. M'llcn cocflicicl~l (I\) is less tlm~ o l ~ c (ignoring tllc sign) clcniancl is suicl to bc
inclastic. aid wlwn clasticity is grci~tcr I l m onc (ignoring the sign), dcmand is said to be
cli~stic, lwl wlwn price clwticity cili~als olic, dcmand is said to I x unitary elasticity
(Cramcr ct al, 1997). If the cstimutcd function is log-lincar clcniand or supply function,
I l x cocl'liciwl ( I ) ) is :I price cli\stici!y hilt il'the csti~niltcd limetion is linear demand or
supply li~nction, the coefticienl ( R ) is not the price elasticity but a component of thc
elasticity (Koutsoyiannis 1977). ''1;" is the f~~nctional relationship which is the way the Xs
Most recent rcscarclws involve ~nultiplc rcgrcssion i l l analysis of their studies.
Arguing in support, Qji (1994) pointed out that many refined and modern methods of
C S ~ imutioll I ~ ~ I V C ig~~orcil graplrical i ~ ~ ~ i ~ l y s i s with its ohvious illustrations about statistical
fa!ts, which is not the case with tlie regression method. Walter (1969) noted that many
rescnrclicrs have oliCli resorted to thc usc of regression bccause of its desirable properlies + 4 .A. 4 '
and suilnli lily. Koulsoyi:~nnis (1 0'7'7) ~niiic&d that son~c o f thc clcsirahlc properties ol'
regression include the following:
I . I.inearity, unbiased~icss and minimmi variation.
iv. Tt has been used in wide range of econometric relationship with fairly
Multiple regressions are used to measure the relationship between demand and their
li~ctors that alli'ct i t . In tlicir stutlics on lilclwootl dcn~md, Amnclicr ct a1 (1 996), Ng7andu
( 1000) used mi~ltiplc rcgrcssion liln~tion to analyse the l'actors that infl~lence fuelwood.
'I'hey developed the model thus: Yd = J:(l'w, Oc, Ed, Fs, 13, Rc U) where:

C)c = Occupalion
I<ci l~~lllc~lio1l
1:s := I:rl~nily Size
1's - I'ricc ol'substitutcs
Rc = Place of resitlencc and
I -- 111-ror lcr~ii.
'I'llcy co~i l i~ .nu l t l ~ i l i t lcma~d Iwl~:~vioi~r of' Iioi~scl~)ltls dcpc~lcls prim:irily o ~ i thc
above variables.
1L~uris (I 070), in his work on llic "dctcrininants 01' encrgy usc" also employed
~n~ilriplc rcgrcssiol~ analysis. Ilc slatctl that (his ~noclcl was initially applied Sor tlic
demand 01' incliviclu;tl l i d s but it is legitimate to extcnd it to overall fuel demand. Jle
norctl rhat the inodcl relates to tlic hcl pricc, income and lcmpcraturc. l le i~scd tlircc
Si~nctional limns - li~iear, scnii-log, and douhle-log. Kouris remarked that among the
Sornis tried, douhlc-log produced tlic ~iiost ~ C U S O I I ; I I ~ I C r~si11ts accorditig to liic
conventional ccono~nic, ccononictric and stirtisticd criteria. Ilc testified that all the
variddcs had expected signs and were Iiigldy signiiicant as indicatcd by 1;-ratio and I<'
indicated a goodness of tit.
Therefore i n the present study. multiple regression analysis was used to determine
1hc li1c1ol.s lI I i11 ilrI1~1~11cc filcIwood clc111;111d ii11CI S I I I ? ~ ! ~ . '1 ' 11~ I.cWoI1 li)r 1 1 1 ~ C ~ O ~ C C 0 1 '
nlulliplc rcgrcssio~~ is Ix~sccl o i l rllc t l ~ l i ~ ~ l ~ i l ; ~ l i v ~ ni11ul.e 01' l l~c tlcpc~iclc~lt virriahlcs. 'l'l~c
heterogeneous nature of the explan'aki'ry 'variables further supports the choice of the
mulliplc regression analysis.
2.8.2 Miirltctirig margin
Marketing margin analysis is one of the tools used i n determining the efficiency of
~~iirrkcling syslc~n. Most rcsci~rclicrs ciiiploy lliis mclllocl in llicir analysis bccausc i t is
c i ~ s y 10 co~~i l ) l~(c . Mi11 hcli~lg 111i1rgi11 01' a co~i~~~rot l i ty is tllc tlil'lkrc~~cc hclwcc11 tlic pricc
paid by the ultimate consumer and thc price received by the producer, or it is the
diiTerence between the producer price (farm gate) and the retail price. It is also known as
the cliITcrcncc between the relail price and ~narketing cocl (Sidliu mid Rangi, 1979).
('osls ol'~n;~rkc*(i~ig l i~~lwood :iccordi~lg 10 I,C;ICII i 1 1 d Mcii~w (1088) include cost
price of li~elwood, transportation, cutting stacki~g, splitting of the log, security, storage,
londi~ig and oll-looding.

2.8..3 ross ~ n a r g i n
(;ross niargin ~ I I I ~ I I Y S ~ S lias l>cc~i li)i~nd to be :I vcrit:ibIc mici efTcclivc loo1 in
determining llic perlb-mawe as well as prolitability of' goods in marketing (Upton, 1996).
I t is rclkrrecl lo as the money tliat is available to cover lhc operating expenses and still
leave w prolil or it represents the difl'crences bclween total revenue and cost of goods sold
( I )owncq' and 'I'rockc, I08 I). ( ; IWS ~nargin is (lie cli Sf'C'rc~icc bctwccn total rcvcnue earned
and the variable costs incurred (Abolt and Makeham, 1980). Gross margin is very
i~nporlant to retail agribusiness (Suelwood inclusive) because such business has relatively
liltle conlrol over cost of goods sold. Secondly, flic prices of purchased agribusiness
goods arc the critical laclor afl'ccting its gross margin. An cnlcrprise with the highest
gross niwgin is of course tlic one hat contribulcs the mosl profit.
C;ross margin is rcprcscnlcct by the li)rmula:
G M - '1'R - '1VC
Where:
GM = Gross margin
'I'R = I'otal rcvcnuc
'I'VC -- 'Totill variable cost. . 1 , . . h l . -'' ' '
' I lie liiglicr the gross niargin, thc sniallcr is the proporlion nccdcd to pay for fixed
cosls, leaving more 1i)r niarkct profit. I S gross margin is Iiigli without al'fecting fixed cost
the market profit will equally be high by exactly the same amount as the gross margin.
I n llie analysis 01. their works, Okckc (lOi(8) i d Ogbuakmne (1998) used il lo
analysc tlic profit of rice and ollicr Soodst~~fl: 'T'liey li)und it to bc an effective tool i n
dctcrniining tlic prolitabi lily 01' rice and other SoodstuSl'.
2.8.4 <;iui cocfficic~lt
111 niarkct stri~cturc, criteria li)r classifying levels ol' niarket competitions include
nunibcr of firms, size of firms, the extent of product differentiation and level of entry
barriers. I l u t i n recent years, atlcntio~~ is being focused on market concentration as a
nicasurc ol' conipctihn i n niarkcting. ('onccnlration is the proportion ol' industry sales
11ii\<lc Ily its largest lir11is (Kollls anel \ 1111. 1072). Market concc~itration is mcasurcci by tllc
( i in i cocSlicicnt, (iitii coeSlicienl is a ni~mher hetwccn x r o and one that is used lo

Iiicnsure irlequality or dcgrcc ol' corlccntration of vurii~blcs in a markct. I1 is the ratio ol'
1 1 1 ~ ;lrcit ullcl~r t l l ~ . I.UI.CII% C L I I . V ~ 10 1 1 1 ~ iII.CiI U I ~ ~ C I ' the diag011aI 011 graph of the Lol.cl1~
C ~ I I . \ ~ C (Sen, 1081 ; blcC;ralh, IOOO). I I ranges hclwcc~l 0 wllcrc Ihcrc is n o concctltri~tio~l
(pcrl'ecl equality) and I wl~erc there is total concenlration (perf'ect inequality). Therefore a
cocl'licicnl ol' 0.2 represents a lower lcvcl oS inequality while a cocrficicnl ol' over 0.6
represents a situation where powerful elite dominate the economy.
(;ini ~~~~~~~~~~~~~nt is il powc~.I'i~I lool i~sctl i n nlcasuri~lg lllc lcvcl ol'compctition in
~ i~ i~~ . l \ c l . I<cscitrcl~c~~s cnlploy tllis 1001 i l l ~llcir analyscs I~ccai~sc il is simple and casy to
interpret.
Gini coeflicicnt is expressed as I'ollo\vs:
Where
G = Gini coefficient
X = I'opulation share
Y = I~icomc share
a>; - C u n ~ ~ ~ l a t e d proportion ol'tlie population variable
r3Y = Cum~latcd proportion 01' the i~lcome variable. 4 )
11 = Number of observatihlis'"" "
k - = n - l
In older for tile Gini coel'ficicnt not to become an ~~nbiased estimator for tlic
population cocl'licicnt. i t was ~nulliplicd by ~ / ( I I -1 ) (Mcgr;~tIi, 1000). , I
Morgan (1065) uscd Gini cocl'licicnt to analyse conccntration of retail firms lo
reflect interplay between the large firms in retail industries and many small ones. Also,
Oltcreke and Antlionio (1088) acloplccl Illis tool in a~lalysing the conccntration of
mnrkerers in grains. l'liey thllnd Gini-cocl'licicnt very cf'lkctivc in determining the degrcc
ol' conccntralion in [bod grain. 'l'licir linding indicated that tlicrc was higher degree of
concentration i n wl~olesnle than in retail level.

3.1 Slntly Areir
I:nugu state is located in the South ltast geo-political zone ol' Nigeria. The statc is
onc of the thirty- six states that constitute the Nigeria federation. Thc state was created in
Augi~st 27,1001. In 1996, the Abakaliki area, one of the three political and administrativc
'I'he state derives its name I'ro~n the capital city I h g u . 'l'hc city owes its gco-
political signilica~icc to the discovery ol'coal in 1900 by n tcam oL' British Geologists
( I ~ I I ~ ~ I slate C;ovcrnnient, 1909). The statc has an estimated total land area of about
8,022.90 sq. km (I:zilic, IOOX). It has a population ol' 3,257,208 with dcnsity ol' 208
persons pcr sq km, which is lligll wllcn compared with tlic average national density 01'
about 06 persons per sq. kni (NIT, 2006).l'he state has three important urban centres
namely: lhugu, Nsukka and Oji-River. -h
'l'l~c srnlc is niadc up of scvcntccn I ,ocnl Govcrnmcnt Arcas. For administrativc
and operational purposes, Enugu State Agricultural Development Programme (ENADEP)
divided tllc state into thrcc zones in line with tlic political zonal structure
(Er\fAD13',2004). 'l'he zones are Enugu East, Enugu West and Enugu North. Enugu East
comprises Ihugu North, 1<nugi1 I'ast. 13n11gu South, Nki~nu Ilast, Nkanu West and Isi-Uzo
1,ocal Govcrnmcnt Areas; Ilnugi~ WLisi"i9'niSdc up ol' 0.ji-River, Awgu, Aninri, 13zeagu
and Udi Ldocal Government Areas while lhugu North is made up of Nsukka, Igbo-Eze
North, lgbo-l'ze South, Igbo-Eti t i , Udcnu and Uzo-IJwani I,ocal Government Areas.
I<~lirgtr slnlc 1.ic.s cnlircly wit hi^^ I I W tropical zone at thc 1:ltitudcs 05', 56' and 07('
0 5 ' ~ i ~ n c l lo~lgit~~das Oh" 53' i111t1 07" 55'1< "(lizil&, 1908). I t is 1~i111dcd i n tlic S O L I ~ I I by
Abia, North by I3enue and Kogi States, to the East by lbonyi state and to the West by
Anambra state. Inugu state occupies ~nucli of' high lands 01' Awgu, Udi and Nsukka. 'l'hc
l~ills i11.c l1;111licA 11y rolling low I ~ I I I C I S 01' Oii-IXivw. A(I~I(I~I. ~ I I I C I A ~ ~ a ~ i i l m lx~sins 10 I I K
West and Ebonyi and Idodo basins to the East (Mbagwu, 2000). Apart from the chain of
t l~c I L W hills running thro~~gh Alx~knliki in I'honyi Statc to Nsukka in thc north and then
crossed by numerous rivers, strcams and lakes. The major rivers arc Adada, Oji, likulu,
Ihmyi and Riali while the lakcs arc 014. A~nagu~izc/Akpawfi~, Ditgudu and lhenekc
I h g u Slate has a tropical clilnate with two distinct seasons:
il. Wc-I hwnicl sailling seasol) hcgins in April and ends in October. 'l'lie State rccords
a lotal annuul rainl'all r'lnging l'roni 47.8Om1n to 877.18ni1n (I{NADEP, 2005).
h. Dry season starts in Novenlbcr and ends in March. Thc nionthly te~nperaturc in
ihc hottest pcriod of February to April is about 36.5"" while the coldest period is
l i un~ .ltl~ic -- .It~ly with a tc~npcralurc ol'about 28"" (liNAIlI:I', 2005).
'I'llc vcgc1;llicm 011 llw I~igh Ii111ds 01' Awg\l ilnd stsclclling lllrot~gh its promonlorics
to l ink undulating hills of Udi is the seini-tropical rain-Sorest type (Mbagwu, 2000). It is
chal.actc~~istically green and is co~nplc~iienlcd in the Nsukka area by typical grassy
\egeii)tio~i (Mbagwu, 2000). Some of tile grasses that doniinatc the area are Gamba grass
(Arirlropon gayanlrs), Punictrm mnximcr, spear grass (Itnperutu cylindricu). Also, both
wirllin I l l c r;linliwes~ i l l d si1vi11111ilI~ nmcs ol' illc state, (Ioliiin;~nt pl:mt S ~ C C ~ C S that arc usccl
as Li~elwood are many. Some of them asc herbs/slir~~bs (low grade fuelwood) -
I ' C ~ ? ~ . Y C I I I I ~ /W~/~IWL'IH, A ~ L I I W ~ ~ I I /~Jc . /O1~l l l l l , ( ' I I I ~ ~ ~ ~ C I I ~ I I ~ C ~ I ~ L I ~ ~ I . L I / L I , I I ~ l l u n / h ~ ~ s rinn11.s,
dry cilssavil slcm (Alrrrlihot c~.sc-l~lc~r~/t~), maize stcln ctc. Sonic trccs grown in this area and
are L I S C ~ its fuelwood include anlong others: 13a1nboo (Oxyternunthern abyssiniu),
ilkprrt4rrl~r ( A f i d i ~ crfricrrnrr), Oil bean trcc (/'en[uck/hru rnucr-ophyllu), African locust
bean (Porkirr higk~ho.scr), Courd trce (('r.cscen/in cujete), Dry zone mahogany (Khunu
scrregtrlvt~sis), African bread Sruit ( ~ ' ~ c L ' z I ~ ~ L I r!fi'icun~), N C C ~ (Azerdit-NC~IU indicu), Aciuu
htrrfc~ri clc (Nwutfc 1992; Okaliw 2000).
Predominantly subsisteri~'d'2gP~iultGre ranks first in the economic activities of the
people of Rnugu State. The pcoplc cultivate convcntional stnplc crops such as: yam,
cassava, ~naizc, sweet-potalo, grain Icguliic, paw-paw, banana, plantain arid vegetablcs.
I~lconic lium Linn is supplc~~~c~l lc t l by carnings liom salcs of ~ m d u c t s from local trecs I t . .
like oil palm, cashew, mango, kola-nuts, and castor oil beans etc.
3.2 S;rnrpling IDrococlu~-c
]:or the purposc of this study, cluster random sampling techniques was adopted.
i h . Selection of fuclwood I~arvestcrs:
I n ortlcr to get rlie rcquircd data, the li~elwood marketers (middlemen) in the urban
irrcas providctl tlic ~.cscarclics with il~li)t .mil~i~n 011 tllosc ~ L I I . ; I I ill.CilS wlicrc they source
their goods. 'I'lien, i n each of the three mnes of the state (Enugu East, Enugu West and
1hlg11 North senatorial zones) sa~~ipling fkmx of clusters - communities was compilcd.
'I'llc list sc-svetl as a sample I'ra~w ol'comnlu~lilics.

4 5
From the sample lia~iie made in the three zones, nine rural communities were
rirndol~~ly sclcctcd. ' l ' l ~ t is three co~n~llr~nilii-s livln cach zone. 'l'hc cornnlunitics chooscn
were Alnqji-Nike, Ilgwogo-Nike. and Amokpo-Agu in Enugu East zone. In Enugu West,
~hcsc com~iiunitics were sclcctcd Aliani-Aclii, Enugu-Agu Achi, and Mmam Ugwoba,
while thosc sclccted in Enugu North were Ilhu-Ndiagu. Opi-Agu and Obimo. Then Srom
each ol' the nine rural communitics selcctcd. 12 households that harvest and supply
fuelwood LO the ~iiicldlcmcn in thc urban arcas wcrc randomly chosen. 'Therefore a total of
108 houscholds that hal-vcst and supply li~clwood were selected and administcred with
cli~eslio~~naircs. 'I'hcsc communitics sclcctccl arc shown in table 3.1
Table 3: 1 : The sample
Zone Enugu East Enugu West Enugu North
Comniuni tics A~~ioqii-Nil,c Alinni- Achi : ha-Ndiagi~ Amokpo-Agu I hi1g11-Ag11. Obimo Ilgwuogo-N ikc Achi Opi-Agu
Mmam Ugwoba
Respondents 3 x 12 3 x 1 2 3 x 1 2 108
b. Selection of fuelwood middlemen:
I:or thc sclcclion ol' thc riiicldlclllcn, tliscc urban centres wcrc sclccted namely
llnilgll, Nsukl.ii~ illld Oii-River. 't'l~?!:ts"h~Cf~usc i t is i n the urban arcas [hat lhe middlcmcn
a1.c c o ~ ~ c c r ~ l l ~ ( c d . Scco~rdly L I I ~ I I 1~0p Ic itcj)c~~eI l l ~ i l ~ i l y 011 pi~scliascd I ~ I C I W O O C I as most
oC them do not have the opportunity to sourcc thc fitelwood by themselves:
Selection of wbolcsalers: In thc urban centres, fuelwood wholesalers usually stay
togcther 31 sonic 10~ilti01ls with large si>c ~l.hc;lps oS lilelwood. 17hcir staying togethcr
makes them form associations. For the selection of thc wholesalers, cluster random
si~lllplil~g \ v i w t~scvl. I'l~c [ ~ r l ~ a ~ r rlwl.l,c.~s 11sc~1 libr tllc stucly were Abakpu Nikc I:llugu,
Nsilkka urkm and Oji-liivcr i11.bn11. 'l'lw scgistcr ol' the li~clwood association 111 cach 01'
the clustcr ol' the urban centres was used as a sample frame. From the register, 17
rcspondcnls wcrc rancloml y sclcc tccl us Sucl wood who lcsalcrs. 'Therefore Srom the three
urban ccr1lrt.s. 5 l wholcsalcrs wcrc randomly choscn and administered with
qucslionnaircs. 'I'he silmpl~ is sllown in tublc -3.2

Table 3 2 : 'i'hc samplc
Zone Enugu East Enugu West Enugu North
I Irban Ahnkpu-Nikc Oii-l<ivcr. I I I ~ I I I I:r~clwood Mir~k~Ls I.'LIcI wood I'uc.i wood Marketers
Markctcrs Asso. Marketers Asso. Nsukka Enugu. Asso. Oji-River
Respondents 1 x 17 1 x 1 7 1 x 17 51
I. Sclcction of rctailcrs: 111 the urhun ccnlrcs li~elwood retailers were often seen
scattcrcti in thc strccts with small sizcs of hcnps of f'rlclwood. Por thc sclcction of the
clustcrs 01' li~clwood rctailcrs uscd lijr the study wcrc Abakpa Nike Enugu, IJgwunzu in
Oji-River. and Odenigbo in Nsukka. A list of'the fuelwood retailers in the clusters was
compilccl to serve ;IS a srr~iiplc liw~ic. 'l'hcn li.oni the list compilcd, 17 respondents wcrc
randonily clioscn fiom the saniplc fr;lrnc ill cnch of llic urban arcn. Tn the thrcc ilrban
areas, a totr~l ol' 5 1 rcspondcnts (rctailcrs) were sclcctcd and scrved with questionnaires. - I licrcforc, in a11 102 rniddlcmcll were ilsccl li,r the study. that is 5 1 wholcsalcrs and 5 1
retailers.
c. Selection of fuelwood consumers: I lcrc clustcr random sampling technique was
employed to select the fuelwood uscrs. In tlic urban areas, thc clusters of fuelwood uscrs . . ,,,. \,. . " 8 '
werc matlc. 'l'hc cluslcrs of cofiR~hier:;'~~scd are as contained in clusters of retailers. From
the clilstcrs :r list ol'liouscliolds t l l i ~ t ilsc li~clwootl was compilcd to scrvc as sample fr:rrnc.
In each 01' tlic u~-h:~n ccnlrc. 44 ho~~scliolds were randomly sclcctcd. Tlicrcforc as 44
liouscliolds wcrg sclcctcd in c x h 01' the urba~i arcas, the three zones gave a total 01' 1 32 , I . .
households that were chosen and served with questionnaires. The table of samples for
retailers and consumers is shown in tahlc 3.3
'I'ahle 3.3: 'l'bc sltmplc for rct:~ilcrs :~nd consumcrs
-
%o 11 c 1Snugu 15ast Ihugu Wcsi IZnugu North

In llic st1rvc.y co~id~~clccl. 342 rc.spo~itlcnls wcSt.c sc.~vctl will) qtlcslionn:~ircs (ic 5 1
wholesalers, 5 1 retailers, 132 l~ouseh~lds us fuelwood consutncrs anti 168 as fuclwood
I M ~ V C S ~ C S S ) .
A1 llic end o f tlic dirtit collection. ou t of lhc 132 copies o f clucslionnilircs 1Iiii1 wcrc
clistribi~tccl to tlic consunicrs, only 120 were returned. For the middlemen, 102
qucstio~~iiaircs wcrc distrihi~rctl IWI only 00 were rcli~rnctl. wliilc 00 questionnuires wcrc
r e ~ ~ ~ r n c d ti-on1 tlic liwlwood liarvcstcrs out o f 108 that wcrc dislribulcd to them. The total
~li~lnhcr ol' cl\lcs~ionnnircs that was rcturnctl :~ntl used Sor thc stucly was 300. This number
is 88 pzrccnt of total number of questionnaires that were dislributcd in the field.
3.3 Mcthotl o f I h t ; ~ Collection
I h t a needed Ibr [he sludy were eollccted from primary sources. Primary data were
oblai~lctl by i~sing qilcslionnaircs. interviews and direct observa1ions. There were threc
sets ol'qucslionnaires, one set was administered to the fuuclwood harvesters, another set to
mitltllclncn alitl thc otlicr scl to llic consumers.
Data for the harvesters includccl alnong others: socio-econon~ic characteristics of
licatls 01' Iiouscholtls. typcs 01' wood gallicrccl and supplied, cluanlily 01' luelwood suppIied
per period, lahour time spent in collection, dislancc lo llic area ol'collcction arid supply.
means and cost 01' transportation, period of greater ,:riles, major consumers of fuelwood,
~ilouthly income ant1 price ol' Ii~clwoorl per tonne li)r cucli month ror the period April
2004 to klarcli 2005, and problcnis~ol;~l;irrslwnotl supplies.
I:or Lilelwood middlcmen, information for them included: source of the products,
purchasing and selling prices per tonne li)r cvcry month hctwcen April 2004 to March
2005, transl'er cost, marketing channel. socio-economic characteristics of household heads ( I . .
; I I ~ (lie ~ ) ~ x h l c ~ i ~ s ol' I'\~clwootl ~liarhcti~ig.
For thc filelwood consulncrs, thc data collcctecl from the fuclwood users included:
socio-cconomic cliaraeleristics ol' h e household heads, acccss to alternative source of
cncrgy. priczs of li~elwoocl a~lcl li~clwootl siihstitutcs, clilantity ol' li~clwood uscd weekly
and ~iwntlily h r thc period uiidcr study, and problems of luelwood consumption.
3.4 Method o f 1ht ;r Analysis
I)esc~.iprivc slalislical ~iic.tliotls \lsi~ig pcrcc~i(agcs. nicilns and frcq~~cncy
distriktrtioil were ilsrd lo andyse ol?jectives (iii) and (vi), and parts of objective (i), (ii),
(iv) and (v). Objectives (iv) a id (v) were rcalised with regression analysis while parts of

objectives (ii) were analysed with marketing and gross margins analyses and part of
objcclivc (i) w a s nnalyscd will1 ( i i r l i c.oCl'licicwt.
I lypothcscs (i) and ( i i ) wcrc tcslcd with dill'Crcnccs bctwcc~i two lncans at 0.05
level of probability. Hypotheses (iii) and (iv) were also tested with F-text.
The results of (v) and (iv) werc cvnluatcd by suhjccting the estimates to both statistical ? atid cccmmclric lcst. 'l'hc Icsl slalislics llsc-cl wcrc I< . lix ~iicasuring tlic goodness ol' lit
and 1:- text lbr measuring the ovcrall signilicanct: ol'each regression coef'ticient.
3.5 Moticl Spccilicirtion
3.5.1 Multiple rcgrcssious
Regression model was used to estimatc the quantity of fuelwood demanded and
supplied a s a iimction of the various factors.
I:or dcinand analysis, the lbnction w : ~ represented implicitly as Sollows:
(1) Yll !.(I Is, I l l , l'w. 1's. l< l I , [ I )
Where
Ytl Qi~unlity ol' l'i~clwootl t1cl1la11clc.d (Kg)
1 Is = I louschold size (numbcr)
In = Income (#)
1's --- I'riccs ol'li~clwood suhstitutcs silch as kcroscnc and cooking gas (#) 4 . 4 wl. .?' .,?
Ild = lducational lcvcl X t h c household hcad (years)
( 1 - Stochastic or error tcrnl.
For supply analysis, the functioli was represented implicitly as follows:
(2) YS = f(Ag, Ms, Ms. Ed, Ct, Lt, Dt, Pw,.In, U) 11
Where
Ys - <)u:~ntity ol'lilclwooc! supplied (Kg)
Ag Agc ol'thc lilclwcrcd Ili~rvcslcrs (years)
Ms = Marital status ol'thc liarvcstcrs, dunimy variable was used '1'
li)r married '0' otlwrwisc.
1-1s = I lousehold s i x (nunibcr)
Ed = Educational level (number)
('t - ('ost ol' t ~ : ~ ~ i ~ p ~ r k ~ l i t , n (N)
1 ,I I .;ihor~r time (110i1t-s)
111 I ) I S ~ L \ I I C C travcllcil ( l i m )

I'w - I'ricc ol' l'ucl wood ($4)
In = Income of the harvestcrs (N)
I I I ;1.ror tern1
'I'lic two n~odcls demand alld s ~ ~ p p l y wcrc rcprcscntcd explicitly in thrcc
li~nctional liw~iis linc:lr, scnii-log and tloi~hlc-log to test the relationship bclwccn the
Model 1: For demand analysis, the linear, semi-log and double-log forms are given as
statistical and ccono~nctric critcria such as Lllc values of tlic cocfficicnt of dctcrmination
(It2), 1:-tcsl, I-vali~cs ;~nd signs :IIKI ~i~;~glliti~tlc 01' lllc rcgrcssion cocflicicnts, only the
double - logarilhmic 111odcl out 01' tlic thrcc lilnctional specifications of the rcgrcssion
consistency of signs of coefficient with ~ p r i o r i expectation.
For demand analvsis, the following explanatory variables are expected to have
pjsitivc signs: sin- ol' ho~~scliolcls ;111tl ~xic'c-s 01' li~ci\vootl subslilittcs wliilc lcvcl 0 1 '
inconic. prices of litclwood and 1c.vc.l of' c8tl11c;rtion arc c.xpcctcd to h:ivc ncg:ltivc signs.

3.5.2 Rlurlicting margin
h,l;wkc.ling ~niwgin is thc clill'crcncc hctwcen the price paid hy the consumers ilntl
that ohtaincd by the producers (Tomek and Rohinson,l990).
I'llc ~n;rrgi~ls 01' thc ~nitlcllc~~lc~i c~lgagcd i n li~clwootl distribution in Ihugu stale
were calculated by deducting purchasing pricc per tonnc li-om sales prices of fuelwood
per tonne. 'The weight was obtained by weighing the fuelwood. 'l'he computation was
lu~sccl on weighing six pick-i~p loilcls 0 1 ' li~clwood. 0 ~ 1 1 01' tlic six pick-loads wcighcd,
tllrec were hard wood whilc others \vcrc light wood, tlien tlie average was taken. Pick-up
load u s d here was the type that the load ol'the wood was supported with sticks
'I'he pi~rcliasing and sclling rriccs wcrc obtairicd by finding the average prices
given by eacll ol' lllc rcspo~idc~lts liw tllc period 01' April 3004 to March, 2005. '1'1uc
priccs wcrc later summed up to obtain the grand mean. 'l'he marketing costs werc
obtained by the summation of the various component of costs incurred. These costs
incli~dcd: transportation, loading and off-loading, security. storage, association's dues, :oil
t';.cs, local govc.~~~~i lcnl rates, c i ~ ~ t i ~ ~ g , cost ol'splitti~lg tllc woocl logs anel stacking.
'I 'he calculation of the margins 01' the participants werc determined th~ls:. , . I lie harvester's receipt is 1hdpr.ke at which thc wholesalers and /or retailers buy
li.om IIic liarvesters.
' I Ilc clil'l'c~~c~~cc I~c~wccn t l~c Il;~r\~cstc~.s'~narkcr p-ic:c 01.8 t o ~ ~ n c 0 1 ' I'i1c1wood i1110
wllolesalc price of a tonne of fi~elwood was the wholesalers' receipt per a tonne of I ' . . lidwood.
I I I C (Iil'ILrcl~c'c hctwc~e~~ rCt;\il pric'c I,cr a 1on11c 01' li~clwoocl and thc wholcsi~lc
price per a tonne of lirclwood I-cprcsented tlie retailers' receipt per a tonnc 01'
li~cl wood.
<; r o s s margin1
I'rolitahility of li~elwoorl in tlic slutly area was computcd from gross margin.

1i1clwc)ocl by c d i participunl was gottc~i. 1*1.01ii thcrc, ~ i ~ r i i t b l ~ costs i~icurrd in the course
01' scllilig Illc li~clwood wcrc i~lso sun~~nctl u p and dcdi~ctcd li-om the total rcvcnuc
rcali/.cd. I'hc variahlc costs ~ c d in tllc sludy wcrc p~rrchi~sc: pricc (cost pricc), cost of'
l~ . i~~~s l~o~. l :~ t io~i . loding, t)l'l'-l~)i~~Ii~ig. scct~r~ly. storage, splil~i~ig of' logs, wsocialion di~cs,
cutting, stacking and toll fees. From the calculation made, fixed cost was deducted from
gross nlargin to get the net profit. The fixed cost used were rent, local government rate,
dcprcciutiou on Iwrow, axc untl rnatchct.
I . CiM --'lT1<-'I'VC
NI' = GM - I'C
M41crc (;M = Gross Margin
I 'I'otul Ihxcni~c
'T'VC - Total Variable Cost.
I T = I:ixed Cost
NI' : Net l'rolit.
3.5.4 (iini coct'ficienl
Gini Coefficient is a number between zero and one that measures the degree of
inequality in the distribution of income in a society (Wikipedia, 2005). It measures the
degree of concentrhm of a v;~rinhlc i n the distrilwtion of its clcments. The Gini
cocllicient ranges between zero where there is no concentration and one where there is
cc~ncc~ilrnl ion. ..,4.,wl.,,. , . ,> .
In order to find the concentration of the harvester, wholesaler and retailer in the
li~clwootl niarltct i l l Ilnugu stale, ( i i n i cocl'licicnl wits cmploycd to calculntc i t . Tlic
computation here was based on the sales revenue generdted by the harvesters, wl~olesalers
and ratailcrs. The revenue realized by e&h mirket participants in each zone of the study
area for the pcriocl of 12 months (April 2004 to March 2005) was added to get the total
sum 01' ~noncy rculisccl in each yonc. 'l'lic~i 1111 tlic rcvcnuc I'rom the Lhrcc zones by thc
pi~rticilxints wcrc addccl topethcr to gct thc lotal sum generated i n the marketing process.
'The total revenue realized from thc three zones was used to divide the revenue
horn each zone i n other to get thc market share of the middlemen in that zone.

Where
<; <;i11i <'ocl'licic~il
X - - I'opi~lalion sharc
Y - Salcs rcvcnuc share
(3s ( ' U I I I [ I ~ : I ~ C ~ 1m)l~or(io11 o I . ( I I L . l>o1~111:1~io11 v;~ri:~I)lcs
(3Y = Cumu1;tted proportion ol'salcs rcvcnuc
n --- Numbcr oS obscrva1.ion
k - n - I
'I'Iicrcli)rc i n ordcr li)r thc ( i i ~ i i cocl'licicrit not to become unbiased estimator Sor
p o p ~ h t i o ~ i c~~ l ' l i c i c~ i t , il WilS 1lii11 tiplied I>y 11/(1i- I )
Whcrc "n" is the nunibcr oSobsc~.vatiotls.
3.5.6 Test of difference betwecn two means
In ordcr to determine whether tlicrc were diffcrcnces in the profits of the fuelwood
harvesters and middlemen, test of difference between two means was employed. The test
, of cli ll'crcncc hctwccn two I I I ~ ~ I I I S W:IS C ; I I C L I I I I ~ C C I 10 ~ C S ( the I~ypothcscs at 0.05 levcl ol'
signi lic;wx with thc dcprcc o f liwclom (dl) i\s V 11,-1-nl-2
'I'he compirtational formula is shown below: * , , , . . w I.,, . .%a
I s,' s:
Where ,I _ ..

4.1 Socio-cconomic C:l1:~1*:1eteristics of liuulwoocl M;r rltct 1% rticipants
Socio-ccononiic cliaructeristics considered in the study include gender, age,
rilarital statits, levcl of education, occupation, liouseliold sizc, level of' income and years
of experience acquired in the business.
Gender of household head determines to an extent the business the household
would engage. This is because there are some bi~sinesscs that arc gender biased. Table 4.1
slwws the frequency distribution o f (i~cI\vood ~iiarkct participants according to gender of
l'ublc 4.1: I)istrihution of fuclwood lwrvcstcrs, wholcsalcrs and rctailcrs according to gender.
Gender liarvestcrs Wholesalers Retailers
Freq. Percentage Frcy. Percentage Freq. Percentage
Source: Field survey, 2005.
Table 4.1 shows that 76% of the liarveaters were males while 24% were females.
'I'liis implies that fi~clwood supply is dominated, by males. 'l'liis could be attributed to the
nature of fuelwood soilrcinp which involbes tlie act of cutting and transportation of the
hcavy wood log. l'liis work is niore energy demanding therefore it requires more males
41.2 Agc of the filclwootl market pirrticilxrnts
1:uclwood business ha:; been Sound to be human labour intensive and due to this,
licoplc ut active labour agc arc cspcctccl to be actively involved (Ijang, 2000). 'l'liis fact
prompted the researcher to design a questionnaire that required fuelwood market
participants to indicate tlicir ages. Iklow is the result ol'thcir responses.

1'rll)lr 4.2: 1~1-equc.1icy clintril)vtir)n o f fuulwoocl ~nr~rltrt pnrticipnnts nccording to ugc. - - -- - . -- -
Age (in years) Harvesters Wholesalers ltetailers Frcq. I'crccntegc Prcq. I'crccntagc Frcq. Percentage
Less than 30 - - - - - -
30 -- 3 0 I 0 2 1 8 18 9 20
40 - 40 32 36 15 3 3 I5 3 3
50 - 59 27 3 0 16 3 6 15 3 3
60 - 09 7 7 4 0 5 1 1
70 and above 5 6 2 4 1 2
Source: Field survey, 200S.
'fable 4.2 shows that the majority of tlie harvesters, wholesalers and retailers fell
withill tllc. i\gc Iwackct ol' 30-50 ycrlrs. 'l'l~is age gr011p i~ccotlntctl liw 87%, 87% and 86%)
of tlic total rcsponclcnts rcspcctivcly. 'I'liis was followctl by tlic age group of between 60-
69 and 70 years and above with 13%, 13% and 14%) ol' liarvcstcrs, wholesalers and
retnilcrs rcspcctivcly. The least in the structure of age distribution was the age group of
less than 30 years, which no rcspondcnt was recorded. 'l'lic result showed that fuelwood
business in tlie study arcit was cloniinatcd by tltc pcoplc ol'activc lahour agc (30-49 years)
thereby supporting the above finding of Ijang (2000).
-1.1.3 Mirrilirl Sti1111s of tltc I ! ' IJ,c'~' IY.uOJI. ,~~~~~~ P;rrlicip:tnts
'I'lic analysis 01' marital status is necessary bccausc wolncn and cliildren arc
soi~rccs 01' li~mily lahour and provitlc ollicr important socio-economic functicms in tlic
economy ol' the 1Bmily. 'I'he niarital status of the Iuelwood market participants was
studied. 'l'hc result or tllc stud;, is slwwiio in tr~ble 4.3.
'I'uble 4.3: Frequency distribution of fuclwood harvesters, wholesalers and retailers irccording to marital sttrtus.
Mibriii~l S ~ ; I ~ I I S I lur\~cslcss W lrolcsirlcrs I<clailers Frcq. Percentage lireq. I'erccn tage Frcq. Percentage
Single 10 1 1 - - 6 13
Married 65 72 3 5 7 8 28 62
Widowed 15 17 10 2 2 1 1 24
Divorccd - - - - - - PA- -. .
'l'of i l l 90 100 J 5 100 45 100
.St'r,rrrr.c*: I * ' ic . / r / . v r r r ~ ~ r : r * , 200.F.

'I'i~blc 4.3 contains tlic licclucticy clist~~ibution ol' market participants according to
n~aritnl status. Thc findings ind~cnte tlint liugc proportion of the snmplc (72%, 78% und
62%) of tlic harvestcrs. wholcs:~lcrs ;lnd rclailcrs rcspcctivcly werc marricd while 1 7%.
22% : I I I ~ ! ?-I"o 0 1 ' 1 1 1 ~ I I : I I . V L ' S ~ L ~ I \ . \ V ~ I O ~ L ~ ~ : I ~ L ~ I ~ S i111cI I ' C ~ ~ I ~ ~ C I ' S were WidOWs. ' ~ ' I I C S C Wcrc
followed by 11% of' liarvcstcrs :tnd 13% of the retailcrs that were single. None of thc
respondents claimed to be divorcee. The result shows that large proportion of the , . rcspondcnts wclv ~iiarriccl. 1 hc high pcrccn1;igc rccortlcd in "mnrric~l" coulcl he t l i i l t
married coi~plcs have 11iorc number ol' pcoplc in the Iioi~sclioltl, and tlicsc pcoplc assist in
the li~clwood trade. 'l'hc assista~icc ol' llic pcoplc givc positive relation with cconomic
profit in tlic filclwood business.
4.1.4 Lcvel of education of the fuelwood market participants
An individual's level of Ibrmal education has a bearing in his business, because it
will help him to make a right choicc 01' husincss and still assist him to gain more
knowlcdgc on how to nianagc t ! ~ husiticss succcssl'idly. 'I'hcrclbrc thc respondents' level
01% li)r~ii:~l ~du~x1io11 :IS ob~:~ i~~cc l i l l 111c s111dy ilt'C:\ is S I I O W I I i l l 1:tI)lc 4.4.
Table 4.4: Distribution of fuelwood hrtrvcsters, wholcsalcrs and retailcrs according to level of formal education.
.: Lcvcl of Education. I larvcstcrs W llolcsalcrs I<ctailcrs
(Number of years) Frcq. I'crccntagc Frcq. I'crccnti~gc Frcq. Pcrccntagc
No Ihrmal cducation 1 3 ., ,, .'. *lI q . . o* ' - - - -
14- 18 7 8 . 10 22 3 6 , I . ..
Ahovc 1 8 - - - - - Total 90 1 00 45 100 45 100
Source: I M c l survcy, 2005.
'I'hc distribution in this t ~ ~ b l c shows that the mqjority 01' the l~arvcstcrs who madc
up 60% of the satnplc spent 1-6 years i n fimnal cducation. This was followed by thosc
who spent 7- 1-7 years. 'l'hc latter constituted I 8%) ol' the sample. 'l'hose who spent 14- I X
years made up 8% ol'the harvestcrs while none of them attained above 18ycars.
Also, large proportion ol' tllc wliolcsalcrs (65%) and retailers (67%) spent 1-6

7-18 years. Tlie overall result showed tlial most of the f~relwood market participants had
low lcvcl ol' cdueation. 1:rom tlic oral i~itcrvicw conducted in the Iield, it showed that
most ol' thc participants who spcnt 7 ycars and above in fornial education vvere civil
service retirees. The implication of the low level of education recorded by the majority of
tlic pnrticip:mts is that i t will bc :~l'li.ctiug thc ninnagcrial and organizational ability ol'tlic
individuals i n the operation oi'tlic husincss.
4.1.5 Occupirtion of fuclwootf mirrltrt p:rrticip:rnts
1'1.i111ary occi~lxitio~~ is [ I I C o c c i ~ p t i o ~ ~ i l l which l~oi~seliol~ls s p c ~ d 75?4 and 111orc 01'
tl~cir ti~itc :\~ul li*o~ll wllicl~ tllcy CXII :i grcatcr p~.oporLio~i ol' tlicir income (Iklicbiri, 2001).
The respondents were asked to indicate their main occupation where they generate most
of tlicis income. Tlic rcs~llt ol'tlicir i~iilicalio~l is S ~ O W I I i n table 4.5
'Table 4.5: I)istrilwtion of Strelwoocl I~irrvcsicrs, wlrolcsirlcrs itnd rctsrilcrs ucxrding to primary occupation of the respondents.
Farming 86 96 - - 2 4
Trading 3 3 4 3 9 6 22 49
'Teaching I 1 - - 5 1 1
Civil service - - 2. 4 14 3 2
- - . -
Sorcrce: Field survey, 2005.
'I'l~c prinlury occi~paliolr clistril~utio~l 01' l l~c Iia~.vcslcrs shows that ~li~!jority (00%)
or tlicm werc l'armcrs whi lc tlic rcmrii ni ~sg-wcrc tradcrs (3%) and teachers ( 1 'YO). Fanners
bcing ~11c 111qjority ol' the li~clwoocl I~i~~.vcstcrs cot~ld have rcsultcd from thc ['act that lhcy
intligcnous to the co~llmunitics h v c xccss to tlic nutur:~l Sorcst and open rmgc land
without restriction or cost.
For ~iiiddlemcn, 96%) 01' wholcsalcrs were traders while the remaining 4% were
li.0111 otlicr prol'cssions. 'I'his in~plics that the wl~olcs;~lcrs arc Sull t i~nc business peoplc

'l'he table also shows that 40% col'tlie rctailers are traders while the rest (51%) are
in otlicr professions.
4.1.6 flousehold size of fuelwood mirrkct participants
Ilouschold size has a very important bearing in the household business and
inconic. 'This is bccnt~se i t is assunicd t l i i ~ t ;I b~rsincss that is labour intcnsivc requires big
I~ot~scliolcl s i x that could provide the lahour a1 least cost. 'I'hc household size of those i n
li~clwootl Iwsincss in I~~iugu State was stdiccl and this is sllown in table 4.6 below.
l ' i~ l~ lc 4.6: Frcqucncy distrihulion of I-cspontlcnts ;rccorcJing to Ilouschold size.
I louscholtl llarvcsters Wlrolcssiers I<etailcrs sizc I'rcq. I'crccntagc I'rccl. I'erccntagc Freq. I'crccntagc
Total 90 100 45 100 45 100
Soiirce: Field siirvry, 2005.
Table 4.6 shows that 48% of liarvcsters of fuclwood hat! household size of
bktweeii 6-10 persons. This was lidlowed by harvesters with household size of 1-5. This
constit~~tcd 40'% ol' tlic total. I Iarvcstc~x with I ~ ~ L I S C I I O I ~ I s i ~ c ol' 1 1-1 5 persons had 12% of
thc sa~nplc. 'l'hc tablc also indicntcs.lliat houscliolds with 16 and above members did not
participate in the luelwood business. 'l'he foregoing result indicates that 60% of the
I i i~rvc~tcr~ had liouscholcl sizes that rungccl bctwccn 6-1 5 persons. This implies that
despite (he perceived high rates of rural to urban migration, households are still quite
large in the rural areas of the study. This nay he attributed to the high unemployment rate
in the urhan areas.
I'or thc micldlenicn, tllc tablc shows that 3 1% ol' the wholesalers and 45% of the
rctailcrs tiad houschold si/c ranging l'rom 1-5 persons. I t l'urther depicts that 64% of
wholesalers and 53% of retailers had households with size ranging from 6-10 while
I~c,uscl~oltls with si/c 1 1 - 15 pcrso~)s wcrc cluitc l'cw mcl consti(~rtcd ahoul 5% ol'
wl~olcsai~rs aid 2% rctililc~~s. 11) tlw S ~ I I I I I > I C S I I ~ V C Y , tIw o v c r i ~ l l rcsult depicts that largc
proportion ol'the respondents had large sizes of household. This implies that fuelwood
husiness ~ieccls large size ol' hoirscholcl hccause the traclc is energy demanding, llicrel'orc,

4.1.7 Monthly incomc lcvcl ol'tllc fuclwood rnarket participants
l llc i~rco~iic lcvcl ol' all i r i c l i v i d ~ ~ ; ~ l J I ~ ; I ~ S viI;ll I.OIC i n clclcrtiiining the typc of'
business one could engage in. 'l'liis is bccausc the level of income can determine the size
of the bilsincss. Thus, the l'rcclucncy clislri bution 01' nionthly income from primary
occupation of market participants is shown i n table 4.7.
Tablc 4.7: 1Xstribution of fuclwood harvcstcrs, wholesalers and retailers according to rtiontlrly Icvcl of income.
Lcvcl of Income Harvcstcrs Wholcsalcrs Rctailers
(#) Frcq. I'c~.ccntsgc Frcq. Pcrccntage Frcq. Pcrccntagc I.css than # IO.000 39 4 3 X 1 X 2 2 4 9
#lO,OOl - W20,OOO 27 3 0 16 36 17 3 8
#40.00 I :1111l ;llIcIve - 4 0 - - Total 90 100 45 100 45 100
Source: Field srrrvqy, 2005.
Table 4.7 shows that large proportion (73%) 01' li~elwood harvesters ikll within
inco~iic Ic.vcl of #420.000.00 or. Icss w l ~ i lc 27% ol' tlic~ii turn nlonthly inconlc 01'
PC20.00 1 .00 and abovc. 'l'hc result tl~crel'orc indicates that tlic majority ol' the harvcstcrs . < , , . , . I . ,?. 9 >.,* '
fel! within the low income level. The implication of this is that more trees will be
exploited i n order to gencratc more or liiglicr income and tlie ovcr - exploitation of thc
trees poses a great danger to the environment.
About 54% of thc whole~alcrs,~wcrc.: within tlie income of W20,000.00, or less
or less while llic remaining 13% wcrc i n rhc i~lcomc lcvcl of P120,001.00 and abovc. 'l'hc
result of income level of the middlemen still shows low level of income among them. The
low Ic.vcI 01 ' i ~ l c o ~ ~ l c would Ilavc in~pi~ct 0 1 1 [lie b~~sincss. 'l'his is hccausc i t may consIrain
tlie niitld1cn-rc.n Srom purchasi~ig large quantities of S~~clwoocl and this can :~fSect thc
volunic ol':lic trade.

4.1.8 Marketing cxperiencc of fuclwood market participants
Years of cxperiencc ol'an cnlrcprcncur in busincss hnvc important bcaring in thc
entrepreneur's success. Thcrcfore the importance of experie~icc in a venture cannot be too
strcsscd. 'l'llc ycars of' the ~narkcting cxpcricncc ol' tlic rcspondcnts wcre studied, and this
is shown i n table 4.8
l':lldo 4.8: Ihtrihntion of fuelwood h:rrvcstcrs, wholcsirlcrs and retailers according to markcting cxpcricncc.
N L I I I ~ I ) C ~ o f ~ C I I I - S I lirrvcsters W lrolcsi~lcrs I<ctailers Freq. Percentage Freq. Percentage Freq. Percentage
I ,css 111at1 4 40 5 4 20 4 5 24 5 4
Total 90 100 45 100 45 100
Table 4.8 shows the fi~elwood marketing expcricnce of the participants in the
study area. 'l'lie result depicts that 84% of'the harvesters, 96% of the wholesalers and 96%
o!' the rclailcrs I'ell wi(hit1 tlrc range ol' 1 - 10 ycars ol' nl;~rkcting cxpericnce. 'l'his was
followed by 1 1-1 4 years of experience which constituted 16% of harvesters, 4% of
w h ~ l c ~ i \ l c r ~ and 4% of' rctnilcrs rcspcctivcly. 'Thc ovcroll rcsi~lt for Ilic participants shows . < , , . . h l . , , ' . , ',. .
that they have not had long ycars of cxpcricncc i n thc busincss. The effect of this may be
lower prolit earning than tllosc who have l w g ycars ol'ccpcricncc i l l the business.
4.2 Socio-economic Characteristics of the Fuelwood Consumers
The socio-economic characteristihs of .the fuelwood consumers included in the
study were: niarital status, level of education, household size, occupation and income of
lhc Ilousclroltl.
4.21 Mirrital status of tlrc fuclwood consumcru
I n Aliican society, the marital status of a household has a bearing in the family
~noclc 01' consumption, as niarrictl people olien have large I'aniilies and this invariably
ali'ccts tllc ~iiodc 01' consu~iiption in the family. Table 4.9 shows the marital status of
fuelwood consumers in the study area.

'I'nblc 4.9: 1)islribulion of the rcqwntlcnis according lo i l~cir m;rriial status.
Marital status Frequency Percentage
Single
Widowed 9 24
Solme: Field survey, 2005.
'I'i~blc 4.9 shows that 72?4 of the respondents wcre ~narricd, followed by the
widowed (24?4). 'l'hc clivorcee constitutccl 3%) ofthe total whilc the least pcrcentagc (2%)
rccorttccl canw liom t h e w lh;~t wcre single. 'l'he ovcrdl rcsult showed that large
proportion of the Suelwood consumers were married. 'l'hc implication is that married
couples often have high child and relation dependence ratio, which implies high
consumption.
4.2.2 Lcvcl of formal education of tlic fuclwood consumers
An individual's Icvcl of education is very vital to his mode of energy - .
consumption. I his is i l l t r i l > ~ ~ I ~ ' ~ i to the f;~ct ( I ~ a t marc yCi1l.S o 1' edi~c;~tion do lead to highcr
income hccause the likclihoocl of improvcmcnt increases as a person scales thc . < , , . . * I . , , ' . . a + '
educational ladder (13radley, 1002). 'l'hc tablc 4.10 shows the level of formal education
attained by the respondents.
'I'al)lc 4.10: I)islri.l)l~lioa o f I~'l~clwoocl users accorcliag lo Icvrl of formal cclncation. -- - --
Levcl of Education " ' Frequency Yercentagc (Number of years)
No formal education 20 17
L . i i r ce : Field survey, 2005.

'I':~blc 4. 10 shows lllc li.cqucncy clistribulion ol' lilclwood users. 'l'hc table shows
that thosc who spcnt 1-6 years in Ibrnial cclllcution wcrc 53%. This was followed by those
that h:td no l i~rnia l cdc~calion ( I 7'!4). 'I'lli- rvspondcnts who spcnl 7-13 years i n limn;~l
cclucation constituted 15% wliilc tliosc. wlio spc111 14- I X yc;lrs rccorc1ccI I3'% ; ~ l i c l 1l1c I C ; I S ~
(2%) wcrc those that spcni above 18 ycars. 'l'hc rcsirli from the frcqucncy table shows that
with more number of years spent in education, the less the fuelwood users.
4.2.3 Household Size of fuclwood consumers
I louscl~old s i x ol'any lilnlily is vcry inlporlanl licelor in dclcrmining the lcvcl 01'
prodwtion nntl consr~~iiption. I t is ;~ss l~n~cd t h t large houscholtls lcncl to consume large
quantity ol 'u product. In the st~lcly area the houschold s i x of those that use fuclwood was
studied. The result of the study is shown in table 4.1 1 .
l'ablc 4.1 1 : IXstribution of I~uclwood Consumers according to houschold sizc.
Household size Frcy uency Percentage
1 - 5 40 3 3
16 and abovc I 1 t
Total 120 100
betwecn 6-1 0 persons. This was I'ollowcd by 33%) of respondents with houschold ranging
li-om 1-5 persons. 'l'wcnly thrcc pcrccnt. ol' the rcspondcnts was within the chss ol' I t . ..
household with 1 1-1 5 persons wliilc liouscliold sizc of 16 and abovc form the least (1 %).
The result showed that household size ranging from 6-1 5 persons constituted the largest
them go to fuelwood, the one that is considered cheaper.
4.2.4 I'rimary occupation of the fuclwood consumers
the level of consumption and production. 'I'hat is why the occupation of the consumers

Tablc 4.12: Distribution of tlrc fuelwood consumers according to their primary occupi~ tion.
0ccup#(io11 I~rcquency I'crccn tage
Farming 9 7
Civil service
Trading
Artisan 3 1 26
'Total 120 100
Sorrrce: Field survey, 2005.
I t could be seen from tablc 4.12 that about 28% of tlic consumers were traders,
26% artisans whilc 22% ol'tlicni were civil servants. Also about 17% of the respondents
claimcd to hc teachers. whilc 7%) of tlic consilmcrs indicated bcing farmers. This may bc
that lkr~ners sourced their fuelwood in farm during land clearing [or agriculture
4.2.5 Monthly income level of the fuelwood consumers
I~icome status of household influences the quantity and quality of goods the family
consumes. In most of thc agricul~ural goods (fuclwood inclusivc) the expenditure on
thosc goods become less as Ilic i~icomc o f the Iiouschold rises. Based on this, tlic
houseliolds were asked to indicate~~hwlevel ol'their monthly income. Table 4.13 contains
thc result ol'thcir responses.
Table 4.13: Distribution of fuelwoud consumers according to their level of monthly income.
I ' . ..
Level of monthly income Frequency Percentage
1,css Lllan # I 0,000 1 .OO
# 10,oo 1 -- M20,000
#20,00 1 - #30,000
W30,OO 1 - #40,000
PC40.00 1 rrliti above -- - -
Total 120 100

'l'lic l iquc~wy clislrihi~lion 01' lcvcl ol' montl~ly incomc of' Ii~clwood users is shown
in table 4.13. The table indicates that 48% of the respondents fell within the income level
ol lcss that1 #I 0,000.00. Nine pcrccnt ol' the ri~clwootl users carncd between #20,001 -
9430,000.00, whilc 3% earned between #30,001- #40,000.00 and the remaining 1 %
earned #40,001 and above. From the result, i t is observed that the higher the level of
incolnc, Ilw Icss lllc 11~1111hcr 01' llic respo~~(I~rlls tliat COI~SIII I IC li~clwood. '1'11~: reason may
I x ~ l i u t I I K higlicr tlic i1ico111c 0 1 ' ~Iic I ~ C S ~ O I I ~ I C I I ~ S tlic 1110rc tlicy scek Ibr alternative
sources ol'energy such as kerosene, cooking gas, etc.
4.3 Marketing System and Market Structure
4 . 3 . Sourccs of fuclwootl
Fuelwood is one o f the most iniportant sourccs of cnergy in Enugu State for
domestic, industrial and conmercial purposes. At present it is a commercial product for
local traders and transporters. I t is sowccti lYom rurnl irrcas whcrc it is transported ( i ~ r
some distances before it gets to the urban markets where it is sold to the end-users. Table
4.14 shows the distribution of respondents according to sources oi' fuelwood while table
4.1 5 shows the rural communities where the fuelwood is sourced and three urban markets
where it is sold.
Table 4.14: I~istrihution of respondcnts according to thc sourccs of fuelwood. - . . . . $.PC
Sources of fi~elw ood Ih-cqucncy Percentage * Surplus arising from
agricultural land clearing 43 4 8
Natural hrest lhen woodland I 90 1 00
Plantation 13 14
'I'rccs I'cllccl fiom privakly o w n 4 land. 2 6 - 29
*Multiple responses recortlecl Source: Field sirrrwy, 2005.
'I'ablc 4.14 sliows that about 100M1 of the iuclwoocl harvesters sourced fuelwood
liom open M ootil;r~~tl/~~alrlr;rl li)rchl. Also 48% soi~rcctl ~hcirs li-om si~rplt~s arising Srom
agricultural land clearing, 20'% sourced the fuelwood Srom their privately owned land
whilc 14% of the 1iarvcstc.r~ so~~rced from plantation. 'l'lic source from plantation comes
from gavel-nnient plantation located at Qii - River.

'I'1tldc: 4: 15: S I I I I I ~ I ~ ~ I co111111uniiics wl1c1-c li~elwoocl src soarccd r111c1 i l~rcc urhan ~ ~ ~ u r l t c i s w1ic1-c lhcy arc sold.
Urban Markets Communities Sources of fuelwood Average distance supply to the urban
markets (km)
Abakpa-Nikc Annorj i-Nikc Clpcn wood land/ hnugu natural forest, '
agricultural land clearing, privately owned land.
Ugwuogo- Nike
Nsukka
I'lna-Ntlingu
Opi-Agu
Obimo
Enugu-Agu Achi
Alnani-Aclni Opcn woodland/ 7 - .-. .-<. .,. .,+ . natural ibrcst, agric
land clearing, privately owned land, government plantation.
Mnlam- 11gwuoba .Open woodland/natural
( 1 litrest, agric land clearing, privately owned land, govcrnnncnt plantation.
Sorirce: Field survey, 2005.
I:ronn table 4.1 5 it could bc sccn that the supplies 01' ii~clwood to 13nugu urban
were from Amorji Nike, Ugwuogo Nike and Amaokpo Agu. The harvesters sourced the
Si~clwood 1.1-om open woodland/natural li)rcsl, agricultural land clcaring and privatcly
owncd land. 'l'he distnnce travcllctl r ; i lqx l'ronn 12-27kni.
I'hc middlctncn and the linrvcstcrs in Nsukka urba11 gut tlicir supplies from Eha-
Ntliiigt~. Opi-Agu and Ohinlo. I ligh gradc li~clwoorl is sourced froni open woodland/

natural Ibrest, surplus arising liom agricultural land clearing and privately owned land.
'l'hc hrrrvustcrs trnvcllcci distu~~ccs ~unging li.0111 1 1 -27k1n to yct to thc urban mnrkcts.
111 0.ji-llivcr trrhan, Ihc SOIII'CL'S \ ) I ' fi~clwood were Sro111 natural forcst/opcn
woodl:rntl, agrici1I111r;iI land clcaring, 1w;vatc land and government plantation. 'I'hc
f~~elwood from these sources are gotten f m n Enugu Agu-Achi, Ahani-Achi, and Mmam-
Ilgwuoha. 'l'hey travelled distances ranging from 7-23k1n before they get to the urban
illVi1 \ V ! I C ~ C lllcj' S C I ~ lllc I'IIL!I\YOO~.
The overall result shows that the three urban areas source their fuelwood from
nal~lral li>lusl, open woodland, privalc land, agriculturiil land clearing and government
plantation. 'l'lwse sources arc. found in dil'Sercnt rural areas of Ihugu state.
1.3.2 Marketing channcl of fuclwoocl
Most of the Suelwood harvesters do not sell their fuclwood directly to the ultimate
consillnew. Iktwecn the 11~1rvestc.r~ and [he consumers arc the middlemen who perform
various Liinctions. 'l'he (i~clwood harvcstcrs, middlemen and consumers link themselves.
'I'he linkage liwn the marketing distribution channel. 'I'he marketing channel of fuelwood
is the path through which the tree product moves from the harvesters until it gets to the
final consumers. The distributive system through which the fuelwood passes is shown in
' figure 4.1 hclow.

Sources of fudwood. Agric land clearing, private land, natural forest/open woodland, government plmtation.
llarvcsters I
End-users (Households, industries, commercial enterprises). I
I
Figrm 4.1: Mrrrketittg cknrtnel ~~~firelrvood irr the strrdy crrecr.
Source: Field srrrvey 2005.
I? v Wholesalers
v
I:igi~rc 4.1 shows thc murkcting clianncl of fi~clwond in the study area. Tlic figure
depicts that tlie l~arvestcrs soclrcc li~clwood from agricultilral land clearing, natural .< ,,. .mq. ,,'
forest/open woodland, private land andh'bovernment plantations. These people sell the
Itct~rilcrs L ' I
v 1
I
product to either tlie wholcsalers, retailers, consumers or transporters. The fuelwood is
I
The wholesalers purchase the good from the harvesters, transporters, in form of 1 ' . .
large pieces or trunk wood. They later sell such wood to the retailers or chop them into
Transporters
smaller picccs either for sale to rclailcrs or sell directly to thc consumers. The wholesalers
who wcrc I ~ O I I - ~ I ~ ~ ~ ~ C I I C S 01' t11c ~ o n ~ n ~ u n i ~ i c s wlicrc the li~clwood is soi~rced often buy thc
trees from the communities, fell, assemble, split and transport them to the cities where
they rcsix uncl rchilndlc ant! sell l o lurgcr consulners (co~ii~ncrciul entcrpriscs).
'I'l~e retailers buy tiom thc wholcsalers, transporters or the harvesters directly. The
retailers in turn chop lhc wood into smallcr pieces and sell tlwn to the end-users.
'I'hc transportcrs, Ilic n u i n occupntion of the trmsportcrs is not firelwood business.
'I'hcy arc those who convey goods liom the urban to thc rural areas. On their return trip lo
the urban ccnlre, instcad ol' going b i ~ ~ k to the urban ccntrc cmpty, they decide to buy the

i ' i~clwo~~l. I1iily he along tlic raid or in tlic l;rrm and sell lo Ihosc that wed it. At times, the
trtlnspol-tcrs convey the l'uelwoorl lion1 the rural areas to the urban centres for the
wholesalers. In the case whcre the transporters purchase fitelwood from the harvesters,
tllc prolit rcalisccl li.0111 tlic si~lcs liclp 111cti1 lo ai~g~ncnl lllc cost o f lircl. Thcsc pcoplc
(Iransportcrs) ill-c sources ol' li~clwood to ~.cti~ilcrs, wholcsalcrs and consumers. 'T'hey ol'lcn
scll directly to the large co~lsumcrs such as restaurants, hakcrics and brewing industries.
The big consilmcrs c.g. hakcrics and restaurants often hypnss tlic system by cithcr
buying directly from the harvesters, wholesalers or retailers. 'They employ their own
labour to cut and transport the fuelwood to the factory. , . I lic overall rcsult slrows that, liltc olhcr i~griclllturiil protlucls, firclwood niovcs
ti0111 the sources through [lie hnrvestcrs, wholesalers, rclailers down to the consumers.
4.3.3 Quality perception of fuelwood by the buyers and sellers
111 1I1e process 01' lx~yi~ig i r 1 ~ 1 S C I I I I I ~ , 111irrkct pirrticipi~~its cn~ploy V ~ I T ~ O U S ways to
assess the clirdity of prodircts they want to buy or scll. This enables them to know
whether the products stand their taste. Thus the frequency distribution of the market
participants according to the criteria ilsccl in accessing the quality of the fuelwood they
pirrchasc or scll in the slilcly area is prcscnlctl in table 4.6.
Table 4.16: Distribution of fuelwood harvesters, wholesalers and retailers according to criteria used i" assessing the quality of the fuelwood. - '. '
C'ritcria 1 li~rvcstcrs Wholcsidcrs Itctzlilcrs Prcq. Pcrcentage* IJrcq. Pcrcentage* Freq. Percentage*
1 ligh burning capacity 88 98 40 89 37 82
Maturity ol'tllc trec 1 0 1 1 13 2 0 6 13 I ' I .
1,css smoky 62 6 0 15 3 3 17 38
Production of' good 45 5 0 2 5 56 18 40 charcoal and less ash
*Multiple responses recorded. Sorrrce: F ~ L J I ~ srrrvyv, 2005
'l'irhlc 4.16 shows the criteria cmploycd hy li~clwood sellers and buyers in the
proccss ol' ~narketing their l'uclwood. ' I he market participants assess the quality of thc
wood t111.ougl1 the k~lowlcclgc ~l ' t l ie tree t l i i ~ ~ produced tlic l'uclwood. 'l'he huyers or sellcrs
observe the filelwood physically. 'I'he fuelwood dealers claimed that most often, white
wood produce low grade of' li~clwood wliilc dark rcd and h;~rtlwood produce high gradc.

I:rom the tilhle, i t coiild hc olxcrvcd that 98% of the harvesters assess the quality
ot'tlic wood through high burning capacity, 69% asscss through less smoky. Also about
50% do so based on the prodi~ction of good charcoal while only 1 1 % of the respondents
asscss tlic qi~alily tliroi~gh lllc ~nalurily ol'lhc lrcc.
Wliolcsalcrs and retailers had Ilighcst :~sscssn~cn~ li)r high burning capacity with
89% and 82% recorded for them respectively. This was followed by production of good
cllarcoal id lcss ash (56'%,) by \vliolcsalc~~s and 40% hy rcti~ilcrs. 1:or wholcsalcrs and
rctailcrs. maturity of the tree rankcd thc least with 29% and 13% respectively. The result
lion1 tI~c t;il~lc has SIIOWII tllilt Iiigh hiliming capacity ol' thc wood was rated highest (98?4,
89% and 82%) by the harvesters, wholesalers and retailers. This may be that as the wood
Iwms Iiigli, i t wolild quicken ttlc cooking, with lcss constant watch and gives less smokc.
'I'kc wood that l ~ a s such quality is regardcd as high grade.
4.3.4 Price fixing in fuclwood salcs by thc harvesters, wholcsalcrs and retailers
Price has an important bearing in the buying and selling of any product. Often
Itxdcrs in u partic~~lar trade come togcthcr cithcr to raise, lower or stabilize prices of a
partic~rlar product in order to win tlicir competitors. 'l'his is achieved through different
ways. The price -fixing of the fuelwood market participants was studied, the result of the
s(iidy is shown in table 4.1 7.
I'c11)lc 4.17: I)istril)efio~~ ol' l'r~clwoocl III~I-vcnlcrs, w l ~ o l c s a l c ~ ~ a l ~ ~ c l rehilers arccording to method of pricc thing.
Mcthocl of Pricing Hilrvc~tcr~ W holcsalcrs Rctailcrs Frcq. Pcrclcrtlh~gc* Frcq. Pcrccn tirgc* Frcq. Perccntugc*
1:ix price arbitrarily
Fix price in consideration of purchases and othcr expenses incurred.
ITix price based on market supply and demand.
Fix pricc throi~gh hrgaining with c ~ I s I ~ I I I ~ ~ s .
I'rice is Iixcd by fuel wood market association.

I'hc i~hovc t;lhlc shows I l l i ~ i r l l i ~ r k c ~ pal-ticipan~s l i x priccs through dill'crcnt
mcthods. 'I'hc table shows that 88% ol' the fuelwood harvesters fix price through
bargaining with customers. 'l'his was lbllowcd by 69% ol'tl~cm that fix the price based on
market supply and demand. About 51% of the harvesters fix theirs in consideration of the
cspc11scs iwi~rrcd in their sunning costs m d others. Nonc 01' the above respondents
~ l i ~ i ~ l l ~ t l I l l i l I I I ~ C Y lix psicc i11.13i11.iiri ly i111~l ; I ISO 1 1 ~ t ~ I S S ~ C ~ ~ I I ~ < ) I I 01. I .~ ICIWOOCI ~iiarketcrs did
not tix price for their product.
I:or thc li~clwood wholcs;~lcrs. i ~ h o i l t 04% of ~ I ~ C ' I I I Iixcd price b:ised on purchases
anti o~llcr C X ~ ~ I I S C S i ~ ~ c i ~ r r c ~ l i n tI1c I ~ I I S ~ I ~ S S while 7 1 '%I lix pricc through bargaining with
customcrs. About 60% indicatcd that thcy fix price based on market supply and demand
and 7%) said that they fix price based on the decision of wholesale fuelwood market
i~s~oc.ii\tio~l. Nonc ol'tl~c wl~olcsi~lc~s lixctl prices arl,iI~.il~'ily.
0 1 1 ~ I I C part ol' retailers, 7 1 '%) 01' ~ h c m lix their priccs through purchases and other
expenses incurred in the course of the trading. Also 58% showed that they fix prices
t111x~1gh hiirgi~ining with customcrs and 51% indicatcd Ihat they lix prices based on thc
conditions of market dcmi~nd and st~pply. Nonc of Ihc retailers cl;limed that thcy fixed
prices through marketers' association or fix price arbitrarily.
The overall result showcd that thc majority of the participants fixed their priccs
tlibugh bargaining with customers and in consideration ol' purchases and other expenses
~ I ~ C I I I ~ I ' L ' ~ ~ i n lllc psoccss 01' lllc 111;1sI\cti1ig, ~ I I ~ C I IXISCCI O I I I I I C co11~l ihn of S L I ~ P I Y and
demand. 'The frequency distribiitf6ii"i':cvcaled that pricc fixing by bargaining with
custon~ers is the highest in the table.
'I'hc ccono~nic implication 01' bargaining with ci~stomcrs is that the middlemen
(wholesalers) could.conspirc to maintain lower prices becausc of the unequal bargaining I f . ..
power with the harvesters of fuelwood.
4.3.5 Sources of market inform;ttion in the study arca
Market information is a lilk wire of' any business. 'The traders need it to plan, carry
out and co~ltrol ~nurkcting activities. 'l'llc result ol' I I I ~ study on the sources of market
inl'ormntion in the stidy arca is shown in table 4.1 8.

T~lhlc 4.18: 1)istril)otion of Ilarvcstcrs, wllolcs~rlcrs and rctililcrs iiccording to sources of rnalrkct inform il t' 1011.
Sources of market llarvesters Wholesalers Retailers information Freq. Percentage* Freq. Percentage* Freq. Percentage*
'I'riidc associalion - 17 3 8 - -
Mi~rkcl 11liicc 7 X X7 40 X 0 42 9 3
*Miiltiple responses recorded Soiirce: Field srirwv, 200.5.
I:ronl tiihlc 4.1 X the ~llil.iority 01' I~i~rvestcrs (87'%), wI~oIcs;~Icrs (80%) and retailers
(93%) sourced information from marketplace. About 38% of wholesalers sourced
inliwmation l'rom tmde association. while none of' the harvesters and retailers got
inlimnation l'mn trade association.
The overall result indicates that the participants i n fuelwood marketing depend
solely o n n~arketplace for the knnwlcdgc of price system. 'I-his indicates inefficiency in
terms of market information, as it docs not reflect efficiency i n purely competitive
market. 'l'hc implication is that not all the information received by the majority of the
market pirrticip;unts especially on price, \voilld bc comprchcnsivc, accurate, trustworthy,
tinicly and firirly distributed in the ~ ~ ~ i i ~ k c t p l i ~ ~ . This is Iwcai~sc those who are privileged
to receive information earlier may hoard them to their own best advantage.
4.4 Mitrkct Structure .<,,... wl..t. .,> .
Market structure rcfkrs to the number of buyers and sellers, their size distribution,
the dcgrcc 01' product dif'fcrcntiiition. ancl the ciisc of entry ol'i~cw lirms into the industry
(Tomek and Robison, 1991). Market structure influences the nature of competition,
infimmtion and pricing systcln operating 'witliiii the market.
4.4.1 Allalysis of nlsrkct structurc
With rcgards to the analysis ol' market structurc for li~clwood, concentration ratio
was ~ ~ s c t l . <'oncc~ltrotion ratio ~.cli.rs lo the proportion ol' the Iiarvcstcrs' ancl thc
~ ~ ~ i c l d l c ~ ~ ~ c ~ i S ~ I I C S 1iii10~ by tllc I I I ~ ~ I C I I C I I I ~ I I i ~ ~ i ~ l I ~ ~ I I . V C S ~ C I . S i n t l l ~ I'IICIWOC)CI market. 'l'llc
concentrution was determined hy using (iini-coefficient. Gini-coeflicient is a number
between zero and one. In the computation of Gini-coefficient, sales revenue was used as a
criteria for the meas~lrcmcnt. 'l'lic compi~tations are shown in tables 4.19, 4.20, and 4.2 1 .

The concentration 01' the market participants was determined at each level
(II~ISVCSICSS, wholcsalcrs and retailers) in thc market. 'l'hc li)rlnula fix Gini coefficicnl is
shown in 3.5.4.
Sales revenue:
'I'l~c sales rcvcnuc is the valuc 01' the li~clwood sold by ihe harvesters and
middlemen at each level. 'l'hc annual rcvcnuc realized Srom thc Li~elwood sdes by the
nliddlcmen in each zone (Enugu, Nsukka, and 0-ji-River zones) was computed by adding
all ilic ~-cvc~i i~c gcncratcd by thc 1narkc1 participanls at the zonal Icvcls.
Population is the numbcr 01' the respondents at each lcvcl ie the harvestcrs,
wholesalers and retailers.
'I'i~l)lc 4. 19: Ani~lysis of'(;iui cocificicnl l i ~ r tlcicraiining ilrc conccniraiion of harvesters in fuclwood market.
Zones Knugu Nsukkil Oji-River Total
Sales revcl~ilc #I 4,172,900 # I 0.9 1 0,200 #6,759,300 W3 1,842,400
I'opulatiou
share (X)
Sales revenue
: . Gini cocl'ficient ((i)
Sorrrce: Cbniprrted fromJieIiI h t u 2005.

Tal~lc. 4.20: Analysis of Cini coefticient for determining the concentration of wholestllcrs in fuelwood market.
Population
share (X) 0.3335 0.3335 0.3335 1.0005
Sulcs rcvcnuc
Share (Y) 0.5306 0.2884 0.1810 1 .OOO
ax 0.3335 0.667 1.0005
(3Y 0.5300 0 .8 100 1.000
ax,, - a X l L . , ('4) 0.3335 0 .7335 0 .3335
aYl<+aYk-~ (13) 0.5306 1.3496 1.8190
A*R 0.1770 0.4501 0.6066
1 (1-E W*W)I : . Gini cocllicient (G)
source: Computed fromjield data 2005.

'I'r~l)lc 4.2 1 : Analysis of Gini cocf'ficicnt libr tlctcrmining conccntrc~tion of rctuilcrs in 1'11clwood inarkct.
- -
Zones Enugu Nsukka Oji-River Total
I)opd* a 1 t 1011 .
share (X) 0.3335
Sales rcvcIllIc
S ~ I ~ I I ' C ( Y ) 0.4205
ax 0.3335
i?Y 0.4265
~ X K - ax,-, (A) 0.3335
ay , 1 ayKeI (13) 0.4265
A*I3 0.142
I (1-z ( A * I ~ ) ) I : . <;ini cocl'licicnt ( t i )
Source: Computed fromfield data 2005.
. ,,.... f . . ? . S . ) ? '
'I'able 4.19 shows that the concentration for the fuelwood harvesters was 0.16.
This rcsult showed that tlic concentration fix the harvesters was very low. This implied
that no single harvester$ was able to control a large share of fuelwood supply in the study
arcu. I t also indicated that tl~crc wcrc I I I ~ I I ~ Y , , snial! sizcs ol' the liarvcstcrs in the markct,
and anlong thc harvcstcrs. none COLIICI inllucnce tlic silpplics cithcr by increasing or
reducing the quantity being supplied thereby influencing the price. Each harvester's
o111pt11 was s~tch an insignificant bit of ~ h c to~nl fitelwood in thc market supply, tliat i t
C O I I I ~ I 1101 i1f.12~1 I I I C I I I ~ I I ~ C I pric~..
'I'lie result realized lion1 the <;ini-coefficicn~ computed (table 4.20) for the
fuelwood wholesalers showed that thc concentration was 0.24. The result also indicated
low conccntration. 'I'his iniplicd tliat there was no wholesaler among the wholesalers that
had thc li~rgcst sliarc in the li~clwood ni:~rkct as lo have inllucncc wlialsoevcr on the
market price of his product through his own decisions or actions. Therefore none of the
wl~olcsalcrs con~rolletl signilican~ proporlion ol'11ie markct.

Also 111c co11cc11tl.illion li)r t l~c rc~ailcrs us slrowlr i n tablc 4.21 indicated that the
ratio was very low. 'l'his was an indication that therc were many retailers in fuelwood
business, and none oC them controlled the largest share.
Will1 rcgi11.tls to lllc cnlirc 111;11 kc1 S I I X I ~ I I I I . ~ , I Oo'% 01' ~ I I C I I~II .VCS~CI.S, rclililcrs ulicl
wliolcsulcrs indicated that tlierc wcrc niany buyers and scllers in the Suelwood market.
In respect of the homoge~ieity of fuelwood in the study area, 100% of the
respondents (harvcsters, wliolcsalers and retailers) claimed that one product could not
ci~sily I)c tlil'l'cluntiatcd I ' ro l r i tlrc otlrcr. I Iw rcsponclcnls notccl that luclwood was identical
anel silrii li~r. I'hc lilclwoocl cli Il'crcntiirtiolr was only through burning capacity. 'l'lic result
therefore depicts that the tree product is homogenous.
As lo wliclhcr lllc entry illlo lllc I'l~clwootl nlilrl,ct is liacc or not, one Iiuncirccl
percent ol' tlic rctailcrs indicatccl that any person coi~ld c~itcr into the fuelwood business.
Therefore there was no restriction.
For the fuelwood liarvcsicrs, 56% o f them sliowccl tl ir i t tlierc was slight barrier in
Iiirrvcsti~rg li~clwootl lix sale. 'l'lrc l~arricr \Y;IS h;~secI OII (Ire 11011-i~ieligc~ioi~s to the arcit 01'
collection syndrome. 'I'hosc who were not indigene of the co~nmunities where the
fuelwood was soured were not allowed freely to collect or harvest fuelwood for
co~n~ncrcial purposes, but those indigenous to the co~nmunitics can harvest fuelwood
liecly witlioul cosi. cxccpt lhc cost ol'culling and transporlation.
At the wholesale level, there was slight restriction in entry into the trade. About . . w , . , , . , , > . a < '
20'%.;, 01' wliolcsalcrs clailiictl t h i ~ t Ilibc was 110 ficcclolri 01' entry into tlic fuelwood tradc
and 71 ?4 ol' them indic:rtcd that there was li.cedom of entry and exit. The restriction was
attributed to l'uclwood markctcrs' association, which demanded certain amount of money
a id drinks bcSorc o ~ i c could he adniiitccl inlo tlic. tradc. 1:or example in one of the urban 11
centres studied, for an individual to be admitted into the fuelwood market, he/she has to
pay the silni of two thousand naira (W2000.00) as registration fee, provide two creates of
homogeneity of the product (fuelwood), entry into the trade was fairly easy, and there
the opcri~tio~i ol.tlic ~iixkct.
'l'he result ol' null liypotlicsis that there was no difference between the
~o l i~c~ i l r i~ l i t j~ i o f the ~niddlc~iicn ; I I ~ Ililrvcslcrs showcd t l i i ~ l signilici~ncc test t-cal (78.06)

was greater than t-tab (2.36). This implies that the null hypothesis is rejected. This shows
that thcsc is higher degree ol'concentrrrtion between the harvesters and middlemen.
4.5 M~lrltcling M;rrgins r r ~ i t l I'rol'ilirl)ilily of Ih~clwootl Mirrltcling
4.5.1 Mi\rltcling milrgin ;~nd cost
In the computation of the marketing margin, the purchasing and selling prices, and
marketing costs were first determined. The figures generated were then used in
computing thc marketing margin.
4.5.1.1 Purcliasing and selling priccs:
' l 'l~c p~trchasing i ~ n t l sclling priccs ol' tlic inarkct participants were computcd by
Iinding the mean priccs ol'u tonne ol' litclwootl. 'l'hc InciIn purchasing and selling priccs
wcrc ohtailled li-om the rcsult ol' tlic intcrvicw conducted in thc lield. The respondents
wcre asked to estimate the avcrngc monthly prices of fuclwood from the months of April
2004 - March 2005. '1'11c average priccs wcre computed lion1 thc ligures given by the
rcspondcnts. 'l'lrc avcrage purcliasing and selling priccs for thc 12 months of the year are
shown i n the table 4.22 below.

Table 4.22: Mean purchasing and selling prices per tonne of fuelwood for harvesters, wholesalers and retailers.
Months uantin su . Retailers (tonnes) Mean Mean Mean Mean Mean Mean
farm selling purch. selling purch selling gate price price price price price price per tonne per tonne per tonne per tonne per tomes
(#I (W (#) (#) (W April
May
June
July
August
September
October
November
December
January
February
March
Total 8356 24200 47400 47400 69250 69250 87500
Mean 69633 2016.67 3950.00 3950.00 5770.83 5770.83 7291.67
Source: Field survey, 2005.

'I'lw above table shows that (he mean selling price of the fuclwood harvesters was
W3950.00. The table also shows that the mean selling price per tonne of fuelwood
~lwkctcd by wholcsi~lcrs was W5770.83, while that ol'rcti~ilcrs was #7201.67.
1:ro111 t i ~ I > l ~ 4.22, i t is ol)scr.vcd t l ~ i ~ l thc supplics 01' li~clwood i n the study area vary
from month to month. The table indicated that supplies were higher during dry season,
tI1i1l is i n the ~ w m l l ~ s ol' I)cccmhcr, . I ~ I I I I I ~ I ~ Y . ~~~~~~~~~y and March. 'l'lic large supplies may
bc iittril>t~tc~i to (11c li)llowing: I:irstly, during this period rains had ceased, almost all roads
were accessible and vehicles could ply tlie feeder roads without sinking. Vehicles enter
tlie remote areas and carry fi~clwood to the urban centres. Secondly, when trees are felled,
tllcy c.c)llltl t1l.y ~ l l l i c ' l \ ~ l t l l i l l l d~ll'illg ~Ylilly SCiISOIIS. 'I'llil'illy SOlllc ol'lllc ~ J S ~ C S hild bWll S C ~
on lire and Ihrmers ci111 create roads easily. 1:inally this period was the slack part of the
year when farmers rest from the hectic farm work thereby engaging themselves in other
cconon~ic aclivities such ;IS li~clwood cutling and supplying.
'I'lie li~elwood supplics were lowcr during the months of July, August and
September. This was attributed to the peak of rainy season, when some feeder roads
become impassable, the forest become swampy, everywhere is bushy and when trees are
fcllcil they do not dry quickly. 'l'llc period is also thc peak ol' I'arming activities when
Iiir~ncrs li~lly engagcd in Ihrm work.
Ilowever the wholesale and retail prices were higher in tlie months of July, August .,,,...ml*.?. , '
and September. 'This is the period the middlemen make the highest sales in the year. The
reason behind this may be that many people (consumers) depend on the purchase of
fuelwood in the market because bio-fuel becomes wet and those who could have sourced
fi~clwood li-om the surrounding bi~sl~cs and ,ii)rcsl's are prcvcnted from doing so due to the
wetness o f the bio mass and secondly bushcs have grown. On tlie other hand, wholesale
and retail priccs are lower in the 111c;nths of December, January and February when the
traders niakc tlwir lowcst sales. I ,owcr priccs arc obtaincd here bccausc reverse is the case
wl1c11 ~nicldlc~ncn nlakc their Iligllcr salcs.
'I'l~c rcsi~lt li.0111 the L ~ ~ O V C table shows that thc supplies and prices of fuelwood
fluctuate according to the season of the year.
'I'llc ~ ~ i ~ ~ ~ o i ~ l i t y 01' li~clwood s11ppIics I I I ~ priccs according to the ~nontlis 01' the
year are shown in figures 4.2 and 4.3 respectively.

1 cm = 50 tonnes
Time- Months
Flgure 4 2 Graph showing the seasonal supply of fuelwood in the study area

I I I - I -, - - - -- - - .- 7 - - 1
A M J J A S 0 N D J F M
Tlme - Months
Figure 4:3 Graph showing the seasonal prices of fuel wood in the study area

4.5.1.2 Mitrlwting cost of thc firclwoocl ntrtrltct pitrticip:tnts
In business venture, marketing cost plays vital role, as this aspect of marketing
assists any business organization to directly analyse the profitability or margin of the
firm. The marketing cost of thc fuelwood market participants was analysed and the result
S I I O W I I i n f i ~ h l ~ 4.23 I X ~ O W .
II;II-vcstcrs: 'I'ablc 4.23 shows thc nlcan markcling cost pcr tonne of fuelwood by
thc harvcstcrs, wholesalers and retailers. I t could be observed that the harvesters mean
marketing cost per tonnc 01' fi~clwood inclicatcd that the cost incurrcd from the services
~x~~ilcl-cd by t l~c 11a1.vcslcss iwluclccl cult ing, collccti~~g : I I I ~ I stacking, loading, transporting
and toll fees. The total cost was W3420.70.The highest cost which harvesters encountered
was transportation cost. 'l'his took the largest share of the costs. 'I'he high cost of the
transportation may be attributed to badipoor condition of roads in the study area. The
f'ccdcr roucis always bccomc vcry bad cspcciully cluring rainy season when some arcas
werc inaccessible. The high cost of transporlation may also be due to high cost ~f fuel and
sparc parts. The high cost of transpo~.tation was followed by cost 01' cutting the trees and
the logs of the wood. The high cost involved here was attributed to dissipation of energy
in thc cutting. 'l'lic lcast cost rcnde~ul hy the l~;~rvcsters was toll f'ecs.
Wholcsdcrs: 'l'lic cost incul-red by the wholesalers included transportation,
loading and ol'f-loading, sccuri ty, rent, association dues, I mxl Government rate and toll . , I . . "1% ,1. , . i. .
fees. Wholesalers incurred a good number of costs. From table 4.23 it is seen that
transportation cost li)i.meJ the Inrgcst cost incurrcd by tllc wholcsulcrs. 'I'he reasons for
the high cost of transportation were attributed as mentioned in the harvester's case. The
total mean cost incurred by the wholesaler;^ per-tonne of fuelwood was #I 006.94.
Itctirilcrs: 'l'hc costs involved at thc retailing lcvcl wcrc transportation, 01's- Ior~cling, I - C I I ~ uncl splitting of'logs. 'I'hc splitting o f logs took thc largest si~are of the costs,
this was clue to high energy that is involved in splitting the logs. The retailer's mean
marketing cost per tonne ol' li~clwood was thc least W800.56 among the participants. This
may be t l i i ~ t the wholesalers or liarvcsters carry thc fuelwootl directly to them; therefore

? 0 r 9 d C C I
0 9 0 'A
0 9 0 'n C C I
I
0 9 0 3 Ch
I
I
I

some of the expenses the retailers co~ild have made on transit were borne by the
4.5.1.3 rl'lie 11uirketing niargi~i
The marketing margin is defined as the difference between the harvester's price
and that ol' the retailer. 'fhc harves~cr's price is the snrnc as the price at which the
\vliolcsalcrs a~itl/or tlic retailers buy li~clwood I'rom tlic harvcstcrs. 'l'hc harvester's share
of the consumer's or retail price is the retail price less the value of the marketing margin.
'rhe marketing margin in this stildy is expressed as a percentage of the retailer's price.
'I'hc markcling margins ol'rcspoi~tlc~its in tlic slutly ercu is shown in table 4.24.
Table 4.24: Marketing margin per tonne of f ~ ~ e l w o o d sold by the harvesters, wholesalers and retailers.
Market Mean Mean Price Mean Mean Percentage particip:ints purch:rsc n~:~rkcting ~*cccivcd selling marketing marketing
price pcr cost pcr pcr tonne price per margin margin/havcstcrs tonne of tonnc of of fuelwood tonne of (#) share fuelwood fuelwood (#) fuelwood
(W (W (#)
I larvestcrs - 3420.70 3950.00 3050.00 - 54.1
Wholcsi~lcrs 3050.00 1 ()Ofi,%. +. , #,, . 5770.83 1 820.83 25.0
Retailers 5770.83 899.56 , 729 1.67 1520.84 20.9 - - -
Source: Field survey, 2005.
'I'iible 4.24 shows the avcragc 1, marketing margins Ibr fiielwood and the
corresponding harvesters sharc pcr tonne. 'l'he result indicates that the marketing margin
liw Ihc wlwles:~lers was higher (25.0%). whilc that of thc retailers was lower (20.9%).
'I lic higl~cr m;lrgin rni~dc by Ilic \vliolcs;~lc~-s may be nttrihutcd to thc good number o f
services rcndcrcd hy the wholcsalcrs t l ~ i i n 1Ilc retailers. 'l'lic tnblc also shows that thc
Iurvcstcrs' sllare, was 54.1%. 'l'hc margins madc by the niiddlc~ncn and the harveslcrs
share indicate that for every tonne of fuelwood sold, the harvesters' share of the
consumers' spcnding is 54.1% whilc tlic rcniaining 45.0% goes to the middlemen. TIiis
implies that for every one naira spent by a consumer on a tonne of fi~elwood, 54kobo

gocs to the lia~vcstcr \vliilc 4Okobo gocs
~narkcting costs.
From tlie result, it could be deduced
to
tlia
cover tlic ~niddlcmcn's net profits and
~t the marketing margin for the middlemen
is lower than the harvester's share. The reasons for higher harvester's share could be
attrihuktl to tlic l'ollowing:
I. I:uclwood is one ol' lhc gootls that does not undcrgo l'urlher processing,
thcre forc nii~ch value is not added to i ts proccssing.
i i. I:uclwood is a bulky arid heavy product that has high cost of transportation.
4.5.2 Profitability of fuelwood marketing
I'rolitnbility of fi~clwood marketing was computcd by employing gross margin.
Gross margin is one of the :~nalytical loots tlinl is used in dctcrmining the profitablity of
marketing. It is the dil'l'crcncc between ~ l i c lotal rcvcnuc ('IK) and the total variable cost
('I'VC). Nct profit is difl'crcncc between ihc gross margin and fixcd cost.
GM = TR - wc NP=GM-I:C
GM = Gross Margin
'1'R = Total Revcnue
'I'VC = Total Variable Cost . , ,, ... .,I. .?' , s ' 9 , ,
FC = Fixed Cost
Nl' - Net l'rolit.
I'rofits [or tlie year's (April 2004 - April 2005) business was computed as the
annual total revenue less variable costs, gross margin less fixcd costs. The variable costs I * . .
included in tlie study were cost price; transportation, cutting, loading and off-!oading,
splilli~ig ol' log, associirlio~l rlucs, loll lkcs ilntl security. Ncl prolit is gross margin less
lixctl costs. I:ixcd costs in lhc ~ni~rkcting ol' li~clwood inclutlcd rcnls, local governmcnt
rate, dcprccia~ion on barrow, axc and ma~clicts used on tlic daily basis of the business.
I:ixctl costs were dcprccintctl using the str;~ight-line mc~hocl ol' tlcprcciation. The abovc
ilcnis were ticprecinted with a n assumcd savage value of zero. The useful number of
years of the items depreciated were determined by the respondents.

Also c;llculatcd wcrc tlic prolitnhility ratios. 'I'hc nct prolit ratio reflects the
cl'licicticy with which ~nanagcmcnt produces or sells each ~ ~ r i i t 01'product. 'l'he cost ratio
indic:~lcs rhc averagc spread bctwecn tlic cost of goods sold and sales revenue.
'I'hc computations for. profitability was carried out fix liarvcsters, wholesalers and
retailers. 'l'hc calculations liw the net pralits are shown in tablcs 4.26,4.27, and 4.28.
l tcrrrs Amount (#) Total Amount (W)
Annual sale
Total revenue
Costs:
Vuriuldc Costs:
Culling
Collection & Stacking 32550.00
Transportation 190650.00
To l 1 fees 4650.00
'I'olal variables cosl . ,,..d" ,,. > . , a
Cross margin (TR -TVC)
Fixcd costs
Dcprecialion on barrow 883.00 9 , " Axe 160.0Q . ..
9 , " Matcliet 175.00
'I'otal Iixed cost
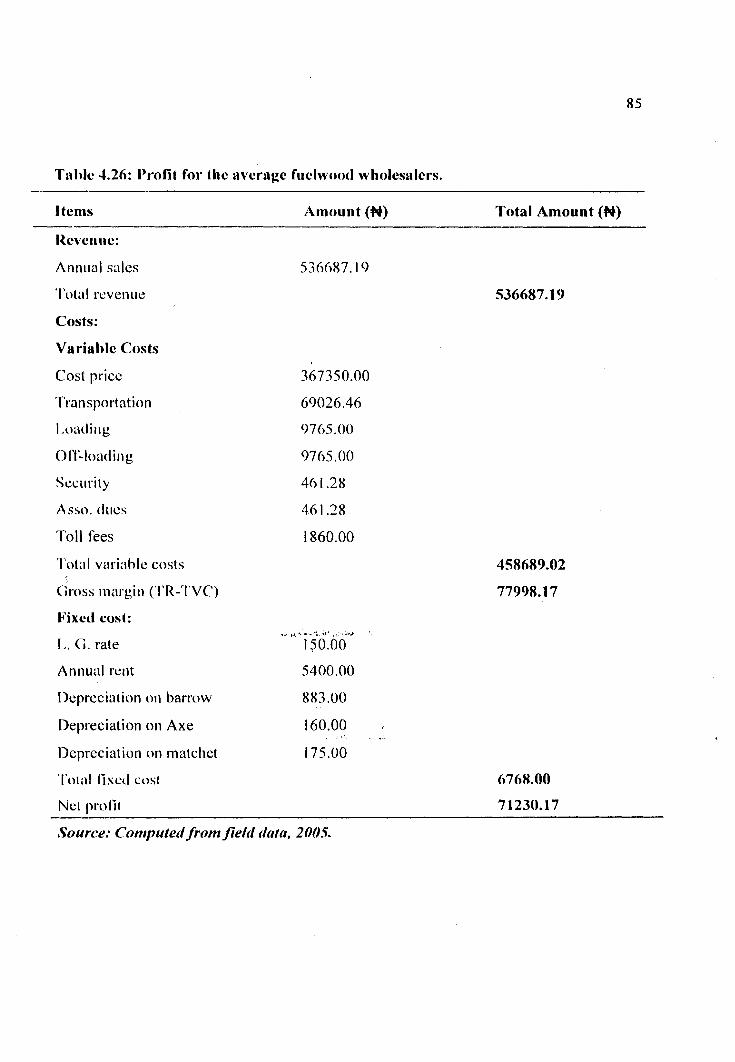
T;rldc 4.26: I'rofit for tlic avcragc fuclwootl wholcsalcrs.
l terns Amount (#) Total Amount (#)
Annual salcs
'I'otal rcvenue
Costs:
Variable Costs
Cosl pricc
Transportation
I .outling
Off-loading
Sccurity
Asso. ducs
Toll fees
Total vnrinhlc costs
Gross margin (TR-I'VC)
Fixcrl cost:
1,. G. rate
Annual rwt
Ileprcciation on barrow
Depreciation on Axe
Depreciation on matchet
'l'otal liscd cost
Net prolic
Source: Computed from fir/(/ h t f l , 2005.

l tem Amount (#) Total Amount (#)
licvenuc:
Annual sales 078 125.3 1
'I'otal rcvcnuc
Cosls:
Variable Costs
('ost price
'I'l'i~tl~porlilL ioll
Off-loading
Splitting ol'log
'I'otal variable cost
Gross niargin ('I'I1-'I'VC)
Fixed costs:
Annual rent 3600.00
Dep. on b:~rro\v 8 ~ 3 . 0 0
l k p . on axe 160.00
Dep. on matchet 175:00, W L +' ,
'Total fixed cost
Net prolit
Source: Computed from field data 2005. , ( . ..
'l'ahles 4.25, 4.26 and 4.27 showcd that an average fuclwood harvester, wholesaler
and retailer made unnual sales revenue of #S67,35O.OO, #536,687.19 and #678,125.3 1
rcspcctivcly. 'l'hc prolit analyses ol' the luclwood harvester, wholesaler and retailer as in
the ti~blcs indicated that liarvcs~cr hucl nct prolit o f W48.072.00, \~holcsalcr W7 1,230.17
while retailer had W54J44.88 being 13%. 13.7% and 8% o f thc annual sales revenuc
rcspcctiv~ly. 'I'lic a ~ i a l y x s liwtlicr indicntcd that an avcragc I'uclwood harvester had gross
margin of #40,290.00 k i n g 13.4% 01' the sales rcvcnuc, wholcsalcrs #77,998.17 which

was 14.5% of' t t x sales rcvaiuc wliilc retailer madc #50,102.88, which was 8.7% of the
i1111111i11 S ~ I I C S ~CVCIIIIC.
The cost analyses showed that the harvester had a total cost of #319,278.00
wl~ic l~ co~~sis ts 01' virriablc cost N3 18,000.00 a ~ ~ d lixctl cost Pi 12,18.00, these coristitutcd
#465,457.02 (86.3%), which consist of variable cost being #458,689.02 and fixed cost
W6,768.00. 'l'hcse also co~~stitutcd 85.0% and 1.3% 01' the annual sales revenue
respectively. Also tile total cost lix the retailer was #623,780.43. This consisted of
vsriable cost #618,962.43 and fixed cost #4,818.00. These costs were 91.3% and 0.7%
of the ann~lal sales respectively.
'I'lic ncl prolil ratio wliicl~ i~rtlici~lctl llial IIlc iIvcl.ilgc I~al.vcslcr, wl~olcsalcr and
retailer made 13%, 13.7% and 8% 01' the annual sales revenue implies that for one naira
si~lcs in the li~clwood business, the harvcstcr, wholesaler and retailer made net profit of
13kob0, 14kobo and 8kobo respective] y.
'I'i~l~lcs 4.25, 1.26 alitl 4.27 sliowctl tliat wliolcsalcr nlatlc 11lc Ilighcst profit whilc <
the retailer madc the least. The reasons behind the wholesaler's highest profit could be
altrib~~tcd l o the li)llowing: .,,,.,kl..?' s . 3 , '
I . 'I'llc \~holesalers rcndcrcd inore services in the busincss operation than the rest. . . 11. They are more organized as they have associations that hold them together. . . . 111. 'I'llcy control ~llodc ol'cnlry into tllc lilclwood business.
iv. They easily get market information as it affects the prevailing prices of the good. I ' . .
v. Wholesalers make bulk purchases, which leads to lower costs and higher prices in
'I'his implies that wholcsalcrs have better management, which leads to good
pcrli)r~nancc in the bilsiness than the harvcslcrs and rctailcrs.
The nu!; hypothesis that there is no significance difference between the profits of
lilclwood Iiarvcsters and the ~ n i d d l c ~ ~ ~ c l ~ in the study area was tested using t-test. The
~ ' c s ~ ~ l t sl~owcd [hat 1-ciil lixm llic pri~nary data was 0.40 whilc Ihc critical t in thc table at
5% level of probability is 2.36. Fro111 tile above rcsult, it shows that t-cat is great than t-

tab indicating that there is significant difference between the profits made by the
fuelwood liarvcsters and the middlcmcn.
4.6 I Jscs of I~aclwootl
4.6.1 The uses of fuelwood in households
'I'lic ulilization ol'ony product tlcpcntls o n the purposc liw which the good is uscd,
on the income of the user and the nvai labi l i ty of the product. The uses of fuelwood in the
households in the study area is shown in tablcs 4.28 and 4.20.
'I'ul~lc 4.28: I)istril)alion of l~o~~sc l~o lc l s according lo illc uses ol' I'uclwood.
Cooking 110
I l c u ~ i ~ ~ g 32
DryinglPrcservation 2 0
Ironing 5
Source: Field srrrvq, 200.5. *Multiple responses recorded.
Table 4.28 shows that fuelwood is used mainly for cooking, heating,
drylprcscrving and ironing. Out o~ ' i l i ~ . ; 1~ , "~ i~ i i ~ i i 11~ accountccl Ihr 0 2 % ~ This indiccltcs that
~imjority ot'tlic respondents use li~clwood Ihr cooking. Cooking was followed by heating
which rccotlctl 27 pcrccnt. About 17 pcrccnl uscd thc li~clwood Sor drying while Sour
percent used it for ironing. 1, . .
-- size of houGl~old Monthly consumption Yearly consumption
(kg) (kg)
1 - 5 180 2160
I6 and ahovc 270 3240
Source: Field sun 2005.

I:rom ti~blc 4.20, i t is ol~scrvccl t l ~ i ~ t a household whose size was between 1-5
~ X ~ O I I S C O I I ~ I I ~ I C ~ i ~ h o ~ ~ t 1801ig ol' (i~cI\vood n~onthly amomting to 2 I6Okg of ~ L I C ~ W ~ O ~
anrli~ally. 'l'l~c monthly li~clwood consu~nption cost the l'amily an average amount of
HI,ZOO.OO. Also, a I~ouscholcl ol' 0-10 ~>crsons utilized an average quantity ol' 220kg
monthly and 2640kg annually, while a household size of 11-15 persons used 250kg of
f i~cI \vo~~i ~~~ont l i ly and 3000kg arlnually. A llniily 01' I6 persons and above consumed
bout 270kg and above ~nonthly. 'l'hc result li-om thc tablc clearly shows that as the size
ol' household increases, the quantity ol' li~elwood being consumed also increases. This
may be that the more the number ol' pcrsons in the family, the more the fuelwood use
increases.
46.2 Market Participants from whbm the Consumers I ~ a y their fuelwood
('onsu~ncrs ol. a product can buy the good ih& any convenient source. This
depends on the location, quality and quantity of the product. Based on this, the fuelwood
~ c r s wcrc asked to itdicntc Ihosc market participants li-oni whom they buy their
l'ucl wood.
Table 4.30: Distribution according to whom the consumers buy the fuelwood.
Whom they buy from Frecl!!e,r?$X ,,. , .,, Percentage*
I larvcsters 0 3 53
Wholesalers 4 1 34
*Multiple responses recor(1ed. Source: Field survey, 2005.
'I'he table shows that the ma-jority (80%) of the respondents bought their fuelwood
Srom thc retailers, 53 pcrccnt purchased theirs from the harvesters who supplied the good
directly to thcm, while 32 percent indicated that they sourced thc good from the
\vllolcsi~lc~~s. 'l'lic high percenragc rccorclcd o n the retailer's side may he that the retailers
re-sizc the bundles of the wood to affordable prices and secondly the retailers are readily
accessible to the respondents at any point in time. d

4.6.3 Sourccs of alternative energy
In rhc cvcnt of li~clwood shortage. rhc consumers of thc fi~clwood could make an
altcrriativc cl~oicc in order lo riicct their tlomcstic obligation. 'I'hcrcliwc, the other sources
through which the fi~elwood users acquire tlic basic energy for cooking, heating were
studied. The result of the study is shown in table 4.3 1.
Sources of alternative energy Frey uency Percentage*
Kcroscnc I 16 97
Table 4.31 shows that among the respondents, 97% used kerosene in cooking.
Kerosene served as subtitutes andlor supplementary to I'uelwood for preparation of food.
On the average, a hoi~schold whose sic.c was I -6 persons uscd 6- I0 litres of kerosene at
the cost of W336 - W420 monthly. A family of 6-10 households size consumed 12-16
lilrcs of keroscnc ~nonthly, wlik& ' 5 . ~ ~ ' ~ L I s c ' I I o I ~ size 01' 1 1 - 15 utilized 20-22 litres ol'
kcroscnc monthly. Two percent of the respondents sourced alternative energy from
cooking gas. Only 3 percent of the colisumcrs used coal for cooking and heating. Those
who i~sed coal came from E11i1gi1 urban. Thc use of this energy source in Enugu urban
;~rrrilwrctl to l l ~ c avi~iIal>ility ol' 111s prc;tl'i~c[. No~w ol' t l ~ c ~ C ' S ~ O I I C ~ ~ I I ~ S indicated using
electricity Ibr cooking. It may hc due to the high cost and the irregularity of electricity
supply that impede its usage.
4.7 Effccts of Socio-economic Factors on the Fuclwood Supply
Regression modcl was ~ ~ s c d to mcasurc the cffccts ol'socio-economic variables on
the fuelwood supplied. The explanatory variables used were age of the havesters (Ag),
marital status (Ms), household size ( I Is), level of education (13d), cost of transportation
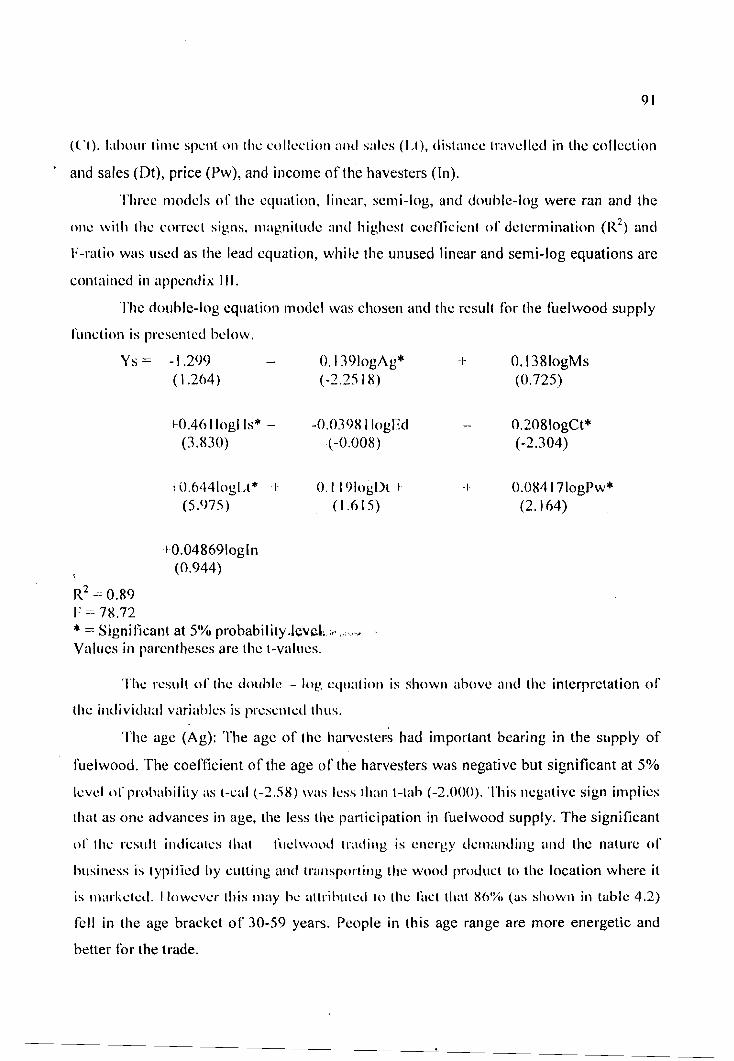
( ( ' I ) , Ii~l,oi~r ti~iic spcrit o n tlrc collccliori i r~ i t l sales (1.1). tlisl:\llcc t r i \~~lIc t l in tlic collection ' and sales (Dt), price (Pw), and income of the havesters (In).
'I'lircc niodcls of the equation. linear, semi-log, and douhle-log were ran and the
one witli the correct signs, mirgnitidc and higlicsl cocl'licicnl of tlclcrminalion ( R ~ ) a~id
1:-ratio was used as the lead equation, while the unused lincar and semi-log equations are
contai~icd in appcndix Ill.
'I'he doirble-log equation model was chosen and tlie rcsult for the fuelwood supply
R~ = 0.89 1: -= 78.72 * = Signilkant at 5% probability.lev~k. ,,. , (.?, .
Valucs in parcntlicscs are the t-values.
'I'hc r-csult ol' the doirldc - log cqra~ion is sliown ahovc and the interpretation of
t l~c intlivitlual variirl)lc,\ is pcscntcd thus.
The age (Ag): The agc of the l ia~vcster~ had important bearing in the supply of
fuelwood. The coefficient of the age of the harvesters was negative but significant at 5%
lcvcl ol*pr-ohihility ;IS I-cal (-2.58) \vas Icss 11l;rn 1-tah (-2.000). 'l'liis ~wgirtivc sign implies
that as one advances in age, tlie less tlie participation in fuelwood supply. The significant
ol' ~ h c rcsi~lt i~ldica~cs 1 1 u t li~clwootl t~'i\tli~\g is cricr-gy clcrriancling and tlic nature ol'
hi~siness i \ typilicd by cutting nntl ~rarisporting tlie wood product to the location wlicre it
is niarl,ctccl. I lowcvcr- this rriiry hc iittr-ihirtccl lo tlic li~ct t l r i r t X()'%, (as shown in tnblc 4.2)
fell in the age bracket of 30-59 years. People in this age range are more energetic and
better for the trade.

Marital status (Ms): 'I'he niarital status of the harvestcrs was weak with the
(i~clwood silpplied. 'l'lie cocllicicnt (0.138) was not statistically significant at five percent
lcvcl o f probability. 'l'liis implies t l ~ n t lidwood supply is not limited to married people
alone. Individuals who are single and havc the energy and resources that could enable
tIic111 harvest thc wood product coulil chgagc themselves in the lirclwood supply.
'I'lic Iiousehold size (I Is): 'l'lic Iiousehold size ol' the harvcstcrs had a positive
crl'cct on the supply ol' fuelwood. It was significant at 5% level of probability with a
coeficient o f 0.461. This implies that with niore number or pcrsons in a household, there
is 1 ilicl ilrootl tlr i11 rllcy c o ~ ~ l d Ilclp i l l tlrc Iiorvcsting a d selling ol' [lie lilclwood. 'l'able 4.6
indicates 111al 60% ol' tlic harvcstcrs had Iioi~scliolcl s i x 01' 0- 15 persons showing large
proporlion ol'big household in tlie fuelwood supply.
I .eve1 ol' cducatio~~ (lid): 'l'his was ncgativc (-0.0308 I ) antl not sl:~tistically
signilicant at 5% level 01' probability as t-cal (-0.008) was greater than t-tab (-2.000).
Ihus, fi~elwood supply was not irillucnccd by the n~unbcr of years spent in formal
education. This could be that the act of cutting the wood antl transporting them for supply
could be acquired infor~iially. Secondly, the higher one's level ol'education, the more he
engages lii~nscll' in lucrarivc I~~s incss orlrcr tlran li~clwootl si~pply which is assumed to be
more tedious.
'I'llc coeflicicnt I'or cost uP"tYit~Tspfir'taiion was ncgativc (-0.208) and statistically
significant at 5% level of probability. This signifies that cost of transportation has effect
on the I'uclwood si~pply. It iniplics ~Iiat the n~ore the cost ol' transportation, the less the
fi~elwood will be,supplied especially to the urban area. 'The implication on the harvesters
is [ h u t lllcy oltcn scll heir products at'' n rciluced price in the rural area instead o f
transporling 111c wood produced t o the urban ~narket where i l will li-tch higher prices.
'I'he result of tlie regression analysis showed the amount of labour time spent in
collcction and supplics w;is li,und 10 I?c posilivc with cocflicicnr of 0.044 rind was also
sti~tisticnlly signilic;rnt at 5% lcvcl ol' prohi~hility as t-cat (5.975) was greater than t-tab
(2.000). 'l'hc result implies that as morc l abo~~r time is spent in thc collection of fuelwood,
Ilic morc product Illat is supplied. 'Ihxclbrc labour as one ol' the ('actors of proCuction
leads to an increase in o ~ ~ t p u t when approximately combined with other limiting factors
ol' procluctio~i.

'I'hc cocflicient of distance travcllcd in the collection and sales was positive
(0.1 10) hut not statistically significant at 5%) level of probability. The positive sign did
not conlir~n with u yriori cxpectation. 'l'hc non-influcncc ol' distance on the supply ol'
li~clwood could be attributed to thc Ihct that with bcttcr road network, any quantity of
fi~elwood would be supplied to the market no matter the distance.
'I'hc cl'fcct of price on li~clwood supply was positive with cocl'ficient 0.08417. It
was also significant at 5% level of probability. The result is consistent with a priori
expectation. 'l'llis implies that high p~:iccs with given cost undcr a pcrfect compctitivc
mnrkcl s t l -~~ctt~rc will rcst~lt to more sq-q,lics.
'I'he a~nount of income earned hy the harvesters had a positive (0.04869)
relationship with the li~clwootl sl~pplicd although its cocl'licicnl was not statistically
signilic:rnt at 5% level of probability as t-col (0.944) was lcss than t-tab (2.000). This
implies that Iwvestcrs with small amount of money could start the act of supply.
The final result shows that the double-log selected provided a good estimate of
socio-cco~ron~ic cha~.actcrislics that irl'l'ccl l'~~elwood s11pp1y. 'l'llis is I~CC:ILISC the model
explained 80% ool' variation in the li~cl\vood supplied. 'l'lic ovcrall regression equation
was statistically significant at 5% level ol' p~.oIxhilily, as 1:-statistic (78.72) was greater
than I:-valw ol' 2.000. 13ascd orr this lire!, 1:-statistic was signilican! irt 5% lcvel and was
accepted that the specified so~in;~w,nrvnic factors had cffcct on fuelwood supply.
'I'liercli>rc hypothesis (iii) that socio-ccono~nioc factors had no cfkct on fuelwood supply
was re.jected and the alternative accepted.
4.8 Effects (if Socio-economic I'acfo,rs on Fuelwood 1)ernand
'l'hrec models ol'regression eqi~atiori - linear, Semi-log and double-log were tried.
'I'lie tlouhlc -log motlcl was sclcctetl ns the Icirtl cclr~ntion lo analysc thc effect of socio-
economic variables on fuelwood demanded, while the unselected linear and semi-log
equation are contained in appendix IV. The result of the rcgrcssion analysis of the
li~elwood tlc~nand fi~nction is prcscnted thus:

I.og Ytl - I ,og 3.700 I 0.280 I .og I Is* - 0.15 1 log1 t i
(4.6 18) (?..968) (-2.358)
-1 0.522 log I's* - 0.193 log I'w* - 0.0368 log I k i (5.008) ( -3 .55) (0 .O72)
R~ = 0.683 1: - - '10
* .= Signilicunt at 5% probability Icvul. Valuc in parentheses are the 1-values.
I:mm the double - log analysis shown abovc, thc individual variables were
cxa~~~inc t l ant1 the intcrprclution ol'thc rcsull is prcscntccl as Ihllows:
'I'llc above equation shows that the s i x of household ( I Is) influenced thc
li~elwood demanded in a positive direction. The coefficient was positive (0.286) and
statistically significant at 5% level o f probability. 'l'his is consistent with a priori
cxpcctution. 'l'his implies t l ~ i l t ils the nunibcr o f persons inct-cases i n the household the
more mouth that would be fed thereby lcading to utilization of more of the fuelwood.
'I'llc lcvcl ol'i~icomc (In) hi~d i1 ncgalivc rclationsliip with the quantity of fuelwood
demanded with coefficient -0.15 1. It was significant at 5% level of probability as it
sI~o\vctI t11:1t t-C;II W ~ I S -2 .358 \vhilc I-tah wah -2. 18. 'l'llc i ~ ~ c o l ~ ~ c cl:wticity was ncgativc. . r s , ' . . l . . r . , , . I +
'I'llis shows thtlt l'uelwood is not a I m u r y ilcm but an inl'crior good to the consumers. The
implication ofthis is that as the incomc of households incrcrrscs, there is the tendency that
one would go for altcrnativc cncrgy sources such as hcrosenc, cooking gas and
electricity. As one's income increases f~elw~ood is considered to be inferior, dirty and
inconvenient to use.
'I'he analysis of the pricc (I'w) ol' li~clwood dcmandcd showed negative (-0.193),
showing that the dcmand I'l~nclion salilicd u yrori expectation and was statistically
signilicant at 5% level ol'probability. I lowever the estimated price elasticity in absolute
valuc was less than lmi~y, implying hat tlic dcmand lhr li~clwocd was inelaslic. 'l'hc
i~iiplication is thnt an incrciisc in li~clwood pricc might makc lhc consimers look for an
alternative energy source.

'I'he price of fuelwood substitutes (t's) had a positive relationship with the
qi~antity of f~~elwood consumed (0.522) and statistically significant at 5% level of
probability. This implies that an increase in the price of alternative energy sources will
makc the rcspoiidcnts to demand nlorc ol'thc fi~clwoocl. 'l'his ~iiiglit bc tliat most ol'thc
fi~elwood consumers were low incom~ earners. This was reflected in table 4.13 which
showcd t l ~ u t 87% ol' tlic l'uclwood users l'cl 1 within group of' people that earn #20,000.00
and lcss ~nonthly.
'I'hc coefficient of level of cducation was ncgative (-0.0368) and was not
signilicant at 5% level ol' probability. 'l'he negative sign is consistent with a priori
~ ~ l X X ~ i l ~ i O l 1 i l l l d I101 hcing sigllilicill\l il\iplics t i \ a t lcvcl of cthlcatioll hild 110 effect on the
quantity of fuelwood demanded. The attainment of higher level of education might make
it11 individual consultic lcss ol' li~clwootl as a rcsult of' accepting altcrnative energy
sources such as kerosene, cooking gas etc.
I'lic doublc-log ovcrall rcsult slio\vs that coellicicnt 01' ~n~~ l t i p l e determination is
high (0.68). The higher R* is an evidence of good fit of the model on the data obtained.
'I'lic cclt~i~tio~l then cxplains that 68% 01' the obscrvcd variables have influence on the
il11i11itity ol' li~clwood dcni:tntlcd wit11 :III 1:-ratio that ih signilicnnt at 5% level ol'
probability. Therefore the null hypothesis that socio-economic factors do not influence
thc q[~antity ol' li~elwood consunied dew mat apply.
4.0 I ' r o l h n s of Ihclwood M;rrltcting i r ~ ~ c l Consrrrnl)tios
4.9.1 Common problems of fuelwood marketing
'I'hc participants in li~clwood markcling experience one problem or the other in
t l~c co[~rsc o f running their b~~sinesscs. The rcspondcnts wcrc i~skctl to indicate the
problc~ns i n rhcir 1~1sincss vc~;turcs; tl~crcli)rc, thc problems cncountcred resulted in
~noltiplc responses recorded i n the stud) area.

Table 4.32: Distributions of respondcnts according to problems encountered in fi~clwoocl marketing.
I'rol)lcnls 1l;rrwstcrs Wllo1cs:r Icr lictailcrs
I'rcq. I'ercca tugc* lircq. I'crccn tugc* k'rcq. I'crccn iugc*
I ligh cost of' transportation
I .nbour intensive
Scarcity of tile1 wood
Police hnrnssmcnt
I 'd~lc 4.32 sllows that c.)lnn\on p~ohlc~iis cncoutitcrcd ky the li~clwood harvesters
in thc course of their Insincss includcd high cost of transportation (93%) and labour
intcnsivc naturc of the trade (00%). 'I'lic labour intensive nature ol'tlic trade is associatcd
will1 tlic X I ( I I ' C L I I I ' I I I ~ lllc wood, pi~cking lllcn~ to the collection cc~itrc, as well as loading
and o l'l'-loading ol' the li~elwooci. All these jobs are energy sapping clue to the bulkiness o t'
wood. Othcr problems considcrcd heavy were lack 01' capital (80%), badlpoor or
inncccssil~ilily of roacls especially during wet season. The inaccessibility of roads leads to
high cost ol'tlallspol.tation, \vllicIi is vimvccl as il stu~nhli~lg hlocL i n li~clwoocl ~narkcting.
I'lic Iiasvc\tcl-.; claimed that low prices ol' thc products during lhe months of January -
hk~rcll \ \a\ n big prohlcm. 'I'IIc i~hovc P ~ O I ~ I C I T I S were li,llowcd hy police harassment
(67(?&) whilc o n transit. l'hc respondents also indicated that scarcity of firelwood (64%) is

one of tlie corn~nonest problenis being experienced by the liarvestcrs. This has led to the
Iiarvcstcrs spending many hours in a day in scarcli ol'higli cl~~ality of I'uclwood. Also poor
working lools such as axe and matchets accot~ntcd lo 5 1%). 'l'liis problem makes the
cutting and splitting of wood log to be labour intensive.
I'he table also indicates that tlie wholesalers considered lack of capital (91%),
high cost of transportation (89?4), inacccssihility of road cspccially during rainy season
(7 I(%) ;lnd poor sales in tlic dry season (82%) as mqjor ohstaclcs afl'ccting their trade.
I x k of storage spncc consliltrtcs iln inipctliriicnt to wl\olcsi~lc trade in thc urban centres.
Ma~ly ol'tlic rcspondc~its clui~iictl that Local (iovern~nent Chairmen often give them short
notices to park out from where they were occupying, they also claimed that they were
occupying large area of land. They take some parts of the land and erect store.. In the
coursc ol'lhc stt~dy in one ol'llic t l r h i~ i i C ~ I I I ~ C S , IIic St~cI\voo(I ~iii~rkct i~ssoci;~tion WLIS i n
law court with one ofthe I m x l Government Chairmen over a space of land where the
~niddlemcn were li~r~iicrly occupying. I'olicc liarassmcnt was not considered as a
common problem here. This may be attributed to the fact that most of them get their
supplics d ired from the liarvestcrs who convey the product to them.
On tlic side ol' the rctailcrs, i t was liwnd that 80'1.;) lack capital. 84% experienced
scarcity of' fuelwood, 80% undergo labour intensive, and 71% suffer from poor sales
cslwcially during dry season. 'I'Iic~q,~~:i!js~~it~~tcd mi!jor constraints in their trade. The table
sho\vs that poor working tools (67%) md lack of space Tor storage wcrc also considercd
as colnnioll problenis.
Tlic overall result showed that' lack of capital, scarcity of fuelwood, and labour
intensive nature of the trade, and high1 cost.'of transportation constituted the major
obs~nclcs hanipcring li~clwood ninrkcting in the study area.
4.9.2 C o m a ~ o n pl -o lhns of fi~clwootl consumption
('otisi~~iiptio~i ol' l't~clwood wot~ld lcxl to v:~~.iot~s prol>lc~ns ranging from
ccologic;~l. cco~lo~iiic, social lo Iicallli ~,rol,lc~iis. 'I'licsc i~l'lLcl llic c.onsumcrs i n one way
or the other. I11 view of the above, the fuelwood users i n the study area were asked to
indicate the problems encountered in li~clwood consumption. 'l'he responses as indicated
by the consumers are shown i n table 4.33 below.

1'rol)lems Frequency Percentage*
I ligh price of filelwood 109 9 1
I lcilltll problc~ns 113 94
I .rick of spncc l'or storage 7 5 6 3
Attacks ol'harmful insect (scorpion) 37 3 1
*Multiple resporrses recorded Source: Field survey, 2005.
The respondents (consumers) claimed that health problems experienced in the use
of li~cl\vood \viis cno r~ l i~ t~s . 1:rolil ~i~hlc. 4.73, ;1hot11 04%~ 01' Ihc consumcrs gave positive
rcsp)~ise lo these prol)\cms. 'l'hcsc Ilci~l~h prohlc~ns wcrc associatsd with respiratory
cases, elr'ects of smoke on eyes, pollution of the environment and odoilr the smoke
impacts on individuals. l'his result is in consonance with the findings of Irene and Joan
(1 997), Smith el a1 ( 1 903), and World h n k (1985).
I ligli prices 01' l'i~clwoocl i l l u h a n arcus wcre reported hy 1:ostcr (1 986) as one ol'
the ma-jor problems affecting fuelwood users. This problem was also viewed to be in
conli,sniity with the ahovc rcpot-I, as 0 I ?4 ol' ~ h c respondcnrs gnvc similar response. This . , , , .. . "1. ,,' , . s ' 3 , '
may hc dtlc lo low incomc ol' 11ic consumers. About 63% of the consumers indicated lack
ol' spacc l i ~ storage as common problem. 'l'his may be that I'uclwood users in urban
centres who are mostly low income earners live in crowded houses. The respondents
(30%) also claimed that fuelwood attrac,ts harmful insects such as scorpion. This type of . . insect Ilitlc it1 lhc I)c~cli ol'tlic wood, i~nc l ill t in~cs stings lllc t~scr.

C1IA1"1'15R PIVK
S ~ ~ n ~ r n i ~ r y , Coacl~lsion i ~ r l c t Recammcntlations
5.1 S ~ t ~ n n l ; ~ r y
'l'lic primary oh,jcctivc ol'the stirdy was to conduct an economic study of fuelwood
murkcting anti consi~nipt i~~i in Ihiirgir State. '1'0 a~liicvc this ohjwtive, the study
examined the effects ol' socio-cconomic factors on Suelwood supplied, the influence of
socio-economic variables on luelwood demanded, marketing channel and market
s tr~~ctu~'c, niarkcting margin a11tl prolits ~n ;~ t l c by thc li~clwood market participants. Also
cxamined wcre the uses of fi~elwood in households, and problems associated with
li~clwood marketing and consumption.
Rcsi~lts showed that the ~najority (76%) of the fuelwood harvesters were males.
'l'hc rcsi~lt also indicated that I ~ g c proporr ion (02%) 01' wl~olcsalcrs untl 67%) ol' rctailcrs
were I'c~i~alcs. 'l'lic li~itlings tlitl poin~ OII I hat tlic mqjority oS thc participants (72%, 78%
of harvesters, wholesalers and 02% of tlie retailers respectively) were married. 'l'lic
majority of tlic participants had largc sizes of households ranging from 6-10 persons per
I~onscl~oltl. ' l ' l~c li~cl\cootl ~ n d ; c t ~ w r ~ i c i l x ~ r ~ ~ s \vc~.c in the low inconic group :lnd they also
Iiad low I C V C I ol'education.
'I'he majority (70%) of the f&J.y.qgri, cgnsumers had low level of education, while
87% ot' them fell under low income group. Most of thc fuelwood consumers were
~llm.rictl \villi I;~rgc sixes ol'l~o~~sclloltl.
'She findings showed that the distributive system of' luelwood indicated t!iat it is
so~~rcccl ti-om ope11 ra~~ge , I ~ ; ~ I U ~ ; I I IOI.CS~,,! pri.v$ely owncd Iilntl, land clearing and
plantarions hy the harvesters, then tlic wood moves from the harvesters to the
wliolcsalcrs, ~xtailers ;md li~lally to thc consunws. 'l'lw ~.cst~lt o n 111arkct information
sl~o\vctl tliar rlrc mar kc^ pnriicipmts dcpcntl solely on tnnrkct place lhr thc knowledge of
price syslcn~. 'l'lic rcst~lt 01' n~;~rlicr structu~.c sliowcd thur ~hcrc wcrc n1wy harvesters, the
proclucls wcrc homogenous, no Ixlrricr to cnlry into the I'm4ncss and thcre was low
conccntration (0.16%) of harvesters. Also, the result of the market structure on the
~'cli~i 1c1.s slio\vcd that IIOII 0 1 ' lhcrn co1111.oI Icd Ii1l.g~ proport ion ol' t l ~ 111~kct. 'l'hcll lbr the
wholesalers, it was almost the same as stated Tor harvesters and retailers. Here there were

1n;111y I~iycrs itntl acllers, no prodt~ct diffcrcntintion, low concentration (0.24). Thzre was
a slight harrics in entering into the business at the wholesale level. l'hus. the overall result
\llo\cctl 111;1t I ' L I c I ~ Y o o ( I 111ilrhci ) ~ ~ I . L I C I L I ~ ~ was p~sc ly co~upcti~ivc ~ l ~ ; ~ r k c t . 'I'herefore none of
lllc 111;1rlicI paflicipants controlled the large share of the market. The analysis indicated
111i1t ~ I I ~ I Y \ \GI \ cli l'll.~*cncc in the C O I I C C I ~ I ~ ~ ~ I ~ O I ~ 01' ~ ; I ~ V C S I C I . S and ~niddlcmcn as t-cal
('18.00) \v;I\ L : I . c ;~~c~ tIl i \ i l t-ti1I1 ( 2 . 3 0 ) .
On the marketing margins and the prolitability ol' the business, the findings
showed that cost of transportation accounted for the largest sharc of marketing costs and
lbs~nccl cco~io~nic barrier to the n~askcting ol' li~clwood. I:uclwood marketing was found
lo bc al'l'cctcd I>y seir~o~~ali ty 01' Ihc procliict as more of the proclucts were supplied to the
middlemen during dry season when prices of the products were generally low. During
rainy sci~)rcm \vlic~i priccs ol' lllc pro(luct hccamc high less 01' thc hclwood were supplied
to the illiliI\~I. ' I IIC inarhcting 11iargi11 ol'111c ~~li<ldlcmcn in ilic study was 45.9%. while the
Iiarvcsters' sliare was 54.1 % showing that every one naira spent by the consumer 54 kobo
goes to the harvester while 46 kobo goes to the middlemen to cover the marketing cost
incurred and net profit.
1 llc li~lclings 0 1 1 tllc ~lrolitahilily 0 1 ' tllc I~ar.vc\tct~\, wllolcsirlcrs clnd rclailcrs
indicated that the gross margins of the harvesters was W49'290.00 which represented
13.40/;1 o f the annual sales while the''~icl 'jircYf'lt was #48,072.00 represenling also 13% of
the arini~al sales. Also, the varichlc cost li-on1 the harvcstcrs \\/as N3 I 8,OOO.OO which was
86.6% of the sales and fixed cost was 0.3%. The gross margin of the wholesalers was
#77,908.17 which lhrmed 14.5%) of thc ,,annual . . sales and net profits of #7 1,230.17
repi-cscnting 13.7%. Also thc variable cost incurred by the wliolcsalcrs was #458,689.02
Iwi11g 85.0% ol'lhc si~lcs, nild lixcd cost ol~N0,708.00 was 1 .3%,. 'I'hc gross margin ofthc
rclailcrs \vas #59,162.88 while net prolit was #54,344.XX. 'I'liese represented 8.7% and
8.0% 01' sales scspeclivcly. 'l'hcy also had variable cost ol' N618,002.43 representing
0 1 .3% ol' sales ant1 fixed cost 01' 0.70/;,. The Ilndings also showed that there was
signilicartt dil'lkrence hctwccil thc psolits ol'llarvcsters and ~niddlcnic~~ as t-cal (9.49) was
greater Ihi111 I-tab (2.36).

'I'lic lindings ol' the study also slio\vcd tliat lilclwootl was used mostly i n cooking,
heating, preservation anti ironing.
Ikonornetric estimation showed that the major cl~aracteristics variab!es that
significantly affected fuelwood supply were age, size of household, cost of transportation,
price a~id laho~~r t i nlc. In li~cl\wod dcnland. the variables t hilt i n I1 ucnccd the dependent
vi~rii\hIc \\lcrc Iio~~scholtl size, prices 01' 1~11cl\.vood and altcrnalivc cncrgy so~lrces.
The regression model for the supply of fuelwood showed that 89% of total
variation was explained hy tlic socio-economic clinrnctcristics. Thus the overall
economic characteristics of the fuelwood consumers. Therefore the overall regression
ecl~~ation liw fi~elwood demand was statistically significant at 5% level ofprobability.
111 i111, tlic 111111 IiypotI~~'sis t1ii11 I ' I I C I \ V O O ~ S I I I ) I > I Y i ~ ~ i ( l C I C I I I ~ I I ~ C I wcw 110t al'l'cctcd by
socio-economic characteristics of the respondents were rejected and alternative accepted.
'I'lic constraints of lirclwood 11ii1rkcti11g in the study arca were lack of
trunsportation, scarcity of li~clwood, Iwd road, lack 01' capital, laboi~r intensive of thc
trade, lack ol'space lbr stolngc, poor working tools, while high price of fuelwood, health
problem, lack of space for storage, attraction of harmful insects were the common
5.2 Conclusion 1C
'I'he study has shown that li~elwood is a source ol' income and energy to people
living i l l rural as wcll as urban areas. l'lic ligdings'indicatcd tliat factors that affected the
lidwood supplied and demanded were povcrty related variables such as big sizes of
household, low-income and low level of education. The study further indicaled that
ti~clwoid riiiirhcting 111111 C O I I S ~ I I ~ I ~ I ~ ~ I ~ i \ rC i ~ t~ rc i~s i~ lg dcspitc tlic c ~ i v i r ~ ~ i ~ n c ~ ~ t a l , economic
a~ld Ilci~lrli dangers tha~ arc iissocinrcd \vi l l i rlicsc.
It is the conclusion ol' this stuiy that government policies on poverty reduction
ncctls to Oc I.L 'V~CWC'C~ SO ;IS to ilicI11~1c tlic ~ ~ i c o ~ ~ r i ~ g c ~ i i ~ ~ i t 01' pcoplc i~ivolvcd i n f~rclwood
business to g~~rdually source liw alternative means of livelihood and hence discourage

them from exploiting trees to ensure sustainable and management of forest and tree
rcSOlIrccS.
5.3 Hecome~cnclaiions
The findings of the study have sonx important implications for enhancing the
marketing systeln ol' li~clwood as well as to improve on the income of the market
pirrlicil~ir~lls ~ I I I C I I .C( ILICC llic high i l c ~ ~ c ~ i d c ~ ~ c e 011 I ' L I C I W ~ O C I C O I I S I I I ~ ~ ~ ~ O I ~ . 'I'liesc
implications are presented in the following section:
I. I n the rural areas, many people depend on fuelwood harvesting and selling to
gc~icratc inconic. I:~.oni t l~c stwly, ni;!iority of thcsc pcoplc lirll within tlic low-
income bracket. It is the recommendation of this study that the fuelwood
harvesters can bypass the middlemen by engaging in marketing activities
through coopcrativcs or Ihc li)r~lli\lio~i ol' any other Icgal organimtions. 7'his
will llclll lo rcilucc llrc costs ill lllc lcvcls ol'disl~~il~ulio~i syslc~n. 'l'liis cllatigc
will benclit the poor consumers by bringing down the priccs of fuelwood and
equally make the fi~elwood harvesters to sell the li~elwood to the urban centres
at higher priccs. 'l'liis in cl'r'cct will increase Ihc illcome of the fuelwood
. . I I . '1 he rcsr~ll of llic stndy also sllowcd that most of lhc li~clwood consumers . , ,, . . " 7. .P. ., ', + '
equally had low income. 'l'lie fuelwood users should form consumers
coopcrat ives especially tliosc wit tiin clusters. They could usc these societies to
by-cut the middlemen by buying dircctly from the harvcstcrs, hiring their own
vehicle that would deliver ,the . good .. to their door steps. Also the member
households of the consumers can do their own chopping of the log of wood to
smaller size pieces thereby avoiding the large "breaking ol'hulk" costs that are
~ior~rially I ~ ) r ~ i c by 111c 1.c1ailc1.s. 'I'lris will Irclp to rcclucc thc cost of t l~c
fuelwood.
O n the ollicr hand, I:cdcral Govcrnmcnt should try and make
alternative energy sources such as kerosine and cooking gas cheaper and
accessible so that i f the priccs of' li~ciwood become high thc consumers could

easily switch to the altcrnalivc energy solirccs. 'l'liis will even assist in
reducing the rate ol 'dcpc~idc~~cc OII fticlwood. ... I I I . Vertical integration could bc very cffectivc n~cthod Sor the efficiency of'
lirelwood marketing. Vertical integration of this kind will be between the
various fuelwood harvesters and the distribution stages (wholesalers and
1.c1;rilcrs). l'llis will I ~ l p lo lowcr Illc costs aml illcrease prolits. I:or instance,
wholesalers might operate their own transport a~ld hire labour to harvest the
fi~elwood thereby reducing total variable costs.
iv. Seasonality of fuelwood creates price fluctuations and this greatly affects the
i~lcolnc ol'tllc harvcstcrs. 'l'hus hot~scholds who harvest Suclwood for a living
should devise ways of selling the harvested fuelwood to ensure even spread
throughot~~ ~ h c year. 'l'his will help them to mccl up demand at each point in
time t l ~ r o ~ ~ g l ~ ~ ~ ~ t the ye;lr. It will also assist to bahnce supply response to price
movement.
v. On the proldc~n ol' li~cIwood S C ~ I I ' C ~ ~ Y , cffi)rts s l~oi~ld be nlade by State and
Federal Governments to give priority to afforestation programme. Rural
people sllould be cncouragcd to grow trees in their own land. By doing so,
they will increase the wailabili~y of f~~elwood and other wood products. They
will lixm this provide tJ~p.u~cJ.v~s,with sources ol' incomc. It will also help to
reduce deforest, LI t ' on.
Establishment of community forest: Community forest programme is
also another means of making fuelwood available and also an effective way of
Ilclping thc poorer ~ncmhcrs 01' llw c o ~ ~ & ~ u n i t ~ to provide mcaris of livciihood.
'I'hc managen-tent ol'thc community forest will be entrusted unto the hands of
local village organizations to avoid illegal felling of the trees.
vi. 111 tllc s ~ i ~ d y , lr;~~lsl)or~;~lio~l c o \ ~ i \ccoi~nt~d liw lllc I;~rgcsl share of ma1 kcting
cos~s. 'Illis limllcd ~ I I I c>co~lonlic Ix~rricr lo Illc ~llakcling ol' liiclwood.
Government should therefore intervene to lower the marketing costs by
improving the transportation system through construction oS feeder and all
season roads and improve on transport facilities.

( 'oni~iii~~~itics in rurnl areas should endeavour to maintain the feeder
ro:ltls I y c.rc;~~i~lp, gullcr mcl \ Y ; I ~ L Y \Y;IYS hy 111e si(lcs 01' the ro:id. This is
because most of the feeder roads become impassable during the rainy season
due to erosion 11i;1t cuts ilic roads. All thcse will cnhancc the supply of
ti~clwood at the lowest cost and with high profit.
vii. 'I'llc researcher rccommcnds (hat li~rthcr study slioulcl bc carricd on thc prices
o f different qualities of fuelwood. marketing and consumption of charcoal and
sawdust in the rural and urban arcas of other states of'tlie 1:edcration. This will
cnahlc lhe govcrn~ncnl lo know the priccs and consumption of fuclwood and
othcr wood products i n the country as wcll as their contributions to house
hold income. It will enable the Government to make proper planning in
clicrgy sector.
Ahbol, .I. C'. (1003). "Marketing, tlic l<ural I'oor and Sustninabilily" In Abbot, J . (ed) Agricz(1ttrre and. fbod A4urketing- in Developing Countries: Netherlands: Technical Centre for Agriculti~rc and Rural Cooperative.
A bho t, .I. C. and .I. 1'. Makeham, ( 1 980). A~riczrllurul Economics and Marketing in rhe 'li.opics. I , o ~ ~ l o n : I,o~iglilnn (;r.chp I , l t l .
Adcgcye, A. .I. and .I. S. Dittoh (1980). Essentials of A,qric~rlturul Economics. Ibadan: Nigeria. I~npact I'ublishers Nigcria 1,td.
Atleyeye, V.A. (1996). "Impact of New 'I'echnology on Poverty Level of Rural Women i l l Nigeria". Technicid I<cport Carncgic Corporation ofNcw York, 1J.S.A.
Acieyokmni~, '1'. 0. (1073) '"l'hc Mnl-kcling Margin Sor rice in I:gba Division of Western State of Nigeria", Bzrllctin ofK11rur1 Economics and sociology, Vol. 8 , No. 2, Pp 1 1-26.
Adeyoju, S. K. (1 975). Forestty and Nigerian Economy. Ibadan: Ibadan University Press.
' Afkican lkergy Policy Research Network ( 1 990). African f:'nerm: Issues in Planning and l'r.trcvictl. 1 .oti~Io~i: Zed I iooI\s l ,Id.
Agarwal, B. ( I986).Cold Ifeurrh md.&wren Slope: The Woo&d Crisis. London: Zed Ihoks 1,td.
Agha~llol-, N.P. (1988). "Seasonal Variihility in the price of yam in Orhiomwon I.,.G.A, 13c1idel State: Inlplication ror policy". Unpublished 13. Sc. Project, Department of Agricultural Economics, University of Nigeria, Nsukka.
I ' . .
Ahmed, M.R. (1996). "Marketing of Woodfilel in Bangladesh: The Case of Hathazari 'I'liana Under Chittagong I>istrictW. A Technical paper presented at National 'I'riiining Course, I<Al)A, Ihgrn , Ihngladcshi, Ikc . 7- 1 1.
Anlilclw. <;. S., W. I:. I lydc, K . I < . K;\ncl ( 1006). "I loilschold li~clwood demand and supply i n Nepal's 'l'aria and Mid-l lills; choice between cash outlays and labour opportunity". World L)evc lop~~~wt .Vole 24, No 1 I. I'p. 1725-1 736.
A~ii~iia~l , I;. itnd I < . Wilson ( 1080). Ilrwr:q\~ 1)c~rmrntl ~ r n d Lt/icicnf I/.Yc. NCW York: Plenum I'rcss.

13o\vden, 13. V. (1986). Econotitic..~. Ohio, USA: South-Wester11 Publishing Coy.
Ihdley, It. S. (1902). Thc J;conornic.v of' Poverty and IXscriminution. Englewood: I'rcntricc 11a11 Inc.
Ruongiono, J . (1977). Long-term Forest of Major Forest Products Consumption in Ilcvclopcd rind IJntlcvcloping Ilconomic". Eiwe.v/ Rc.vctrr.c~h. Vol. 23, No. I , M ; ~ I ~ I , pp 13-25.
Callaglian, 1'. (1994). Z ~ L I S ~ I ~ ~ S S Advunc~d Lcvc'~, B t ~ s i n c ~ s L<ducution. Sunderland Tyre, Great Britain: Educatior? Publishers.
Campbell, K.M. and [-I . 1'. William (1984). Microeconomics. 'Toronto: McGraw-Hill I < ycrson I . ~ d .
Casley, D. J. and I). A. Lury j 1984). Ihtu Colleclion in Developing Countries. New York: Oxfhrd Clarcnon I'rcss. '
('lia~lvin, 11. (1981). "Whcn an Ali-ican city Ituns out ofI:~rcl". flr~vylvcr, Vol. 33, No. 133 p.1 I.
Cecelski. E. (I985a). "The Rural Energy Crisis: Women's Work and Basic Needs,: I'crspective and Approach to Act". International Labour Organization, Rural I hployment Pol icy I<csearcli I'rogramme, Technical Cooperat ion, Geneva.
('ccdski, 1:. ( 1085h). "l<ncrgy illid I<~II.;II WOIIICII'S W~~r l i : ISSIICS i i~r I)~SCUSS~OI~". ['apcr I'rcparatory Mccting on . , I jncr~y , .rl. ;!!id Rural Women's Work, Intcrnational Labour Organization, Geneva, 2 i-25 October.
Cliaplnnn, . I . 13. ( 1989). ( ; L w ~ Y I / ~ I ~ ~ c1ric1 I:'nc~r,qy. England: I ,ongman Scientific And 'I'cchnical.
C l i i~k \v~~ , 1.1 :. W . (200 I ). "Agrici~lli~ral ,,Sust~l.inahiIity and 1:armcrs: Ilccision at Farmer Level. In Sagary N. (ed), Proceeding of the Sixth Scientzfic Workshop of Sub- Scrlwmn Africcm Nc>/\iwrk (SI IS AN) hcld at the International Institute of Tropical Agriculture (II'I'A), Ibadan, Nigeria, August 23-27.
C'ouricr, K . ( IOXO). '"l'hc Woodlilcl Crisis". 'l'hc C'ourier. No. 05, Jan-l:eb. 1'. 28.
('ranicr. <;.I,., <'.W. .Icnscn, and 11.1). Soi~rh~a tc .Ir. (1007). , / ~ , L ~ ~ L ~ I I I I I I I ' ( I I Economics and Agr.ihrr.sine.s.s. New York: Johli W ilcy & Sons Inc.

Dasgupta, P. (1993). " Poverty, Resources and Fertility: The Household as a Reproductive Partnership "An Encpiry inlo Well Being und I l i s~rihu~ion, Oxford: ( )S Iibrd I J~~ivcrsity I'rcss.
Ilavid. W. 1'. and M. I'inlcntcl ( 1070). Iliu)r/, enerm) ~lritl Socic!,~. Idondon: I3Iward Arnold I'ublishers.
I)ccui~nalo, M. 1 :. ( 1083). '"l'hc I Jsc of lircwood as I~omcstic I:ucl in Mcxico and Pattern 01' ( ' l~at~gc to Altcrtli~livc". Ilnpul~lishcd 1'li.l). 'l'llcsis, Instilulc of Agricultural I~conomics, Oxlhrd University, August.
Dennis, A. (1986). "Declining Tree Stocks in African Countries" World Development. Vol. I , No 7, I'p. 853-863.
Ilcwccs,P. A. (1980). "'l'hc Woodli~cl Crisis Rcconsi<lcrctl: Obscrvations on thc 1)ynamics ol' Abundance and Scarcity". World 1ler)cloprnent. Vol. 17. Pp. 1 159-
i
Iligerness, T. 1-1. (1977). Wood or fucl "'l'lie Energy situation in Bara, Sudan", Mimeo, Dcpart~ncnt of Geography, I Jnivcrsity of ncrgcn, Norway. July, P. 15.
Ilixie, G. (1080). "Ilorticultu~-al Marketing: A Kesourcc and 'I'raining Manual for Extension Officers, Agricultural Scrviccs". Bulleliri, 17A0, Iiorne Pp32-39.
I?unkerly, J . and W. Ramsay (1983). Analysis of Energy: I'rospects and Problems of Developing Countries" Report prepared for U. S. Agcncy for International Dcvelop~nent, IPPC, Washington I). $., August.
,' . . .
liboh, 1.:. C. ( 109 1). "'l'hc Agricultural Syrnptonis 01' I'opularion Strcss in the I'ortner Anambra State: Implication for food and Environmental Conservation". A!ot/clir~g, Alotr.v~~r.c~rrtc~r~/ trrrrl ( 'hr l /r~d. Vol. 35, No 3, I'p. 4 1-5 1.

r'clicbiri. 1i.N. (2001). "An Analysis ol' tlic lnfluencc o r Socio-cconomic Variables on I lo~~scl~old Inconlc, ('onsutnption, IJxpcncliturc and Saving in Rural Southeaslcrn Nigc.ri:~". IJ~~l~t~l,lislictl 1%. I). 'I'lwsis, I)cparlnlcnl of' Agrict~llurd Ilcono~nics, I I~~ivcrsity ~ l 'N igc~ . i i~ , Nsilkha.
Eckliolm, I:. P. (1 975). "The Other Energy Crisis". World Wdch , No 1 , September. P. 6.
IIckholm, I:. 1'. (1 976). Losing ((;rolrncl: I:'nl)ironmentnl S/res.s and World Food Prospect. Nc\v York: World Walcli Il~slitttlc.
Ikkliolm, 1I.I'. ( 1080). "'l'hc Otlicr I hcrgy Crisis: I:ircwood". In: Smil, V. and W .E. Knowland (eds). L;ner~,y it1 /he Ikveloping World. New York: Oxford University Press.
I'ckolm, 1:. ( 1984). "Ncpal: A 'I'rck lhrot~gli a I:orest in Crisis". New York Times. 14-21 I:cbt.~~i~ry. 1'13. 24-25.
Eligizouli, I. A . R. (1990). "Rural-lJrbnn I louschold Encrgy (lsc Inlcr-relation in Central I<cgio~l o f Sudan" I I I AI'I< I I I ' I < I :N (ctl). ,,!/i.ictrn Ilrrc~r,y~~. I mnclon: Zed 13ooks I.td.
E n u p State Agricultural Ikvelopment Programme (ENADEP) (2005). "Metrological Ilala", Annual Kcport. .&,,.. ,.l..,. ,,.,a '
I<nt~gu Slalc Agr ic~l t t~~i l l 1)cvclopn~crit I'rogrammc (I1NAI)I~I') ( 2004). Memo on Reorganisation of Agricultural Development Programme Zones, August 3rd .
Enugu Statc Governrncnt ( I OW). I:'nzrg~/ S/tr/c. I ,ag,os: W esl A liican h o k Publishers. 11
I h t ~ g u Slate Govcrnmcnt (2002). lillrrgrr S/rr/c. I:nugu: Ministry 01' lnrormalion and Culture.
I:vans, M. (IOX7), "Stoves I'rograni~nc in h c I:ralncworlc of Improved Cooking: A ('Iimge in Focus \villi Special Rclkrcncc to Idatin A~ncrica; Geneva, 1LO Working 1';l~"'l'
Evans, J .R. and D.Derman (1994). Ahrke/ing. New York: Macmillian Publishing ('oln~illiy.

I</cdim~n:r, I;.O.('. (IOOO). "('rap Scicncc " In Youdcowci. A., I:.O.C:. Ihd imma and C.O. Ocliapa (cds). Iufrvdircfiorl lo 'l'ropicul Agriculftlre. Lngland: I'earson I ltlirc;rtion.
Ezenia, F.1. (2001). "Conventional Sources of Energy". In: Ezekwesili, N.O., P.O. I ll~acliukwu anti C.R. Nwagho (ctls), Infrodzrcfion lo Nulurul Science. Onitsha: Newcrest Publishers.
Iq;/il\c. .I. 0. (1008). " I )~ l i~ lc i \ t io~~ ol' Old :111tl Ncw I : I ) I I ~ L I StirIc." I I~l l~~~l>l is I~cd 13ullcli11, l a d s and Survey, Ministry Works, Iinugu.
Food and Agricultural Organization (1981). "Map of the Fuelwood Situation in The Developing Countries". Rome.
Food and Agricultural Orgi11li~3ti01l ( 1095). "I~orcs~, FLICIS and I:uture: Wood Energy for a Sustainable I>evelopnlcnt, Forcslry 'l'ropics Report. NOS, Rome, F.A.O.
Food and Agricultural Organization (2003). Wood Energy Policy". Newsletter. The Regional Wood Energy Develop~nc~it Programme (RWEDP). Rome. P. 3-4.
Filani, M. 0. ( 1 979). "Air Transport" In Oguntoyimbo et al (eds), Geography of Nigeria l ) o ~ ~ c l o ~ > ~ t ~ t i / . Ihndi111: I Ici~lc~llii~l l ~ t l ~ ~ c i \ t i c ~ l ~ l 1300ks (Nig) I .Id.
. . 4.. '
Foley, G. and G . Rarnard ( 1 984). Fcrrnt C'ommunify firesfry. Idondon: Earthscan I'uhlicat ion.
I:ostcr, '1'. (1086). "A Common I:uturc I:or Women and Mcn" World Commission On Environmental Devclopment. Ottawa,.Canada: EDPRA Consulting Inc.
I ' . .
Garictli, I < . I ., D. I3en and I I. Solomon (2000). Ecologiccrl Economic. Oxford: Black Science I Id.
Gujarati, 11. (1 992). E.~.~errtic~l~~ c?J'Ecom)nic/ric..v. New York: McGraw - Hill

Anne, 11.1:. (1006). "Iluilding a Suilablc I:ood System". In: I'liilip, 133. and S.E. Okoye (eds). The World at [he ('ros.sroatl. London: Earthscan Publications.
Arjuri, M.(1080). "Energy in the rural 'I'liird World". In Smail,V. and W. E. Know land ( 4 s ) . Energy in the Third World New York: Oxford University Press.
Armitage, J. and G. Schramm, (1994). '"Managing the supply and demand of fuelwood in A li-ica". In Schramm, G. and .I ..I W arford, (eds). Environmenful Munagement and fkononiic De\~e/opmenl. I3altimore and 1,ondon: John I lopkins University Press. 1'1). 130- I7 I .
Arnold, .I. E. M. (1978). "Wood Energy and Rural Communities" Mimeograph, Forestry I)cparImcnt, I:AO, Ih i l c . I'p. 8- 10.
Awoke, M. U. (2001). Econon~etrics: Theory and Applications. Abakaliki: Willy Rose and Appleseed Publishing Coy.
Ayodclc, A . 1. (1002). "l:~icrgy I)cvclopl~crll and Ulili/.ation, I'olicy in Africa: Thc Nigcrim (.'ascY'. Jn K. Smail (ctl). ltrt/rr.s/ritrliztr/iorr, A.litrc*rol Re.sorrrcrs and 1:'nergy in Ajiicu. ScnegaliwC.OU.ES I< 1 A tlook Series.
I3aclioi1, A. S. (1990). "New Approaches lo lhc Dcvclopmcnr and Utilization of Ilcncwable Encrgy Resources i n Ilg~nda". In AFRI:13REN (ed). African Energy. I ,o~idon: Zed I3ooks I ~ t l .
Bannister, D. and K. Button (1993). flnvironn~ental Policy und Transport: An Overview irr Tr~rt~spor~r, rhc l:'nvit~otnnc.tr! c r t d ,~rr.vtainahfe Development. New York: E & ENS I'ON .
Hain, J.S. (Ic)0S). ln~l~rsrriul Orguniz~r~ion. New York: John Wilcy and Sons Inc.
13ahugi11~1, S . U . (1984). "Women's Non-violcnt I'owcr in Chipko Movement". In: Kishwnr, M. (ed), 111 Seorch o f Arr.v~~~r.v: Indiuns Women1.\. Voicesfrom Manushi. I .o~idon: Zed I'rcss.
Ikndcr, W. and M. Smith (I 907). l'opulrifion IJullefin. Vol. 5 1, No 4. Feb. p.3

I-ladley, M. and J.P. Lanly (1983). "'Tropical Forest Ecosystems". Nature and Resources. Vol. XIX, N o . 1. Pp. 12-1 6.
I Ialcrow, I I. (;. ( 1 980). Lc-orrotrric~.~ (?J'/lgr.ic-r~llr~r.e. New York: McGraw-I I i I I Rook Coy.
I-lam, <>.1>.,1). Sydney and I;. Dieter (1989). People and 'l'rees. Washington D. C: World I3ank.
I Inns-.lunger, V. M. (1 984). " The Role of Forest in Rural Development". Plant Research rrrrrl I )c~~~e/(~l>rrrc~/~l . Vol. 1 7, Pp. 52-68.
I lclbcrg, I<., R.M. Dave, G. 13anard (2004). I'uclwood Consumption and Forest I)cgratlation: A Ilouscholtl Motlcl for Domestic Ihorgy in Rural India. www.cldis.org/sta~ic./[)OO(,. 102-1 I'I'M.
Iloskins, M. (1979a), "Women in 1:orcstry for Local Community Development: A Programme Guide" Workshop Paper on Office of Womcn in Development, AID, Washington D.C., September. P.7
I loskilis, M . ( 197911). "('o~iimunity Part icipations in African Fulewood Production, I'ransl'ormatioli a id Utili~ation". A Workshop papcr on 1:ulewood and other Renewable Fuels in African, Paris Oversea Development Council, AID, Nov. 29- 30. 1'. 7
I lo\vc and SOCD (1977). "l:nergy for the Villages of Africa: Recommendation for Aliican Gove~-n~nent and Outside I>onors" Oversca I>evelopment Council, Washington D. C., February. . , , . , w f . P.83. .r , 3 > .
Hungate, L, S. and R. W. Sherman (1979). Food and Economics. West port, U.S.A: The Avi I'i~hlisliing Company. I t . .
I l i~tscl~cr, W .S. (2003). "Wood I.ncrgy Policy Ikvclopmcnl". Cfiocl Energy News. Vol. 10, No. I, March I'p3-5. *
Ifezue, A.N. ( 1 990). Principles ofA4urketing. Enugu: A.B.C. Books and Equipment Ltd. I'p. 77-80.

Illc~nc, I1.A. ( 1007). '1'11c Markcti~~g ol"l:ood ('rop in Ihugu State, Nigcria: A Case Study 01' I<icc, M a i ~ c , L ~ I I ~ I ~ I I I S , I J ~ ~ l ~ ~ ~ l ~ l i s l ~ c d M.Sc. 'I'I~csis, Ilcpartlncnt of Agric Ilcolioliiics, University 01' Nigcri;~, Nsukka.
I.ji~ng, '1'.1'. ( 2 0 0 0 ) . N'I'I:l' C'asc C'omparison ('osc 1)escription Report: Case of Puelwood in thc I'ar North Province ol'('a~ncroon, Aliica, Ilnivcrsity of l>ischang, March.
Igun, A . (1972). "Social and Lconomic Lill'ects ol' I<uraI Kapid Growth Ratcs". Poptrlution Growlh ~ i n d Econotnic Developmenf in Africa. Ibadan: Heinemann I'rcss.
I l l i Ilk, J . ( 1983). 7hi. Afi-ictrn l'oor-. New York: Carnbridgc I lnivcrsity Press.
International Labour Organization, ( 1 966). "Maximum Permissible Weight to be carried by one Worker". Rcport to the International I.abour Conference Fifty-five session, (;cllcvil. IIA).
Isniail. A.I< I:. (090). "l<~rral-llrlxui I louschold Ilncrgy use in Central Region Sudan" . In A I:IZ I II'IZ I:N (etl), Af t . i c~ t r r r I ! ' I I c J I . ~ I ~ . I ,onclon: Zcd I\ooks I Ad.
Iwayemi, A. (1983). "Energy in West Africa, Issues and Policy Approaches". Energy Policy. Vol. I I, No.3 Sept. Pp235-249.
.Icnni kr , A .I:.( 1994). A17 11~frothcfio17 1 0 S~ts/uinuhle Ilcvcloprnenf. 1,ondon: Routledge Publications.
.lohn, I<. W . ( Ic)04). l'opultrliorr. Calilimiy,: W++worth I'ublishing Company.
.lolinson, 1>.'1'. ( 1990). 771c 1hsirrcs.v of:firrnring. Idondon: Macmillian Press.
Katerere, Y. (1 992). '"l'he Valuation oi"l'ree 13ased Resources: The Problem". In: Kwaje, S.I. and 17.13. Mivanro (cds), I'rocccdings of thc First Intcrnal Workshop on cqmcily Iluilcling in 1:orcstr.y Kcsc;~~'cli in Africa, Kampaln, Uganda, Nov. 9- 1 1 .

K ~ I s o I ~ ~ , 1j.W.N. :111(1 K. Kitsa (100.3). "I<cSorc~~afion oSa 'I'own i n Zaira: The Katanaga I~xpcricncc" . ,4/i.i~-trrr I:'rrr~i~.orlr~~c~t~~. Vol. V I I I, No.3 1-32, I'p. 125- 126.
Kates, R.W. and V. Ilaarman (1992). "Where the Poor 1,ive: Are the Assumption ('orrccl'?". /:'n1~ir.o171rrerll. Vo1.34, No.4 l'p4- I 1 .
Ki- %c~.bo. I . ( I08 I ). "Womc~l and I<~~crgy ('risis in tlic Sahcl". IJt7tr.\:)hu, VoI. 33, No 13.3. 1'11. 5-10.
Kgat hi , I). I ,. (1 000). "A ('rilical Review o f I:ulcwoocl Survcy i n Botswana". I n Ak~IIIil'REN (ed). African Energy. London: Zed books Ltd.
Kohls, 1<.1,. and 1. N. IJhI (1072). Ahrrkclirlg c!f'Agric~rrlltrrd I'rod~rcls. New York: Macmillan Publishing Coy Inc.
Koirtsoyiannis, A. (1 070). Alotlerr~ A./i~.r.o ecorronrics. Imndon: Macmillan Press Ltd.
Kowis, I . ( 1070). '"l'lic I)ckrmin;rrif of' I;ncrgy in I.I'C Area". 1:'rrergj~ I'olicy, Vol. 4, No. 4, Ikc . pp 343- 354.
Kulnar, S. and D. Ilotclikiss (1988). "Consequences of Deforestation for Woman's Time Allocation, Agricultural Production and Nutrition in IHi l l Areas of Nepal". I<csc;~~.cli I<cporl, W;~slii~igIoii I).(': InIc~.ni~lio~lirl I:ootl l'olicy I<csc:rrcli Institulc.
I .a~ilhrcch~, 1). ( 1978). " N igcrin and its Wood". A ~ ~ n d r . Vol. No 1 . Pp. 19-20. * , ,, . 4 w * . .,' , . 3 * '
Leach, G and R. Means ( 1 988). Beyond the Woodfile1 Crisis. London: Earthscan Publication.
Lloyd, 'I'. and '1'. Laura ( 1990). When ~ h c bough bkuks . London: Earthscan Publication.
Maddala, ( i .S . ( 1992). Irrlrod~r~~ion 1 0 Ec~onot~relric. New Jcrsey, USA, I'rentice-I-iall.
Mndlnl, S. ( 1995). "Regcncrating Indian's Forest: Reconciling Gender Equity with Joint Forest Management". In.stilzr/e of'DcveIopment SIZILI~L'S. VoI. 26, No3, Jan. Pp. 84- 88.

Madueke, C.M. (1988). "Masking of Processed Staple Food Products of National Root Crops Production Company, Enugu". An Unpublished Project Report, I k l ~ ~ - l ~ i i c n t 01'Markcting, I l~iivcssity oI'Nigcrin, 1In11gt1 <'ampus.
Mbagwu, T.C. (2000). "Enugu State". In Mamman, J.O., Oyeban-ji, S.W ., Peters S. W. (cds), Nigerirr A I'eoplc IJ t~ i / c~ l , / I f i l lwe A,v.st/rctl. Vol. 11. Abu-ja: Federal Millistry 0 1 ' Inlhsmation.
McC'asthy, 1:. .I. and W. I>. I'crrcault (!'OW). Ihsic bIurk~/irr,g. New York: Von I-loffincnn Press Inc.
Mcc'oy, .l.l I . ( 1088). l,i~v~,vioc.k rrrrtl Atcrrl A lrwkc~/itrg. New York: Van Nostrand Rcinhold ( 'ompiiny.
McGrath, M. E. ( 1 999). Prohc l Slru/e,gl, fbr. ffigh 7 ' e c h n o l o ~ C'omnpunies. New York: McMillan Pscss.
Mdagllsi, C'. A . ( 1905). "Womcn, I-hvironmcnt and I'opitlation: A Morroccan Case Study". ln.slilrr/c. r ? f ' l ~ c ~ , ~ c ~ l o l ~ t ~ r c ~ t r ~ ,Sltrrlic.s. Vol. 26, No I . Jan. I'p. 6 1-64.
Mil lcr, G.T. ( 1 992). I ,iving in the hvisontnent : An It~/rotfuc/ion lo Environmenful S"i'.ietic.c. Wadsworth, I3clmonth.
Ministry ol' Infi~niiulion (1002). Unpuhlislicd I'rolile on I h ~ ~ g i t Slate, 1:nugu
Minlia.j, A.J. (1996). "Co~istrai~)~s.RslatcJ to Woodfitel Production and Marketing". A 'I'ccllnicnl l'apcr I'rcsclltctl n t National Training Course, RADA, Bogra, I\anglndcsh, 7- 1 1 I)eccmhcr.
Mishru, 13.1,. and I'.K. Mislirn, (1982). I'ricc Spread ol' Wheal and Grain in Ccntral Madhya Pradeshi. Agricullz/rul Murkeling. Vol. XXV, No.3. Pp. 23-25.
11 I .
hli~lcntlosl', 1I.J. (1003). "Improving I'lly~ici~l Markcling Inli.:~stritctusc in Africa through mosc Scl f-l lclp". A hot t. J . (cd). /1,~yic.rrllr/re trncl 1ti)otl Mwkcling in Developing ( 'orrtrltic*.~. I .o~itlon: I .ong~ll ;~~i Cisot~p I .ttl.
Mniravn, I:. M. (1081). "Villagc Industries Vs Savanna I:orcst". Unusylvu. Vol. 33, No. 13 I . l'p. 24-20.
Mosgi111, W . I ) . (1083). "Wood t lct i~a~~tl , S tdying the ('o~iin,crciaI Organizalion 01' Woodluel" I'AO. Rome.
Morgan, 1 1 .I<. ( 1965). "Concentration in I:ood Retailing: Criteria and Causes". Journul of ,firrrn l:'conotnic,s. Vol. 48, No2. Pp 1 23- 149.

Myers, N. ( 1003). "'l'ropical I:orests: 'l'hc Main llcforcstalion Fronts". Lnvironmen~ul ('o~i.v~~r.\~utiori. Vol. 20, No. 1993, Pp9- 1 5.
Nrgbraliariian, D. and .I. Sanibriani (1083). "Women Drudgery in Firewood Collection". l I~~)rro~~i ic~ tr~rtl l'oli(icwl .Weekly. S i ~ n 1-8, I'p. 36.
Nation;~l I'opulation Commission (2000). I:cdcral Rcp~~blic ol' Nigeria Official Gazcttc, No. 21, Vol. 01, May 15, 2007, 11. 11 185.
N igcrian I hvironrncntal Stidy Ac t io~~ ' l 'ca~~i. (NIS'I') (I 000). Nipt.i(rn :v Threulcnccl Environmenl Nulionul Prqjile. Ibadan: NEST Publication.
Nl,o~~ol,i. S. I<. (l0X.Z). " ' l l~c 1,;11~1.gy ('risi\ 0 1 ' t l~c I'oor i n ' I ' ~ I I I / ; I I I ~ I I : \ I ~ " l<csci~rcli l<cport ol' h e 'I'anzania I<ural I:ncrgy C'onsumption Survey, Inslilulc o f Developmen( Sllrdie.~., University ol' Dares Salaam, 'l'anzania.
Nwude, K.C. ( 1 992). "Survey of Some Neglected and Under-Exploited Multipurpose 'Trceslshrubs in Abakaliki Agroccosystem". IJnpublished D. Sc. Thesis, I)cpar~~ncnt of Crop Science and Animal I'roduc~ion, Ikugu State University of S c i c ~ ~ c c ~ I I C I 'l'ccl~nology, Al~h i~ l ik i C'a111ps.
Obi, A. (1984). '"l'lic Marketing ol'Sliccp and Goats: An Analysis ol'Supply and Prices in Sclcctccl M;~rl;cts in Oyo State". Ilnp~~hlislicd M. Sc. 'l'hcsis, Dcpartmcnt of Agrici~ll~~ral I:,cononiics, I Inivcrsily ol' Nigcrin, Nsl~l;k;~.
Obinne, C.P.O. and N.E. Mundi (1999). "Prospects of Alleviation of Poverty in Rural Nigeria". In: Fabiyi, Y.L. and E.O. ldowu (eds), Poverly Alleviation and Food Securily in Nigeria. Ibadan: Times Roman Fronts.
Ogbuakanne, V. I. (1998). "l'conornic Analysis of Rice Marketing in Anambra State: A ( 'we Sludy o f Ormi1~1 NorlIi and Sotilh I,.G.As".. IJ~~p~rklished M . Sc. Thesis, I )c~;wIn~cnt 01' Agrici~Ili~r~~I I:cono~ilics, I Jnivcrsity ol' N igcria, Nsukka.
Qji, K . 0 . ( 1 904). Comparative analysis of Rural -Urban Demand for Selected Products in Abia State, Nigeria. An Unpublished M. Sc. Thesis, Department of Agricultural I<conomics, I Jnivcrsity of Nigcri;~ Ns~rkk;~.
Okalijr, .I.('. (1986). "l:orcstry and Al'lbrcstalioti l'rogram~ne in the Rural Areas". A paper prcscnlcd at llic Deparlrnent ol' I'ublic Administrolion and I,ocal Government Seminar, University of Nigeria, Nsukka. Feb. 26.
Oknliw. J.C. (2000). "l,ist o f I'l;~nt species ;I( I:anic AgricuItlrrc\l Centre". A Paper I'rcscntcd at M'I'RM, Ihug i~ Shlc Agricultural Ocvclopmcnt I'rogramme. April.
0haIi)r. .l.C'., l:.l. 01llorodio11 i inc l l:.S. AI~~; I / .u (1004). "Noi i - ' lh lw l:orcst I'roducts". Draft Report Prepared for the National Tropical Forestry Action Programme (NTFAP), Forestry Management, Evaluation and Co-ordinating Unit, Federal I)cpartnicnt of' Forestry, Ahuja,~Nig~iiir.
O'Keefe, 1'. (1983). '"The Kenyan Fi~elwood Cycle Study: A summary". Geography ./orrrtitr/. Vol. 7 , No. 1 l'p23-3 1.
Okckc. I-.(]. (1988). A 1:11nction;~l Analysis of Food ('rop Marketing by FMCS in Ananihra Slalc and Itno Stale, All1 Ihipublislicd l'h.ll 'l'l~csis, Department of Agricultural Economics, University of Nigeria, Nsukka.
Okcrckc. 0. and ,).R.O. Antlionio (19'88). '"l'lic Structural Characteristics of the Market li,r ({rail~s i n I:asrcr11 NigcriilV 111 Atlcka~iyc, 'l'.O. (ctl). ~t,qric~rrl/rrrcrl M(rrkc1ing. Ilxltlatl: I ,ongiilan Nig. I Ad.
Okigbo, 13.N. (1986). "Allcy I:arrning in I lunlid and Sub-1 lutnid 'I'ropics", Proceedings of an International Workshop held at Ibadan, Nigeria. March 10-14.

Ol:hisi, I.A. ( 1000). 1)onicslic Ihcrgy Situarion in Nigcria: 'I'cchnological Implications and I'olicy Altcrnativcs, Jnpi~l~lisllccl Scminar I 'u lx~- , I)cpi~rtrncnt ol' Sociology, ()l)alL.~l~i Awolowo I I~livcrsily, Ilc-Ilk.
Olukosi, J . 0 . and S.IJ. Isitor (1990). Ir~~r~orfzrcfion lo Agriczrllural Markefing and 1'1.m-lice: Print-iplcs trtid App1ic.trlion.v. F.C.T., A h j a , N igeria: G.U. I'ublication.
Oniar, M. and 11. I'riya (1000). "Il~idcrslnnding Diofi~cl Dynamics in Developing Countries". In I3.C. Philip et al (eds). The World a1 ,he Cross Roads. London: Earthscan Publications.
Onycikc, 1i.11. (1970). "'l'hc Supply and Marketing of 1:ircwood in Aba 'Town". An IJnpuhlisIicd t3. Sc. l'hcsis, I)eparlmcnt of Geography, University of Nigeria, Nsirkka.
Ope~~sIiaw, K. (1074). "Woodli~cls in llic 1)cvcloping World". New Scicnlisf. Vol. 61, No 8 8 3 , .Ian 3 1 .
Opcnshaw K. (1980). "Woodliicl-A lime ol' Kcassessmenl in Energy". In: Smil, V. and W.E. Knowland (eds), Energ?, in fhe Developing World. New York: Oxford I Inivcrsity press.
Osi!ji, 0. (1980). "Rice Marketing in Abcokuta I,ocal Govcrnment Area of Ogun State, Nigeria: A lunctional Approach". Nigerun Jozrrnul oJ'Murkefing. Vol. 2. P p . I I - 24.
O S I I I ~ ~ O ~ L I I I , A.A., It. Ac1eyc1110, ~ , l . . r ( ~ ~ t ~ ~ ~ ~ , $ h i ~ ~ ~ l > i (1081). M i ~ ~ ' l < ~ t i ~ l g : I I ~ I~istr i l~ulic)~~ 01' I:ootl (bps in Nigcria I'hroi~gli t l x I)cvclopmc~it ol' I:armcrs7 Coopcrativcs: A Strnlcgy of Approach Ihr the Grccn I~evolution. 1:ederal Department of Agric. Cooperatives, Lagos.
l'andcy, I.M. (2001 ). I~i'rttrt~c.itil Riltiritr~ctnc~if. New Delhi, India: Vikas Publishing I-louse I'V'I. I ,Id. 11
Pandey, I.M. (2002). Fuelwood Studies in India, Myth and Reality. Jakarka, Indonesia: Centre for International Forestry.
I'ctcrs, S. W. (2000). "l'ncrgy I<esourccs :lnd I'nergy Policy in Nigcria". I n Ajaegbu, I I.)., Mathew-llaniel, D.J., and Uya, 0.E. (eds) Nigeria, A People Unifed, A Future .4ssrrrd Abi!ja: Federal Ministry of Information.
Pimentel, D. and M. Pimentel. "Energy use in Food Processing for Nutrition and Development". Food untl Nutrition. Vol. 7 No. 2. Pp. 36-70.
I<mian;~kasini~, 1;. ( 1086). "Al'rican Women Ilrace for Advancing on Desert": Women and Ihvironmcntul ('risis. Report ol' Workshops on Women's Environment and Llcvelopment, 10-20 July, Nairobi.
Remedio, E.M. (2004). "Wood Energy and Livelihood, Patterns: A Case Study from the Philippine". Corporate Documentary Repository, Rome.
Sa~iinnt, I).\>., E.V. Shiva and S.I.. Skar (1082). Social 1:orcstry i n Orissa: A Case Study on I:ucl Availability ancl its Iml'uct on Wonwn's 'l'inw I)isposilion and 1,ifestylc". Operations Iksearch Group, t3lii1baneswar, India.
Scn, A. ( I 08 I ). Powr.~y clnd l*irrr~jrw. New York: Ox ford I lnivcrsity press.
Shepherd, G.S. and G.A. I:utrcll (1971). Murketing I+'urrr~ 1'rodulrcf.v. Ames: The Iowa State University Press.
Sidhu, D.S. and P.S. Rangi (1979). "Price Spreads in Egg Industry in the Punjab". Indian .lor~r~rrtrl c~f'/lgt.ic~r~l/r~r~crl l<corrorrric-.v. Vol. Xxxiv, No 4 . Oct-lkc. Pp. 168-1 79.
Sniil, V. and W.E. Knowland (1980). l:'r?cr.gy in //re lkvclo/)ing World. New York. Oxford University Press.
., ,, . . m l . ,?. , .>+
Smith, K. I<. (1983). 13ioli1cl Air I'oll~~tio~i illid Ilealtli: A Global k v i e w . New York. Plenuni.
Smith, K . R. A. Rasmussen, I:. Manegole, and M. Apte (1991). Greenhouse Gases from Small Scale Combustion in Developing Countries, Environmental Protection Agency Ikporl. ( I . .
Smith, K . I\., S. G I J , K . llunng and I). Qui (1993). "Onc Ilundrcd Million Improved Cooking Stove in China: I low was i t done". World lkvekoprnenf. Vol. 2 1, No 6. l'p. 94 I -6 I.
Spear, J.S. ( 1078). "Wood ils i1n Icncrgy Source: 'l'lie Situation in llle I>cvcloping World". A papcr prescntcd at tile 103 A I ~ I I L I ~ I ~ Meeting, Washingloti I1.C. lJSA Oct. 8.

Stern, L.W. and A.1. El-Ansary (1983). "I)istribut~rs: No Ihdangered Species". l n h s / r y W w k , January 24, I'p. 47-52.
Super. S . ( 1980). "Women: Kcy to I<cfi,rcstation". /Ij.ytt(kr, Vo1.3. No I , .lan./l:cb. 1'1). I 8- 19.
Thomas, R.L. (1 993). Introdtictog) Econometric: Theory and Application. London: Longman.
Thomson, J.T. (1983). Participation, Imal Organization, I m d and Trce Tenure: r:utl~rc 1)irections Ibr Sahelian FOI-cstry". Club du Sahel, New Delhi, India.
Tomck, W .G. and K. I. Robinson ( 1 990). Aaqric.ril/~irol l ' r o J z ~ / Priccs. l thace and I ,ondon: Corncl l Onivcrsity I'rcss.
Udo, R.K. ( 1 987). A C'omprchcnsive (;~o,qrcrpC~y of West Africu. I badan: I-leinemann Educational Books (Nig) 1,td.
Unitcd Nation Environmental I'rogrammc and United Nation Development Programme ( 1 993). World Re.volit-c~c~.v. New Y ork: O x lixd I Inivcrsity Prcss.
Upton, M. (1996). The Economios~f;.Tropicul Farming System. New York: Cambridge IJniversity Press.
Upton, M and Q.L3.0. Anlhonio (1075). / + i ~ t ~ r i n g us u 1 ~ ~ ~ i n c . s . ~ . Bath, Great 13rilain: Pilman Press.
Walters, A.A. (1 969). Introduction to Econontetrics. London: Macmillan Press Ltd.
Wardlc, 1'. ;ind M . I'almicri (1081). "What I>ocs I:uclwood Rcally Cost"? IJn.syI\~u Vo1.33, No. 13 1 Pp20-23.
Werner, S., 13. Martin and G. Wuyla~id (1087). l:'conorttic~.s. I3oston, Massachusetts, U.S.A.: I-loughton Mifllin Company.

Wikipedia (2005), Gini-coefficient: www. Wikipedia, the Free Encyclopaedia.
World 13ank ( I 990). World l)cveloptrot/ l-?c~l)ot-1 I990 on /'overly. Washington I>.C: Oxl'orcl I Jnivcrsity I'rcss.
World 13anli ( 1085). "'l'hc / " ~ ~ c / ~ ~ w o i / ( 'I-i,~i.s in 'l'rol)ical Wc.v/ Africu ", Washington D.C: World I h i k .
World I-lcalth Organization (WHO) (1984). Biomass Fuel Combustion and Health. Gcncva, World I.lealth Organization.


Test of Hypothesis I1
.\', - ,Y ,
- + -- n-1 n - l

'I'hc ~nurket margins ol'thc: l'i~clwood niarkct participants.
Wholesaler's (MM) #5,770.83 - #3,950.00
Rctnilcr's (MM) #7,29 1.67 - #5,770.83
Retailer's percentage marketing margin
Harvester's share = 100% - 25.0% - 20.9% = 54.1%

Appcnclix Ill
'l'he linear and scmi-log regression equations and estimates
parameters for the quantity of fuelwood supplied in kilograms.
Semi-log
-7 1532.73 1
(-5 S45)
-2339.308
(-3.385)
2689.383
(1.123)
4256.442
(2.8 18)
'k valucs in parenthesis arc 1-values

Appendix IV
quantity of fi~elwood demanded in kilograms.
Yd I ,inear regression Semi-log
169.95
(0.482)
00.703
(2.178)
-38.563
( - 1.388)
69.7 I 6
(1.748)
-259.09
(-1.01 I )
45.838
(I .478)
I<' = 0.366
1: 13.170
'I'he values in parenthesis are t-values

Appendix V
I>cpartment 01'Agricultural f7conomics,
University O f Nigeria, bisukka.
24'hApril,2005.
SirIMada~n,
'I'liis qucstionnaire is ~iicant to carry out study on I~conomic Analysis of Fuelwood
Markcting and Consumption in Enugu state. The questionnaire is administered by a
postgracluate student liotn tltc above dcpartmcnt of the institution.
'I'hc rcscarcl~cr is recluesting that you supply the accurate information required
because the purpose of the research is purely for academic exercise. You are assured that
every inl'nrmation supplied will be treated with confidence.
'I'hanks Ibr your cooperation.
Yours Sincerely,
Ebe, Felix E.
I'lcasc tick (4) the appropriate onc(s) where applicable.
I . What is your scx?
a. Male
b. I:cmalc r^7
3. What is yolrr mirrild status'?

h. M;tn.ied a c. Widowed /-/
u 4. What is the number of years spent in formal education? -------------
7. what is your monthly income? ...........................................
a. #I, 000.00 - # 10, 000. 00 , /7
13. N 10. 00 I . 00 N20. 000. 00 /-7 1 2
c . W20, 00 I . 00 - #30, 000. 00
d. #30,001. 00 - W40, 000. 00 E7
c. #40, 00 I . 00 and ahovc
8. I low many ycars have you bccn in liwlwood collection and sales?
SICCTION 1 1 1 : Faclwootl Collection And Marketing?
9. Who are the people involvcd in the sourcing and sales of fi~elwood?
a. Mcn only
b. Women only -0
c. Children (Boys and Gir.ls$ .:t. "r""-7
1 1 . How many times do you sources fuelwood in a week?
a. Oncc
1>. 'I'wo timcs
e . I:ive times and above /-7

12. When does fuelwood collection become easier?
a. Dry season L z I I . 7 1,. I<i\illy/ W C l SCi lSOl l LzI7
13. What was the average monthly collection during the period April 2004 -
Apri I
May
Junc
J u l y
Augusl
ScptcnlI'cr
October
November
I Icce~iibcr
January
b'cbriiary
March
14.
a.
b.
C.
t I .
e .
t : 15.
i l .
b.
C.
d.
What are the sources .. of ,, your .r. .r , fuelwood ,,.. collection and sales?
Surplus arising ftom agricullural land clearing /-7
Natiiral foresttopen woodland
'I'rees felled l'rom government dcvelop~nent projects /-7
Rural market /? Name the market
I'arm gate

16.
a.
17.
C.
d.
c.
17.
i1.
I ) .
18.
11.
I> .
c.
d.
e.
19.
a.
b.
C.
tl.
e.
1:
g.
20.
a.
b.
C.
? I .
a.
What is the distancc liom tlic placc ol'collection lo the placc of sales?
I ,ess than 5 km /7
15 -20km L.II7' 2Ok1ii and nlwvc [--7
What are the types of fuelwood sold?
What are the criteria used by buyers to assess the quality of fuelwood?
I-ligh burning capacity
Less smoky
Production of good charcoal and less ash L__./
I low oftcn do y o ( ~ bring yollr product (li~elwood) to the market?
Daily L L Z I ~
I'very two days n 1:very four days (native-wcteks) . o n ~ c i l l il \vcck
Lz7 /L7
Fortniglilly
Once in a month Lcz7
b. Fix pricc in considenilion ol'lhc cxpcnscs incurred /-7
c. Fix price based on market condition of supply and demand D

d. I:ix pricc through bargaining with custorncrs
22. Do you think that buyers ol'l'uelwood manipulate prices (s) to your detri'ment?
I . Yes - I?. No - a. Very stable /-7
rl. Not stable /-7
24. Is there any restriction in selling (ilelwood?
a. Ycs /-7 b. No 0
25. If yes, what are these restrictions?
26. Arc tlierc many scllers ol'li~clwoocl in the markct?
a. Yes 1-/ . , .. .. 9 "i: rl' ,.. ..'l.,' '
b. No 0
27. Arc therc many buyers of li~elwood in the market?
a. Yes /7 b. No '/-- I * . ..
SECTION IV: Marketing Cast And Returns
28. Which of the following Inems clo you llse in transporting your fuelwood?
a. I lead porterage /-7 17. Wlieelbarrow L-.-/
c. Iiicyclc
cl. Motor- bike

Is ~ h e road li.o~n your place l o ~ l i e niarket larred?
Yes /---7
If your answer i s N O docs the condition o f the road have effect on the
quantity and cost ol'tiwlwood transported?
Yes P-7
I f ' yes, what are the avcragc ~nonrhly charge per IOOOkg ol' Iuelwood during
tlic period A1
Month
Apr i l
May
June
July
August
Sepkm her
October
Novem her
Ileccmhcr
January
Fcbrur~ry
March
Quantity (Kg1

32. Whal ql~antily of li~clwood d o you sell ill a wcck and how lnirch d o you
rcalizc at tlle following placcsl~iinskct?
2004 - March 2005.
Month
A pri I
May
.I unc
July
A11g11sl
Scptcrn bcr
Oclobcr
Novcmbcr
I )ccclllhcr
.lanuary
February
March
Amount(#l Murltcl 1'l;lccs -- Farm gale
Itoat1 sitlc
IJrlmi market
I<ur.nl nlarlict
Cost (PC)
33. I :stit~iatc Oic average inconic gcncratcd from the sale of fuclwood from April
Ouantity(Ke)
34. What quantity o f fuelwood did you transport in a month and at what cost
~llrough the li)llowing distance?
Murltct Pluce
I jrbuu market
I<ond side
Rural market
Means of Transportation IXstance O i ~ a ~ ~ t i t y Cost

133
35. What other cost (s) did yo~r inclrr in sourcing and marketing the fuelwood in a
month'?
Nature OI' Work
Cutting
Stacking
'I'oll lkcs
Chareel1 000kg ( W )

What is your sex?
a. Male / / b. Female r7 What is your marital status?
a. Single D h. Married /7 c . Widowed /--/ d. I)ivarced I--/ What is the number of years spent in formal education? ------------- What is ~ h e sizc 01' youy, !?~mi!~~]i~)l ,~? .-------------------------------------
What is your prilllary occllpatioll? ..................................... -- What is your monthly income?
/-7
c. N40, 00 1 . 00 and above f-7 I low many ycars havc you hccn in I'uclwood marketing'? ------------

SECTION 1 1 1: Sources Of Fuelwood and Marketing System: 0 . Where do you purchase your li~elwood?
10. From whom do you buy your fuelwood for sale?
1,. Rctailcrs 1 /
I I . 'I'o whom do you scll your liiclwood?
12. How frequent do you p~~rchase your fuelwood? - a. Daily / / h. Every two days / /
e. Once i n a month r-7 13. When do you get more supplies?
I . Iluri~ig dry scilsoll
h. During rainy/wet season /7
14. W hcn do you 111akc 11iorc si~lcS"! . .,
I . During dry scason ,"-7 .-
b. Iluring rainy scuso~l u 15. Wliat arc ihc critcrii~ 11scd hy buycrs to asscss thc quality of Suclwood?
I ligll burning capacity LZ7' Mill~irity o1 ' t I~ trcc f -=--7 Less smoky
I
Production of good charcoal and les ash 0

I . I low do you arrive at the price at which you sell your fuelwood?
it. I:is pricc i th i l~~i t~ . i ly /7 I). I:ix price in consideration of purchase and otllcr expenses incurred /-7 c. I:ix pricc bascd on market conditions of supply and demand
d. ITix price tlirougli bargaining with retailers or consumers Ll"
/-7
SECTION 1V: Market Structure:
b. Monopoly (one scllcr, many buyers)
c. Oligopoly (I'cw buyers and sellers)
(1, ()tilers (spcci IbY) .........................
18. Arc tllcrc s o n ~ burricrs to ~ ~ ~ t r y into the li~clwood ~nurkct'!
a. Yes L 7
I . I 1' yes, mention thc hm-icrs
20. Do you oflen know the prevailing market price of your fuelwood?
a. Radio L!l.J
h. Newspapers/otlicr publication 1-1 c. 'I'rildc associations /--'-7 d. Market place /-7

33. I S your product ( l i l~lwood) i l l any way dil'l'crcnt li.om that of anothcr scllcr
sclling the same product?
23. If yes, how does it differ?
SECTION V: Marketing Cost and Returns:
25. What is the distance !?om h e placc of purchase to the place of sale?
a) Less than 5 krn
b) 5 - IOkm /-7
C) 10- l5km 7 :
c) 20km and abovc / / 26. Is thc roitd Icading to ihc place wherc yo11 buy your product tarred?
; I . Ycs /7 I,. N o /---7 u
27. 11 no, is the area accessible during rainylwet season? (a) Yes /-/ (b) No /7

market where yoit scll, do y o ~ think that transportation cost is high?
i\ .
11.
29.
i l .
1).
C .
d.
C.
Yes /-/
If yes, what islare the factors responsible for the high cosl?
Cost 01' i i~ct /7 cos t of spare parts /T Condition of road /-7 'I'lie dist;~ncc Srom ,lie plncc o f ptirchase to the place ol. sale /T Ikploitativc tendciicy of the drivers LL./
30. What was the average monthly transportation charge per 1000kg of fuelwood
dtrring tlic period April 2004 - March 2005. ,
.I w e
.Idy
Augusl
September
()ctoOcr
November
December
January
I:cl~ruary
March
3 I . What ollwr cxpcllsus do MI incl~r in the cot~rsc 0 1 ' running your l'uelwood
Quality (kg) Mon tlr
April
business'?
a) Loading and off - loading /7
Cliarge/lOOkgj#~
h) Splitting of tbe log / /

33. 1 tow much i s the monthly security charge? # --------------------------
35. 1 low milch is the Local Government monthly rate #------------------
Q I I ~ I ~ t i t ~ (kg) N;riu~-c of work
1 .oacling and ol'l-loading
Splitting of the logs
3 . I low mucl~ is thc \ Y I I o I L ' s ~ ~ ~ I . s ' associalion monlhly dues'? #--------
Cl~i~rgc/lOOOkr~ (W)
37. Whal was tlic avcragc ~nonthly pricc at which you purchased fuelwood from
April 2004 to March 2005.
Month
April
May
.I~lne
July
August
Scplclnhcr
()cLoOcs
Novcm hcr
December
January
l:cIwui~ry
March
Ouirntity (kc) . , 4 . . 1 $ '

38. Estimate the average n~otitlily selling price of your fuelwood from April 2004
Price (N) Month
April
M ny
s 1rnc
S11ly
A L I ~ L I S ~
September
Octobcr
Novcm bcr
I )cccllll)cl.
January
February
March
Ouantitv (Kc)

SECTION1 : Identification
Plcasc tick (d ) the appropriate one (s) whcre applicable.
I . What is your sex?
3. What is your marital status'?
c. Single D d. Married /-/ c. w itlowctl /-7 f. Divorced /-7
4. What is the number of years spcnt in formal education'? -----------------
7. What is your monlhly illcome?
8. I low nlany years h a w you hcc11 i n I ' t~~Iwood marketing? ----------------

SECTION 1 I I : Sources Of Fuelwood and Marketing System:
a. Fuelwood harvesters / /
'I'o wlmm do you sell your fuelwood?
(imsulners 1-1 Wholesalers / / I low licquenl do you purcllasc your lilclwood?
I );lily /7 Every two days /- -/ IIvcry hut- days (o;llive weck) /f Fortnightly /-/ Once il l it mo~llh - . . ." . . , ., ..
When do you gel tnorc supplies"?
a. 1)uring dry scason L ! I 7
b. 1>u.ring rainytwel season / . / When do you make more sales'?
a. During dry scrtson
h. 1 hlrillg rililly sc:!Wll
LX7 LIZ7
Wlial arc thc criteria used by buyers to assess the quality of fuelwood?
;I. I jig11 bwning ~t\l,i~cily /-/ 13. Maturity of the tree
c. Less smoky L E I 7 17
d. Production of good charcoal and les ash 1-1

17. I low do you arrive at Lhc price al which you sell your filelwood?
:I. I'ricc fiucd h y rcti~ilws /-/ / -- - - /
c . I'rice rci~cl~cd tliroi~gl~ hi~rgi~i~li~lg wit11 C O I I S L I I ~ I C ~ S /-I (1. ()[Ilcr (spcci --------------------------------- /7
18. 1 low do you arrive at the retail price of your fuelwood?
il. I p i c I i t ~ i ~ i l / / h. Isix pricc i n co~~sirlcr;~t ion ol'p11rc1i;lsc and other cxpcnscs incurred E 7 c. Fix pricc bascd on market conditions ofsupply and demand /7
h. Monopoly (one scllcr, many buycrs) 0 c. Oligopoly (l'ew hi~ycrs and sellcrs) n
Arc there some harriers lo entry into the fuelwood market?
c. Yes /-/ . , $ . . "1. 3,. , ,<.
d. No /-/ IF yes, mention the barriers
Do you ol'ten know the prevailing markel price ol' your lirclwood?
a. yes /-/ I,. N o / -
Radio /-/ Newspapeniother publication 1-1
/----7 Trade associations L!---/

1 24. Is your product (fitelwood) in any way different from that of another seller selling
25. I I. yes, how does it dill'cr?
) SECTION V: Marketing Cost and Returns:
) 26. Which of t11c following means do you use in transporting your good from place of
I purchase to the place of sale?
a. I lead porterage / /
I
d. Motor- hike
. . 11. CJtll,cl.s (spccl[ y) --------------------------------------------------------
27. What is the distance from the place'of pufchase to the place of sale?
28. Is [lie road leading to the place where you buy your producl tarred?
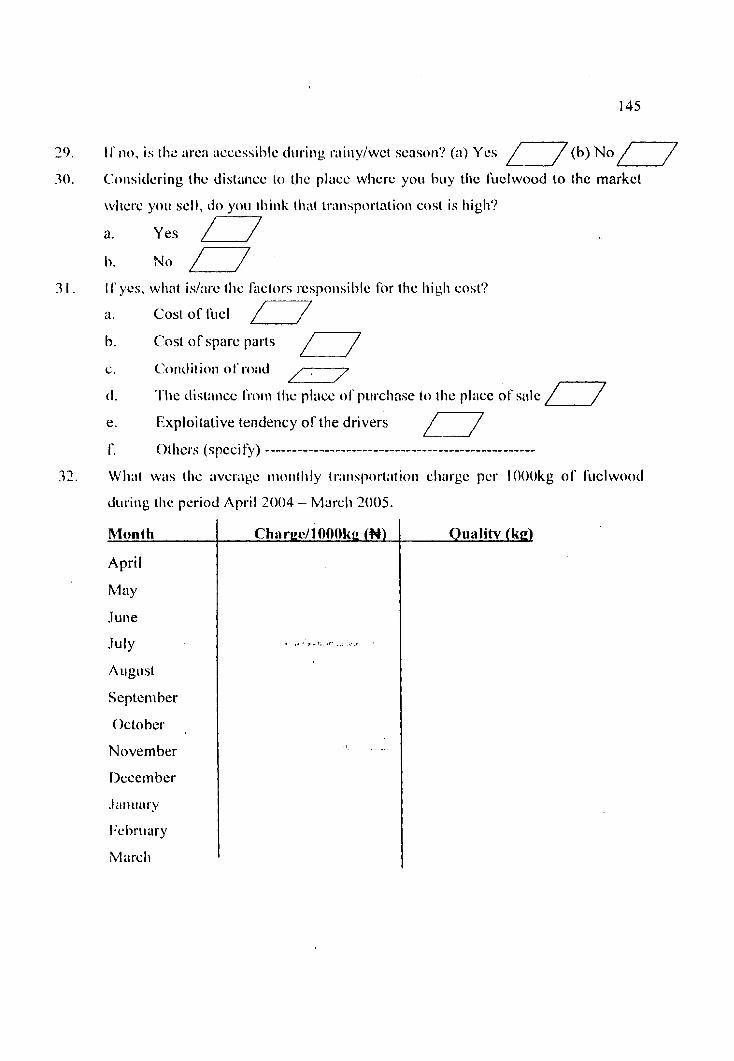
C'onsiclcring tlic distance to the place wherc you buy thc tirclwood to the markct
\vllcrc you scll, do yo11 think that triuisportntion cost is high'?
a. y e s /-7
Il'ycs, what idarc the ft~clors rcsponsil>lc for the high cost?
a. cost or 1i1e1 1-7 b. Cost of spare parts
C. C'oncl it ion o I' r o d E 7 0
during t l~c period April 2004 - March 2005.
Month
April
May
June
July
August
September
October
November
Ikcember
.l~lllllilI'y
1:cbruary
Mi~rcli
Quality (kg)

33. What other expenses do you incur in the course of running your fuelwood
busit~css?
a. I .oadiag and off- loading / /
c. Securily
d. Storage
11. Associal ion chcs
35. 1 low rn~~ch is thc ~nonthly sccurily charge? #------------------------------
36. I low much is the monthly storage charge? #-------------------------------
37. 1 low much i s the 1,ocnl ~;(!vergh~nn~~lt,~jionthly rate #---------------------
38. I low much is thc rctailcrs' association monthly ducs'?N -----------------
39. What was the average monthly price at which you purchased fi~elwood from April
34. What were rile averngc monthly clial-ges per 1000kg of fuelwood?
Nsiare of work
Loading and off- loading
Splitting of the logs
2004 to March 2005.
c h i r w / l OOOkg (#)
Mon tli April
May Sunc .Illly August Scplem hcr Octohcr Novcmbcr 1)ccembcr January Febri~ary March
c~usntity (kg)
Qr~antitv ( k d . ..

march 2005.
Month Quantity (Ke)
April
M a y
.I 1 I W
J11ly
August
Septe~n her
octobcl-
Novcm bcr
[kcember
January
I:chruill.y
March
SECTION VI: Problems Of Fuclwood Marketing.
4 1 . What arc the prohlcms of l ' i~~I \vood markcling? ., ,$. . - I" .,. , .,..
I).

SICCrTION 1 1 : Socio -1~conorii ic C'liarncicrist ics:
I . What is your sex? m
a. Malt: / / I, . I:cmillc rn
3. Whai i s your martial status'?
a. Single D 11. Miirricd /T c. Widowed /T d. Divorced /-/
4. What is thc nilmber orycars spcnt in ror~nal education? -----------------
7. What is your occupation?
Civil service GI, -------
Artisan /T 'I'ci~clling (;I, -------- (Mrcrs (spcci l'y) --------
8. What i s your tnonthly incomc'?
a. 44 1 , 000.00 - # 10,000.00 /-7 I>. #4 to, 00 I .oo - #20, 000. 00 LEI7 c. W20,OO l .OO - W30, 000.00 /7

0. Do you LISC l'ilclwood in your housc?
a. Yes 1-1 I ) . N o [--77
10. If'ycs. which of the following (s) influence your decision to use fuelwood?
a. It is readily availahlc /7 b. Low price L7 C . I .OIV ~ I I C O I I I C . Sti l t t l \ ~ ) I . ~ I I U I I O ~ ~ S C I I O I ~ /-/ d. I ligh priccs of altcrnalivc cnergy sources/'/-7
e. Little or on investment in secondary appliance - LI7 I: Size of ihc hoasclr,ld / / g, l 'ypc of li)otl cookctl c - 7
I I. What islare thc domcstic uscs of f ~ ~ c l w o o d in your household?
a. Cooking ~ , - - - - - 7
c. Preserving food/drying~phkfkt/" /" / d. Ironing /7
12. What is the average quantity of'li~clwood used in the following? I ' . , .
Quantity used Total quantity used Monthly (Kg)
Cooking
Ironing

SECTION IV: I'xpenditurc On Fuelwood and Alternative Energy Sources:
13. Is liielwood market accessible to you?
a. Yes /-/ b. Nu /-/
I I . I I' yes, \vhnt is Ilic distilncc l'ron~ yow house to the nearest market where
15. I h you think tI\i \ t pool l ~ ~ \ t l ~~c two~.k I~as lcd to poor distribution oI' Suclwood in
your area?
a. Yes 1-7
16. If yes, do you believe that an improvement in the distribution network will
enlialice the marketing 01' li~elwood in your area'?
a. Yes L7 b. No 1-7
17. Whom do you buy your filelwood? m
a. Fuelwood harvesters / / b. Wholesalers /7
a. I ligh burning capacity u 11. Maturity ol'lrccs /-/ c. 1,ess smoky
d. Production of good charcoal and less ash L7'
19. Does the size of your household at any time influence the quantity of fuelwood
you buy?
a. Yes

21. How much do you spend on fuelwood?
1 . W c&ly'? .................................
b. Monthly'? # ...............................
22. In addition to fuelwood energy. what other alternative encrgy
source (s) do you co~nmonly use'!
a. Kerosine / / b. Electricity / / c. Cooking gas/ /
What quantity o1'aIlcsnnlivc cncrgy do you consumc?
(a) Wcckly / / (b) n m ~ t l i l y . / / Estimate the average amount of money spent on any of the energy source
monthly
Copyright © 2022 FDOKUMEN