Faculty of Agriculture - University Of Nigeria Nsukka
186
i Digitally Signed by: Content manager’s Name DN : CN = Webmaster’s name O = University of Nigeria, Nsukka OU = Innovation Centre Ugwoke Oluchi C. Faculty of Agriculture Department of Agricultural Extension TECHNOLOGICAL CAPABILITIES OF MECHANICAL OIL PALM PROCESSORS IN ANAMBRA STATE, NIGERIA OFOKA, INNOCENT CHIDIKE PG/Ph.D/03/34835
-
Upload
khangminh22 -
Category
Documents
-
view
4 -
download
0
Transcript of Faculty of Agriculture - University Of Nigeria Nsukka

i
Digitally Signed by: Content manager’s Name
DN : CN = Webmaster’s name
O = University of Nigeria, Nsukka
OU = Innovation Centre
Ugwoke Oluchi C.
Faculty of Agriculture
Department of Agricultural Extension
TECHNOLOGICAL CAPABILITIES OF MECHANICAL
OIL PALM PROCESSORS IN ANAMBRA STATE, NIGERIA
OFOKA, INNOCENT CHIDIKE
PG/Ph.D/03/34835

ii
TECHNOLOGICAL CAPABILITIES OF MECHANICAL OIL PALM
PROCESSORS IN ANAMBRA STATE, NIGERIA
OFOKA, INNOCENT CHIDIKE
PG/Ph.D/03/34835
DEPARTMENT OF AGRICULTURAL EXTENSION
UNIVERSITY OF NIGERIA, NSUKKA
A THESIS SUBMITTED TO THE DEPARTMENT OF AGRICULTURAL
EXTENSION, FACULTY OF AGRICULTURE, UNIVERSITY OF NIGERIA,
NSUKKA, IN PATIAL FULFILLMENT OF THE REQUIREMENT FOR THE
AWARD OF THE DEGREE OF DOCTOR OF PHILOSOPHY (Ph.D) IN
AGRICULTURAL EXTENSION (ADMINISTRATION)
MAY, 2014

iii
CERTIFICATION
Ofoka, Innocent Chidike, a post graduate student in the Department of
Agricultural Extension, with registration number PG/Ph.D/03/34835 has satisfactorily
completed the requirements for course and research works for the degree of Doctor of
Philosophy (Ph.D) in Agricultural Extension Administration.
The work embodied in this thesis is original and has not been submitted in part
or full for other diploma or degree of this or any other University.
…………………………………… ……………………………….
PROF. A. E. AGWU PROF. E. M. IGBOKWE
(Head of Department) (Supervisor)
……………………………………………….
PROF. A. O. ANI
External Examiner

iv
DEDICATION
This thesis is dedicated to Almighty God for his grace to me to complete and
make the programme a reality. I say may all glory, power, majesty, praise and
adoration be ascribed to Him alone in Jesus name.

v
ACKNOWLEDGEMENTS
I give my deep appreciation to my supervisor, Professor E. M. Igbokwe for his
great encouragement, fatherly advice, counsel and efforts that made this programme a
great success.
Worthy of mention are the following academic staff in the Department of
Agricultural Extension for their useful contributions viz: Professor M. C. Madukwe,
Prof. A. E. Agwu, Prof. (Mrs.) E. A. Onwubuya, Dr. (Mrs.) M. U. Dimelu, Dr. (Mrs.),
J. M. Chah, Rev. Dr. I. A. Enwelu, Dr. (Mrs.) J. Iwuchukwu, M/s I. Irohibe, Dr. O.
M. Akinnagbe and Dr. (Mrs.) A. N. Asadu.
Special appreciation goes to my friends, and well wishers in deed, Dr.
Ogbonna Nkwole (DPO), Mr. Emeka Okoye, Engineer V. Ejike, Mr. Ngosi Ubah, Dr.
F. Anaeto, Pst. D. U. Orji, Dr. (Mrs.) C. J. Obiora, Rev. and Mrs. Joe Ndefo and Prof.
D. O. Ohajianya for their assistance morally and financially during the period of this
programme. More appreciation to Mrs. F. O. Onuoha who typed, and formatted the
work to readable presentations.
I also give special thanks to my darling wife, Mrs. E. U. Ofoka and children;
Favour, Chimdiuto and Chioke for standing with me during the period of this
programme. May God continue to bless all of you.

vi
TABLE OF CONTENTS
TITLE PAGE……………………………………………………….. i
CERTIFICATION………………………………………………….. ii
DEDICATION………………………………………………………. iii
ACKNOWLEDGEMENTS………………………………………… iv
TABLE OF CONTENTS…………………………………………… v
LIST OF TABLES ………………………………………………….. viii
LIST OF FIGURES ………………………………………………… x
LIST OF PLATES …………………………………………………. xi
ABSTRACT ………………………………………………………… xii
CHAPTER ONE: INTRODUCTION 1
1.1 Background information…………………………………………….. 1
1.2 Problem statement…………………………………………………… 5
1.3 Purpose of the study………………………………………………… 7
1.4 Significance of the study……………………………………………. 8
CHAPTER TWO: LITERATURE REVIEW 9
2.1 The role of oil palm in the economy and environment……………… 9
2.2 Innovation system paradigm………………………………………… 12
2.3 Agricultural technological capabilities concept……………………… 18
2.4 Technological and production capabilities of oil palm-fruits
processing enterprise…………………………………………………
31
2.5 Expected role of extension…………………………………………… 48
2.6 Constraints to the development of improved oil palm production and
processing technological capabilities…………………………………
50
2.7 Conceptual frame work for the study of technological capabilities of
mechanical oil palm processing industry……………………………
51
CHAPTER THREE: METHODOLOGY 55
3.1 Study area…………………………………………………………… 55
3.2 Population and sampling procedure………………………………… 58
3.3 Data collection………………………………………………………. 59
3.4 Measurement of variables…………………………………………… 60

vii
3.5 Data analysis………………………………………………………… 66
CHAPTER FOUR: RESULTS AND DISCUSSION 67
4.1 Socio-economic characteristics of mechanical oil palm fruits
processing enterprise…………………………………………………
67
4.2 Socio-economic characteristics of mechanical oil palm
processor……………………………………………..……………
74
4.3 Description of available technologies to mill owners/operators……… 83
4.4 Description of available technologies to oil mill floor workers……… 88
4.5 Investment capabilities of oil mill operators………………………… 91
4.6 Investment capabilities of oil mill managers………………………… 93
4.7 Investment capabilities of floor –workers within the last three
years……………………………………..……………………………
95
4.8 Production capabilities of oil/owner operators……………………… 98
4.9 Production capabilities of processing floor workers……………….. 100
4.10 Minor and major change capabilities of mill operators……………… 111
4.11 Minor and major change capabilities of managers…………………… 113
4.12 Linkage capabilities of oil mill operators…………………………… 116
4.13 Linkage capabilities of processing managers………………………… 118
4.14 Strategic marketing capabilities of processing managers…………… 118
4.15 Learning capabilities of mill operators……………………………… 121
4.16 Learning capabilities of processing managers……………………… 122
4.17 Factors influencing the development of technological capabilities of
floor workers………………………..
123
4.18 Mean score of factors influencing the development of technological
capabilities of floor workers……………………………………….
124
4.19 Factors influencing the development of technological capabilities of
mill operators…………………………………………………………
127
4.20 Means score of factors influencing the acquisition/development of
technological capabilities among mill operators……………………
129
4.21 Factors influencing the development/acquisition of technological
capabilities of processing managers…………………………………
132

viii
4.22 Mean score of factors influencing the acquisition/development of
technological capabilities of processing managers……………………
133
CHAPTER FIVE: SUMMARY, CONCLUSION AND
RECOMMENDATIONS
137
5.1 Summary…………………………………………………………….. 137
5.2 Conclusion………………………………………………………….. 140
5.3 Recommendations…………………………………………………… 141
5.4 Suggestions for further research……………………………………… 142
REFERENCES…………………………………………………….. 143
APPENDIX…………………………………………………………. 154

ix
LIST OF TABLES
Table 1: Palm fruits processing hazard analysis chart………………………. 36
Table 2: Summary of palm oil processing unit operations………………….. 47
Table 3: Summary of composition of population and sample size………….. 59
Table 4: Percentage distribution of mills based on age, organizational structure
and mode of services…………………………………….
68
Table 5: Percentage distribution of mills based on management and
communication in oil enterprising………………………………….
72
Table 6: Percentage distribution of mills based on number of workers……… 73
Table 7: Percentage distribution of mill operators, managers and floor workers
based on socio-economic characteristics……………………
78
Table 8: Percentage distribution of mill operators based on available
technologies to them……………………………………………………
86
Table 9: Percentage distribution of floor workers based on available
technologies/tools………………………………………………………
89
Table 10: Percentage distribution of mill owner/operators based on investment
capability…………………………………………………………………
93
Table 11: Percentage distribution of oil mill managers based on investment
capability…………………………………………………………………
95
Table 12: Percentage distribution of floor workers based on investment
capability…………………………………………………………………
96
Table 13: Percentage distribution of oil mills based on production capabilities…… 99
Table 14: Percentage distribution of mill operators based on cleaning capability of
production equipment……………………………………………………
100
Table 15: Percentage distribution of floor workers based on different kinds of
work performed………………………………………………………
101
Table 16: Percentage distribution of floor workers based on produce (products/by-
products) capabilities……………………………………………………
103
Table 17: Percentage distribution of floor workers based on packaging capabilities 106
Table 18: Percentage distribution of floor workers based on cleaning methods…… 107
Table 19: Percentage distribution of floor workers based on effluent and solid
waste disposal methods………………………………………………….
109

x
Table 20: Percentage distribution of managers based on identifiable causes of
palm oil spoilage capabilities…………………………………………….
110
Table 21: Percentage distribution of mill operators based on minor and major
change capabilities………………………………………………………
112
Table 22: Percentage distribution of managers based on acquisition of minor and
major change capabilities……………………………………………….
114
Table 23: Percentage distribution of mill operators based on linkage capabilities… 116
Table 24: Percentage distribution of managers based on linkage capabilities…… 117
Table 25: Percentage distribution of managers based on strategic market
capabilities…………………………………………….………………
120
Table 26: Percentage distribution of mill operators based on learning capabilities. 122
Table 27: Percentage distribution of managers based on learning capabilities…… 123
Table 28: Mean distribution of floor workers based on factors that influence the
development of technological capabilities………………………………
124
Table 29: Varimax rotated matrix of factors that influence the development of
technological capabilities of floor workers………………………………
127
Table 30: Mean distribution of mill operators based on factors that influence the
development of technological capabilities………………………………
129
Table 31: Varimax rotated matrix of factors that influence the development of
technological capabilities of oil mill operators…………………………
131
Table 32: Mean distribution of managers based on factors that influence the
development of technological capabilities………………………………
133
Table 33: Varimax rotated matrix of factors that influence the development of
technological capabilities…………………………………………….…
136

xi
LIST OF FIGURES
Figure 1: Non-mechanical traditional methods of palm oil extraction………….. 37
Figure 2: Flow chat for mechanical oil palm fruits processing………………. 34
Figure 3: Schema for the study of the technological capabilities of mechanical
oil palm processing industry in Anambra State, Nigeria …………
54
Figure 4: Map of Nigeria showing 36 States and F.C.T. ……………………… 56
Figure 5: Map of Anambra State showing derivable agricultural and natural
resources………………………………………………………………
57
Figure 6: Percentage distribution of mill operators based on number that have
acquired investment capabilities…………………………
92
Figure 7: Percentage distribution of oil mill managers based on the number that
have acquired investment capabilities……………………
94
Figure 8: Number of floor workers that had acquired investment
capabilities………………………………………………………….
96
Figure 9 Percentage distribution of mill operators, managers and floor workers
that had acquired production capabilities ……………………
98
Figure 10: Percentage distribution of mill operators that had acquired minor and
major change capabilities………………………………
111
Figure 11: Percentage distribution of managers that had acquired minor and
major change capabilities………………………………………
114
Figure 12: Percentage distribution of managers and operators that had acquired
linkage capabilities……………………
115
Figure 13: Percentage distribution of managers that had acquired strategic market
capabilities…………………………………………
118
Figure 14: Percentage distribution of managers and mill operators that had
acquired learning capabilities……………………………………
121

xii
LIST OF PLATES
Plate 1: (a) Fully automated oil mill comprising sterilizer, digester, press, fibre
separator and oil clarification………………………
(b) Semi-automated oil mill comprising cooking drums, digesters,
press, manual fibre separation and oil clarification…………………
87
87
Plate 2: Fibre separator, jack press, palm fruits cooking drums and manual
removal of fibre/nuts from press…………………………………………
88
Plate 3: Non-automated oil mill method showing the use of manual screw press
and manual fibre separator………………………………………………
90
Plate 4: Products and by-products of processing oil palm fruits………………… 104

xiii
ABSTRACT
The survey was undertaken to assess the technological capabilities of mechanical oil
palm processors in Anambra State, Nigeria. Specifically, the study identified the
socio-economic characteristics of the mechanical oil palm
enterprises/processors/consumers; described the available technologies to processors
(fully automated, semi-automated and non-automated oil palm processors; examined
technological capabilities (investment, linkage, minor change, major change, strategic
marketing and learning mechanisms) of the processors and identified factors
influencing the development of technological capabilities of the processors. The
survey was carried out in Anambra State, Nigeria. The population of the study
comprised mechanical oil palm processors and palm oil consumers in three out of four
agricultural zones. Two extension blocks were purposively selected from each of the
three zones, while also purposive selection of four circles in each block was done to
get a list of two oil mills, two mill operators, two mill managers, two floor workers
and two consumers. Thus 48 oil mills were used out of which 48 mill operators, 48
manages, 48 floor workers and 48 oil consumers were selected using simple random
sampling technique to get a total of 192 respondents. Data were collected using
modified enterprise level interview schedule that contained structured and semi-
structured questions. Data were analysed using descriptive and inferential statistics,
including percentage, mean score standard deviation and factor analysis. The findings
revealed that socio-economically, the enterprises were small-scale, public/personal
service oriented and had three units viz: mill operation for operators, management for
managers and production for floor workers. The mill operation was dominated by
males only whereas all the processors belonged to low income earners, literate group,
middle aged and were mainly married men and women. All the mill operators had
mill presses while 97.9% had digesters. All the processors assessed for production
showed strong production capabilities which made their oils to rate very good. Both
mill operators and managers had poor minor and major change capabilities. All the
respondents had high linkage capabilities. The mill operators had strong linkage with
consumers group, managers had strong linkage with marketers and abundant linkage

xiv
with oil consumers. The managers had abundant strategic market capabilities with
highest capabilities with open market followed by sales depots as distribution
channels. All the assessed respondents for learning capabilities; mill operators and
managers had abundant learning capabilities in avoiding oil spoilage. Production,
policy/institutional and technological related factors influenced the development of
technological capabilities of processing managers. Manpower, technical, personnel
and infrastructural related factors influenced the development of technological
capabilities of mill operators. Also, management, infrastructural and personnel related
factors influenced the development of technological capabilities of floor workers. The
study recommends that as all the studied processors were primary processors,
extension should co-ordinate the activities of the stakeholders in the oil palm
processing industry in areas of policy formulation and implementation and should
liaise with state and federal governments to support the industry through fiscal
measures such as grants, loans, tax relief and subsidies. This will give the processors
capabilities to be involved in secondary processing of palm oil, palm kernel oil and
other by products which will add additional financial value to them.

1
CHAPTER ONE
1.0 INTRODUCTION
1.1 Background
Food and nutrition securities remain Africa’s most fundamental challenges for
human welfare and economic growth. The effectiveness of farmers in producing and
processing food is a critical factor in the level of access to food enjoyed by farmers
themselves and the much broader population with whom they are linked via markets.
Growth in food supplies has the dual effect of increasing the income of the farming
household and reducing the prices households must pay to acquire food in the market,
both of which enhance nutrition and food security. To achieve the above, the global
economy is undergoing a series of broad changes driven by rapid technological
progress in the industrialized economies. These changes are fundamentally altering
the methods and organizations of the production of goods and services and the skills,
information, infrastructure and institutions needed to operate an economy efficiently.
So broad and far reaching are these technological developments that analysts see the
emergence of a new industrial “revolution” within the world (FMST, 2001).
The new paradigm of production involves not only new technologies (in the
traditional sense) but also new management and organizational techniques, different
forms of linkage between enterprises and tighter relations between industry, pure
science and flow of information between economic agents. The nature of the current
industrial revolution is such that the long-term success of all productive systems,
including those in the food industry and in particular oil palm processing industry in

2
developing countries ultimately depends on the ability to harness these new
technologies (UN, 1995).
The world economy is also experiencing the impact of rapid globalization and
the emerging information age, which is bringing about a new global economic order
dominated by information and knowledge based economies (IKES) (UN, 1995). The
emerging information age characterized by information and communication
technologies (ICTs) and the extra ordinary increase in the spread of knowledge has
given rise to an era of knowledge and information. These technologies are offering
even less developed agricultural countries like those in Africa the opportunity to
transform their economies and accelerate their socio-economic development process
as part of the process of addressing the challenges of globalization and the socio-
economic implications of the widening digital divide. The concept of digital divide
and its implications is often defined in terms of the degree of access to ICTs in general
and in particular to the Internet and its related and emerging technologies. The threat
posed by the technological divide is more of an economic development problem than
a technological one.
The nature of skills required at all levels for efficient operation in many
activities is changing along with technology and organization. There are moves
towards a closer integration of science and engineering with production, marketing
and managerial know how and changes are also occurring in the relation between
firms themselves, their customers and suppliers and even their competitors in what is
today termed technological capabilities. There is need for a multidimensional, multi-
disciplinary and multi-institutional technological capability interaction between actors.

3
Technological capabilities are the skills (technical, managerial or organizational) that
enable firms (farms or actors) to efficiently use equipment and information and
improve on the technology. Among social scientists, technology includes all tools,
machines, utensils, weapons, instruments, housing, clothing, communicating and
transporting devices and the skills by which we produce and use them
(http:en.wikipedia.org/wiki/technology). Technological capabilities are built through
interactions both within the firm (farm) and with external actors (Malerba, 1992).
Following this definition, technological capabilities are the result of interactive
learning processes and linkages between a number of actors such as firms, universities
and research centers through collaborations both complementary and competing ones
(Bell and Paoith, 1993; Szogs and Mwanitma, 2010). In order to create, mobilize and
improve technological capabilities, firms need continuous and reliable access to
certain complementary assets which include finance, human resources, material,
intermediate inputs and support services. Consequently, to make their analysis
manageable, technological capabilities are categorized into six; namely, investment
capability, production capability, minor change capability, major change capability,
strategic marketing and linkage capability (Ernest, Ganiates, and Mytelka, (1994).
Biggs, Manju and Srivastava (1995) in their study identified learning
capability/mechanism as a seventh category. However, it is important to note that
learning capability cuts across the other six capabilities since they enable firms to
augment their endowments of the other six types of capabilities

4
The development of the oil palm processing industry should be considered as
part of agricultural development at the rural and urban settings and as an integral part
of sustainable Agricultural and Rural Development (SARD). If the oil palm
processing industry is to experience the level of change going on in other industrial
sectors in this century, its technological capabilities must be transformed to meet the
challenges associated with it.
The oil palm processing industry, presents many facets, from traditional
labour–intensive activities that are often found in developing countries to the capital-
intensive industrial processes common in the industrial world. In order to increase
extraction efficiency and increase palm oil production, three types of mechanical
processing equipment viz: the screw press, the pioneer mills and hydraulic press
which have extraction efficiencies of 66 – 86% were first introduced into Nigeria
since the 1930s. It includes majorly the processing of the fruits, and kernels for oil by
the continued efforts of some actors like research, fabricators, millers (mill owners)
and other processors and the attendant reactions from the consumers of the products
(oils) (NIFOR, 2009).
Also in order to improve extraction efficiency and increase palm oil output, the
earlier mentioned machines (screw press, pioneer oil mill and hydraulic press) were
complemented with other machines or equipment to achieve continued processing
operations mechanically (i.e. starting from introduction of fresh bunch to sterilization-
stripper-digester-press-continuous clarifier-oil purifier-oil dryer-oil storage tank).
Efforts have been made to disseminate these technologies to processors (NIFOR,
1981, 2009). This study was designed to examine the technological capabilities of

5
mechanical oil palm processors. The processors use their technological capabilities to
exploit, harness and process the oil palm.
The mechanical oil palm processing industry is classified into full automated,
semi-automated and non-automated operating mills and the technological capabilities
of the processors was based on these classifications.
According to ATPS (2003), there are some major problems hindering oil palm
processing in the oil palm producing states. The major problems include;
transportation, scarcity of (FFB) fresh fruit bunch, unstable market price, cost of
storage facilities, lack of soft credit, cost of processing machines, cost of labours, and
lack of infrastructure. They however advised that stakeholders in oil palm processing
should liaise with the various governments to solving the above problems through
enabling policies which when followed effectively will bring the desired sustainable
solutions.
1.2 Problem statement
Oil palm production provided the most important export products like palm oil,
kernel oil etc until the mid 1960s when the decline started in export products in
Nigeria and Anambra State in particular. The acceptability and demand for palm oil
have continued to rise in Nigeria. In Anambra State, some oil mills have gone out of
business due to poor technological capabilities, some new ones have been established,
while others have continued to flourish over the years. The Nigeria Oil Palm Produce
Marketing Board (NP-PMB) has played an important role in bringing the quality of
Nigeria palm oil up to the standards set in South East Asia (PIND, 2011). According
to the standards, a grading system was set up as follows: Grade 1 under 9% Free Fatty

6
Acids (FFA), Grade II –9-18% FFA, Grade III –18% to 27% FFA, Grade IV –27% -
36% FFA and Grade V over 36%.
The qualities and quantities of oil processed by some fruit processors are
acceptable according to the above grading system while those of others are
inconsistent and sometimes objectionable with regard to taste, flavour, colour, texture,
low quantities and general appearance due to differences in the technological
capabilities of the processing enterprises. Also extraction of oil from palm kernel and
palm fruits through traditional method has its defects in terms of high labour intensity,
only convenient for subsistent small-scale enterprise, inefficient extraction (poor
yield) of reasonable quantity of oil from the kernels/palm fruits due to; (1) inadequate
technological tools e.t.c.
These poor quality and poor yield of oil processed have been also attributed to:
(2) biophysical constraints such as disease and pest prevalence, bruising of palm fruits
many hours before processing thereby causing fermentation effects, lack of improved
varieties of oil palm, etc. According to Okonkwo (2010), there are hazards and
sources (HS) in oil palm fruits processing steps that must be avoided through
appropriate control measures, e.g. (in fruit bunch ripening on a tree as the first step,
hazard and source are that the birds or insects eat the fruits giving entry point for
microbial infection which could be avoided through regular inspection and early
harvesting as control measure); (3) processing of oil palm is faced with some socio-
economic constraints such as lack of effective marketing information channels, poor
distribution and high prices of inputs (equipment), lack of credit facilities and poor
infrastructure (including roads and poor or low government subsidized equipment.
7
Many new technological equipment had been developed by manufacturers/fabricators
to arrest the quality decline but some are lying unused due to the above factors; and
(4) Processors and other agents in the oil palm processing industry are responding
tacitly to their environments and available resources to solve their perceived problems.
However, appropriate combination of technological capabilities which include
technical, engineering, behavioural, managerial, organizational and institutional
capabilities allow productive enterprise to utilize equipment and technology
efficiently even in the oil palm processing industry. Based on the combination
approach selected, seven technological capabilities are to be identified at the
enterprise or industry level. They include investment, production, minor change,
linkage, strategic marketing, major change and learning mechanism (Ernest, Gainates
and Mytelka, 2000; Biggs, Shan and Srivaste, 1995). The study sought to determine
what technological learning capabilities have been developed by the mechanical oil
palm processors. Which capabilities are lacking and why? Who are the stakeholders
involved in the development of these capabilities? What were the factors affecting the
development of technological capabilities of the processors? What lessons were to be
learnt for improving the agro transfer practices in oil palm processing industry? What
were the causes of poor quality and low yield of quantity of oil processed?
1.3 Purpose of study
The overall purpose of the study was to determine the technological
capabilities of mechanical oil palm processors in Anambra State. The specific
objectives of the study were to:

8
i. identify the socio-economic characteristics of the mechanical oil palm
enterprises/processors;
ii. describe technologies that are available to the processors (fully automated, semi-
automated and non-automated oil mill processors);
iii. examine technological capabilities (investment, production, linkage, minor change,
major change and strategic marketing and learning mechanisms) of the processors;
and
iv. identify factors influencing the development of technological capabilities of
processors.
1.4 Significance of the study
The study will help processing mill operators, managers and mill floor workers and
other stakeholders in oil palm processing industry in Nigeria and in particular Anambra State
to identify and prioritize areas of intervention, investment needed for success and bridge
identified gaps that will allow coordinated efforts and increase production, quality, quantity,
marketing and profitability of the processed products. The identified gaps and needs will
guide and model the expected role extension will play in oil palm processing industry.
The findings of the study also will be a source of information for research purposes,
the oil palm processing industry, consumers, and government institutions and non-
governmental agencies that may need to use them. It will serve as a baseline data for
universities, research institutes, and polytechnics conducting research on oil palm processing
industry. Information such as processes, products, packages and equipment used by the
processors will be available to them. Consumers will also obtain information on the type
(quality) of oil they have been consuming. The findings will also provide policy makers with
new information that they require in formulating new policies and improving or modifying
existing ones so as to regulate and improve the performance of the industry.

9
CHAPTER TWO
2.0 Literature Review
Literature was reviewed under the following headings:
2.1 The role of oil palm in the economy and environment
2.2 Innovation system paradigm
2.3 Agricultural technological capabilities concept
2.4 Technological capabilities of oil palm processing enterprise
2.5 Expected role of extension
2.6 Constraints to the development of improved oil palm production and
processing technological capabilities
2.7 Conceptual framework for the study of technological capabilities of mechanical
oil palm processing industry
2.1 The role of oil palm in the economy and environment
The use to which products of oil palm can be put is limitless as almost all parts
of the crop are useful to mankind. The Nigerian Institute for Oil Palm Research
(NIFOR), (2009) reports that oil palm produce (palm oil and palm kernel oil)
accounted for about 52.1% of the Nigeria’s domestic export between 1906 and 1913.
It earned the nation about 22% of the foreign exchange up to the beginning of the civil
war.
During the period 1948-1963 Nigeria was a leading producer of palm produce
in the world. The discovery of crude oil and the civil war adversely affected the
production of the produce in Nigeria. Other competing countries such as Malaysia and
Indonesia became leading producers. Nigeria’s domestic palm oil production as at

10
1986 was estimated at 760,000 metric tones. Palm kernel is also produced in large
quantities in Nigeria. Palm kernel output however, declined from 419,000 metric tons
during the period 1960 and 1965 to 358,000 metric tons between 1985 and 1987. Palm
kernel cake, which is a major ingredient in livestock feed manufacture is a by –
product of palm kernels. The kernel oil, which is used very extensively in bakery trade
and for making ice creams, detergents and pomades, is a product of palm kernel.
These two products palm kernel oil and palm kernel cake are obtained in the process
of crushing palm kernels.
The ever-popular palm wine, which is also of socio-economic importance, is
obtained from the male inflorescence. In some areas of Nigeria, the trade in palm wine
competes greatly with that of palm oil. The leaflets of the oil palm are used for
making thatch for roofing houses, the leaf rachises are used for fencing, reinforcing
buildings and basket making. The mid ribs of the leaflets are used for brooms. The
cabbage, soft tissue around the apical bud, serves as a delicacy for eating. The bunch
refuse, which is left after the fruits have been removed from the palm bunch is a rich
source of potassium. Locally, it is used for making soap. The fibre residue left after oil
has been extracted from the fruit provides fuel while the shell from cracked palm nuts
provides not only fuel, but also serves as an aggregate for flooring houses.
The palm trunk may be sawn into timber and used in constructing fences,
roofing houses and reinforcing buildings. The importance of the crop in the overall
economy of the country cannot therefore be over emphasized. In Nigeria, oil palm
cultivation, processing and other oil palm products based industries provide
employment to millions of its citizens.

11
On environment, World Rainforest Movement Bulletin (WRMB, 2000)
reported that during the international negotiations on climate change, some
governments committed themselves to reducing carbon dioxide emissions in their own
countries. Oil palm plantations were noted for absorption of carbon dioxide. They
emphasized that caution should be taken not to industrialize palm plantations. There
are attendant effects of deforestation on local flora, fauna, soil and water resources.
Local people are also deprived of their communal land. This is as well as fluctuations
in price of oil palm products. World Rainforest Movement Bulletin (WRMB, 2001)
had these to say in favour of oil palm plantation on environment:
(a) forests are a natural storage of carbon. Oil palm plantations have similar net carbon
fixation to lowland forests;
(b) like Hevae spp. oil palm trees are environmentally friendly. They remove carbon
dioxide from the air and release oxygen to the atmosphere;
(c) well managed oil palm forest sequesters more carbon per unit area than tropical
rainforest and oil palm estates are predicted to become important part of carbon
offset management in the next century;
(d) in the same way as rubber tree plantations, the cultivation of palms is also regarded
as environmentally friendly, because it helps to fix carbon during the plant growth
stage, cutting or filtering down on the green house effect, besides providing other
environmental advantages;
(e) oil palm as an excellent “machine” can fix carbon dioxide using solar energy; and

12
(f) an oil palm plantation can “sequester” up to 15 tonnes of carbon dioxide from the
atmosphere for each hectare planted, thus contributing to mitigate the green house
effect (a planted forest is replacing another forest.).
The Malaysia Daily Express (MDE, 2000) had it that Malaysia emitted 144
million tonnes of green house gases – almost half (68.7 million tonnes) of the
emissions were absorbed by “carbon sink” planted forest; oil palm turned out to be the
country’s largest carbon sink, taking up 63% of the 68.7 million tonnes of green house
gases absorbed due to their extensive areas.
2.2 Innovation system paradigm
Innovation concept (lineal technology diffusion paradigm) is the search for
development, adoption or imitation and the subsequent adoption of technologies that
are new within a specific context (Hall and Dijkman, 2006). In agricultural terms,
innovation is the process by which farmers and farms accept and use agricultural
technologies and services that are new to them, irrespective of whether they are new
to their competitors. In the neo-classical economics tradition, innovation was
understood to be induced by the relative scarcity (hence, price) of factors (Rogers,
1995). It follows that there is a lineal, input/output relationship between agricultural
research, development of technology and its dissemination, and at the end, adoption
by farmers leading to economic and social effects and impacts (Hall; Bockett; Taylor;
Sivamotian; Clark, 2001). This paradigm of lineal technology diffusion, was
criticized for its failure to understand the source, nature, and dynamics of most
innovations processes in particular in the context of developing countries (Berdegue,
2005), as well as for failing to pay sufficient attention to the distributional or equity

13
issues related to innovation (Hall et al, 2001). The concept of innovation system
emerged because the conventional economic models had limited power to explain
innovation, which it viewed conventionally as a linear process driven by research
(Berdegue, 2005). The innovation systems framework sees innovation in a more
systemic, interactive and evolutionary way, whereby networks of organizations,
together with the institutions and policies that affect their innovative behaviour and
performance bring new products and process into economic and social use (Freeman,
1987; Edquist, 1997).
An innovation system is therefore a network of organizations within an
economic system that are directly involved in the creation, diffusion and use of
scientific and technological knowledge, as well as the organizations responsible for
the coordination and support of those processes. An innovation system refers to both
the nature of the institutions that make up the system as well as to the linkages and
flows that connect them to one another. The incentives to innovate vary on the basis
of individual endowments of wealth, income, or capacity and collective endowments
of a similar nature. The concept recognizes that innovations emerge from systems of
actors (Hall, Sulaiman, Clark, Sivamohan and Yoganand, 2002; Clark, Hall,
Sulaiman, and Naik, 2003). In the context of the study, these actors include directly
or indirectly farmers, agro-processors, marketers, researchers, universities, the
ministries of agriculture, science and technology, environment and education,
Agricultural Development Programme (ADP), state and local governments and others.
Processes and systems invariably evolve and change because the actors involved in
the innovation learn along the way and modify their behaviour accordingly.

14
Spielman (2005) stated that the organizing principle of innovation system
involves studying interactions and institutions that affect heterogeneous agents’
strategic efforts to innovate, adapt and complement an equilibrium outcomes. He
further stated that development is driven by the institutional context in which
technological change occurs. The innovation systems perspective usefully widens
otherwise narrow horizons in the agricultural research community. The framework
can be used to fill knowledge gaps and frame socio-economic research within a wider
context of diverse actors, knowledge sources, institutions and interactions.
Rivera, Alex and Hansen (2006), define innovation as the introduction of
something new – a new idea, method or device. The Agricultural Science Technology
Innovation System (AIS) is about the importance of developing and diffusing
innovations. The model appears to have emerged directly from the concept of
National Systems of Innovation (NSI), which was developed in the late 1980s and
presumes to cover all sectors but focuses particularly on the industrial sectors to which
oil palm processing belongs. One important aspect of the concept is its emphasis on
interconnected institutions that create, store and transfer the knowledge, skills and
artifacts that define new technologies. National system of innovation is defined as:
that set of distinct institutions which jointly and individually contribute to the
development and diffusion of new technologies and which provides the framework
within which governments form and implement policies to influence the innovation
process. As such it is a system of interconnected institutions to create, store, and
transfer the knowledge, skills, and artifacts which define new technologies” (Chema,
Gilbert, and Roseboom 2003). The economy-wide industrial emphasis of NSI has

15
been re-envisioned by the international agricultural development community into a
more sectoral framework, the AIS. Not an entirely new analytic concept, AIS
emphasizes “agricultural” innovations and goes beyond previous knowledge system
concepts by incorporating the goals of current reform measures, such as political
decentralization, public sector alliances with the public sector, enabling the private
sector, advancing consensus approaches to development, and promoting demand-
driven services. AIS also reviews innovation as “the transformation of an idea into a
new or improved product introduced on the market or a new or improved operational
process used in industry and commerce or into a new approach to a social service”.
Thus technological innovation is seen to involve more than Research and
Development (R & D); it also entails the workings of the marketplace. While the
notion of advancing the development and diffusion of innovations is not new,
certainly knowledge system success depends on innovations being disseminated,
adopted and practised. We observe, however, that in addition to its origins from the
term NSI, the AIS nonetheless resembles in several respects earlier models of
agricultural knowledge systems, most obviously the Agricultural Technology System
(ATS), developed in the mid-1980 by the University of Illinois INTERPAKS team
(Swanson 1986) and adopted both by the International Fund for Agricultural
Development (IFAD) and the International Service for National Agricultural Research
(ISNAR) as a conceptual framework for studying the links between agricultural
research and technology transfer in developing countries. Like the AIS framework,
the ATS emphasizes innovative research. ATS seeks to map and track three types of
technological components through national systems; they include: (a) genetic
16
technology, such as new crop varieties, hybrids and livestock breeds; (b) agricultural
chemicals, such as new pesticides; and (c) new cultural or management practices, such
as plant population and fertilizer usage, were organized into agronomic
recommendations adapted to major agro-ecological zones and reflective of the socio-
economic conditions under which small-scale farmers operated. Thus, the ATS
emphasizes new technology, either developed or introduced into a country. This
earlier effort is very much in line with AIS thinking, although the more contemporary
AIS stresses decentralized, demand-drive approaches and broad stakeholder
participation in the control, support and implementation of the agricultural technology
agenda.
The World Bank (2006) stated that investments in knowledge especially in the
form of science and technology have featured prominently and consistently in most
strategies to promote sustainable and equitable agricultural development at the
national level. Although many of these investments have been successful, the context
for agriculture is changing rapidly and sometimes radically. Six changes in the
context for agricultural development that heightened the need to examine how
innovation occurs in the agricultural sector were identified as follows:
1. Markets, not production, increasingly drive agricultural development.
2. The production, trade, and consumption environment for agriculture and
agricultural products is growing more dynamic and evolving in unpredictable
ways.
3. Knowledge, information, and technology increasingly are generated, diffused, and
applied through the private sector.

17
4. Exponential growth in information and communications technology has
transformed the ability to take advantage of knowledge developed in other places
or for other purposes.
5. The knowledge structure of the agricultural sector in many countries is changing
markedly.
6. Agricultural development increasingly takes place in a globalized setting.
For a new perspective on the systems of agricultural innovation to yield
practical approaches to agricultural development that may be more suited to this
changing context the World Bank reviewed the changing approaches for supporting
agricultural innovation. As the context of agricultural development has evolved, ideas
of what constitutes “research capacity to innovate: In the 1980s, the “national
agricultural research system” (NARS) concept focused development efforts on
strengthening research supply by providing infrastructure, capacity, management, and
policy support at the national level. In the 1990s, the “agricultural knowledge and
information system” (AKIS) concept recognized that research was not the only means
of generating or gaining access to knowledge. The AKIS concept still focused on
research supply but gave much more attention to links between research education,
and extension and to identifying actor like farmers’ processor etc demand for new
technologies.
More recently, attention has focused on the demand for research and
technology and on the development of innovation systems, because strengthened
research systems may increase the supply of new knowledge and technology, but may
not necessarily improve the capacity for innovation throughout the agricultural sector.

18
Matanmi (1994) has viewed that end users’ (farmers, processors etc) perceived
attributes of innovations has a lot to do with their adoption or acceptance. According
to him, a standard classification scheme for describing the perceived attributes of
innovations is needed. Five different attributes of innovations are described. These
are somewhat empirically inter-related but they are conceptually distinct. These
attributes are the receivers perceptions of the attributes of innovations and not the
attributes as classified by experts or extension agents, per se. As an adage says of
beauty, similarly, the beauty of innovations exists only in the eyes of the users. The
five criteria in acceptance of agricultural innovations by endusers in Nigeria include;
relative advantage, compatibility, complexibility, potentiality and divisibility and
observability.
2.3 Agricultural technological capabilities concept
The challenges of increasing agricultural productivity and thus farm income
require, among other things, a strong ‘agricultural technology system’ (ATS), which
Sumberg and Okali (1997) defined as comprising “all the individuals and groups
working on development, diffusion and use of new and existing technologies, the
action they engage in and the relations between them” in order to develop, diffuse and
use new agricultural technologies. Agricultural research thus plays an important role
in the struggle for improving the livelihood of the rural poor in developing countries.
Agricultural research is assumed to be most effective if accompanied by ‘participatory
approaches, which direct the research priorities towards the choices of the rural
population. The extent to which participatory methods can enable people to influence
the process of research and development activities depends not only on the

19
performance of participatory methods but also on the institutional environment in
which they are applied (Bechstedt, 2000). Since the institutional environment often
restricts the potential to participate. Thus the agricultural technology system (ATS)
consists of all the individuals, groups, organizations and institutions engaged in
developing and delivering new or existing technology.
The emphasis is on both “new technology,” i.e. that which has been recently
developed and older technology that is being introduced into a new area or group of
users; ATS is thus an analytical framework rather than a formal system’s model.
Swanson, Bentz and Sofranko (1997) stated that there is need for a close relationship
between national agricultural research and extension organizations and with different
categories of farmers, processors, millers, fabricators etc. organizations in a broader
system, the agricultural technology system (ATS) which will allow a more effective
contribution of each organization to the boarder goal of getting improved agricultural
technology in all major categories of farmers, end users/clientele/actors in innovation
system. He identified systems analysis as an effective procedure in identifying linkage
problems, since it is a problem-solving methodology.
Systems analyses had been successfully applied in numerous fields, especially
as a management tool to analyse, design, and implement complex technical processes,
this system analysis systematically examines a problem and makes each step of the
analysis explicit. Agricultural technology system (ATS) will need to develop and
transfer a package of recommendations for all of the economically important
commodities being produced within different farming systems in each agro ecological
zone. By using a systems approach, it is possible to examine each system component

20
and linkage at different levels within an ATS. In the process, specific system
constraints and weaknesses can be easily identified, and then the most appropriate
intervention strategy can be determined. ATS is based on primary functions and tasks
as well as functional linkages so that the framework can be used to analyse technology
systems in any type of political economy (Swanson, Bentz and Sofranko, 1997).
To clarify this earlier ATS framework’s basic similarity to the AIS, (Rivera,
Alex and Hanson, 2006), highlighted its four major functional components, which
emphasize those internal to the technology system and those external factors that
influence the technology system.
1. Policy, which includes those external factors that directly impact the
technology system, including the utilization of technology by processors, or
end users.
2. Technology development, which includes that part of the agricultural research
system that is devoted to applied and adaptive research
3. Technology transfer, which is broken down into the sub-functions of
knowledge transfer and input transfer.
4. Technology utilization by end users (processors) with an emphasis on fully
automated (continuous system), semi automated (batch system) and non
automated mills.
AIS draw attention not only to the need for innovation but also to the pluralistic
involvement of different institutions in agricultural research. Rivera, Alex, and
Hanson, (2006) explained the features of the AIS further with USAID approach to
promoting agricultural innovation through her focus change in its many country-based

21
research and extension project of the 1980s with a plethora of “agribusiness projects”
in 1990s. Those projects in effects supported innovation by for-profit firms working
in specific sectors and with specific business plans. The firms, frequently drawing on
existing capacity within research, extension and education institutions, supported
innovations in production technology, market linkage, sector organization, policies,
and financing. The aggregation of innovations by many individual firms can be a
powerful force for change in behaviour and development across a country’s
agricultural sector.
Scott, Gotsch and Bahri (2003) state that everyone involved in agricultural
policy and project analysis should have a clear way of thinking about evaluating
decisions. Some pertinent questions were raised, on what grounds can one alternative
be judged better than another? How much policy is enough? Is economic efficiency
the only thing that matters? While stating that for rational decision-making to take
place, each of us needs a clear and logical way to evaluate policy options. A well –
understood framework for agricultural policy analysis is needed for decision-makers
and interest groups to understand the consequences of policy actions. The clarity of
definitions is critical in policy analysis. What is meant by the term, “framework for
agricultural policy analysis?” A framework is an organized and consistent approach
for clear thinking. Without it, policy debate can quickly reduce to misunderstanding
and emotionalism. A framework is designed to permit the study of linkages in
economic systems. Good economic analysis is fascinating for economists, frustrating
for non economists, and relevant for everyone because it focuses on linkages within an
economy – on why one group’s actions influence others in the system. Agriculture

22
refers to the production and consumption of commodities that are produced by
cultivating crops or raising livestock and how best to process them for human or
animal consumption. Policies are government actions intended to change behaviour
of producers and consumers. Analysis consists of the evaluation of government
decisions to change economic behaviour. They concluded that a framework for
agricultural policy analysis, therefore, is a logical system for analyzing public policies
affecting producers, marketers, processors and consumers of crops, and livestock
products.
The four central components in the framework for agricultural policy analysis,
as proposed by De Gorter (2004) are objectives, constraints, policies and strategies.
Most goals of government policy fall under one of three fundamental objectives;
efficiency, equity, or security. Efficiency is achieved when the allocation of scarce
resources in an economy produces the maximum amount of income and the allocation
of goods and services brings highest consumer satisfaction. Equity refers to the
distribution of income among groups or regions that are targeted by policy makers.
Typically, greater equity is achieved by more even distribution of income. However,
because policy refers to government actions, the policy makers (and indirectly voters
in a democracy) define equity. Security is furthered when political and economic
stability allows producers and consumers to minimize adjustment costs. Food security
refers to the availability of food supplies at affordable and stable prices (FAO, 1998).
According to Barry (2000) technology effectiveness could take a variety of
forms. In addition to examining the more traditional effectiveness criteria of those
involved in market impacts, the model considers a number of alternative effectiveness

23
criteria, including political and capacity building. Thomas and Gatignon (1986)
examined competitive effects on technology diffusion and suggested how the supply-
side competitive environment and the adopter industry competitive environment both
affect diffusion of a new technology. The work sought to extend the current
behavioural paradigm for studying innovation diffusion by incorporating competitive
factors as explanatory variables. Competitiveness as described by Agri-business
council of Jamaica (2003) is the ability of a nation’s commodity to sell in domestic
and international markets alongside similar goods produced in other countries.
Among the many concepts applied to measure policy effects, competitiveness and
comparative advantage (longer-run competitiveness) are the measurements of
production and private social profitability. Anambra State has higher capability
potentials for processing of oil palms because of high concentration of oil palm
plantations (Ofoka, 2000). Thus concentration of her efforts on oil palm processing
will give her a comparative advantage and competitiveness as explained by
Agribusiness Council of Jamaica (2003).
Cramb (2000) focuses on the higher order factors affecting successful adoption
of technologies. Drawing on the “actor-oriented perspective” in rural sociology, he
argued that successful examples of adoption at this higher level result from a complex
conjunction of people and events, with outcomes that may have been quite
unanticipated at the outset. From this perspective research and extension projects and
programs are viewed as arenas in which social actors-village leaders, processors,
fabricators, millers as incase of oil palm processing, farmers, researchers (local and
international), aid officials, municipal agents, extension workers, and traders-pursue

24
their own short-and long-term objectives and strategies. He submitted that the actors
have to manoeuvre, negotiate, organize, cooperate, participate, coerce, obstruct, form
coalitions, adopt, adapt, and reject, all within a specific geographical and historical
context. These chain of actions normally influenced policy leading to improve
technology development, dissemination, and incorporation into farming systems and
many of the actors may be made better off. However, there is nothing predetermined
about this outcome. Hence, a detailed, case history approach is needed to understand
and explain the patterns of success in achieving beneficial technical change he
concluded.
Biggs (1990) views technology development from an actor-oriented
perspective, and concluded that it is a complex, multithreaded, and multidirectional
process, involving many actors other than scientists in the formal research system
(learning mechanism). Moreover, the emergence of a particular technology depends
not only on its scientific merits but also on the actions of “development coalitions” or
loose groupings of actors who combine their resources to push for a particular path of
technical change. He stated further that while it is appropriate to evaluate a given
technology in itself, the result often leads to an incomplete account of what it takes to
succeed in technology development. This typically involves networking, advocacy,
lobbying, and other activities, which can be called “coalition building.” These
activities are often excluded from conventional accounts of technology development.
He submitted that policy coordination is the key to successful and profitable
development efforts. Biggs and Smith (1998) in their study of conventional extension
theory, based on the central source model of technology development and diffusion,

25
examined the role of various organizational arrangements and communication
techniques in persuading end users to adopt a recommended technology, he stated
further that the rural development interventions, such as agricultural extension
projects, involve a variety of social actors with diverse histories and agenda from both
within and beyond rural communities. Hence, a project intervention needs to be
recognized as part of an ongoing, continually renegotiated social process, not simply
the execution of a pre-specified plan of action with expected outcomes. Moreover,
any technology dissemination activity takes place in a specific historical, political, and
economic, agro climatic, and institutional context. The influence of these contextual
factors may be crucial in determining the outcome of a particular project.
Oyeyinka (2003) views broadly technological capability as the knowledge
required to master new technologies, adapt, adopt, improve, and diffuse them within
the economy and exploit them. They are important in creating, and sustaining
competitiveness in actors within the extension innovation system. Technological
capabilities are acquired through learning. The individuals within the actors or agency
as well as the agency learn. Generally, technological capability has seven
components. These include: investment, production, minor and major change,
linkage, marketing and learning capabilities. The learning capability spans through
the other six technological capabilities. When actors in an innovation system learn
over time they accumulate technological knowledge and progressively undertake new
activities and acquire capabilities (Oyeyinka, 2003). Technological capabilities of
clientele or end users are the final impact of the agricultural extension innovation
system. They are measures of the degree to which the extension innovation system is

26
successful and provide useful information for policy making and policy revision.
However, Khalil –Timamy (2002) agrees with Oyeyinka but separates investment into
further components such as pre-investments, project-execution stage and project
implementation stage. The various components according to Khalil –Timamy’s
concept and other authors are discussed briefly below and will form the basis to
ascertain the capabilities of the processors.
a) Pre – investment
Pre-investment stage is the period when the following activities are under
taken: opportunity cost studies, screening of project ideas, market studies, technical
requirement studies, techno-economic feasibility studies, technical evaluation of
project, economic and financial evaluation, location studies and evaluation of means
of financing. Positive answers to the above undertaking encourage the processors, to
forge ahead.
b) Project implementation stage
This is the stage when production activities, technological personnel training
and maintenance occur. In the context of technological capabilities, the services
offered during the pre investment, project execution and implementation constitute
strategic technical capabilities. Careful attention should be paid to these stages,
especially technical personnel training to acquire skill and avoid costly pitfall during
the operational life of the enterprise. At this stage, production activities begin and
workers (both skilled and casual) are instructed on what to do and how. At this stage
those who will operate the mills (the stripper, sterilizers, press machines either screw
or hydraulic, digester etc) are sent on a training to be able to manage the proposed

27
project of processing before capital investments on those machines or equipment are
made (Okonkwo, 2010).
c) Investment capabilities
Every application of technology begins with an investment. Investment
capabilities are skills and information needed to identify feasible projects, locate and
purchase suitable technologies (embodied and disembodied), design and engineer the
plant, manage the construction, commission and start –up. The development of an
investment capability in an industry or country, rather than just in an enterprise, can be
of great help in setting up plants economically and later expanding and improving
upon them (Biggs and Srivastava, 1995; Lall 1992; Hassan and Wartensleben, 1988).
Investment could be in the areas of capital goods, eg. Land, machinery mills,
equipment, pilot plant, engineering plants-generators, blue prints, models, systems
analysis, feasibility reports, products and process patents and human resource
development. Enwere, (2000) has it that if respondents residence is used for
processing; investments are made on items that the households do not have already.
Chima, 2011; Enwere, 2000; Agwu 2006; Ofoka, 2000) identify personal savings,
borrowed money from friends, Bank loans, cooperative societies, family or communal
funds and funds transferred from other business as sources of fund for investments in
Agricultural enterprises.
d) Production capabilities
Once a firm has acquired technology of any sort, it must have adequate
production capabilities to remain in business. Production capabilities are skills,
knowledge and information needed for plant operation and improvement, quality

28
control, maintenance, equipment stretching, research, design, innovation, scheduling
or reaching prescribed level of machine efficiency. These capabilities are categorized
as production management, production engineering and repair and maintenance of
physical capital.
These capabilities range from routine functions to intensive and innovative
efforts to adapt and improve technology. They require considerable expenditure of
time and effort. The more advanced capabilities require high or different skills, more
time and greater investment. Production capabilities include both process and product
technological capabilities such as product Research and Development (R&D), design
engineering, procurement, production, marketing, sales and customers services. The
production capabilities are highlighted in line with either traditional or mechanical
processing methods of palm oil extraction and they are acquired through learnings and
practices, (Enwere, 2000). To the processor, efficient operation of a mill with a given
production technology could include: use of stripper, steriser, digester etc.
e) Linkage capabilities
Linkage capabilities refer to skills required to receive and transmit information
from external sources such as components and raw materials suppliers, sub –
contractors, consultant services, other firms and technology institutions. Linkage
capability plays a significant role in improving the effectiveness of firm level
innovation strategies. Linkage capabilities enhance training and learning through
interactions of stakeholders. How farmers, processors, millers, and fabricators link
one to another or among themselves. Enwere (2001) views that linkage of

29
stakeholders in processing industries lead to actors’ development of technological
capabilities using baking industry in south-eastern Nigeria as an example.
f) Minor change
This refers to the firm’s capability to improve and adapt continuously its
products and processes. This includes adaptive engineering and organization
adjustments involved in the incremental upgrading of product design and performance
features and of process technology (Ernest, Ganiates and Mytelka, 1994).
Successful adaptation of technology is beneficial in that it leads to modification
of products’, processes and equipment themselves, creates new technology or
knowledge, after leading to future improvements. This process of minor innovations
can accumulate over time to significant improvements in productivity, sometimes
larger than a major single jump in technology. The nature of this learning process
means that different firms can operate at quite different rates of technological
development and end up with different level efficiency while using the same
technologies (Biggs, Shan and Srivasta, 1995). Processors can change from the use
of drums and firewood to cook palm fruits to the use of sterilizer (Okonkwo, 2010).
Without strong minor change capabilities a firm is ill equipped to reap the dynamic
benefits of technology diffusion.
g) Strategic marketing capability
This broadly includes the knowledge and skill required for collecting marketing
intelligence, development of new markets, establishment of distribution channels and
provision of customers services, (Ernest, Ganiates and Mytekal, 1994). Knowledge of

30
behavioural pattern of customers is needed (Lall, 1992). In order to be able to translate
its knowledge about customer needs into successful products and services, a company
needs storing products design and systems engineering capabilities. All of these
require that the company redefines its marketing into strategic management function.
This requires a precise knowledge of customer needs and consumers reactions towards
the products. Marketing channels involved in agro processing industries include;
processors residence, kiosk, local market places, soap making industries, along the
street, office distribution vans, co-operative marketing societies, primary/secondary
schools, super markets (Enwere, 2000 ; Okonkwo, 2010).
h) Major change capability
This refers to the knowledge and skills required for creation of new technology,
that is, major changes in design and core features of products and production process.
It is a capability that drives from many sources, internal and external to the firm.
These include in- house R & D, external R & D, outfits of universities, public and
private laboratories, specialty research institutes e.t.c. This capability is particularly
required when the challenge is to upgrade product performance and to enter middle
level and upper level market segments. The acquisition of mechanical equipment or
mills to change from traditional methods to machine operated mills is major change
capability. It calls for higher investment cost, skill acquisition and new knowledge to
operate with (Obibuaku, 1986; Okonkwo 2010).
i) Learning mechanisms
According to Biggs, Shan, and Srivaste (1995) learning mechanisms are
capabilities required and are available to acquire new or improve existing investment

31
and production capabilities. Learning mechanisms constitute the dynamic element of
technological capabilities, enabling firms to change over time the levels of
investments and production capabilities. The attention to learning processes,
particularly technological accumulation and the institutions affecting these processes
are very important and span through the other six capabilities. Khalil – Timamy
(2002) showed that a large increase in factor productivity (capital and labour
combination) is accounted for by improvement in worker’s skills, minor or
incremental technical innovations and time saving improvement. The growth in skills
and knowledge has not only been a time dependent process, but has also involved
deliberate efforts and investments in the accumulation of technological capability. The
accumulation of technological capability has been achieved through various forms of
learning. For examples, stakeholder and participation, workshop, exhibitions and site
visits, computer supported collaborative learning, mentoring process, partnership,
apprenticeship demonstration, visit, seminars, exhibitions, on spot training are such
various forms of learning (Paulsen, 2011; Emenyeonu, 1987; Enwere, 2005).
Learning at farm or firm level emerges and accumulates via a continuous process of
trial and error, testing of different processing methods on the basis of an experimental
and pragmatic approach to the situations of problems. This articulated process is
referred to as in-firm learning (Andreoni, 2011). Thus, mechanical processors and
others stakeholders can learn from field experience.
2.4 Technological and production capabilities of oil palm-fruits processing
enterprise

32
Bell and Pavitt (1993) make a clear distinction between production capability
and technological capability. According to them production capability incorporates the
resources used to produce industrial goods at a given efficiency and at given input
combinations, equipment (capital embodied technology), labour, skills (operating and
managerial know-how and experience), products and input specifications and the
organizational methods and systems used. Technological capabilities on the other
hand, incorporate the resources needed to generate and manage technical change,
including skills, knowledge and experience and institutional structures and linkages.
Lall (1992) identifies three categories of firm level capabilities. They include:
(a) Investment capabilities – which describe the firms ability to identify and prepare
projects, procure equipment and artifacts, carry out detailed design, construct,
install and operate production facilities.
(b) Production capabilities – This pertains to operation, quality control, maintenance,
adaptation, equipment stretching, research, design and innovation.
(c) Linkage capabilities – relating to skills required to receive and transmit
information from component or raw material suppliers, sub contractors,
consultants, service firms and technology institution. These capabilities are
facilitated or hindered by factors both internal and external to the firm. Firm level
capabilities interact and are complemented by national level capabilities. These are
categorized into aggregate levels of physical investments, human capital and
technology effort.

33
Technological capabilities for the processing of oil palm fruits have emerged
over the years. The available methods for oil palm fruit processing have their own
distinct technology (skills, knowledge and procedures). The procedures involve
materials, equipment and machinery. Information, financial resources, skills,
managerial capability and nature of organization determine the technology and
method used. Some of the methods identified in literature for oil palm fruits
processing majorly fall into two, and include: 1. Non – mechanical traditional methods
of palm oil extraction. 2. Mechanical methods (fully automated, semi-automated and
non-automated mill methods. Their schematic diagrams and explanations are as
follow:
Traditional oil palm fruits processing method
The traditional methods of palm oil extractions according to NIFOR, (1999)
involves basically soft oil and hard oil processes or methods. The soft oil process
involves bunch reception which is followed by chopping into spikeletes to remove
fruits within 2 – 4 days. The separated fruits are then boiled for 1 – 2 hours in drum
or pot, before pounding in mortar/big iron pot. The nuts are removed from the
mesocarp which is reheated and hand pressed or that the pounded fruits are washed in
water in cemented trough to remove fibre and nuts. The crude oil from any of the
above methods is heated and dry oil is recovered for storage. The hard oil method
involves the boiling of fruits which are put in water trough like canoes and treaded on
after 2 – 3 days to remove mesocarp fibre and nuts. The crude oil water mixture is
agitated heated and oil decanted for storage.

34
NIFOR (2009) says that the traditional method of oil palm fruits processing are
known to be labour intensive, low through-puts and give oil of low quality – the free
fatty acid (FFA) level of 8% and above, high moisture content over 0.5% and high
dirts content over 0.3% - have very low extraction rates 6 – 8%.

35
1. Oil palm fruit processing
Traditional Process Mechanical Process
Bunch reception & chopped into Boiled fruits in water spikelets (2-4 days) troughs (eg. Canoes)
Fruit threshing or separation Fruit foot treaded (2 –3 days) Sterilization/Boiling (1 – 2 hours) Removal of mesocarp fibre & nuts
Digested/pounded in mortar Removal of mesocarp fibre & nuts
Nut removal Crude oil water mixture agitated
Mesocarp reheated (in pots) Froth/Crude oil heated
Hand pressed Oil stored Crude oil fried in pots Oil separation from
Oil packaging (b) Bunch reception & chopped into spiklets (2-4 days)
Fruit separation Boiling
Fruit pounded Washed in H20 in trough cemented Removal of fibre & nuts Hot water oil mixture agitated Crude oil scooped Crude oil heated
Dry oil recovery
Oil storage
Source: (NIFOR, 1999)
Fig. 1: Non-mechanical traditional methods of palm oil extraction.
(a) Soft Oil
(b) Hard oil

36
Okonkwo (2010) assesses the traditional or indigenous oil palm wet processing
with the hazard analysis and critical control points (HACCP) system for food safety
and quality. The analysis shows that hazards exist at all stages (20) of process. The
critical control points are the sorting stage of the palm fruits, clarification to remove
moisture and storage which were identified as the important operations in oil palm
processing. The actions recommended for eliminating the hazards in production of
quality red palm oil are discussed.
Twenty stages of process are identified with the hazards associated with each
stage. Good quality crude red palm oil production starts from the raw materials –
palm fruits which must be fresh with minimal signs of damage or contamination from
harvest to detachment of fruits from the spikes. Fruit sorting ensures that different
grades of fruits are not mixed which ultimately affect oil quality. An innovation to
obtain high grade fruits is boiling the fruits in the spikes for easy detachment.
Badmus (1987) notes in his study that in mechanized method, the weakening of the
attachment bonds of the fruits is achieved by boiling bunches. The critical control
points were the boiling mixture stage to reheating stage (clarification) for removal of
residual mixture from the crude palm oil. The reheating of the oil must not exceed the
limit time to avoid partial bleaching and cooking of oil which will affect B-carotene
content. Storage conditions include dry and cool environment, storage in opaque
containers (plastics) is best advised. The summarized process steps, hazards and
sources with the control measures are shown in Table 1.

37
Table 1: Hazard analysis chart
Process step Hazard and source Control measure
1. Fruit bunch ripening on tree Birds/Insects eat fruit. Entry point for
microbial infection
Regular inspection and early
harvesting
2. Dropping of ripe fruit On the soil. Point of microbial infection
and contamination with sand particles
Regular inspection and early
harvesting
3. Fresh Fruit Bunch Harvesting
Technique
Damage of fruits in the process of
pruning fronds, Insects hidden. Free tall
on the ground by gravity, causing
bruises on some of the fruits. Increase
FFA
Skilful and careful pruning
techniques. Unbruised fruits
Alternative method to traditional
harvesting method to minimize fall
(Badmus, 1990)
4. Post harvest Transport Rust and dirty basket, head pan or wheel
barrow. Allows contamination and
further deterioration
Quality standard. Clean materials.
Good handling practices
5. Bunch cutting into spikes Some fruits broken Microbial activity Skilful cutting for detachment of
spikes from bunch
6. Detachment of fruits from spikes Dirty materials for covering, chemical
activity-lipolytic enzyme changes at the
base.
Personal hygiene. Good handling
practices. Innovation. Boil fruits
with spikes
7. Fruit sorting Mixed fruits of all grades. Unwashed
fruits
Grade fruits for quality control. Use
wholesome fruits
8. Fruit boiling Contaminants from rusty containers Good grade and clean container.
Personal hygiene
9. Fruit pounding Dirty mortar/pestle and environment. Clean environment. Personal
hygiene with cloak/work dress/apron
Process step Hazard and source Control measure 10. Fruit washing (pulp) Cold mash. Wash quickly. When cold add hot or
warm water to release oil. Personal
hygiene.
11. Fibre-nut separation Tick (viscous) mixture Hard squeezing. Add hot water and
filter
12. Mixture sieving Rusted containers, old raffia basket Use clean and rust free materials
13. Clarification (Boiling mixture) Rusted containers, Inadequate boiling
period.
Rust free/good grade containers.
Boil for maximum time till foam is
darker.
14. Decanting oil Contains moisture, dirt, fibre and slurry. Second heating
15. Second boiling Engrained dirt and residual moisture,
increase FFA
Careful skimming off the dried oil
16. Reheating Over heating Heat for appropriate time limit.
17. Fibre-nut disposal Indiscriminate and improper drying. Keep fibre near kitchen fire. Sun dry
nuts in clean environment or heap
near kitchen fire for later cracking.
18. Packaging Inadequate cooling, Odour development,
Rancidity
Allow proper cooling. Personal
hygiene
19. Storage containers Tins, transparent bodies and plastic jars
on floor, Rancidity.
Opaque or coloured plastic
containers and amber glass jars on
platform.
20. Storage conditions Hot environment Dry and cool environment
Okonkwo, (2010) Oil Palm Product: Domestic crude palm oil: Date: March 26
2008.

38

39
Oil palm fruits processing operations (mechanical method)
According to NIFOR, 2009, palm oil processors of all sizes go through these
unit operational stages (Fig. 2). They differ in the level of mechanization of each unit
operation and the inter-connecting materials transfer mechanisms. The operational
mechanism could either be semi automated single batch or continuous systems (fully
automated) and or non-automated. The scale of operations differs at the level of
process and the product quality control that may be achieved depends on the method
of mechanization adopted. In palm oil extraction mechanically, there are three
systems: (1) fully automated continuous processing mill system. In this process,
starting from bunch receiving, sterilizing-stripping-digesting-pressing to clarifying are
done automatedly, ie the extraction of oil from boiled palm fruits can be
accommodated by handling successive batches of materials or continuously feeding
materials to the machine; (2) semi-automated processing mill – some processing
equipment are done manually before/after engaging the automated processing mill at
different stages to finish processing. Eg. A processor may manually remove the fruits
from spikes, cook the fruits in drums before carrying the hot boiled fruits to semi-
automated mill to digest, press out oil and separate (or not) the nuts from fibres
automatedly; (3) non-automated processing mill – all the mechanical equipment
involved in the processing are not machine/engine operated.
Some of the technical terms referred to in figure two are described below:
1. Bunch reception: This is reception of well ripped, unbruised and timely
conveyed fresh fruit bunch to the sterilizer.

40
2. The sterilizer: The fruit process to which the fresh fruit bunch (FFB) is
subjected is sterilization in the sterilizer, the aim of which is to;
i. inactivate the lipase or fruit enzyme, which is thermolabile i.e. stops at both
enzymatic hydrolysis that causes acidification of palm oil.
ii. coagulate the nitrogenous and mucilagerious matters so as to prevent the
formation of emulsions of the in the crude oil during purification.
iii. improve extraction by proper stripping of the bunches as well as the breaking
up of the oil-carrying cells of the mesocarp.
Sterilization is commonly carried out by means of horizontal or vertical
sterilizers, the FFB are contained in a mild steel fruit cage of either 1.5 or 2.5 tonne
capacity. The sterilizer normally has two cylindrical carrier rings to facilitate the
lifting and smooth discharge of fruit into the stripper.
The vertical sterilizer is generally used for small to medium scale factories and
the FFB are normally discharged directly into the sterilizer by means of a bunch
elevator. The sterilizer is discharged manually by workers who rake out the sterilized
fruits to a conveyor that feeds the stripping or threshing machine.
Small-scale mills employ vertical type sterilizers which steam at atmospheric
pressure, though bunches are however quartered or cut into spikelets before
introduction into the sterilizer. Where traditional method of sterilization is followed by
picking fruit from the bunches after cutting up and heaping for 2-4 days, then fruit
sterilizer can be used. This consists of a 44 gallons (200 litres) sterilizing drum set in a
special tipping frame. If sufficient loose fruits are being supplied to keep the press in
operation during the daytime then about four drums will be needed. Fruit boiling is

41
carried out for 1 hour after steam appears at the top of the drum usually covered with
layers of tick jute bags.
3. The stripper – The stripper removes sterilized fruits from the bunches stalk and
this should be carried out when the bunches are still at high temperature. The
fruit bunches are off loaded from the cooker/sterilizer and placed in the rotation
stripper. The stripper is made to rotate by turning the handle in a clockwise
direction. As the stripper rotates it knocks about the bunches and the fruits drop
off and are collected. In mechanized method the stripper usually requires one
man and can handle 0.5 tonnes of fresh fruit bunches per hour.
Traditionally, stripping in a hand-operated mill can be by beating out the fruits
from the sterilized bunches by means of wooden batons or pronged forks.
4. Digestion by digester
The fruits from the stripper which constitute about 62-65 percent of the FFB
are fed into the digester. The aims of the digester are;
i. to release oil from the pericarp cells by mashing them,
ii to raise the temperature of the mash to facilitate subsequent pressing (usually to
about 900)
iii. to drain away free oil and so reduce the volume to be pressed.
The digester is usually a cylindrical vessel enclosed in a steam jacket, the heat
maintains the viscosity of the oil in the mash at a low level. The digester is equipped
with rotating beater arms or blades. The fruit is admitted at the top and the wet mash is
drained off to the press at the bottom. Oil is allowed to drain off through drainage
holes at the bottom and joins the oil expelled by the press. The greater the amount of

42
oil which can be drained away during digestion, the drier will be the mixture of nuts
and fibre to be pressed. It is better when digester is fully loaded with fruits to generate
full pulping and stirring action of the beater aims or blades. Charging of digester,
maceration and discharge take 10 minutes. Usually the digester can handle 64.6 kilos
of fresh fruit bunches depending on the capacity, pattern and make-designer per batch
and maybe operated by two men.
Traditional digestion is by pounding stripped fruit in a mortar with wooden
pestles by 4 to 6 men. Hot water is introduced to maintain relative steady temperature
of the mash. Also foot-trampling the cooked but cold fruits in canoes or specially
constructed wooden troughs form traditional method.
5. Pressing (crude oil extractions)
The efficient extraction of oil from the pericarp is the basic objective of the
entire process. There are two basic mechanical methods of oil extraction, one is by use
of centrifugal force and the other is by squeezing (pressing method) the oil and
moisture from the digested mash. The oil contains non-oily solids (nos) and water and
is called crude oil. The extraction could be done using the following tools to enhance
the two methods:
a) Centrifugal oil extraction method: These were in common use in by gone
years and are beneficial where through-puts are small. Oil losses on fibre are
relatively high compared with modern equipment dealing with perforated fruit
types. The centrifuge consists of a perforated steel drum into which the
digested mash is introduced and revolved at high speed. The oil and water in
the mash is thrown out through the perforations by centrifugal force, more or

43
less independently of pressure transmitted through the press cake from nut to
nut.
b) Press methods
Hand pressing is the traditional way of pressing mashed fruits oil out when the
mash is relatively having low temperature. This is best used for in household kitchen
cooking. It was long realized that traditional pressing or cultural methods were a
bottleneck in small-scale palm oil processing. The process was usually conducted
slowly/fastly (in case of centrifugal) to avoid the huge loss of oil that might result
from inadequate pressing or force. The economic importance of this process was
therefore long recognized and has received the greatest attention for mechanization.
Presses developed over the years have included models such as:
1. Manual vertical screw press
2. Stork hydraulic hand press
3. Motor-jack press
4. Motor-jack/canti-lever press
5. NIFOR, hydraulic hand press
6. Combined screw/hydraulic press
7. Mechanical screw press
8. NIFOR mechanical screw press
9. Manual spindle press
The manual vertical screw press, the stork hydraulic hand press and NIFOR
hydraulic hand press enjoyed the highest patronage in Nigeria for a long time, even

44
though oil loss/fibre ratio for those presses range from 18 – 35 percent because these
presses operation depends on the strength of the operator (in non-automated method).
There are three common issues about the above models – either Screw/spindle
press or hydraulic press. They guarantee relative efficiency, productivity and
maximal extraction of oil from fruit fibre (NIFOR, 2009). Sequel to the above
reasons, the mechanism of screw spindle/press and hydraulic press are to be described
here briefly.
b (1) Hydraulic press
In the hydraulic press, the downward pressure of the press ram is transmitted
via the press cake through the nuts and fibre. The press cage is cylindrical and with
perforated holes on it. This is the manually operated press used in small-scale mills
and the automated press used in the large medium scale mills. Automatic hydraulic
presses are effectively used to process fruit with a proportion of nuts to pericarp of
about 30% (nuts to fibre ratio of 35:65) where the percentage of nuts falls to around
20% as may commonly be found in modern tenera material the current choice would
be for screw presses. AGRICA in Ghana introduced the use of manually operated
hydraulic presses to Ghana and Nigeria from India to complement the mechanical
digester though presses have frequent presses seals problem leading to wearing of
hydraulic cylinder.
b (2) Screw press
The screw press is a very simple and easily operated equipment. It comprises of
a helical screw turning within a perforated cage. It exerts gradually increasing
pressure on the press cake as it is screwed down towards a loaded or precet cone,

45
which permits eggress from the press only after the requite pressure has been applied.
The main disadvantage of screw presses has been the amount of nuts broken and
kernels lost when sufficient pressure is applied to reduce oil losses on fibre to an
acceptable level. When mainly tenera type fruits are processed, nut breakage ceases to
be a problem. Another problem with screw press is the rapid wear of the screw, this
can be addressed thoroughly by use of harder metals for construction. The NIFOR
mechanical screw-press is the latest used by the small-scale palm oil processing
industry in Nigeria. This consists of a perforated tube inside which a transport screw
rotates. The press outlet is more or less closed by a cona that regulates the pressing
pressure. The worm transports and gradually compresses the macerated fruit.
Released oil drains through the perforations in the tube. Trials have shown that the
press can handle over 1 tonne FFB per hour with an average oil loss to fibre of 10.7
percent.
b(3) Manually operated screw spindle press
It is a kind of screw press manufactured by the University of Science and
Technology, Kumasi, Ghana in early seventies in efforts to deliver a low cost press to
the smaller village processors with small patches of palm farms. It operates little
screw press (with narrow cage) to deliver low pressures and relies on manual labour
for pressure developments.
The through-put is about 50kg per hour or 1.5 tonnes per day. The spindle
press is mounted in between an inverted “U” shaped stand attached to a container at
the bottom to collect oil.

46
6. Crude oil clarification
The oil recovered from pressing needs to be clarified before it can be consumed.
According to (NIFOR, 2000) clarification involves the removal of dirt, water and other
impurities from the oil. This is done in the clarifier, a specially built container consisting;
a) the crude oil tank where the oil from the press is first vigorously boiled after
adding hot water to reduce its viscosity. The dilution ratio of two crude oil to
one of water is commonly used. Separation takes place better at a temperature
of 900c
, boiling should be avoided because it promotes the formation of
emulsions. Pre heaters are used to raise the temperature of the crude oil at the
boiling chamber;
b) a settling compartment where the sludge fraction is separated and eliminated.
This is controlled by some valves.
c) a cleaning/drying tank compartment for further elimination of dirt and water.
The two compartments are connected by means of a pipe and control valve;
and
d) there are also two chimneys in the equipment. Each chimney is fitted with a
butterfly valve (or damper valve), which enables the chimney to be isolated from the
furnace. The temperature of the chimney is controlled by opening or closing this
valve. The arrangement in the clarifier makes it possible for the mixture of oil, sludge,
and water to be transferred into the settling tank compartment while it is still being
boiled at 900c
in the boiling compartment.
From the settling compartment the oil is recovered and transferred by water
displacement into the heat exchanger where it is dried. The clarifier thus functions as a
continuous clarifying unit complete with a cleaning and drying system. Big clarifier

47
e.g. NIFOR can handle oil produced in one day from 2 tonnes of FFB. This is
equivalent to 0.25 tonnes FFB/hour or 12 tonnes FFB/hour per annum from 50
hectares. The oil thus refined is stored in drums, tankers, tins or bottles ready for sale.
The recent innovation of small-scale improved oil extraction technologies
(equipment and machines) has reduced the threat presented to women’s income which
large modern mills establishment posed earlier. Now the women and men alike can
process their palm fruits to derive oil, nuts and other by-products directly. This was
not so with large modern mills (pioneer oil mills) where fruits were sent to and
husbands received money for oil directly. This deprived the women of their income
from palm “Kernel” sales which traditionally was women’s personal reward for
processing oil palm fruits. The small-scale technologies have improved the income of
individual processors especially women and relieved them of some of their arduous
tasks. The technologies at small-scale had enabled raw materials owners to process
raw materials (rather than sell them for instant cash) and this general a greater income.
In developed economies, palm oil has vast food uses and non-food uses as a
result o refinery capabilities. Food uses include cooking oil, deep frying oil
(vegetable oil), margarine and spreads, bakery fats, cocoa butter alternative fats,
confectionary fats, ice cream fats, infant nutrition fats and other food applications.
The non-food uses include cosmetics and personal care, soaps, candles,
pharmaceuticals, lubricants and grease, surfactants, industrial chemicals, agro-
chemicals, coatings, paints, and lacquers, electronics oils, leather and biodiesel

48
7. Disposal of the oil mill effluent
Pollution problems arise in the disposal of sterilizer condensate and sludge
after clarification. The oil and solid content makes the sludge very
objectionable since it emits a very strong and disagreeable smell as breakdown
via microbiological activity takes place. A common disposal method is the use
of a series of sludge pits. The amount of solid material decreases in each
successive pit as water and dirt sink to the bottom and the lighter oil at the top.
Surface is held by a partition. This oil is sold as technical quality palm oil and
is used for soap manufacture.
Table 2: Summary of palm oil processing unit operations
Unit Operation Purpose
1. Fruit fermentation To loosen fruit base from spiklets and to allow ripening
processes to abate
2. Bunch chopping To facilitate manual removal of fruits.
3. Fruit sorting To remove and sort fruit from spiklets
4. Fruit boiling To sterilize and stop enzymatic spoilage, coagulate
protein and expose microscopic oil cells.
5. Fruit digestion To rupture oil bearing cells to allow oil flow during
extraction while separating fibre from nuts
6. Mash pressing To release fluid palm oil using applied pressure on
ruptured cellular contents.
7. Oil purification To boil mixture of oil and water to remove water soluble
gums and resins in dry decanted oil by further heating.
8. Fruit nut separation To separate de-oiled fibre from palm nut
9. Second pressing stock To recover residual oil for use as soap stock
10. Nut drying To sundry nuts for later cracking.
Essential precautions in processing palm fruits
1. Fruits should not be wounded during harvesting, transportation to the mill and
during feeding of bunches to the mill.
2. Fruits should be harvested when they are just ripe, over ripening should be
avoided.

49
3. The barest minimum time internal should be allowed between harvesting and
processing (sterilization).
4. The processing system must ensure that the material remains at high
temperature through out period of processing.
5. Processed oil must be stored in clean, dry and sterilized containers
According to Okonkwo (2010) quality control in oil palm mills is indispensable
in all products derivable from the fruits. In order to ensure such a high quality, it is
standard practice to attach a quality control laboratory to palm oil mills. The main
functions of the laboratory are to analyze the major products for their quality
characteristics. The palm oil is analyzed for its moisture content in standard laboratory
set up, FFA content, (by titration against sodium hydroxide) and iodine value. The
palm kernel is analyzed for amount of pieces of shell, broken kernel, whole kernel,
moisture and FFA content. If these processing conditions of palm oil and palm kernel
oil are maintained, oil of both will maintain their qualities NIFOR (2009). At the
moment in Nigerian, there is no policy regulating the activities of the oil palm
processors in order to ensure that products sold to consumers are of good quality and
safe for consumption. However, if there is policy regulating the activities of oil palm
processors, there is obvious need for the enforcement of its implementation in the oil
palm processing industry. The opinion in this paper is that agricultural extension can
help to formulate or enforce such policies and help to implement them.
2.5 Expected role of extension
Extension is among the publicly-funded systems established by government
and non governmental organizations to improve the conditions of life and well being

50
of rural and urban populations and to increase agricultural productivity to better the
life of rural and urban dwellers (Peterson, 1997). Specifically agricultural extension
can be viewed from the aim which extension service strives to accomplish. According
to Asiabaka (2002) the aim of agricultural extension is to teach rural and urban
clientele how to determine their problems using their own resources. The oil palm
industry makes its contribution by utilizing, processing and adding value to
agricultural produce. Thus, it is a stakeholder in sustaining agricultural development.
However, extension in Nigeria has focused on farmers and rural farm families in their
various programmes to the neglect of the agro-processing industry including the oil
palm processing industry.
The technology utilization component encompasses the users of agricultural
technology not only farmers but also agro-processors. User awareness, adaptation and
adoption of improved technology from various sources should be pursued by
extension in the oil palm processing industry to improve productivity and ultimately
economic growth at individual and national level.
Government and private extension should be involved in the transfer of
knowledge, skills, information and inputs to the oil palm processing industry. The
challenging for extension in the context of sustainable agricultural development is
how to help the oil palm processing industry make better use of resources-physical,
human, and capital so as to improve their performance not just as individual
processors but by action taken as a group (Rolling and Pretty, 1997).

51
In this approach, sustainability is not a scientific ‘hard’ property, which can be
measured according to some objective scale or a set of practices to be fixed in time
and space. Rather, sustainability is a quality that emerges when people individually or
collectively apply their intelligence to maintain the long-term productivity of natural
resources on which they depend (Sriskandarjah 1991). In oil palm processing industry,
the processors association (national and state) becomes the platform for group action
which extension will necessarily need to collaborate with during programme planning
and implementation. This is in line with Ofoka (2000) where the use of oil palm
farmers associations was made to reach out to the farmers who through team work
were able to adopt improved oil palm seedlings and received incentives and
subsidized inputs from the state government.
2.6 Constraints to the development of improved oil palm production and
processing technological capabilities
UNCTAD’s 2007, report on the least developed countries (including Nigeria)
stated that these countries domestic firms and farms have low technological
capabilities, undeveloped skills, and ineffective or lack of domestic institutions which
could support technology acquisition and diffusion. The report noted that agricultural
productivity is low, but the population is rising and farm sizes are declining.
Similarly, UNCTAD (2003) identified physical infrastructure, skills, financing,
market, technology and supply dusters as the factors affecting technology
development in Africa. Other constraints include lack of access to improved seeds,
fertilizers, and pesticides as well as the knowledge and information to use them
effectively and efficiently (FAO, 2007).

52
According to ATPS (2003) in appropriate packaging of technology and
information, lack of participation by recipients in the knowledge generation process,
abrupt or lack of funding continuity, and inefficient or inappropriate markets and
institutions are some of the bottlenecks to successful transfer of technology.
Furthermore, Asoegwu and Asoegwu (2007) note that a major constraint to
agricultural production in Nigeria is lack of labour-saving devices for field operations,
harvesting and processing.
In case of improved oil palm production and processing technological
capabilities, (NIFOR, 1990) identified pests and disease problems, farmers lack of
interest, ignorance of improved production methods amongst farmers, input limitation,
poor pricing of produce, lack of access to credit facilities and lack of infrastructural
facilities as factors that militate against optimum production of oil palms in Nigeria.
Agwu (2006) also agrees with NIFOR in some areas by identifying high cost of agro-
chemicals (insecticides and herbicides), high cost of fertilizers, unavailability of
fertilizers and high cost of labour to carry out necessary farming operations as
hindrance to improved oil palm production.
In oil palm processing, high cost of processing palm fruits in mechanized mills,
unavailability of labour to carryout necessary processing operations and unavailability
of enough mechanized mills in some areas where oil palms are located constitute
factors that militate against oil palm fruit processing (Agwu, 2006).
2.7 Conceptual framework for the study of technological capabilities of
mechanical oil palm processing industry
The conceptual framework for studying the technological capabilities of
mechanical oil palm processors in Anambra State is shown in Fig 3. The

53
technological capabilities include investment, production, linkage, minor change,
strategic marketing and major change capabilities and learning mechanisms or
learning processes. Through investment, the operators of the oil palm industry acquire
these capabilities to varying degrees. Through learning mechanisms or learning
processes, the other six technological capabilities are improved and developed. The
level of success of the industry is dependent on these seven capabilities. The ability to
develop and improve determines the technological development of the oil palm
processing industry. This varies among enterprises. Inability to develop and improve
the existing technological capabilities creates needs and gaps. It also results into errors
and distortions in the technological capabilities.
In order to determine the technological capabilities existing and lacking in the
mechanical oil palm processing industry, the enterprise level survey design model
(Marsden, K. and Garzia, M. 1998) was used. Enterprise survey model is a
questionnaire that contains structured and semi-structured questions which are
designed and administered to the different processors during the interview. The
technological capabilities of the mechanical oil palm processors in relation to what
were expected of them were identified. Based on the findings of the study in chapter
four, the extension implications of the technological capabilities of mechanical oil
palm processors were determined.
In summary, the conceptual framework tended to identify the expected technological
capabilities (investment, production, minor and major changes, linkages, strategic marketing
and learning) of oil palm processors in relation to what were existing among them through
the process of learning. Hence, their influencing gaps, needs, errors and lacks were identified
during the study for the policy statement which they (the processors) should note to direct

54
their roles in the development of their technological capabilities in the oil palm processing
industry to satisfy the consumers (household users of Technical Palm Oil (TPO), commercial
users of TPO and Industrial users of Special Palm Oil (SPO) and Palm Kernel Oil (PKO).
Box “A” contains the oil palm processing industry making up of fully
automated mill and semi-automated mill processors, non –automated mill who
are expected to acquire the technological capabilities in Box “B” ,
Box “B” contains the expected oil palm processing technological
capabilities which the processors should acquire through process of leaning
mechanisms.
Box “C” contains the acquired and existing technological capabilities
among the processors which are used in comparison to the expected
technological capabilities at the enterprise level.
Box “D” exposes the areas of technological capabilities which the
processors lacked, needed, gaped and errored in that call for acquisition and
correction in order to enhance expected success in their oil palm processing
enterprises.
Box “E” brings in the policy makers who would make policy statements
based on the findings of the study for stakeholders in oil palm processing
enterprises
Box “F” contains the processors (mill operators, managers and floor
workers) who must adhere to the policy statement of policy makers in other to

55
acquire and improve their technological capabilities in oil palm processing
enterprises.
B C D
A
•
Enterprise
level
Learning
processes
Fig. 3: Schema for the study of the technological capabilities of mechanical oil palm processing
industry in Anambra State, Nigeria
The oil palm
processing industry
Technological
capabilities expected
of the oil palm
processing industry • Investment
• Production
• Linkage
• Minor change
• Strategic marketing
• Major change
* Learning mechanism
Technological
capabilities
existing in the
oil palm
processing
industry
Technological
capabilities
*Lacking
*Needs
*Gaps
*Errors
Policy
implication
for
stakeholders
in oil palm
processing
industry
Mechanical oil
palm processors
*Fully
automated mill
processors
* Semi-
automated mill
processors
* Non-
automated mill
processors Processors
• Mill operators
• Managers
• Floor workers
F
E

56
CHAPTER THREE
3.0 METHODOLOGY
3.1 Study area
The study was carried out in Anambra state, Nigeria. Anambra State which
lies between latitude 5o4
1 and 7
o05
1 North and longitude 6
o31
1and 8
o31
1 East occupies
an area of approximately 5025km (Egboka and Nwafor, 1994). The state has an
estimated population of 4.18 million people (NPC, 2006). The climate is characterized
by uniformly high temperatures and seasonal distribution of rainfall (Osinem, 2005;
Okigbo, 1972). The rainfall pattern begins in April with a steady increase in rain
through August and intense rains during September after which emerges decreasing
rain which stops in October and November. The inhabitants of the rural communities
are mainly farmers producing staple food crops such as cassava, yam, pear, raffia
palm, mangoes, cashew, oil palm, oil bean, african breadfruit, Ogbono, guava e.t.c.
The state has four agricultural zones namely; Aguata, Anambra, Awka and Onitsha
which are further divided into extension blocks and circles. Also, the inhabitants are
engaged in tradings and other industrial activities eg. fabrication of agro-equipment
and artesanal workmanships, processing of palm fruits and kernels etc.

57
Anambra State
Fig. 4: Map of Nigeria showing 36 states and F.C.T.
Source: http://www.maplibrary.org/stacks/Africa/Nigeria/Anambra/index.php.

58
Fig. 5: Map of Anambra State showing deriveable agricultural and natural
resources.
Thick line is the areas covered by study.
Source: Anambra State Ministry of Agriculture (MOA, 2012)

59
3.2 Population and sampling procedure
All mechanical oil palm processors and consumers in Anambra State
constituted the population. The processors were classified into mill operators, mill
managers and floor workers according to their functional activities. A multi-stage
sampling procedure was used to select samples of mechanical oil palm processors.
The multi-stage sampling procedure was based on the existing four agricultural zones
namely: Aguata, Anambra, Awka and Onitsha. According to Small Holder
Management Unit (SMU) of Ministry of Agriculture report (2010), there were 1,250
oil palm farmers, 300 processors, 15 industrial mills, 200 automated small-scale
processing equipment, 48 hydraulic presses and 350 screw presses in Anambra state.
There were also poorly co-ordinated Oil Palm Farmers Association (OPFs) and Oil
Palm Produce Association (PPAs) in some of the Extension Blocks (EBs) in Anambra
state. Anambra State Agricultural Development Programme (ADP) has it that there
are 21 LGAs, 21 extension blocks (EBs) and 177 circles (ADP, 2012).
The above information stood as over all population for the study. Based on the
concentration of mechanical oil palm processing mills, three agricultural zones were
purposively selected, namely; Aguata, Awka and Onitsha. Two extension blocks
(EBs) were purposively selected from each agricultural zone for the same reason of
concentration of processors making a total of six EBs. The six selected extension
blocks included, Aguata, Anaocha, Awka South, Ekwusigo, Idemili South and Nnewi
North.

60
Similarly, a purposive selection of four (4) circles in each EB was done and a
list of two oil mills, two mill owner/operators, two processing managers, two floor
workers and two consumers was selected in each circle. Subsequently, 48 oil mills,
48 mill owner/operators, 48 processing managers, 48 floor workers were selected
using purposive sampling technique to get a total of 144 respondents for the study.
The summary of sampling frame is presented in Table 3.
Table 3: Summary of composition of population and sample size
Respondents
Anambra
State
Agric.
Zone
Extension
blocks
Circles Oil
mills
Mill
operators
Processing
manager
Floor
workers
Grand total
of
respondents
Aguata 2 8 16 16 16 16
Awka 2 8 16 16 16 16
Anambra - - - - - -
Onitsha 2 8 16 16 16 16
Total 6 24 48 48 48 48
Grand total of respondents 48 48 48 144
3.3 Data collection
Data were collected from both primary and secondary sources. The instrument
for primary data collection was a modified enterprise level interview schedule that
contained structured and semi structured questions (Marsden and Garzia, 1998; in
Enwere 2006). Four different interview schedules were designed and administered to
oil mill owner/operators, processing managers, and processing floor workers in order
to obtain relevant information from them. Additional information were collected
through direct observation of activities, equipment and environment of the oil palm

61
processing mills and by participations in mill operations. Information about some
advertisement and strategic marketing gimmicks were collected from sign boards and
distribution vans.
The interview schedule was divided into four sections for the respondents.
Section 1 sought information on the socio-economic profile (characteristics) of the
enterprises/processors. Section 2 was on description of available technologies to the
processing respondents. Section 3 sought information on technological capabilities of
the respondents in terms of investments, production, linkage, minor and major
changes, strategic marketing and learning mechanisms. Section 4 identified the
factors influencing the development of technological capabilities of respondents.
3.4 Measurement of variables
Objective 1: Information on the socio-economic characteristics of the
enterprise, processors, (mill owners/operators, processing managers and processing
floor workers) was measured thus:
Enterprise socio-economic characteristics
Business name/address: With exception of managers and floor workers, the
mill owners/operators were required to give their business names and addresses.
Organizational structure: The processing managers were required to indicate
how many departments they have, and rationale for creating them.
Management functions: The processing managers were required to indicate
what functions they perform whether planning, evaluating, organizing, decision
making, monitoring, controlling and all of the above. The processing managers were
required to indicate whether they delegated duties or authorities to their subordinates

62
and how, recruitment procedures and type of worker they prefered to recruit, and good
communication channels adopted.
Year of establishment: Mill owner/operators or managers were asked the
actual year of starting/establishing the business.
Sources of enterprise Labour: The mill owner/operators and processing
managers were asked to state sources of their labour for production. On the basis of
their responses, the sources were grouped into 3 thus: family, hired, and family/hired.
Type of employment: The processing managers and floor workers were
required to indicate whether they were employed on permanent or temporal basis. No
of workers employed and areas trained in, were required also.
Number of employees: The mill owner/operators were required to state the
number of workers working with them in mill operations. While the managers were
required to state the total number of workers in the entire processing enterprise.
Estimated monthly income: All the respondents were required to state or
estimate monthly income accruing to them.
Processors (Objective 1)
Sex: The sex of all the respondents was recorded at nominal levels as 1 and 2
for male and female, respectively.
Age: All the respondents gave their actual ages in years.
Marital status: Nominal levels of 1, 2, 3, 4 for married, widowed, divorced
and single, respectively were used to measure the marital status of all the respondents.
Educational levels: The respondents were measured by requesting them to
state their highest level of educational attainment and the basis of their response was

63
grouped into five categories viz: no formal education, (NFE), First School Leaving
Certificate (FSLC), Secondary Education (SE), Tertiary Education (TE), (OND, NCE,
HND, First degree) and Higher degrees (MSc. and Ph.D).
Years of experience: Respondents were asked to specify number of years they
have worked in the enterprise.
Number of people living in a household: The respondents such as
mill/operators, managers and floor workers were required to state the number of
people living in their households.
Objective 2: Sought to describe the available technologies of key actors. The
respondents were asked to mention the technologies they have acquired/adopted. The
mill owner/operators were asked to indicate the types of processing system (that is
whether fully automated, semi automated and or non-automated) they were using.
They were required to mention the different components involved in the system they
are using such components could be: use of sterilizer, stripper, digester, pressing
machine, clarifier, type of engine being used to operate the equipment and effluent
disposal pits. The processing managers were asked similar questions as in the case of
mill owner/operators while floor workers who worked under mill owner/operators and
managers. .
Objective 3: Sought information on technological capabilities of the
respondents.
Investment: Was measured by requesting for the investment made within 3
years in the enterprise of oil palm processing as mill owner/operators, processing
managers and processing floor workers. The investments were on machinery

64
(equipment) or human resource development. As investment is represented by project
execution activities including feasibility studies, equipment search, assessment of
equipment, employee training, all respondents were asked to itemize investments
their enterprises had made in terms of equipment and human resources within last
three years. For human resources (development), they specified the number of staff
with their qualifications, the type of training on processing of oil palm fruits,
maintenance training and amount invested into such trainings.
Production capability: Involved the skills and knowledge needed for the
efficient operation in the maintenance of equipment during production and timely
monitoring of processes during processing of oil palm fruits by processors. The mill
owner/operators were asked to indicate the quantity of fresh fruit bunch (FFB) their
machine/equipment could process at a time/process, method of heating the palm fruits
– that is either sterilizer use or local heating in drums, whether they used fully
automated, semi-automated or non automated methods in processing, how they stored
their oil, whether they underwent analysis of their oil in relation to chemical
composition; or the use of sensory method to measure taste, appearance, shelf life,
flavour, overall quality, texture, colour, mouth feel and congeality. The oil mill owner
and processing managers were asked to indicate likely causes of oil spoilage they
know, how they did their cleaning and disposal of wastes with or without problems.
Minor and major change capabilities: This involves short and long term
improvements and adoptions of equipment and human resources. The mill
owner/operators, managers and floor-workers were required to itemize both minor and
major changes with regards to processing technological capabilities that have taken

65
place in their enterprise/firm within the last three years. They were asked to list and
describe the type and nature of minor and major changes that have been carried out in
relation to equipment design, equipment replacement, method/process, investment,
product, packaging, manufacturer quality control, marketing, communications,
linkages, organization, management and other investments within last three years.
Strategic marketing: This involved knowledge and skill required for
collecting marketing intelligence, development of new markets, establishment of
distribution channels and provision of consumer services. The respondents were
asked to state marketing channels they used in marketing their products. The strategic
management function of marketing between the processors and consumers were
asked. With the exception of others, only managers were asked to also list and
describe methods for collection of information about customer/consumers needs and
complaints and promotions/advertisement of their products.
Linkage capability: The mill owner/operators and managers were asked to
indicate the type linkage capabilities among themselves and with external sources.
Nominal levels of 1, 2, 3, 4, 5 and 6 for direct, indirect, vertical, horizontal, internal
and external, respectively were used to measure the linkage type that existed among
the processors and other external actors such as sellers of equipment, technology
transfer group, extension agents (government or individual), consumers, markers,
farmers etc). The respondents ticked against the type of linkage that applied to them.
Frequency counts and percentage were used to determine the type of linkage.
Learning mechanisms capabilities: The mill owner/operators, floor workers
and processing managers were asked to list and describe the type of formal education

66
non-formal education, private support learning mechanisms received from private
organizations, and collective support learning mechanisms from different government
and non-government institutions in the last three years. The managers and mill
operators were asked to indicate what they have learnt to be the causes of low quality
oil.
Objective 4: Factors (constraints) that influence the technological capabilities
development of the actors. Such factors included: poor linkage with other
stakeholders/actors, no price control, poor financing, poor infrastructures policy, poor
environmental regulations, inflation, crime and theft, lack of labour, unavailability of
equipment, finance, no water supply, poor marketing/distribution of products,
consumers attitude/complaints, spoilage, storage facilities, no preservative measures,
power outage, poor quality of production and factory space etc. The respondents were
asked to respond to the above possible factors using a four-point Likert type of scale
of “to a great extent” (4), “to some extent (3)”, to a little extent (2)” and “to no extent
(1)”. The mean value of 2.5 was used to determine the factors. Variables that have a
mean value of 2.5 and above were considered as factors that influence technological
capability development and those below 2.5 were not. For policy relevance, data were
further subjected to exploratory factor analysis procedure using the principal factor
model with varimax in grouping the influencing factors (Cornrey 1962). Only
variables with loadings of 0.4 and above (10% overlapping variance) were used in
naming the factors.

67
3.5 Data analysis
The data from the study were analyzed with mean scores and factor analysis
and the results presented in percentages.
Objective one was analysed using percentage and mean to identify socio-
economic characteristics of the mechanical oil palm enterprise/processors. Objective
two was analysed using descriptive statistics. Objective three was analysed using
percentage and mean to examine the respondents technological capabilities. Objective
four was analysed using mean scores and factor analysis.
Version 16.0 of the Statistical Product for Service Solution (SPSS) software
was used for the analysis.

68
CHAPTER FOUR
4.0 Results and Discussions
Results of the study are presented as follows:
* Socio-economic characteristics of enterprise/processors
* Description of available technologies to the processors
* Mechanical oil palm processing technological capabilities (investment, minor
and major changes, production, strategic marketing, linkage and learning) of
processors.
* Factors influencing the development of technological capabilities of
processors.
4.1 Socio-economic characteristics of mechanical oil palm fruits processing
enterprise
Information on the above title were responses from either mill operators (MOs)
and or processing managers (PMs). Names and addresses of the oil mills are
presented in Appendix 1(one)
Ages of the oil mills are given in Table 4. Age of enterprises ranged from1 - 10
years (35.4%), 16 - 25 years (31.2%) and 26 - 30 years (10.4%). The oldest oil mill,
which is located in Oraifite was 52 years as at the time of the study. All the oil mills
studied had management, mill operation and oil production units (100%). The only
rationale for creating the various units was for ease of function. The mill operators
were responsible for operation of the machines and equipment, the managers were for
management while floor workers were for production activities.

69
The structure of an organization is the manner in which the various sub-units
are arranged and inter-related. It is the institutional arrangements and mechanisms for
mobilizing human, physical and information resources at all levels of the system. It is
used in the division of work into activities, linkage between different functions,
hierarchy, and authority structure and relationships and co-ordination (Sachedeva,
1990; Robins and Judge, 2007).
The mode of service for the oil mills was 97.9% for personal and public
services and 2.1% for personal services only. This shows that all except one oil mill
engaged in commercial services to the public in processing oil palm fruits in addition
to their personal services. The respondents said they engaged in commercial services
to the public in order to break even and make more profits.
Table 4: Percentage distribution of mills based on age, organizational structure
and mode of service
Characteristics Percentage (n = 48) Mean
Age 1 – 5 8.3
6 – 10 27.1
11 – 15 12.5
16 – 20 10.4 15.8
21 – 25 20.8
26 – 30 10.4
Above 30 10.4
*Organizational structure (units) in the oil mill
industry
Management for managers 100.00
Mill operation for mill operators 100.00
Oil production for the floor workers 100.00
Rationale for creating units
Function 100.00
Mode of service
Personal services only 2.1
Personal and public services 97.9
*Multiple responses

70
Management and communication in oil mill enterprises
Data in Table 5 show that management of oil mills studied was in the hands of
owners or delegated family members (62.5%) and employed managers (37.5%).
Managers are the people who see that things are done by themselves or through other
people. In mechanical oil palm fruit processing, there were about 62.5% of
respondents who functioned as both managers and mill owners and 52% of them were
managers who actually performed functions either as mill operators or oil production
workers. Other managers (37.5%) took part in general work especially where the
employers were engaged in commercial production of palm oil. Although there were
few manager/owners (10.5%) who did not actually perform the work, but they were
usually responsible for successful completion of work (Nzeoma, 2000; Bererlien et al.,
1995).
The managers’ management functions which the respondents said they were
involved in included planning (50%), evaluation (41.6%), organizing (72.9%),
decision making (37.5%), monitoring (83.3%) and controlling (93.75%). Those who
said they performed all of the above functions were 4.2%. However, they also
delegated authorities, and guidelines for delegation of duties or authorities to
subordinates were; on result expected (89.6%), task to be done (95.8%), open line of
communication (62.5%) and family members (58.3%). Controlling all the workers
and activities was mainly to maintain peace among workers, prevent damage of
equipment and increase production.

71
Types of worker
Types of worker in mechanical oil palm fruits processing included; full time
workers (20.8%), part-time workers (47.9%) and family members (31.3%) Table 5.
These are employees who did work in the oil mills on daily or monthly basis or in
kind as in the case of family workers who might get their pay (reward) through
payment of school fees for their wards or in feeding and clothing.
Methods of communication
Methods of communication used in the oil mill are shown in Table 5. On the
whole, briefing (83.3%), GSM phone calls (79.2%) and personal discussion (41.6%)
were prominent methods. Communication through other workers (20.0%) was less
used.
Communication is a basic element in an organizational structure and function.
It is the key mechanism for achieving integration and co-ordination of the activities of
the specialized units at different levels in an organization (Asopa and Beye, 1997).
According to (Fisher, 1982; Adedoyin 2011), communication is the basis of society
for effective communication flow and it should be a multilateral process.
Staff recruitment in oil mill enterprise
Staff recruitment procedure in oil mill is given in Table 5. The advertisement
of vacancies was done mainly through the processing fruit owners who recruited
floor-workers (43.8%), and through present employees (25%). Further, staff
recruitment was done through friends and neighbours (14.6%), unsolicited applicants
(10.4%) and notice boards (6.2%) which was used in less important level. According
to Bererlien et al (1995), word of mouth (that is announcing vacancies to employees

72
and other people) can be a valuable method for advertising a job. This is particularly
important and less expensive method for small businesses such as oil mill industry.
Consideration for filling vacancies
The conditions for filling vacancies were; no preference (41.7%), no
experience (37.5%) and previous experience (20.8%). Some works/tasks require no
preference to either male or female, hence no gender barrier or experience was
required before one is employed and such tasks include cooking of fruit, manual fibre
separation, cleaning of the equipment, hewing of fire wood and cooking of oil for
clarification. Workers without experience are given on-the-job training as they start
work. The jobs that need previous experience and gender preference border on
operation of machines and equipment with routine maintenance.

73
Table 5: Percentage distribution of mills based on management and
communication in oil mill enterprising
Management and communication Percentage *(n = 48)
Manager/mill owner 62.5
Manager (employed) 37.5
Manager/owner who performed work and mill operation 52.0
Managers management functions Planning 50.0
Evaluation 41.6
Organizing 72.9
Decision making 37.5
Monitoring 83.3
Controlling 93.75
All of the above 4.2
Delegation of authority
Guides for delegation of authority to subordinates Result expected 89.6
Task to be done 95.8
Open line of communication 62.5
Family member 58.3
Types of worker Hired full-time workers 20.8
Hired part-time workers 47.9
Family members 31.3
Methods of communication to workers
Briefing 83.3
Personal discussion 41.6
Phone calls 79.2
Through other workers 20.8
Staff recruitment procedures
Through present employers 25.0
Notice boards 6.2
Through friends and neighbours 14.6
Unsolicited applicants 10.4
Processing fruit owners recruit floor-workers 43.8
Consideration for filling vacancies
No preference of gender 41.7
Previous experience 20.8
No experience 37.5
* Multiple responses

74
Average number of workers
Majority (83.3%) of oil mill enterprises employed 6 – 10 workers while 8.4%
employed 1 – 5 persons. The mean number of workers was 8 persons. Also 8.3% of
the enterprise employed 11 – 15 persons. The workers comprised of fulltime workers,
part time or casual workers and family members in proportion of what was discussed
in types of worker (Table 5). This implies that oil palm mill industry is a small scale
business. According to Akwuodo (2006) small scale industry is one that has 11 – 100
workers or a total amount of money of not more than N50 million including working
capital. The number of workers in an enterprise depended on the available equipment
mechanized (less workers), firm size and infractural developments. Manpower,
otherwise known as human resource, employee, worker, personnel and staff is an
active part of production. Man has to do the thinking, invention and operation of
machine and so human resource constitutes the ultimate basis for production
(Harbison, 1982 in Enwere, 2001). Therefore, the type of employee by the processing
enterprises will determine their success or failure.
Table 6: Percentage distribution of mills based on number of workers
Workers Percentage
(n = 4.8)
Mean
1 – 5 8.4
6 – 10 83.3 8.0
11 – 15 8.3
Above 15 0.0

75
4.2 Socio-economic characteristics of mechanical oil palm processors
The socio-economic characteristics of human resources in oil palm processing
enterprises are given in Table 7. The human resources studied included oil mill
operators, managers, floor workers and consumers. Human resource is at the centre of
all the technological capabilities. They have to acquire the skill, knowledge and
experience required for investment, production, changes (minor and major), marketing
and linkage (Adeboye and Clark, 1996; Barry, 2000). It is also important to know
how the nature and quality of the human resources in the oil palm processing
enterprise affect all the other technological capabilities. Manpower is therefore, the
catalyst that makes all the other resources fail or succeed (Osuji, 1992 in Enwere,
2001).
Sex
Data in Table 7 show that all the mill operators (100%) were males. Also,
majority (79.2%) of mill managers were males while 20.8% were females and
majority (95.8%) of floor workers were females. These findings show that females
were favoured in mill operation tasks that involved lifting of palm fruits into
sterilizer/digester, operation of heavy running machines such as digesters, presses and
fibre separators and or nut crackers as the case may be. In the management of mill,
managers are involved in tedious and energy expending works which on the contrary,
managers in bakery industries are not but to see that floor workers and supervisors did
the work under their instructions and monitoring (Enwere,. 2001). The finding on
floor workers agrees with Enewre’s (2000) finding where females dominated the work
force in soymilk enterprises in Nsukka Urban. This may be attributed also to the

76
nature of work done such as cooking of palm fruits, manual fibre separation, washing
of equipment/containers, cooking of crude oil for clarification, packing of oil, fibres,
nuts and other containers used in the oil mills etc which are socially and traditionally
regarded as females’ work.
Age (years)
Entries in Table 7 show that 36.5% of the processing managers (PMs) were
between the ages of 41 – 50 years and 20.5% above 60 years. The mean age was 46.2
years. The data for the ages of mill operator (MOs) show that majority (54.1%) of
them were within the age range of 31 – 50 years, 18.8% of them within the age range
of 51 – 60 years and about 12.6% were with the age range of 26 – 35 years. The mean
age was 43.62 years. The age of floor workers (FWs) ranged from ≤ 20 – 60 years.
The majority (68.8%) of FWs ranged between 26 – 40 years and 17.0% of them also
fell between the age range of 41 – 50 years. The mean age was 36 - 76 years.
The fact that the mean ages of the PMs, MOs and FWs were 46.6, 43.6 and
36.7 years, respectively implies that the processors were matured people. Hence they
should be able to take rational decisions and appreciate the importance of their work
and environment in terms of development of technological capabilities. This implies
also that the processors were still within their middle age as well as active years to do
their works effectively. The above findings agree with the findings of Enwere (2001)
where mean ages of the processors of bakery industry fall between 40 – 50 years.
Marital status
Data in Table 7 also show that majority (91.7%) of the mill operators (MOs)
were married while very few (3.3%) were single, majority (79.2%) of the processing

77
managers (PMs) were males while 20.8% were females, majority (91.7%) of the floor
workers (FWs) were married, 6.2% were widows. These findings are in support of the
findings of Okonkwo (2010). In her findings, majority (95.8%) of the processors of
oil palm in Anambra State were married. The finding also portrays sustained
marriages which are regarded as an act of responsibility on part of both make and
female in Anambra State as they divide their time between work and family (Obiora,
2012). This also implies that oil palm processing enterprise is a household sustaining
business to take care of their basic needs (food, shelter and clothing).
Educational status
Entries in Table 7 reveal that half (50%) of MOs obtained West African
Examination Council Certificates, 45.8% obtained First School Leaving Certificates,
2.1% obtained tertiary institution certificates while 2.1% had no formal education.
The PMs (50%) had their secondary education completed, 29.1% had First School
Leaving Certificates, 18.8% had uncompleted secondary education while only 2.1%
had tertiary education (MSc). On the other hand, 47.9% of the FWs were WAEC
holders, 37.5% obtained tertiary education certificates, 10.4% obtained FSLCs while
4.2% did not complete primary school education. It could be inferred from these
findings that about 100%, 97.9% and 95.8% of the PMs, MOs and FWs respectively
had attended formal school and they could be described as literate who could read and
write. Hence, the level of education attained by the respondents is relatively high.
This finding is in agreement with the findings of Okonkwo (2010) and Enwere (2001).
In their findings, they discovered that processors of oil palm fruits and bread in
Anambra State and South Eastern Nigeria respectively, had high level of education.

78
Sheik, Mohammed, Bashir and Kashif (2006) note that high literacy level makes
adoption in the agricultural sector high. This could therefore be an advantage as it
could enhance high level of adoption of technological capabilities/innovations by the
respondents in oil palm processing industry.

79
Table 7: Percentage distribution of oil mill operators, managers, floor workers and consumers
based on socio-economic Characteristics
Socio-economic characteristics
of
processors and
consumers
Mill
operators
(%)
Mean Managers
(%)
Mean Floor
workers (%)
Mean
Sex
Male 100 79.2 4.2
Female 0 20.8 95.8
Age (years)
Up to 25 6.3 0.0 6.6
26 – 30 6.3 2.4 15.5
31 – 35 12.5 0.0 15.5
36 – 40 24.9 18.7 37.8
41 – 45 16.7 0.0 6.6
46 – 50 6.3 43.6 36.5 46.6 10.9 36.7
51 – 55 12.0 0.0 4.4
56 – 60 8.4 21.9 2.2
Above 60 2.1 20.5 0.0
Marital status
Married 91.7 81.3 91.7
Single 8.3 8.3 6.2
Widowed 0.0 10.4 2.1
Education status
Uncompleted FSLC 0.0 0.0 4.2
FSLC completed 45.8 29.1 10.4
Uncompleted secondary
education
0.0 18.8 0.0
Completed secondary education 50.0 50.0 47.9
Tertiary education 2.1 2.1 37.5
No formal education 2.1 0.0 0.0
Household size
1 – 2 20.8 20.8 20.8
3 – 4 45.8 41.6 41.6
5 – 6 25.0 4 31.3 5 31.3 5
7 – 8 8.3 6.3 6.3
Above 8 0.0 0.0 0.0
Cannot assess 0.0 0.0 0.0
Estimated monthly income (N)
≤ N15,000 10.4 37.5 25.0
N15,001 – N30,000 62.5 41.6 20.8
N30,001 – N45,000 12.5 N18,584 4.2 N17,291.67 8.4 N22,843.70
N45,001 –N 60,000 4.2 6.3 16.0
N60,001 – N75,000 0.0 0.0 20.8
Cannot assess 10.4 10.4 8.4
Training in mill operation
Trained before working 12.5
On-the-job training 87.5
Trained in (as managers)
Mill operators 39.6
Management 6.2
Equipment fabrication 10.4
Hydraulic press operation 2.1
Machine/equipment installations 2.1
No formal/informal training 39.6
Employer of labour (mill
operators)
Individuals 33.3
Co-operative society 20.8
Family joint business 4.2
Self employed 41.7
Type of employee (n = 28)
Permanent 35.7
Temporary 28.6
Daily paid 35.7
Types of employee (floor
workers)
Temporary(Daily paid) 22.9
Self employed 77.1
Years of experience
1 – 5 0.0 7.5 45.9
6 – 10 58.3 12.6 24.9 5
11 – 15 0.0 18.8 29.2
16 – 20 22.9 0.0 11.6
21 – 25 0.0 12.5 44.9
26 – 30 8.3 16.2
Above 30 10.5 0.0
Ownership of fruits processed
Owned the fruits 77.1
Did not own the fruits 22.9
Household size (persons)

80
Table 7 reveals that about 45.8% of the MOs had a household size of 3 – 4
persons while 25.0% of them had a household sized of 5 – 6 persons as well as 20.8%
of them had household size of 1 – 2 persons. On the other hand, 41.6% of the PMs
had household size of 3 – 4 persons, 31.3% of them had 5 – 6 persons while 20.8% of
them also had household size of 1 – 2 persons. Data in Table 7 further show that
about 41.6% of the FWs had household size of 3 – 4 persons, 31.3% of them had
household size of 5 – 6 persons, while 20.8% of them had household size of 1 – 2
persons. The average household size for the MOs, PMs and FWs were 4, 5 and 5
persons, respectively.
These findings are in agreement with the findings of Okonkwo (2010). In her
findings, she discovered that processors in Anambra State had moderate household
size. Household size could influence the level and rate of adoption of technological
capabilities. The larger the household size, the more likely the enterprise labour will
be available to enhance the practice of technological capabilities and more mouths to
feed. Also, in consonance with Enwere (2001), processors with large household size
are capable of readjusting to sudden changes in labour supply at peak periods of
labour demand.
Estimated monthly income (N)
Entries in Table 7 show that the estimated income of mill operators MOs
ranged from N15,000 – N45,000 and above N45,000. Majority (62.5%) of the MOs
earned between N15,001 – N30,000 per month, 12.5% of them earned N30,001 –
N45,000, 10.4% of them earn < N15,000 while 4.2% earn above N45,000. Data in
Table 7 further show that about 41.6% of the processing managers (PMs) earned

81
between N15,001 – N30,000, 37.5% earned ≤ N15,000, 6.3% of them earned between
N45,001 – N60,000 while 10.4% could not estimate. Entries in Table 5 further show
that majority (54.1%) of the floor workers (FWs) earned ≤ N45,000 while 37.4%
earned between N40,000 to above N60,000.
The fact that the mean estimated monthly incomes of the MOs, PMs and FWs
were N18,584, N17,291.67 and N22,843.7, respectively, implies that some of the
processors were earning monthly income below the Nigerian minimum wage of
N18,000 only, some of them were earning monthly income within the Nigerian
minimum wage of N18,000 while some earned monthly income slightly above it.
This implies that the processors belong to low income earners which encourages
labour mobility from oil palm processing business to other businesses of greener
pasture. Hence, technological capabilities are influenced negatively in areas of
productions and investments. Some of the processors did not say their estimated
income thinking it would incur tax payment or that the income fluctuated from time to
time and they could not do proper accounting. However, business can not perform
effectively without proper accounting. Accounting is the process of recording,
classifying and summarizing business transactions. The respondents who could not
estimate their incomes should make sure that their basic financial statement for
business control are well handled (Beierlien et al 1995 in Enwere, 2001).
Training in mill operation/trained in (as managers)
Entries in Table 7 show that 87.5% of the MOs were trained as on-the–job
trainees while 12.5% were trained in some other mills before starting work in a new
mill. The same Table 7 further shows that about 39.6% of the processing managers

82
were trained in mill operation. 10.4% were trained in equipment fabrication, 6.2%
were trained in oil mill management while 2.1% and 2.1% were trained in operation
and maintenance of hydraulic press and installation of machines and equipment,
respectively. About 39.6% of the PMs did not have formal or informal training before
starting work. The above findings agree with some of the findings of Enwere (2000)
and Okonkwo (2010). In their findings, on-the-job trainings were used to train
workers in soymilk and oil palm processing in Nsukka urban and Anambra State,
respectively. The on-the-job training of MOs shows that there is no specialized
training institute where formal training could be attained and this may have
implication of wastage of resources or damages of equipment before the MOs master
the skill of operating machine or equipment. The PMs on the other hand who did not
have any training in mill management before becoming managers must have been
trained later as on-the-job trainees implying trial and errors that often resulting in
wastage and damage of resources.
Years of experience
Data in Table 7 show that majority (58.3%) of MOs had ≤ 10 years experience
in mill operation, 22.9% of them had between 10 – 19 years experience, while 10.5%
had 30 years and above experience. The table further shows that 44.9% of the PMs
had between 21 – 25 years experience, 18.8% had between 11 – 15 years, 16.2% had
between 26 – 30 years experience while 12.6% had 6 – 10 years experience in
management of oil mill. The mean years of experience for MOs and PMs were 12.5
year and 11.6 years, respectively. The fact that the mean years of experience for both
MOs and PMs were 12.5 years and 11.6 years, implies that both MOs and PMs were

83
experienced in oil mill operation and management respectively which by implication
will incur less wastage/damage of working equipment, guarantee proper maintenance
and management of both equipment and human resources.
Employer of labour (mill operators)
Entries in Table 7 show that 41.7% of the MOs were self employed, 33.3% of
them were employed by individuals, 20.8% were employed by co-operative societies
while 4.2% were employed by family joint business. The results above agree with
Enwere (2001) where certain tasks that required moving machineries, high
temperature and high expenditure of energy were given to males alone in bakery
industries. The implication also is that those oil mills owned by females or women
co-operative societies and families employed male workers to do the task of mill
operations for them. It can also be said that female workers were favoured and not
discriminated against. This then, on the other hand posses danger to mechanical oil
palm processing where male workers are not available or the male workers may
decide to demand high pays unreasonably knowing that without them, the mechanical
processing will be influenced adversely.
Types of employee
Data in Table 7 show that among the MO employees, about 35.7% were
employed as permanent workers, 28.6% were employed as temporary workers while
35.7% were daily paid workers. Table 7 further shows that majority (77.1%) of floor
workers were self employed, while 22.9% were temporary daily paid floor workers.
The results about the MOs show classes of non-self employed, the respondents said
that because of peak and off peak periods of oil palm fruiting, the mill operation work

84
is seasonal, resulting to often changes in recruitment of all the above classes of
workers. The results about the FWs might imply that as most of them were self-
employed and owned the fruits, were ready to work for themselves. The temporary
daily paid employees were unsolicited workers who came to seek for job in the
enterprises and were offered job as need arose.
Ownership of palm fruits processed (FWs)
Entries in Table 7 show that 77.1% of the FWs owned the palm fruits
processed. This is might be as a result of public service nature of oil palm processing
industry. The smaller (22.9%) proportion of the respondents could belong to owners
of the mill who employed their own floor workers or did the work themselves.
Description of available technologies to mill operators/floor workers
Technologies here include knowledge embodied in machines, skill of people,
behavioural patterns, and procedures which are not reduced to machines alone.
Available technologies are assessed for mill owner/operators and floor workers.
4.3 Description of available technologies to mill owner/operators
Available oil mill system
Data in Table 8 show that majority (87.4%) of mill operators operated semi-
automated oil mill system, 10.4% operated fully automated oil mill system while 2.2%
of the mill operators operated non-automated milling system. Automated refers to
those equipment or machines that are connected to auto-engines to operate. The
results show that fully automated milling system starts from steam sterilization-
automated digesters - automated press - oil filter (or clarifier tanks) and finally to
automated fibre separator. The semi-automated starts from drum cooking of fruits –

85
automated digesters – automated presses – manual oil filtering to manual fibre
separation. Non-automated implies that the mechanical screw press and any other
equipment are operated manually.
Available equipment/ machines
Data in Table 8 show that the majority (97.9%) of the mill operators had
digester, 10.4% had sterilizer, 45.8% had hydraulic press, 31.3% had jack press,
22.9% had manual screw presses while 29.2% and 2.1% had fibre separator and
stripper respectively. Also, 4.2%, 4.2% and 4.2% of the oil mill operators had lift
(conveyor), nut cracker and welding plant, respectively. The availability of the above
equipment and machines relieve processors of some of their arduous tasks and
improve production efficiency and quantity of palm oil produced.
Combination of equipment/machines in batch system
Entries in Table 8 show that 10.6% of the mill operators combined sterilizer,
digester, hydraulic/jack press and fibre separator (fully automated), 29.8% of the MOs
combined digester, hydraulic/jack press and fibre separator (semi automated), 36.2%
of them combined digester and hydraulic press (semi automated) while 23.4% of them
as well combined digester and hand screw press (semi automated). The proper
combination of equipment is a function of money availability which enhances
investments. Some of the processors bought the equipment at the initial stage of the
business while some bought as money began to accrue from the business. Fully-
automated system is more capital intensive, hence the semi-automated is more
acceptable and patronized.
Available horse power engines used

86
Data in Table 8 show that the mill operators used different horse-power
engines in fully automated mills. It was observed that 4.2% and 4.2% of the mill
operators used 16 – horse power and 17 horse power engines (diesel), respectively
while 2.1% of the mill operators used 12 horse-power engines to operate fully
automated mills. For semi-automated mills, 38.0%, 31.3% and 21.2% of the mill
operators used 12 – horse-power, 10 horse-power and 8 horse-power engines,
respectively. Low throughput equipment and machines use low horsepower engines.
The use of low horsepower engines to run high throughput equipment spoils the
engines, in a short run, hence it is discouraged.

87
Table 8: Percentage distribution of mill operators based on available technologies
to them Available technologies Percentage (n = 48)
Oil mill system operated:
Fully automated oil mill 10.4
Semi-automated oil mill 87.4
Non-automated oil mill 2.2
Equipment/machine:
Sterilizer 10.4
Stripper 2.1
Digester 97.9
Presses:
Hydraulic press 45.8
Jack press 31.5
Handscrew/press 22.9
Fibre/nut separator 29.2
Lift (conveyor) 4.2
Nut cracker 4.2
Welding machine 4.2
Combination of equipment/machines:
Sterilizer, digester, hydraulic/Jack press and fibre separators (full automated) 10.6
Digester, hydraulic/Jack press and fibre separator (semi automated) 29.8
Digester and hydraulic/Jack press (semi automated) 36.2
Digester and hand screw press (semi automated) 23.4
Horse power engine used (diesel):
Fully automated mills
12 – horse power 2.1
16 – horse power 4.2
17 – horse power 4.2
Semi automated mills
8 – horse power engine 21.2
10 - horse power engine 31.3
12 - horse power engine 38.0

88
Plate 1: Fully automated oil mill comprising sterilizer, digester, press, fibre
separator and oil clarification.
(b) Semi automated oil mill comprising cooking drums, digesters, press, manual
fibre separation and oil clarification

89
Plate 2: Fibre separator, jack press, palm fruits cooking drums and manual
removal of fibre/nuts from press
4.4 Description of available technologies to oil mill floor workers
Available oil mill system
Data in Table 9 show that all (100%) of the floor-worker respondents operated
non-automated oil mill.
Type of equipment/tools used
Data in Table 9 show that all (100%) of the floor workers operated the manual
screw press. It was observed that some (77.1%) of the automated and all non-
automated oil mill enterprises used manual screw presses. Those who had automated
presses used manual screw presses to extract oil (2nd
time) from fibre after nuts were

90
separated. This was done most often by the floor workers without involving the
automated mill operators. Most (83.3%) of the floor workers had manual fibre
separators, 100% had crude oil cooking drums, 89.6% fruits cooking drums, 77.1%
had wheel barrows, 100% had iron or plastic buckets, while 37.5% had oil palm
weaven baskets. These are tools the floor workers were using manually in processing
of oil palm fruits which took them more time and energy than the use of automated
equipment.
Table 9: Percentage distribution of floor workers based on available
technologies/tools
Available Technologies Percentage* (n = 48)
Non-automated oil mill 100
Type of equipment/tools used
Screw press 100
Manual fibre separator 83.3
Wheel barrow 77.1
Iron or plastic buckets 100
Earth sunken digestion drums 2.1
Fruits cooking drums 89.6
Crude oil cooking drums 100
Oil palm weaven baskets 37.5
*Multiple responses

91
Plate 3: Non-automated oil mill method showing the use of manual screw
press and manual fibre separator

92
Mechanical oil palm fruits processors’ technological capabilities (investment,
minor change, major change, learning, linkage, production and strategic
marketing)
Investment capability
4.5 Investment capabilities of oil mill operators.
. Figure 6 shows that 75% of the mill owner/operators claimed they had no
capability while 25% had in terms of investment in equipment. The same figure also
shows that (89.6%) had no investment capability while 10.4% had in human resource
development. Investment capabilities are represented by project execution activities
including feasibility studies, equipment acquisition, equipment search, employee
training etc. Hence investment capability was either investment in machinery
(equipment) or human resource development within the last three years of the oil mill
establishment.
This finding indicates that majority of the mill owner/operators have little
investment capability in terms of both equipment and human resources. This implies
that oil mill owner/operators are not adequately prepared in terms of finances for
innovational changes or that the investments made so far in terms of equipment and
human resources are durable investments that do not need changes often (whether
minor or major changes). This result agrees with the findings of Obiora (2012), but is
in contrast with the findings of Enwere (2001) and Oyebisi, Olamide, and Agboola
(2004) where investment capability was found to be high among the bakery and
telecommunications industry, respectively.

93
Figure 6: Percentage distribution of mill owner/operator based on
number that had acquired investment capabilities
Table 10 further shows the investment capability (equipment and human
resource), which the respondents had acquired. Hundred percent (100%) of the
respondents had acquired digester, 50% had acquired hydraulic press, 41.7% had
acquired fibre/nut separator, 25.0% had acquired Jack press, 16.7% had acquired
nutcracker, 16.7% had acquired welding plant while 25.0% invested in construction of
oil mill house. The result implies that investment within the last three years was done
for those equipment needed in the oil mill industry more especially for respondents
that changed from non-automated equipment to automated milling equipment. The
investinent within three years was adopted to take care of minimal number of years
the equipment could stay before developing fault and number of years a worker could

94
step before deicing to move to another profession. The low investment could also be
attributed to long shelf life of processing equipment.
The same table equally shows investment in human resource. It shows that
100% had undergone on-the-job training, which was meant to acquaint them with
skillful operating capability of the machines/equipment.
Table10: Percentage distribution of mill owner/operators based on investment
capability within the last three years
Equipment capability % *(n = 12) Human Resource capability % * (n = 5)
Type of equipment Type of training
Digester 100 On-the-job training 100
Hydraulic press 50.0
Fibre/nut separator 41.7
Jack press 25.0
Nut cracker 16.7
Welding plant 16.7
Construction of mill house 25.0
*Multiple responses
4.6 Investment capability of oil mill managers
Entries in Figure 7 show that 41.6% of the processing managers invested in
equipment capability. The same table also shows that 89.6% did not have investment
capability in human resource development while 10.4% had. The finding also does
not agree with the findings of Enwere (2001) where investment capability was high in
bakery equipment and human resource development. Investment was mainly directed
to equipment they did not have but felt that investing in those equipment or machines
will help alleviate the arduousness associated with crude tools in processing oil palm
fruits.

95
Figure 7: Percentage distribution of oil mill managers based on numbers that had
acquired investment capabilities.
Table 11 further shows the investment capability (equipment and human
resources), which oil mill managers had acquired. One hundred percent (100%) of the
respondents had acquired record books, 100% had acquired motor vehicle, 20.0% had
acquired motor cycle, 30.0% had acquired office table while 75.0% had acquired
chairs. This result shows that there was investment in transportation and office
equipment. The same table shows that 100% of the respondents who said they
acquired investment capability underwent workshop training for management of
equipment and human resources.

96
Table 11: Percentage distribution of oil mill managers based on investment
capability within the last three years
Equipment capabilities %* (n = 20) Human resource %* (n = 5)
Type of equipment Type of training
Record books 100 Workshop/on-the-job 100
Motor-vehicle 100
Motor cycle 25.0
Table 30.0
Chairs 75.0
* Multiple responses
4.7 Investment capability of floor workers within the last three years
Entries in figure 8 show that only 14.6% of the floor workers invested in
acquisition of human resource development. There was no investment acquisition of
equipment among the floor workers. This result shows that though the floor workers
acquired investment in training, it was very poor.

97
Fig. 8: Percentage number of floor the floor workers that had acquired investment capabilities
Entries in Table 12 show that 100% acquired investment capability in
operation of manual screw press while 100% acquired manual operated fibre
separator,. This result implies that the investment acquisition of floor workers for
human resource development was very poor. It could also imply that the skill
acquisition does not require much training other than physical energy to obey simply
instructions in operating the equipment or their maintenance.
Table 12: Percentage distribution of floor workers based on investment
capability within the last three years
Human resource capability % (n = 7)
Area/type of training
Operation of hand screw press 100
Use of hand fibre separator 100
* Multiple responses

98
Production capabilities
The respondents assessed were the mill operators, floor workers, and managers
who worked as either mill operators or as floor – workers. Data in Figure 9 show that
97.9% of the mill operators, 100% of the managers and 100% of the floor workers
acquired production capabilities. Production capabilities here include production
activities, such as; packaging of products produced, different products and by-
products produced, cleaning methods for processing equipment and tools and causes
of bad palm oil.
The above result shows abundant production capabilities for all the different
players in oil palm processing enterprise. This implies that the actors have ability to
remain in business despite the influencing factors to oil palm technological
capabilities. This finding agrees with an empirical study by Biggs, et al (1995) where
the respondents showed abundant production capabilities which enabled them remain
in business.

99
4.8 Production capabilities of oil mill/owner operators
Entries in Table 13 show that 21.3% of the mills processed between 80 –
100kg of fruits per batch, 10.6% of them processed 101 – 150kg of fruits, 25.5% of
them processed 151 – 200kg of fruits per batch, 31.9% of them processed 201 – 250
kg of fruits per batch, 10.6% of them processed between 251 – 300kg of fruits per
batch, and 2.2% of the mills processed above 300kg per batch.
The result shows varying quantities of fruits processed per batch. This could
derive from the different capacities of auto-engines operating the equipment. Engines
with low horse-power operated equipment of low capacities while engines of high
horse-power operated equipment (for example digester, presses etc) of high capacities
Fig. 9: Percentage distribution of respondents based on acquired production capabilities

100
as well. The operators emphasized that use of small auto-engines with big equipment
damages the engine very fast.
Table 13: Percentage distribution of oil mills based on production capabilities
Quantity (Kg) of fruits processed per batch Percentage (n = 47)
18 - 100kg 21.3
101 – 150kg 10.6
151 – 200kg 25.5
201 – 250kg 31.9
251 – 300kg 10.6
Above 300kg 2.2
Cleaning of production equipment capabilities
Entries in Table 14 show that 10.6% of the respondents cleaned their sterilizer
equipment by mopping with hot water and foam; 100% cleaned their digester
equipment by mopping with dry fibre; 31.9% cleaned their jack press by occasional
mopping with dry fibre; 46.8% of the respondents mopped out stains with dry fibre;
29.8% cleaned by daily mopping with dry fibre, 4.1% cleaned the nutcracker by
brushing out dirts and broken shells after production exercise; 4.3% did occasional
dusting of the welding plants with foam or broom; and 100% drained out oil and
refilled with fresh one (every two – three months). Generally, stubborn dirts on any of
the above equipment were scraped off with metal wire, brush or knife as the case may
be. This result implies that apart from cleaning of digester and changing of engine oil,
the general cleaning of the equipment used was poor and needs to be improved. The
level of this poor state could be seen in some of the pictures captured during field

101
work. The respondents reported that they were doing the cleaning of equipment but
not very often cleaning of equipment ad machines very often prevents contamination
of palm oil with dirts.
Table 14: Percentage distribution of mill operators based on cleaning capability
of production equipment
Item Cleaning method Percentage*
(n = 48)
Sterilizer Occasional washing with hot water 10.6
Digester Mopping with dry fibre after
production process
100
Jack press Occasional cleaning with dry fibre 31.9
Hydraulic press Clean out stains when noticed 46.8
Automated fibre separator Daily mopping with dry fibre 29.8
Nut cracker Occasional brushing out of dirts and
broken shells
4.3
Welding plant Occasional dusting with broom or
foam
2.2
Engines Draining out dirt oil and refilled
with new one in 2 – 3 months
100
*Multiple responses
4.9 Production capabilities of processing floor workers
Different kinds of work done by floor workers
Entries in Table 15 show that 83.3% of the floor workers were involved in
cooking palm fruits, 10.4% of them were involved in hewing of wood, 70.8% did
hand fibre separation, 62.5% did manual pressing of screw press, 83.3% were
involved in cleaning of equipment/tools, 83.3% were involved in sweeping of the
environments, 4.2% were involved in sorting kernels from shell, 52.1% were involved
in clarification, and 50% of them were involved was in disposal of effluents and solid

102
waste. This result shows that apart from mill operation and cleaning of the automated
equipment by mill operators, all other works involved in oil mills were done by floor
workers. This could imply that most of the private palm fruits processors engage in
production themselves to save cost and minimize wastage of resources. Also the
activities involved are gender inclined, hence the 95.8% female floor workers.
Table 15: Percentage distribution of floor workers based on different kinds of
work performed
Different kinds of work activities Percentage*
(n = 48)
Cooking of palm fruits 83.3
Hewing of fire wood 10.4
Hand fibre separation 70.8
Manual pressing of screw press 62.5
Cleaning of equipment/tools (screws press, hand fibre separation,
containers etc)
83.3
Sweeping of the environments 83.3
Sorting out kernels from shell 4.2
Cooking of oil to remove water and dirts (clarification) 52.1
Disposal of effluents and solid waste 50.0
*Multiple responses
Products and by-products of processing oil palm fruits
Entries in Table 16 show that 100% of the respondents produced palm oil,
100% produced palm nuts and sold, 100% produced fibre, 100% produced effluent,
62.5% produced sludge, 4.2% cracked nuts to produce palm kernel and also 4.2%
cracked nuts to produce kernel shell. About six percent of the respondents produced
light sticks. This result implies that all the products and by-products listed above have
value for one purpose or the other. Even the solid wastes are being used by local soap
makers. The light sticks are kindled with fire for illumination when electric power is

103
off during the night processing or sold to the public. The findings of the study ended
at the above products and by products due to low/limited refinery capabilities (primary
processors). The oils are both technical palm oil (TPO) and special palm oil (SPO).
The processors reported that if SPO is to be achieved, fresh fruits should be processed,
neat containers used, and clarification should not exceed the limit time to avoid
bleaching
In advanced palm oil processing industry, Special Palm Oil (SPO) and Palm
Kernel Oil (PKO), can be further refined into Refined Bleached Deodorized Oil
(RBDO) and Refined Palm Kernel Oil, (RPKO) respectively which they mix together
to get vegetable oil. These are the end products that are further fractionated into Olein
Oil (liquid) and Stearin oil (solid) which are the end-products used in the food
industry (PIND, 2011). . In developed economies, the Olein oil is further refined or
fractionated to get agrochemical oils, industrial chemical oils, paint oils, bio-diesel
(fuel), etc. Stearin oil however, is also fractionated further to get candles, soap
substance, lubricants etc. However, domestic population’s preference to technical
palm oil (TPO) is high due to it’s odour and taste but it raises serious public health
concerns and as such calls for measures to help educate the masses on the risks
involved in the consumption of high levels of FFAs oil. In addition, the overall low
quality with high iron content (residues from oil machines) might also endanger the
health of the poorest who consume the lowest quality oils available (Lade, 2007 in
PIND, 2011).

104
In Nigeria, there is serious need to step up the limited transformation and uses
of the primary or secondary products of oil palm for either food or non food
applications by government and non governmental organizations. This is necessary
because in some cases, the prices of oil and palm kernel do not give sufficient market
returns to pay for all the labour and capital that goes into their processing. However
in many cases, the profit may come from the production of the secondary, higher
value products if harnessed. Hence, processors in Anambra state should be made
aware of potential value of by-products such as fibres and residues to make for
example, briquettes or animal feeds and not rely solely on extracted oil or palm kernel
sales.
Table 16: Percentage distribution of floor workers based on produce
(products/by products) capabilities
Different products produced Percentage (%)* (n = 48)
Oil 100.00
Nuts 100.00
Fibre 100.00
Effluents 100.00
Sludge 62.5
Palm kernel 4.2
Kernel shell 4.2
Light sticks (Uli-oku) 6.3
*Multiple responses

105
Plate 4: Products and by-products of processing oil palm fruits
Packaging capabilities
Oil
Entries in Table 17 show that all (100%) of the respondents packaged the oil in
plastic containers of 20 litres, and 25 litres, respectively; 52.1% packaged their palm
oil in plastic drums, 8.3% packaged the oil in metal barrels; and 20.8% packaged their
palm oil in either glass or plastic bottles (1 litre). This result implies that there were
very few who were still using metal barrels which is discouraged because of the
rusting nature of melts. Also the bottle containers (1 litre) were used mostly when a
processor wants to give out oil for taste to would-be buyers. The packaging
capabilities enhance easy conveyance of oil from one location to another and ensure
storage convenience.

106
The processors reported that storage of crude oil in a dry and cool
environment, and in opaque containers example, plastic, bottles etc help to avoid
decomposition (lipolysis) from light ray. Also that storage of containers containing
oils on platform would increase the self life of the oil.
Nuts
All (100%) the respondents stored their nuts in heaps before cracking while
10.4%of them stored their nuts in jute bags before cracking. The storage in jute bags
was done for small quantities of nuts while heaps were for big quantities of nuts
(whether dry or not) before they are sold to buyers who crack and sell the kernel and
shell.
Kernel and kernel shell
Data in the same table show that 4.2% of the respondents stored their kernel
shell in jute bags while 4.2% stored their kernel shell in heaps before being sent to the
burner. Thirty one percent of the respondents packaged their solid waste in open
plastic or iron containers before being sold to local soap makers. Thirty one percent
of the respondents stored the fibre in jute bags while 100% stored the fibres in heaps
in dry cool places. The shell fibre and effluents are used in making carbon briquettes
used as fuel which substitutes fuel wood.

107
Table 17: Percentage distribution of floor workers based on packaging
Capabilities
Items and packaging capabilities Percentage*
(n = 48)
Oil
packaged in iron drums 8.3
Packaged in plastic drums 52.1
Packaged in plastic containers (20 litre capacity) 100.00
Packaged in plastic containers (25 liters capacity) 100.00
Packaged in either glass or plastic bottles (1 litre capacity) 20.8
Nuts
Stored nuts in heaps before cracking 100
Package nuts in jute bags before cracking 10.4
Fibre
Packed in jute bags 31.3
Packed in heaps in cool dry places 100
Kernel
Stored kernel in jute bags 4.2
Kernel shell
Stored in heaps before being sent to burner 4.2
*Multiple responses
Methods of cleaning the environment, equipment and tools
Environment
Entries in Table 18 show that 100% of the respondents swept their
environment with either broom or iron rake, 79.1% cut the bushes around the mill
with machetes, while 41.7% smothered the weeds with effluents and later raked out
dead and dry weeds. Cleaning of environment enhances reduction of mosquito bite or
other deadly reptiles to ensure/improve health condition.

108
Earth sunken digesting drum and pestles
Table 18 entries also show that 2.2% of the respondents cleaned the earth
sunken drum and pestles with dry fibre. The screw presses were mopped by the
respondents (77.1%) with dry fibre, 62.5% scraped off stubborn dirt on presses with
knife or iron wire or bar, 58.3% of the respondents cleaned the oil clarifying drums
with dry fibre and kept the drums slanted, 83.7% mopped the hand fibre separator
while 100.0% and 62.5% of the respondents washed buckets with detergent and water
and wheel barrow with water, respectively. Regular cleaning of processing tools
reduces the incidences of contamination of oil with dirts and prevents the metal
barrels from rusting which posses health hazards to the vulnerable poor who consume
most of oils produced with such tools.
Table 18: Percentage distribution of floor workers based on cleaning methods
Item Cleaning method Percentage*
(n – 48)
Environment Sweeping with broom or raking with
iron rake
100
Cutting of bushes around the oil mill
with matchet
79.1
Smothering the weed with effluents
and later rake out dead weed
41.7
Earth sunken digesting drum
and pestles
Mopping the drums and pestles with
dry fibre
2.2
Screw press Mopped clean with fresh dry fibre 77.1
Scrapping of stubborn dirts with
knife or iron bar/rod
62.5
Oil clarifying drums/oil
cooking drums)
Mopping with dry fibres and kept
started
58.3
Hand fibre separator Kept cleaned by moping with dry
fibre
83.7
Kept cleaned by washing with hot
water
16.3
Wheel barrow Washing with water 62.5
Buckets Washing with detergent and water 100
*Multiple responses

109
Waste disposal methods in production capabilities
Method used to dispose coagulated solids (non oily solid)
Entries in Table 19 shows that 62. 5% of the respondents disposed their solid
waste ashes by giving to people who need them, 60.4% of the respondents sold their
solid waste to local soap makers, 58.3% disposed theirs into the open farm/garden,
31.3% disposed unsold waste into public refuse dump, 20.8%disposed their wastes
into the bush while 10.4% of the respondents disposed into pit that will be evacuated
out during the dry season. This result implies that some of what was supposed to be
wastes were sold for money while the rest were disposed effectively.
Methods used to dispose liquid waste (effluents)
Entries in the same Table 19 show that 87.5% of the respondents disposed their
effluents into disposal pit, 41.6% of floor workers used the effluents to smother weeds
as herbicide, 25% of them poured into public gutters, 20.8% of them used the
effluents in feeding animals (pigs) while 10.4% of them disposed their effluents in the
bush. This result shows that greater percentage of the respondents had effective
effluents disposal methods. However, about 25% of the respondents had problems of
waste disposal methods in polluting drainage system, (8.3%) had problem of polluting
farm land and 6.3% of them had complaints from neighbours. The liquid effluent is
used in making carbon briquette used as fuel wood for cooking fruits. The effluents
are spread over fibre and shell.

110
Table 19: Percentage distribution of floor workers based on effluent and solid
waste disposal methods
Waste disposal methods Percentage*
(n = 48)
Methods used for solid waste (non oily solid and ashes)
Ashes given to people who need them
62.5
Sold at times to local soap makers 60.4
Disposal into the open farm/garden 58.3
Pit disposal 10.4
Disposal of excess unsold wastes into public refuse dump 31.3
Disposed in the bush 20.8
Methods used for disposing liquid wastes
Disposal into pit 87.5
Animal (pig) feed 20.8
Smothering of weeds (as herbicide) 41.6
Pouring into gutter drainage 25.0
Disposed in the bush nearby 10.4
Problems arising from waste disposal
No problem 83.3
Pollution of air (bad odour) 6.3
Pollution of drainage system 25.0
Complaints from neighbour 6.3
Pollutions of land 8.3
*Multiple responses
Causes of bad palm oil based on managers production capability
Entries in Table 20 show that 90.0% of the respondents claimed that oil
spoilage come from processing of rotten oil palm fruits, 70.0% claimed that oil
spoilage could be caused by improper clarification of oil to remove dirts and water
contents, 50% claimed that mixing of bad oil with fresh oil could spoil the quality of

111
oil, 48.0% responded that storage of oil over a long period of time could spoil a good
oil. Various other causes the respondents claimed are; 20.4% of them claimed that
bruises on the fruits introduce microbial activities, 20.4% said processing of palm
fruits with dirty tools and equipment, 15% claimed processing of palm fruits with hard
water, while 10.0% of them said soaking of fresh fruits in cold water before
processing. This result implies that processors should avoid the above indicated
causes or sources of oil spoilage in order to produce good quality palm oil. The
results also agree with Okonkwo (2010) findings in her studies of indigenous oil palm
processing with hazard analysis and critical controls.
Table 20: Percentage distribution of respondents/managers, capabilities based on
identifiable causes of palm oil spoilage
Causes or sources of palm oil spoilage Percentage*
(n = 48)
Processing of rotten palm fruits 90
Storage of oil in too cold or hot places 45
Processing of palm fruits with dirty tools and equipment 20.4
Mixing of bad oil with fresh oil 50.3
Over boiling of oil to bleaching point 10.0
Storage of oil for a long period of time 48.0
Processing of palm fruits with hard water 15.0
Soaking of fresh fruits in cold water before processing 10.0
Improper clarification of oil to remove dirts and water 70.0
Bruises on fruits that introduce microbial activities 20.4
*Multiple responses

112
Minor and major change capabilities
Minor and major changes involve short and long term improvements and
adaptations of equipment and human resources. Here the key actors involved in these
minor and major changes are the mill owner/operators and the processing managers.
4.10 Minor and major change capabilities of mill operators within the last
three years
Minor and major change capabilities are the short and long term
improvements and adaptations to equipment and human resources. Figure 10 shows
that 52.1% of the mill operators had acquired minor and major changes where as
47.9% of them said they had acquired none.
The mill operators (100%) said they had minor changes which include
processing of fresh fruits only, (48.0%), of them had replacement of damaged wheel
barrow, (80.0%) of them had changed to use of plastic containers and 20.0% of them
e c Figure 10: Percentage distribution of mill operators based on number that had
acquired minor and major change capabilities

113
change to the use of mobile phones for communication (Table 20). This result shows
processing of fresh fruits only as more obvious minor change of the mill operators
followed by replacement of wheel barrow. The table equally shows the major change
capabilities of the mill operators included construction of pit for waste disposal
(40.0%), change from manual screw press to automated press (24.0%), change from
manual pounding to automated digester (36.0%), and training for equipment bought
(36.0%), as prominent major changes. The result depicts that there was poor major
change capabilities of the respondents. The processing of fresh fruit as a minor
change will improve the quality of oil and major changes from manual press to
automated press will ensure labour efficiency and increase in quality of processed oil.
Also the use of automated digester will remove the drudgery associated with the use
of pestle to digest fruits.
Table 21: Percentage distribution of mill operators based on minor and major change
capabilities
Percentage (n = 25)
Minor changes
Processing of fresh fruits only 100
Change to use plastic container 30.0
Change or replace old wheel barrows 48.0
Use of mobile phone for communication 20.0
Major changes
Change to automated fibre separator 8.0
Dug pit for waste disposal 40.0
Change from hand screw press to automated press 24.0
Change from use of pestle pounding of fruits to automated digesters 36.0
Had indoor training for equipment/machine bought 36.0
Welding plant bought 4.0
Changed from drum cooking of fruits to steam sterilization 8.0
*Multiple responses

114
4.11 Minor and major change capabilities of managers within the last three
years
Figure 11 shows that 41.7% of the processing managers had acquired minor
and major changes. Entries in Table 22 show that among the managers that acquired
minor changes, the use of GSM in communication were (100%), replacement of
damaged table were 15% and those that bought plastic chairs were (25%). The result
shows use of GSM as only conspicuous minor change capability. The table also
shows that the major change capabilities of processing managers were thus; change
from use of lantern to electricity (25%), change from motorcycle to motor vehicle
(10%), renovation of oil mill house (25%) and change of marketing channels to the
Northern parts of Nigeria (50%). The overall change capabilities of the respondents
were poor.
This result also may imply that both minor and major change capabilities were
not needed within the last three years as oil mill equipment do not need very often
changes. The low income of the managers might have affected their minor and major
change capabilities hence (NACDB) Nigeria Agricultural Cooperative and
Development Bank should facilitate soft loan or grants to processors.

115
Table 22: Percentage distribution of managers based on acquisition of
minor and major change capabilities
Capability Percentage* (n = 20)
Minor changes
Use of GSM in communication 100
Replaced damaged table 15.0
Bought plastic chairs 25.0
Major changes
Changes from lantern to electricity 25.0
Changed from motor cycle to motor vehicle 10.0
Renovation of oil mill house 25.0
Changed marketing channels to the Northern and Western parts of
Nigeria
50.0
*Multiple responses
Figure 11: Percentage distribution of processing managers based on number
that acquired minor and major changes

116
Linkage capability
In the study, the key respondents involved in linkage capabilities are the
managers, oil mill operators and consumers. Data in Fig. 12 show that 95.8% of
managers acquired linkage capabilities, 95.8% of the mill operators acquired linkage
capabilities; and 79.2% of consumers acquired direct linkage capabilities. This shows
high direct linkage capabilities for all the respondents (manager, mill operators and oil
consumers). It implies also that learning could take place when actors link and
interact in different context which are especially embarked within
institutions/enterprises. Ogelaram – Oyeyinka (2004) opines that interaction fosters
knowledge flow, either old knowledge used in new ways or new knowledge diffused
as innovation. System interaction otherwise known as linkage capability is an
important asset which is composed of knowledge, skill and experience to engage other
actors in the process production of innovation.
Fig. 12: Percentage distribution of respondents based on the number that have acquired
linkage capabilities
managers no yes mill
operators
no yes consumers no yes
4.2%
95.8%
4.2%
95.8%
20.8%
79.2%

117
4.12 Linkage capabilities of oil mill operators
Data in Table 23 show that mill operators (89.1%), had direct and vertical
linkage with marketers of oil, (100%) had direct/vertical linkage with consumers
(73.9%), had horizontal linkage with other fellow mill operators, and (73.9%), had
direct linkage with fabricators. This result shows that mill operators had linkage
capabilities with actors mentioned above except farmers and extension agents. This
could be attributed to commercial nature of service rendered by most oil mill
enterprises who don’t have direct contact with farmers that produce fruits and sell
directly or indirectly to other commercial processors. Also monitoring and evaluation
of the activities of oil mill operators in Anambra State by extension agents is yet to be
given adequate attention, hence the low linkage of mill operators with extension
agents.
Table 23: Percentage distribution of mill operators based on linkage capabilities
Institutional/actors Percentage* (n = 46)
Marketers group 89.1
Consumers group 100
Fabricators 73.9
Other mill operators 69.5
Extension agents 6.5
Farmers group 19.6
*Multiple responses
4.13 Linkage capabilities of processing managers
Data in Table 24 show that the processing managers (87.0%) had direct
linkage with equipment suppliers, 69.5% had horizontal linkage with managers,
73.9% had direct/vertical linkage with consumers and 100% had direct linkage with

118
oil marketers. This result shows the same trend of low linkage of managers with
farmers and extension agents which may imply that managers don’t have direct
contact with farmers who sell fruit to middlemen/other processors they are dealing
with directly. The impact of extension agents for now is more on oil palm plantation
establishment other than processing capabilities in Anambra State (Ofoka, 2000).
Building, effective networks of relevant actors requires vision, funding, skills and
commitment – all these may be in short supply, explaining why strong linkages
between managers, and extension agents and farmers may be lacking (Gijobers, 2009)
Table 24: Percentage distribution of managers based on linkage capabilities
Institutions/actors Percentage* (n = 46)
Equipment suppliers 87.0
Other processing managers 69.5
Consumers 73.9
Marketers 100
Farmers 21.7
Extension agents 10.8
*Multiple responses
Strategic marketing capabilities
In the study, strategic marketing capability was assessed for processing
managers only. Data in Fig. 13 show that 97.8% of the respondents acquired strategic
marketing capabilities. This is also high strategic marketing capabilities. Strategic
marketing capability is the knowledge and skills for collecting market intelligence,
development of new markets and establishing distribution channels and customer
services in order to be able to translate it’s knowledge about customer requirements
into successful products and services. Any industry which undergoes commercial

119
production of products must find ways of selling out otherwise they will go out of
business.
4.14 Strategic marketing capabilities of processing managers
Data in Table 25 show that 95.7% of the respondents used open markets as
distribution channel, 80.2% used oil mill gate, 59.5% used workers and 55.3% used
middle men sellers. This result shows that open market and oil mill gates were major
distribution channels for marketing of their products. Sales at the mill gates save the
processors logistic cost of transportation, while when they need money quickly they
don’t wait for mill gate sales but go to open markets.
The same table also shows that 96.5% of the respondents had eastern part
(Onitsha) as outlets or depots, 61.7% had Northern parts and 29.8% had western part
Fig. 13: Percentage distribution of processing managers based on the
number that acquired strategic marketing capabilities

120
as depot for the marketing of palm oil. This result shows that Anambra State has the
capability of producing palm oil for her citizens and also for other parts of Nigeria.
Table 25 also shows that 82.9% of the respondents collected consumers’
complaints through middle men, 68.0% used workers as methods of collection of
consumers’ complaints, 61.7% used consumers’ direct complaints to processors,
8.29% used drivers who conveyed oil to depots, while 31.9% used palm oil retailers.
The use of the above channels was cheaper to the processors when compared with the
use of organized market survey on consumers’ complaints.
Table 25 shows that 63.8% of the respondents used workers to advertise or
promote their products, 53.1% used contact through phone call, 31.3% used sign
board and 42.5% used giving of sample to would-be buyers. In this result, the use of
workers information and phone calls are more prominent in advertisement of products
as they were considered cheaper when compared with radio or public announcement
which incur more cost.

121
Table 25: Percentage distribution of managers based on strategic market capabilities
Strategic market capabilities Percentage* (n = 47)
Distribution channels
Oil mill gate 80.8
Open market 95.7
Middlemen sellers 55.3
Workers 59.5
Retail oil marketers 8.5
Hotels 25.5
Soap makers 8.5
Outlets/depots:
Eastern parts – (Onitsha) 96.5
Southern part 0 (Port Harcourt) 8.5
Western part – (Lagos) 29.8
Northern pars (Kano, Maiduguri, Zaria etc) 617
Consumers’ complaints collection methods:
Palm oil retailers 31.9
Drivers that convey oil to depot 82.9
Consumer direct complaints to processors 61.7
Middlemen who sell to retailers 82.9
Workers in the oil mill processing 68.0
Methods used for promotion of products
Workers information 63.8
Sign boards 31.9
Contact through phone calls 53.1
Church announcement 21.2
Giving sample for testing 42.5
*Multiple responses
Learning mechanisms capabilities
Mill operators and processing managers were assessed for learning capabilities.
Data in Fig 14 show that 100% and 100% of managers and mill operators,
respectively, acquired learning mechanism capabilities. This result shows that the
respondents had high learning capabilities in the industry. According to Biggs, Shan
and Srivastava (1995) learning mechanisms are capabilities required and are available
to acquire new or improve existing investment and production. The attentions to learn
processes, particularly technological accumulation and the institutions affecting these
processes are very important and span through the other six capabilities.

122
4.15 Learning capabilities of mill operators
Data in Table 26 show that 100%, 100% and 100% of the respondents learnt
operation of equipment and machines, maintenance services of engines and routine
cleaning of equipment for their life sustenance, respectively. Also 52% learnt that
using small capacity engine to operate big equipment spoils the engine very fast while
37.5% and 8.3% learnt minor repairs of equipment and fabrication of equipment parts,
respectively. This result indicates adequate learning capability of the respondents
(mill operators). This result also implies that new technologies which will help them
cope with the challenges of mechanical oil palm processing industry had been learnt.
The finding agrees with Bangens and Laage-Helman (2002) where majority of the
respondents have adequate learning capabilities that enable them to be competitive,
avoid damages to the machines and equipment and save costs that could have arisen
from wastages (incompetence in operations).
Fig 14: Percentage distribution of respondents, based on learning mechanisms capabilities

123
Table 26: Percentage distribution of mill operators based on learning capabilities
Leaning capabilities (experience between non-farm oil
training
Percentage* (n = 48)
Fabrication of equipment parts 8.3
Operation of mill equipment and machines 100.0
Minor repairs of equipment when spoilt 37.5
Maintenance services of the engines 100.0
Routine mill/equipment cleanings 100.0
Learnt that the use of small capacity engine to operate big
equipment spoils the small engine
52.0
*Multiple responses
4.16 Learning capabilities of the processing managers
Data in Table 27 show that 83.3% and 83.3% of the managers learnt causes of
oil spoilage, preventive measures of oil spoilage and period of palm fruits abundance
(February – June), respectively, 100% learnt marketing strategies, 62.5% learnt
operation of oil mills, 41.7% and 41.7% learnt, minor repairs of equipment/machines
and routine maintenance of mill engines, respectively, 31.3% learnt installation of
equipment/machines and 83.3% learnt that tenera spp of oil palm give light red oil
where as local oil palm fruits give thick red oil in colour. This result shows that the
managers had learning capabilities in abundance in areas indicated above especially
the knowledge of the causes and preventive measures of oil spoilage. These learning
capabilities will in the long run of the business prevent wastages and improve income.

124
Table 27: Percentage distribution of managers based on learning capabilities Learning (experience and non formal training) Percentage* (n = 48)
Learnt causes of oil spoilage 83.3
Preventive measures of oil spoilage 83.3
Operation of oil mills 62.5
Minor repairs of equipment and machines 41.7
Installation of equipment and machines 31.3
Routine maintenance of mill engines 41.7
Period of palm fruits abundance (February – June) 83.3
Marketing strategies 100
Learnt that palm fruits from tenera oil palm give light red oil 83.3
while local oil palm fruits give thick red oil in colour
*Multiple responses
Factors influencing the development/acquisition of technological capabilities of
processors
4.17 Mean score of factors influencing the acquisition/development of
technological capabilities among floor-workers
Entries in Table 28 show that lack of labour availability (M = 2.6), lack of
water supply (M = 3.0), power outage (M = 3.3), no price control (M = 2.8) and
seasonal scarcity of palm fruits (M = 3.06), were the mean scores for the factors that
influenced the development of technological capability. The table also shows the
factors that were not considered as factors that influenced the development of
technological capability. The prominent among such non influencing factors include;
no training facilities (M = 2.3), poor waste disposal (M = 1.9), poor infrastructure for
example transportations, road etc (M = 2.3) and terrorism/kidnapping (M = 2.0). This
result shows high mean scores for lack of labour and power outage implying high cost
of labour and high cost of production due to use of liquid fuel. Also no price control
may imply fluctuations of prices during the peak period of palm oil production which
is not favouring the processors. Moreover, the seasonal scarcity of palm fruits imply

125
that some of the processors will be less busy or go out of production during the period
of scarcity. Some of the above results agree with Enwere, (2001) where power outage
and no price control were major factors that influenced technological capability in an
empirical study of technological capability in bakery industry.
Table 28: Mean distribution of floor workers based on factors that influence the
development/acquisition of technological capabilities
Factors (n = 48) Mean Std deviation
Managers negative influence 1.17 .559
Fellow floor worker attitude 1.46 .651
Lack of labour availability 2.60* 1.067
Owner of mill’s attitude 1.73 1.026
Old equipment/machinery 1.98 .758
Lack of water supply 3.00* .851
Poor waste disposal 1.92 1.200
Oil spoilage 1.67 .883
Poor environmental protection 1.71 1.031
Poor storage facilities 1.98 1.390
Power outage 3.31* .971
Non government interference 1.92 1.350
Consumers’ attitude/complaints 1.73 .939
No training facilities/programmes 2.27 1.216
Poor infrastructures 2.27 1.747
No price control system 2.85* .799
Crime and thefts 1.79 1.091
Terrorism/kidnapping 2.06 .885
Labour unrest/strike 1.89 1.127
Seasonal scarcity of palm fruits 3.06* .845
*Significant influencing factor
4.18 Factors influencing the development/acquisition of technological
capabilities of floor-workers
Table 29 shows varimax rotated factors influencing the development of
technological capability. Based on variable loading, three factors were identified and
named. Factor one was named management factors. They include such factors like;
lack of labour availability, owner of mills’ attitude, poor water supply, poor waste
disposal, poor storage facilities, non-government interference, lack of training

126
opportunities and seasonal scarcity of palm fruits; factor two (2) was named
infrastructural factors and included non-availabilities of equipment, frequent power
outage, poor infrastructure such as roads, transportation, market etc and poor security
or terrorism; and factor three (3) was named personnel/manpower and included
managers and floor workers attitudes toward one another and their interaction which
may have positive or negative effect on production depending on the prevailing
situations.
Factors that loaded high under management factors (Factor 1) were lack of
labour (.689), attitude of owner of mill (.836), poor water supply (.749), poor waste
disposal system (.858), poor environmental protection (.741), inadequate storage
facilities (.902), non-government interference (.928), poor training opportunities
(.892), crime and thefts (.470) and seasonal scarcity of palm fruits (.650). According
to www.Britainica(2008), management of production activities involve five (Ms) of
management viz; the manpower, machine, methods, materials and money. In other
words, proper management of the processing mill entails effective planning and
control of industrial processes to ensure that they move smoothly at required level.
Seasonal scarcity of palm fruits has been found out to be very important factor
influencing the development of technological capabilities.
This finding has implication for research to be concerned about production of
cross breed of species of oil palms that will be fruiting all the year round such as we
find in improved budded citrus (oranges). This result also shows lack of labour
availability (.689) which corroborates the report of Manyong, Ikpi, Olayemi, Yusuf, et
al (2005) that a major problem of agricultural production and processing in Nigeria is

127
the seasonal labour shortage, especially at the peak periods of labour demand (during
production and processing) due to the increasing migration of able-bodied youths
from rural to urban cities. Non-government interference was also a very important
problem in this sector. This implies therefore that government should make policies
on price control to stabilize prices, on waste disposal system and provide law
enforcement/implementation agency, on environmental protection, on training of
processors before embarking on such business and adequate provision of storage
facilities. Crime and theft were also found to be an important factor. This implies that
the government and NGOs (communities) should liaise together to provide adequate
security for the safety of the properties and life of the processors.
Factor 2 on infrastructural problems, power outage dominated the factors
implying that government (NPHC) Nigeria Power Holding Company should give
priority attention to providing power to minimize costs of production to the
processors. There should also be infrastructure like good roads, supply of water and
other marketing infrastructures by government to the processors for effective
development of the technological capabilities in this sector. Terrorism was also a
problem implying that government and NGOs should ensure security of life and
property to enhance continued linkages for business transactions in this sector.
Factor 3 on personnel/manpower problems was another important problem
implying that adequate management training and role definition among the processors
will help them maintain ranks and coordinate with one another for effective
development of their technological capabilities. Labour unrest/strike loaded high

128
under both factors I (.450) and 2 (.779) and was not considered in naming the
extracted factors according to SPSS rule.
Table 29: Varimax rotated matrix of factors that influence the development of
technological capabilities of floor workers
Influencing factors Factor 1
Management
related
Factor 2
infrastructure
related
Factor 3
personnel/manpower
related
Managers attitudes .368 .48 .771
Fellow-floor workers attitudes .141 -.125 .788 Lack of labour availability .689 -.191 .156
Owner of the mill’s attitudes .836 .250 .257
Inadequate equipment and machinery .208 .515 .377
Lack of water supply .749 -.113 -.229
Poor waste disposal .858 .115 .268
Spoilage of products .649 .331 .467
Environmental protection .741 .100 .067
Poor storage facilities .902 .257 .158
Power outage -097 -575 -.083 Non government interference .928 .218 .174
Consumers attitudes/complaints -.413 .121 .659
Lack of training opportunities .892 .086 -.092
Poor infrastructural facilities -.141 .576 -.039
No price control .618 -.640 -.133
Crime and theft .470 .267 .358
Terrorism -296 -.677 .120
Labour unrest/strike .450 .779 .024
Seasonal scarcity of fruits -.650 -.315 -119
Extraction method: principal component analysis
Rotation method: varimax with Kaiser Normalization (Loading at .4 and above)
Boldly typed is used to highlight high factor loads.
4.19 Mean score of factors influencing the acquisition/development of
technological capabilities among mill operators
Data in Table 30 show that lack of manpower (M = 3.19), market forces (M =
3.35), poor remunerations/profit (M = 2.69), lack of interactions (M = 3.42), seasonal
scarcity of fruits (M = 3.54) and lack of fund for business expansion (M = 3.56) were
the factors that influenced technological capabilities of the mill owner/operators. The
table also shows non-influencing factors and prominent among such factors were;

129
poor fiscal government policies (M = 2.15), poor infrastructure (M = 2.29), poor
learning opportunity (M = 1.98), poor funding for research (M = 1.73) and lack of
legal framework (M = 1.54). This implies that if infrastructural facilities are built,
workers that move to cities will stay, if there is price control, processors income will
not be determined by market forces, hence improving their income to invest more.
The issue of seasonal scarcity of palm fruits is a natural factor influence, hence
processors should engage themselves in other businesses during the non peak fruits
yielding to keep themselves busy. Such businesses may include cracking of kernels,
secondary processing of stored palm oil, petty trading, etc.

130
Table 30: Mean distribution of mill operators based on factors that influence the
development of technological capabilities
Influencing factor Mean (n = 48) Std. deviation
Poor funding for research 1.73 .765
Poor learning opportunity 1.98 .565
Lack of manpower 3.19* .610
Unavailability of technology 1.40 .660
Farm size 1.23 .444
Bureaucracy/bottleneck of firm 1.19 .491
Poor government fiscal policy 2.1 5 .875
Market forces 3.35* .483
Poor remunerations/profits 2.69* .512
Lack of interaction among actors 3. 42* .613
Lack of legal frame work 1.54 .771
Poor access to knowledge 1.48 .714
Poor infrastructure 2.29 .824
Seasonal scarcity of palm fruits 3.54* .683
Lack of fund for the expansion 3.56* .616
* Significant influencing factors
4.20 Factors influencing the development/acquisition of technological
capabilities of mill operators
Data in Table 31 show varimax variable loading factors as viz factor 1 =
manpower; factor 2 = technical problems; factor 3 = personnel problems and factor 4
= infrastructural problems.
Entries in the same Table show that factors that loaded under manpower
problem (Factor 1) were lack of manpower (.663), poor government fiscal policy
(.428), seasonal scarcity of palm fruits (.580) and poor fund for business expansion
(.675). Lack of skilled manpower has been identified as important factor for the low
level of technological capability development in many firms in developing countries

131
(Panda and Ramanathan, 1997). Inadequate funding will not allow actors to invest in
business expansion, training and development or state of the art technology
acquisition. Also poor funding will not allow business diversifications to cushion the
effects of seasonal scarcity of palm fruits during some months of the year (July –
January).
Farm size (.683), organizational bureaucracy (.446), knowledge (.757) loaded
high under technical factors (Factor 2) (Table 32). Poor remunerations means
financial handicap, hence limiting the ability to invest in or access knowledge which
also affects negatively the firms’ size in the long run retarding the technological
capabilities of the mill operators.
Factor 3 has to do with loadings of poor learning opportunities (-.659) and lack
of interactions among actors (-.537). Interactions between actors will allow them
swap information and enhance learning (Dominguez and Brown, 2004). Such
learning will permit the actors to accumulate technological capability in mechanical
oil palm fruits processing industry. Lack of interaction hence implies that there will
be no opportunity of learning and development of technological capabilities of the
mill operators.
Factor four on infrastructural problems were dominated by poor infrastructure
(.739) and firm’s poor organizational structures (.612). According to FAO (1997) a
good marketing infrastructure, maintenance of rural roads, supply of water, and
marketing services have profound effects on food availability, market prices and
physical access to food at the community level. Conversely, poor marketing

132
infrastructure, particularly price fluctuations etc limit the investment and production
capabilities of the actors/processors.
However, poor government fiscal policy loaded high under both manpower
(.428) and personnel (.777) factors while lack of legal framework loaded high under
both technical (-.628) and infrastructural (.417) factors. Under (SPSS) version 16.0,
the above loaded factors were not considered in naming the extracted factors.
Table 31: Varimax rotated matrix of factors that influence the development of
technological capabilities of oil mill operators
Influencing factors Rotated component matrix
Factor 1
Manpower
related
Factor 2
Technical
related
Factor 3
Personnel
related
Factor 4
Infrastructure
related
Poor funding for research -.376 -.063 -.077 -.032
Poor learning opportunities .197 .006 -.659 -.355
Lack of manpower .663 .116 -.053 .115
Unavailability of technology -.224 -218 -.192 .187
Farm size .260 .680 .039 -.017
Bureaucracy .140 .446 .013 .711
Firm’s organizational
structure
-.031 -.254 .016 .612
Poor government fiscal policy .428 .098 .777 -.032
Market forces .510 .110 .709 -.070
Poor remunerations/profits .346 .427 .186 .073
Lack of interaction among
actors
.174 -.024 -537 .022
Lack of legal framework .258 -.628 .202 .417
Poor access to knowledge -.009 .757 .110 .203
Poor infrastructure .045 .128 .040 .739 Seasonal scarcity of palm
fruits .580 .172 -.155 .106
Poor fund for business
expansion .675 -.172 .074 -.195
Extraction method: principal component analysis
Rotation method: Varimax with Kaiser Normalization (Loading at 0.4 and
above)
Boldly typed is used to highlight high factor loads

133
4.21 Mean score of factors influencing the acquisition/development of
technological capabilities of processing managers
Data in table 32 show that market forces (M = 3.30), poor access to knowledge
and information of new technologies (M = 2.94), poor remuneration (M = 3.23), lack
of interactions among actors (M = 2.85), lack of labour (M = 3.30), no price control
(M = 2.70), power outage (M = 3.40), no quality control laboratory (M = 2.82) and
seasonal scarcity of palm fruits (M = 3.42) were the factors that influenced the
development of technological capabilities. The same table also shows factors that did
not influence the technological capabilities of the processing managers. Prominent
among the factors were culture of the firm (M = 2.06), organizational bottle necks (M
= 2.38), poor government fiscal policies (M = 2.45), poor water supply (M = 2.06),
terrorism/kidnapping (M = 2.28), poor quality of products (M = 1.55) and policy
dynamics (M = 1.53). This results almost show the same influencing factors like that
of mill operators. The occurrence of frequent power outage will increase the
production cost due to use of liquid fuel. Also lack of interactions among the
processors will limit information flow which also affects their technological
capabilities in the oil palm processing industry. There is need also for the government
(oil palm marketing board) to fix prices for oil to stabilize the income of the
processors which has been subject to market forces. This situation most often favour
oil marketers who buy oils when there are fluctuations in prices of oil to stock and sell
when the price improves.

134
Table 32: Mean distribution of processing managers based on factors that influence the
development/acquisition of technological capabilities
Influencing factors (n = 47) Mean Std. deviation
Unavailability of technologies 1.23 .520
Unavailability of equipment 1.23 .476
Size of firm 1.09 .282
Culture of firm 2.06 .485
Lack of training opportunities 1.19 .576
Bureaucratic bottle necks 2.38 .795
Poor government fiscal policies 2.45 .775
Market forces 3.30* .657
Policy dynamics 1.53 .620
Poor access to knowledge and information of
new technology
2.94* .528
Poor remunerations 3.23* .633
Lack of interactions among actors 2.85* .625
Lack of labour 3.30* .657
Crime and thefts 1.94 .919
Poor infrastructures 1.38 .768
No price control 2.70* .689
Poor water supply 2.06 .919
Consumers attitudes/complaints 1.53 1.018
Power outage 3.40* 1.077
Spoilage of products 1.47 .905
Poor storage facilities 1.49 .975
No quality control laboratory 2.82* 1.093
Poor quality of production and factory space 1.28 .750
Poor preservation of products 1.47 .718
Poor waste disposal system 2.23 .560
Terrorism/kidnapping 22.8 .743
Poor quality of products 1.55 .999
Seasonal scarcity of fruits 3.42* .823
*Significant influencing factors
4.22 Factors influencing the development/acquisition of technological
capabilities of processing managers
Entries in Table 33 show that factors that loaded high under production factors
(Factor 1) were power outage (-.820), spoilage of products (.531), poor storage
facilities (.523), no quality control laboratory (-.522) poor waste disposal system
(.846) and quality of product (.650). The above results imply that such factors like
power, storage facilities and quality control laboratory equipment should be provided

135
to processors at a subsidized rate and given priority attention by government. Also
government should institute or enforce existing environmental and consumer
protection authorities to do periodic inspection of oil mills to ascertain the quality of
products being produced. When there is adequate storage facility and quality control,
the issue of poor products and spoilage will be highly minimized.
Factors that loaded high in (factor 2) policy/institutional factors include; lack
of training opportunities (.528), bureaucratic organizational bottle necks (.854), poor
government fiscal policies (.768), market forces (.638), lack of labour (.729), crime
and thefts (.677) and poor water supply (.796). Government can be instrumental in
stimulating technological capability enhancement through a number of fiscal
incentives (Porter, 1980). Aderemi, et al (2009) maintained that government has the
roles of setting priorities, participating and enacting laws that could enhance
technological capabilities development and accumulation. The technological
capabilities of the processors could be enhanced if government should provide
laboratory and milling equipment at subsidized prices and make a law that before any
processor wishes to enter the industry, he/she must meet the above requirement.
The table equally shows the factors that loaded high under technological
factors (factor 3) such as unavailability of technologies (.687), unavailability of
equipment (.614), poor access to knowledge (.537), policy dynamics (.596), poor
infrastructure (.530), no price control (.466) and seasonal scarcity of fruits (.432).
Asoegwu and Asoegwu (2007) opine that non-availability of improved/modern
technologies for agricultural production and processing including oil palm fruits

136
processing, which are time and energy saving is one of the main constraints in agro-
processing in Nigeria.
This finding has implication for government/NGOs to provide processors with
modern-technologies that will reduce the drudgery in processing at subsidized rates.
However, few of such technologies namely; mechanical fibre separators, digesters,
sterilizers etc abound but in the hands of individuals/NGOs at exorbitant prices as was
reported during the course of the study.
However, lack of interactions loaded in both factor 2 and factor 3 (.573 and
.473), consumers attitude that loaded in factor 1 and factor 3 (.757 and .482), poor
preservation of products that loaded in factor 2 and factor 3 (.459 and 500) and
terrorism/kidnapping that loaded in both factor 1 and 3 (-.708 and .456) were not
considered as extracted factors according to SPSS 16.0 version.

137
Table 33: Varimax rotated matrix of factors that influence the development of
technological capabilities
Influencing factors Factor 1
Production
related
Factor 2
Policy/institutional
related
Factor 3
Technological
related
Unavailability of technology .023 -.178 .687
Unavailability of equipment .097 -.051 .614
Size of firm -.239 .206 .303
Culture of firm -.179 -131 .048
Lack of training opportunities -.196 .528 .302
Bureaucratic/organizational bottle
necks
.145 .854 -017
Poor fiscal government policies .021 .768 .186
Market forces .281 .638 -120
Policy dynamics .117 .163 .596
Poor access to knowledge and
information of new technology
.156 .333 .537
Poor remunerations -.198 .382 -.134
Lack of interactions among
actors/poor linkage with other
actors
-.023 .573 .473
Lack of labour -.020 .727 -.366
Crime and thefts .278 .677 .085
Poor infrastructures -.214 .035 .530
No price control -.166 .289 .466
Poor water supply .175 .796 .150
Consumers attitudes/complaints .757 .170 .482
Power outage -.820 .110 -.346
Spoilage of products .531 .231 .243
Poor storage facilities .523 .234 .214
No quality control laboratory -.832 .185 -.074
Poor quality of production and
factory space
.522 .396 -.037
Preservation of products .064 .459 .500
Poor waste disposal system .846 .085 .085
Terrorism/kidnapping -.708 .208 .456
Quality of products (oil) .650 .017 .192
Seasonal scarcity of palm fruits -.353 -.086 .432
Extracted method: Principal component analysis
Rotation method: Varimax with Kaiser Normalization (Loading at .4 and above)
Boldly typed are used to highlight high factor loads.

138
CHAPTER FIVE
5.0 Summary, Conclusion and Recommendation
5.1 Summary
Technological capabilities of mechanical oil palm processors entail acquisition
of requisite technological capabilities – the skills, knowledge, competence and
information required and the learning ability to upgrade these capabilities when
needed.
This study has shown that the palm enterprises in Anambra state operated at
small – scale level and have simple centralized classical organizational units viz– mill
operation, management and production units. The enterprises were commercial
oriented, majority (72.2%) of the processors communicated to staff and recruited new
staff via fruit owners (43.3%)
This study has also shown that the various stakeholders (processors) in the oil
palm processing enterprises (manager, mill operators and floor workers) have
contributed to the development of the technological capabilities in the oil palm
processing enterprises. The processors were literate, married men and women
between the ages of 25 to 60 years. Generally, majority of the enterprises were
managed by their owners and have the mean score of 8 workers.
With regards to years of experience, the manager, mill operators and floor
workers have mean scores of 11.6, 12.5 and 5 years experience, respectively. Also the
processors were low income earners having mean estimated monthly income of N17,
29167, N18, 584 and N22, 84370 for managers, mill operators and floor worker,
respectively.

139
With regards to available technologies, the mill operators (87%) operated semi
–automated oil mills having sterilizers ,digesters ,presses and used 17 or 18 horse
power engine for fully automated equipment. Also the floor workers (100%) have
operated non- automated mill system using manual screw presses and fibre/nut
separators.
The poor finances of the oil palm processing enterprises reduced to a
reasonable extent the investment capabilities. Some of the enterprises that needed to
expand by buying new site, equipment and machines, and human development
resource capabilities could not afford to acquire them .There is need for financial
intervention in oil palm processing enterprises by non –governmental organizations
(NGOS) and public sectors in terms of fiscal measures. Also there were poor minor
and major change capabilities in equipment and human resources development.
Moreover, there was no quality control laboratory in any of the oil palm mills which
was an indication for poor research and development capabilities.
With regards to production, majority of the processors have abundant
production abilities to produce very good oil called special palm oil (spo), kernel,
shell and light sticks. They also have technological capabilities in marketing their
products, strategically using open market, deports in eastern and northern parts as
distribution channels. Most of the processors have direct linkage with their equipment
and raw material suppliers, and products – buyers but with weak linkage with
extension. Their linkage with equipment and raw materials suppliers served as one
avenue for learning in oil palm processing enterprises .In terms of learning
mechanisms, the mill operators have high capabilities in learning more especially in

140
operation of mills and routine cleaning of equipment. The manager processors learnt a
lot of capabilities in areas of causes and preventive measures of oil spoilage, strategic
marketing and period of a oil palm fruits abundance.
However, the managers have policy/ institutional (.854) and technological
(.687) related factors influencing their technological capabilities development. The
mill operators also have man - power (.675) and infrastructural (.737) related factors
influencing the development of their capabilities development. The floor workers also
have management (.928) and personnel /man-power (.788) related factors influencing
the development of their capabilities in oil palm processing enterprises .`
This study has shown that despite assistance from some governmental and non-
governmental agencies, extension (activities through government interference, price
control, quality control, information dissemination etc) did not play any direct role in
the activities of oil palm processing enterprises in Anambra state though their indirect
roles have affected the production of raw materials and equipment supplied to
processors. However, the combined efforts of processors as the agencies to which they
were linked helped to develop all the seven technological capabilities to their present
level, which is inadequate in few of them due to probably lack of co-ordination and
fund. Extension organizations should therefore help to co-ordinate the activities of all
the stakeholders in oil palm processing enterprises to ensure that their efforts produce
the desired impact of developing the technological capabilities in the oil palm
processing industry to an advanced level in the 21st.

141
5.2 Conclusion
The study has shown that mechanical oil palm processing enterprises were
organized along simple organizational structure, only three of the managers were
professional managers, one third of them was trained in mill operation. Most of the
managers worked as mill operators and managers in function. The highest
qualifications of most of the workers were primary and secondary education. All they
learnt about oil palm fruits processing was in form of non-formal training obtained
from fellow workers in the oil mill with occasional training for some workers in form
of on-the-job training from equipment suppliers to which these enterprises were
linked.
Remunerations in form of income or profit or salaries were low for most of the
workers (stakeholders) including mill owner processors. Most of them produced palm
oil, nuts, fibre, effluents as their products. Strategic marketing capabilities included
distribution channels and outlets depots. The majority of changes (both minor and
major) were in areas of office up keeps and equipment/tools. Majority of the mills
operated semi-automated mechanical processing industry. The processors possessed
adequate production capabilities. All the actors; mill operators, managers and floor
workers had linkage with other complementing actors but at times with weak
interactions.
The various processors identified a lot of factors that influenced the
development of their technological capabilities. Included in the factors were; power
outage, spoilage of products, poor storage facilities, seasonal scarcity of palm fruits,
lack of interactions among actors, markets forces, no price control, no quality control

142
laboratory services, lack of labour, terrorism and kidnapping, poor government fiscal
policies, poor water supply and poor remunerations/profit. These problems need to be
seriously addressed by government and non-government organizations in order to
improve the performance of the mechanical oil palm processing industry.
5.3 Recommendations
Based on the findings from the study, the following recommendations are
made:
1. Government (MOA) and (NAFDAC) should formulate or enforce existing
policies to regulating the production, preservative measures, packaging,
storage, price control and marketing of commercial oil palm products such as
palm oil and/palm kernel oil.
2. Government (NAFDAC) should establish quality control laboratories in major
towns or communities where oil palm processors can test their finished
products (oils) to ensure acceptable quality at subsidized rates. Or processors
Association coming together to form financial synergy to get equity to
establish quality control laboratories.
3. Extension organizations should form linkages between oil palm processing
enterprises and other agencies such as research and technology transfer groups
like ADP, Ministry of Agriculture etc that make input into the enterprises and
the consumers of the output from the oil palm processing enterprises.
4. Extension in addition, should co-ordinate the activities of all the stakeholders
in the oil palm processing industry in areas of policy formulation and
implementation and should sensitize government to support the industry

143
through appropriate fiscal measures such as grants, loans, tax relief and
subsidies.
5. Extension should liaise with oil palm processors for dissemination of
information about the existing new technologies, tools and knowledge in oil
palm processing which the processors had been responding tacitly to their
existence and availability. Hence the drudgery in oil palm processing will be
highly minimized.
6. A forum should be formed for all stakeholders in the oil palm processing
industry in which the factors influencing them should constantly be discussed
and solutions sought. Membership for this forum should comprise or include
the oil palm processors, equipment fabricators/research, extension
organizations, technology transfer group, financial institutions and non-
governmental agencies.
5.4 Suggestions for further research:
The study carried out was found to be only on technological capabilities of
mechanical oil palm fruits primary processors. However, I suggest that further studies
should be on technological capabilities of mechanical processors of secondary
products such as palm oil/palm kernels.

144
References
Adebayo, K., Babu, S. and Rhoe, V. (2009). Institutional capacity for designing and
implementing agricultural and rural development policies and strategies in
Nigeria. Background paper No. 008, Nigeria Strategy Support Program
(NSSP) of the International Food Policy Research Institute (IFPRI).
Adebayo, T, and Clark, N (1996). Methodological issues in science and technology
policy research technological capability. African Technology Policy Studies
Network (ATPS), Working Paper No. 2.
Aderemi, H. O. Oyebisi, T. O. and Adeniyi, A. A. (2009). Development of a measure
for technological capability in the information and communications technology
industry in Nigeria. A paper submitted to Globelics, Dakar, Senegal. Pp. 68 –
70.
Adedoyin, S. F. and K. Adebayo, (2011). Communication and Advocacy Strategies
in Extension. In: Adedoyin, S.F. (ed.) Agricultural Extension in Nigeria.
Agricultural Extension society of Nigeria (AESON). Pp. 27 – 35.
African Technology Policy Studies Network (ATPS) (2003). Science and technology
and food security in Africa. Nairobi, Kenya. Technology Brief 11
http://www.atps/net.org.12th-May/2007.
Agricultural Development Programme (ADP, 2012). Information from Extension
Department. Anambra State ADP, 19th
February.
Agwu, A. E. (2006). Adoption of Improved Oil Palm Production and Processing
Technologies in Arochukwu Local Government Area of Abia State, Nigeria
Agro Science Journal of Agriculture, Food, Environment and Extension.
vol. 5(1) pp. 26 – 35.
Akwuodo, S. D. A. (2006). The Business Entrepreneur, Entrepreneurial
Development, Small and Medium Enterprises. Entrepreneurship Academy
Publishing, Kaduna, Nigeria.
Asiabaka, C.C. 2000). Agricultural Extension: A Handbook for Development
practitioners. Masyfem United Services. Port Harcourt, Nigeria.
Asoegwu, S. N., and Asoegwu, A. O. (2007). An overview of agricultural
mechanization and its environmental management in Nigeria. Agricultural
Engineering International: the CIGRE Journal Invited Overview, vol.
9(6),pp.34 – 39.

145
Asopa, V. N. and Beye, G. (1997). Management of agricultural research: A
training manual. Module 8: Research Extension Linkage. Food and
Agriculture Organization of the United Nations pp. 32 - 33.
Badmus, G. A. (1987). An assessment of the performance of a palm fruit bunch
threshing machine Niger J. palms seeds vol. 3; pp. 78 – 90.
Badmus, G. A. (1990). Factors affecting the design of a fruit bunch harvesting
system of tall palm trees in plantation. Niger. J. Palms seeds, vol. 11: pp.
102 – 114.
Bangeus, L. and Laage-Hellman, J. (2002). Development of technological
capability in South African industry: An industrial network approach.
Paper submitted to the 18th
annual IMP Conference in Dijon, 5th
– 7th
September (2002).
Barry, B. (2000). Technology transfer and public policy: A review of research
and theory. Research Policy, vol. 29 pp. 627 – 655.
Bechstedt, H. D. (1999). Eleven steps for participatory technology development
(PTI) in sustainable land management. IBSRAM Newsletter, No. 51.
Bell, M. (1993). Technological accumulation and industrial growth: Contract
between developed and developing countries. Industrial and corporate
change 2pp 157 – 210.
Bell, R.M. and Pavit, K. L. R. (1993). Technological accumulation and industrial
growth: Contrasts between developed and developing countries. Industrial
and corporate change 2(2): pp. 152 – 210.
Berdegue, J. A. (2005). Pro-poor innovation system. Background paper
submitted to International Fund for Agricultural Development (IFAD).
Berelien, I. G., K. C. Schneeberger, and O. D. Osburn, (1995). Principles of
Agribusiness Management, 2nd
Edition, Illinois, Wave land press.
Biggs, S. D. (1990). A multiple source of innovation model of agricultural
research and technology promotion. Agricultural Administration (Research
and Extension) Network paper. London: Overseas Development Institute.
Biggs, S. D. and G. Smith (1998). Beyond methodologies: Coalition building for
participatory development. World Development. Vol. 26 pp. 239 – 248.
Biggs, T., Shan, M and Srivastava, P. (1995). Technological capabilities and
leaving mechanisms in African Enterprises, Technical paper No. 288,
African Technical Department Series, Washington, D.C., World Bank.

146
Biggs T., Manji, S. and Serivastava, P. (1995). Technological Capabilities and
learning in African enterprises. World Bank Technological paper 288.
Chema, S., E. Gilbert and J. Roseboom (2003). A review of key issues and recent
experiences in reforming agricultural research in Africa. Research Report
24 The Haguli ISNAR.
Chima, U. D. (2010). Oil palm in Nigeria: Shifting from smallholders and women
to mass production World Rain Forest Movement (WRM). 7/29/2011
11.45A.M.
Chima, U. D. (2010). Oil Palm in Nigeria WRM draft. Retrieved from:
http://oil.palm-in-africa.wprd.press.com. on 2010/08/06.
Chukwumah, A. (2010). Women and intertribal marriages, Nigerian films.
Retrieved from http/www.com/news/9229/18/woman/7.0907am. on
2012/11/25
Clark, N. A.; Hall, R., Sulaiman, and G. Naik (2003). Research as capacity
building: The Case of an NGO facilitated post-harvest innovation system
for the Aimalayan hills. World Development 31 (II): pp 1845 – 1863.
Cramb, R.A. (2000). Processes affecting the successful adoption of new
technologies by smallholders. In: Hacker, B. (ed.) Working with farmers:
the key to the adoption of forage technologies, pp. 11 – 22. ACIAR
Proceedings No. 95. Canbersa: Australian Centre for International
Agricultural Research Creating a Trading system for Development, World
Bank, Washington D.C.
Crowder, L. Van and Anderson, J. (1997). Linking research, extension and
education: Why is the problem so persistent and pervasive? European
Journal of Agricultural Education and Extension, vol. 3 (4), pp. 145 – 152.
De Gorter, H. Ingco, M. and Ignacio, L (2004). Domestic support: Economics
and policy instruments. In: Ingco, M., and Nash, J. (Eds.) Agriculture and
the WTO. p.95 - 98.
Dominguez, L. and Brown, F. (2004). Measuring technological capabilities in
Mexican industry. CEPAL Review vol. 83, pp. 129 – 144.
Ebii, C. O. (1993). Sociological variable facts of inhibition of the farming
communities, of Imo and Abia States. Paper presented at Imo Concord
Hotel on 29th
November 1993.

147
Edem, D. O. (2002) Palm oil biochemical, physiological, nutritional,
hematological and toxicological aspects. A Review. Plant Foods Cum.
Nutrition, vol. 57, pp. 319 – 341.
Edquist, C. 9ed.) (1997). Systems of Innovation Approaches: Technologies,
Institutions and Organizations. Printer, Cassel Academic, London.
Egboka, B. and Nwafor, U.E.T. (1994). River boundary agricultural lands in
Anambra State. Agricultural Forum National Light Newspaper. August
10: p. 11.
Emenyeonu, B. N. (1987). Communication and adoption of agricultural
innovations: qualifications and notes towards a conceptual model pp. 120
124.
Emodi, A. I. (2010). Analysis of rice (oryza spp) innovation system in Southeast
Nigeria. A Ph.D. Thesis, Department of Agricultural Extension, University
of Nigeria, Nsukka pp. 66 – 68.
Enwere, N. J. (2001). Extension implications of the technological capabilities of
the baking industry in South eastern Nigeria. Ph.D thesis, Department of
Agricultural Extension, University of Nigeria, Nsukka pp. 98 - 101.
Enwere, N. J. (2005) Improving the technological capabilities of the food
industries in Benue State through extension learning methods: implications
for the University of Agriculture, Makurdi Lecture at the University of
Agriculture, Makurdi, Benue State, September 29, 2005.
Enwere, N. J. (2000). Extension implication of the technological capabilities of
small-scale soymilk enterprises in Nsukka urban. M.Sc. Thesis,
Department of Agricultural Extension, University of Nigeria Nsukka pp. 58
- 62.
Ernest, D., Ganiates, T, and Mytelka, L. (1994). Technological capabilities: A
conceptual framework Draft UNCTAD Six Country Research Project on
Technological Development in south and East Asia, Geneva.
Esechie, H. A. (1978). Mesocarp oil and free fatty acid accumulation in oil
hazards analysis and control point in oil palm processing in Anambra State,
Nigeria – 1 palm fruits during ripening. Niger Agric. J. vol 15 pp. 114 –
129.
FAO (2004) The market for non-traditional agricultural exports. Food and
Agriculture Organization of the United nations, Rome

148
Faturoti, B. O. (2008). Analysis of innovation system in plantain and banana Belt
in Nigeria. A Ph.D. thesis, Department of Agricultural Extension,
University of Nigeria, Nsukka pp. 77-79.
Fisher, D. (1982). The Right to communicate: A Status Report; Reports and
papers on mass communication No. 94, Paris, UNESCO. Pp 81 – 84.
FMST, (2001). Federal Ministry of science and technology. The National
Information Technology Policy, pp 3.
Food and Agriculture Organization (1970). Consultations on palm oil and palm
kernel production FAO, Rome.
Food and Agriculture Organization (1987). Consultations on oil palm production
FAO, Rome.
Food and Agriculture Organization of the United Nations (FAO, 1997).
Agriculture, food and nutrition for Africa. A resource book for teachers of
agriculture. Food and Nutrition Division, FAO, Rome pp 1 – 125.
http://www.proteinresearch.net. 12th
February, 2007.
Food and Agriculture Organization (FAO) (1997). Agriculture, food and nutrition
for Africa. A resource book for teachers of agriculture. Food and
Nutrition Division, FAO, Rome pp 1 – 25. http://www.proteinresearch.net.
12th
February 2007 jtt://www.proteinresearch.net, 3rd
March, 2010.
Freeman, C. and Perez, C. (1998). Structural crises of adjustment, business cycles
and investment behaviour. In G. Dosi (ed). Technical Change and
Economic Theory. London, Printer.
Gijsbers, G. (2009). Missing linkages in Asian agricultural innovation and the
role of public research organizations paper presented at the 6th
Asialics
International Conference, 6 – 7th
July Hong Kong.
Hall, A. (2006). Public private sector partnerships in an agricultural system of
innovation: concepts and challengers. United Nations University (UNU-
Merit) Working Paper Series, 2006 – 002.
Hall, A; Bockett, G; Taylor, S., Siramohan, M.V.K. and Clark, N. (2001). Why
research partnerships really matter: innovation theory, institutional
arrangements and implications for developing new technologies for the
poor. World Development 29(5): pp 783 – 797.

149
Hall, A. J., V. R. Sulaiman, N. G. Clark, M.V.K., Sivamohan and B. Yoganand
(2002). Public private sector interaction in the systems perspective on
installation reform. In: Byerlee, D. and R. G. Echeverry (eds). Agricultural
Research Policy in an Era of Privatization: Experiences from the
Developing World. CABI, Walling Ford.
Hall, A. and Dijikman, J. (2006). Capacity development for agricultural
biotechnology in developing countries: concept, context, case studies and
operational challenges of a system’s perspective. United nations University
(UNU-Merit) working paper series, 2006-003.
http://www.namy.wedding.com/article. The Igbo traditional weddings in Nigeria.
Retrieved on 12th
October 2012.
Khalil-Timamy, M.H. (2002). Pursuing technology policy research In Sub-
Saharan Africa, ATPS Special Paper No. 7, African Technology Policy
Studies Network Nairobi.
Lall, S. (1992). Structural problems of African industry. In: F. Stewart, S. Lall
and S. M. Wangwe (eds). Alternative Development Strategies in Sub-
Saharan Africa. London McMillan, pp. 103 – 144.
Lall, S. (1992). Technological capabilities and industrialization. World
Development 20 (2) pp. 165 0 186. Amsterdam, Elsevier Science.
Madukwe, M.C. (2008). Practice without policy: The Nigerian agricultural
extension service. An Inaugural lecture of the University of Nigeria,
Nsukka on April 28.
Malaysia Daily Express (MDE) (2001). More law to be needed for oil palm areas.
Available:www.wrm.org.Uy/plantations/material/oil.palm.6.html(2001)
February, 13th 2001, Malaysia.
Malerba, F. (1992). Learning by firms and incremental technical change. The
Economic Journal 102: pp. 845 – 859.
Manyong, V.M.; Ikpi, I, I; Olayemi, J.K.; Yusuf, S. A.; Omonona, B. T.;
Okoruwa, V. and Idachaba, F.S. (2005). Agriculture in Nigeria: identifying
opportunities for increased commercialization and investment.
International Institute for Topical Agriculture (IITA), Ibadan, Nigeria. Pp.
159.
Marsden, K. and Gerzia, M. (1998). Agro-Industrial policy review –
Methodological Guidelines. Training Materials for Agricultural Planning,
No. 24, FAO, Rome.
150
Matanmi, B. M. (1994). Some criteria in acceptance of agricultural innovations by
small-scale farmers in Nigeria. NOMA Magazine Vol. II.
Mytelka, L. (2000). Local system of innovation in a globalized world economy.
Industry and Innovation 7(1): pp 35 – 54.
NIFOR (1981). NIFOR Highlight of Activities 1981. NIFOR, Benin, Edo State,
Nigeria.
NIFOR, Nigerian Institute For Oil Palm Research, (1999, 2009). The manuals on
small-scale oil palm fruit processing equipment. P.M.B. 1030, Benin City,
Nigeria.
Nigeria Institute For Oil Palm Research (NIFOR, 2009). Small-Scale Oil Palm
Fruit Processing Equipment Operational Manual. NIFOR, Benin City,
Nigeria. Revised fourth edition.
NPC (2006). National Population news, Federal Republic of Nigeria.
NUC (2011). National Universities Commission. List of approved Universities in
Nigeria. True Verdict Magazine, May – June.
Nwalieji, H. U. (2006). Evaluation of phase one vegetable production project of the
Anambra State ADP. M.Sc. Dissertation, Department of Agricultural
Extension, University of Nigeria, Nsukka. Pp. 56 – 66.
Obiora, C. J. (2012). Technological Capabilities of Climate Change Actors in the
Agricultural Innovation System of South East, Nigeria. A Ph.D. thesis,
Department of Agricultural Extension, University of Nigeria, Nsukka pp. 66 -
68.
Ofoka, I. C. (2000). Adoption of improved oil palm seedlings among farmers in five
selected local government areas of Anambra State. An M.Sc. thesis,
Department of Agricultural Economics and Extension, Faculty of Agriculture,
Enugu State University of Science and Technology, Enugu, November 2000.
Ofoka, I. C. (2007). Small holder oil palm tenureship, exploitation arrangements, and
conflicts: implication for oil palm developments in Anambra State, Nigeria. A
pre-Ph.D. Seminar paper of Department of Agricultural Extension, University
of Nigeria, Nsukka.
Ohajianya, D. O. (1999). Marketing of oil palm produce in Imo State Department of
Agricultural Economics, Federal University of Technology, Owerri.
Okigbo, B. N. (1972). Land use, soil fertility and crop specialization in east Central
State of Nigeria.

151
Okonkwo, E. U. (2010). Hazard analysis and critical control points in palm oil.
Processing in Anambra State, Nigeria. African Journal of Agricultural
Research Vol. 6(2) pp. 244 – 247, 18 January, 2011. Available online at
http://www.acade-org-journals-org/AJAR,ISSN-1991-637X©2011. Academic-
Journals.
Okoli, J. U. (2009). Processing of oil palm fruits Agricultural Engineering
Research Division, Nigeria Institute for Oil Palm Research, Benin City,
Nigeria.
Oluka, I. and Amefule, E. (2011). Unveiling the wealth potential of oil palm punch
Newspapers, Community-Chairman, Nigerian Institute of Agricultural
Engineer’s. Wednesday 27 July, 2011.
Olagunju, F. I. (2008). Economics of palm oil processing in Southwestern
Nigeria. International Journal of Agricultural Economics and Rural
Development, vol. 1(2), pp 24-29.
Omobuwajo, T. O., Ige, M. T., Ajayi, O. A. (1997). Heat transfer between the
pressing chamber and the oil and oil cake streams during screw expeller
processing of palm kernel seeds. J. Food Engine, vol. 31(1) p. 1.
Opute, F. I.; Obasola, C. O. (1979). Breeding for short strummed oil palm in
Nigeria: Fatty acids, their significance and characteristics. Annual Bot.,
vol. 43 (6) pp. 677 – 681.
Ortiz, R. (1990). A joint venture in technology transfer to increase adoption rates;
In W. F. Whyte (ed), Participatory Action Research, Newburg Park, CA;
Safe.
Osin, B. (1989). The return of the oil palm tree. Sunday Champion, May 28, pp.
7.
Osinem, E. C. (2005). Environmental Education in Agriculture. Cheston Agency
LTD, Enugu, Nigeria. Pp 54 – 56.
Oyebisi, T. O., Odimide, O. O. and Agboola, A. A. (2004). An assessment of the
level of availability of technological capabilities in the Nigerian
telecommunications industry. Available on line at
http://www.science.direct.com/science.
Oyelaran-Oyeyinka, B. O. (2003). Technological capacity of systems of
innovation: concepts and perspectives. Netherlands: United Nations
University, Institute of New Technology.

152
Oyelaran-Oyeyinka, B. O. (2004). A systems perspective on inter firm and
organizational collaboration in African industry. M united Nations
University Institute for new Technologies. Discussion Paper Series. No
2004 – 18.
Panda. H. and Ramanathan, K. (1997). Technological capability assessment as an
input for strategic planning: case studies at Electricite de France and
Electricity Generating Authority of Thailand. Technovation, 17 (7): pp 359
– 390.
Partnership Initiatives in the Niger Delta (PIND, 2011). A report on palm oil
value chain analysis in the Niger Delta. 167 Ademola Adetokunbo
Crescent, Wuse II, Abuja, Nigeria.
Paulsen, M. E. (2011). Teaching methods and techniques for computer-mediated
communication.
Porter, M. (1980). Competitive Strategy. Free Press, New York.
Pray, C. and R. Echeverria; (1990). Private Section Agricultural Research and
Technology Transfer Links in Developing countries; In: D. Kaimowits
(ed.), Making the link: agricultural research and technology transfer in
developing countries. Bouldu Westview Press 1990: pp. 197 – 226
Production year book. FAO Rome publishing, pp. 13 – 44.
Rivera, W. M. Alex, G. Hanson, J. (2006). Enabling agricultural development the
evolution and promise of agricultural knowledge systems. Paper presented
at Association for International Agricultural and Extension Education
(AIAEE) Conference May, 2006 World Bank, Washington D. C.
Rivera, W. M. and M. K. Quamar, (2005). Agricultural knowledge and
information systems for Rural Development (AKIS/RD): A Comparative
Review of Ten Country case studies on AKIS/RD. Rome: FAO
Rogers, E. M. (1995). Diffusion of Innovations. 5th
edition New York: the Free
Press.
Scott, P., C. Gotch and S. Bahri (2003). Applications of the policy analysis Matrix
in Indonesian Agriculture.. FAO Rome publishing, pp. 65 – 68.
Sheikh, A. D.; Mohmmod, M. A., Bashir, A. and Kashif, M. (2006). Adoption of
rice technology package by farmers of irrigated Punjab, Pakistan. Journal
of Africa cultural research, vol. 44(4) pp. 341 – 352.

153
Smallholder Management Unit (SMU, 2010). Ministry of Agriculture and Natural
resource, Anambra State, Nigeria. 19th
January.
Smith, K. (1996). The Norwegian national innovation system: A pilot study of
knowledge creation, STEP report, Oslo.
Spielman, D. J. (2005). Innovation systems perspectives on developing country
agriculture: A critical review. IFPRI discussion paper Washington, D.C.
Spielman, D. J. (2006). A critique of innovation systems perspectives on
agricultural research in developing countries. 2006. Bio Development
International Institute. Inc. Ithaca NY, USA.
Spielman, D. J. and K. VON Gebmer, (2004). Public private partnerships in
agricultural research: an analysis of challenges facing industry and the
consultative group on international agricultural research. EPTD Discussion
paper No 113 Washington, D.C.: IFPRI.
Sumberg, J. and Okali, C. (1997). Farmers’ experiment: Creating local
knowledge. Boulder London: Lynne Reinner
Swanson, B. E., Bentz, R. P., Sofranko, A. J. (1997). Improving agricultural
extension a reference manual was prepared under a contract between FAO
and the International Programme for Agricultural Knowledge System
(INTERPAKS), College of Agriculture, consumer, and Environmental
Sciences, University of Illinois at Urbana – Champaign, United States.
Szogs, A and Mwanitima, K. (2010).Technological Capability building in
informal firms in the agricultural subsistence Sector in Tanzania assessing
the role of Gats by clubs. African series of science, Technology, Innovation
and Development 130-138
Ugbaja, F. N. (1993). A survey of the role of the oil palm industry in the
development of the rural economy with particular reference to Isu L.G.A.
of Imo State. A B.Sc. project, Department of Agricultural Science A.J.C.E.
Owerri pp.
UN (1995). Science and technology in the new global environment: Implications
for developing countries, Science and Technology Issues, New York,
UNCTAD.
UNCTAD, (2003). Africa’s technology gap: Case studies on Kenya, Ghana,
Uganda and Tanzania, United Nations publication,
UNITAD/ITE/IPC/MISC.13.

154
UNCTAD, (2007). The least Development Countries Report 2007: Reduce
poverty by narrowing technology gap. United Nations publication, Vienna,
19 July http://www,unis.univerma.org/presrels/2007. 17th May, 2008.
UNIDO, (2010). United Nations industrial development organization WRM’s
Bulletin No. 161. Oil palm in Nigeria Shifting from smallholders and
women to mass production April, 2010.
United Nations and Environment (2003). Small and medium-sized enterprises and
sustainability, Big Challenge for small business. Sustainability and SMES
Industry and Environment, vol. 26 (4), pp. 4 – 6.
Usoro, E. J. (1974). The Nigeria Oil Palm Industry. Ibadan Nigeria: University
Press.
World Bank (2006). Enhancing agricultural innovation: How to go beyond the
strengthening of research systems. The International Bank For
Reconstruction and Development. The World Bank 1818 H. Street, N.W.,
Washington, D.C. 20433.
WRMB (2001). World Rainforest Movement Bulletin Sustaining Agricultural
Development in Malaysia Experience in Plant sties Sector. In bulletin of
the World Rainforest Movement Bulletin.
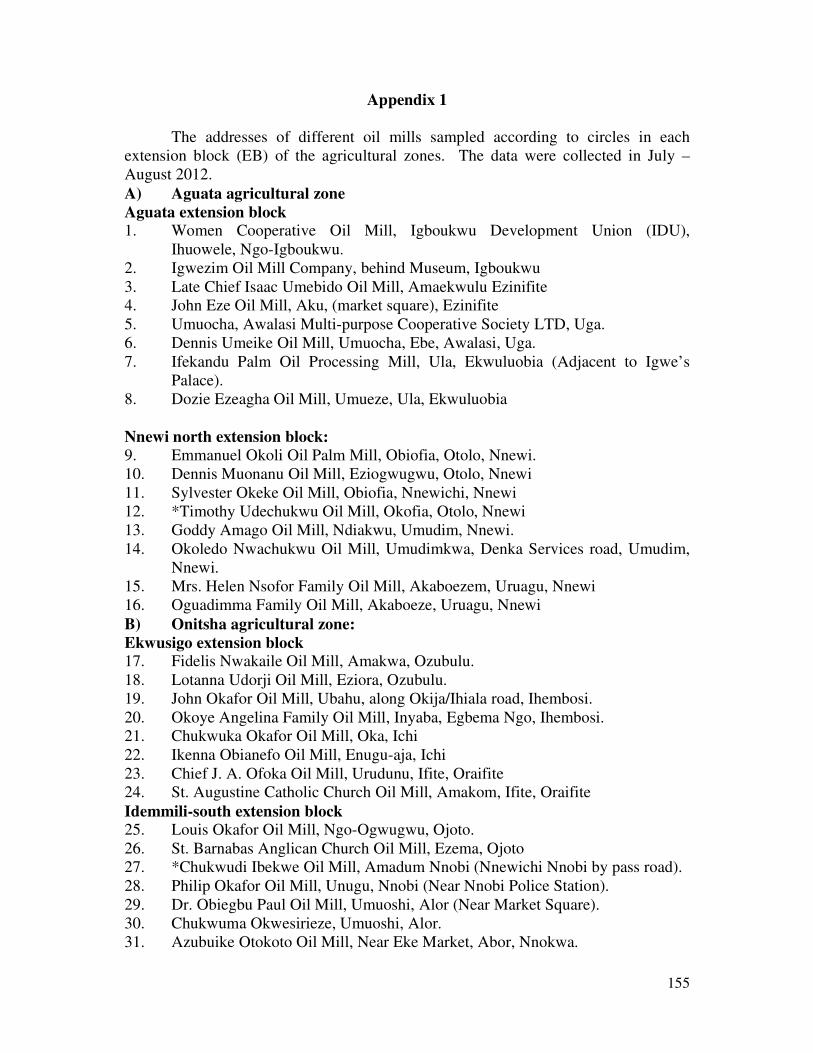
155
Appendix 1
The addresses of different oil mills sampled according to circles in each
extension block (EB) of the agricultural zones. The data were collected in July –
August 2012.
A) Aguata agricultural zone
Aguata extension block 1. Women Cooperative Oil Mill, Igboukwu Development Union (IDU),
Ihuowele, Ngo-Igboukwu.
2. Igwezim Oil Mill Company, behind Museum, Igboukwu
3. Late Chief Isaac Umebido Oil Mill, Amaekwulu Ezinifite
4. John Eze Oil Mill, Aku, (market square), Ezinifite
5. Umuocha, Awalasi Multi-purpose Cooperative Society LTD, Uga.
6. Dennis Umeike Oil Mill, Umuocha, Ebe, Awalasi, Uga.
7. Ifekandu Palm Oil Processing Mill, Ula, Ekwuluobia (Adjacent to Igwe’s
Palace).
8. Dozie Ezeagha Oil Mill, Umueze, Ula, Ekwuluobia
Nnewi north extension block:
9. Emmanuel Okoli Oil Palm Mill, Obiofia, Otolo, Nnewi.
10. Dennis Muonanu Oil Mill, Eziogwugwu, Otolo, Nnewi
11. Sylvester Okeke Oil Mill, Obiofia, Nnewichi, Nnewi
12. *Timothy Udechukwu Oil Mill, Okofia, Otolo, Nnewi
13. Goddy Amago Oil Mill, Ndiakwu, Umudim, Nnewi.
14. Okoledo Nwachukwu Oil Mill, Umudimkwa, Denka Services road, Umudim,
Nnewi.
15. Mrs. Helen Nsofor Family Oil Mill, Akaboezem, Uruagu, Nnewi
16. Oguadimma Family Oil Mill, Akaboeze, Uruagu, Nnewi
B) Onitsha agricultural zone:
Ekwusigo extension block 17. Fidelis Nwakaile Oil Mill, Amakwa, Ozubulu.
18. Lotanna Udorji Oil Mill, Eziora, Ozubulu.
19. John Okafor Oil Mill, Ubahu, along Okija/Ihiala road, Ihembosi.
20. Okoye Angelina Family Oil Mill, Inyaba, Egbema Ngo, Ihembosi.
21. Chukwuka Okafor Oil Mill, Oka, Ichi
22. Ikenna Obianefo Oil Mill, Enugu-aja, Ichi
23. Chief J. A. Ofoka Oil Mill, Urudunu, Ifite, Oraifite
24. St. Augustine Catholic Church Oil Mill, Amakom, Ifite, Oraifite
Idemmili-south extension block 25. Louis Okafor Oil Mill, Ngo-Ogwugwu, Ojoto.
26. St. Barnabas Anglican Church Oil Mill, Ezema, Ojoto
27. *Chukwudi Ibekwe Oil Mill, Amadum Nnobi (Nnewichi Nnobi by pass road).
28. Philip Okafor Oil Mill, Unugu, Nnobi (Near Nnobi Police Station).
29. Dr. Obiegbu Paul Oil Mill, Umuoshi, Alor (Near Market Square).
30. Chukwuma Okwesirieze, Umuoshi, Alor.
31. Azubuike Otokoto Oil Mill, Near Eke Market, Abor, Nnokwa.

156
32. Mrs. .Kelechi Ughanze Oil Mill, Near Eke Market, Abor, Nnokwa.
Awka agricultural zone
Aniocha extension block 33. Ichida Women Oil Mill, Afor Market Square, Ezebuazu, Ichida.
34. Omenka Family Oil Mill, Mgbudu, Ichida (opposite Okada garage).
35. Late Chief Richard B. Obikezie Mill (A.K.A. Women Co-operative Oil Mill)
Uhunkwo, Adazi-ani.
36. Ben. Onodo Oil Mill, Uhunkwo, Adazi-ani.
37. Alphonsus Eze Oil Mill, Off roundabout, Etitinabo, Neni.
38. Simon Anaka Oil Mill, Opposite Chrisudus Petrol Station, Umuabani, Neni.
39. Adazinnukwu, Women Co-operative Oil Mill, Amaolu, Adazinnukwu.
40. Olisa Alor Family Oil Mill, Amata, Adazi Nnukwu
Awka – south extension block 41. Ignatus Ogbaju Oil Mill, Enugu, Umuawulu
42. Ike Okeke Oil Mill, Agbani, Umuawulu.
43. Berthran U. Chinedu Oil Mill, Ezeoye, No. 1 Erike road, Nibo.
44. Ven. A. E. Nweke Oil Mill, Ifite, Nibo.
45. The virtuous Women Multipurpose Co-operative Society LTD Oil Mill,
Ngene, Oka, Nise.
46. Chinemelum MCSLTD, Nibo Oil Mill (% Christopher Nwobu).
47. Mrs. Udoka Okoyeocha Oil Mill Nkwelle Amaenyi, Awka.
48. Sunday Okeke Oil Mill, Nkwelle, Amaenyi, Awka.
* Fabricators of processing equipment as well as processors.

157
Appendix II
INTERVIEW SCHEDULE ON TECHNOLOGICAL CAPABILITIES OF
MECHANICAL OIL PALM PROCESSORS IN ANAMBRA STATE
I am a Ph.D student of University of Nigeria, Nsukka carrying out a research
on technological capabilities in oil palm processing. Inappropriate methods in
production and processing of oil palm fruits lead to poor quality and quantity of
produce (output).
The purpose of the study is therefore to identify and document the
technological capabilities in oil palm processing industry.
Technological capability is defined as the variety of knowledge which
processing firms/organizations need so that they can acquire, assimilate, use, adopt,
change and create technology. Technology here is not reduced to machine; it has to
do with knowledge embodied both in machines and in the skills of people, in
behavioural patterns and in the organizational structure and procedures. Your
responses are to be kept in confidence.
By
Ofoka, I. C.

158
Instruction: Please write in the blank spaces provided or tick (√) the correct
options to each question.
SECTION A (i): Socio-economic characteristics of oil mill enterprise (using mill owner
or mill managers as respondents).
1. Name of enterprise: …………………………………………………………
2. Address of enterprise ………………………………………………………
3. Location: ……………………………………………………………………
4. Age……………………………………………………………………..
Organizational structure of the processing enterprise:
5. How many departments/units do you have in oil palm processing please list them
(1)………………………… (2)……………………………………….
(3)………………………………. (4)………………………………………..
6. What was the rationale for creating the units (departments?)
a) Discipline ( ) (b) Function ( )
(c) Commodity or product ( ) (d) Geographical area ( )
and flow of authority ( )
7. Mode of service: (a ) Personal services ( ) (b) personal and
public services ( )
8. What functions do you perform (tick those applicable) planning ( ),
Evaluating ( ) Organizing ( )
Decision making ( ) Monitoring ( )
Controlling ( ) All of the above ( )
9. Do you sometimes delegate authority to your subordinates, that is asking them to act
for you? ( ) Yes ( ) No
10. If yes do you use any of the items in the following guidelines?
( ) Define assignment and delegate authority in light of result expected
( ) Select persons in light of task to be done
( ) Maintain open line of communication
( ) Establish proper controls
( ) Reward effective delegation
( ) Reward successful assumption of duty
( ) Others (specify)
11. Identify areas from the list below) through which you have been encouraging good
communication in the processing enterprise
( ) Staff meeting ( ) Briefings ( ) Circulation of
reports ( ) Identifying and developing the staff who have the potential to be good
communicators ( ) Providing opportunities for participating in house
meetings, seminars and professional meetings ( )
Being a good teacher of effective communication skills ( ) others
12. What recruitment procedures do you use when you want to employ new staff?
Specify
( ) Advertise vacancies in newspaper
( ) Inform recruitment agencies
( ) Inform schools and tertiary institutions
( ) Ask your present employees to tell their friends and relations
( ) Advertise vacancies on a board inside or outside the processing mill premises
Other methods (specify)………………………………………………………………

159
13. When you fill vacancies for production, mention type of worker you prefer (tick) (√)
to recruit
( ) School leavers ( ) Adult with no previous experience
( ) Youth with previous experience ( ) Men/boys ( )
Women/girls ( ) no preference ( )
14. Average number of workers in the oil mill enterprise?
a) 1 – 5 ( ) (b) 6 – 10 ( ) (c) 11 – 15 ( )
(d) Above 15 ( )
15. Is your mill periodically inspected by environmental and consumer protection
authorities in the following fields? ( ) Yes ( ) No.
If yes what agencies?
SN
Field
Inspected
Agency responsible Yes No
Waste disposal
Noise abatement
Air pollution
Workers safety and health
Product safety and hygiene
Product quality
Others specify
Section A(ii): Socio-economic characteristics of processors and consumers.
Instruction: Please write in the blank spaces provided or tick (√) the correct
options to each question.
(1) Socio-economic characteristics of Mill owner/operators
1. Sex: Male ( ) Female ( )
2. Age…………………………………………………………………………………
3. Marital status: Married ( ) Widowed ( )
Divorced ( ) Single ( )
4. Highest level of education ……………………………………………………
5. What is the number of people living in your household? 1 – 2 persons ( )
3 – 4 person ( ) 5 – 6 person ( ) 7 – 8 person ( ) above 8 ( )
6. Have you been trained in oil mill operations? Yes ( ) No ( )
7. If yes, in what areas (please specify)
a) …………… (b) ………………… c) ………………… (d) ………………………….
8. Are you the owner of the oil mill? Yes ( ) No ( )
9. If No, who are you working for?
a) Individual ( ) (b) Cooperative ( ) Family joint
business ( ) others: (1) ……………………………………….
(2)………………………………………..
10. What type of employee are you? Permanent/ Shareholder ( )
Temporary ( ) Daily paid ( ) self paid ( )

160
11. How many workers do you work with in your processing mill………………………
12. Indicate the number of years of experience in oil mill operations …………………….
SECTION B: Available Technological capabilities in your firm/enterprises
13. What type of mechanical mill system do you have?
a) Fully automated oil mill ( ) (b) Semi automated oil ( )
c) Non-automated oil mil ( )
14. Give reasons for joining oil palm processing business?
a)………………………………………… (b) ……………………………………………..
15. On the average, what is your estimated monthly income from processing business
(N)?
0 – 15,000 16,000 – 30,000 31,000 – 45,000
Above 45,000 Cannot assess
16. What are the available technological capabilities to you in the areas of the
following/Available equipment/machine?
a) Use of sterilizer (boiler) Yes ( ) No ( )
b) Stripper: Yes ( ) No ( )
Advantage:……………………………. Disadvantage:…………………………..
c) Use of digester: Yes ( ) No ( ), if yes what
type……………………………………………………………………………
Advantage:……………………………. Disadvantage:…………………………..
d) Use of pressing machine Yes ( ) No ( ), if yes what
type…………………………………………………………………………………
Advantage:……………………………. Disadvantage:…………………………..
e) Use of crude oil clarifier: Yes ( ) No ( ), if yes what
type…………………………………………………………………………………
Advantage:……………………………. Disadvantage:…………………………..
Others: No ( ) Yes ( ) if yes indicate
(1) ………………… (2) ………………(3) ……………(4) ……………
f) Use of disposal pits: Yes ( ) No ( )

161
g) Do you combine some of the above (a – e in full/semi automated operation:
Yes ( ) No ( )
h) If yes, which of the above equipment/machine do you combine?
(i) …………………(ii) ……………………… (iii) ………………………
i) What type of motor engine do you use to operate the (i) Semi automated ………..
horse power engine? (2) Fully automated………. horse power engine?
……………………………………… horse power (engine)
SECTION C: Technological capabilities
i) Investment
17. Has your oil palm processing firm made any investment in equipment/working tools
with regards to oil palm processing industry within the last years? Yes ( )
No ( )
18. Has your oil palm processing firm made any investment in human resource? ? Yes
( ) No ( )
19. If your answer to No 17 or 18 above is yes, please, fill the tables below
S/NO Name of Equipment Cost of equipment N Years of
purchase
Function of the
equipment
1
2
20. Investment in human resources (fill the table)
S/NO Qualification of
staff/Category of staff
Type of Training Period of
training
1
2
ii) Minor and major changes capabilities. Itemize changes with regards to oil palm
processing that have taken place in your oil mill firm within the last three years.
These changes may include changes in models of equipment and tools, course
taught or training undergone or researches carried out by the oil mill operators.
a) ………………(b)……………… (c) ……………… (d) ………………..
iii) Linkage capabilities
21. In tackling oil palm processing, do oil mill operators have links/interactions with one
another? Yes ( ) No ( ) if yes what type……………………..
22. Does your oil mill firm have links with other oil mill operators? Yes ( )
No ( )
23 If yes, how many institutions do you have links with? No:…………………….

162
24. Do you have links with any of these institutions below? (Please tick) (√)
Institutions /Actors Yes No
� Research group Yes ( ) No ( )
� Government agencies eg (NAFDAC, FMA) Yes ( ) No ( )
� Donor agencies Yes ( ) No ( )
� Technology transfer group Yes ( ) No ( )
� Marketers group Yes ( ) No ( )
� Consumer group Yes ( ) No ( )
� Fabricators group Yes ( ) No ( )
� Other Oil mill operator group Yes ( ) No ( )
� Extension group Yes ( ) No ( )
� Financial institutions Yes ( ) No ( )
� Farmers group Yes ( ) No ( )
� Processors group Yes ( ) No ( )
� Others (specify) Yes ( ) No ( )
iv) Learning capabilities
25. Please could you identify what you have learnt over the years with regards to oil palm
processing (in particular oil mill operators)
i) ………………(ii) ……………………(iii)………………(iv)………………
26. Production: What quantity of fruits do you process at a batch ………………………
27. Cleaning and Waste disposal: How do you clean your equipment/tools ……………
Cleaning and waste disposal
28. How do you clean the different equipment or containers after oil production?
S/N Equipment Method of cleaning
1
2
29. How do you clean your environment after palm oil production
…………………………………………………………………………………...
30. Describe methods used for disposing liquid and solid wastes from your processing
enterprise
S/N Solid waste method S/N Liquid waste method
1 1
2 2
31 Are there problems arising from your present method of waste disposal?
( ) Yes ( ) No
32. If yes, what kind of problems do you encounter?
( ) Pollution of land ( ) Pollution of air (bad odour)
( ) Pollution of water ( ) Pollution of drainage system
(eg. Gutter) ( ) Complaints from neighbours.
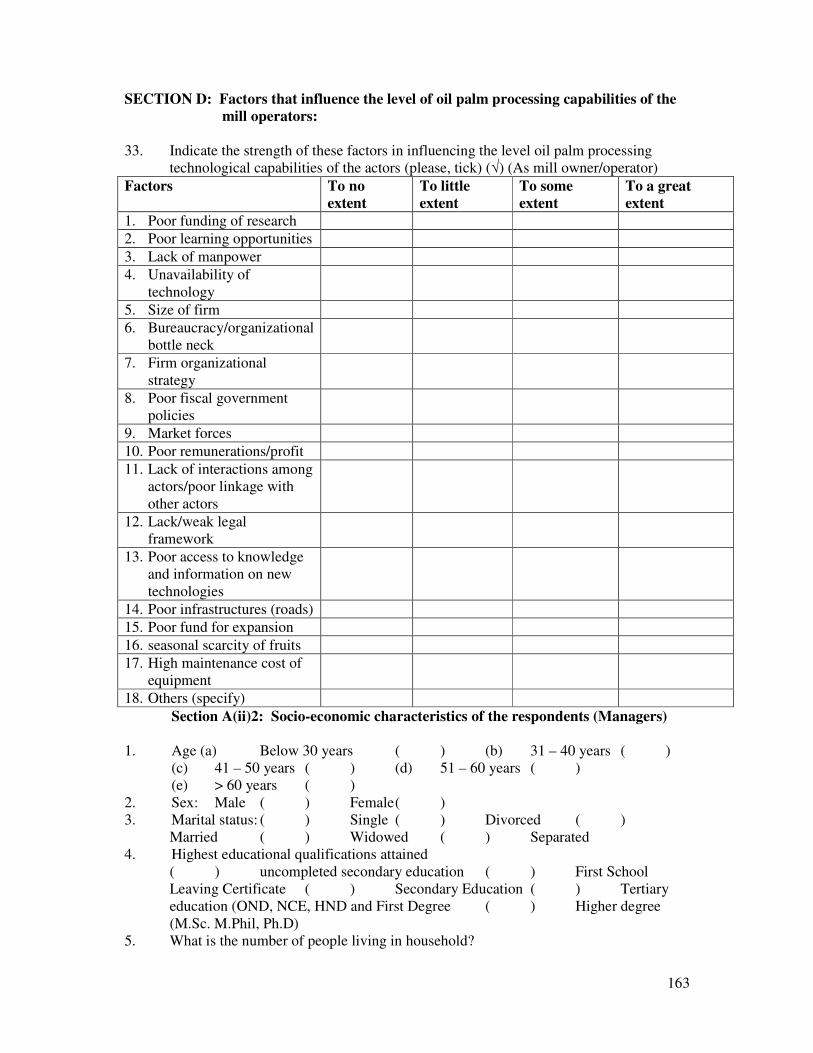
163
SECTION D: Factors that influence the level of oil palm processing capabilities of the
mill operators:
33. Indicate the strength of these factors in influencing the level oil palm processing
technological capabilities of the actors (please, tick) (√) (As mill owner/operator)
Factors To no
extent
To little
extent
To some
extent
To a great
extent
1. Poor funding of research
2. Poor learning opportunities
3. Lack of manpower
4. Unavailability of
technology
5. Size of firm
6. Bureaucracy/organizational
bottle neck
7. Firm organizational
strategy
8. Poor fiscal government
policies
9. Market forces
10. Poor remunerations/profit
11. Lack of interactions among
actors/poor linkage with
other actors
12. Lack/weak legal
framework
13. Poor access to knowledge
and information on new
technologies
14. Poor infrastructures (roads)
15. Poor fund for expansion
16. seasonal scarcity of fruits
17. High maintenance cost of
equipment
18. Others (specify)
Section A(ii)2: Socio-economic characteristics of the respondents (Managers)
1. Age (a) Below 30 years ( ) (b) 31 – 40 years ( )
(c) 41 – 50 years ( ) (d) 51 – 60 years ( )
(e) > 60 years ( )
2. Sex: Male ( ) Female ( )
3. Marital status: ( ) Single ( ) Divorced ( )
Married ( ) Widowed ( ) Separated
4. Highest educational qualifications attained
( ) uncompleted secondary education ( ) First School
Leaving Certificate ( ) Secondary Education ( ) Tertiary
education (OND, NCE, HND and First Degree ( ) Higher degree
(M.Sc. M.Phil, Ph.D)
5. What is the number of people living in household?

164
1 – 2 ( ) 3 – 4 ( ) 5 – 6 ( )
7 – 8 ( ) Above 8 ( )
6. Have you been trained in any aspect of oil palm processing? ( )
Yes ( ) No
7. If yes in what areas? Please specify
(1) …………… (2)……………… (3)……………(4)………………………….
8. How many workers do you have in your enterprise? …………………………………
9. Years of experience in oil palm processing ……………………………………………
10. Are you the owner of the mill as well Yes ( ) No ( )
11. On the average, what is your monthly estimated income from oil palm fruit
processing enterprise? Income (N)
0 – 15,000 ( ) 16,000 – 30,000 ( )
31,000 – 45,000 ( ) 46,000 - 60,000 ( )
61,000 – 75,000 ( ) Above 75,000 ( )
Cannot assess ( )
SECTION B: Available technologies to the respondents (Managers)
Available technologies
12. What are the available processing technologies (methods) being used in your oil palm
processing enterprise?
a) ( ) Fully automated mill (continuous system)
b) ( ) Semi automated mill (batch system)
c) ( ) Non- automated mill
13. Based on your answer above, what types of machine/equipment (mill) do you have?
1) ……………………………………… (2)……………………………
(3) ………………………………………. (4)……………………………
SECTION C: Technological capabilities
i) Investments
14. What investments have your oil palm processing enterprises made in areas of human
resources in the last three years?
Category of staff Type of training Period of training Cost of training
ii) Production capabilities
15. List the various products from your oil palm processing enterprises
1) 2) 3) 4)
16 That kind of fuel do you use for heating/cooking your palm fruits?
( ) Wood ( ) Diesel ( ) Electricity ( )
Coal ( ) Charcoal ( ) Fibre ( ) Nut
chaff/shell
17. What methods do you use in heating your palm fruits ( ) Local
heating in drums ( ) Sterilizers
18. Do you cook your fruits in bunch or do you cook already loosed fruits?
( ) In bunches ( ) Loosed fruits
19. If your answer is heating the bunches, do you have strippers to remove fruits?
Yes ( ) No ( )
20. After heating your fruits, do you do manual pounding or use digester?
( ) Pounding ( ) Digester
21. If you still retain hand screw press, when /why do you use it?........................................

165
…………………………………………………………………………………………..
22. What model of presses do you use?
( ) Manual vertical press ( ) Stork hydraulic hand press
( ) Motor-jack press ( ) Motor-jack canti-lever press
( ) NIFOR hydraulic hand press ( ) Combined screw/hydraulic press
( ) Mechanical Screw press ( ) NIFOR mechanical screw press
( ) Manual spindle press ( ) Automated hydraulic press
23. Do you add food additives (herbs and spices) ( ) Yes ( ) No
24. If yes, what type of reason (1) ……………… (2) …………………………
25 How do you remove dirts, water and other impurities (clarification) from the oil?
( ) Heating in pot/drum and decant oil
( ) Clarifier containers (tanks)
26. How do you store your oil ( ) In drum (buta) ( ) in tanks ( )
In tins ( ) in bottle ( ) in plastic container
27. Can you rate the oil grades according to these characteristics using a 5 point likert
scale using sensory method?
S/N Characteristics Product according to grades
1 2 3 4 5
1 Appearance
2 Colour
3 Flavour
4 Texture
5 (Mouth feel)
6 Taste
7 Shelf life
8 Overall quality
9 Congeality
Rating 5 = Excellent, 4 = Very good, 3 = Good, 2 = fair, 1 = poor
28. Do you know causes of spoilage of palm oil (poor grade)? Yes ( ) No
( )
If yes, describe:
1. …………… 2. …………………… 3) ……………………………
29. Where do you carry out your quality control analysis (name and address)
…………………………………………………………………………………………
iii. Minor and major change capabilities
30. Describe the minor improvements and minor adaption/changes that your processing
industry has carried out since you started as manager under the following headings
within 3 years
Item Improvement Adoption
Equipment
1
Investment
1
Product
1
Process

166
1
Package
1
Human resources
Training/learning
1
Quality control
Linkage
1
Management
1
Organization
1
Consumer protection
1
Environment waste disposal
1
Communication
1
Marketing
v) Linkage capabilities
a) What type of Linkage with external and internal sources? (i) Direct ( ) (ii) Indirect
( ) (iii) Vertical ( ) (iv) Horizontal ( )
31. What type of after service has your processing industry received from your machinery
supplier
Yes No
a) After – sale service: Assistance in installing the machinery within
your own factory
b) Assistance in training your workers in operating within your
industry
c) Assistance in training your service engineers in maintenance and
repair
d) Assistance in training your operatives in order industries prior to
installation
e) Visit by suppliers staff to deal with technical problems that have
arisen during subsequent operation of machinery
f) Other forms of assistance from machinery suppliers
32. Was the assistance from suppliers provided under what condition?
Condition Yes No
a) Free or included in the price of machinery
b) Covered by special service contract
c) Covered by a technical license
d Paid for on an adhoc basis according to work performed
33. Have you ever heard about agricultural extension/technology transfer agents?
Yes ( ) No ( )

167
Has any agricultural extension/technology transfer agent helped you in any aspect of
your oil palm processing business? Yes ( ) No ( )
34. If yes, what role has agricultural extension/technology transfer agent played in your
oil palm processing business?
1……………………………………………. 2……………………………………….
Linkage within the processing industry
35. How is information transmitted from one unit to another within the processing
industry? If yes, how?....................................................................................................
vi) Strategic marketing capabilities
36. List your distribution channels and outlets/depots
S/N Distribution channels S/N Outlets Depots
1 Farm gate 1 Soap manufacture marketers
2 Open market 2 Hotels
3 Middlemen oil sellers 3 Retail oil marketers
4 Workers 4
37. List and describe methods used for collecting information about customers/consumers
needs and complaints
S/N Method e.g. Description
1
38. List and describe methods used for promotion and advertisement of your products
S/N Method e.g. Description
1
vi) Learning mechanisms
39. List and describe the type of formal education (in educational institutions) undergone
by the staff in your oil processing industry in the last 3 years
S/N Category of staff Number of staff Certificate obtained Period
1
2
40. List and describe the type of non-formal training (Learning on the job) undergone by
staff in your oil palm processing industry in the last 3 years
S/N Category of Staff Nature of training Period of learning
1
2
41. Are there problems arising from the different learning mechanisms (training
methods)? ( ) Yes ( ) No
42. If yes, list these problems
S/N Learning mechanisms Problems
1
2
3

168
SECTION D: Factors that influence oil palm processing technological
capabilities of the processors (Manager)
43. Please indicate to what extent the following factors affect you
Factors To no extent To little
extent
To some extent To a great extent
Unavailability of
technology
Unavailability of
equipment
Size of firm
Culture of firm
Lack of training
opportunity
Bureaucracy/organizational
bottle necks
Poor fiscal government
policies
Policy dynamics
Market forces
Poor access to knowledge
and information new
technology
Poor remunerations
Lack of interactions among
actors/poor linkage with
other actors
Lack of labour
No price control
Poor infrastructures (roads)
Crime and thefts
Poor water supply
Consumers attitudes/
Complaints
Spoilage of products
Power outage
Poor storage facilities
Poor quality of production
and factory space
No quality control
laboratory
Preservation of products
Waste disposal
Quality of products (oil)
Terrorism/kidnapping
Owner of the industry
Poor fund for expansion
Scarcity of fruits

169
SECTION Aii, 3: Socio-economic characteristics of the respondents (factory floor
workers)
1. Sex: Male ( ) Female ( )
2. Age: ………………………………………………………………………..
3. Marital status: Married ( ) Widowed ( ) Divorced
( ) Single ( )
4. Highest level of education?....................................................................................
5. What is the number of people living in your household?
1 – 2 persons 3 – 4 person 5 – 6 person
7 – 8 person above 8
6. Are you a floor-worker processor? (that is owner of fruits)
( ) Yes ( ) No
Management
7. Indicate the number of years of experience in oil palm processing
industry………………………………………………………………
8. What type of employee are you? ( ) Permanent ( )
Temporary ( ) Daily paid ( ) Self employed
9. If you are paid, are you paid in cash? Or in kind?
10. What is your estimated monthly income from oil palm fruits processing enterprise?
N0 – 10,000 10,001 – 20,000
20,001 – 30,000 30,001 - 40,000
40,001 – 50,000 Above 50,000
Cannot access
11. In what area of the processing industry are you currently working in?
( ) production ( ) Technical repairs ( )
Laboratory ( ) Sales ( ) others (specify)
SECTION B: What are the available technologies to you in areas of the following?
a) Fully automated oil mill ( ) (b) Semi automated oil mill ( )
(c) Non-automated oil mill ( )
12. If your answers is (a or b or c) what type of machine or equipment do you have and
use?
a) …………… b) ……………… c) …………… d) …………………

170
SECTION C: Technological capabilities
13. Have you under gone any training in oil processing ( ) Yes
( ) No
14. If yes, in what areas or types? (1) ………………………………………………………
2)………………………………………. (3) …………………………………………...
15. Have you helped to train any of your fellow workers ( ) Yes ( ) No
16. If yes, give number and category of people, type of training and length of time
Number of people Category of workers Type of training Length of training
1
Production
17. What kind of work are you currently doing in the oil palm processing industry?
1. ………………2. ……………………3. ………………………
18. What kind of storing/packaging containers do you use for the following products?
Oil (1) drums ( ) (2) tin ( ) (3) tank ( )
(4) bottles ( ) (5) plastic containers ( )
Nuts (1) in heaps ( ) (2) stacked in jute bags ( )
Fibre (1) staked in bags ( ) (2) in heaps ( )
stacked in jute bags
Effluent (1) stored in drums before disposed ( ) (2) stored in
tanks before disposal ( )
19. How do you clean your environment?.............................................................
…………………………………………………………………………………...
20. How do you clean your equipment/machines?
Equipment/machine Methods
1
21. How do you dispose the effluents and wastes from your processing industry?
Waste/effluent Methods of disposal
1

171
SECTION D: Factors influencing the technological capabilities of mechanical oil palm
processing (floor workers)
Factors To no extent To little
extent
To some
extent
To a great
extent
Manager
Fellow floor workers
Labour availability
Owner of mill
Equipment /machinery
Water supply
Waste disposal
Spoilage
Environmental protection
Storage facilities
Power outage
Government interference
Consumer
attitudes/complaints
Training facilities
Infrastructure (road)
Price control
Crime and theft
Terrorism/kidnapping
Labour unrest/strike
Fruit scarcity
Others specify
SECTION Aii4: Socio-economic characteristics of the consumers
1. Sex: Male ( ) Female ( )
2. Age……………………………………………………………………………………...
3. Marital status: Married ( ) Widowed ( )
Divorced ( ) Single ( )
4. Highest level of education? …………………………………………………………….
5. Years of experience in palm oil: ……………………………………………………….
6. Can you rate the grades of oil according to these characteristics using a 5 point-scale
using sensory method?
S/N Characteristics Product according to grades
5 4 3 2 1
1 Appearance
2 Colour
3 Flavour
4 Texture
5 Mouth feel
6 Taste
7 Shelf life
8 Overall quality
9 Congeality
Rating 5 = Excellent, 4 = Very good, 3 = Good, 2 = Fair, 1= Poor

clxxii
7. Do you know causes or sources of spoilage of products (oil)? Yes ( ) No
( )
If yes, describe:
a) …………… (b)………………… (c)…………………… (d) ……………………….
8. What quantity of oil do you buy in 6 months? ………………….. (litre)………………
9. Do you have direct link with (1) processors ( ) (2) marketers? ( )
10. If you buy from processors, do you have linkage problems?
a) ……………… (b) ……………… (c) ……………… (d) ………………