Motor Vehicles, Air Pollution, and PublicHealth - CDC stacks

Environmental Monitoring and Assessment (2006) 122: 61–79
DOI: 10.1007/s10661-005-9165-6 c© Springer 2006
FIELD SURVEY OF TRANS-BOUNDARY AIR POLLUTION WITHHIGH TIME RESOLUTION AT COASTAL SITES ON THE SEA OF
JAPAN DURING WINTER IN JAPAN
MASAHIDE AIKAWA1,∗, TAKATOSHI HIRAKI1, MOTONORI TAMAKI2, MIKIOKASAHARA3, AKIRA KONDO4, ITSUSHI UNO5, HITOSHI MUKAI6, ATSUSHI
SHIMIZU6 and KENTARO MURANO6
1Hyogo Prefectural Institute of Public Health and Environmental Sciences 3-1-27 Yukihira-cho,Suma-ku, Kobe, Hyogo 654-0037, Japan; 2Hyogo Environmental Advancement Association 3-1-31Yukihira-cho, Suma-ku, Kobe, Hyogo 654-0037, Japan; 3Graduate School of Energy Science, Kyoto
University Yoshida-Honmachi, Sakyo-ku, Kyoto 606-8317, Japan; 4Graduate School ofEngineering, Osaka University 2-1 Yamadaoka, Suita, Osaka 565-0871, Japan; 5Research Institutefor Applied Mechanics, Kyushu University Kasuga Park 6-1, Kasuga, Fukuoka 816-8580, Japan;
6National Institute for Environmental Studies 16-2 Onogawa, Tukuba, Ibaraki 305-8506, Japan(∗author for correspondence, e-mail: Masahide [email protected])
(Received 18 August 2005; accepted 19 December 2005)
Abstract. An intensive field survey, with 6-h measurement intervals, of concentrations of chemical
species in particulate matter and gaseous compounds was carried out at coastal sites on the Sea
of Japan during winter. The concentration variation of SO2(g) and HNO3(g) were well correlated,
whereas the NH3(g) concentration variation had no correlation with those of SO2(g) and HNO3(g).
The NH4+ (p)/non-sea-salt- (nss-)SO4
2−(p) ratio in particulate matter was mainly affected by the
location of the sampling site. One or more concentration peaks of nss-Ca2+ for survey period were
observed. Backward trajectories analyses for the highest nss-Ca2+ concentration peaks showed some
inconsistency in pathways. We consider that insufficient mixing of the atmosphere and/or insufficient
time for the transported air pollutants to react with those discharged locally are the most likely
explanations for the discrepancies between the measured products [HNO3][NH3] and the calculated
values.
Keywords: aerosol, ammonia, ammonium, filter pack, gases, nitrate, sulfate
1. Introduction
In East Asia, the development of economic activities will be accompanied by in-creased emission of air pollutants such as sulfur dioxide(SO2) and nitrogen ox-ides(NOx) in the near future; air pollution and acid deposition will become seriousissues in areas of China and Korea north of latitude 25◦N. The researchers who areinvolved in atmospheric chemistry as well as acid deposition are interested in thetransport of air pollutants emitted in Eurasian continent to Japan, and conductingground-based observation of air pollutants in remote and rural areas of Japaneseislands (e.g. Ohizumi et al., 1997; Murano et al., 1998). In Japan, northern andnorthwestern winds prevail in the winter season (December-February) owing to

62 MASAHIDE AIKAWA ET AL.
an atmospheric pressure pattern that high and low atmospheric pressure overlieswestern and eastern Japan, respectively. This wind brings the air pollutants fromEurasian continent to Japan and causes spray that emits a large number of sea saltparticles at the coast of the Sea of Japan. In fact, the contribution of sea salt com-ponents from the Sea of Japan to the composition of rainfall in Japan is quite large,especially in winter (Aikawa et al., 2003; Aikawa et al., 2004). From the standpointof an investigation of trans-boundary transport of air pollutants from the Eurasiancontinent, measurement of concentrations of chemical species in particulate matterand gaseous compounds with high time resolution is essential. An intensive survey,with 6-h measurement intervals, of particulate matter and gaseous compounds wascarried out during winter, when the influence on Japan of trans-boundary transportof air pollutants from the Eurasian continent became great.
2. Experimental
2.1. SURVEY PERIOD AND SAMPLING SITES
Samples were collected from 17 January through 2 February 2001, from 16 Januarythrough 1 February 2002, from 10 February through 28 February 2003, and from8 January through 30 January 2004. The field surveys in 2001, 2002, and 2003 werecarried out at Hatagami, and the field survey in 2004 was conducted at Hatakeyama.Both Hatagami and Hatakeyama are located in Toyo-oka city, Hyogo Prefecture,Japan (Figure 1). The area around the monitoring sites is shown in Figure 2. Toyo-oka city is located on the coast of the Sea of Japan. There are few industrial facilitiesand limited commerce occurs in this region. Heavy snowfall occurs in winter.
The locations of the two sampling sites are quite different, although both are inToyo-oka city. Hatagami (altitude: 10 m above sea level (a.s.l.)) is approximately4 km from the coast and mountains approach from both sides as we leave thesea. Finally sampling site is surrounded by low mountains on three sides, in otherwords, Hatagami is located in the final stage surrounded on mountains. We startedthe survey at Hatagami with expectation of a detection of high-concentration airpollutants. However the high-concentration air pollutants that we expected was notobserved for first three years as shown and mentioned later. Therefore, we movedthe sampling site to Hatakeyama. Hatakeyama (altitude: 170 m a.s.l.) is locatedapproximately 300 m from the Sea of Japan. Both sites are classified as rural.
The mean meteorological parameters over the field survey periods, measured bythe Toyo-oka Meteorological Observatory (approximately 10 km from the samplingsites), were temperatures of 2.0◦C (2001), 4.0◦C (2002), 4.7◦C (2003), and 2.0◦C(2004); and relative humidities of 85% (2001), 79% (2002), 78% (2003), and 78%(2004). The neighborhood of the sampling spot was covered by snow (averagely30 cm) through all the survey period in 2001 while it was covered by snow only acertain period (less than 10 days on an average) in 2002, 2003, and 2004.

FIELD SURVEY OF TRANS-BOUNDARY AIR POLLUTION 63
Figure 1. Location of sampling sites.
2.2. SAMPLE COLLECTION AND ANALYSIS
2.2.1. MethodThe four-stage filter pack method was used to collect gaseous compounds (SO2,HNO3, HCl, and NH3) and particulate matter (SO4
2−, NO3−, Cl−, Na+, NH4
+, K+,Ca2+, and Mg2+) (Karakas and Tuncel, 1997; Matsumoto and Okita, 1998; Sickleset al., 1999). The four filter-pack stages consisted of a PTFE filter; a polyamidefilter; a 6%K2CO3–2% glycerin-impregnated filter; and a 5%H3PO4–2% glycerin-impregnated filter. A Norwegian Institute for Air Research filter holder with an openface was used. The samples were automatically collected at 6-h intervals using a10-line global sampler (GS-10GP, Tokyo Dylec Corp., Tokyo, Japan). The flow rate

64 MASAHIDE AIKAWA ET AL.
Figure 2. Enlarged view of monitoring site area.

FIELD SURVEY OF TRANS-BOUNDARY AIR POLLUTION 65
used for sampling was approximately 10 L/min. Samples were collected at about1.5 m above ground level. The sampling began at 0:00 JST.
2.2.2. Chemical analysis and statistical analysisWe used the following solutions for extraction: deionized water for the PTFE filter,the polyamide filter, and the 5%H3PO4–2% glycerin-impregnated filter and a 0.03%H2O2 solution for the 6%K2CO3–2% glycerin-impregnated filter. The 0.03% H2O2
solution was used to completely oxidize SO2 (SO32−) to SO4
2−. The extracts werefiltered with a 0.22-μm membrane filter and analyzed by ion chromatograph (DX-300 series, Dionex Corp., Sunnyvale, USA).
The least significant difference test was used for a statistical comparison of datacollected in each year.
2.2.3. Backward trajectory analysesThree-day isentropic backward trajectory analyses at 850 hPa were conducted usingthe method developed by Hayashida-Amano et al. (1991) and using data from theEuropean Centre for Medium-Range Weather Forecasts with the Support System forEvaluation of Troposphere Monitoring Data of the Center for Global EnvironmentalResearch (CGER) National Institute for Environmental Studies (NIES).
3. Results and Discussion
3.1. METHODOLOGY, DATA DISTRIBUTION AND YEAR-TO-YEAR COMPARISON
As for the four-stage filter pack method, artifacts should be taken into account atfirst. Matsumoto and Okita (1998) and Matsuda et al. (2002) studied the artifactsin detail. In addition, Aikawa et al. (2005) also discussed the artifacts when usingthe four-stage filter pack method. Taking the manuscripts by Matsumoto and Okita(1998) and Matsuda et al. (2002) and the previous discussion by Aikawa et al.(2005), few artifacts could be observed for sulfate, and some artifacts could beobserved for nitrate, ammonium, and chloride although no actual estimation of theartifacts by using a denuder method was tried in the current survey. However, asdiscussed in the manuscript by Aikawa et al. (2005), the possible artifacts werepresumably expected to be smaller than the results by Matsumoto and Okita (1998)due to the low air temperature in the current survey period.
Statistical parameters for ions in particulate matter and gaseous compounds areshown in Table I. Values of p in Table I show the results of Kolmogorov-Smirnov(K-S) normality tests. Non-sea-salt- (nss-) SO4
2− and nss-Ca2+ concentrations inparticulate matter were calculated on the basis of Na+ concentrations. The p valuesindicate that few of the ions and gaseous compounds followed a normal distribution;therefore, it is appropriate to use median rather than mean values for year-to-yearcomparisons. A clear example of the difference in the concentrations of the ionsin particulate matter and gaseous compounds over four years is characterized by

66 MASAHIDE AIKAWA ET AL.
TABLE I
Statistical parameters for select ions measured in particulate matter and gaseous compounds
Percentile∗1
N Mean∗1 Median∗1 Minimum∗1 Maximum∗1 25th 75th p∗2
NO3− 58 5.7 3.5 0.0 36.6 0.0 9.2 p < .01
nss-SO42− 58 26.7 22.6 2.8 68.9 15.7 33.5 p < .05
Na+ 58 18.4 9.6 0.1 81.1 3.9 18.0 p < .01
2001NH4
+ 58 46.2 40.4 3.5 109.4 27.8 65.3 p < .20
nss-Ca2+ 58 0.6 −0.1 −1.8 13.8 −0.4 0.0 p < .01
HNO3 58 1.9 1.9 0.0 14.0 0.0 2.8 p < .01
SO2 58 6.1 3.2 0.0 43.9 1.2 6.4 p < .01
NH3 58 9.1 6.1 0.0 40.8 2.7 11.5 p < .01
NO3− 63 6.9 6.1 −0.3 29.3 3.2 8.4 p < .01
nss-SO42− 63 20.9 17.8 2.1 58.6 12.9 26.1 p < .01
Na+ 63 27.8 19.1 2.2 128.8 8.9 41.1 p < .01
2002NH4
+ 63 36.2 29.3 2.4 97.6 18.2 50.8 p < .01
nss-Ca2+ 63 2.1 1.4 −0.4 22.8 0.5 2.6 p < .01
HNO3 63 2.1 1.8 −0.2 7.4 1.1 2.3 p < .01
SO2 63 7.5 5.5 1.1 43.1 3.4 9.3 p < .01
NH3 63 19.6 20.0 0.5 45.1 15.0 23.3 p < .05
NO3− 67 14.9 10.0 1.4 56.6 6.7 18.3 p < .01
nss-SO42− 67 48.5 38.3 8.7 168.7 24.5 67.6 p < .01
Na+ 67 56.3 40.7 5.1 228.3 22.6 63.9 p < .01
2003NH4
+ 67 95.5 83.4 23.3 354.5 40.6 132.9 p < .01
nss-Ca2+ 67 3.5 2.2 −2.1 29.0 1.2 4.4 p < .01
HNO3 67 2.6 1.6 0.0 35.8 0.5 2.5 p < .01
SO2 67 7.6 3.8 0.3 43.9 1.8 10.5 p < .01
NH3 67 17.1 15.0 6.5 69.1 11.2 20.9 p < .01
NO3− 82 33.2 23.0 3.7 124.9 12.3 42.1 p < .01
nss-SO42− 82 57.0 50.0 −91.8 264.9 28.8 74.2 p < .01
Na+ 82 426.7 246.6 60.5 1560.6 163.7 570.3 p < .01
2004NH4
+ 82 86.4 63.3 6.3 407.3 32.0 115.8 p < .01
nss-Ca2+ 82 4.6 4.0 −1.1 26.8 1.6 6.5 p < .01
HNO3 82 11.1 3.7 0.0 73.0 0.4 17.5 p < .01
SO2 82 61.9 31.2 2.6 452.9 12.1 79.7 p < .01
NH3 82 22.3 19.1 2.2 81.3 12.2 26.2 p < .01
∗1) Units are nmol/m3.
∗2) Result by K-S test.

FIELD SURVEY OF TRANS-BOUNDARY AIR POLLUTION 67
high concentrations in 2004. These high concentrations were typically and clearlyobserved in Na+ concentrations in particulate matter, and we attribute them to the lo-cations of the sampling sites (section 2.1). The sampling site in 2004 (Hatakeyama)was located close to the coast, where the influence of the Sea of Japan was directand great, whereas the sampling site in 2001, 2002, and 2003 (Hatagami) was lo-cated among mountains about 4 km from the coast. As with Na+ concentrations,both HNO3(g) and SO2(g) concentrations were considerably higher in 2004 thanin the other three years. When HNO3(g) and SO2(g) are compared in terms ofmaximum/median and 75th percentile/median, both parameters for SO2(g) showedsimilar values among respective years, although both maximum and median in 2004were higher than in the other three years. In contrast, for HNO3(g), both parametersin 2004 were larger than in 2001 and 2002, indicating that in 2004 high HNO3(g)concentrations appeared more frequently than did high SO2(g) concentrations. Themean NH3(g) concentration in 2001 was lower than those in the other three years.The differences observed in HNO3(g), SO2(g), and NH3(g) concentrations are likelyattributable to emission sources and trans-boundary transport, as discussed later inthis paper.
3.2. CONCENTRATIONS OF GASEOUS COMPOUNDS
3.2.1. SO2(g) and HNO3(g)Figure 3 shows temporal variations of SO2(g) and HNO3(g) concentrations. Asmentioned in section 3.1, the concentrations of SO2(g) and HNO3(g) in 2004 weresignificantly (p < 0.001) higher than those in other years. This difference is pre-sumably due to the change of the sampling site. Some peaks were observed in 2004.Isentropic backward trajectories from Hatakeyama calculated at the 1500-m levelare shown in Figure 4. Both SO2(g) and HNO3(g) were high on January 10 and24 as shown by Peak A and Peak B, respectively. The backward trajectories weresimilar.
In contrast, in the case of Peak C (C’) and Peak D (D’), time gaps of 6 or12 hours were observed between SO2(g) and HNO3(g) peaks. The pathways to thedestination were similar for PeakCSO2 and PeakDSO2, although the end pointswere different. In contrast, both the pathways and the end points were different forPeakC’HNO3 and PeakD’HNO3. The backward trajectory of PeakC’HNO3 arrivedat the destination passing over the western part of Japan, and that of PeakD’HNO3
arrived at the destination after staying near the destination approximately one day.Only SO2(g) showed high concentrations at PeakESO2. The backward trajectory
for PeakESO2 started over the Sea of Japan further north and then looped over theKorean peninsula before reaching the sampling site.
3.2.2. NH3(g)Figure 5 shows temporal variations of NH3(g) concentrations. As mentioned in sec-tion 3.1, the mean concentration of NH3(g) in 2001 (9.1 nmol/m3) was significantly

68 MASAHIDE AIKAWA ET AL.
Figure 3. Temporal variations of SO2(g) (a) and HNO3(g) (b) concentrations.
(p < 0.001) lower than those in the other three years (19.6 [2002], 17.1 [2003],and 22.3 [2004]). The primary emission source of NH3(g) at this rural site is theground (Genfa et al., 1989; Misselbrook et al., 2000). We believe that the lowNH3(g) mean concentration in 2001 is attributable to snow completely coveringthe ground and inhibiting emission of NH3(g) from the ground. Concentrations ofNH3(g) varied considerably, although some peaks with high concentrations whichwas presumably due to the influence from a village near the sampling site were alsoobserved. The inventory of NH3(g) in East Asia has been studied (e.g. Streets et al.,2003; EAGrid2000 unpublished but communicated). According to the studies, adifference between the NH3(g) emission amount in Japan and that in China is notbigger than a difference between the SO2(g) emission amount in Japan and that inChina. Accordingly NH3(g) concentration in Japan would be strongly controlledby the NH3(g) emitted in Japan, not that in China.
Backward trajectories for high NH3(g) concentrations are shown in Figure 6.The end points of the trajectories of PeakGNH3 and PeakHNH3 were the Eurasiancontinent. However all trajectories stayed relatively near the sampling site for 24 to48 hours before arriving at the destination. These findings are also consistent with

FIELD SURVEY OF TRANS-BOUNDARY AIR POLLUTION 69
20
30
40
50
60
100 110 120 130 140 150
Longitude
Lat
itu
de
Lat
itu
de
PeakA SO2,HNO320
30
40
50
60
100 110 120 130 140 150
Longitude
20
30
40
50
60
100 110 120 130 140 150
Longitude
Lat
itu
de
Lat
itu
de
20
30
40
50
60
100 110 120 130 140 150
Longitude
20
30
40
50
60
100 110 120 130 140 150
Longitude
Lat
itu
de
20
30
40
50
60
100 110 120 130 140 150
Longitude
Lat
itu
de
20
30
40
50
60
100 110 120 130 140 150
Longitude
Lat
itu
de
PeakBSO2,HNO 3
PeakCSO2 PeakC'HNO3
PeakDSO2 akD'HNO3
PeakESO2
Pe
Figure 4. Isentropic backward trajectories for peaks with high SO2(g) and HNO3(g) concentrations
at Hatakeyama, calculated at the 1500-m level. Calculations were performed at 12-hour intervals.

70 MASAHIDE AIKAWA ET AL.
Figure 5. Temporal variations of NH3(g) concentrations.
and support the above statement that the primary emission source of NH3(g) is theground.
3.3. CONCENTRATIONS AND RATIOS OF PARTICULATE MATTER
3.3.1. NH4+(p) and nss-SO4
2−(p)Few artifacts could be observed for sulfate as mentioned in 3.1, in additionNH4HSO4 and (NH4)2SO4 are important species in the atmospheric chemistry.Therefore, NH4
+(p) and nss-SO42−(p) concentrations and NH4
+(p)/nss-SO42−(p)
molar ratios will be discussed primarily.Figure 7 shows temporal variations of NH4
+(p) and nss-SO42−(p) concentrations
and NH4+(p)/nss-SO4
2−(p) molar ratios. The mean concentrations of NH4+(p) in
each year were 46.2 nmol/m3 (2001), 36.2 nmol/m3 (2002), 95.5 nmol/m3 (2003),and 86.4 nmol/m3 (2004), whereas those of nss-SO4
2−(p) were 26.7 nmol/m3
(2001), 20.9 nmol/m3 (2002), 48.5 nmol/m3 (2003), and 57.0 nmol/m3 (2004).The mean NH4
+(p)/nss-SO42−(p) molar ratios in each year were 1.79 (2001), 1.71

FIELD SURVEY OF TRANS-BOUNDARY AIR POLLUTION 71
20
30
40
50
60
100 110 120 130 140 150
Longitude
Lat
itu
de
20
30
40
50
60
100 110 120 130 140 150
Longitude
Lat
itu
de
20
30
40
50
60
100 110 120 130 140 150
L
Lat
itu
de
PeakFNH 3 PeakGNH3
PeakHNH3
ongitude
Figure 6. Backward trajectories for peaks with high NH3(g) concentrations at Hatakeyama, calculated
at the 1500-m level. Calculations were performed at 12-hour intervals.
(2002), 2.02 (2003), and 1.35 (2004). Both NH4+(p) and nss-SO4
2−(p) concentra-tions in 2001 and 2002 had no statistically significant (p > 0.05) differences fromeach other; the same was true in 2003 and 2004. In contrast, both NH4
+(p) andnss-SO4
2−(p) concentrations in 2003 and 2004 were statistically higher than thosein 2001 and 2002.
The situation with respect to the NH4+(p)/nss-SO4
2−(p) molar ratios was differ-ent. The mean NH4
+(p)/nss-SO42−(p) molar ratios in 2004 (1.35) was lower than
other three years (1.79 [2001], 1.71 [2002], 2.02 [2003]). The difference between2004 and other three years was presumably caused by the difference in the samplingsite locations. In addition, we consider both insufficient mixture and insufficienttime for reaction to be factors affecting the NH4
+(p)/nss-SO42−(p) molar ratio.
These factors are discussed in detail in section 3.4.Figure 8 shows results of simulations for nss-SO4
2−(p) concentrations by theChemical Weather Forecast System (CFORS) (Uno et al., 2003). PeakDnss-SO4
2−
and PeakBnss-SO42−, shown on Figure 7, were observed between 12:00 and 18:00
on 10 January 2004 and between 6:00 and 18:00 on 19 January 2004, respectively.The observed concentrations of PeakDSO4
2− and PeakBnss-SO42− were 265 and
217 nmol/m3, respectively. The results of simulation at the corresponding times ofthe peaks were approximately 300 and 200 nmol/m3, respectively, indicating thatthe results of the survey agreed quite well with the results of the simulation.

72 MASAHIDE AIKAWA ET AL.
Figure 7. Temporal variations of NH4+(p) and nss-SO4
2−(p) concentrations (a) and molar ratios of
NH4+(p)/nss-SO4
2−(p) (b).
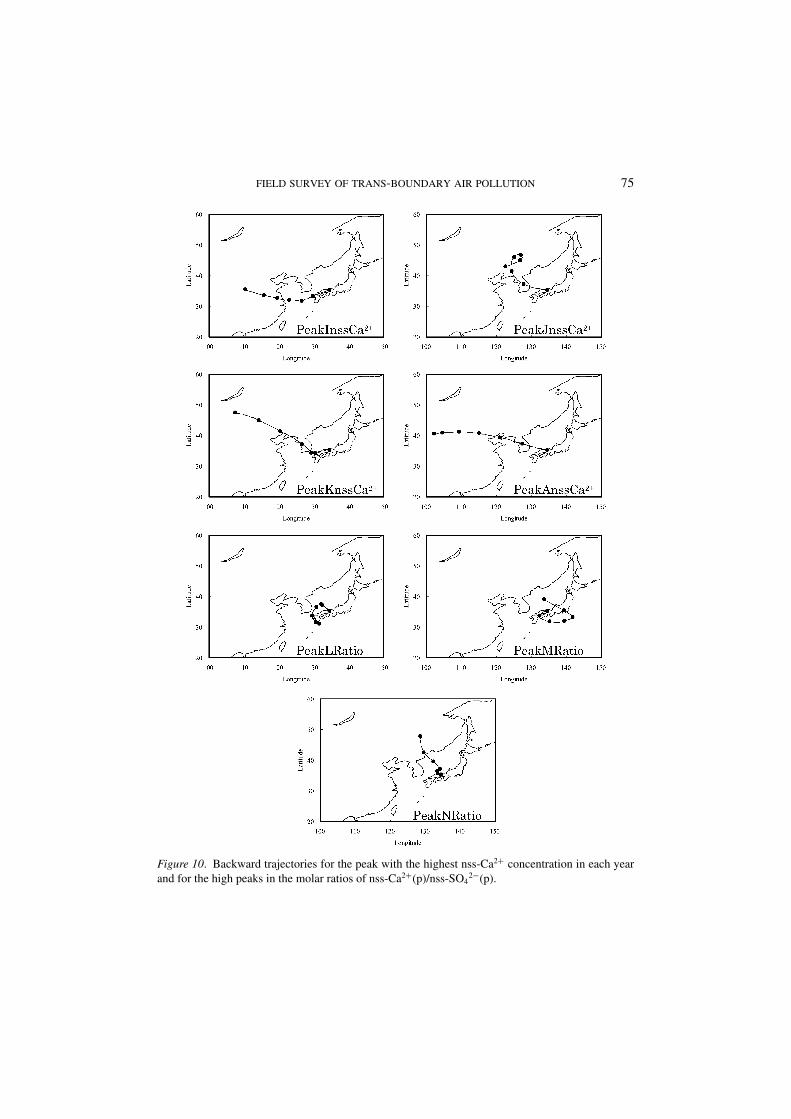
3.3.2. nss-Ca2+(p)It is generally accepted that the yellow-sand events occur in springtime in EastAsia (Kim et al., 2002). The high concentration of nss-Ca2+(p) in the ambient air isobserved in the yellow-sand events (Aikawa et al., 2005). Yellow-sand events fre-quently occur in March and April. Our field surveys were carried out in January andFebruary. However, we observed some events with high nss-Ca2+(p) concentrations.Figure 9 shows temporal variations in concentrations of nss-Ca2+(p) and molar ra-tios of nss-Ca2+(p)/nss-SO4
2−(p). One or more nss-Ca2+(p)concentration peakswere observed for each year. Backward trajectories for the highest nss-Ca2+(p)concentration in each year are shown on Figure 10. The backward trajectory inPeakInss-Ca2+ (2001) arrived at the destination after traveling over the western partof Japan. The backward trajectory for PeakKnss-Ca2+ (2003) appeared to originatein the Gobi Desert and to pass through the western part of Japan. In PeakJnss-Ca2+
and PeakAnss-Ca2+ (2002 and 2004, respectively), the backward trajectories bothreached the destination after traveling over the Korean peninsula although the endpoints were different.
Some peaks were also observed in the nss-Ca2+(p)/nss-SO42−(p) molar ratio, and
many of them coincided with the high nss-Ca2+(p) concentration peaks. However,

FIELD SURVEY OF TRANS-BOUNDARY AIR POLLUTION 73
Figure 8. Results of simulations for nss-SO42−(p) concentrations by CFORS (Uno et al., 2003).

74 MASAHIDE AIKAWA ET AL.
Figure 9. Temporal variations of nss-Ca2+(p) concentration (a) and molar ratios of nss-Ca2+(p)/nss-
SO42−(p) (b).
some high peaks appeared in the nss-Ca2+(p)/nss-SO42−(p) molar ratio, even though
the nss-Ca2+(p)concentrations were not very high, showing that nss-SO42−(p) con-
centrations were much lower than the nss-Ca2+(p) concentrations. Typical caseswere observed in PeakLRatio, PeakMRatio, and PeakNRatio; backward trajecto-ries for these cases are also shown on Figure 10. All backward trajectories did nottravel long distances but stayed in narrow areas. In addition, backward trajectoriesfor PeakLRatio and PeakMRatio traveled over Japan to draw a loop. These ob-servations probably indicate that when an air mass does not travel a long distance,nss-Ca2+(p) concentrations are relatively higher than nss-SO4
2−(p) concentrations.
3.4. ATMOSPHERIC CONDITIONS WITH RELATION TO
CONCENTRATION PRODUCTS
The equilibrium of gaseous ammonia and nitric acid with NH4NO3(p) in the atmo-sphere has been studied (Stelson and Seinfeld, 1982a; Stelson and Seinfeld, 1982b;Allen et al., 1989; Parmar et al., 2001; Aikawa et al., 2005). In our study, the mea-sured concentration products [HNO3][NH3] in 2001, 2002, and 2003 agreed wellwith the values calculated by Stelson and Seinfeld (1982a). The good agreementwas mainly observed above approximately 5◦C. In contrast, many of the measured
FIELD SURVEY OF TRANS-BOUNDARY AIR POLLUTION 75
Figure 10. Backward trajectories for the peak with the highest nss-Ca2+ concentration in each year
and for the high peaks in the molar ratios of nss-Ca2+(p)/nss-SO42−(p).

76 MASAHIDE AIKAWA ET AL.
concentration products [HNO3][NH3] in 2004 were larger than the calculated val-ues. Most of the 6-h average temperature measurements in 2004 were below 5◦C.A similar discrepancy with temperatures below 5◦C was reported by Allen et al.(1989). They showed two possible explanations for the discrepancy: insufficientmixing of HNO3(g) and NH3(g) in the atmosphere and insufficient time availablefor reaction. In our field survey, as mentioned in section 2.1, the survey site in 2004was very close to the Sea of Japan; therefore, the arriving transported air pollutantsdid not have enough time to react with the air pollutants discharged locally. Accord-ingly, both insufficient mixing and not enough time for reaction indicated by Allenet al. (1989) are the likely explanations for the discrepancies between the measuredproducts [HNO3][NH3] and the calculated values. Furthermore, Parmar et al. (2001)determined the NH3(g) and HNO3(g) concentrations in ambient air and discussedthe concentration products in detail. They considered that the atmospheric systemis not in equilibrium in some occasions, which is one of the factors to induce thediscrepancy. In our survey the sampling site would be located in the forefront wherethe arriving transported air pollutants and the air pollutants discharged locally getmixed with. In addition, they considered the chemical reaction of HNO3(g) withNaCl(p) as another factor to account for the discrepancy. A third possibility is thehigh Na+ concentrations in 2004 mentioned in section 3.1. NaCl(p) and HNO3(g)in the atmosphere can undergo the following chemical reaction:
NaCl(p) + HNO3(g) −→ NaNO3(p) + HCl(g)
This chemical reaction, on the other hand, inhibits the chemical reaction betweenNH3(g) and HNO3(g):
NH3(g) + HNO3(g) −→ NH4NO3(p)
NH3(g) can thus stay in the atmosphere as a gaseous compound without changingto NH4NO3(p). Parmar et al. (2001) indicated the presence of nitrate in both coarseand fine modes in winter in India. The similar distribution of nitrate in both coarseand fine modes was also reported in Japan (Ito et al., 2005). These results wouldalso support the third possibility.
3.5. COMPARISON WITH OTHER FIELD SURVEYS
Murano et al. (1998) carried out similar winter field surveys in Goto, a remote island,in western Japan. Figure 11 compares concentrations of NO3
−(p), nss-SO42−(p),
NH4+(p), nss-Ca2+(p), HNO3(g), SO2(g), and NH3(g) in this survey with concen-
trations in surveys conducted by Murano et al. (1998). Our survey in 2004 showedconcentrations similar to those measured at Goto. From the simulation survey, long-range transport of air pollutants from the Eurasian continent to Goto was clarifiedby Uno et al. (2000). Our survey site in 2004 was also affected by long-range

FIELD SURVEY OF TRANS-BOUNDARY AIR POLLUTION 77
Figure 11. Comparison of concentrations of NO3−(p), nss-SO4
2−(p), NH4+(p), nss-Ca2+(p),
HNO3(g), SO2(g), and NH3(g) in this survey and surveys conducted by Murano et al. (1998). (*1:
Result in Goto, in January, 1997. *2: Result in Goto, in December, 1997. *3: There was no data in
the result in Goto, in January, 1997.)
transport of air pollutants from the Eurasian continent, as evidenced by the factsthat the 2004 survey showed concentrations similar to those measured at Goto andthat there were no large emission sources near the survey site.
4. Conclusions
Intensive surveys of concentrations of chemical species in particulate matter andgaseous compounds, with 6-h measurement intervals, were carried out in Japan inthe winter seasons of 2001, 2002, 2003, and 2004, when the influence of trans-boundary transport of air pollutants from the Eurasian continent was greatest inJapan, at two rural sites in Hyogo Prefecture. SO2(g) and HNO3(g) consistentlyshowed high concentrations, although 6- or 12-hour time gaps were sometimes ob-served. In contrast, the temporal variations of NH3(g) concentrations were differentfrom those of SO2(g) and HNO3(g) concentrations. Taking into account the rural sur-vey site and the meteorology each year, we conclude that the SO2(g) and HNO3(g)were transported and NH3(g) was discharged locally. The NH4
+(p)/nss-SO42−(p)
ratio in particulate matter may have been affected by NH3(g) in the atmosphere.Some events with high nss-Ca2+ concentrations were observed, although the back-ward trajectories showed different patterns. We consider that insufficient mixingof atmosphere and/or insufficient time for the transported air pollutants to reactwith those discharged locally are the most likely explanations for the discrepanciesbetween the measured products [HNO3][NH3] and the calculated values.

78 MASAHIDE AIKAWA ET AL.
Acknowledgements
This research was funded by the Japan Environment Ministry’s Global Environmen-tal Research Fund. We utilized the Support System for Evaluation of TroposphereMonitoring Data (CGER-GMET) in CGER-NIES for the backward trajectory cal-culations. In addition, this study was supported in part by funds from the Grant-in-Aid for Scientific Research in Priority Areas under Grant No. 14048213 fromMinistry of Education, Culture, Sports, Science and Technology (MEXT), Japan.Moreover, this study was supported in part by funds from the Ministry of Environ-ment titled by “Development of the degradation diagnostic technique of the pluralfunction of natural environment and the integrated model for effect evaluation ofrecovery measures for a basin”.
References
Aikawa, M., Hiraki, T., Tamaki, M. and Shoga, M.: 2003, ‘Difference between filtering-type bulk and
wet-only datasets based on site classification’, Atmospheric Environment 37, 2597–2603.
Aikawa, M., Hiraki, T., Shoga, M. and Tamaki, M.: 2004, ‘Spatial variations and trends in acid
deposition in Japan within a 100 km × 100 km region from 1989 to 1999’, Water, Air, and SoilPollution 157, 225–244.
Aikawa, M., Hiraki, T. and Tamaki, M.: 2005, ‘Characteristics in concentration of chemical species in
ambient air based on three-year monitoring by filter pack method’, Water, Air, and Soil Pollution161, 335–352.
Allen, A. G., Harrison, R. M. and Erisman, J. W.: 1989, ‘Field measurements of the dissociation of
ammonium nitrate and ammonium chloride aerosols’, Atmospheric Environment 23, 1591–1599.
Genfa, Z., Dasgupta, P. K. and Dong, S.: 1989, ‘Measurement of atmospheric ammonia’, Environ-mental Science and Technology 23, 1467–1474.
Hayashida-Amano, S., Sasano, Y. and Iikura, Y.: 1991, ‘Volcanic disturbances in the strato-
spheric aerosol layer over Tsukuba, Japan, observed by the National Institute for Environmen-
tal Studies Lidar from 1982 through 1986’, Journal of Geophysical Research 96, 15, 469–15,
478.
Ito, H., Ohizumi, T., Matsuda, K., Usui, S.: 2005, ‘Evaluation of FP method on aerosol monitoring’,
Proceedings of the 46rd Annual Meeting of the Japan Society for Atmospheric Environment, 243.
(In Japanese)
Karakas, D. and Tuncel, S. G.: 1997, ‘Optimization and field application of a filter pack system for
the simultaneous sampling of atmospheric HNO3, NH3 and SO2’, Atmospheric Environment 31,
1657–1666.
Kim, Y. K., Lee, H. W., Park, J. K. and Moon, Y. S.: 2002, ‘The stratosphere-troposphere exchange
of ozone and aerosols over Korea’, Atmospheric Environment 36, 449–463.
Matsuda, K., Shimotori, M., Fukuzaki, N., Yamamoto, M., Hiraki, T., Aikawa, M., Taguchi, K.: 2002,
‘Study on methodology of dry deposition monitoring-Present situation and problem of comparison
study between denuder and filter pack-’, Proceedings of the 43rd Annual Meeting of the JapanSociety for Atmospheric Environment, 512. (in Japanese)
Matsumoto, M. and Okita, T.: 1998, ‘Long term measurements of atmospheric gaseous and aerosol
species using an annular denuder system in Nara, Japan’, Atmospheric Environment 32, 1419–
1425.

FIELD SURVEY OF TRANS-BOUNDARY AIR POLLUTION 79
Misselbrook, T. H., Van Der Weerden, T. J., Pain, B. F., Jarvis, S. C., Chambers, B. J., Smith, K. A.,
Phillips, V. R. and Demmers, T. G. M.: 2000, ‘Ammonia emission factors for UK agriculture’,
Atmospheric Environment 34, 871–880.
Murano, K., Mukai, H., Hatakeyama, S., Oishi, O., Utsunomiya, A. and Shimohara, T.: 1998, ‘Wet
deposition of ammonium and atmospheric distribution of ammonia and particulate ammonium in
Japan’, Environmental Pollution 102, S1, 321–326.
Ohizumi, T., Fukuzaki, N. and Kusakabe, M.: 1997, ‘Sulfur isotopic view on the sources of sulfur
in atmospheric fallout along the coast of the Sea of Japan’, Atmospheric Environment, 31, 1339–
1348.
Parmar, R. S., Satsangi, G. S., Lakhani, A., Srivastava, S. S. and Prakash, S.: 2001, ‘Simultaneous
measurements of ammonia and nitric acid in ambient air at Agra (27◦10’N and 78◦05’E) (India)’,
Atmospheric Environment 35, 5979–5988.
Sickles, J. E. II, Hodson, L. L. and Vorburger, L. M.: 1999, ‘Evaluation of the filter pack for long-
duration sampling of ambient air’, Atmospheric Environment 33, 2187–2202.
Stelson, A. W. and Seinfeld, J. H.: 1982a, ‘Relative humidity and temperature dependence of the
ammonium nitrate dissociation constant’, Atmospheric Environment 16, 983–992.
Stelson, A. W. and Seinfeld, J. H.: 1982b, ‘Thermodynamic prediction of the water activity, NH4NO3
dissociation constant, density and refractive index for the NH4NO3-(NH4)2SO4-H2O system at
25◦C’, Atmospheric Environment 16, 2507–2514.
Streets, D. G., Bond, T. C., Carmichael, G. R., Fernandes, S. D., Fu, Q., He, D., Klimont, Z., Nelson,
S. M., Tsai, N. Y., Wang, M. Q., Woo, J.-H. and Yarber, K. F.: 2003, ‘An inventory of gaseous and
primary aerosol emissions in Asia in the year 2000’, Journal of Geophysical Research 108(D22),
8856.
Uno, I., Jang, E.-S., Shimohara, T., Oishi, O., Utsunomiya, A., Hatakeyama, S., Tang, X.-Y., Kim,
Y.-P. and Murano, K.: 2000, ‘Wintertime intermittent transboundary air pollution over East Asia
simulated by a long-range transport model’, Global Environmental Research 4, 3–12.
Uno, I., Garmichael, G. R., Streets, D. G., Tang, Y., Yienger, J. J., Satake, S., Wang, Z., Woo,
J.-H., Guttikunda, S., Uematsu, M., Matsumoto, K., Tanimoto, H., Yoshioka, K. and Iida, T.:
2003, ‘Regional chemical weather forecasting system CFORS: Model description and analysis
of surface observations at Japanese island stations during the ACE-Asia experiment’, Journal ofGeophysical Research 108, DOI 10.1029/2002JD002845.
Copyright © 2022 FDOKUMEN