Fibroblast growth factor-1 is a mesenchymal stromal cell-secreted factor stimulating proliferation...
12
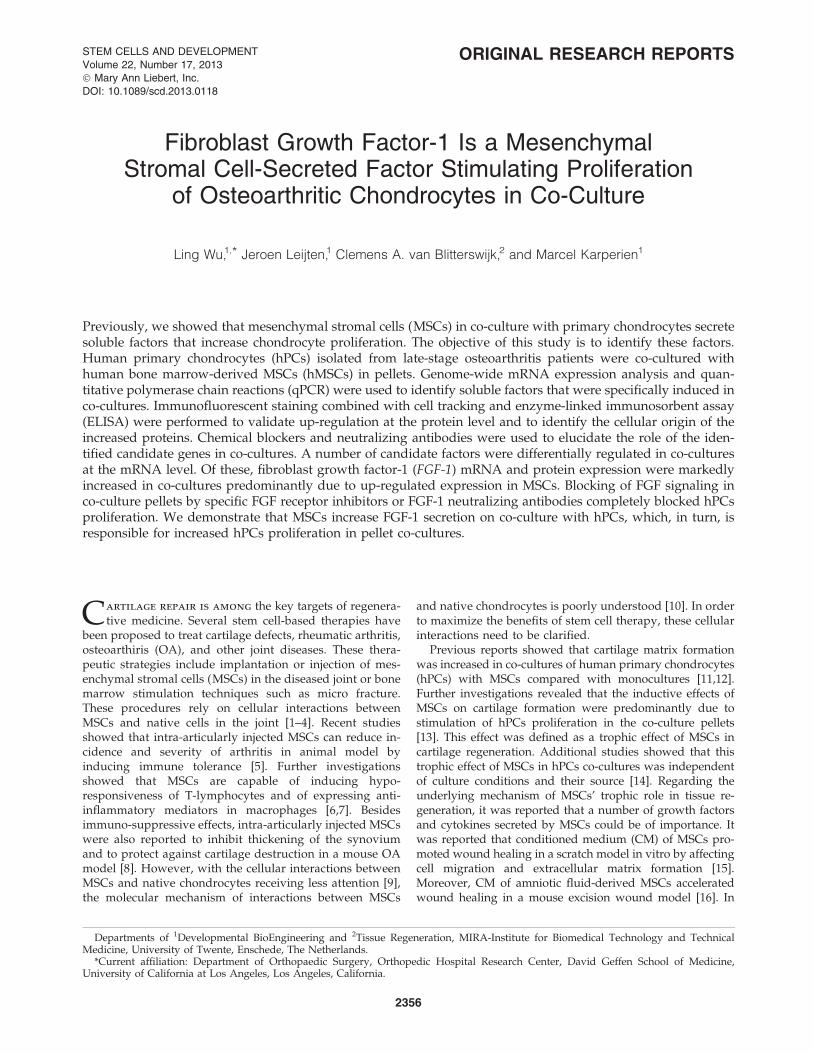
ORIGINAL RESEARCH REPORTS Fibroblast Growth Factor-1 Is a Mesenchymal Stromal Cell-Secreted Factor Stimulating Proliferation of Osteoarthritic Chondrocytes in Co-Culture Ling Wu, 1, * Jeroen Leijten, 1 Clemens A. van Blitterswijk, 2 and Marcel Karperien 1 Previously, we showed that mesenchymal stromal cells (MSCs) in co-culture with primary chondrocytes secrete soluble factors that increase chondrocyte proliferation. The objective of this study is to identify these factors. Human primary chondrocytes (hPCs) isolated from late-stage osteoarthritis patients were co-cultured with human bone marrow-derived MSCs (hMSCs) in pellets. Genome-wide mRNA expression analysis and quan- titative polymerase chain reactions (qPCR) were used to identify soluble factors that were specifically induced in co-cultures. Immunofluorescent staining combined with cell tracking and enzyme-linked immunosorbent assay (ELISA) were performed to validate up-regulation at the protein level and to identify the cellular origin of the increased proteins. Chemical blockers and neutralizing antibodies were used to elucidate the role of the iden- tified candidate genes in co-cultures. A number of candidate factors were differentially regulated in co-cultures at the mRNA level. Of these, fibroblast growth factor-1 (FGF-1) mRNA and protein expression were markedly increased in co-cultures predominantly due to up-regulated expression in MSCs. Blocking of FGF signaling in co-culture pellets by specific FGF receptor inhibitors or FGF-1 neutralizing antibodies completely blocked hPCs proliferation. We demonstrate that MSCs increase FGF-1 secretion on co-culture with hPCs, which, in turn, is responsible for increased hPCs proliferation in pellet co-cultures. C artilage repair is among the key targets of regenera- tive medicine. Several stem cell-based therapies have been proposed to treat cartilage defects, rheumatic arthritis, osteoarthiris (OA), and other joint diseases. These thera- peutic strategies include implantation or injection of mes- enchymal stromal cells (MSCs) in the diseased joint or bone marrow stimulation techniques such as micro fracture. These procedures rely on cellular interactions between MSCs and native cells in the joint [1–4]. Recent studies showed that intra-articularly injected MSCs can reduce in- cidence and severity of arthritis in animal model by inducing immune tolerance [5]. Further investigations showed that MSCs are capable of inducing hypo- responsiveness of T-lymphocytes and of expressing anti- inflammatory mediators in macrophages [6,7]. Besides immuno-suppressive effects, intra-articularly injected MSCs were also reported to inhibit thickening of the synovium and to protect against cartilage destruction in a mouse OA model [8]. However, with the cellular interactions between MSCs and native chondrocytes receiving less attention [9], the molecular mechanism of interactions between MSCs and native chondrocytes is poorly understood [10]. In order to maximize the benefits of stem cell therapy, these cellular interactions need to be clarified. Previous reports showed that cartilage matrix formation was increased in co-cultures of human primary chondrocytes (hPCs) with MSCs compared with monocultures [11,12]. Further investigations revealed that the inductive effects of MSCs on cartilage formation were predominantly due to stimulation of hPCs proliferation in the co-culture pellets [13]. This effect was defined as a trophic effect of MSCs in cartilage regeneration. Additional studies showed that this trophic effect of MSCs in hPCs co-cultures was independent of culture conditions and their source [14]. Regarding the underlying mechanism of MSCs’ trophic role in tissue re- generation, it was reported that a number of growth factors and cytokines secreted by MSCs could be of importance. It was reported that conditioned medium (CM) of MSCs pro- moted wound healing in a scratch model in vitro by affecting cell migration and extracellular matrix formation [15]. Moreover, CM of amniotic fluid-derived MSCs accelerated wound healing in a mouse excision wound model [16]. In Departments of 1 Developmental BioEngineering and 2 Tissue Regeneration, MIRA-Institute for Biomedical Technology and Technical Medicine, University of Twente, Enschede, The Netherlands. *Current affiliation: Department of Orthopaedic Surgery, Orthopedic Hospital Research Center, David Geffen School of Medicine, University of California at Los Angeles, Los Angeles, California. STEM CELLS AND DEVELOPMENT Volume 22, Number 17, 2013 ȑ Mary Ann Liebert, Inc. DOI: 10.1089/scd.2013.0118 2356
-
Upload
independent -
Category
Documents
-
view
0 -
download
0
Transcript of Fibroblast growth factor-1 is a mesenchymal stromal cell-secreted factor stimulating proliferation...
ORIGINAL RESEARCH REPORTS
Fibroblast Growth Factor-1 Is a MesenchymalStromal Cell-Secreted Factor Stimulating Proliferation
of Osteoarthritic Chondrocytes in Co-Culture
Ling Wu,1,* Jeroen Leijten,1 Clemens A. van Blitterswijk,2 and Marcel Karperien1
Previously, we showed that mesenchymal stromal cells (MSCs) in co-culture with primary chondrocytes secretesoluble factors that increase chondrocyte proliferation. The objective of this study is to identify these factors.Human primary chondrocytes (hPCs) isolated from late-stage osteoarthritis patients were co-cultured withhuman bone marrow-derived MSCs (hMSCs) in pellets. Genome-wide mRNA expression analysis and quan-titative polymerase chain reactions (qPCR) were used to identify soluble factors that were specifically induced inco-cultures. Immunofluorescent staining combined with cell tracking and enzyme-linked immunosorbent assay(ELISA) were performed to validate up-regulation at the protein level and to identify the cellular origin of theincreased proteins. Chemical blockers and neutralizing antibodies were used to elucidate the role of the iden-tified candidate genes in co-cultures. A number of candidate factors were differentially regulated in co-culturesat the mRNA level. Of these, fibroblast growth factor-1 (FGF-1) mRNA and protein expression were markedlyincreased in co-cultures predominantly due to up-regulated expression in MSCs. Blocking of FGF signaling inco-culture pellets by specific FGF receptor inhibitors or FGF-1 neutralizing antibodies completely blocked hPCsproliferation. We demonstrate that MSCs increase FGF-1 secretion on co-culture with hPCs, which, in turn, isresponsible for increased hPCs proliferation in pellet co-cultures.
Cartilage repair is among the key targets of regenera-tive medicine. Several stem cell-based therapies have
been proposed to treat cartilage defects, rheumatic arthritis,osteoarthiris (OA), and other joint diseases. These thera-peutic strategies include implantation or injection of mes-enchymal stromal cells (MSCs) in the diseased joint or bonemarrow stimulation techniques such as micro fracture.These procedures rely on cellular interactions betweenMSCs and native cells in the joint [1–4]. Recent studiesshowed that intra-articularly injected MSCs can reduce in-cidence and severity of arthritis in animal model byinducing immune tolerance [5]. Further investigationsshowed that MSCs are capable of inducing hypo-responsiveness of T-lymphocytes and of expressing anti-inflammatory mediators in macrophages [6,7]. Besidesimmuno-suppressive effects, intra-articularly injected MSCswere also reported to inhibit thickening of the synoviumand to protect against cartilage destruction in a mouse OAmodel [8]. However, with the cellular interactions betweenMSCs and native chondrocytes receiving less attention [9],the molecular mechanism of interactions between MSCs
and native chondrocytes is poorly understood [10]. In orderto maximize the benefits of stem cell therapy, these cellularinteractions need to be clarified.
Previous reports showed that cartilage matrix formationwas increased in co-cultures of human primary chondrocytes(hPCs) with MSCs compared with monocultures [11,12].Further investigations revealed that the inductive effects ofMSCs on cartilage formation were predominantly due tostimulation of hPCs proliferation in the co-culture pellets[13]. This effect was defined as a trophic effect of MSCs incartilage regeneration. Additional studies showed that thistrophic effect of MSCs in hPCs co-cultures was independentof culture conditions and their source [14]. Regarding theunderlying mechanism of MSCs’ trophic role in tissue re-generation, it was reported that a number of growth factorsand cytokines secreted by MSCs could be of importance. Itwas reported that conditioned medium (CM) of MSCs pro-moted wound healing in a scratch model in vitro by affectingcell migration and extracellular matrix formation [15].Moreover, CM of amniotic fluid-derived MSCs acceleratedwound healing in a mouse excision wound model [16]. In
Departments of 1Developmental BioEngineering and 2Tissue Regeneration, MIRA-Institute for Biomedical Technology and TechnicalMedicine, University of Twente, Enschede, The Netherlands.
*Current affiliation: Department of Orthopaedic Surgery, Orthopedic Hospital Research Center, David Geffen School of Medicine,University of California at Los Angeles, Los Angeles, California.
STEM CELLS AND DEVELOPMENT
Volume 22, Number 17, 2013
� Mary Ann Liebert, Inc.
DOI: 10.1089/scd.2013.0118
2356
our own study, pellets of bovine chondrocytes cultured inMSCs conditioned proliferation medium showed a higherproliferation rate than cells cultured in non-CM [13].Nevertheless, publications pinpointing the trophic role to aspecific factor are scarce [17,18].
In this study, we used microarray experiments to inves-tigate the differentially expressed genes in co-culture (MSCsand hPCs) and mono-culture pellets (MSCs or hPCs sepa-rately). A number of secreted factors were found to beup-regulated in co-culture pellets. Further studies identifiedfibroblast growth factor-1 (FGF-1) as a prime candidate foran MSC secreted factor that promotes the proliferation ofhPCs in co-cultures of MSCs and hPCs.
Materials and Methods
Cell culture and expansion
The use of human material has been approved by a localMedical Ethics Committee. Macroscopically healthy lookingcartilage was obtained from knee or hip biopsies of patientswith end-stage osteoarthritis who were undergoing totalknee or hip replacement. HPCs were isolated as previouslydescribed [19]. In short, cartilage was digested for 20–22 h incollagenase type II (0.15% Worthington) in DMEM supple-mented with penicillin (100 U/mL) and streptomycin(100 mg/mL). hPCs were then cultured in chondrocyte pro-liferation medium (DMEM supplemented with 10% FBS,1· nonessential amino acids, 0.2 mM Ascorbic acid 2-phosphate, 0.4 mM proline, 100 U/mL penicillin, and100 mg/mL streptomycin). Bovine primary chondrocytes(bPCs) were isolated from full-thickness cartilage of kneebiopsies from cows of *6 months old with the same protocolas hPCs. Bone marrow MSCs were separated from humanbone marrow aspirates as previously described [20]. Briefly,aspirates (100 mL) were mixed with 900 mL of red cell lysingbuffer for 5–10 min on ice. The mononuclear cell fraction wascounted. Cells were plated at a density of 50,000/cm2 in aculture flask in MSC proliferation medium (a-MEM, sup-plemented with 10% fetal bovine serum, 1% L-glutamin,0.2 mM ascorbic acid, 100 U/mL penicillin, 10 mg/mL strep-tomycin, and 1 ng/mL bFGF), plus 1% heparin. Medium wasrefreshed every 3–4 days until confluence. All reagents usedfor cell culture were purchased from Gibco, Invitrogen, un-less otherwise stated. Common chemicals were purchasedfrom Sigma-Aldrich.
Cell tracking with organic fluorescent dyes
The organic fluorescent dye, CM-DiI (Molecular Probes)was used for cell tracking in co-cultures. HPCs were labeledaccording to the manufacturer’s protocol. HPCs applied inco-culture experiments are shown as red cells.
Co-culture of hPCs and hMSCs
For co-culture of hPCs or bPCs and hMSCs, 40,000 chon-drocytes and 160,000 hMSC (ratio of PC:hMSCs = 1:4) wereseeded in one well of a round bottom ultralow attachment ofa 96-well plate in chondrocyte proliferation medium andcentrifuged for 3 min at 2,000 rpm. Medium was refreshedtwice a week. Cell pellets were cultured for 2 days beforeRNA isolation and 5-ethynyl-2¢-deoxyuridine (EdU) staining.
EdU labeling and staining
Cell proliferation in pellets was examined with the Click-iT� EdU Imaging Kit (Molecular Probes). Cell pellets werecultured in chondrocyte proliferation medium. EdU wasadded to the culture media at a concentration of 10 mM, 24 hbefore harvesting the samples. Cell pellets were then washedwith PBS and fixed with 10% formalin for 15 min. Sampleswere embedded in cryomatrix, and cut into 10mm sectionswith a cryotome (Shandon). Sections were permeabilizedand stained for EdU with Alexa 488 cocktail. Nuclei werecounterstained with Hoechst 33342.
RNA isolation and quantitative PCR
Gene expression analysis was performed as describedearlier [21]. RNA samples were isolated with the Nucleo-Spin� RNA II Kit (Macherey-Nagel). For quantitative poly-merase chain reactions (qPCR), 1 mg of total RNA wasreverse transcribed into cDNA using the iScript cDNASynthesis kit (Bio-Rad). qPCR was performed on cDNAsamples by using the iQ SYBR Green Supermix (Bio-Rad).PCR reactions were carried out on MyiQ2 Two-Color Real-Time PCR Detection System (Bio-Rad). For each reaction, amelting curve was generated to test primer dimer formationand nonspecific priming. The primers for real-time PCR arelisted in Supplementary Tables S1 and S2 (SupplementaryData are available online at www.liebertpub.com/scd). Re-lative expression was calculated using the double delta Ctmethod. GAPDH was used for normalization.
Microarray processing and statistical analysis
For a microarray study, equal number of cells from threehPCs donors was pooled. The pooled cells were used in pelletmonocultures (n = 3) and in co-cultures with three distinct do-nors of hMSCs. RNA was also isolated from the three MSCdonors cultured in pellets individually. RNA samples wereprepared as previously described. NuGEN Ovation PicoSLWTA System kit followed by Encore BiotinIL module was usedto generate biotinylated sscDNA starting from 50 ng total RNA.750 ng of the obtained samples was hybridized onto IlluminaHumanHT-12 v4 Expression BeadChips. Samples were scan-ned using the Illumina iScan array scanner. Gene expressionprofiling was performed using Illumina’s Genomestudio v.2010.3 software with the default settings advised by Illumina.The raw fluorescence intensity values were normalized by ap-plying quantile normalization. Differential gene expression wasanalyzed using the commercial software package Genespring,version 11.5.1. (Agilent Technologies). Genes with at least atwenty-percent difference between observed and expectedvalues were selected and tested for significance using a one-wayanalysis of variance (ANOVA) with a Benjamini–HochbergFDR correction and Tukey honestly significant difference(HSD) post hoc test using a cut-off rate of P £ 0.05. The expectedvalue of gene expression was defined as 80% of the expressionof the gene in monoculture pellets of hMSCs added to 20% of theexpression of the gene in monoculture pellets of hPC, both ofwhich were determined by microarray analysis assumingthat gene expression was not influenced by the co-culture. Theobserved values of gene expression reflected the actually ex-pression level of one gene measured in the microarray experi-ment (Supplementary Fig. S1). Changes in gene expression in
MSC SECRETED FGF-1 INCREASES CELL PROLIFERATION 2357
annotated canonical pathways and bio-functions were visual-ized using ingenuity pathway analysis software (IngenuitySystems). Search Tool for the Retrieval of Interacting Genes/Proteins (STRING) was used to investigate the predicted in-teraction network [22]. Clusters were formed using a k-meansclustering algorithm.
Immunofluorescent staining
At day 2 after seeding, co-culture pellets were harvestedfor immunofluorescent staining. Cryo-sections from cellpellets were prepared as previously described. Sections werepermeabilized and blocked in PBS containing 0.5% Triton-X100 and 0.5% bovine serum albumin for 15 min at roomtemperature. Slides were subsequently incubated overnightat 4�C with a goat polyclonal antibody against FGF-1 (R&DSystem). Subsequently, slides were washed and incubatedwith a secondary antibody conjugated to Alexa 488 (Mole-cular Probes), and nuclei were counterstained with 4,6-dia-midino-2-phenylindole (DAPI; Molecular Probes).
Image acquisition and analysis
All fluorescent images were taken with a BD pathway 435confocal microscope (BD Biosciences). Separated imageswere captured at the green channel (Alexa 488), red channel(DiI), and blue channel (Hoechst 33342). ImageJ software [23]was used for cell counting. Briefly, a threshold was set toavoid artifacts manually. Then, numbers of green cells, redcells, green + red cells, and total cells were counted by run-ning plug-ins written with macro language (available onrequest). Values represent the mean – standard error of atleast three biological replicates.
Collection of CM
CM was collected by incubating chondrocyte proliferationmedium with pellets of mono-cultures (hMSCs or hPCs) orco-cultures. Concentrations of FGF-1 in such media were mea-sured without any treatment. CM was also obtained by incu-bating DMEM with hMSCs cultured in the monolayer at 90%confluency for 48 h. CM was then passed through a 0.22 mmfilter and stored at - 20�C. On usage, CM was thawed, put inAmicon Ultra-15 Centrifugal Filter Units (Millipore) with a cut-off value of 3,000 dalton Nominal Molecular-Weight Limit, andcentrifuged at 4,000 g for 40 min. The concentrated solute (stillnamed CM) was first applied to enzyme-linked immunosor-bent assay (ELISA) to a test concentration of FGF-1; then, it wasused to supplement chondrocyte proliferation medium con-taining FBS and used to culture hPCs pellets.
ELISA assay
The concentrations of human FGF-1 in the CM of co-cultureor mono-culture pellets or hMSC 2D cultures were determinedby a human FGF-1 ELISA kit (R&D system). Absorbance wasmeasured on a plate reader at a wavelength of 450 and 550 nm.The 450 nm values were subtracted by the 550 nm valuesfor correction of the optical imperfections in the microplates.
Statistical analysis
Differences between culture conditions of MSCs and hPCswere examined for statistical significance with one-way
ANOVA followed by Tukey HSD Test. Comparisons be-tween hMSCs and hPCs in the same conditions were madeby using the Student’s t-test. P values of < 0.05 were consid-ered significant.
Results
Co-culture enhances proliferation of hPCs isolatedfrom late-stage OA patients
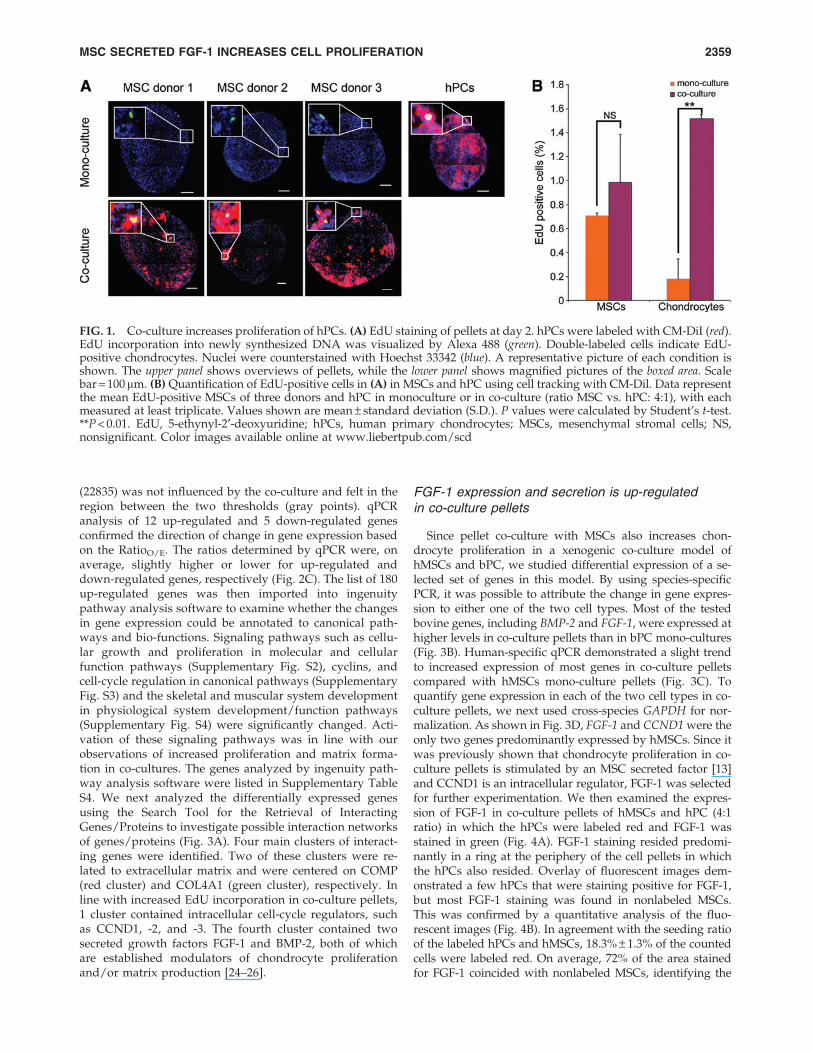
Previously, we reported that proliferation of chondrocyteswas enhanced in a xenogenic co-culture system of bovinechondrocytes and hMSCs [13]. In this study, we examined theproliferation of hPCs in a fully human co-culture system withhPCs isolated from osteoarthritic knee or hip joints. Since thebPC proliferated mostly at day 2 after establishing the co-culture, we analyzed proliferation in fully human co-culturepellets at day 2 by measuring EdU incorporation. To distin-guish hMSCs from hPC, the latter cells were labeled with themembrane-bound fluorescent tracer CM-DiI (red). As shownin Fig. 1A, EdU-positive cells were predominantly found atthe periphery of the cell pellets in which the red labeled hPCsresided. The percentage of EdU-positive hPCs and EdU-positive hMSCs in the co-cultures was determined. Ourresults showed that co-culture significantly stimulated EdUincorporation in hPCs (P < 0.01) but not in hMSCs (Fig. 1B).
Microarray study identifies a group of genesregulated by the interactions between MSCsand hPCs
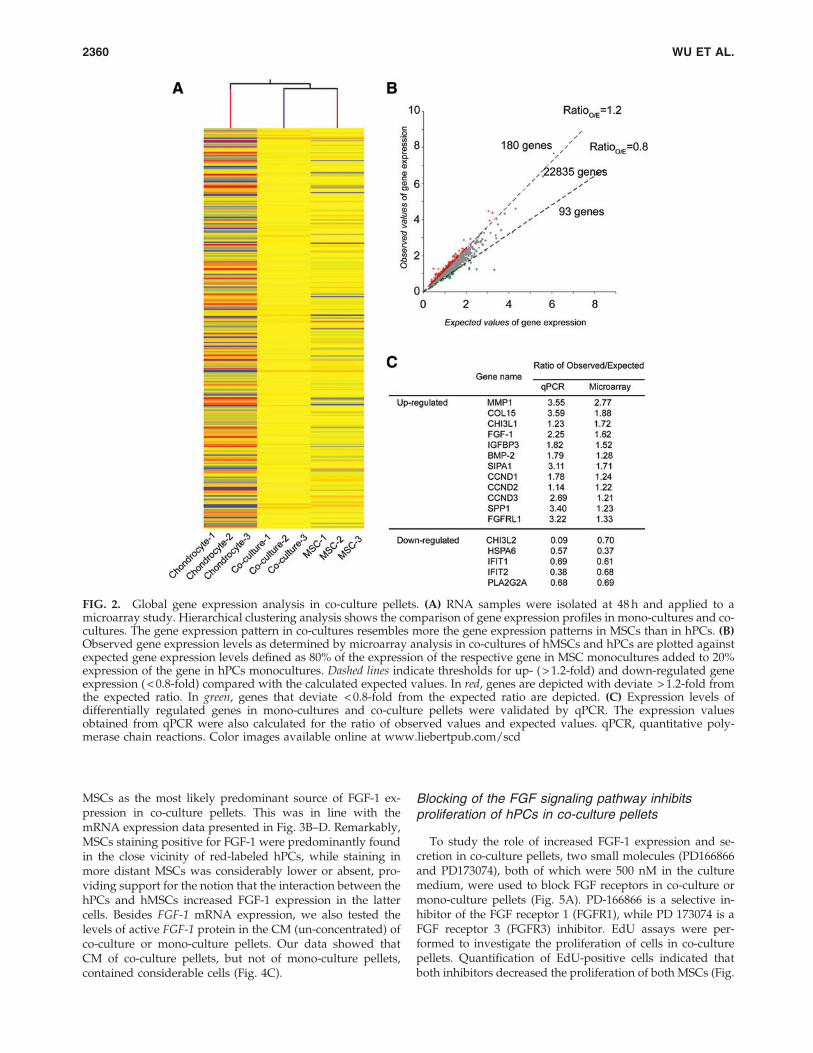
Since after 48 h in co-culture, hPCs proliferation wasstrongly increased we chose this time point for microarrayanalysis to identify genes that are regulated by the interac-tion between MSCs and hPC. In addition, based on ourprevious data [13], the beneficial effects of co-culture couldbe very well shown at a ratio of 4:1 (MSC:hPCs). Total RNAwas isolated from three independent experiments, each withthree experimental conditions: monoculture pellet of MSCs,co-culture pellet of MSCs and hPCs (ratio 4:1), and mono-culture pellets of hPC. Each RNA sample was hybridized to(Illumina HumanHT-12 v4 Expression BeadChips). Afterdata normalization, the ratio between observed gene ex-pression as determined by the microarray experiment andexpected values of gene expression was calculated (Supple-mentary Fig. S1) and significantly changed genes (P £ 0.05,after one-way ANOVA with a Benjamini–Hochberg FDRcorrection and Tukey HSD post hoc test), deviating morethan 20% from the expected value that had been selected.Hierarchical cluster analysis using the significantly changedgenes showed a higher degree of similarity in gene expres-sion profile with hMSC mono-culture pellets than with hPCsmono-culture pellets (Fig. 2A). Figure 2B shows a globalcomparison between observed values and expected valuesof each gene analyzed in the microarray experiment inco-culture pellets. Using a threshold for up-regulated genesof RatioO/E > 1.2 and a threshold for down-regulated genes ofRatioO/E < 0.8, the expression of 180 genes was positivelyregulated by co-culture, while the expression of 93 genes wasnegatively regulated by co-culture, respectively (Fig. 2A andSupplementary Table S3 for a full list of these differentiallyregulated genes). The expression of the majority of genes
2358 WU ET AL.
(22835) was not influenced by the co-culture and felt in theregion between the two thresholds (gray points). qPCRanalysis of 12 up-regulated and 5 down-regulated genesconfirmed the direction of change in gene expression basedon the RatioO/E. The ratios determined by qPCR were, onaverage, slightly higher or lower for up-regulated anddown-regulated genes, respectively (Fig. 2C). The list of 180up-regulated genes was then imported into ingenuitypathway analysis software to examine whether the changesin gene expression could be annotated to canonical path-ways and bio-functions. Signaling pathways such as cellu-lar growth and proliferation in molecular and cellularfunction pathways (Supplementary Fig. S2), cyclins, andcell-cycle regulation in canonical pathways (SupplementaryFig. S3) and the skeletal and muscular system developmentin physiological system development/function pathways(Supplementary Fig. S4) were significantly changed. Acti-vation of these signaling pathways was in line with ourobservations of increased proliferation and matrix forma-tion in co-cultures. The genes analyzed by ingenuity path-way analysis software were listed in Supplementary TableS4. We next analyzed the differentially expressed genesusing the Search Tool for the Retrieval of InteractingGenes/Proteins to investigate possible interaction networksof genes/proteins (Fig. 3A). Four main clusters of interact-ing genes were identified. Two of these clusters were re-lated to extracellular matrix and were centered on COMP(red cluster) and COL4A1 (green cluster), respectively. Inline with increased EdU incorporation in co-culture pellets,1 cluster contained intracellular cell-cycle regulators, suchas CCND1, -2, and -3. The fourth cluster contained twosecreted growth factors FGF-1 and BMP-2, both of whichare established modulators of chondrocyte proliferationand/or matrix production [24–26].
FGF-1 expression and secretion is up-regulatedin co-culture pellets
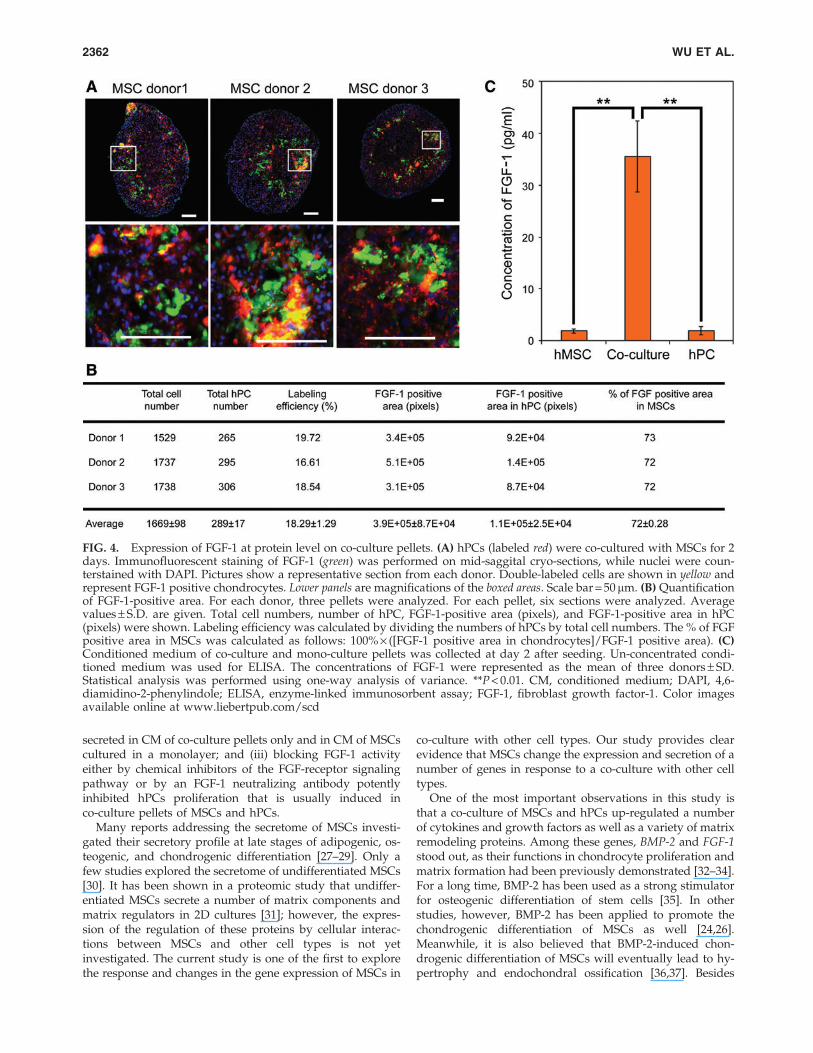
Since pellet co-culture with MSCs also increases chon-drocyte proliferation in a xenogenic co-culture model ofhMSCs and bPC, we studied differential expression of a se-lected set of genes in this model. By using species-specificPCR, it was possible to attribute the change in gene expres-sion to either one of the two cell types. Most of the testedbovine genes, including BMP-2 and FGF-1, were expressed athigher levels in co-culture pellets than in bPC mono-cultures(Fig. 3B). Human-specific qPCR demonstrated a slight trendto increased expression of most genes in co-culture pelletscompared with hMSCs mono-culture pellets (Fig. 3C). Toquantify gene expression in each of the two cell types in co-culture pellets, we next used cross-species GAPDH for nor-malization. As shown in Fig. 3D, FGF-1 and CCND1 were theonly two genes predominantly expressed by hMSCs. Since itwas previously shown that chondrocyte proliferation in co-culture pellets is stimulated by an MSC secreted factor [13]and CCND1 is an intracellular regulator, FGF-1 was selectedfor further experimentation. We then examined the expres-sion of FGF-1 in co-culture pellets of hMSCs and hPC (4:1ratio) in which the hPCs were labeled red and FGF-1 wasstained in green (Fig. 4A). FGF-1 staining resided predomi-nantly in a ring at the periphery of the cell pellets in whichthe hPCs also resided. Overlay of fluorescent images dem-onstrated a few hPCs that were staining positive for FGF-1,but most FGF-1 staining was found in nonlabeled MSCs.This was confirmed by a quantitative analysis of the fluo-rescent images (Fig. 4B). In agreement with the seeding ratioof the labeled hPCs and hMSCs, 18.3% – 1.3% of the countedcells were labeled red. On average, 72% of the area stainedfor FGF-1 coincided with nonlabeled MSCs, identifying the
FIG. 1. Co-culture increases proliferation of hPCs. (A) EdU staining of pellets at day 2. hPCs were labeled with CM-DiI (red).EdU incorporation into newly synthesized DNA was visualized by Alexa 488 (green). Double-labeled cells indicate EdU-positive chondrocytes. Nuclei were counterstained with Hoechst 33342 (blue). A representative picture of each condition isshown. The upper panel shows overviews of pellets, while the lower panel shows magnified pictures of the boxed area. Scalebar = 100mm. (B) Quantification of EdU-positive cells in (A) in MSCs and hPC using cell tracking with CM-Dil. Data representthe mean EdU-positive MSCs of three donors and hPC in monoculture or in co-culture (ratio MSC vs. hPC: 4:1), with eachmeasured at least triplicate. Values shown are mean – standard deviation (S.D.). P values were calculated by Student’s t-test.**P < 0.01. EdU, 5-ethynyl-2¢-deoxyuridine; hPCs, human primary chondrocytes; MSCs, mesenchymal stromal cells; NS,nonsignificant. Color images available online at www.liebertpub.com/scd
MSC SECRETED FGF-1 INCREASES CELL PROLIFERATION 2359
MSCs as the most likely predominant source of FGF-1 ex-pression in co-culture pellets. This was in line with themRNA expression data presented in Fig. 3B–D. Remarkably,MSCs staining positive for FGF-1 were predominantly foundin the close vicinity of red-labeled hPCs, while staining inmore distant MSCs was considerably lower or absent, pro-viding support for the notion that the interaction between thehPCs and hMSCs increased FGF-1 expression in the lattercells. Besides FGF-1 mRNA expression, we also tested thelevels of active FGF-1 protein in the CM (un-concentrated) ofco-culture or mono-culture pellets. Our data showed thatCM of co-culture pellets, but not of mono-culture pellets,contained considerable cells (Fig. 4C).
Blocking of the FGF signaling pathway inhibitsproliferation of hPCs in co-culture pellets
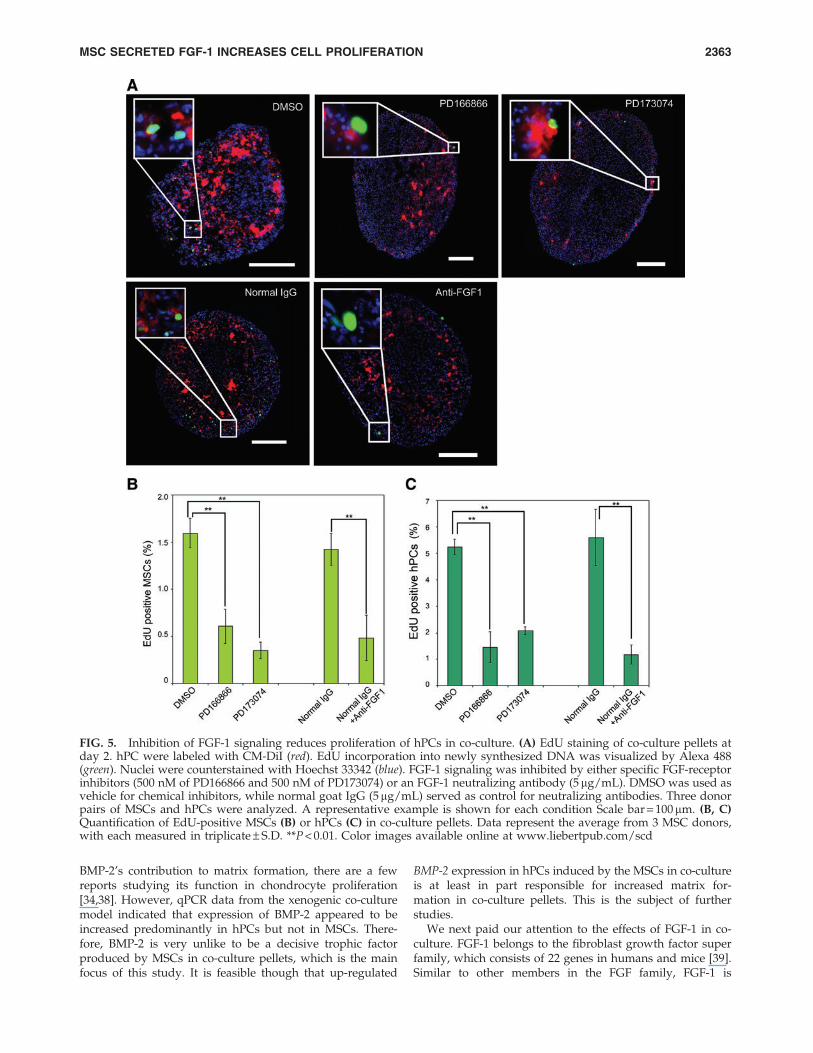
To study the role of increased FGF-1 expression and se-cretion in co-culture pellets, two small molecules (PD166866and PD173074), both of which were 500 nM in the culturemedium, were used to block FGF receptors in co-culture ormono-culture pellets (Fig. 5A). PD-166866 is a selective in-hibitor of the FGF receptor 1 (FGFR1), while PD 173074 is aFGF receptor 3 (FGFR3) inhibitor. EdU assays were per-formed to investigate the proliferation of cells in co-culturepellets. Quantification of EdU-positive cells indicated thatboth inhibitors decreased the proliferation of both MSCs (Fig.
FIG. 2. Global gene expression analysis in co-culture pellets. (A) RNA samples were isolated at 48 h and applied to amicroarray study. Hierarchical clustering analysis shows the comparison of gene expression profiles in mono-cultures and co-cultures. The gene expression pattern in co-cultures resembles more the gene expression patterns in MSCs than in hPCs. (B)Observed gene expression levels as determined by microarray analysis in co-cultures of hMSCs and hPCs are plotted againstexpected gene expression levels defined as 80% of the expression of the respective gene in MSC monocultures added to 20%expression of the gene in hPCs monocultures. Dashed lines indicate thresholds for up- ( > 1.2-fold) and down-regulated geneexpression ( < 0.8-fold) compared with the calculated expected values. In red, genes are depicted with deviate > 1.2-fold fromthe expected ratio. In green, genes that deviate < 0.8-fold from the expected ratio are depicted. (C) Expression levels ofdifferentially regulated genes in mono-cultures and co-culture pellets were validated by qPCR. The expression valuesobtained from qPCR were also calculated for the ratio of observed values and expected values. qPCR, quantitative poly-merase chain reactions. Color images available online at www.liebertpub.com/scd
2360 WU ET AL.

5B) and hPCs in co-culture pellets and nullified the increasedhPCs proliferation usually found in co-culture pellets (Fig.5C). To analyze the role of FGF-1 more specifically, a neu-tralizing antibody was used to block FGF-1 activity. FGF-1neutralizing antibodies significantly reduced proliferation ofhMSCs (Fig. 5B) and hPC (Fig. 5C) also in co-culture pellets.
FGF-1 in MSC CM induces hPCs proliferation
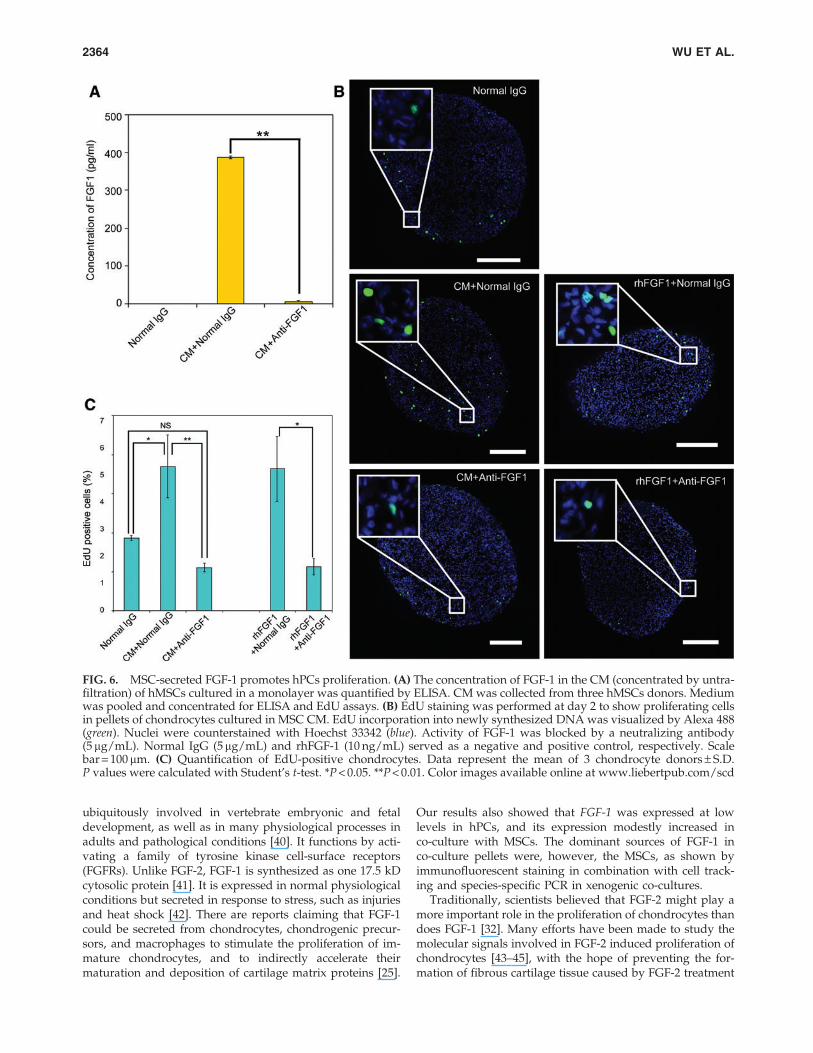
Previously, we reported that secreted factors from CM ofMSCs cultured in a monolayer increased the proliferation ofhPCs in pellet culture. The amount of FGF-1 contained in CM(concentrated by ultra-filtration) was determined by ELISA(Fig. 6A). The neutralizing antibody can be effectively usedto block the activity of FGF-1. Then, we performed an EdUassay to test whether FGF-1 contributed to hPCs prolifera-tion. As shown in Fig.6B and C, pellets of hPCs cultured for 2days in hMSCs CM (CM + Normal IgG) showed more EdUincorporation than pellets cultured in nonconditioned pro-liferation medium (Normal IgG), which is in line with pre-vious observations [13]. Increased hPCs proliferation was
reversed by adding anti-FGF-1 to the CM. HPCs pelletscultured in proliferation medium containing human recom-binant FGF-1 (10 ng/mL rhFGF-1 + Normal IgG) and me-dium containing both rhFGF-1 (10 ng/mL) and anti-FGF-1(rhFGF-1 + anti-FGF-1) served as controls to verify the posi-tive effects of FGF-1 on the proliferation of hPCs and theneutralizing activity of the anti-FGF-1 antibody.
Discussion
Previously, we have shown that co-culture of MSCs andPC in pellets augmented cartilage matrix formation. Thiseffect was attributed to a trophic effect of the MSCs on thechondrocytes rather than the differentiation of MSCs intochondrocytes. Furthermore, we showed that in these co-cultures, MSC secreted factors that potently induced chon-drocyte proliferation [13]. In this study, we have identifiedFGF-1 as the main MSC secreted growth factor that is re-sponsible for this effect. We base this conclusion on the fol-lowing observations: (i) FGF-1 expression was up-regulatedin co-cultures predominantly in the MSCs; (ii) FGF-1 is
FIG. 3. Interaction networks of up-regulated genes and species-specific qPCR in xenogenic co-culture of bPCs and hMSCs.(A) The predicted interaction networks of the 180 up-regulated genes/proteins were shown. (B) 80% of human MSCs and20% bovine chondrocytes were co-cultured for 2 days. RNA was then isolated. Expression of bovine genes was examined byreal-time RT-PCR using bovine specific primers that did not cross-react with human genes. Data are expressed as fold changerelative to the expression in chondrocyte monocultures and represent the mean of three independent experiments – S.D. (C)Expression of human genes was also demonstrated by real-time RT-PCR using human specific primers that did not cross-react with bovine genes. Data are expressed as fold change relative to the expression in MSC monocultures and represent themean of three independent experiments – S.D. (D) Expression levels of both bovine and human genes in co-culture pelletswere normalized to cross-species GAPDH. Human gene expression is plotted relative to the expression of the respectivebovine gene, which was set to one, and represents the mean of three independent experiments – S.D. bPCs, bovine primarychondrocytes. Color images available online at www.liebertpub.com/scd
MSC SECRETED FGF-1 INCREASES CELL PROLIFERATION 2361
secreted in CM of co-culture pellets only and in CM of MSCscultured in a monolayer; and (iii) blocking FGF-1 activityeither by chemical inhibitors of the FGF-receptor signalingpathway or by an FGF-1 neutralizing antibody potentlyinhibited hPCs proliferation that is usually induced inco-culture pellets of MSCs and hPCs.
Many reports addressing the secretome of MSCs investi-gated their secretory profile at late stages of adipogenic, os-teogenic, and chondrogenic differentiation [27–29]. Only afew studies explored the secretome of undifferentiated MSCs[30]. It has been shown in a proteomic study that undiffer-entiated MSCs secrete a number of matrix components andmatrix regulators in 2D cultures [31]; however, the expres-sion of the regulation of these proteins by cellular interac-tions between MSCs and other cell types is not yetinvestigated. The current study is one of the first to explorethe response and changes in the gene expression of MSCs in
co-culture with other cell types. Our study provides clearevidence that MSCs change the expression and secretion of anumber of genes in response to a co-culture with other celltypes.
One of the most important observations in this study isthat a co-culture of MSCs and hPCs up-regulated a numberof cytokines and growth factors as well as a variety of matrixremodeling proteins. Among these genes, BMP-2 and FGF-1stood out, as their functions in chondrocyte proliferation andmatrix formation had been previously demonstrated [32–34].For a long time, BMP-2 has been used as a strong stimulatorfor osteogenic differentiation of stem cells [35]. In otherstudies, however, BMP-2 has been applied to promote thechondrogenic differentiation of MSCs as well [24,26].Meanwhile, it is also believed that BMP-2-induced chon-drogenic differentiation of MSCs will eventually lead to hy-pertrophy and endochondral ossification [36,37]. Besides
FIG. 4. Expression of FGF-1 at protein level on co-culture pellets. (A) hPCs (labeled red) were co-cultured with MSCs for 2days. Immunofluorescent staining of FGF-1 (green) was performed on mid-saggital cryo-sections, while nuclei were coun-terstained with DAPI. Pictures show a representative section from each donor. Double-labeled cells are shown in yellow andrepresent FGF-1 positive chondrocytes. Lower panels are magnifications of the boxed areas. Scale bar = 50 mm. (B) Quantificationof FGF-1-positive area. For each donor, three pellets were analyzed. For each pellet, six sections were analyzed. Averagevalues – S.D. are given. Total cell numbers, number of hPC, FGF-1-positive area (pixels), and FGF-1-positive area in hPC(pixels) were shown. Labeling efficiency was calculated by dividing the numbers of hPCs by total cell numbers. The % of FGFpositive area in MSCs was calculated as follows: 100% · ([FGF-1 positive area in chondrocytes]/FGF-1 positive area). (C)Conditioned medium of co-culture and mono-culture pellets was collected at day 2 after seeding. Un-concentrated condi-tioned medium was used for ELISA. The concentrations of FGF-1 were represented as the mean of three donors – SD.Statistical analysis was performed using one-way analysis of variance. **P < 0.01. CM, conditioned medium; DAPI, 4,6-diamidino-2-phenylindole; ELISA, enzyme-linked immunosorbent assay; FGF-1, fibroblast growth factor-1. Color imagesavailable online at www.liebertpub.com/scd
2362 WU ET AL.
BMP-2’s contribution to matrix formation, there are a fewreports studying its function in chondrocyte proliferation[34,38]. However, qPCR data from the xenogenic co-culturemodel indicated that expression of BMP-2 appeared to beincreased predominantly in hPCs but not in MSCs. There-fore, BMP-2 is very unlike to be a decisive trophic factorproduced by MSCs in co-culture pellets, which is the mainfocus of this study. It is feasible though that up-regulated
BMP-2 expression in hPCs induced by the MSCs in co-cultureis at least in part responsible for increased matrix for-mation in co-culture pellets. This is the subject of furtherstudies.
We next paid our attention to the effects of FGF-1 in co-culture. FGF-1 belongs to the fibroblast growth factor superfamily, which consists of 22 genes in humans and mice [39].Similar to other members in the FGF family, FGF-1 is
FIG. 5. Inhibition of FGF-1 signaling reduces proliferation of hPCs in co-culture. (A) EdU staining of co-culture pellets atday 2. hPC were labeled with CM-DiI (red). EdU incorporation into newly synthesized DNA was visualized by Alexa 488(green). Nuclei were counterstained with Hoechst 33342 (blue). FGF-1 signaling was inhibited by either specific FGF-receptorinhibitors (500 nM of PD166866 and 500 nM of PD173074) or an FGF-1 neutralizing antibody (5 mg/mL). DMSO was used asvehicle for chemical inhibitors, while normal goat IgG (5mg/mL) served as control for neutralizing antibodies. Three donorpairs of MSCs and hPCs were analyzed. A representative example is shown for each condition Scale bar = 100mm. (B, C)Quantification of EdU-positive MSCs (B) or hPCs (C) in co-culture pellets. Data represent the average from 3 MSC donors,with each measured in triplicate – S.D. **P < 0.01. Color images available online at www.liebertpub.com/scd
MSC SECRETED FGF-1 INCREASES CELL PROLIFERATION 2363
ubiquitously involved in vertebrate embryonic and fetaldevelopment, as well as in many physiological processes inadults and pathological conditions [40]. It functions by acti-vating a family of tyrosine kinase cell-surface receptors(FGFRs). Unlike FGF-2, FGF-1 is synthesized as one 17.5 kDcytosolic protein [41]. It is expressed in normal physiologicalconditions but secreted in response to stress, such as injuriesand heat shock [42]. There are reports claiming that FGF-1could be secreted from chondrocytes, chondrogenic precur-sors, and macrophages to stimulate the proliferation of im-mature chondrocytes, and to indirectly accelerate theirmaturation and deposition of cartilage matrix proteins [25].
Our results also showed that FGF-1 was expressed at lowlevels in hPCs, and its expression modestly increased inco-culture with MSCs. The dominant sources of FGF-1 inco-culture pellets were, however, the MSCs, as shown byimmunofluorescent staining in combination with cell track-ing and species-specific PCR in xenogenic co-cultures.
Traditionally, scientists believed that FGF-2 might play amore important role in the proliferation of chondrocytes thandoes FGF-1 [32]. Many efforts have been made to study themolecular signals involved in FGF-2 induced proliferation ofchondrocytes [43–45], with the hope of preventing the for-mation of fibrous cartilage tissue caused by FGF-2 treatment
FIG. 6. MSC-secreted FGF-1 promotes hPCs proliferation. (A) The concentration of FGF-1 in the CM (concentrated by untra-filtration) of hMSCs cultured in a monolayer was quantified by ELISA. CM was collected from three hMSCs donors. Mediumwas pooled and concentrated for ELISA and EdU assays. (B) EdU staining was performed at day 2 to show proliferating cellsin pellets of chondrocytes cultured in MSC CM. EdU incorporation into newly synthesized DNA was visualized by Alexa 488(green). Nuclei were counterstained with Hoechst 33342 (blue). Activity of FGF-1 was blocked by a neutralizing antibody(5 mg/mL). Normal IgG (5mg/mL) and rhFGF-1 (10 ng/mL) served as a negative and positive control, respectively. Scalebar = 100 mm. (C) Quantification of EdU-positive chondrocytes. Data represent the mean of 3 chondrocyte donors – S.D.P values were calculated with Student’s t-test. *P < 0.05. **P < 0.01. Color images available online at www.liebertpub.com/scd
2364 WU ET AL.
[46,47]. Our data uncover a positive role of FGF-1 in prolif-eration of hPCs, at least in co-culture with MSCs. Our qPCRdata obtained from the xenogenic co-culture models as wellas results of immunofluorescent staining clearly showed thatthe expression of FGF-1 in the co-culture pellets is predom-inantly from MSCs. Combined with our observations thatblockade of FGF-1 activity either by inhibitors of FGFR-signaling or by a neutralizing antibody inhibited hPCsproliferation in co-culture pellets and that neutralizing anti-bodies blocked hPCs proliferation induced by MSC CM, ourstudy identifies FGF-1 as the MSC secreted factor that is re-sponsible for the stimulation of hPCs proliferation in co-cultures. Even though our data suggested a positive role ofFGF-1 in co-culture pellets, recombinant protein may not begood to replace MSCs in the co-culture system, as secretedfactors from MSCs may decrease the deposition of the car-tilaginous ECM, including GAGs and collagen type II fromarticular chondrocytes in a long-term culture [48]. Based onour previous studies, we believe that cell–cell contact be-tween MSCs and chondrocytes in the co-culture system iscrucial for maintaining chondrogenic phenotypes.
Another interesting finding in this article is the location ofthe cells expressing FGF-1 in co-culture pellets, as indicatedby immunofluorescent staining. In line with the expressionof FGF-1 at mRNA level in hPCs, some hPCs stained positivewith FGF-1 antibodies. However, staining in MSCs was moreabundant. Interestingly, the most intense FGF-1 staining wasfound in MSCs that were in close vicinity or even directcontact with hPCs. More distant MSCs without physicalcontacts with hPCs either expressed FGF-1 at a low level ordid not express FGF-1 at all. This implies that the enhance-ment of FGF-1 expression in co-culture pellets is very likelydue to an as yet unknown effect of the hPCs on the MSCs.This may either involve a secreted factor or as FGF-1 ex-pressing MSCs are invariably in close vicinity of the chon-drocytes signaling via direct cell–cell contacts. We arecurrently exploring both options. Combined with the factthat FGF-1 concentration increased dramatically in the CM ofco-culture pellets when compared with mono-cultures, wealso concluded that not only expression but also secretion ofFGF-1 is increased by the cross-talk between MSCs andhPCs. From literature, it can be deduced that both cells se-crete a wide range of growth factors, cytokines, and extra-cellular matrix components into their surroundingenvironment [31]. Some of these molecules may form afeedback loop that stimulates the expression of FGF-1. Thereare numerous examples of the regulatory effect of MSCs ininflammation. In many cases, the MSCs create a feedbackloop with other cell types to activate or inhibit signalingpathways [49]. In this study, we now expand this to mutualcross-talk between MSCs and chondrocytes.
In conclusion, our data have identified FGF-1 as an MSCsecreted factor whose expression increased on co-culturewith hPCs. Increased FGF-1 expression potently stimulatedhPCs proliferation. As far as we know, this study is one ofthe first that is dedicated to the analysis of reciprocal changesin gene expression in co-culture pellets of MSCs with othercell types. It provides clear evidence for a mutual relation-ship between MSCs and hPCs. It has been proposed that anintra-articular injection of MSCs might be a treatment optionfor osteoarthritis. This is currently under investigation inclinical trials [50]. Our study may provide insights on how
MSCs exert such beneficial effects on diseased cartilage. Inaddition, besides FGF-18, which is explored for clinical ap-plication in osteoarthritis, our study identifies FGF-1 as apotential therapeutic agent in osteoarthritis.
Acknowledgments
The authors gratefully acknowledge the financial supportof the TeRM Smart Mix Program of The Netherlands Min-istry of Economic Affairs and The Netherlands Ministry ofEducation, Culture, and Science. They are grateful to Jac-queline Plass for her technical support. They also thank IvyWang for language editing of the article.
Author Disclosure Statement
No competing financial interests exist.
References
1. Alford JW and BJ Cole. (2005). Cartilage restoration, part 1:basic science, historical perspective, patient evaluation, andtreatment options. Am J Sports Med 33:295–306.
2. Alford JW and BJ Cole. (2005). Cartilage restoration, part 2:techniques, outcomes, and future directions. Am J SportsMed 33:443–460.
3. Wakitani S, K Imoto, T Yamamoto, M Saito, N Murata andM Yoneda. (2002). Human autologous culture expandedbone marrow mesenchymal cell transplantation for repair ofcartilage defects in osteoarthritic knees. Osteoarthritis Car-tilage 10:199–206.
4. Murphy JM, DJ Fink, EB Hunziker and FP Barry. (2003).Stem cell therapy in a caprine model of osteoarthritis. Ar-thritis Rheum 48:3464–3474.
5. Gonzalez MA, E Gonzalez-Rey, L Rico, D Buscher and MDelgado. (2009). Treatment of experimental arthritis by in-ducing immune tolerance with human adipose-derivedmesenchymal stem cells. Arthritis Rheum 60:1006–1019.
6. Augello A, R Tasso, SM Negrini, R Cancedda and G Pennesi.(2007). Cell therapy using allogeneic bone marrow mesen-chymal stem cells prevents tissue damage in collagen-induced arthritis. Arthritis Rheum 56:1175–1186.
7. Nemeth K, A Leelahavanichkul, PS Yuen, B Mayer, A Par-melee, K Doi, PG Robey, K Leelahavanichkul, BH Koller,et al. (2009). Bone marrow stromal cells attenuate sepsis viaprostaglandin E(2)-dependent reprogramming of host mac-rophages to increase their interleukin-10 production. NatMed 15:42–49.
8. Ter Huurne M, R Schelbergen, R Blattes, A Blom, W deMunter, L Grevers, J Jeanson, D Noel, L Casteilla, et al.(2012). Anti-inflammatory and chondro protective effects ofintra-articular injection of adipose-derived stem cells in ex-perimental osteoarthritis. Arthritis Rheum 64:3604–3613.
9. MacDonald GI, A Augello and C De Bari. (2011). Role ofmesenchymal stem cells in reestablishing immunologic tol-erance in autoimmune rheumatic diseases. Arthritis Rheum63:2547–2557.
10. McGonagle D, C De Bari, P Arnold and E Jones. (2007).Lessons from musculoskeletal stem cell research: the key tosuccessful regenerative medicine development. ArthritisRheum 56:714–721.
11. Hendriks JAA, RL Miclea, R Schotel, E de Bruijn, L Moroni,M Karperien, J Riesle and CA van Blitterswijk. (2010). Pri-mary chondrocytes enhance cartilage tissue formation upon
MSC SECRETED FGF-1 INCREASES CELL PROLIFERATION 2365
co-culture with a range of cell types. Soft Matter 6:5080–5088.
12. Acharya C, A Adesida, P Zajac, M Mumme, J Riesle, IMartin and A Barbero. (2012). Enhanced chondrocyte pro-liferation and mesenchymal stromal cells chondrogenesis incoculture pellets mediate improved cartilage formation.J Cell Physiol 227:88–97.
13. Wu L, JC Leijten, N Georgi, JN Post, CA van Blitterswijk andM Karperien. (2011). Trophic effects of mesenchymal stemcells increase chondrocyte proliferation and matrix forma-tion. Tissue Eng Part A 17:1425–1436.
14. Wu L, HJ Prins, M Helder, C van Blitterswijk and M Kar-perien. (2012). Trophic effects of mesenchymal stem cells inchondrocyte co-cultures are independent of culture condi-tions and cell sources. Tissue Eng Part A 18:1542–1551.
15. Walter MN, KT Wright, HR Fuller, S MacNeil and WEJohnson. (2010). Mesenchymal stem cell-conditioned me-dium accelerates skin wound healing: an in vitro study offibroblast and keratinocyte scratch assays. Exp Cell Res316:1271–1281.
16. Yoon BS, JH Moon, EK Jun, J Kim, I Maeng, JS Kim, JH Lee,CS Baik, A Kim, et al. (2010). Secretory profiles and woundhealing effects of human amniotic fluid-derived mesenchy-mal stem cells. Stem Cells Dev 19:887–902.
17. Caplan AI and JE Dennis. (2006). Mesenchymal stem cells astrophic mediators. J Cell Biochem 98:1076–1084.
18. da Silva Meirelles L, AI Caplan and NB Nardi. (2008). Insearch of the in vivo identity of mesenchymal stem cells.Stem Cells 26:2287–2299.
19. Moreira Teixeira LS, J Leijten, J Sobral, R Jin, AA vanApeldoorn, J Feijen, C van Blitterswijk, PJ Dijkstra and MKarperien. (2012). High throughput generated micro-aggre-gates of chondrocytes stimulate cartilage formation in vitroand in vivo. Eur Cell Mater 23:387–399.
20. Wu L, X Cai, H Dong, W Jing, Y Huang, X Yang, Y Wu andY Lin. (2010). Serum regulates adipogenesis of mesenchymalstem cells via MEK/ERK-dependent PPARgamma expres-sion and phosphorylation. J Cell Mol Med 14:922–932.
21. Leijten JC, J Emons, C Sticht, S van Gool, E Decker, A Uit-terlinden, G Rappold, A Hofman, F Rivadeneira, et al.(2012). Gremlin 1, frizzled-related protein, and Dkk-1 arekey regulators of human articular cartilage homeostasis.Arthritis Rheum 64:3302–3312.
22. Szklarczyk D, A Franceschini, M Kuhn, M Simonovic, ARoth, P Minguez, T Doerks, M Stark, J Muller, et al. (2011).The STRING database in 2011: functional interaction net-works of proteins, globally integrated and scored. NucleicAcids Res 39:D561–D568.
23. Abramoff MD, PJ Magelhaes and SJ Ram. (2004). Imageprocessing with ImageJ. Biophotonics Int 11:36–42.
24. Kurth T, E Hedbom, N Shintani, M Sugimoto, FH Chen, MHaspl, S Martinovic and EB Hunziker. (2007). Chondrogenicpotential of human synovial mesenchymal stem cells in al-ginate. Osteoarthritis Cartilage 15:1178–1189.
25. Bolander ME. (1992). Regulation of fracture repair bygrowth factors. Proc Soc Exp Biol Med 200:165–170.
26. Noth U, L Rackwitz, A Heymer, M Weber, B Baumann, ASteinert, N Schutze, F Jakob and J Eulert. (2007). Chondro-genic differentiation of human mesenchymal stem cells incollagen type I hydrogels. J Biomed Mater Res A 83:626–635.
27. Alvarez-Llamas G, E Szalowska, MP de Vries, D Weening, KLandman, A Hoek, BH Wolffenbuttel, H Roelofsen and RJVonk. (2007). Characterization of the human visceral adi-pose tissue secretome. Mol Cell Proteomics 6:589–600.
28. Ji YH, JL Ji, FY Sun, YY Zeng, XH He, JX Zhao, Y Yu, SH Yuand W Wu. (2010). Quantitative proteomics analysis ofchondrogenic differentiation of C3H10T1/2 mesenchymalstem cells by iTRAQ labeling coupled with on-line two-dimensional LC/MS/MS. Mol Cell Proteomics 9:550–564.
29. Chiellini C, O Cochet, L Negroni, M Samson, M Poggi, GAilhaud, MC Alessi, C Dani and EZ Amri. (2008). Char-acterization of human mesenchymal stem cell secretome atearly steps of adipocyte and osteoblast differentiation. BMCMol Biol 9:26.
30. Choi YA, J Lim, KM Kim, B Acharya, JY Cho, YC Bae, HIShin, SY Kim and EK Park. (2010). Secretome analysis ofhuman BMSCs and identification of SMOC1 as an importantECM protein in osteoblast differentiation. J Proteome Res9:2946–2956.
31. Polacek M, JA Bruun, J Elvenes, Y Figenschau and I Marti-nez. (2011). The secretory profiles of cultured human artic-ular chondrocytes and mesenchymal stem cells: implicationsfor autologous cell transplantation strategies. Cell Trans-plant 20:1381–1393.
32. Ornitz DM. (2005). FGF signaling in the developing endo-chondral skeleton. Cytokine Growth Factor Rev 16:205–213.
33. Shea CM, CM Edgar, TA Einhorn and LC Gerstenfeld.(2003). BMP treatment of C3H10T1/2 mesenchymal stemcells induces both chondrogenesis and osteogenesis. J CellBiochem 90:1112–1127.
34. Shu B, M Zhang, R Xie, M Wang, H Jin, W Hou, D Tang, SEHarris, Y Mishina, et al. (2011). BMP2, but not BMP4, iscrucial for chondrocyte proliferation and maturation duringendochondral bone development. J Cell Sci 124:3428–3440.
35. Lin Y, W Tang, L Wu, W Jing, X Li, Y Wu, L Liu, J Long andW Tian. (2008). Bone regeneration by BMP-2 enhanced adi-pose stem cells loading on alginate gel. Histochem Cell Biol129:203–210.
36. Carlberg AL, B Pucci, R Rallapalli, RS Tuan and DJ Hall.(2001). Efficient chondrogenic differentiation of mesenchy-mal cells in micromass culture by retroviral gene transfer ofBMP-2. Differentiation 67:128–138.
37. Steinert AF, B Proffen, M Kunz, C Hendrich, SC Ghivizzani,U Noth, A Rethwilm, J Eulert and CH Evans. (2009). Hy-pertrophy is induced during the in vitro chondrogenic dif-ferentiation of human mesenchymal stem cells by bonemorphogenetic protein-2 and bone morphogenetic protein-4gene transfer. Arthritis Res Ther 11:R148.
38. Li X, J Peng, M Wu, H Ye, C Zheng, G Wu, H Xu, X Chenand X Liu. (2011). BMP2 promotes chondrocyte proliferationvia the Wnt/beta-catenin signaling pathway. Mol Med Re-port 4:621–626.
39. Itoh N and DM Ornitz. (2004). Evolution of the Fgf and Fgfrgene families. Trends Genet 20:563–569.
40. Bottcher RT and C Niehrs. (2005). Fibroblast growth factorsignaling during early vertebrate development. Endocr Rev26:63–77.
41. Friesel RE and T Maciag. (1995). Molecular mechanisms ofangiogenesis: fibroblast growth factor signal transduction.FASEB J 9:919–925.
42. Jackson A, S Friedman, X Zhan, KA Engleka, R Forough andT Maciag. (1992). Heat shock induces the release of fibroblastgrowth factor 1 from NIH 3T3 cells. Proc Natl Acad Sci U S A89:10691–10695.
43. Khan IM, EA Palmer and CW Archer. (2010). Fibroblastgrowth factor-2 induced chondrocyte cluster formation inexperimentally wounded articular cartilage is blocked bysoluble Jagged-1. Osteoarthritis Cartilage 18:208–219.
2366 WU ET AL.
44. Khan IM, SL Evans, RD Young, EJ Blain, AJ Quantock, NAvery and CW Archer. (2011). Fibroblast growth factor 2 andtransforming growth factor beta1 induce precocious matura-tion of articular cartilage. Arthritis Rheum 63:3417–3427.
45. Nishida T, S Kubota, E Aoyama, D Janune, A Maeda and MTakigawa. (2011). Effect of CCN2 on FGF2-induced prolif-eration and MMP9 and MMP13 productions by chon-drocytes. Endocrinology 152:4232–4241.
46. Yan D, D Chen, SM Cool, AJ van Wijnen, K Mikecz, GMurphy and HJ Im. (2011). Fibroblast growth factor receptor1 is principally responsible for fibroblast growth factor 2-induced catabolic activities in human articular chondrocytes.Arthritis Res Ther 13:R130.
47. Handorf AM and WJ Li. (2011). Fibroblast growth factor-2primes human mesenchymal stem cells for enhanced chon-drogenesis. PLoS One 6:e22887.
48. Xu L, Q Wang, F Xu, Z Ye, Y Zhou and WS Tan. (2013).Mesenchymal stem cells downregulate articular chondrocytedifferentiation in noncontact coculture systems: implicationsin cartilage tissue regeneration. Stem Cells Dev [Epub aheadof print]; DOI: 10.1089/scd.2012.0605.
49. Prockop DJ and JYOh. (2012).Mesenchymalstem/stromalcells(MSCs): role as guardians of inflammation. Mol Ther 20:14–20.
50. Kasemkijwattana C, S Hongeng, S Kesprayura, V Rungsi-naporn, K Chaipinyo and K Chansiri. (2011). Autologousbone marrow mesenchymal stem cells implantationfor cartilage defects: two cases report. J Med Assoc Thai94:395–400.
Address correspondence to:Prof. Marcel Karperien
Department of Development BioEngineeringMIRA-Institute for Biomedical Technology
and Technical MedicineUniversity of Twente
P.O. Box 2177500AE Enschede
The Netherlands
E-mail: [email protected]
Received for publication March 2, 2013Accepted after revision April 2, 2013
Prepublished on Liebert Instant Online April 4, 2013
MSC SECRETED FGF-1 INCREASES CELL PROLIFERATION 2367