Fertilizer Nitrogen Use Efficiency and Nutrient Uptake ... - CORE
205
FERTILIZER NITROGEN USE EFFICIENCY AND NUTRIENT UPTAKE BY MAIZE (ZEA MAYS L.) IN VERTISOLS IN KENYA. CENTRALE LANDBOUWCATALOGUS_ 0000 0751 7069
-
Upload
khangminh22 -
Category
Documents
-
view
0 -
download
0
Transcript of Fertilizer Nitrogen Use Efficiency and Nutrient Uptake ... - CORE

FERTILIZER NITROGEN USE EFFICIENCY AND NUTRIENT UPTAKE BY MAIZE (ZEA MAYS L.) IN VERTISOLS IN KENYA.
CENTRALE LANDBOUWCATALOGUS_
0000 0751 7069

Promotor: Dr. Ir. O. Oenema, Bijzonder hoogleraar in de Nutriëntenstromen en Bemesting
Co-promotor: Dr. Ir. B.H. Janssen, Universitair hoofddocent bij de Vakgroep Bodemkunde en Plantenvoeding
Fertilizer Nitrogen Use Efficiency and Nutrient Uptake by Maize (Zea mays L.) in Vertisols in Kenya.
Dalmas O. Sigunga
Proefschrift
ter verkrijging van de graad van doctor op gezag van de rector magnificus
van de Landbouwuniversiteit te Wageningen, Dr. C.M. Karssen,
in het openbaar te verdedigen op dinsdag 20 mei 1997
des namiddags te half twee in de Aula

ISBN 90-5485-681-5
BIBLIOTHEEK
LANDBOUWUNIVERSITEIT
WAGENINGEN
»HoW lQ.$°l
Propositions (Stellingen)
1. In addressing the issue of nitrogen use efficiency by crops in soils, all the processes and factors responsible for nitrogen loss, uptake and utilization need be considered to avoid the pitfall of wrong recommendations. - This thesis.
2. In general, the relevant processes of nitrogen loss in Vertisols are denitrification, bypass flow, and volatilization in order of relative importance. - This thesis.
3. Provision of appropriate drains is a prerequisite step in improving nitrogen use efficiency by crops in Vertisols. - This thesis.
4. Potential denitrification values do not have much relevance under field conditions. - This thesis.
5. So far there is no single or simple approach to management of Vertisols. - This thesis. - Coulombe, C.E., Wilding, L.P. & Dixon, J.B. (1996). Overview of Vertisols: characteristics and
impacts on societv..'Adv. Agron.. 57: 289-375.
6. In the scientific world, knowledge is important but comprehending the knowledge is more important, and application of the knowldge is the ultimate goal.
7. It is anybody's guess as to what will happen to him when I am dead. I give him almost everything he needs for survival, and he is never tired of poisoning me. My name is land, his is man.
8. Culture undermines objective education.
9. Existentialist is a democrat; substantialist is a dictator.
10. Temper and temperament are like siamese twins.

^Kio^O'^S^
11. PhD is commonly known among university students in Kenya as an acronym for Permanent Head Damage. Apparently.
D.O. Sigunga Fertilizer nitrogen use efficiency and nutrient uptake by maize (Zea mays L.) in Vertisols in Kenya. Wageningen, 20 May 1997.

This thesis is dedicated to my late father.
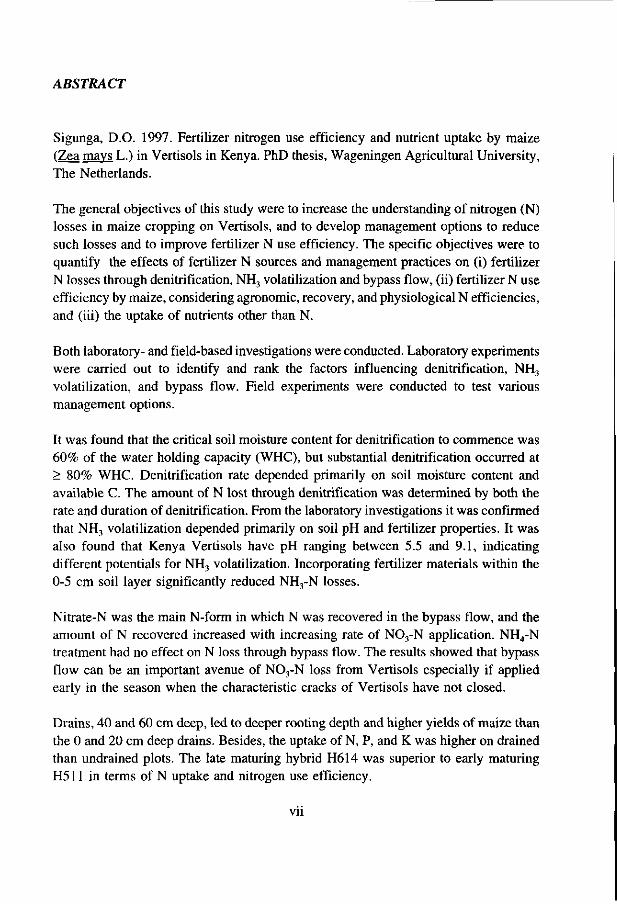
ABSTRACT
Sigunga, D.O. 1997. Fertilizer nitrogen use efficiency and nutrient uptake by maize (Zea mays L.) in Vertisols in Kenya. PhD thesis, Wageningen Agricultural University, The Netherlands.
The general objectives of this study were to increase the understanding of nitrogen (N) losses in maize cropping on Vertisols, and to develop management options to reduce such losses and to improve fertilizer N use efficiency. The specific objectives were to quantify the effects of fertilizer N sources and management practices on (i) fertilizer N losses through denitrification, NH3 volatilization and bypass flow, (ii) fertilizer N use efficiency by maize, considering agronomic, recovery, and physiological N efficiencies, and (iii) the uptake of nutrients other than N.
Both laboratory- and field-based investigations were conducted. Laboratory experiments were carried out to identify and rank the factors influencing denitrification, NH3
volatilization, and bypass flow. Field experiments were conducted to test various management options.
It was found that the critical soil moisture content for denitrification to commence was 60% of the water holding capacity (WHC), but substantial denitrification occurred at > 80% WHC. Denitrification rate depended primarily on soil moisture content and available C. The amount of N lost through denitrification was determined by both the rate and duration of denitrification. From the laboratory investigations it was confirmed that NH3 volatilization depended primarily on soil pH and fertilizer properties. It was also found that Kenya Vertisols have pH ranging between 5.5 and 9.1, indicating different potentials for NH3 volatilization. Incorporating fertilizer materials within the 0-5 cm soil layer significantly reduced NH3-N losses.
Nitrate-N was the main N-form in which N was recovered in the bypass flow, and the amount of N recovered increased with increasing rate of N03-N application. NH4-N treatment had no effect on N loss through bypass flow. The results showed that bypass flow can be an important avenue of N03-N loss from Vertisols especially if applied early in the season when the characteristic cracks of Vertisols have not closed.
Drains, 40 and 60 cm deep, led to deeper rooting depth and higher yields of maize than the 0 and 20 cm deep drains. Besides, the uptake of N, P, and K was higher on drained than undrained plots. The late maturing hybrid H614 was superior to early maturing H511 in terms of N uptake and nitrogen use efficiency.
vii

It is recommended that 40 cm deep drains with inter-drain spacing of 15 - 20 metres be provided as prerequisite step in the management of Vertisols for maize production.
Keywords: agronomic nitrogen efficiency, ammonia volatilization, bypass flow, denitrification, drainage, Kenya, maize, nitrogen recovery efficiency, nitrogen use efficiency, Vertisols.
vin
PREFACE
I began this PhD study at the Department of Soil Science and Plant Nutrition at Wageningen Agricultural University (WAU), The Netherlands in October 1993. The aim of the study was to increase the understanding of nitrogen losses in maize cropping on Vertisols, and to develop soil and crop management options to reduce such losses and improve crop growth and nutrient uptake. The study involved both laboratory and field investigations, and was partly conducted in The Netherlands, and partly in Kenya. Inevitably, the study called for the participation of many individuals without whose help - financial, technical, logistical and moral - I would not have completed it.
I would like to express my deepest gratitude to Kenya Agricultural Research Fund Secretariat, Rockefeller Foundation, and Centra Internacional de Mejoramiento de Maize y Trigo, Kenya for financially supporting my field research in Kenya. In the same vein, I am deeply indebted to Wageningen Agricultural University for offering me fellowships during my stay in Wageningen.
I would like to thank the Vice-Chancellor of Egerton University, Prof. J. Kiptoon for granting me study leave in order to pursue this study.
My promotor, Prof. O. Oenema has always shown great interest in the research and the write up. His critical reading of the draft thesis is greatly appreciated.
I am very much obliged to Dr. Bert Janssen, my co-promotor and supervisor. His personal interest in this study, encouragement, guidance, patience and kindness made it possible for me to complete the task. His visits to Kenya to discuss with me field experiments on the ground were very stimulating and encouraging. During the write up of this thesis at Wageningen, Bert was always very keen to read and discuss the manuscript. I am also grateful to him for translating the English Summary into Dutch. He is the supervisor I am proud to have.
During my field experimentation in Kenya I got a lot of assistance, logistically and technically, from Dr. A.F.E. Palmer, Dr. F.N. Muchena, Dr. R.K. Obura and Dr. P. Smithson for which I am grateful.
IX
I would like to express my appreciation to the staff of Nutrient Management Institute, Wageningen, and the staff of the Department of Soil Science and Plant Nutrition (WAU) for their help during my laboratory experimentation.
Special thanks go to Dr. M.L. Van Beusichem, the Chairman of the Section of Soil Fertility and Plant Nutrition, and Mr. K. Koenders, the Manager of the Department for the financial and logistical arrangements during my stay at the Department. I highly appreciate the kindness with which Mr. C.M.M. van Heijst attended my numerous administrative problems. The guidance offered to me by Ms. H. Roseboom and Ms. M. Wierstra, the secretaries in the Department, whenever I wanted to use stores and other facilities in the Department is gratefully acknowledged.
The assistance by Kenya Soil Survey staff in characterizing the research sites is highly appreciated.
I would like to thank Mr. J.G. Koops very much for his guidance on computer use in data analysis.
Finally, I wish to express my appreciation to my family: Dorine, Beatrice, Cecil, Paul and Charles for their patience in coping with absentee head of the family during this study.
CONTENTS
Abstract vii Preface ix
Part I General introduction 1 1. Introduction 3 2. Soils and sites 15
Part II Literature review 29 3. Processes influencing nitrogen losses in Vertisols in Kenya 31 4. Crop growth and nitrogen use efficiency 53
Part III Laboratory-based experiments 61 5. Denitrification in Kenyan Vertisol and Phaoezem 63 6. Ammonia volatilization from inorganic fertilizers
applied to Vertisols in Kenya 93 7. The effects of fertilizer nitrogen source and rate
on nitrogen loss in bypass flow in a Kenyan Vertisol 107
Part IV Field-based experiments 119 8. The effects of drain depth on temporal moisture variation and
maize performance in a Vertisol in Kenya 121 9. Interactive effects of drain depth, nitrogen source and time
of application on nitrogen use efficiency by maize in Vertisols in Kenya 131
10. Interactive effects of fertilizer nitrogen source and rate, and maize genotypes on fertilizer nitrogen use efficiency 155
Part V Synthesis 167 11. General discussion and recommendations 169
References 179 Summary 199 Samenvatting 203 Curriculum vitae 207
xi

Parti
General introduction

CHAPTER 1
INTRODUCTION
1.1 General
Maize (Zea mays L.) is the principal staple food crop in Kenya. It is produced from sea level to about 2,500 metres above sea level and, inevitably, across a number of agroecological zones (AEZ). Each AEZ is defined by characteristic agro-climatic factors (principally moisture availability and temperature) and differentiated by soil patterns (FAO, 1978; Jaetzhold & Schmidt, 1982). Thus, in each AEZ is a variety of soil types. Out of the 28 major soil types of the world (FAO-UNESCO, 1988), 18 occur in Kenya in varying extensiveness (Sigunga, 1993b). Nitrogen (N) and phosphorus (P) are the most limiting nutrients to maize production in the majority of Kenyan soils (Ikitoo, 1989; KARI, 1991) and their use by farmers is minimal due to high purchase prices that are beyond the economic means of most Kenyan farmers (Murithi & Shiluli, 1993). Besides, there is a widespread concern by farmers that crops in general, and cereals in particular, do not respond well to fertilizer N application in Vertisols. Nitrogen losses through ammonia volatilization, bypass flow, and denitrification are some of the possible causes of low fertilizer N recovery in these soils (Koelliker & Kissel, 1988; Andreini & Steenhuis, 1990; Smaling, 1993).
In continuously cropped lands in Kenya, low levels of N in the soils severely limit production of maize crop. Maize has two main sources of N for growth: nitrogen derived from soil (Ndfs) and N derived from fertilizer (Ndff) (Jenkinson et aL, 1985). Ndfs includes all the N found in the soil such as what is added through depositions, and biological fixation by other plants and released later by mineralization. Since Ndfs is limiting, the only remaining major alternative is the Ndff. In order to alleviate the constraint to production brought about by low inherent soil N and/or low crop response to fertilizer N, there is need to develop technologies that result in the most efficient use of the fertilizer N. Given the high cost of inorganic fertilizer N, its importance in maize production, and its complex effects on soil properties and environment, it becomes imperative that fertilizer N be used efficiently in environment-friendly manner in order to ensure desirable economic returns to the maize grower and minimize the undesirable effects on soil and ground water.
Chapter 1 .
1.2 Use of fertilizer N
The efficiency of fertilizer N use is expressed in several ways, but the term 'fertilizer use efficiency' is commonly visualized as comprising uptake and utilization efficiencies (Capurro & Voss, 1981). Inevitably, nitrogen use efficiencey is affected by changes in fertilizer N recovery and/or in utilization. Efficiency in uptake and utilization of N in grain maize production requires that those processes associated with uptake, translocation, assimilation, and redistribution of N by the crop operate effectively and efficiently (Boswell et al., 1985). Some of the factors affecting fertilizer N uptake by crops are plant genotype (Goodroad & Jellum, 1988), soil characteristics (Tandon, 1989), N source and rate (Haynes & Swift, 1987), climatic conditions (Benoit et aL, 1965; Kuchenbuch & Barber, 1988), and N application method and time (Thomas, 1980; Mochoge, 1989). These factors may, in turn, be influenced by such processes as leaching, denitrification, NH3
volatilization and soil N mineralization rate (Boswell et aL, 1985; Mughogho et aL, 1986). Leaching in humid regions probably accounts for greater losses of N than any of the other processes (Sanchez, 1976), especially in free-draining soils. In Vertisols 'leaching' losses of fertilizer N are made possible by the bypass flow phenomenon (Bouma et aL, 1981; Smaling & Bouma, 1992). Hence, such management practices as choice of N source, mode of placement and time of application of N within the feeder root zones are designed to reduce fertilizer N losses through denitrification, NH3 volatilization, and leaching/bypass flow so as to ensure maximum recovery and least loss of applied fertilizer N.
1.3 Fertilizer research on Vertisols
Vertisols occupy about 260 * 106 ha of land globally (Dudal & Bramao, 1965). Africa has the largest area occupied by these soils, with 105 * 106 ha. Hence, Vertisols represent an undoubted important asset for agricultural production in Africa (Santanna, 1989). A lot of work has been done on the management of physical and chemical properties, as well as fertility of Vertisols in the developed countries (Hubble, 1984; Harris, 1989; Coulombe, et al., 1996). In tropical Vertisols, N is the most universally deficient nutrient (Dudal & Bramao, 1965; Ahamad, 1985; Le Mare, 1989). Crop response to N applications in Vertisols is closely linked to soil moisture variations and, hence, to rainfall pattern (IBSRAM, 1989; ICRISAT, 1989). In Africa, research on Vertisols have focussed more on the management of physical properties than on fertility (IBSRAM, 1989 & 1992). Several strategies for the maintenance of productivity of Vertisols have been proposed and their success varies within and among regions. Vertisols require
. Introduction
specificity in terms of fertility management practices and land utilization because of (i) their highly variable morphological, chemical, and physical properties within and among regions, (ii) the variability in climatic conditions, and (iii) the difficulty in technology transfer from one region to another (Coulombe, et al., 1996).
1.4 Fertilizer research on Vertisols in Kenya
1.4.1 Vertisols
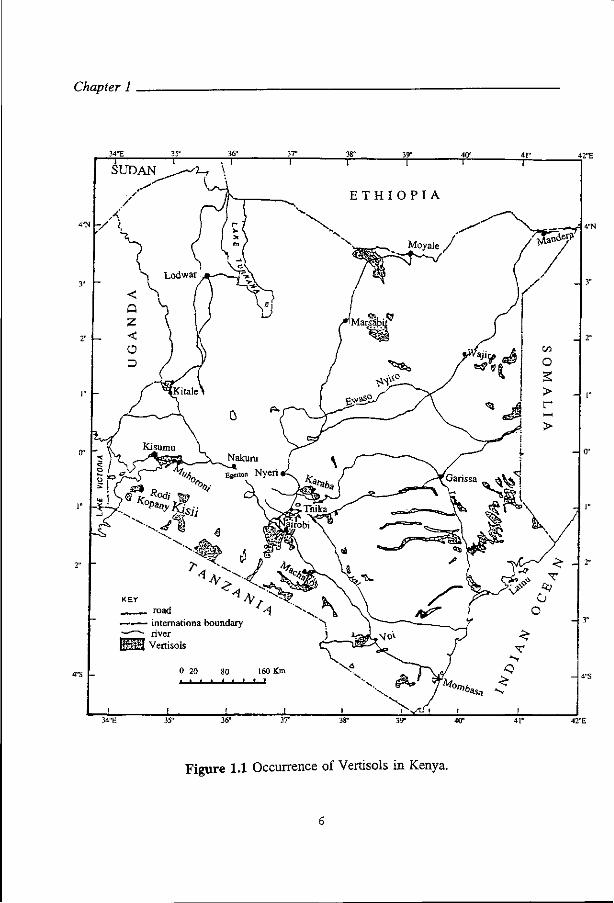
Vertisols are one of the 18 major soil groups occuring in Kenya (Sigunga, 1993b), and they occupy approximately 2.8 million hectares of land in Kenya (Muchena & Gachene, 1985; Muchena et a l , 1986). Vertisols in Kenya are found in many parts of the country (Figure 1.1) and, inevitably, occur in different agroclimatic conditions ranging from humid to arid. They have several desirable attributes that make them a potentially productive group of soils (D'Costa et al., 1988; Coulombe et al., 1996), but certain inherent characteristics make them problematic with respect to fertilizer N use efficiency. Vertisols in Kenya are characterized by pH ranging from neutral to alkaline (Muchena & Gachene, 1985; D'Costa et al., 1988). Ammonia-based N fertilizers are susceptible to fertilizer N loss through NH3
volatilization in soils with high pH (Fenn & Hossner, 1985; Koelliker & Kissel, 1988). Poor drainage, a common characteristic of Vertisols, creates periodic waterlogging (anaerobic) conditions which favour fertilizer N loss through denitrification (Knowles, 1982a; Aulakh et al. 1992). In this respect, a management measure that can alleviate waterlogging conditions could be a possible means of reducing denitrification losses. In addition, shrink-swell characteristic of Vertisols may enhance fertilizer N losses through bypass flow phenomenon (Bouma et al., 1981; Andreini & Steenhuis, 1990). Despite concerted efforts by many scientists of various organizations (eg. IBSRAM, 1989 & 1992; ICRISAT, 1989), there is still no single or simple solution for the proper management of Vertisols (Coulombe et al., 1996).
1.4.2 Research Work
Research activities already undertaken on Vertisols in Kenya with respect to soil fertility and productivity are indeed few (Muchena et al., 1986). Later, Ssali (1990) stated that little is known about the fate and efficiency of N fertilizer applied to Kenyan soils. This view was reinforced by Smaling (1993) who found low fertilizer use efficiency in some Kenyan Vertisols, and recommended that the processes of erosion, denitrification, leaching, and nutrient uptake should be studied further.
Chapter 1
Figure 1.1 Occurrence of Vertisols in Kenya.
. Introduction
Fertilizer research work in Kenya may be grouped on the basis of time frame with reference to Fertilizer Use Recommendation Programme (FURP) as follows:
a) Pre-FURP period b) FURP period c) Post-FURP period
a) Pre-FURP period (upto 1985)
In pre-FURP period are grouped all the fertilizer projects (both research and demonstrations) done before the inception of FURP in 1985. During this period about 500 fertilizer projects (experiments and demonstrations) were carried out on maize as a monocrop (FURP, 1987a), but none of them addressed the issue of nitrogen use efficiency by maize on Vertisols.
b) FURP period (1985 to 1990)
During the FURP period three fertilizer research projects were done on Vertisols at Rodi Kopany and Karaba. Two experiments, namely 4N * 4P and 2N * 2P * 2S 2FYM were carried out at both sites over a period of 3 to 4 years. From these experiments, it is clear that no consideration was given by FURP to:
i) N-source such as N0 3 - , NH4+- and NH4N03- based fertilizers despite the fact
that these N-sources would be expected to react differently in Vertisols. ii) Attempts to reduce N losses, and enhance N recovery by manipulating
management practices such as timing, splitting and mode of placement, iii) Quantification of fertilizer N losses through denitrification, NH3 volatilization
and leaching/bypass flow, and when the losses occur, iv) Relationship between fertilizer N losses and soil moisture fluctuations.
The third project on Vertisols during this period was concerned with "bypass flow and leaching of nitrogen" (Smaling & Bouma, 1992).
c) Post-FURP period (1990 onwards)
Most of the few research activities carried out on Vertisols in Kenya have been focussed on the physical and chemical characteristics p_er se. For example, Muchena and Gachene (1985), D'Costa et al. (1988), and Ikitoo (1989) have variously reported on properties, classification, management in terms of land shaping, and agricultural use of Vertisols in Kenya. Research reports on denitrification, volatilization, and appropriate drain depth in relation to nutrient use efficiency in Kenyan Vertisols are unavailabe. Information on fertilizer losses in bypass flow in
Chapter 1
Kenyan Vertisols is meagre, being confined to the report by Smaling & Bouma (1992). Fertility studies were done on Karaba Vertisols in Kenya (Dr. F.N. Muchena, pers. commun.), but here again no consideration was given to N-sources, nutrient uptake and quantification of losses by denitrification, volatilization, and leaching/bypass flow. The lack of information on fertilizer use efficiency on Vertisols, and indeed on other soil types as well, is possibly due to a small number of qualified soil scientists working in the country (Sigunga, 1993b).
In its national research plan, Kenya Agricultural Research Institute (KARI) emphasized, as one of its major goals for Soil Fertility and Plant Nutrition Program, "... the need to study relative efficiency of various sources of nitrogen, phosphorus and trace elements as well as their residual value on different crops" (KARI, 1991).
1.5 Conceptualization and objectives
1.5.1 Conceptualization
The operational concepts relating to "Fertilizer Nitrogen Use Efficiency", "Factors Determining Maize Yields", and "Factors Determining Fertilizer N Use Efficiency" as used in the present study are elucidated herebelow:
(a) Fertilizer Nitrogen Use Efficiency
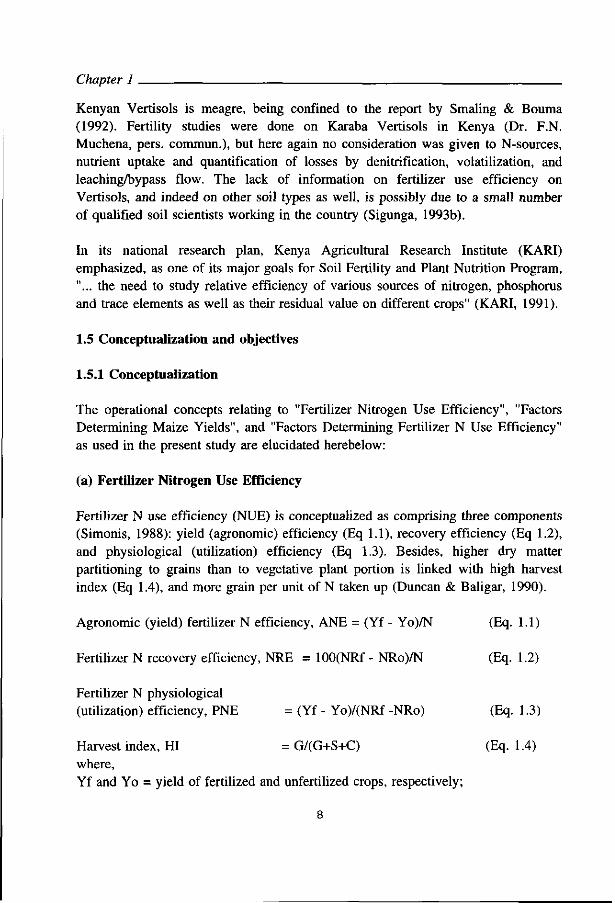
Fertilizer N use efficiency (NUE) is conceptualized as comprising three components (Simonis, 1988): yield (agronomic) efficiency (Eq 1.1), recovery efficiency (Eq 1.2), and physiological (utilization) efficiency (Eq 1.3). Besides, higher dry matter partitioning to grains than to vegetative plant portion is linked with high harvest index (Eq 1.4), and more grain per unit of N taken up (Duncan & Baligar, 1990).
Agronomic (yield) fertilizer N efficiency, ANE = (Yf - Yo)/N (Eq. 1.1)
Fertilizer N recovery efficiency, NRE = 100(NRf - NRo)/N (Eq. 1.2)
Fertilizer N physiological (utilization) efficiency, PNE = (Yf - Yo)/(NRf -NRo) (Eq. 1.3)
Harvest index, HI = G/(G+S+C) (Eq. 1.4) where, Yf and Yo = yield of fertilized and unfertilized crops, respectively;

. Introduction
NRf and NRo = N recovered by fertilized and unfertilized crops, respectively N = rate of fertilizer N application G, S, and C = grain, stover and cob yields on dry matter basis, respectively.
b) Factors Determining Maize Yield
Maize yield is a function of plant genotype and environment, and may be represented as follows:
Maize Yield = /(Genotype, Environment) (Eq. 1.5)
The environment is comprised of climate, soil and management (Gardner et aL, 1985). Thus, Eq. 1.5 becomes:
Maize Yield =/(Genotype, Climate, Soil, Management) (Eq. 1.6)
c) Factors Determining Fertilizer N Use Efficiency
Since plant growth is a function of environment and the genetic constitution of the plant, nutrient use efficiency by a crop is determined by the interaction between crop production potential and the environment. The environment is considered to be made up of soil, climate, and management. Hence, studies on fertilizer N use efficiency by a crop must be considered in the light of many factors that interactively affect both the uptake and utilization aspects of N use as conceptualized in Figure 1.2. Climate and management directly affect the interactions between fertilizer N and soil constituents. The influences of climate and management are not, in this conceptualization, on soil and fertilizer N seperately but on them when they interact. The effects of climate and management on interacting soil and fertilizer are expected to be reflected in the processes of N use (ie. uptake and utilization) by the crop on the one hand, and in the processes of N loss (ie. denitrification, NH3 volatilization, and bypass flow) on the other hand. Besides, climate and soil have direct influence on N use by the crop.
Fertilizer N utilization is affected by the N source. This is because NH4+ and N03"
ions have different effects on rhizosphere pH and uptake of other essential plant nutrients (Riley & Barber, 1971; Sigunga, 1993a). The effect of N source on fertilizer N uptake and uptake of other nutrients are modified by soil characteristics such as native pH and nutrient status.

Chapter 1
Losses of fertilizer N through denitrification, volatilization and/or bypass flow have direct bearing on the recovery of N by the crop. The climatic and management factors influence these processes, as do the fertilizer N sources and soil characteristics.
In this conceptualization the climate, management, soil, and fertilizer are considered as INPUT, while fertilizer N use by the crop (uptake and utilization) and loss (through denitrification, NH3 volatilization, and bypass flow) are OUTPUT. Conceptually, therefore, there are a number of factors that interactively affect the processes of N loss as well as the processes of N use. In such a situation, the logical step in promoting fertilizer N use efficiency would be to identify and
1. Rainfall 2. Temperature
VERTISOLS
1. Native pH 2. CEC 3. Cracks 4. Periodic
waterlogging
MANAGEMENT
1. Fertilizer N a) Timing and splitting b| Rate c) Mode of placement
2. Soil (Vertisols) a) Drainage b) Tillage
FERTILIZER N
1. NOj 2. NH,
INTERACTION BETWEEN
VERTISOLS AND FERTILIZER N BEING INFLUENCED BY
CLIMATE AND MANAGEMENT
PROCESSES OF N USE
1. N uptake 2. N utilization
PROCESSES
1. 2. 3.
Denitr Volati Bypass
OF N LOSS
fication ization flow
ES
Figure 1.2 Schematic representation of the conceptual framework of causes and effects in fertilizer N use efficiency.
10

. Introduction
address the most limiting constraint(s) in priori. Identification of the constraints requires a thorough understanding of the system via systems research, and a conceptual model. The identified constraints must be verified and tested. Hence, focussed field experiments are to be conducted in order to observe effects of well defined treatments. This brings us to the knowledge level: the knowledge of what effects resulted from which treatments. It is one thing to know the results of various treatments, and it is another thing to understand the possible causes of such effects. Both the knowledge and understanding of cause-effect relationships are vital in formulating realistic and viable management options in fertilizer N use efficiency. On this premise, it becomes necessary to conduct experiments on the processes of N loss under controlled conditions which can make it possible to clearly identify specific factors influencing the magnitudes of N losses by the processes. Then, the occurrence of the identified important factors in the field is studied. Eventually, the relative importance of processes of N loss can be worked out and strategies to reduce such losses be formulated thereby providing better opportunity for fertilizer N recovery. Since, in the final analysis, crop productivity depends on crop's capacity to exploit environmental (soil and climate) resources in an integrative manner, field experiments are essential in testing various management options.
1.5.2 Objectives
The general objectives of this study were to increase the understanding of the nitrogen losses in maize cropping on Vertisols, and to develop soil and crop management options to reduce such losses and to improve crop growth and nutrient uptake. The specific objectives were to quantify the effects of fertilizer N sources, and management practices, namely fertilizer N application rate, N timing and splitting, and provision of drainage on:
i) Fertilizer N losses through denitrification, NH3 volatilization and bypass flow ii) Fertilizer N use efficiency by maize, considering agronomic, recovery, and
physiological N efficiencies, iii) Uptake of other nutrients than N (nutrient balance in the plant to explain
physiological N efficiency).
1.6 Outline of the research
Based on the conceptual framework of this study (Section 1.5.1) it became necessary to derive critical threshold values for the processes of N loss in Vertisols, and to test management options. Experiments relating to denitrification, NH-,
11
Chapter 1 .
volatilization, and bypass flow were conducted under laboratory conditions in order to study specific factors influencing these processes and threshold values. This task would be difficult under field conditions where a large number of factors interactively influence the processes. The following experiments were carried out in the field: (i) the effects of drain depth on soil moisture variation, and maize rooting depth and yield, (ii) interactive effects of drain depth * N source * time of N application on NUE, and (iii) interactive effects of maize genotype * N source * N rate on NUE.
Soil moisture influences denitrification through its effects on soil organisms and 0 2
supply to the soil. Available carbon also influences denitrification by providing energy source for denitrifiers (Knowles, 1982a; Aulakh et al., 1992). Soil texture influences denitrification through its effects on the diffusion of substrate to, and the products from, the microsites where denitrification occurs (Benckiser, 1994). For this reason, a medium-textured Phaoezem was used for comparison with the fine-textured Vertisol. In this study the effects of soil moisture and available C on denitrification were investigated in order to determine the magnitude of their effects on denitrification rate. Various soil moisture levels were chosen in order to establish critical moisture level below which denitrification does not occur in these soils. In addition, denitrification rate was determined under anaerobic (N2 atmosphere) so as to compare the potential denitrification in the two soils. Different rates of NO," and glucose were used to establish whether or not the substrates were limiting denitrification in these soils.
The magnitude of NH3 volatilization from inorganic fertilizers applied to soils is determined by the soil characteristics and fertilizer properties. In this study, different NH4-based fertilizers were tested on different Vertisols in order to rank the magnitude of NH3-N loss in these soils. Effectiveness of placement mode, namely surface-broadcast and surface-broadcast and incorporation in reducing NH3
volatilization from fertilizer applied to Vertisols was tested. These placement modes were chosen because they are commonly practised by farmers in Kenya.
Characteristic cracks of Vertisols provide preferential flow paths which can facilitate rapid movement of fertilizer materials down the soil profile beyond the reach of plant roots (Andreini & Steenhuis, 1990). The susceptibility of N03" and NH4
+-based fertilizers to be carried in the bypass flow down the soil profile was determined. Different N-forms were chosen because they carry different charges and, hence, are likely to be influenced differently by the dominantly negatively charged surfaces of soil colloids.
12
. Introduction
Vertisols are characteristically poorly drained, a situation that leads to waterlogging during and after heavy rainfall events (IBSRAM, 1989), with the consequence of denitrification risk. Drainage is a possible viable management measure to control soil moisture content in the root environment. This was tested in a field experiment involving different drain depths, namely 0 (control), 20, 40, and 60 cm. These depths were chosen in order to determine specific soil layer within which drainage had the most beneficial effects on soil moisture content in relation to maize performance. In choosing these drain depths, the expected rooting depth of maize was considered. Interactive effects of drain depth * N source * time of application on NUE were examined in a second field experiment with the following treatments: drain depths (0, 40, 60 cm), time of N application (0, 0/40, 40 days after planting (DAP)), and N03- and NH4-N sources. The drain depths were selected for the reasons explained above. The N application dates were chosen so as to determine the interactive effects of soil moisture as influenced by rainfall and N source on N recovery.
Late maturing maize hybrid H614 and medium-late H511 were tested under field conditions to determine their adaptability in exploiting prevailing environmental resources in relation to NUE. The two hybrids contrast in terms of yield potential, maturity period and, hence, their demand for nutrients.
1.7 Outline of this thesis
Characteristics of the experimental soils and sites are presented and discussed in Chapter 2. Review of literature relating to the processes of fertilizer N losses, namely, denitrification, NH3 volatilization, and bypass flow, is presented in Chapter 3, while Chapter 4 is devoted to literature on nutrient use efficiency. Results and discussion relating to laboratory-based experiments on denitrification, NH3
volatilization, and bypass flow are presented in Chapters 5, 6 and 7, respectively. Chapters 8 to 10 are devoted to results and discussion relating to field-based experiments. The effects of drainage on temporal soil moisture variation and maize yields are reported in Chapter 8. The results and discussion on the interactive effects of drain depth, N source and time of application, and interaction between maize genotype, N source and rate on N use efficiency are presented in Chapters 9 and 10, respectively. Since the ultimate aim of the whole study was to formulate management practice(s) that would lead to efficient use of fertilizer N, results from individual experiments are discussed holistically and synthesized into recommended management options in Chapter 11.
13

CHAPTER 2
SOILS AND SITES
2.1 Soils for laboratory-based experiments
Soil samples were collected from various sites across Kenya for the laboratory-based experiments. For denitrification experiments, soil samples were collected from Muhoroni and Kisii (Figure 1.1). Soils from 5 different sites, namely Machakos, Karaba, Rodi Kopany, Muhoroni, and Kitale were used in volatilization experiments. Bypass flow experiments were carried out on undisturbed soil columns at Rodi Kopany site.
2.2 Sites for field-based experiments
Field experiments were conducted at two sites, namely Rodi Kopany and Muhoroni (Figure 1.1). Rodi Kopany site had been characterized and soils classified (FURP, 1987b; Smaling & Bouma, 1992). Muhoroni soils had not been characterized before. Hence, the site was characterized and soils classified just before the commencement of the present experiments.
2.2.1 Rodi Kopany site
2.2.1.1 General
Rodi Kopany site, located at 0° 46' S and 34° 30' E (Anon, 1991) is in Homa Bay district, Kenya (Figure 1.1). The site, which is 1 ha, is 1330 metres above sea level (masl), and its physiography is plain with a slope of less than 1% (FURP, 1987b).
2.2.1.2 Climate
Agroecologically Rodi Kopany falls within the lower midlands 2 (LM2) agroecological zone, AEZ, (Jaetzold & Schmidt, 1982). The climate of the site is summarized in Table 2.1 and Figure 2.1. Temperature and potential evaporation, Eo, (Class A pan) were obtained from Marinde, (meteorological station no. 9034041), situated 7 km east of Rodi Kopany site. The rainfall distribution shows a weak bimodal pattern with the first and second rains occurring during the periods end of February to end of June, and beginning of September to November end respectively (Table 2.1). The 1st rains provide crop growing period of 120 to 140 days, while the corresponding crop growing
15
Chapter 2
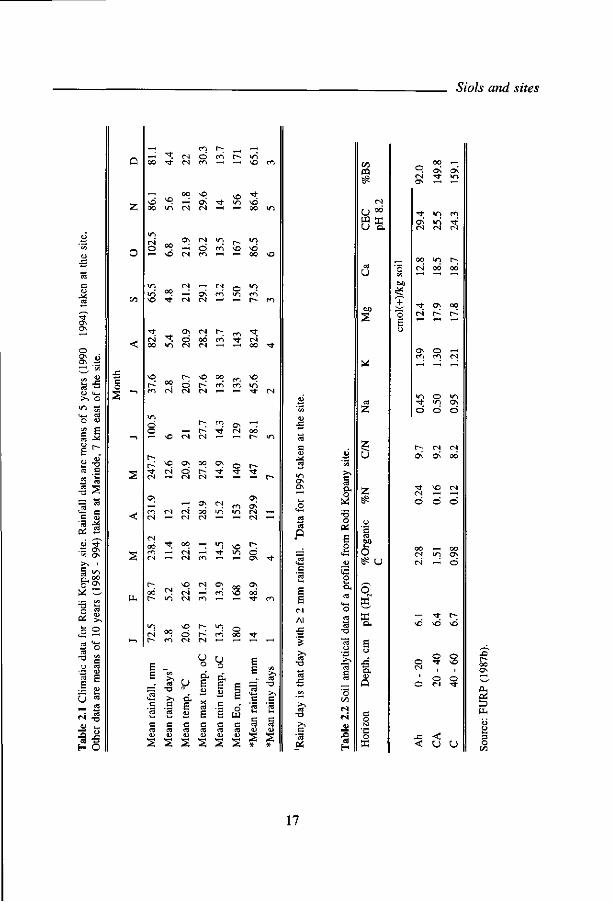
period during the 2nd rains is 90 to 100 days. Rainfall reliability, 60%, figures for the site and its environs during the 1st and 2nd rains are 700 and 400 mm, respectively (FURP, 1987b). Potential évapotranspiration, Eto, values estimated as 2/3 of Eo (Woodhead, 1968) are fairly high for the area (Table 2.1). Rough estimate of water balance by the difference between rainfall and Eto (Barraclough et al., 1983) shows that the soils at the site do have excess moisture during the 1st rains, and not during the 2nd rains (Figure 2.1). In practice, the 1st rains provide the main crop growing season for annual crops in the area.
2.2.1.3 Cropping systems
Common crops grown in Homa Bay district include maize, sorghum, bulrush millet, finger millet, sweet potato, cassava, pineapples, papaw, bananas, tobacco (on sandy soils), ground nuts, and various vegetables. Intercropping of cereals and legumes, cereals and vegetables, as well as cereals and root crops are practised to a large extent. Zebra grass (Hyparrhenia ruf a), Guinea grass (Panicum maximum), Rhodes grass (Chloris gayana), and Star grass (Cynadon dactylon), Nandi seteria (Seteria sphacelata), Osinde grass (Andropogon spp), Napier grass (Pennisetum purpureum), and various Cenchrus spp. are the important pastures in the district. Rodi Kopany site, prior to the present research, had been used for about 10 years for research on cereals and legumes, namely maize, sorghum, and beans. Both phosphatic and nitrogenous fertilizers were applied at different rates to different plots in different seasons.
2.2.1.4 Soil classification
The soils of the Homa Bay and the neighbouring Kisii districts are derived from Tertiary alkali basalt (Wielemaker & Boxem, 1982), and are of moderate to high fertility (Jaetzold & Schmidt, 1982). The soils at Rodi Kopany site are black Vertisols. For the purpose of soil characterization, two profile pits were dug at the site in 1985 and they were virtually the same in profile horizonation, A-CA-C sequence, and physicochemical properties (FURP, 1987b). Some of the chemical properties of the soil samples from one of the profiles are given in Table 2.2. There were, however, spatial variations within the site; one side of the site having higher contents of organic C%, total N%, and K cmol (+)/kg soil in the Ah horizon. The variation could possibly be due to differences in land use in previous years. The soils at the site are reported (FURP, 1987b; Smaling & Bouma, 1992) to be classified as Eutric Vertisol (FAO-UNESCO, 1988) or Typic Pelluderts (Soil Survey Staff, 1990).
16
Siols and sites
o o\ ON
<S1
<rt CD
J =
O
.e c
2
os S ó -^
S2 ON
c« ON
g * ON
"O S o es
« g S
. 3 CD
Ö ^
H Ô
1—1
CO T h CS
CS
co O en
r -co H t - *
-
\£3 ^ irï es
oî oo ° ^ ^ ^ tn-O . -* O T) \o ^o — ^o es m — •— oo
es ^ es 0 *n °^ — C\ en »n en ' t M cJ - - h
oo in es
es oo es
r*-m "—(
Tt
>—<
"3-es oo
o o — NO
ON 0 0 ON
— — • *
—i ON <N
T t 00 •— V>
NO CN ON
ON
ON
•o ° >N d.
•s e
u o ci h 0>
U o ci e e
&
g g
3 c
S £ tu es a a es tü tu
o CD o o o m
s s s s s s s s
—' t -
t2 « cd
cd
c t - i
F Ë
o X T3 O a: g o o
I S
2
os
t / 1
CO i£
u w u
t N
0 0
m a.
u
60
u
oo
O
o in i s <s
A
F-H
c o N
c K
Tt-
ON >/-> i n
oo vo r^ CN» od oó
TJ- ON oo (N K t~
«n o »n ^ - w-j ON
Ö Ö Ö
ON
NO
Ö
00 es es
i n r-i
oo
o
\ó \ó ^ó
o I N 1 O
o T f
o t N
O NO
o T f
0 0 ON
^ 0-
D PU
•3 < < u u
17

Chapter 2
zau-
200-
150-
« 1 1
«il 100-1 1 I H H f
50-
0- i N H l r a l r a l M l r H l m l m l r B l M l H l m l M ==, J F M A M J J A
Month S O N D
Mean rainfall, mm Mean Eto, mm
Figure 2.1 Water balance for Rodi Kopany as estimated by the difference between mean rainfall and évapotranspiration.
2.2.2 Muhoroni site
2.2.2.1 General
The site is in Koru settlement scheme of Muhoroni division in Kisumu district, Kenya (Figure 1.1). It is approximately located at 35° 15'E and 0° 20'S, and is about 1450 masl. The site is underlain by Basement System rocks comprising mainly granitoid gneiss (Jaetzold & Schmidt, 1982). It lies on nearly level plain (slope < 2%), in contrast to hilly surrounding. The objectives of the current characterization were to classify the soils of the site, and to determine and describe those site characteristics that are deemed essential in facilitating the laying out of experimental plots and transfer of subsequent research results from this site to others with comparable characteristics.
2.2.2.2 Climate
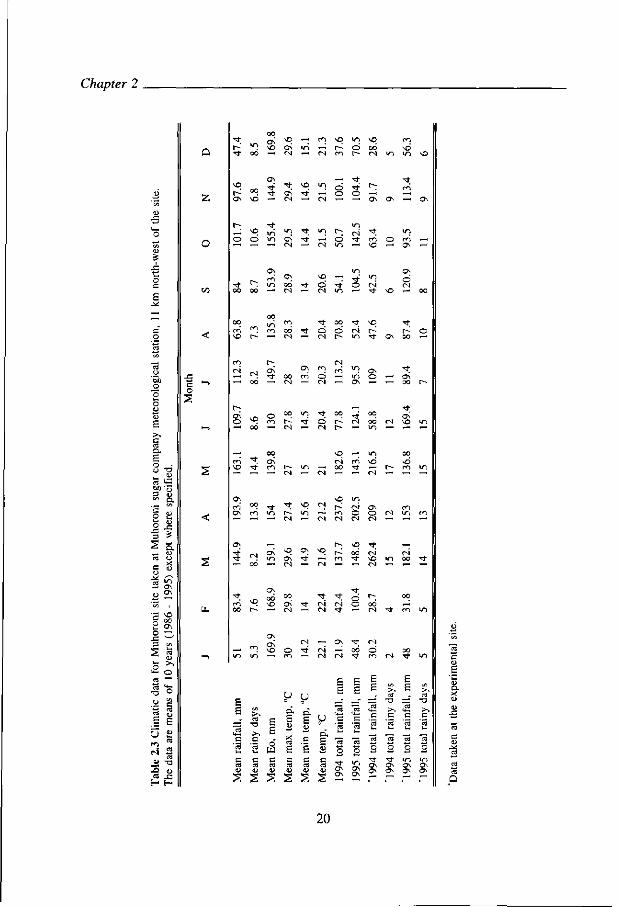
Muhoroni site falls within agroecological zone LM2 (Jaetzold & Schmidt, 1982). Data on long term climatic factors such as rainfall, temperature, and potential evaporation (Eo) records were obtained from the central meterological station (Registration No. 9035220) of Muhoroni Sugar Company, which is 11 km northwest of the site. In addition, precipitation at the site was recorded for two years, 1994 and 1995, during which period experiments were conducted. Main climatic data, means of 10 years
Soils and sites
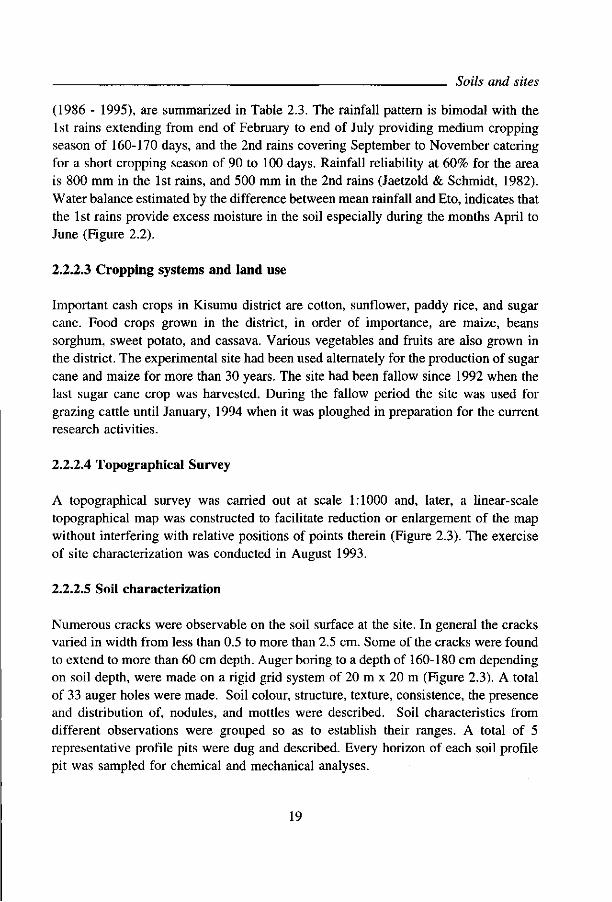
(1986 - 1995), are summarized in Table 2.3. The rainfall pattern is bimodal with the 1 st rains extending from end of February to end of July providing medium cropping season of 160-170 days, and the 2nd rains covering September to November catering for a short cropping season of 90 to 100 days. Rainfall reliability at 60% for the area is 800 mm in the 1st rains, and 500 mm in the 2nd rains (Jaetzold & Schmidt, 1982). Water balance estimated by the difference between mean rainfall and Eto, indicates that the 1 st rains provide excess moisture in the soil especially during the months April to June (Figure 2.2).
2.2.2.3 Cropping systems and land use
Important cash crops in Kisumu district are cotton, sunflower, paddy rice, and sugar cane. Food crops grown in the district, in order of importance, are maize, beans sorghum, sweet potato, and cassava. Various vegetables and fruits are also grown in the district. The experimental site had been used alternately for the production of sugar cane and maize for more than 30 years. The site had been fallow since 1992 when the last sugar cane crop was harvested. During the fallow period the site was used for grazing cattle until January, 1994 when it was ploughed in preparation for the current research activities.
2.2.2.4 Topographical Survey
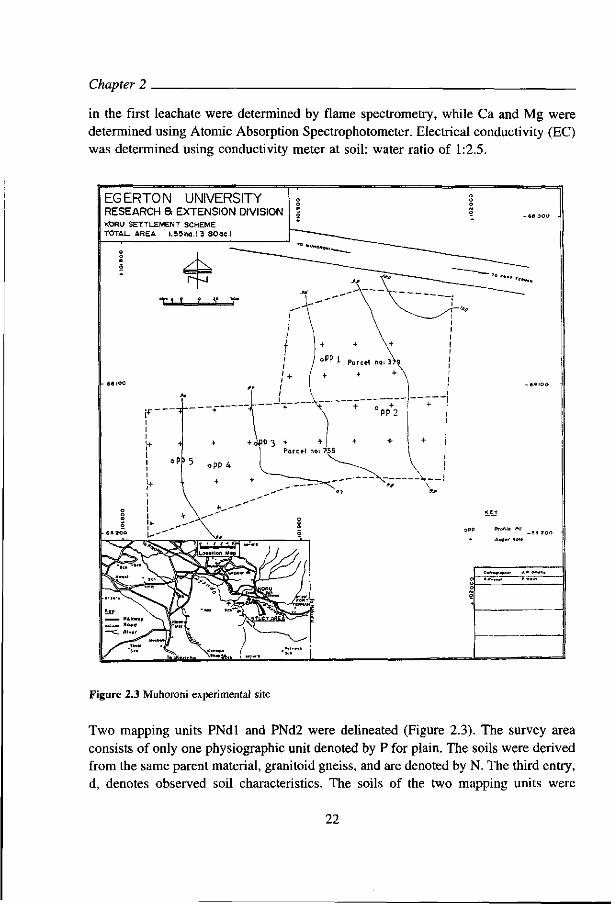
A topographical survey was carried out at scale 1:1000 and, later, a linear-scale topographical map was constructed to facilitate reduction or enlargement of the map without interfering with relative positions of points therein (Figure 2.3). The exercise of site characterization was conducted in August 1993.
2.2.2.5 Soil characterization
Numerous cracks were observable on the soil surface at the site. In general the cracks varied in width from less than 0.5 to more than 2.5 cm. Some of the cracks were found to extend to more than 60 cm depth. Auger boring to a depth of 160-180 cm depending on soil depth, were made on a rigid grid system of 20 m x 20 m (Figure 2.3). A total of 33 auger holes were made. Soil colour, structure, texture, consistence, the presence and distribution of, nodules, and mottles were described. Soil characteristics from different observations were grouped so as to establish their ranges. A total of 5 representative profile pits were dug and described. Every horizon of each soil profile pit was sampled for chemical and mechanical analyses.
19
Chapter 2
O
o
<\> E >-> c rtl Cu
R o
bü
O
O
Tl
O,
O
w 0) cd o r- X cj
•« £s *-* ON <D °N
3
cd — ' Cd "Ir
T3 °
. ^ C
I E
O £ ^ S
ra a* - o
5 « H H
\ o - n \ o »n \ 0
ö CM in v i \ o
NO
ON
C-;
O
NO
NO O
TT 2
f
>n
ON tN
U"> ON
NO
2;
Tf Tf
IN
in
tN
ö o
t— o in
O
in
•*
ON
"* en NO
o
o
rn
in cl ON
Os
^
NO —
O tN — TI NO ~ - 00
m r-
in
-—' 00 CM
t i — i CM
00
rS r-
.c
o •-»
CM
oö *t 00
CM rn Ö
CM
in ON
O ~
oo I--(N
<n Ti-
•—'
Tj-O CM
OO
r-r-
t CM • — '
oo oo in
CM
—
o< \r> —
in
-—' r-> 00 ^
,—« cc vp — in oq en " ^ ON' N en \ ö ^© ^ O ^ f c n t - - > n ™ o o ^ p — r - m m
ON O
^ oq ^ Tt sp <N ^ ON m i n r - * n ~ en ^ — — CM ^ CM CM
CM ON m O o CM i n en C M C M —« - H — i
ON
• *
00
tN
NO
ON in
ON
NO
NO ON Ol
00 O N tN
ON
2;
^j-
NO
tN
Tf tN tN
r-
•'t tN
NO OO
Tf
O
oi NO tN
r~ 00 tN
in
"*
oi oo
00
m
• *
in
tn in'
ON NO O
tN tN tN
ON
tN
e p
oö
E P
tN
Ö
e e
tN OO
e E
e e _* 5 c
cd
-o > i
c l_<
e a o
P u ~2 ^ .^
S T3 S
6 S y
* 3 ' S ^
E E
S 2 S S S S 2 2 ;
o o o o
T t * ^ i n m ON ON ON ON
ON ON 2 2 2 2
20

Soils and sites
Figure 2.2 Water balance for Muhoroni site as estimated by the difference between rainfall and évapotranspiration
(a) Soil units
The soils were described according to the Guidelines for Profile Description (FAO, 1977). Soil colours were described according to the Munsell soil colour charts (Munsell Co., 1973). Soil texture was determined using mechanical analysis (Gee & Bauder, 1986). Bulk density, BD, was determined by resin-coating method (Brasher, et al., 1966; Bronswijk, 1986). Water infiltration rate was determined according to the double cylinder method as described by Landon (1991).
Samples used in the determination of soil chemical properties were air dried and ground to pass through 2 mm sieve. Soil pH was determined with glass electrode at soil:water ratio of 1:2.5. To determine C content soil samples were oxidized with K2Cr207, and the concentration of Cr3+ formed in the reaction was measured colorimetrically, and compared with standard series of sodium oxalate that had been treated in the same way. Total N was determined by digesting the soil samples with a mixture of H2S04-Se and salicylic acid, and measuring the N in the digest spectrophotometrically. To determine CEC and exchangeable Ca, Mg, K and Na, soil (10 g) was leached with IM NH4OAc (pH = 7), and this first leachate was used for the determination of exchangeable cations. The soil was then washed free of NH4OAc with ethanol. The second leaching was done with acidified CaCl2 solution to release adsorbed NH4
+, and the NH4+ concentration in the leachate was subsequently
determined spectrophotometrically using continuous flow auto-analyzer. The K and Na
21
Chapter 2
in the first leachate were determined by flame spectrometry, while Ca and Mg were determined using Atomic Absorption Spectrophotometer. Electrical conductivity (EC) was determined using conductivity meter at soil: water ratio of 1:2.5.
Figure 2.3 Muhoroni experimental site
Two mapping units PNdl and PNd2 were delineated (Figure 2.3). The survey area consists of only one physiographic unit denoted by P for plain. The soils were derived from the same parent material, granitoid gneiss, and are denoted by N. The third entry, d, denotes observed soil characteristics. The soils of the two mapping units were
22
Soils and sites
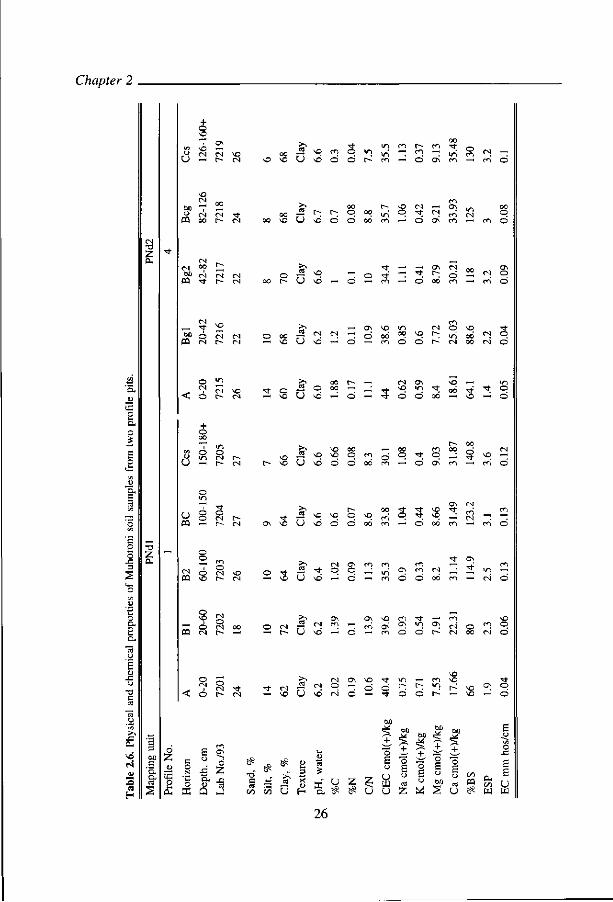
similar in almost all the measured characteristics except at depth greater than 60cm, where there were more iron and manganese concretions in profiles of the PNd2 than in PNdl profiles. Owing to similarities in characteristics of profiles within each of the two mapping units only one profile from each unit was described.
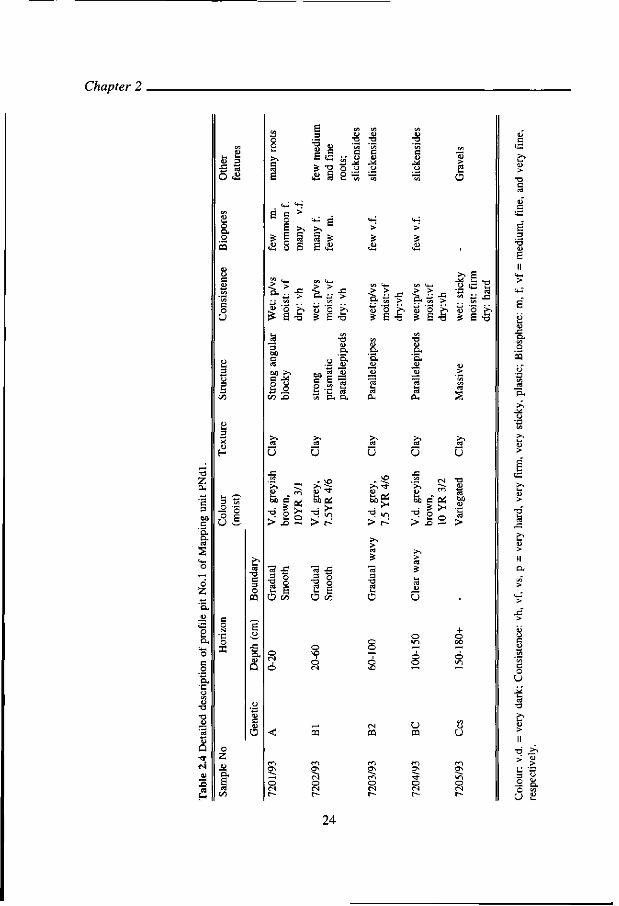
(b) Soil profiles
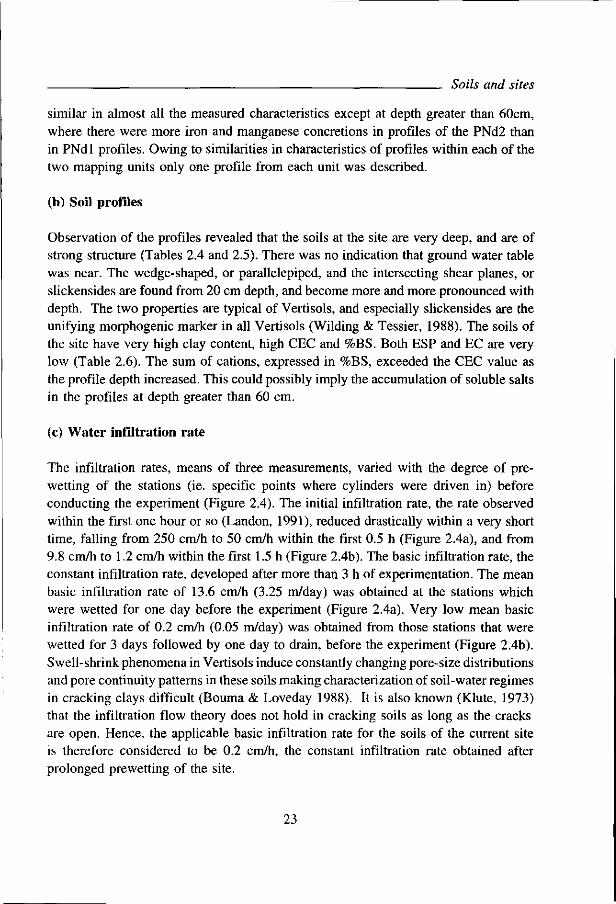
Observation of the profiles revealed that the soils at the site are very deep, and are of strong structure (Tables 2.4 and 2.5). There was no indication that ground water table was near. The wedge-shaped, or parallelepiped, and the intersecting shear planes, or slickensides are found from 20 cm depth, and become more and more pronounced with depth. The two properties are typical of Vertisols, and especially slickensides are the unifying morphogenic marker in all Vertisols (Wilding & Tessier, 1988). The soils of the site have very high clay content, high CEC and %BS. Both ESP and EC are very low (Table 2.6). The sum of cations, expressed in %BS, exceeded the CEC value as the profile depth increased. This could possibly imply the accumulation of soluble salts in the profiles at depth greater than 60 cm.
(c) Water infiltration rate
The infiltration rates, means of three measurements, varied with the degree of pre-wetting of the stations (ie. specific points where cylinders were driven in) before conducting the experiment (Figure 2.4). The initial infiltration rate, the rate observed within the first one hour or so (Landon, 1991), reduced drastically within a very short time, falling from 250 cm/h to 50 cm/h within the first 0.5 h (Figure 2.4a), and from 9.8 cm/h to 1.2 cm/h within the first 1.5 h (Figure 2.4b). The basic infiltration rate, the constant infiltration rate, developed after more than 3 h of experimentation. The mean basic infiltration rate of 13.6 cm/h (3.25 m/day) was obtained at the stations which were wetted for one day before the experiment (Figure 2.4a). Very low mean basic infiltration rate of 0.2 cm/h (0.05 m/day) was obtained from those stations that were wetted for 3 days followed by one day to drain, before the experiment (Figure 2.4b). Swell-shrink phenomena in Vertisols induce constantly changing pore-size distributions and pore continuity patterns in these soils making characterization of soil-water regimes in cracking clays difficult (Bouma & Loveday 1988). It is also known (Klute, 1973) that the infiltration flow theory does not hold in cracking soils as long as the cracks are open. Hence, the applicable basic infiltration rate for the soils of the current site is therefore considered to be 0.2 cm/h, the constant infiltration rate obtained after prolonged prewetting of the site.
23
Chapter 2
•±3 Kj
O Ä
m
31 u
pa
O
Q • »
c*
a H
o Z <D U .
CS
g =
£ "2 O
e s
E E
£ Ë 4?
Dû >* C M O c-»
S °
S E
U
W3
5 2 £ > .o —
"rt -S
•s §
2 E
U
5 5 2 e
Ü Vi
pa
o "o ^i
s E -a
U
Ü
•5 ?•• J3 fi-S ?•
S Ë -S
S* 'S.
I l & S E -o
U U
>> T t
60 " >> 60
•a >
c * o b-
J3
c i
BS
>* o
U
+ o
U pa
r«1 O <N r-
•<t
o (N r~-
«n o (N r-
3
U
O
n
« &
73
O U
73 J>>
24

Soils and sites
o O
O
u
2 55
-a Z a.
u
o d Z
p
a, •c
•n o
O
o Z
H
c > 1
p
E B
O P
a) c'
o a c a -
c
(J
WÎ
O id
c
« 5
O ts
13 CO
Ü
£ e e fr •a
U
(N
.3 O
O
o •a il o
Ü 8. ' C Oc C Ü 60 JJ S "3 on O*
O T3 II
t f l
O
a. u ed
S (X
o •a II
c/3
o. a. U CÖ
S a.
XJ o o
O
bß
n
O
pa
* • ^ | 'S gj, £ E -o
Jj Jj <u
U U
u
0 0 —<
+ o <N - H
00 ^H
u
25
Chapter 2
z CL,
• S CS
H
-a Z Cu
+ o vo
U — t - ra
M -r —
CO Tt
CQ
CQ
CN CN CN
U
eu
( N
w
1
o
O
o ó VO
•«t O CN r—
m O ( N r-
O CN oo CN r- —
S O . i CN - *
< o r- CM
o Z
s s s o K
6 S; u Ö
Z
— u
vo VO
en o
M-o o
T i
(*•
T i
m
c o
^ ^ r -c o
o
m
~ UN
•«t
m CO
O C l
* CN
c o ~ O
^ U
r-VO
r-o
o o o o
0 0
0 0 m c o
vT) O
-l CN ' t
O
,_, CN
o\
o\ r O r o
i n IN
— c o o o
o n ^ 1— U vo
— o o
~* " t
•<t m
,— i
~ r~
, — i
• *
o
o\ t -
OO
CN
c~> c o
o o
--CN
c o
CTv O O
M u
CN
vO
CN
'-' _ ^ O
o\ o
vn OO c o
T I
oc O
v o
o
CN
r-r-
o i n CN
VO
0 0 oo
CN
( N
T f O O
<
C/l
O
u
o CN
Ó
+ O oo
O T I
T i
o CM r-
v o
CN
T f
r-
o vo
vo vo U
O
VO
VO
vo '
o o o o
VO v o
ö
r-
ö
00 o ö
"
CO
0 0
5
ö r o
CN
vO
Ö
00
q
T l
ö
ö
0 0
m o
vq oó
oo
co
VO
o
T f
vq en
i n o ö
CN
Ö
^ 5 e * o vo U vo ö ö
CT\ CN 00 * ^t VO f J CO
v q ^ q ^ v q . j Ç O ^ ^ o o m - — o oo n , -^ m o
o t n ^ q q -— VO U vo — o —<
rj\ co CN _• 3 T I ~ m o o oo — CN O
>, o
CN
VO
CT\ m
—• ~ o
Os
c o
^ vo
CT\ CO
c o CTv
O
•<t T I
o — 0 \
r -
c o
CN CN
ro 0 0
e n
CN
VO O
O
— vo U vö
es
tn i n U h SC c
CN O
CN
u <£
av
^ o
Z ü*
VO
o
z U
t n
o ß
+ O
H CJ
u [ I l
u
T i l—
o
on
o f= o ca
z
- — 1
1 - -
O
•^
+ o 6 W
— vo — o
U
00 CQ
e e u
26

Infiltration rate, cm/h
Soils and sites
0 0.5 1 1.5 2 2.5 3 3.5 4
Figure 2.4 Water infiltration rates in the soils of Muhoroni experimental field on sites pre-wetted for one day (a) and three days (b) before the commencement of the experiment.
BD, g/cm1
2.03
J Y=-1.39X+1.84 ,.8-jl 3 \ r = 0.97—
1.6-3
Où Q2 0.4 0.6 0.8
Moisture content, mass fraction
Figure 2.5 Moisture content and bulk density relations in the soils of Muhoroni site.
27
Chapter 2
(d) Bulk density
Moisture was found to have strong influence (r = 0.97***) on BD of these soils (Figure 2.5), indicating considerable changes in soil bulk volume with changes in soil moisture content. The maxima and minima BD values correspond to saturated and oven-dry soils, respectively. Changes in soil moisture content, expressed as moisture mass fraction (MMF), resulted not only in changes in BD but also in other properties such as pore-volume fraction (PVF), moisture volume fraction (MVF), and air-volume fraction (AVF) of the soil (Table 2.7). At MMF of 0.54, corresponding to 80% of maximum water holding capacity (WHC) of the study soil, the AVF was already very low (0.02) indicating denitrification risk. Water holding capacity was determined as described in section 5.3.3.
Table 2.7. Effect of moisture mass fraction on properties of Muhoroni Vertisol.
%WHC
MMF
BD, mg cm"3
PVF
MVF
AVF
0
0
1.84
0.31
0
0.31
20
0.14
1.65
0.38
0.23
0.15
40
0.27
1.46
0.45
0.39
0.06
80
0.54
1.09
0.60
0.58
0.02
90
0.62
0.99
0.63
0.61
0.02
100
0.68
nd
nd
nd
nd
WHC = water holding capacity; MMF = moisture mass fraction; BD = bulk density PVF, MVF, AVF = pore, moisture, and air volume fractions, respectively, nd = not determined
(e) Classification
In summary, the soils at the site were found to be characterized by shrink-swell properties as illustrated by the formation of cracks and, changes in soil volume with moisture variation resulting in increase in BD with decrease in moisture content. Slickensides were pronounced in all the profiles. The soils are imperfectly drained, having basic infiltration rate of 0.2 cm/h. Hydromorphic features of these soils were reflected in the occurrence of reduced iron and manganese concretions distributed in the profiles. The soils were also found to be characterized by high clay (> 60%), CEC [ > 30 cmol(+)/kg soil], and BS ( > 60%). These soils were therefore classified as eutric Vertisols (FAO-UNESCO, 1988) or Typic Pelluderts (Soil Survey Staff, 1990).
28
Part II
Literature review

CHAPTER 3
PROCESSES INFLUENCING FERTILIZER NITROGEN LOSSES IN VERTISOLS IN KENYA
3.1 Introduction
Nitrogen is the most universally deficient plant nutrient in tropical Vertisols (Bayene, 1988; Le Mare, 1989). In Kenyan Vertisols crop response to N is widespread (Ikitoo, 1989). The availability of applied fertilizer N to crops is subject to influence by such processes as denitrification (Fillery, 1983; Jarvis, et al., 1991; Aulakh et al., 1992), ammonia volatilization (Fenn & Hossner, 1985; Hargrove, 1988b; Priebe & Blackmer, 1989), leaching (Barraclough et al., 1992; Kamukondiwa & Bergstrom, 1994a), bypass flow (Dekker & Bouma, 1984; Andreini & Steenhuis, 1990), and immobilization (Stevenson, 1986; Powlson, 1993). It is also affected by fertilizer form or source and soil properties like texture, pH, and organic carbon contents that would in turn influence the processes mentioned above. Immobilization of N by soil organisms is not considered a loss from the soil system. Leaching of salts through the soil matrix is negligible in Vertisols characterized by very low water infiltration rate. Hence, denitrification, ammonia volatilization and bypass flow are considered important processes influencing fertilizer N losses in Vertisols.
3.2 Denitrification
3.2.1 General
Denitrification, a biochemical process by which facultative bacteria use nitrate and nitrite, in the absence of 02, as electron acceptors in their respiration thereby reducing the substrates (NO," and N02") to gaseous nitric oxide, nitrous oxide and dinitrogen (Eq 3.1 & 3.2), is one of the major avenues of nitrogen loss from soils (Fillery, 1983; Chalk & Smith, 1983; Jarvis, et al-, 1991).
24KN03 + 5C6H,206 > 12N2 + 30CO2 + 24KOH + 18H20 + Energy Eq. 3.1
1 2 3 4 NCy > N02- > NO > N20 -> N2 Eq. 3.2
The reduction of N03- to N2 is accomplished in the presence of nitrate-, nitrite-, nitric oxide-, and nitrous oxide-reductase that promote the processes at the steps 1, 2, 3, and 4, respectively (Knowles, 1982b; Fillery, 1983). Denitrification is of interest to
31

Chapter 3
environmentalists, soil scientists, and agronomists alike. Where high NO," levels in soil and/or water pose a pollution hazard, denitrification is considered a desirable process by which to reduce NO," levels (Aulakh et al., 1992). It is also a source of N20, a greenhouse gas, considered to be depleting ozone layer with the consequence of increasing global warming (Groffman, 1995). Besides, the process plays an important role in N cycling and fertilizer N use efficiency by crops (Burford & Bremner, 1975; Jarvis et al., 1991; McCarty & Bremner, 1992).
It has been observed that yields of maize and sugarcane grown in Vertisols in Kenya are low despite fertilizer N applications. Denitrification is suspected to be a possible cause of nitrogen loss from these soils (Smaling, 1993). The phenomenon, however, has not been studied in soils in Kenya. This is possibly due to lack of inadequately trained soil scientists working in the country (Sigunga, 1993 b).
Denitrification occurs in a wide variety of ecological settings (Cho et al., 1979; Beauchamp et al., 1980; Klemedtsson et al., 1991; Nielsen et al., 1994). It occurs in undrained and drained arable soils (Colbourn & Harper, 1987; Schnabel & Stout, 1994), drained peats (Jorgensen & Richter, 1992), acid soils (Kroeze et al., 1989; Nielsen et al, 1994), and in sandy soils (Bowman & Focht, 1974; Trudell et al., 1986). Denitrification losses from arable lands vary considerably (Nieder et al., 1989). The losses vary with climate (Jarvis et al., 1991), cropping systems (Klemedtsson et al., 1991; Weier et al., 1993b), fertilizer N application schedules (Svensson et al., 1991; Jarvis et al., 1991), and soil characteristics (Cho et al., 1979; Bandibas et al., 1994). It is to be expected that the soil factors affecting denitrification would interact with one another on the one hand, and with climatic constituents, especially rainfall amount and distribution as well as temperature on the other hand.
Some of the major soil factors influencing denitrification are texture and drainability, moisture content, distribution of denitrifying bacteria, organic matter content, and NO r
N supply, as well as temperature.
Soil texture affects drainability of soils: drainability gets poorer as the texture becomes finer. Soils characterized by low basic water infiltration rates or saturated hydraulic conductivity are prone to flood with water after heavy rainfall events (Landon, 1991). Excessive wetness excludes air, especially oxygen, 02, from the soil pore space thereby creating anaerobic condition (Fausey & Lai, 1990), since oxygen diffusion rate, ODR, in water is very low, being 10,000 times slower than in air (Russell, 1977). Adequate exchange of gases between the root and aerial atmosphere is required for optimal plant metabolism (Letey, 1985). Stolzy and Letey (1964) observed that ODR of 0.20|4g
32
Processes of nitrogen loss in Vertisols
02/cm2/min was required for growth of several plants. It was reported (Orchard & So, 1985) that the most significant changes in the soil environment following waterlogging, or excessive wetness, were the reduced availability of 02 and the loss of N03. Denitrification, being favoured by anaerobic conditions (Fillery, 1983; Weier et al., 1991), occurs at higher magnitude in saturated soils than in drained soils (Colbourn & Harper, 1987; Schnabel & Stout, 1994). Weier et al- (1993a) reported that total N loss due to denitrification greatly increased as soil texture became finer and water filled pore space (WFPS) increased.
3.2.2 Soil moisture content
Respiratory soil microorganisms take in 02 or, in some cases, ionic nitrogen oxides, and release C02 as a byproduct. Thus, production of C02 is indicative of metabolic activities of the microorganisms. The minimum soil moisture content at which C02
evolution commences varies widely with soils. Linn and Doran (1984a) reported low C02 production at soil moisture contents < 10 %WFPS, while Howard and Howard (1993) observed considerable variation among soil types with respect to C02 evolution rates at soil moisture levels < 20 %WHC. Evolution of C02 from incubated soil samples had been reported to increase with soil moisture content until near saturation (Rovira, 1953). The author argued that at saturation point, microbial activity was depressed by low 02 availability. It has been reported (Linn & Doran, 1984b) that 02
uptake reduced at soil moisture content > 60 %WHC, but C02 evolution continued. The authors also reported a reduction in relative microbial activity, as measured by C02 evolved, with increasing WFPS above 60%, but stabilized at WFPS > 90%.
In the report by Aulakh, et al., (1992) it was stated that water can directly and indirectly influence denitrification through provision of suitable conditions for microbial growth and activity, and as diffusion medium through which substrates (C, N03) move to, and products (N20, N2) are moved away from, the microsites. Knowles (1982b) reported that in most soils denitrification occurs only at water contents above 60% of maximum WHC, and that for a particular water content, denitrification increases with decreasing 02 concentration, and for a particular 02 level the denitrification increases with increasing water content.The author further reported that an increase in activity of denitrifiers is frequently observed between 100 and 200% of maximum WHC probably due to the presence , at 100% WHC, of air-filled inter-aggregate pores providing 02. These pores, he reasoned, become water filled at 200% WHC, restricting 02 diffusion and increasing the volume of anaerobic microenvironments in which denitrification can occur. Comparing the amount of N20 accumulated in the headspace of incubation containers in which soil cores received
33

Chapter 3
similar treatments, Aulakh and Doran (1991) found that significantly higher quantities of N 20 were produced in containers that were frequently opened than in the containers which were continuously sealed. They attributed the low accumulation of N 20 in containers continuously sealed at high WFPS to delayed N20 release from soil. It was also reported (Benckiser, 1994) that N20 formed during denitrification, diffusing through the soil pores may be entrapped in soil aggregates, dissolved in soil water, or be sorbed on clay minerals and organic substances.
In studying the relationships between denitrification and soil water content, WFPS or %WHC have been found better expressions of soil water content than matric potential, water potential, gravimetric or volumetric water contents (Rovira, 1953; Linn & Doran, 1984a; Aulakh et al., 1992; Howard & Howard, 1993). Use of WFPS or %WHC overcomes several problems associated with varying water saturation levels and bulk density for soils differing in texture and tillage (Aulakh et al., 1992; Howard & Howard, 1993).
3.2.3 Denitrifiers
Denitrifying bacteria, able to use nitrogen oxides as electron acceptors in place of 02 , are biochemically and taxonomically very diverse, but three genera, namely Pseudomonas, Alcaligenes and Bacillus, are of greatest importance (Knowles, 1982a). Fillery (1983) reported that about 20 bacteria genera had been identified as denitrifiers, and that only two genera, namely Pseudomonas and Alcaligenes are listed as the major ones, and are the most ubiquitous in soils. Tiedje et al. (1989) reported that respiratory denitrifiers prefer to use 0 2 as their electron acceptor and will reduce N-oxides only when 0 2 is not available. Yeomans et al. (1992) working with some Iowa soils, found that the number of denitrifying bacteria in soil profile samples decreased with depth but was significant even at the 200 to 300cm depth. They also found that the abilities of the samples to denitrify N0 3 in the absence of added organic C decreased with depth, but was substantial in those samples which had high organic C contents. The authors concluded that the slow rate of denitrification in Iowa subsoils was not due to lack of denitrifying bacteria but to lack of organic C that can be utilized by the microorganisms for reduction of N03 . Several researchers (eg. Knowles, 1982a; Beauchamp et al., 1989; Jarvis et al., 1991; Weier et al., 1993b) have concurred that denitrification activity of soil microorganisms is related to organic C contents of soils.
3.2.4 Available carbon
Soil microorganisms require energy for their metabolic activities. They derive their
34
Processes of nitrogen loss in Vertisols
energy primarily from organic C. However, not all forms of soil organic C is utilizable by the soil microorganisms, since much of the soil organic C is resistant to decomposition. Stanford et al. (1975) studied the relationship between denitrification rate and total soil C, as well as extractable glucose-C. The authors concluded that readily decomposable glucose-C was a better parameter to predict denitrification rate. It has been reported by several authors (eg. Burford and Bremner, 1975; Knowles, 1982a; Beauchamp et al., 1989; Jarvis et al., 1991) that denitrification in soils is controlled largely by the supply of readily decomposable organic matter, and that analysis of mineralizable C or water soluble organic carbon (WSOC) provides a good index of a soil's capacity to denitrify N03. Batonda and Waring (1984) also examined the relationships between denitrification and both total C and WSOC in 21 different soil samples, and reported a strong correlation between WSOC and N03-N loss. They observed that drying and grinding soil increased the content of WSOC in the samples leading to high rate of N03-N loss. Reports by Firestone (1982), McCarty and Bremner (1992), and Weier et al (1993a &b) showed significant increases in denitrification rates with addition of exogenous energy sources such as glucose and sucrose. Thus, the availability of readily utilizable C by denitrifiers is an important factor in influencing denitrification (Groffman et al., 1988; McCarty & Bremner, 1992; Yeomans et al., 1992). It was reported (Stanford et al., 1975; Batonda & Waring, 1984) that the WSOC in soils decline quite rapidly in time such that 80 to 100% of the initial WSOC was used up within 4 days of incubation. Jörgensen and Richter (1992) observed that in most soils less than 12% of organic C consists of readily hydrolysable sugar C that is important for denitrifying bacteria. They reported that the soil contents of both organic C and readily hydrolysable C exhibit a strong profile differentiation, decreasing markedly with depth.
3.2.5 Nitrate supply
The effects of nitrate supply on denitrification rate appears to be variable depending on some other factors. Denitrification rate may follow either zero-order or first-order kinetics depending on N03 concentration and the supply of oxidizable substrate given other modifying factors favourable. Stanford et al. (1975) observed that denitrification follows first-order kinetics in respect of N03 when oxidizable C is not limiting, and NO, levels are lower than 40 mg N03-N/kg soil. Klemedtsson et al. (1991) reported that denitrification followed first- and zero-order kinetics when NO, concentrations were lower and higher than 4ug N/g soil, respectively. It had been suggested (Firestone, 1982) that the first-order kinetics for N03 concentration cited in several reports resulted from the concentration-dependence of N03 diffusion rather than reduction. Since NO, diffusion to microsites where denitrification occurs is
35
Chapter 3
concentration-dependent, the effect of diffusion would make the process appear to be first-order (Rolston, 1981).
In the reports by Rolston (1981) and Knowles (1982a), it was noted that denitrification rates in soils are independent of N0 3 concentrations over a wide range. However, Aulakh et al. (1992) reported that denitrification rates are substrate-dependent (ie. first-order kinetics) at N0 3 concentrations < 100 rag N03-N/kg soil. Weier et al. (1993a) reported increase in denitrification rates in 4 soils with increasing N0 3 concentrations at high available C (glucose) addition. The authors also reported that the denitrification rate decreased with increasing N0 3 supply in the absence of additional glucose. Aulakh et al. (1992) reported that the dependence of denitrification rate on soil moisture, anaerobiosis, and available C is the possible reason why denitrification rates under laboratory conditions, where soils are incubated with high water content and available C supply, depend upon N0 3 supply. It has also been reported (Knowles, 1982b; Weier, et al., 1993a) that high N0 3 concentration may inhibit the enzymatic reduction of NO and N20 causing accumulation of intermediates and higher N20/N2 ratio, respectively.
The relationship between denitrification rate and N0 3 supply is somewhat complex. Firestone (1982) observed that the inherent heterogeneity of natural soils in terms of N0 3 concentration, C availability, aeration, and microbial distribution should make the elucidation of denitrification kinetics in natural soils a challenging topic for some time to come. Aulakh et al. (1992) reported that the interpretation of denitrification kinetics which is already difficult in natural soils because of inherent heterogeneity in many of the factors that influence the process is further complicated by frequency and severity of wetting and drying cycles. The authors contended that kinetic constants for N0 3 and N0 2 in relation to denitrification have little quantitative meaning in their own. Benckiser (1994) conceded that attempting to relate denitrification field data to the predictions of well-posed hypotheses could be a task verging on the impossible. The author suggested that modellers should not venture out into the field but restrict their investigations to theory and laboratory experimentation in which controlled parameters could use to advantage the qualitative changes in behaviour from non-chaotic to chaotic dynamics.
The situation is further complicated by variation of denitrification rate in the field with crop species and cropping system. Klemedtsson et al. (1991) reported that the functional relationship between denitrification rate and soil nitrate and moisture levels varied between crops, sampling locations vis-a-vis plant rows, and years. The authors further reported that denitrification rates in grass leys depended to a significant degree on soil nitrate levels, whereas N0 3 concentration was of no value in predicting rates
36
Processes of nitrogen loss in Vertisols
in barley plots, even though the ranges in N03 concentrations over the growing season in the two crops were similar. They conceded that the relationship between soil moisture, NO, concentration, and denitrification rate was more complex than they could represent. Svensson et al. (1991) also reported higher denitrification rates in the lucerne- than in the barley- and grass-leys though no extra N03 was added to the plots. Nitrifying activity in the soil is one of the factors influencing denitrification (Benckiser, 1994). Nitrification affects denitrification through its effects on the production of N03-N from NH4-N. Wetting and drying cycles prevalent in the field enhance mineralization thereby increasing soil C and N03 levels available for denitrification (Birch, 1958 & 1959; Aulakh et al., 1992). Nitrification rate is influenced by soil type, N source and application rate. Soil texture affects the relationship between soil air and moisture volume fractions thereby imparting influence on nitrification since the process is (Independent. Abbes et al. (1994) reported significant differences in nitrification rates among N sources and rates as well as among soil types.
3.2.6 Denitrification variability in soils
One of the common features of denitrification under field situations is its variability both in space and in time (Tiedje et al., 1989; Svensson et al., 1991). Cho et al., (1979) found denitrification rates in three irrigated Alberta soils to vary with season, being 70 kg N/ha/day (= 2.9 kg N/ha/h) in August and 5 kg N/ha/day (= 0.2 kg N/ha/h) in December in the same field. The difference in denitrification rates was ascribed to temperature, August being warmer. Malhi et al., (1990) measured denitrification rates in 14 cultivated surface soil samples with varying C contents and found the rates to range from 12 to 21 mg N/kg soil/day (= 1.1 to 1.9 kg N/ha/h). Denitrification rate is also influenced by interaction between soil moisture content, organic C and N03-N concentration. Weier, et al., (1993a) found denitrification rate to vary with soil type, N03 concentration, C contents and %WFPS in four soil series.
3.2.7 Denitrification Measurements
Denitrification measurements are made mainly to study the reaction sequence of this process and factors affecting it, or to determine the amount, rate, site and timing of N loss in denitrifying systems. There are many methods available for measuring denitrification losses in the laboratory and the field. These include nitrate/chloride ratios, nitrate disappearance, nitrogen balance, nitrogen gas production in sealed chambers, nitrogen production calculated from soil gas gradient, non-random isotope distribution, micrometeorological methods, acetylene techniques, and l5N methods (Hauck, 1986; Smith, 1988; Colbourn & Harper, 1987). Selection of the measurement
37
Chapter 3
technique to be used in a particular study should be consistent with the objectives of the study and should be made with awareness of the method's limitations (Hauck, 1986). The acetylene inhibition technique and '5N are, however, the most reliable and widely used (Tiedje, et al. 1989).
3.2.7.1 Acetylene inhibition technique, AIT.
The AIT is based on the principle that C2H2 inhibits the bacterial reduction of N20 to N2 (Ryden et al., 1979; Nieder et al., 1989), and provides a direct method of measuring denitrification N losses under a wide range of circumstances (Jarvis et al., 1991). The AIT is reported (Duxbury, 1986; Tiedje et al., 1989) to have a number of advantages, the major ones of which include the following;
1. High sensitivity that allows for small fluxes of N20 from soil to be easily measured.
2. The method allows for a large number of samples that may be assayed so that the spatial and temporal distribution of denitrification N losses can be analyzed.
3. The versatility of the method allows its use in laboratory, field, and remote studies. 4. The cost involved, especially for the analytical equipment, is considerably much
less than in the case of N-isotope. 5. It allows for the use of natural substrate (eg. soil-derived N03-N).
Along with the above listed advantages, there are also disadvantages that limit the use of AIT. Rolston (1986) and Tiedje et al (1989) reported a number of disadvantages associated with AIT which include the following;
1. C2H2 inhibits nitrification and, hence, its use may be limited in situations where denitrification N losses from concurrent nitrification is to be measured.
2. Some bacteria can utilize C2H2 as a source of C, thereby reducing its effectiveness to inhibit N20 reduction to N2.
3. Some denitrifiers can adapt to C2H2 after a long exposure (eg. > 7 days) and resume reduction of N20 to N2 despite the presence of C2H2.
4. Diffusion of C2H2 in high clay soils and poorly drained soils is low making its adequate distribution under such conditions difficult to ensure.
3.2.7.2. 15N method
The 15N approach provides an indirect method of measuring denitrification N losses (Hauck, 1986), as it relies on the estimation of the non-recovery of 15N-labelled compounds (Nieder et al., 1989). Using l5N method in N cycling studies, denitrification
38
Processes of nitrogen loss in Vertisols
is estimated by the difference between applied and recovered N as in the following relationship:
Denitrification N loss = N applied - (N in plant + N in leaching + N volatilized + N remained in soil).
Since the unaccounted for l5N, taken to represent denitrification N loss, actually represents the sum of all experimental errors (Rolston et al., 1979) besides denitrification losses, the difference method does not seem to be accurate for denitrification studies (Tiedje et al., 1989).
3.2.7.3 Comparing AIT and 15N methods.
Some researchers (eg. Rolston et al., 1982; Mosier et al., 1986) found no significant difference between the two methods of measuring denitrification N losses. Since the AIT and l5N methods can give equally acceptable quantitative measurements of denitrification, either of them may be used (Tiedje et al., 1989). The authors, however, cautioned that in choosing the method to use, questions relating to the characteristics of the site to be studied, availability of required equipment, and the cost involved need be addressed. Goulding et al. (1993) also found acetylene inhibition technique and l5N method to give comparable results.
3.3 Ammonia volatilization
3.3.1 General
Ammonia volatilization is a mass transfer of gaseous NH3 from soil, water and/or plant surfaces into the atmosphere. The driving force behind volatilization is the difference in partial pressures between gaseous NH3 in the air on the one hand and that in the soil, water or plant systems on the other hand (Freney et al., 1983; Fenn & Hossner, 1985: Koelliker & Kissel, 1988). Volatilization of NH3 from soil system into the atmosphere is controlled through a number of equilibria, each of which is influenced by many factors singularly or interactively.
3.3.2. Fundamental equilibria in ammonia volatilization
The fundamental equilibria governing NH3 volatilization from soil to the atmosphere may be schematically represented as in Figure 3.1. Ammonium-N adsorbed onto soil colloids at point A (Figure 3.1) has to be transformed to NH3, and be translocated to
39
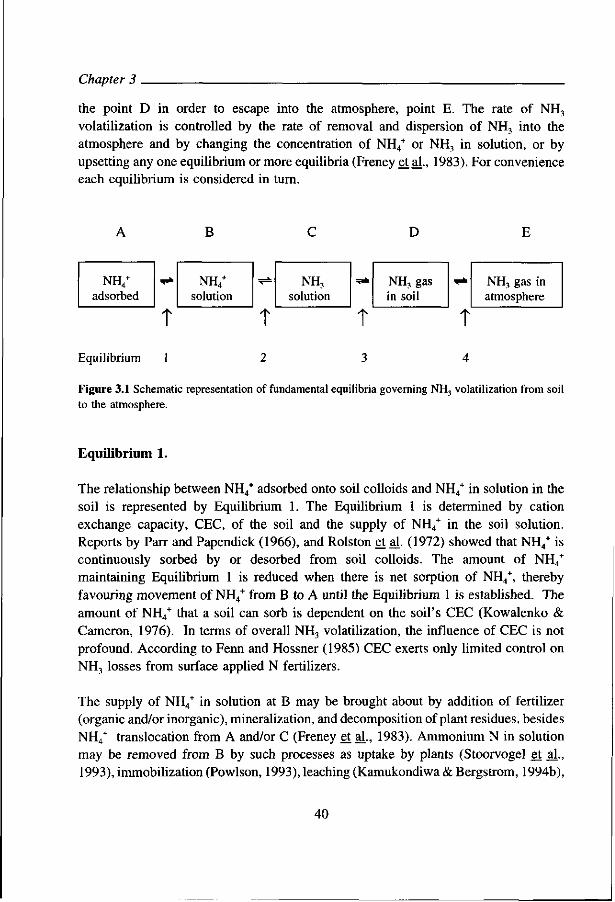
Chapter 3
the point D in order to escape into the atmosphere, point E. The rate of NH3
volatilization is controlled by the rate of removal and dispersion of NH3 into the atmosphere and by changing the concentration of NH4
+ or NH3 in solution, or by upsetting any one equilibrium or more equilibria (Freney et al., 1983). For convenience each equilibrium is considered in turn.
B D
NH4+
adsorbed
Equilibrium
T
i
NH4+
solution
T
2
NH, solution
T
3
NHj gas in soil
**
Î
4
NH3 gas in atmosphere
Figure 3.1 Schematic representation of fundamental equilibria governing NH3 volatilization from soil to the atmosphere.
Equilibrium 1.
The relationship between NH4+ adsorbed onto soil colloids and NH4
+ in solution in the soil is represented by Equilibrium 1. The Equilibrium 1 is determined by cation exchange capacity, CEC, of the soil and the supply of NH4
+ in the soil solution. Reports by Parr and Papendick (1966), and Rolston et al. (1972) showed that NH4
+ is continuously sorbed by or desorbed from soil colloids. The amount of NH4
+
maintaining Equilibrium 1 is reduced when there is net sorption of NH4+, thereby
favouring movement of NH4+ from B to A until the Equilibrium 1 is established. The
amount of NH4+ that a soil can sorb is dependent on the soil's CEC (Kowalenko &
Cameron, 1976). In terms of overall NH3 volatilization, the influence of CEC is not profound. According to Fenn and Hossner (1985) CEC exerts only limited control on NH3 losses from surface applied N fertilizers.
The supply of NH4+ in solution at B may be brought about by addition of fertilizer
(organic and/or inorganic), mineralization, and decomposition of plant residues, besides NH4
+ translocation from A and/or C (Freney et al., 1983). Ammonium N in solution may be removed from B by such processes as uptake by plants (Stoorvogel et al., 1993), immobilization (Powlson, 1993), leaching (Kamukondiwa & Bergstrom, 1994b),
40

and nitrification (Abbes et al., 1994).
Processes of nitrogen loss in Vertisols
The most important source of NH4+ supply at B is the fertilizer, either inorganic or
organic. Common inorganic N fertilizers are ammonium sulfate (AS), ammonium nitrate (AN), mono-ammonium phosphate (MAP), diammonium phosphate (DAP), ammonium chloride (AC1), and ammonia (NH3). Organic fertilizers are represented by urea (U), manures (M), and plant residues (P). The reaction mechanisms by which NH3
loss occurs from inorganic and organic fertilizers applied to soils differ in their driving force (Fenn & Kissel, 1974; Fenn & Hossner, 1985).
In the case of inorganic N fertilizers Fenn and Kissel (1973) provided a general form of reaction as follows:
X(NH4)2 Y + DCaC03 ^ D(NH4)2C03 + CanYx Eq. 3.3
(NH4)2C03 + H20 —» 2NH3 Î + 2H20 + C02î Eq. 3.4
1 I 2NH4OH
where Y represents the anion of the NH4 salt and D, X and n are dependent on the valences of the anions and cations (Eq. 3.3).
The product (NH4)2C03, being unstable, decomposes producing NH3 and C02 gases (Eq. 3.4). The decomposition of the ammonium carbonate is determined by the solubility of Ca„Yx and its rate of formation. Insoluble Ca„Yx favours the reaction proceeding to the right (Eq. 3.3) resulting in the production of additional OH" and an increase in pH (Eq. 3.4). Soluble CanYx does not favour the reaction (Eq. 3.3) to proceed to the right, and formation of NH3 from NH4
+ will depend primarily on the native pH of the soil. For instance, AS reacts with CaC03 to form relatively insoluble CaS04 (Eq. 3.5), while AN does not produce insoluble CanYx with CaC03 (Eq. 3.6), since it does not produce (NH4)2C03 in a calcareous soil as shown below (Fenn & Miyamoto, 1981):
(NH4)2S04 + CaC03 —» (NH4)2C03 + CaS04i Eq. 3.5
2NH4N03 + CaC03 ^~ (NH4)2C03 + Ca(N03)2 Eq. 3.6
41
Chapter 3
Urea is a common compound in organic fertilizers. As such, reaction mechanism involving U in the NH3 volatilization is representative for the organic fertilizers. The enzymatic decomposition of urea by urease was presented by Fenn and Hossner (1985) as follows:
urease
CO(NH2)2 > (NH4)2C03 Eq. 3.7
H20
The (NH4)2C03 so formed breaks down as in reaction (Eq. 3.4) above releasing NH3
and C0 2 gasses.
Equilibrium 2.
The equilibrium between NH4 and NH3 in aqueous solution is determined by the pH of the medium (Court et al., 1964; Freney et al., 1983; Fenn & Hossner, 1985: Koelliker & Kissel, 1988). At pH > 7 relative concentrations of NH3 and NH4
+ become higher and lower at a given temperature, respectively (Figure 3.2).
The prevailing pH following fertilizer addition to a soil system depend on the native soil pH, fertilizer type, and soil buffering capacity, all of which contribute interactively to the pH level that will finally influence NH3 volatilization (Fenn & Hossner, 1985; O'Toole et al., 1985; Koelliker & Kissel, 1988; Whitehead & Raistrick, 1990). For instance, urea hydrolysis engenders rise in pH as a consequence of H+ consumption (Ferguson et al., 1984) as shown in the following reactions:
urease
CO(NH2)2 + H+ + 2H20 > 2NH4+ + HC0 3 , at pH > 7 Eq. 3.8
urease
CO(NH2)2 +2H+ + 2H20 > 2NH4+ + H2C03, at pH < 6.3 Eq. 3.9
The H2C03 is, in fact, carbonic acid plus aqueous carbon dioxide (Koelliker & Kissel, 1988). The generated pH will, however, be counterbalanced to some extent by the soil's inherent characteristic to resist pH changes. Soil's ability to resist changes in its pH whenever H+ or OH" ions are added to it is its buffering capacity (Buckman & Brady, 1974). The buffering capacity of a soil against an increase in pH depends upon the soil's total acidity comprised of exchangeable acidity plus non-exchangeable
42
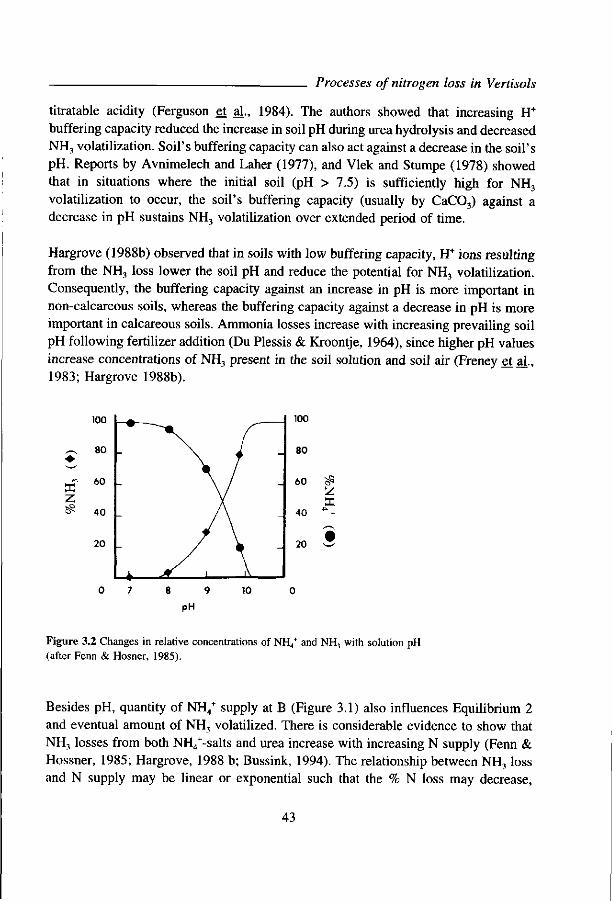
Processes of nitrogen loss in Vertisols
titratable acidity (Ferguson et al., 1984). The authors showed that increasing H+
buffering capacity reduced the increase in soil pH during urea hydrolysis and decreased NH3 volatilization. Soil's buffering capacity can also act against a decrease in the soil's pH. Reports by Avnimelech and Laher (1977), and Vlek and Stumpe (1978) showed that in situations where the initial soil (pH > 7.5) is sufficiently high for NH, volatilization to occur, the soil's buffering capacity (usually by CaC03) against a decrease in pH sustains NH3 volatilization over extended period of time.
Hargrove (1988b) observed that in soils with low buffering capacity, H+ ions resulting from the NH3 loss lower the soil pH and reduce the potential for NH3 volatilization. Consequently, the buffering capacity against an increase in pH is more important in non-calcareous soils, whereas the buffering capacity against a decrease in pH is more important in calcareous soils. Ammonia losses increase with increasing prevailing soil pH following fertilizer addition (Du Plessis & Kroontje, 1964), since higher pH values increase concentrations of NH3 present in the soil solution and soil air (Freney et al., 1983; Hargrove 1988b).
Figure 3.2 Changes in relative concentrations of NH4+ and NH3 with solution pH
(after Fenn & Hosner, 1985).
Besides pH, quantity of NH4+ supply at B (Figure 3.1) also influences Equilibrium 2
and eventual amount of NH3 volatilized. There is considerable evidence to show that NH3 losses from both NH4
+-salts and urea increase with increasing N supply (Fenn & Hossner, 1985; Hargrove, 1988 b; Bussink, 1994). The relationship between NH3 loss and N supply may be linear or exponential such that the % N loss may decrease,
43

Chapter 3
remain constant, or increase with increasing application rates (Hargrove and Kissel, 1979). Vlek and Stumpe (1978) postulated that NH3 loss is a first order reaction with NH3 loss directly related to N supply. This relationship applies to N fertilizers which form precipitate with CaC03 [eg. (NH4)2S04, (NH4)2HP04], but does not hold for the non-precipitate forming fertilizers such as NH4N03 and NH4C1 (Fenn & Kissel, 1974; Fenn & Hossner, 1985)
Equilibrium 3.
In nature, chemical and biochemical reactions are influenced by temperature, and so is NH3 volatilization. The partition of NH3 between the liquid and gaseous phases follows Henry's law, and may be represented as:
[NH3] aqueous = H Eq. 3.10
[NH3] gaseous
at a particular temperature (Koelliker & Kissel, 1988). An expression for the variation of the constant H in the above equation with temperature was worked out by Hales and Dremes (1979) and given as:
log10 H = 1477.7/T-1.6937
where H, the Henry's constant, is the ratio between the dissolved molar concentration of NH3 in pure water and the molar gaseous concentration, and T is the absolute temperature (°K).
Reports by Fenn and Kissel (1974), Fenn and Miyamoto (1981), Fenn and Hossner (1985), and Koelliker and Kissel (1988) demonstrate that NH3 volatilization rate increased with increasing temperature. For a given amount of NH4
+ in the soil solution (point B) and the same air movement conditions (point E), loss of NH3 is directly related to the pH and temperature of the soil solution since the partial pressure of gaseous NH3 in soil solution is directly related to pH and temperature (Koelliker & Kissel, 1988). The authors illustrated the relative importance of pH and temperature on NH3 volatilization by displaying the driving force as influenced by the two factors (Figure 3.3).
44

Processes of nitrogen loss in Vertisols
Equilibrium 4
The driving force, df, for NH3 volatilization from a moist soil or solution surface is usually considered to be the difference in NH3 partial pressure between gaseous NH3
in the atmosphere, point E, and gaseous NH3 in the solution, point D (Freney et al., 1983; Denmead et al., 1982). Air movement sweeps away the NH3-ladden layer resulting in the lowering of the partial pressure of NH3 at E. Consequently, more NH3
at D moves to E. The sweeping away of the NH3-ladden layer from, and concomitant lowering of partial pressure at E is facilitated by wind and temperature (Denmead et al., 1982). The partial pressure of NH3 at E may also be reduced by provision of a sink for gaseous NH3 in the vicinity. For instance, the inclusion of HCl, H2S04, etc in closed flux chambers to trap NH3 lowers the partial pressure of gaseous NH3, and provides the driving force for ammonia volatilization (Ventura & Yoshida, 1977; Whitehead & Raistrick, 1990; Oenema & Velthof, 1993).
6 0
e •S 40 N
> jg 'St ° 20 ->
OS
1 — 1 — " • -
Relative driving force = 1 at pH 7 and 25 "C.
-
i
V
1
y
i
o / -N S
'
6.5 7.5 8.5
pH
Figure 3.3 Influence of soil solution pH and temperature on relative driving force for NH, volatilization (after Koelliker & Kissel, 1988).
3.3.3 Management factors influencing NH, volatilization
3.3.3.1 Effect of fertilizer placement mode
Many reports show that maximum NH3 losses occur when N fertilizers are applied to soil surface (eg. Fenn & Escarzaga, 1976; Fenn & Miyamoto, 1981; Freney et al.,
45

Chapter 3
1983). Broadcast surface application often results in higher NH3 losses than band surface application. Touchton and Hargrove (1982), and Eckert (1987) showed that surface-broadcast was inferior to surface band applied urea-ammonium nitrate solution. Incorporating fertilizer within 5 to 10 cm soil depth is reported to be very effective in reducing NH3 losses from N fertilizers (Fenn & Kissel, 1976; Bouwmeester et al., 1985). The influence of incorporation is, however, less effective with AS than with Urea. Fenn and Miyamoto (1981) reported that 27% of NH3 was lost from AS placed at 7.5 cm soil depth.
3.3.3.2 Effect of nitrogen source
The magnitude of NH3 losses from fertilizer N is influenced by N source. Whitehead and Raistrick (1990) compared NH3 losses from AS, AN, MAP, DAP and U surface applied to 5 soil types differing in pH and CaC03, and found that NH3 losses were significantly influenced by N source and soil type. The authors also showed that there was interaction between N source and soil type with respect to NH3 loss depending on the solubility of the product formed during the reaction between soil constituents and the applied fertilizer. Other reports (Hargrove et al., 1977; Keller & Mengel, 1986; Oenema & Veithof, 1993; Gezgin & Bayrakll, 1995) have also demonstrated variation in NH3 loss with N sources in different soil types.
3.3.3.3 Effect of moisture content and relative humidity
The variability in soil water content is probably one of the most confounding factors affecting NH3 loss from surface applied N fertilizers (Fenn & Hossner, 1985). Hargrove (1988b) conceded that the influence of soil water content on NH3
volatilization is complex and has been the most difficult to determine under dynamic field conditions. Bouwmeester et al. (1985) showed that for maximum NH3
volatilization, the soil water content must be at or near field capacity (¥=-33 kPa) at the time of fertilizer application. Inorganic fertilizers (eg. AS, AN, etc.) and organic fertilizers (eg. U) require water for solubilization and hydrolysis, respectively (Fenn & Escarzaga, 1976). In a dry soil, dissolution of dry fertilizer materials is slow and the biological and chemical reactions necessary for NH3 volatilization are very slow or may not occur (Hargrove, 1988b). Fenn and Escarzaga (1976) applied AN and AS to Houston Black clay with a range of moisture content from oven dry (0%) to saturation (55%) and found that evaporation enhanced NH3 loss from originally wet soil, and that at temperature higher than 30 °C NH3 losses were high regardless of the moisture content. Tisdale et al. (1985), quoting work done by Stanley and Smith on silt loam (1956), reported that soil moisture content at or near field capacity provided maximum
46
Processes of nitrogen loss in Vertisols
retention of ammonia, and that as soils became either drier or wetter than field capacity they lose their ability to hold ammonia. In contrast, Fenn and Escarzaga (1977) surface applied fertilizer to soils brought to 60 - 80% of water saturation and reported that initially wet soil resulted in higher NH3 loss than initially dry soils in most soils with both AN and AS . The authors also reported that addition of increasing water quantities reduced total NH3 loss. The main function of relative humidity appears to be limited to keeping the surface soil moist enough to allow for urea hydrolysis and solubilization of anhydrous N fertilizers. Report by Reynolds and Wolf (1987) showed that %RH had no effect on NH3 volatilization when the moisture content at the soil surface was high and constant.
3.3.3.4 Urease activity
The main soil factors affecting urease activity in soils are temperature, water potential, pH, organic C, and total N (Hargrove, 1988b). Kissel and Cabrera (1988) reported that urease activity increases exponentially with temperature within the range 0 to 40°C. Information on the effect of temperature > 40°C is not definitive. The authors also reported maximum urease activity at about -20 kPa soil moisture potential. Urease will function effectively at any soil pH in which plants will grow (Hargrove, 1988b). Kissel & Cabrera (1988) reported that the best correlation of urease activity is with organic C, total N, and CEC, with organic C giving the best prediction of urease activity. The effect of organic matter on urease activity depends on the availability of the organic matter as a source of energy for urease-producing microorganisms.
3.3.4 Importance and occurrence of NH3 volatilization
Ammonia originates from natural processes such as the biological degradation of organic matter, plant residues, and animal wastes. In addition, NH3 is also emitted from fertilizer breakdown, as well as from industrial and combustion processes (Denmead, 1990). Gaseous NH3 provides an important pathway in the terrestrial N cycle (Harper, 1988; Sharpe & Harper, 1995). Ammonia volatilization from soil, plant, and water systems can lead to considerable N losses from agricultural systems (Harper, 1988; Denmead, 1990; Sharpe & Harper, 1995). Much of the N in agricultural systems is lost to the atmosphere particularly where livestock waste, urea and/or anhydrous ammonia-producing fertilizers are surface applied. Some reports (eg. Fenn & Kissel, 1974; Freney et al., 1983; Whitehead & Raistrick, 1990; Jayaweera & Mikkelson, 1991) show that as much as 70% of surface applied N fertilizers may be lost in gaseous NH3.
Ammonia N can be volatilized from fertilizer (organic or inorganic) applied to crops
47
Chapter 3
before it is taken up by the crops. It can also be lost from the surfaces of plant shoots. It has been demonstrated that plants lose NH3 through the stomata to the atmosphere (Farquhar et al., 1980; Morgan & Parton, 1989; Denmead, 1990; Sharpe & Harper, 1995). Other reports (Harper, et al., 1987; Francis et al., 1993) show that plants absorb NH3 from the atmosphere via diffusion through the stomata. Thus, plants can both absorb and desorb atmospheric NH3 depending on prevailing conditions. Farquhar et al. (1980) introduced the term "ammonia compensation point" to refer to finite concentration of NH3 in the air spaces within plant leaves, which is in dynamic equilibrium with ammoniacal N in the transpiration stream and NH3 solution in the plant cells. The authors found that plants will absorb NH3 from, or lose it to, the air when ambient NH3 concentrations are above or below the compensation point, respectively. Ammonia compensation point has been found to vary with crop species (Parton et al., 1988; Schj0rring et al., 1989; Harper et al., 1989), temperature (Farquhar et al., 1980), level of nutrition (Morgan & Parton, 1989), and senescence of plant leaves (Wetselaar & Farquhar, 1980; Harper et al., 1987; Parton et al., 1988; Bussink, 1996).
3.3.5 Ammonia volatilization measurements
The methods used for measuring NH3 volatilization are many and varied. Some are designed exclusively for use under field conditions (Denmead, 1983; Harper, 1988; Bussink, 1994), and others are suited for laboratory situation (Fenn & Kissel, 1973; Oenema & Velthof, 1993; Blaise & Prasad, 1995), while some may be used both in the laboratory and in the field (Harper, 1988). The choice of a method to use is governed by such factors as the objective of the study and the precision required as well as cost, convenience and availability of expertise.
Marshall and Debbel (1980) evaluated a number of commonly used systems for collecting NH3 gas using the same surface, and found considerable variations amongst the systems. The authors concluded that the closed dynamic system most nearly approximated actual field NH3 losses. Oenema and Velthof (1993) compared the performance of the vented closed flux chamber with the flow through flux chamber (closed dynamic system) and reported twice as high standard deviation for the latter than for the former and, hence, they employed the use of vented closed flux chamber system in their subsequent studies on NH3 volatilization. According to Fenn and Hossner (1985) data obtained from laboratory-based experiments may not be precisely reproducible on a field basis, but in most cases the laboratory generalizations are useful in the field.
48
Processes of nitrogen loss in Vertisols
3.4 Bypass flow
3.4.1 General
There are two ways by which fertilizer N may move quickly down the soil profile to depths beyond the reach of plant roots in which case the fertilizer N is lost as far as N uptake by the plant is concerned. The two ways are leaching and bypass flow. The concept of leaching is applicable if the solute (eg. N03", NH4
+, Ca2+, K+, etc.) moves in water through soil matrix to depths beyond the reach of growing plant (Terry & McCants, 1973), as is the case in unstructured soils (Nielsen et al., 1986; White et al., 1986). In contrast, bypass flow concept holds in situations where the solute and water circumvent the soil matrix and move down the profile through preferential paths such as moleholes, wormholes, root channels and/or cracks (Bouma et al., 1981) as it is commonly the case with structured soils like swell-shrink soils (Smettem et al, 1983).
Bypass flow, defined as vertical flow of free water along the walls of continuous, well-connected structured pores in unsaturated soil (Bouma et at., 1981; Smettem et al., 1983), has been variously referred to as preferential flow (Andreini & Steenhuis, 1990), channelling (Beven, 1981), short-circuiting (Bouma et al., 1981), and bypassing flow (Smettem et al., 1983).
In structured soils (eg. clay) preferential flow paths originate principally from the surface, while in nonstructured soil the paths may develop at any depth (Van Ommen et al., 1988). The preferential paths or macropores are formed in various ways: shrinkage, chemical weathering, mole draining, plant roots, etc. (White, 1985; Andreini & Steenhuis, 1990). In Vertisols, heavy clay soils, shrink-swell phenomenon is the major cause of cracking (Wilding & Tessier, 1988; Bronswijk & Evers-Vermeer, 1990). The cracks, and other macropores, are of interest to agronomists as well as to environmentalists because of the possible consequences for rapid loss of fertilizers, soluble waste materials, and other potential pollutants into surface as well as ground water (Bouma et al., 1983). From the position of agronomists and farmers, fertilizer carried in bypassing water down the soil profile beyond the rooting reach of crops is a loss.
3.4.2 Bypass flow and fertilizer N losses
It has been reported (Bouma & Loveday, 1988) that macropores or preferential flow paths facilitate rapid movement of solute with water down the soil profiles beyond the reach of plant roots. This often leads to losses of not only applied fertilizer nitrogen
49
Chapter 3 .
but also mineralized nitrogen in soil systems (Smettem et al., 1983; Dekker & Bouma, 1984; Andrieni & Steenhuis, 1990).
Fertilizer N losses in bypass flow may be minimized by tillage practices, timing fertilizer application, splitting fertilizer application, and choosing appropriate fertilizer type. Conventional till destroys the structure of the surface soils, mixing the plough layer and covering the macropore's connection to the surface leading to reduced fertilizer losses in the bypass flow (Logsdon, 1995). In contrast, no-till has more continuous macropores and other preferential paths reaching directly from the surface deep into the subsoil (Andreini & Steenhuis, 1990). Smaling and Bouma (1992) using Vertisol columns from Kenyan dry grassland and cropland (tilled topsoil) found that there were more fertilizer losses from the grassland than from the cropland. They also found that fertilizer losses were higher when fertilizer was applied before wetting the soil columns than when fertilizer was applied after pre-wetting the soil columns.
3.4.3 Effect of fertilizer N on soil N leaching losses
Applied fertilizer N, in another dimension, is known to influence the release of soil nitrogen in a variety of soil systems (Broadbent, 1965; Westerman & Kurtz, 1973 & 1974; Mochoge, 1989; Azam et al-, 1994a & b; Hamid & Ahmad, 1995). The phenomenon of increase in uptake of soil N by plant as a result of added fertilizer is referred to as "Priming Effect" (Hauck & Bremner, 1978; Westerman & Tucker, 1974; Jenkinson et al., 1985). Aleksic et al. (1968), however, conceptualized the phenomenon of priming effect to refer to increase in availability of soil N following fertilizer N addition. The presence of plants is not essential for a priming effect to occur since there are instances whereby more unlabelled inorganic N has been observed in soils incubated with labelled inorganic N than in the corresponding soil incubated without labelled N (Jenkinson et al., 1985). Westerman & Kurtz (1973) reported that fertilizer N increased the uptake of soil N by crop by 17 to 45% in one experiment, and 8 to 27% in the other. Mochoge (1989) applied (NH4)2S04 and KN03, at an equivalent rate of 140 kg N/ha, to soil columns and supplied water. It was found that a total of 215.9 kg NOj-N was recovered in the outflow which was equivalent to 154% of the input. The NH4-N concentration in the outflow was extremely low and inconsistent. Reports by Mochoge (1989), Azam et al- (1994a & b), Hamid & Ahmad (1995), and Sen & Chalk (1995) showed that the amount of soil N released increased with fertilizer N added to the soil.
There has been considerable controversy over the cause and interpretation of this phenomenon (Jenkinson et al., 1985). Priming effect is thought to be caused by
50

Processes of nitrogen loss in Vertisols
stimulatory effect of added N on microbial decomposition of organic N (Westerman & Tucker, 1974). Broadbent (1965) and Broadbent & Nakashima (1971) suggested that osmotic effects contributed to the mineralization of organic N in the soil, but that the magnitude depends on the salt and the nature of the soil. Singh et al., (1969) investigated the effects of different kinds and concentrations of salts on the release of NH4-N from soils and suggested that chemical reactions involving ions are involved in priming effect. Laura (1975) also suggested that the addition of ammonium and nitrate ions to a soil can induce a water-mediated protolytic deamination of peptides and amino acids, purely a chemical process, leading to a priming effect. Thus, several mechanisms for priming effect have been discussed, but none had been found adequate in explaining the increased release of soil N upon addition of fertilizer N (Aleksic et al., 1968). Jenkinson et al- (1985) considered, from theoretical position, the possible reactions that may lead to the priming effect, and discussed displacement reactions and pool substitution.
Azam et al. (1994a) applied (NH4)2S04 at the rate of 100 or 200 mg N/kg soil to 3 Mollisols and incubated the soils aerobically for 2 weeks at 25 °C. The authors found that the added labelled NH4
+-N did not cause significant release of unlabelled clay-fixed NH4
+, and suggested that clay fixation or defixation of NH4+ did not contribute
significantly to the observed added nitrogen interaction (ANI) in the soils used. Sen and Chalk (1995) used biologically active y-irradiated and reinoculated y-irradiated samples to separate ANI due to biological and chemical processes, and concluded that biologically mediated ANI arise from the mineralization of soil organic N solubilized by alkaline-hydrolysing N fertilizers. There is need for more research to ascertain the cause(s) of non-biologically mediated ANI.
51

CHAPTER 4
CROP GROWTH AND NITROGEN USE EFFICIENCY
4.1 Introduction
Crop development and growth involve complex physiological and biochemical processes which are influenced by the crop's environment. The principal environmental variables include climate, soil and management (Gardner et al., 1985; Fageria et al., 1991 b). High crop productivity can be expected only when conditions are optimal or favourable in the growth medium constituted by the interacting environmental variables. Optimal conditions for crop growth are rather difficult to define because they vary with plant species, soil type, and agroclimatic factors (Fageria et al., 1991a). Different cropping systems are practised under the same climatic regime in which different soil types occur. Similarly, the potential of a given soil type to produce crop is expressed differently under different climatic regimes (Sivakumar et al., 1992). In the final analysis, therefore, the productivity of a crop will depend on the crop's capacity to integrate all the climatic and soil factors that influence crop development and growth. The capacity of the crop to efficiently exploit environmental resources is essentially determined by the genetic constitution of the crop plant, environmental variables and the cultural practises applied.
4.2 Genotype
Several authors (eg. Kang & Gorman, 1989; Sivakumar et al., 1992) have reported significant interaction between climatic factors and genotype on maize yield. Nutrient requirements and preferences by plants are known to vary between and within species (Gerloff & Gabelman, 1983). Genetic variation in root growth among maize hybrids has also been reported (Wiesler & Horst, 1994 a & b). Some authors (eg. Tsai et al., 1984; Mackay & Barber, 1986; Ebelhar et al., 1987) observed differences in uptake of N, P and K by maize genotypes. Rao et al (1993) comparing kinetic parameters of N uptake and translocation from NH4- and NO,-N sources among legumes and cereals, reported significant differences in both uptake and translocation of the N sources between and within plant groups. Duncan and Baligar (1990) observed genotypic differences in nutrient utilization by maize. In the report by Clark (1990) it was noted that maize genotypes vary extensively in adaptation to soils and their productivity differed with fertilizer inputs. Thus, the plant genetic constitution determines the highest possible yield that can be realized from a plant under optimal growth conditions.
53
Chapter 4
4.3 Climate
Climatic factors such as rainfall, temperature, and solar radiation are important in determining the success of growing crops in a given agroclimatical zone (Dennett, 1984; Thompson, 1986). Moisture availability is one of the most important factors determining crop productivity, since water is required by plants for the translocation of absorbed mineral elements as well as products, for the manufacture of carbohydrates and proteins, and for the maintenance of hydration of protoplasm (Marschner, 1986; Fageria et al 1991a) Rainfall pattern, in terms of both the total amount and distribution, is very important in relation to crop productivity. The Eto of maize crop during growth cycle is reported to vary widely, ranging from 440 to 1000 mm, depending on soil characteristics, and rainfall pattern (Fageria et al., 1991b). While total rainfall is important in satisfying the Eto of the crop, the distribution is essential in ensuring that the crop is not exposed to moisture stress (both excess and insufficient) during the sensitive growth stages such as anthesis and grain filling (Orchard & Jessop, 1984). Under rainfed agriculture, maize grain yields are reported to follow rainfall distribution pattern (Goense & Wienk, 1990). Temperature has been reported to influence photosynthetic rate (Tollenar, 1989), root development and growth (Kuchenbuch & Barber, 1988). Root temperatures are the critical temperatures as far as plant survival and productivity are concerned, and usually root temperatures are lower than air temperatures during the crop growth period (Fageria et al., 1991a). Warrington and Kanemasu (1983) reported that the minimum and optimum air temperatures for germination of maize were 9 and 30 °C, respectively. Fageria et al. (1991b) reported that soil temperature in the range of 26 to 30 °C is optimal for both germination and early seedling growth, and that optimum temperature at tasselling varies from 21 to 30 °C. One important characteristic of the tropical climate is the temperature stability in most parts of the year, the mean monthly temperature variation being 5°C or less between the average of the warmest and coldest months (Fageria et al., 1991a). The effect of temperature on crop yield is modified by soil moisture level (Runge, 1968; Asghari & Hanson, 1984a; Kuchenbuch & Barber, 1988), and soil fertility (Asghari & Hanson, 1984a & b).
Solar radiation is another climatic component that influences crop productivity (Muchow & Davis, 1988). Fageria et al (1991a) reported that in the tropics there is comparatively little seasonal variation in radiant energy input, and that a steady value of 1.7 * 107 to 2.1 * 107 J/M2/day is often experienced. The authors also reported that radiation is higher in the tropical and subtropical climates (5.5 * 109 to 7.1 * 109
J/M2/year) than in the temperate climates (3.8 * 109 to 5.0 * 109 J/M2/year).
54
Nitrogen use efficiency
4.4 Soil
Topographical, physical, chemical and biological characteristics of soils have bearing on the productivity of the soils. Soil texture and effective depth influence moisture content of the soil as well as the depth to which root system can reach and, hence, the nutrient uptake by the crop (Fisher & Dunhan, 1984). There is higher chance of losing fertilizer N by way of leaching in light-textured soils than in heavy-textured soils (Tisdale et a l , 1985). At the onset of rains the swell-shrink soils lose more nutrients by way of "bypass flow" than the soils without the swell-shrink characteristics (Bouma et al., 1981; Smaling & Bouma, 1992). But later in the season when the swell-shrink soils have swollen and the cracks have become minimized, the nutrient loss through "bypass flow" considerably reduces.
Vertisols in Kenya occur in different AEZs in the country (Chapter 1) and, hence, have different physicochemical characteristics, some of which are given in Table 4.1 to illustrate how the properties vary with AEZs. Water control is reported to be the most crucial concern in Vertisol management for crop production (Hubble, 1984; Santanna, 1989; Pushparajah, 1992; Muchena & Kiome, 1993). Hence, Vertisol management will vary according to rainfall amount and distribution, especially where irrigation is not practised (Ahmad, 1985; Pushparajah, 1992). The importance of soil water management lies in the necessity to maintain favourable root environment with adequate moisture and 0 2 supply. It has been reported (Tiedje et al., 1984; Fausey & Lal, 1990) that when soil water content becomes high, the beneficial exchange of air between the soil and the atmosphere is compromised. Tiedje et al. (1984) noted that the dramatic effect of water on soil aeration status is due to the much lower 0 2 diffusion coefficient which, according to the report by Russell (1977), is 10,000 times slower in water than in the atmosphere. Letey (1985) reported that of the four soil physical conditions directly related to plant growth, soil water is the dominant one. The other three, namely 02 , temperature and mechanical resistance reflected in bulk density, are controlled by soil water. Waterlogging damage to crops has been attributed to reduction in 0 2 supply, increase in denitrification N losses, impeded root growth, and disruption in root metabolism with respect to water and nutrient uptake as well as supply of hormones from the roots to other plant parts (Orchard & Jessop, 1984; Fausey & Lai, 1990; Aulakh et al., 1992). The problem of waterlogging can be alleviated by providing surface drainage since subsurface drainage in Vertisols is inefficient (Dudal & Bramao, 1965). Different approaches have been tried to remove excess water from cropped Vertisols (IBSRAM, 1989), but a viable solution is yet to be found (Coulombe, et al., 1996).
55
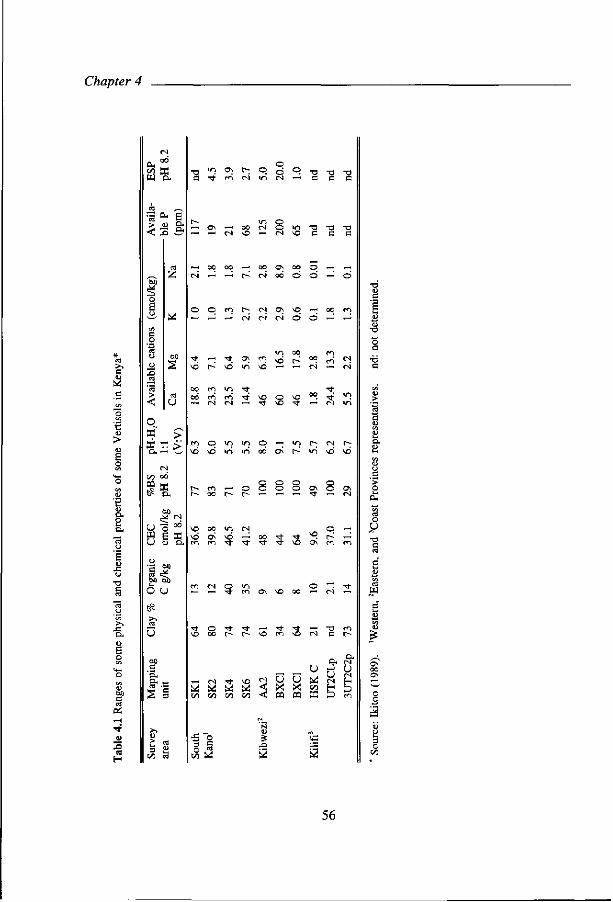
Chapter 4
U
Bi
.fi CS
H
W Ti
=1 ^ | > u o ,
< 3 S
«
^
B S
m <N »n o j ^H
" H O N — C O ( N O I O T D - 0 —« —' (N ' O - ( S *C C C
— O O O O - — ' O O O N O O O — — c N ' - I r - I ^ o i o o d d - ' d
in oo r*~i
co m i n ' t Tt
- N M ' - T t ^ ' t ' - ' n i r i
o * > K r. > o. — O
M
C/3 OO
s» W e* &
M ^ CM
U o °° " Ê ï U o O.
o
bo ob O u
C*1
\ D
t~-t ~
VO
\ó n - j
<n
O vó
CO 0 0
0 0
Ov CCI
<N
U"l
wi
t ~
»n 'S •>t
o • *
'T )
V )
O r-
CN
^ t-
v-> m
p 0 0
O O
'""
0 0 • *
o\
^ o<
o o *~*
t
VO
vn r~
o o '—'
s
0 0
r-; vi
o\ • t f
^o o\
o •
o) vö
o o
o
s m
~~! CS
r-o
ON I N
— ^ m
• *
u H u —i O) • * VO
W W Ui i4 M M M M
<N U y W S U oi X X H
D
o
o U
W
56
Nitrogen use efficiency
4.5 Fertilizer N Management
Management of fertilizer N for high uptake by maize involves choosing the appropriate rate, placement mode, timing of application, single or multiple applications and surface applied or soil incorporate depending on soil type, N source, rainfall pattern, temperatures and maturity period of the maize crop (Thomas, 1980; Mughogho et aL, 1990). Fertilizer N applications are designed to complement the Ndfs (Jenkinson et al., 1985). The Ndfs is contributed by soil organic matter, crop residues, farm yard manure, green manure and biological fixation (Mughogho et aL, 1986; Mengel & Kirkby, 1987). In maize monocropping systems with no organic matter and green manure additions the only contributions to Ndfs would be crop residues and depositions from rain and dust (Marschner, 1986). Thus, the rate of fertilizer N needed to be supplied to a maize monocrop is influenced by the soil N content (Carefoot et aL, 1989), N source (Bache & Heathcoat, 1969; Jones, 1976), soil reaction (Riley & Barber, 1971; Jones, 1976), rainfall (Dennett, 1984), maize maturity period (Mackay & Barber, 1986) and yield level desired (Arnon, 1975).
Timing N applications and/or multiple (i.e. split) applications of fertilizer N have resulted in improved N recovery and increased grain yield of maize in some soils. Jung et aL (1972) found that the period 6 to 8 weeks after planting in Wisconsin was the most effective period of fertilizer N application to maize as shown by the highest increase in grain and tissue yield per unit fertilizer N applied. Thomas (1980) concluded from more that 10 years of studies in Kentucky that delaying at least one-half of the applied N fertilizer until 4 to 6 weeks after planting resulted in improved efficiency from maize production on soils with poor drainage. The effect of fertilizer N placement mode, i.e. hill placed, broadcast or banded on N recovery will vary with the N source, N rate, climate and soil type among other factors (Mughogho et aL, 1986). Likewise, the effect of surface applied or soil incorporated N on fertilizer N recovery depends on N source, N rate, soil characteristics and climate - especially rainfall patterns and temperature (Fenn & Hossner, 1985).
The central issue in fertilizer N management is to ensure minimal N losses and maximum N availability to the crop during crop establishment and the period covering 3 weeks before and after silking. Synchronized availability of N with the demand by the crop is influenced by the N source, amount and placement method of crop residues.
4.6 Nitrogen Source
The main forms in which the element N is taken up from the soil by growing plant
57
Chapter 4
roots are N0 3 and NH4+ (Tisdale et aL, 1985; Mengel & Kirkby, 1987). The two
carrying ions are dissimilar in the charge they carry and the effect they have on soil properties and, hence, plant productivity. The N fertilizers calcium nitrate, ammonium sulphate and calcium ammonium nitrate are carriers of different N-forms. Calcium nitrate carries N03-N, while ammonium sulphate contains NH4-N and calcium ammonium nitrate supplies both N03-N and NH4-N in almost equal proportions. The N source will affect the predominant N-form available to the plant, nitrification not withstanding, at least during the first few days following the application of the N fertilizer. Maize prefers NH4
+-N during early growth and N03"-N in the later growth stages (Dibb & Welch, 1976). Smith et aL (1990) also found pearl millet to prefer NH/-N during the first 2 weeks of growth, and N03"-N thereafter. Whereas some reports show that ammonium nitrate is the superior N source on maize compared to other N sources (Bändel et aL. 1984; Below & Gentry, 1987; Fox & Hoffman, 1981; Fox et aL, 1986), there are some reports to show that there are no significant differences in maize grain yield due to N-sources (Lu et aL, 1987; Njoku & Odurukwe, 1987). The conflicting findings are possibly due to the different N-sources and soil types used in the experiments. Mughogho et aL (1986), summarizing collaborative fertilizer trials testing N-sources in many agroecological units in the sub-Saharan Africa, concluded that all the fertilizer sources are not the same, and emphasized the need to test the various N products available in the soils in which they will be used before any recommendation can be made to the farmer.
Ammonium and N03-N sources have been found to lower and raise the soil pH, respectively (Blair et aL, 1970; Haynes & Swift, 1987; Sigunga, 1993a), and the magnitude of these effects is influenced by rates of N application (Balasabramanian & Singh, 1982; Fox & Hoffman, 1981; Jones, 1976). Furthermore, whereas NH4
+ ions stimulate the uptake of negatively charged H2P04 , HP04
= and S04= (Blair et aL, 1970;
Riley & Barber, 1971; Smith & Jackson, 1987a & b) and reduce the absorption of positively charged Zn++, Ca++, Mg++, K+ and Cu++ (Tills & Alloway, 1981), NO," ions enhance the uptake of positively charged Ca++, K+, Mg++ and Mn++ (Riley & Barber, 1971; Gashaw & Mugwira, 1981; Moritsugu & Kawasaki, 1983).
4.7 Nitrogen use efficiency
The major problem in the use of fertilizer N by crops is the low N uptake (Simonis, 1988), and any effort to increase nitrogen recovery efficiency, NRE, in agricultural systems is important. The NRE of fertilizer N by crops worldwide remains low, usually below 50% in most cases (Rao et al., 1993). The three common ways in which fertilizer NUE is expressed are yield or agronomic efficiency, ANE, (Eq. 1.1), nitrogen
58

Nitrogen use efficiency
recovery efficiency, NRE, (Eq. 1.2), and physiological nitrogen efficiency, PNE, (Eq. 1.3). The PNE is sometimes referred to as nitrogen utilization efficiency (Simonis, 1988). Both the NRE and PNE require that the fraction of the fertilizer N applied recovered by the crop be known.
Commonly used methods for estimating fertilizer NRE are the isotope, difference, and regression analysis (Terman & Brown, 1968; Rao et al., 1992). Essentially, in isotopic dilution method the amount of fertilizer N taken up by the plant is calculated from the total N uptake and N isotope ratio analysis of plant samples from the fertilized plots. In the case of difference method, the difference in N uptake in the fertilized and unfertilized plots is considered as the amount of N recovered from the fertilizer. Regression of total N uptake by crops on N rates applied is sometimes used to calculate the NRE. Varvel & Peterson (1990) conducted a study to determine N fertilizer recovery by maize in monoculture and rotational systems, and reported that N recovery determined by isotopic method was significantly higher for maize in rotation than for maize in monoculture. In contrast, fertilizer N recovery estimated by the difference method was much greater in monoculture than in rotational systems. The authors argued that such differences indicated that N fertilizer applied to maize in each cropping system appeared to be entering different sizes and types of organic soil N pools, resulting in apparent differences in N immobilization. They concluded that problems exist in estimating fertilizer N recovery with both isotopic and difference methods.
Rao et al (1992) reported significant interaction between time of comparison and method of estimating NRE. They found that at 20 days after crop (wheat) emergence, DAE, the NRE values by difference method were lower than those by the 15N method. In contrast, they reported, at 60 DAE the NRE values by the difference method were higher than those by l5N method. The authors observed that an average NRE estimated by the difference method using different replicates may be the best estimate of the true values in some cases where, for example, there are low mineralization-immobilization turn over, high N losses by such processes as denitrification, volatilization and leaching. Terman and Brown (1968) found both isotope and difference methods to work equally well, and suggested their complimentary use. Rao et al (1992) concluded that there is no universally acceptable method for making NRE estimates, and proposed an approach to correct NRE values obtained by either method.
In general, the amount of fertilizer N recovered by crops increase with N application rate, but the NRE declines with increasing N rate of application. The NRE, however, varies with crop, soil, climate and management (Simonis, 1988), cropping system
59
Chapter 4
(Varvel & Peterson, 1990), and the method of estimation as well as the time of measurement (Rao et al., 1992). For maize, NRE varies from as low as 7 to as high as 86% (Simonis, 1988; Pilbeam & Warren, 1995). Torbert et al (1992) reported significant interaction between NRE and moisture supply. They observed low NRE with low and excessive moisture. Pilbeam (1996) reported that in humid environment more fertilizer N was recovered in the crop than in the soil, while in the dry environment more fertilizer N was recovered in the soil than in the crop. The author observed regional differences in the recovery of fertilizer N in both crop and soils.
60
Part III
Laboratory-based experiments
CHAPTER 5
DENITRIFICATION IN KENYAN VERTISOL AND PHAOEZEM
Abstract
Denitrification is of interest to agronomists and soil scientists because of its importance in nitrogen (N) cycling and fertilizer N management. The process becomes of particular concern with respect to fertilizer N recovery in soils of poor drainage. The aims of the present studies were to identify and rank the factors that are important in influencing denitrification in a Kenyan Vertisol (heavy clay) and a Phaoezem (loam), and also to compare potential denitrification in the two soil types. Four experiments were carried out. In Experiment 1, the effects of soil moisture content (mc) on utilization of soil C by microorganisms were estimated by measuring the amount of C02 gas evolved at various soil mc. There were 10 treatments made up of 5 mc, namely 0, 30, 60, 100, and 140% water holding capacity (WHC) and the two study soils. In Experiment 2, the influences of soil mc and available C (glucose) on denitrification were investigated. The 28 treatments comprised of 7 mc (0, 20, 40, 60, 80, 100, and 140 %WHC), two glucose levels (0, and 20 mg glucose/kg soil added), and two soil types. In Experiment 3, potential denitrification of the two soil types were determined. There were 20 treatments composed of 5 mc (0, 30, 60, 100, and 140 %WHC), 2 dinitrogen treatments (with and without N2), and the two soil types. The effects of nitrogen rate (NR) and nitrogen source (NS) were studied in Experiment 4. To investigate the effects of NR on denitrification, 10 treatments comprising 5 KN03 levels (0, 50, 100, 200, and 400 mg N/kg soil, and the two soil types were instituted. In the case of investigation on the effects of NS on denitrification, 3 nitrogen sources (KN03, NH4N03, and (NH4)2S04, all analytical grade, and the two soil types were combined factorially. Soil moisture levels within the range of 60 to 140% WHC had similar effects on microbial utilization of soil C. With ambient air in the headspace of the incubation bottles, critical moisture level for denitrification to occur in these soils was 60% WHC corresponding to 0.41 and 0.35 moisture mass fractions for the Vertisol and the Phaoezem, respectively. Anaerobic conditions lowered critical moisture level for denitrification in both soils to 30 %WHC. Soil moisture was necessary for denitrification to occur: even under anaerobic conditions denitrification did not occur in soils with moisture lower than 30% WHC. Available C was an important limiting factor to denitrification in these soils. Denitrification potential of Phaoezem was higher than that of Vertisol. In both soils denitrification rates increased with increasing N03-N rate of application to maxima at 100 mg N03-N/kg soil. Higher N03-N rate than 100 mg NO,-N/kg soil depressed denitrification rate, and resulted in lowered N losses. Under the conditions of the present experiment, nitrification did not occur and, hence, the differences in denitrification losses between the N sources were attributed to the N03-N contents of the applied N-forms. Soil mc was an important factor influencing denitrification in these soils. It was found that denitrification became substantial at soil moisture content > 80% WHC, and at a given soil moisture content denitrification rate increased with increasing C.
5.1 Introduction
Denitrification occurs in a wide variety of ecosystems (Beauchamp et al., 1980; Klemedtsson et al., 1991; Nielsen et al., 1994), including arable, forest, pasture and
63

Chapter 5
flooded lands (Kroeze et al., 1989; Schnabel & Stout 1994).The magnitude at which it occurs in these ecosystems is influenced interactively by soil factors, climatic constituents and, in some cases, management practices. Sometimes denitrification is viewed as a useful process by which to get rid of excess N03 from soil or water systems (Cho et al., 1979; Akunna et al., 1994). In other cases the process is looked at as an unwelcome avenue of fertilizer N03 loss from arable and pasture lands (Knowles, 1982a; Weier et al., 1991; McCarty & Bremner, 1992).
Vertisols are generally characterized by low basic water infiltration rates (Dudal & Bramao, 1965; Blokhuis, 1993; Coulombe et al., 1996). The few Kenyan Vertisols studied have been found to have low water infiltration rates, with variation among the sites (Dr. F.N. Muchena, pers. commun.). Basic water infiltration rate in Muhoroni Vertisols was found to be low, especially after wetting the soil (Chapter 2). This situation creates environment favourable for denitrification since 02 diffusion rate in water is very low (Russell, 1977) and, hence, the soil microsites become deficient of 02. Although denitrification is suspected to be one way by which Vertisols in Kenya lose N03 (Smaling, 1993), there is shortage of information on the significance of denitrification on these soils.
One way by which water affects denitrification is through its influence on soil microorganisms, denitrifying bacteria inclusive (Linn & Doran, 1984b). Aerobic microbial activities such as respiration, nitrification and mineralization increase with soil moisture level as long as 02 remains non-limiting (Aulakh et al. 1992). Moisture must be available to a certain minimum level to support active microbial population (Rolston, 1981). The minimum soil moisture level at which microbial metabolic activities, as reflected in C02 evolution, commences varies with soils. Whereas Linn and Doran (1984a) observed low C02 production in soils at WFPS < 10%, Howard and Howard (1993) reported variation in C02 production among soils at WHC < 20%. As soil moisture content increases to saturation and above, the microorganism population shifts to those (eg. denitrifiers) that can adopt to anaerobic conditions (Fausey & Lai, 1990). The other way by which water influences denitrification is by providing diffusion medium through which substrates (such as C and N03) are translocated to, and products (such as N20 and N2) are removed from the microsites where denitrifiers are metabolically active (Aulakh et al. 1992).
Available C is reported to be and important controller of denitrification N losses in various systems (Groffman et al., 1988; McCarty & Bremner, 1992; Yeomans et al., 1992). Furthermore denitrification, being favoured by anaerobic conditions (Fillery, 1983; Weier et al., 1991), has been found to occur with higher magnitude of N losses
64

Denitrification in Vertisol and Phaoezem
in saturated than in drained soils (Colbourn & Harper, 1987; Schnabel Stout, 1994).
In order to compare denitrification activities in different soils and/or under varying conditions, denitrification rate is often used (Burford & Bremner, 1975; Binstock, 1984; Nielsen et al., 1994). Measuring actual denitrification rates in the field by the acetylene inhibition technique (AIT) is complicated because wet conditions conducive to denitrification strongly limit field measurements of gas exchange, either of N20 out of the soil or of C2H2 into the soil (Kroeze et al., 1989). McKenney et al. (1993) reported that typical field conditions are characterized by highly complex heterogeneous microenvironments that make it extremely difficult to obtain meaningful denitrification rates under actual field conditions. According to Groffman (1995), measurement of denitrification rate in the field by AIT is further complicated by the difficulty in measuring N2 due to high atmospheric background of this gas, and in ensuring adequate C2H2 diffusion into the soil to block N20 reduction to N2. Besides, under field conditions N03" is consumed by plants, reduced to NH4
+ by heterotrophic microbes, and is also lost through leaching/bypass flow and runoff. Laboratory-based measurements of denitrification rates may circumvent some of these difficulties, and are commonly practised (Aulakh et al., 1991).
Denitrification rates are discussed under such concepts as denitrification activity, intensity, capacity and potential (Burford & Bremner, 1975; Focht, 1978; Cho et al., 1979; Malhi et al., 1990; Yeomans et al., 1992; Koops et al-, 1996). Potential denitrification has been defined as the maximum rate at which nitrate will be dissimilated under anaerobic condition without addition of exogenous reductant (Focht, 1978). This concept of potential denitrification underscores the importance of the soil's inherent (unamended) capacity to dissimilate N03-N. Binstock (1984) and Kroeze et al (1989) determined potential denitrification of soils without amendment with exogenous reductant such as glucose. Yeomans et al (1992) and Koops et al (1996), however, measured potential denitrification of soils after amending the soils with both nitrate and available C (as glucose). In the present study, the concept of potential denitrification as was espoused by Focht (1978) was adapted.
The substrate N03 affects denitrification rate differently depending on its concentration on the one hand, and on its interaction with other influencing factors, on the other hand (Stanford et al., 1975; Klemedtsson et al. 1991; Weier et al. 1993a). Whereas some researchers report that denitrification rates in soils are independent of N03
concentrations over a wide range (eg, Rolston, 1981; Knowles, 1981a), other researchers report otherwise (Aulakh et al., 1992). It has also been reported (Knowles, 1982b; Weier, et al., 1993a) that high NO, concentration may inhibit the enzymatic
65
Chapter 5
reduction of NO and N 20 (Eq. 3.2) causing accumulation of intermediates and higher N20/N2 ratio, respectively.
Nitrifying activity in soils influence denitrification via N0 3 supply (Benckiser, 1994). Wetting and drying cycles prevalent in the field enhance mineralization thereby increasing soil C and NO, levels available for denitrification (Birch, 1958 & 1959; Aulakh et al., 1992). Nitrification rate is influenced by soil type, N source and application rate. Soil texture affects the relationship between soil air and moisture volume fractions thereby imparting influence on nitrification since the process is (Independent. Abbes et al. (1994) reported significant differences in nitrification rates among N sources and rates as well as among soil types.
In formulating viable fertilizer management options in flood-prone Vertisols, thorough understanding of the effects of specific factors influencing denitrification is essential. In this respect, the effects of soil moisture, organic C, N03-N, and their interactions on denitrification were studied. In order to study the relative magnitude of the effects of these factors on denitrification, controlled laboratory conditions were preferred to field situation, where there are inevitably many environmental factors that would interactively affect the process. Phaoezem is used in this experiment for comparison with Vertisol because of its contrasting texture to that of Vertisol.
5.2 Objectives
The aim of the present studies was to identify and rank the factors that are important in influencing denitrification in a Vertisol (fine-textured) and a Phaoezem (medium-textured). The specific objectives were to determine:
1. Soil moisture content range within which soil microorganisms are actively utilizing organic C, in order to ensure that the soil moisture levels employed in the subsequent denitrification investigations do not adversely affect microorganism respiration.
2. The effects of soil moisture content on denitrification so as to establish the relationships between moisture content and denitrification in these soils. This information, together with the actual soil moisture content in the field, are necessary in predicting the periods during which denitrification risk is high under field conditions.
3. The effects of C in order to establish whether or not C poses limitation to denitrification in these soils.
4. Potential denitrification using the concept of Focht (1978), and 5. The effects of nitrogen rate and source on denitrification in the two soil types.
66

Denitrification in Vertisol and Phaoezem
5.3 Materials and methods
5.3.1 Experimental treatments
Experiment 1. Effect of soil moisture on the utilization of soil C by microorganism
In this experiment the effects of soil moisture level on the utilization of soil C by microorganisms was estimated by measuring the amount of C0 2 gas evolved at various soil moisture contents over a period of time. There were 10 treatment combinations made up of 5 moisture levels (0, 30, 60, 100, and 140 %WHC) and 10 g (AD) of each of the two study soils. Determination of WHC is described in Section 5.3.3.
Experiment 2. Denitrification in two soils as influenced by soil moisture and glucose
This experiment was designed to investigate the influence of soil moisture level and glucose on denitrification in a Kenyan Vertisol and a Phaoezem. The experiment had 28 treatment combinations comprised of 7 moisture levels (0, 20, 40, 60, 80, 100, and 140 %WHC), two glucose levels (0, and 20 mg glucose/kg soil AD added), and 20 g (AD) of each of the two soil types. In this experiment KN03 was added to provide NO,-N at an equivalent rate of 100 mg N/kg soil AD.
Experiment 3. Potential denitrification in two soil types
There were 20 treatment combinations composed of 5 moisture levels (0, 30, 60, 100, and 140 %WHC), 2 dinitrogen treatments (no flushing and flushing with N2), and 10 g (AD) of each of the two soil types. In the case of N2 treatments, a stream of commercial dinitrogen gas was passed through the headspace of the incubation bottles for 30 min. Dinitrogen gas was applied to provide anaerobic condition in the incubation bottle. Potassium nitrate, analytical grade, was added to the soil samples at an equivalent rate of 100 mg N/kg soil to ensure that N03- was not limiting, so as to focus on the study of other factors than N03 .
Experiment 4. Effects of nitrogen rate and source on denitrification
To investigate the effects of nitrogen rate on denitrification, 10 treatment combinations comprising 5 KN03 (analytical grade) levels 0, 50, 100, 200, and 400 mg N/kg soil (AD) and 10 g (AD) of each of the two soil types were instituted. In the case of investigation on the effects of nitrogen source on denitrification, three nitrogen sources, namely KN03, NH4N03, and (NH4)2S04, all analytical grade, and 20 g (AD) of each
67
Chapter 5
of the two soil types were arranged factorially. In addition, two controls were included, one for each soil type. Nitrogen was supplied at an equivalent rate of 100 mg N/kg soil (AD). Different N sources were used to determine the possibility of nitrification supplying additional N03-N for denitrification in these soils.
5.3.2 Soil preparation:
Two soil types, Vertisol and Phaoezem (FAO-UNESCO, 1988) differing in physicochemical characteristics collected from sites with contrasting climates were used. Vertisol and Phaoezem samples were collected from Muhoroni and Kisii, respectively, in Nyanza Province of Kenya (Figure 1.1). The Vertisols of Muhoroni were developed on granitoid gneiss, and are of very poor drainage (Jaetzold & Schmidt, 1982). The Phaoezem of the Kisii soils were derived from acid igneous rocks with volcanic admixture, and are well drained (Sombroek, et al., 1982). Topsoil (0 -20 cm) samples were collected, air dried, separated from plant roots and gravel, then ground to pass through 2.0 mm sieve. At each site, soil was collected from four locations.
5.3.3. Chemical and soil analysis
The samples were analyzed for texture, pH, organic C, total N, mineral N03-N and NH4-N. Besides, WHC of the soils were determined. The particle size determination was performed by mechanical analysis, and pH was determined with glass electrode (soil:water - 1:2.5). For the determination of NH4-N and NO,-N, 20 g of air dry (AD) soil was mixed with 50 ml of 1 M KCl, shaken in a mechanical shaker for 60 min, and the suspension filtered using Schleicher & Schuell filter # 300212. The filtrate was used in the continuous flow photometer (auto-analyzer) to determine the mineral N contents. Total N was determined by digesting the soil samples with a mixture of H2S04-Se and salicylic acid, and measuring the N in the digest by spectrophotometry. To determine organic C content soil samples were oxidized with K2Cr207, and the concentration of Cr,+ formed in the reaction was measured colorimetrically, and compared with standard series of sodium oxalate that had been treated in the same way. Some of the properties of the soils are given in Table 5.1.
For the determination of WHC, three samples of each soil type were used to determine its water holding capacity, which is the upper plastic limit of the soil. Water was added slowly to 500 g soil in a bowl while mixing until the mixture was at the point of being able to flow. Two subsamples from each sample were transferred into moisture cans, weighed and dried in a ventilated oven at 100 to 105 °C for 24 h, then the oven-dry
68

Denitrification in Vertisol and Phaoezem
(OD) soil was weighed. Gravimetric water contents of air-dry (AD) soil was also measured. The WHC was calculated as g H20/kg soil OD also as AD. Soil WHC has been found an appropriate way of expressing soil water content in relation to soil microorganism activities (Chapter 3).
Table 5.1 Some properties of the test soils
Soil
type
Vertisol
Phaoezem
Texture
C
L
pH
6.1
5.7
Organic C g/kg soil
23
37
Total N g/kg soil
1.5
3.7
Mineral N mg
NO,
3.1
95.2
N/kg soil OD
N NH4-N
4.9
47.7
WHC g H20/kg soil
AD*
680
583
OD
770
600
*AD = air dry basis OD = oven dry basis
5.3.4 Incubation procedure and measurements of C0 2 and N 20
In the case of Experiment 1, the capacity of incubation bottle was 300 ml, while for experiments 2 to 4 it was 600 ml. The bottles had screwtops provided with septum rubber to allow for the measurement of the gases in the headspace. The soil samples in the bottles were brought to the required moisture level by adding the appropriate amount of water. All the treatments were replicated twice, and the bottles were randomly arranged. The samples were incubated in the laboratory at 20 °C ± 2, and 1 atmosphere for 4 and 6 days in respect of Experiments 1 and 3, and 6. Incubation periods for Experiment 4 were 4 and 5 days in the cases of N rate and N source investigations, respectively. Incubation soil moisture levels for N rate and N source were 160 and 140% WHC, respectively.
The concentration of evolved gases (C02 and N20) retained in the headspace of the incubation bottles was measured using the Multi-gas Monitor Type 1302 (Bruel & Kjaer Co.).
5.3.5 Acetylene inhibition technique for estimating denitrification rate
Acetylene inhibition technique (Aulakh et al. 1991)was used to inhibit N20 reduction to N2. Fresh C2H2 was generated by putting about 5 g of CaC2 in 1000 ml of water in a container with a provision to trap the generated gas. Using a syringe and a needle 60 ml of the freshly generated C2H2 was transferred to each incubation bottle each day of the experiment in order to maintain C2H2 volume fraction of at least 0.1 of the headspace.
69

Chapter 5
5.3.6 Calculation procedures
5.3.6.1 Estimating amount of C mineralized from C02 evolved:
CMIN CMGKG
= (x * VOL * 10"3) * (MWT/22.4) * PC = (CMIN/WTSOIL) * 10"3
Eq. 5.1 Eq. 5.2
where, CMIN CMGKG
x VOL MWT PC WTSOIL
= The amount of carbon mineralized from soil sample, mg. = The amount of carbon mineralized from 1 kg soil on dry
weight basis, mg C/kg soil. = Concentration of C02 evolved from the soil sample, ul.r1. = Volume of incubation bottle, 0.3 1. = Molecular wt of C02. = Proportion of C in C02, 12/14 = Weight of soil on dry weight basis, g.
5.3.6.2 Estimating amount of N denitrified from N20 evolved.
NDENIT NMGKG NKGHA
t(x * VOL * 10'3)*(MWT/22.4)]PN (NDENIT /WTSOIL) * 10"3
NMGKG * WTHFS
Eq. 5.3 Eq. 5.4 Eq. 5.5
where, = The amount of nitrogen denitrified from soil sample, mg. = The amount of nitrogen denitrified from 1 kg soil on dry weight
basis, mg N/kg soil. = The amount of nitrogen denitrified per hectare, kg N/ha. =Weight of 1 hectare farrow slice (0-15 cm soil layer)
estimated at 2.2 * 106 kg (Buckman & Brady, 1974). = Concentration of N20 evolved from the soil sample, ul.l'. = Volume of incubation bottle, 0.6 1. = Molecular weight of N20. = Proportion of N in N20. = Weight of soil on dry weight basis, g.
NDENIT NMGKG
NKGHA WTHFS
x VOL MWT PN WTSOIL 1 mole of gas at normal temperature and pressure = 22.4 1.
70
Denitrification in Vertisol and Phaoezem
5.4. Results
5.4.1 Effect of soil moisture on the utilization of soil C by microorganism
The soil moisture level had clear effect on the evolution of C02 gas by soil microorganisms in both soil types (Figure 5.1). Production of C02 increased with increasing soil moisture. At air dry status (0 %WHC in this experiment) at the time of this experiment Vertisol and Phaoezem had moisture contents of 0.13 and 0.03 mass fractions, respectively. At this moisture level the respiratory activities of microorganisms were at the minimum and remained so throughout the experiment, while the effect of 30 %WHC levelled off after 20 and 48 h of the experiment for Vertisol and Phaoezem, respectively. Moisture levels > 60 %WHC sustained C02
production and evolution for the entire period of the experiment. The means of cumulated C02 evolved at 60 %WHC were significantly higher than at < 30 %WHC (Table 5.2). The order of significant differences were 140 = 100 = 60 > 30 > 0 %WHC for both soils. Significantly more C02 was produced from Phaoezem than from Vertisol at all moisture levels except at 0 %WHC.
5.4.2 Effect of soil moisture content and glucose on denitrification
There was no denitrification at moisture levels below 60 %WHC, hence N losses at 0, 20, and 40 %WHC are not included in Figure 5.2. The amount of N denitrified, calculated from the N20 evolved, depended on soil type, soil moisture level, and glucose. Phaoezem had significantly higher denitrification losses than Vertisol at all moisture levels > 80 %WHC (Table 5.3.). Added glucose resulted in significantly higher denitrification in both soils, and at moisture levels above 60 %WHC. In both soils denitrification losses significantly (p < 0.01) increased with increasing moisture levels > 80 %WHC. The effect of soil moisture level on denitrification was in the order 140 > 100 > 80 > 60 = 40 = 20 = 0 %WHC.
In both soils denitrification started after an initial lag phase of approximately 20 h and levelled off about 67 h later (Figure 5.3). The highest moisture level (140 %WHC) resulted in the sharpest drop in the denitrification rate. In both soil types glucose raised the denitrification rate, and prolonged the period of high rates particularly at moisture levels > 100 %WHC. Phaoezem had significantly higher maximal denitrification rates than the Vertisol at moisture levels > 80 %WHC (Table 5.4). Glucose resulted in higher maximal denitrification rates than no-glucose treatment at all the moisture levels from 100 %WHC in both soil types. The effect of moisture level was consistently in the order 140 > 100 > 80 > 60% WHC.
71

Chapter 5.
Mineralized organic C
w
- • - 0% WHC -+- 30% WHC - * - 60% WHC
- e - 100% WHC - * - 140% WHC
0
^ " ~ , 10 20 30 40 50 60 70 80
Figure 5.1 Cumulative mineralized organic carbon, mg C/kg soil OD in a Vertisol (a) and Phaoezem (b) at various soil moisture levels (ie. 0 - 140% water holding capacity, WHC).
N denitrified, mg N/kg soil, OD
20 40 60 80 100 120 140
Time, h
Figure 5.2 Cumulative N denitrified in a Vertisol unamended (a) and amended (b), and in a Phaoezem unamended (c) and amended (c) with glucose at various soil moisture levels.
72
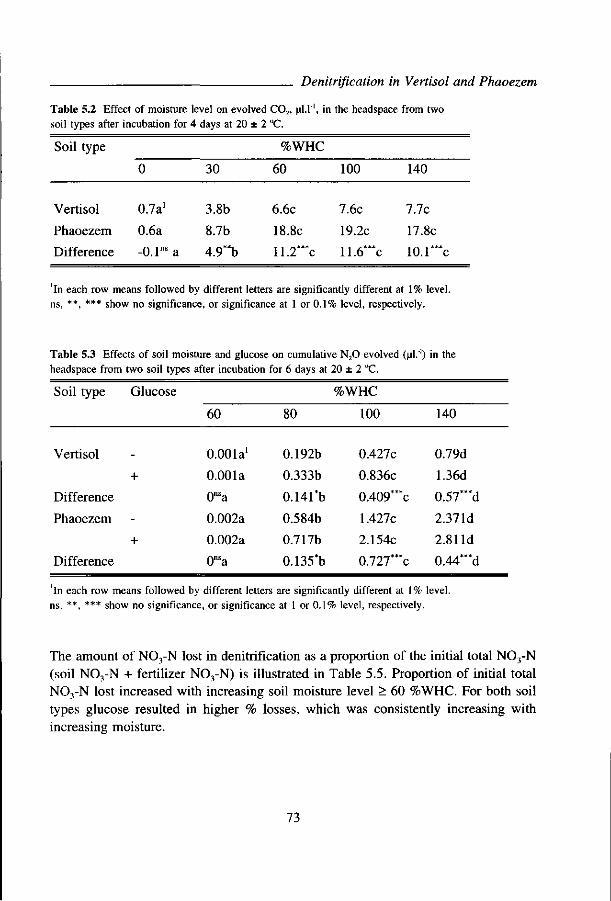
Denitrification in Vertisol and Phaoezem
Table 5.2 Effect of moisture level on evolved C02, ul.1', in the headspace from two soil types after incubation for 4 days at 20 ± 2 "C.
Soil type %WHC
Vertisol
Phaoezem
Difference
0
0.7a1
0.6a
-0.1nsa
30
3.8b
8.7b
4.9"b
60
6.6c
18.8c
11.2"*c
100
7.6c
19.2c
11.6*"c
140
7.7c
17.8c
io.r**c
In each row means followed by different letters are significantly different at 1% level. ns, **, *** show no significance, or significance at 1 or 0.1% level, respectively.
Table 5.3 Effects of soil moisture and glucose on cumulative N20 evolved (ul.1) in the headspace from two soil types after incubation for 6 days at 20 ± 2 "C.
Soil type
Vertisol
Difference
Phaoezem
Difference
Glucose
_
+
-
+
60
0.001a'
0.001a
0nsa
0.002a
0.002a
0nsa
80
0.192b
0.333b
0.141*b
0.584b
0.717b
0.135*b
%WHC
100
0.427c
0.836c
0.409***c
1.427c
2.154c
0.727"*c
140
0.79d
1.36d
0.57*"d
2.371d
2.811d
0.44***d
In each row means followed by different letters are significantly different at 1% level. ns, **, *** show no significance, or significance at 1 or 0.1% level, respectively.
The amount of N03-N lost in denitrification as a proportion of the initial total N03-N (soil N03-N + fertilizer NO,-N) is illustrated in Table 5.5. Proportion of initial total NO-,-N lost increased with increasing soil moisture level > 60 %WHC. For both soil types glucose resulted in higher % losses, which was consistently increasing with increasing moisture.
73

Chapter 5
5.4.3 Potential denitrification
Nitrogen losses via denitrification increased with increasing moisture level and N2
treatment (Figure 5.4). In both soils denitrification did not occur at moisture levels < 60 %WHC in the absence of N2 (Figure 5.4 a & c). With N2 treatment, denitrification occurred at moisture level > 30 %WHC in both soils though at very low magnitudes (Figure 5.4 b & d). At 30 %WHC and in the presence of N2, cumulated N lost from Vertisol and Phaoezem during the 4 days of incubation were 0.6 and 1.6 mg N/kg soil-OD, respectively. The differences in N losses due to soil moisture level were consistent whether or not N2 was applied. Soil type, N2, and %WHC had significant effects on N 20 evolution (Table 5.6). In both soils, the effect of moisture level became significant at 100, and > 60%WHC without and with N2 treatment, respectively (Table 5.7). Treatment with N2 significantly raised denitrification losses at moisture levels > 60 %WHC in both soils. Significant effect of %WHC * N2 interaction was evident at > 60 %WHC in both soils.
Denitrification rate, ug N/kg soil/h 1200 TI
1200
1000
800-
600-
400-
200-
0-20
0
m
20-49 49-67 67-92 92-120
•J
i
;
0 — E H — m —
0-20 20-49 49-67 67-92 92-120
E S 100
0-20 20-49 49-67 67-92 92-120
Time, h
Figure 5.3 Mean maximal denitrification rates for various time intervals in a Vertisol unamended (a) and amended (b), and in a Phaoezem unamended (c) and amended (d) with glucose at various soil moisture levels.
74
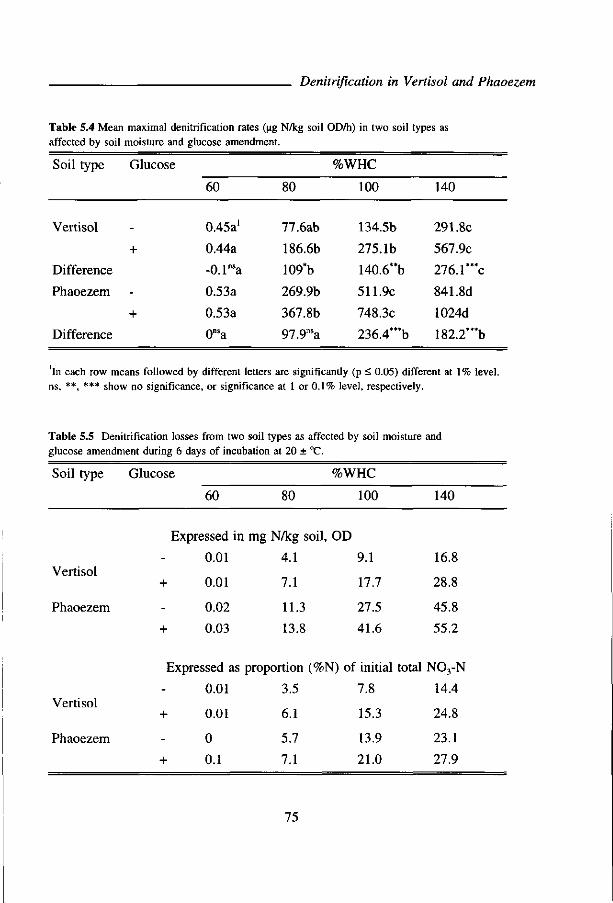
Denitrification in Vertisol and Phaoezem
Table 5.4 Mean maximal denitrification rates (|ag N/kg soil OD/h) in two soil types as affected by soil moisture and glucose amendment.
Soil type
Vertisol
Difference
Phaoezem
Difference
Glucose
.
+
-
+
60
0.45a1
0.44a
-0.1 nsa
0.53a
0.53a
0nsa
80
77.6ab
186.6b
109*b
269.9b
367.8b
97.9nsa
%WHC
100
134.5b
275.1b
140.6**b
511.9c
748.3c
236.4*"b
140
291.8c
567.9c
276.1***c
841.8d
1024d
182.2***b
In each row means followed by different letters are significantly (p < 0.05) different at 1% level.
ns, show no significance, or significance at 1 or 0.1% level, respectively.
Table 5.5 Denitrification losses from glucose amendment during 6 days of
Soil type Glucose
60
two soil types as ncubation at 20 ±
80
affected by soil "C.
%WHC
100
moisture and
140
Vertisol
Phaoezem
Expressed in mg N/kg soil, OD
+
0.01
0.01
0.02
0.03
4.1
7.1
11.3
13.8
9.1
17.7
27.5
41.6
16.8
28.8
45.8
55.2
Vertisol
Phaoezem
Expressed as proportion (%N) of initial total N03-N
0.01
0.01
0
0.1
3.5
6.1
5.7
7.1
7.8
15.3
13.9
21.0
14.4
24.8
23.1
27.9
75

Chapter 5
The maximal denitrification rates were influenced by soil type, soil moisture level, and N2 treatment (Figure 5.5). The rates started to decline after 53 to 73 h in both soils whether or not N2 was applied. In both soils the maximal denitrification rates were generally higher in the samples treated with N2 than in the samples that were not treated for the moisture levels > 30 %WHC. Maximal rates obtained with N2 treatment were significantly higher than those obtained without N2 at moisture levels > 60 %WHC (Tables 5.8 & 5.9). Soil moisture * soil type, and soil moisture * dinitrogen interactions had high significant effects on denitrification rates. However, soil type * dinitrogen, and soil type * dinitrogen * soil moisture interactions had insignificant effects (Table 5.8). Interaction effects of soil moisture * dinitrogen became significant at > 60 %WHC for both soils (Table 5.9). In the Vertisol the maximal denitrification rates which were observed at the highest moisture level applied (140 %WHC) were 148 and 800 jag N/kg soil OD/h in the absence and presence of N2, respectively (Table 5.9). For the Phaoezem the corresponding values were 738 and 1507 |jg N/kg soil OD/h without and with N2, respectively. Thus, potential denitrification rates of Vertisol
N denitrified, mg N/kg soil, OD
0 10 20 30 40 50 60 70 80 90 100
Figure 5.4 Mean cumulative N denitrified in a Vertisol not flushed (a) and flushed (b), and in a Phaoezem not flushed (c) and flushed (d) with dinitrogen gas at various soil moisture levels.
76
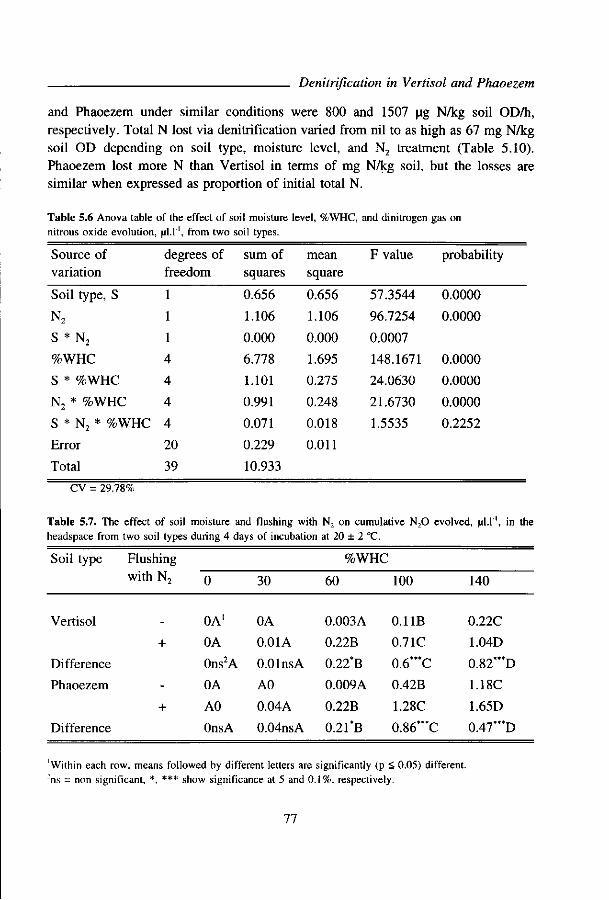
Denitrification in Vertisol and Phaoezem
and Phaoezem under similar conditions were 800 and 1507 ug N/kg soil OD/h, respectively. Total N lost via denitrification varied from nil to as high as 67 mg N/kg soil OD depending on soil type, moisture level, and N2 treatment (Table 5.10). Phaoezem lost more N than Vertisol in terms of mg N/kg soil, but the losses are similar when expressed as proportion of initial total N.
Table 5.6 Anova table of the effect of soil moisture level, %WHC, and dinitrogen gas on nitrous oxide evolution, ul.l"1, from two soil types.
Source of variation
Soil type, S
N2
S * N2
%WHC
S * %WHC
N2 * %WHC
S * N2 * %WHC
Error
Total
degrees of freedom
1
1
1
4
4
4
4
20
39
sum of squares
0.656
1.106
0.000
6.778
1.101
0.991
0.071
0.229
10.933
mean square
0.656
1.106
0.000
1.695
0.275
0.248
0.018
0.011
F value
57.3544
96.7254
0.0007
148.1671
24.0630
21.6730
1.5535
probability
0.0000
0.0000
0.0000
0.0000
0.0000
0.2252
CV = 29.78%
Table 5.7. The effect of soil moisture and flushing with N2 on cumulative N 20 evolved, ul.l ', in the headspace from two soil types during 4 days of incubation at 20 ± 2 "C.
Soil type
Vertisol
Difference
Phaoezem
Difference
Flushing with N2
+
-
+
0
0A'
0A
0ns2A
0A
A0
OnsA
30
0A
0.01A
O.OlnsA
A0
0.04A
0.04nsA
%WHC
60
0.003A
0.22B
0.22*B
0.009A
0.22B
0.21*B
i
100
0.11B
0.71C
0.6***C
0.42B
1.28C
0.86"*C
140
0.22C
1.04D
0.82*"D
1.18C
1.65D
0.47*"D
Within each row, means followed by different letters are significantly (p < 0.05) different. :ns = non significant, *, *** show significance at 5 and 0.1%, respectively.
77
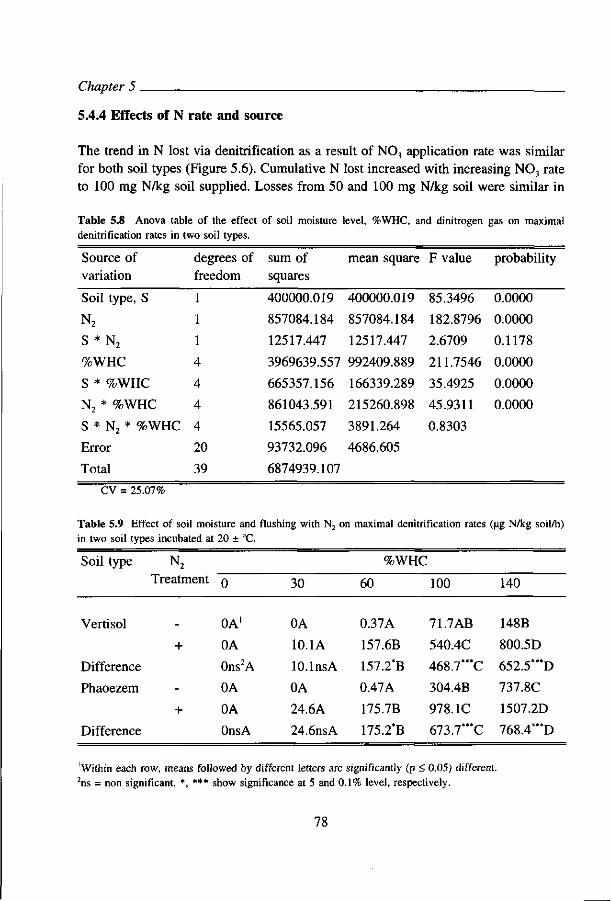
Chapter 5
5.4.4 Effects of N rate and source
The trend in N lost via denitrification as a result of N03 application rate was similar for both soil types (Figure 5.6). Cumulative N lost increased with increasing N03 rate to 100 mg N/kg soil supplied. Losses from 50 and 100 mg N/kg soil were similar in
Table 5.8 Anova table of the effect of soil moisture level, %WHC, and dinitrogen gas on maximal denitrification rates in two soil types.
Source of variation
degrees of sum of freedom squares
mean square F value probability
Soil type, S
N2
S * N2
%WHC
S * %WHC
N2 * %WHC
S * N2 * %WHC
Error
Total
CV = 25.07%
1
1
1
4
4
4
4
20
39
400000.019 400000.019 85.3496 0.0000
857084.184 857084.184 182.8796 0.0000
12517.447 12517.447 2.6709 0.1178
3969639.557 992409.889 211.7546 0.0000
665357.156 166339.289 35.4925 0.0000
861043.591 215260.898
15565.057 3891.264
93732.096 4686.605
6874939.107
45.9311
0.8303
0.0000
Table 5.9 Effect of soil moisture and flushing with N2 on maximal denitrification rates (ug N/kg soil/h) in two soil types incubated at 20 ± "C.
Soil type
Vertisol
Difference
Phaoezem
Difference
N2
Treatment
.
+
-
+
0
0A'
0A
0ns2A
0A
0A
OnsA
30
0A
10.1A
lO.lnsA
0A
24.6A
24.6nsA
%WHC
60
0.37A
157.6B
157.2*B
0.47A
175.7B
175.2*B
100
71.7 AB
540.4C
468.7***C
304.4B
978.1C
673.7***C
140
148B
800.5D
652.5*"D
737.8C
1507.2D
768.4"*D
'Within each row, means followed by different letters are significantly (p < 0.05) different. 2ns = non significant, *, *** show significance at 5 and 0.1% level, respectively.
78

Denitrification in Vertisol and Phaoezem
both soils. Higher rates of N03-N application, 200 and 400 mg N/kg soil reduced N losses. For each nitrate application rate Phaoezem lost more N than did Vertisol.
Maximal denitrification rates, realized at about 66 h after the start of the experiment, decreased with increasing nitrate application rate in both soils (Figure 5.7). The rates were similar for 50, 100, and 200 mg N/kg soil, but significantly reduced at 400 mg N/kg soil supplied (Table 5.11). Phaoezem had significantly (p < 0.01) higher maximal denitrification rates than Vertisol at all the nitrate application rates. There was significant (p < 0.01) interaction between soil type and N03 rate < 50 mg N/kg soil supplied. The highest losses of N were realized with 100 mg N/kg soil supplied in both soils (Table 5.12). Higher N03-N rates than 100 mg N/kg soil reduced N losses, the reduction being significant (p = 0.01) at 400 mg N/kg soil in both soils. The lowering of denitrification at higher N rate than 100 mg N/kg soil was also reflected in the lowering of the amount of N denitrified per unit soil C (Table 5.13). Interaction between soil types and N rates was observed at N rates < 100 mg N/kg soil. The N losses expressed as percent of the initial total N (soil N03-N + fertilizer N03-N) are
Denitrification rate, ug N/kg soil/h
400-
000-
800-
600-
400-
200-
0 S S 3 0
BS'»o
iH
MB60
fr==] 140%WHC
"•
400-
200-
ooo-
800-
600-
400-
200-
0-30 30-5. 53-73 73-96
0
ii i
m
I
Figure 5.5 Mean denitrification rates for various time intervals in a Vertisol not flushed (a) and flushed (h), and in a Phaoezem not flushed (c) and flushed (d) with dinitrogen gas at various soil moisture levels.
79
81

Chapter 5
Chapter 5
Denitrification rate, ug N/kg soil/h
| NH.-N EKNH„NO,|
700-
600'
500'
400'
300-
200-
0 !! g ! • ' •
1-
*1 I i . i .
J ,J 23-49 49-70 70-95
Time, h
Figure 5.9 Mean denitrification rates for various time intervals in a Vertisol (a) and a Phaoezem (b) incubated at 140% WHC and 20 ± "C as influenced by fertilizer N source.
Table 5.10 Cumulative denitrification losses from two soil types as influenced by moisture and flushing with N2 during 4 days of incubation at 20 ± 2 "C.
Soil type N2
Treatment
%WHC
30 60 100 140
Vertisol
Phaoezem
Expressed in mg N/kg soil, OD
0 0.01 4.6 9.1
0.58 9.5 29.9 44
0 0.03 16.3 45.5
1.6 9.6 49.2 66.7
Expressed as proportion (%N) of initial total NO r N
Vertisol
Phaoezem
-
+
-
+
0
0.5
0
0.8
0.01
8.2
0.02
4.3
4
25.7
8.2
24.8
7.9
37.9
23
33.6
82

Denitrification in Vertisol and Phaoezem
5.5 Discussion
5.5.1 Soil moisture content and the utilization of soil C by microorganisms
Soil moisture content at air dry status did not support active microbial metabolism, probably because the moisture level was inadequate to facilitate the solubilization and diffusion of substrates to the microsites. Cumulative mineralized C at 30 %WHC soon levelled off (Figure 5.1) apparently because of vapour loss, as the amount of the moisture was too low. This could quickly result in very low amount of moisture available at the microsites. Although 02 uptake by microorganisms reduces at moisture content > 60% WHC (Linn & Doran, 1984 b), the C02 evolution continued at almost the same magnitude with increase in %WHC (Table 5.2). This suggests that the decrease in C02 evolution at moisture content > 60% WHC was negligible. Although the differences in C02 production at 60, 100, and 140 %WHC were non-significant (Table 5.2) it was observed that Vertisol reached the highest level of C02 production at 100 and 140 %WHC, while the highest C02 evolution from Phaoezem was obtained with 60 and 100 %WHC (Figure 5.1). Howard and Howard (1993) reported similar findings in which the moisture content at which maximum C02 evolution occurred differed between soil types.
The significantly higher C02 evolved from Phaoezem than from Vertisol (Table 5.2) is attributable to the higher organic C content in Phaoezem. The influence of soil organic C on soil microorganism metabolic activities has been reported by many authors (eg. Knowles, 1982a; Jarvis et al> 1991; McCarty & Bremner, 1992). It has also been demonstrated that soil organic C, especially the fraction that is readily utilizable by microorganisms, is a major controlling factor in soil microbial activities
Table in two
Soil
5.11 Effect of fertilizer nitrogen rate on maximal denitrification rate soil types incubated at 160 %WHC and 20 ± 2 "C.
type Fertilizer nitrogen rate,
Control 50 100
(ug N/kg so
mg N/kg soil AD
200 400
1/h)
Vertisol 0.4A'
Phaoezem 259.4A
Difference 258.0*"A
198.2D
918.9C
720.7***B
205.9D
930.7C
724.8*"B
142.4CD
872.8C
730.4*"B
98.8BC
729.1B
630.3*"B
Within each row, means followed by different letters are significantly (p < 0.01) different. "" shows that the difference is significant at 0.1% level.
83
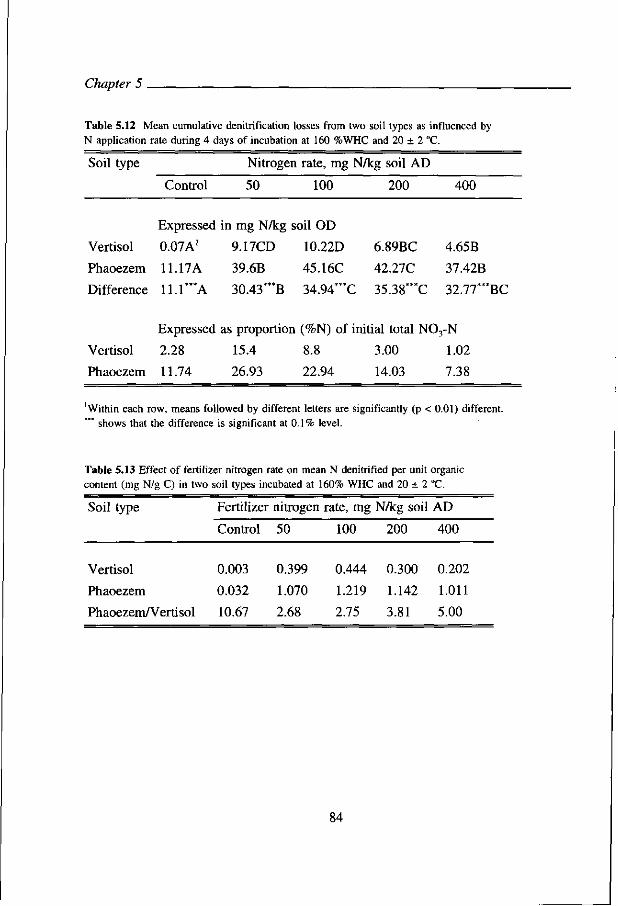
Chapter 5 .
Table 5.12 Mean cumulative denitrification losses from two soil types as influenced by N application rate during 4 days of incubation at 160 %WHC and 20 ± 2 "C.
Soil type Nitrogen rate, mg N/kg soil AD
Control 50 100 200 400
Expressed in mg N/kg soil OD
Vertisol 0.07A1 9.17CD 10.22D
Phaoezem 11.17A 39.6B 45.16C
Difference 11.1***A 30.43***B 34.94*"C
6.89BC 42.27C
35.38*"C
4.65B 37.42B
32.77***BC
Expressed as proportion (%N) of initial total N03-N
Vertisol 2.28 15.4 8.8 3.00 1.02
Phaoezem 11.74 26.93 22.94 14.03 7.38
Within each row, means followed by different letters are significantly (p < 0.01) different. *" shows that the difference is significant at 0.1% level.
Table 5.13 Effect of fertilizer nitrogen rate on mean N denitrified per unit organic content (mg N/g C) in two soil types incubated at 160% WHC and 20 ± 2 "C.
Soil type
Vertisol
Phaoezem
Phaoezem/Vertisol
Fertilizer
Control
0.003
0.032
10.67
nitrogen
50
0.399
1.070
2.68
rate, mg
100
0.444
1.219
2.75
N/kg soil AD
200
0.300
1.142
3.81
400
0.202
1.011
5.00
84

Denitriftcation in Vertisol and Phaoezem
(Groffman et al., 1988; Weier, et al., 1993a & b). Whereas the amount of C02 evolved from soil under aerobic conditions gives a good estimate of mineralizable C in the soil(Bijay-Singh et al., 1988; Davidson, et al., 1987), the amount of C mineralized under anaerobic conditions as determined from evolved C02 is a good measure for the amounts of C available for denitrifying bacteria (Bijay-Singh, et al., 1988). Hence, it may be argued that Phaoezem had more available C than Vertisol that could be utilized by denitrifying bacteria.
Moisture levels < 30 %WHC restrict metabolic activities of soil microorganisms and, at 0%WHC (air dry condition) the metabolism processes in microorganisms are reduced to minimum. Despite possible shifts in microorganism populations with soil moisture changes, the overall consumption of mineralizable C, reflected in C02
evolution, continued with the same magnitude at soil moisture level ranging from 60 to 140 %WHC. It is therefore concluded from this study that soil moisture level within 60 to 140 %WHC had similar effects on microbial utilization of soil C in both soil types.
5.5.2 Effect of soil moisture content and glucose on denitrification
The amount of N lost depended on soil type, soil moisture level, and the presence of glucose. As there was no N20 production at moisture levels below 60 %WHC, this moisture level which corresponds with moisture mass fractions of 0.41 and 0.35 for Vertisol and Phaoezem, respectively, is therefore considered critical for denitrification in these soils. Below this critical moisture level denitrification is negligible, and above it denitrification increased with increasing moisture, an observation that was also made by Klemedsson et al. (1991), Aulakh et al. (1992), and Weier et al- (1993a). Phaoezem had higher denitrification losses than Vertisol at all moisture levels > 80 %WHC. The higher N loss from Phaoezem than from Vertisol (Figure 5.2) is attributed partly to higher organic C content of the former (Table 5.1), and partly to textural difference between the two soil types. It was found, in the present study (Section 5.4.1) that Phaoezem produced more C02 than did Vertisol under similar conditions. This was interpreted to mean that Phaoezem had higher available C than did Vertisol for the utilization by denitrifying bacteria (Bijay-Singh et al., 1988). The amount of soil organic content in itself does not clearly reflect the soil's capacity to denitrify NO, since only a small fraction of the soil organic C is readily hydrolysable sugar that soil microorganisms can utilize (Jorgenssen & Richter, 1992). It is the water soluble fraction of the organic carbon (ie. hydrolysable C) content of the soil that is an important indicator of the soil's capacity to denitrify (Stanford et al., 1975; Batonda & Waring, 1984; Yeomans et al., 1992). The Vertisol being heavy clay as opposed to
85

Chapter 5
Table 5.14 Effect of fertilizer nitrogen source on maximal denitrification rate (ug N/kg soil/h) in two soil types incubated at 140 %WHC and 20 ± 2 "C.
Soil type
Vertisol
Phaoezem
Difference
Fertilizer nitrogen
Control
0.5A1
231.4A
230.9***A
NH4-N
0.9A
236.3A
235.4"*A
source
NH4N03
156.2B
718.5B
703.3***B
N03-N
184.3B
759.3B
575***C
Within each row, means followed by different letters are significantly (p < 0.01) different. *** shows that the difference is significant at 0.1% level.
Table 5.15 Mean cumulative denitrification losses from two soil types as influenced by fertilizer N sources during 4 days of incubation at 140 %WHC and 20 ± 2 "C.
Soil type Fertilizer nitrogen source
Control NrL-N NH4NO, NO3-N
Vertisol
Phaoezem
Difference
Expressed in mg N/kg soil OD
0.04A1 0.04A 8.93B
7.31A 8.77A 38.06B
7.27*"A 8.73"*A 29.13***B
10.95B
43.49C
32.54***C
Expressed as proportion (%N) of initial total N03-N
Vertisol 1.23 1.28 14.99 9.43
Phaoezem 7.68 9.22 25.94 21.94
'Within each row, means followed by different letters are significantly (p < 0.01) different. "* shows that the difference is significant at 0.1% level.
86
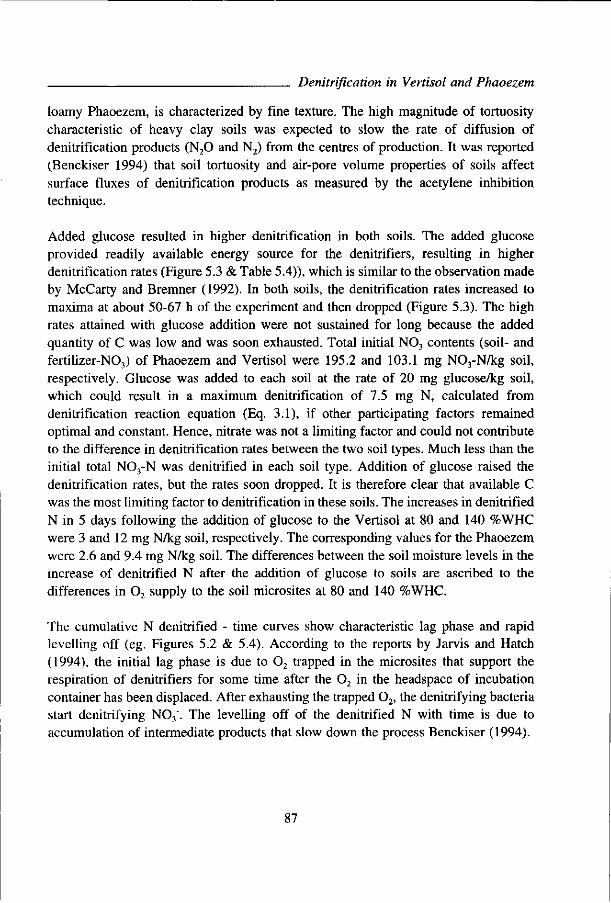
Denitrification in Vertisol and Phaoezem
loamy Phaoezem, is characterized by fine texture. The high magnitude of tortuosity characteristic of heavy clay soils was expected to slow the rate of diffusion of denitrification products (N20 and N2) from the centres of production. It was reported (Benckiser 1994) that soil tortuosity and air-pore volume properties of soils affect surface fluxes of denitrification products as measured by the acetylene inhibition technique.
Added glucose resulted in higher denitrification in both soils. The added glucose provided readily available energy source for the denitrifiers, resulting in higher denitrification rates (Figure 5.3 & Table 5.4)), which is similar to the observation made by McCarty and Bremner (1992). In both soils, the denitrification rates increased to maxima at about 50-67 h of the experiment and then dropped (Figure 5.3). The high rates attained with glucose addition were not sustained for long because the added quantity of C was low and was soon exhausted. Total initial N03 contents (soil- and fertilizer-N03) of Phaoezem and Vertisol were 195.2 and 103.1 mg N03-N/kg soil, respectively. Glucose was added to each soil at the rate of 20 mg glucose/kg soil, which could result in a maximum denitrification of 7.5 mg N, calculated from denitrification reaction equation (Eq. 3.1), if other participating factors remained optimal and constant. Hence, nitrate was not a limiting factor and could not contribute to the difference in denitrification rates between the two soil types. Much less than the initial total N03-N was denitrified in each soil type. Addition of glucose raised the denitrification rates, but the rates soon dropped. It is therefore clear that available C was the most limiting factor to denitrification in these soils. The increases in denitrified N in 5 days following the addition of glucose to the Vertisol at 80 and 140 %WHC were 3 and 12 mg N/kg soil, respectively. The corresponding values for the Phaoezem were 2.6 and 9.4 mg N/kg soil. The differences between the soil moisture levels in the increase of denitrified N after the addition of glucose to soils are ascribed to the differences in 02 supply to the soil microsites at 80 and 140 %WHC.
The cumulative N denitrified - time curves show characteristic lag phase and rapid levelling off (eg. Figures 5.2 & 5.4). According to the reports by Jarvis and Hatch (1994), the initial lag phase is due to 02 trapped in the microsites that support the respiration of denitrifiers for some time after the 02 in the headspace of incubation container has been displaced. After exhausting the trapped 02, the denitrifying bacteria start denitrifying N03". The levelling off of the denitrified N with time is due to accumulation of intermediate products that slow down the process Benckiser (1994).
87

Chapter 5
5.5.3 Potential denitrification
The finding that denitrification did not occur at moisture level < 60 %WHC in the absence of N2 (Figure 5.4a & c; Table 5.7) is consistent with the results of earlier experiment (effects of soil moisture and mineralizable C on denitrification discussed in Section 5.4.1) and is in agreement with the reports by Aulakh, et al. (1992) and Weier e tal . (1993a). The occurrence of denitrification at 30 %WHC in the presence of N2 (Figure 5.4b & d; Table 5.7) is ascribed to the displacement of 0 2 by N2 in the incubation bottle causing anaerobic condition in the soil microsites. The anaerobic condition so developed constrains the denitrifiers to use N0 3 as electron acceptors in their metabolism in the absence of 0 2 (Firestone, 1982; Fillery, 1983). Thus, the critical moisture levels for denitrification to commence in the presence and absence of N2 were 30 and 60 %WHC, respectively. The lack of denitrification in air-dry soil (ie. 0 %WHC in this experiment) despite N2 application to create anaerobic condition is because the amount of moisture in the soil was possibly too low to meet active metabolic requirement of the soil microorganisms whether under aerobic or anaerobic conditions. This underscores the importance of moisture for metabolic activities of denitrifiers. Water must be available at a certain level to have an active microbial population (Rolston, 1981). The significant effect of moisture level on denitrification (Tables 5.6 & 5.7) is attributed to the effect of moisture in restricting 0 2 diffusion into the soil pore space.
Moisture levels below saturation (<100 %WHC) do not fill all the pore space in which case 0 2 supply to the soil atmosphere is still high enough to support, at least in part, aerobic metabolic activities of microorganisms (Klemedtsson, etal., 1991). At higher moisture levels (>100 %WHC) the pore space is filled to capacity thereby restricting, but not completely stopping, 0 2 diffusion into the soil from the headspace. Flushing with N2 removes 0 2 from the headspace resulting in increased magnitude of anaerobic condition (Tables 5.6 & 5.7). The higher degree of anaerobic condition so developed results in higher denitrification activity, since denitrification is inversely related to 0 2
concentration in the medium (Jarvis, et al., 1991; Bandibas, et al., 1994).
The decline of denitrification rates after 53 to 73 h (Figure 5.5) even at soil moisture level > 100 %WHC in the presence of N2 is suggestive of some other factors than moisture and 0 2 limiting the process. The cumulative N losses in denitrification with N2 treatment during the entire experimental period were 44 and 67 mg N/kg soil from Vertisol and Phaoezem, respectively (Table 5.10). These losses are well below the initial total N03-N (soil- plus fertilizer-N) of Vertisol and Phaoezem which were 103.1 and 195.2 mg N/kg soil, respectively. Temperature was almost constant at 20 ± 2 °C
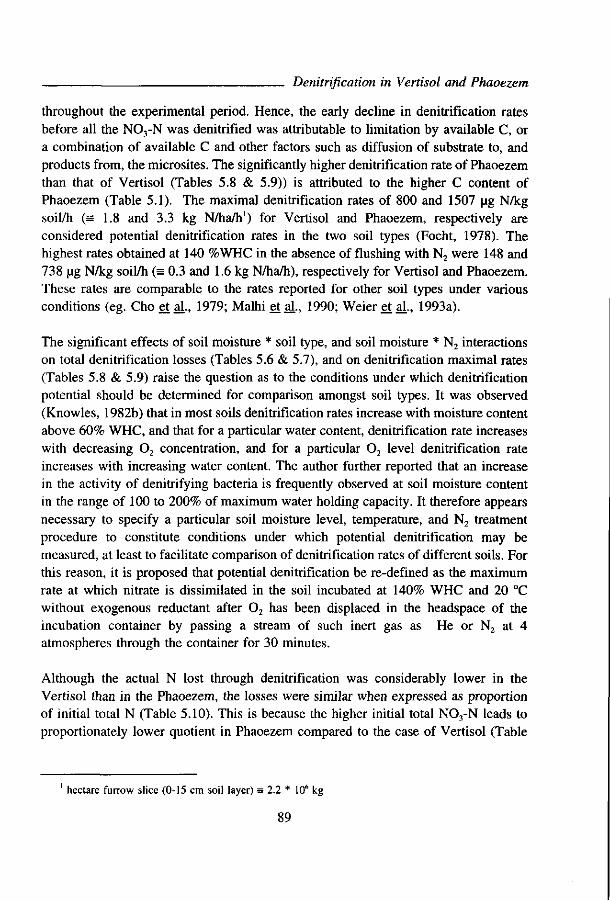
Denitrification in Vertisol and Phaoezem
throughout the experimental period. Hence, the early decline in denitrification rates before all the N03-N was denitrified was attributable to limitation by available C, or a combination of available C and other factors such as diffusion of substrate to, and products from, the microsites. The significantly higher denitrification rate of Phaoezem than that of Vertisol (Tables 5.8 & 5.9)) is attributed to the higher C content of Phaoezem (Table 5.1). The maximal denitrification rates of 800 and 1507 ug N/kg soil/h (H 1.8 and 3.3 kg N/ha/h1) for Vertisol and Phaoezem, respectively are considered potential denitrification rates in the two soil types (Focht, 1978). The highest rates obtained at 140 %WHC in the absence of flushing with N2 were 148 and 738 ug N/kg soil/h (= 0.3 and 1.6 kg N/ha/h), respectively for Vertisol and Phaoezem. These rates are comparable to the rates reported for other soil types under various conditions (eg. Cho et al-, 1979; Malhi et al., 1990; Weier et al., 1993a).
The significant effects of soil moisture * soil type, and soil moisture * N2 interactions on total denitrification losses (Tables 5.6 & 5.7), and on denitrification maximal rates (Tables 5.8 & 5.9) raise the question as to the conditions under which denitrification potential should be determined for comparison amongst soil types. It was observed (Knowles, 1982b) that in most soils denitrification rates increase with moisture content above 60% WHC, and that for a particular water content, denitrification rate increases with decreasing 02 concentration, and for a particular 02 level denitrification rate increases with increasing water content. The author further reported that an increase in the activity of denitrifying bacteria is frequently observed at soil moisture content in the range of 100 to 200% of maximum water holding capacity. It therefore appears necessary to specify a particular soil moisture level, temperature, and N2 treatment procedure to constitute conditions under which potential denitrification may be measured, at least to facilitate comparison of denitrification rates of different soils. For this reason, it is proposed that potential denitrification be re-defined as the maximum rate at which nitrate is dissimilated in the soil incubated at 140% WHC and 20 °C without exogenous reductant after 02 has been displaced in the headspace of the incubation container by passing a stream of such inert gas as He or N2 at 4 atmospheres through the container for 30 minutes.
Although the actual N lost through denitrification was considerably lower in the Vertisol than in the Phaoezem, the losses were similar when expressed as proportion of initial total N (Table 5.10). This is because the higher initial total N03-N leads to proportionately lower quotient in Phaoezem compared to the case of Vertisol (Table
hectare furrow slice (0-15 cm soil layer) = 2.2 * lO6 kg
89
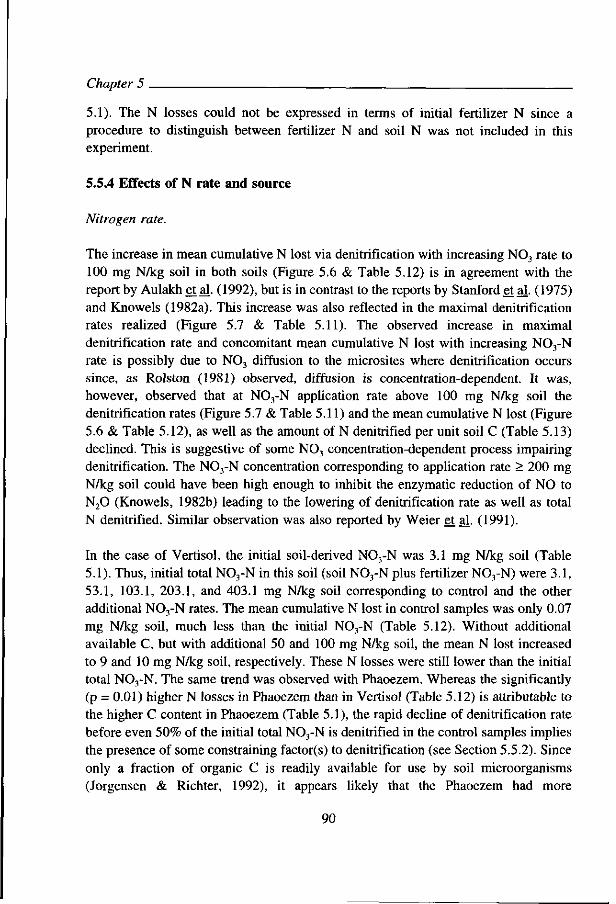
Chapter 5
5.1). The N losses could not be expressed in terms of initial fertilizer N since a procedure to distinguish between fertilizer N and soil N was not included in this experiment.
5.5.4 Effects of N rate and source
Nitrogen rate.
The increase in mean cumulative N lost via denitrification with increasing N0 3 rate to 100 mg N/kg soil in both soils (Figure 5.6 & Table 5.12) is in agreement with the report by Aulakh et al. (1992), but is in contrast to the reports by Stanford et al. (1975) and Knowels (1982a). This increase was also reflected in the maximal denitrification rates realized (Figure 5.7 & Table 5.11). The observed increase in maximal denitrification rate and concomitant mean cumulative N lost with increasing NO,-N rate is possibly due to N0 3 diffusion to the microsites where denitrification occurs since, as Rolston (1981) observed, diffusion is concentration-dependent. It was, however, observed that at N03-N application rate above 100 mg N/kg soil the denitrification rates (Figure 5.7 & Table 5.11) and the mean cumulative N lost (Figure 5.6 & Table 5.12), as well as the amount of N denitrified per unit soil C (Table 5.13) declined. This is suggestive of some N0 3 concentration-dependent process impairing denitrification. The N03-N concentration corresponding to application rate > 200 mg N/kg soil could have been high enough to inhibit the enzymatic reduction of NO to N 20 (Knowels, 1982b) leading to the lowering of denitrification rate as well as total N denitrified. Similar observation was also reported by Weier et al. (1991).
In the case of Vertisol, the initial soil-derived N03-N was 3.1 mg N/kg soil (Table 5.1). Thus, initial total N03-N in this soil (soil N03-N plus fertilizer N03-N) were 3.1, 53.1, 103.1, 203.1, and 403.1 mg N/kg soil corresponding to control and the other additional N03-N rates. The mean cumulative N lost in control samples was only 0.07 mg N/kg soil, much less than the initial N03-N (Table 5.12). Without additional available C, but with additional 50 and 100 mg N/kg soil, the mean N lost increased to 9 and 10 mg N/kg soil, respectively. These N losses were still lower than the initial total N03-N. The same trend was observed with Phaoezem. Whereas the significantly (p = 0.01) higher N losses in Phaoezem than in Vertisol (Table 5.12) is attributable to the higher C content in Phaoezem (Table 5.1), the rapid decline of denitrification rate before even 50% of the initial total N03-N is denitrified in the control samples implies the presence of some constraining factor(s) to denitrification (see Section 5.5.2). Since only a fraction of organic C is readily available for use by soil microorganisms (Jorgensen & Richter, 1992), it appears likely that the Phaoezem had more
90
Denitrification in Vertisol and Phaoezem
mineralizable C than the Vertisol. This view is in accord with the results in an earlier experiment (Section 5.4.1) in which more C02 was evolved from the Phaoezem than from the Vertisol. According to the report by Bijay-Singh et al. (1988), the amount of C02 evolved from soils under anaerobic conditions gives a good measure of C available for use by denitrifying bacteria.
Nitrogen source
Lack of difference in N losses between NH4-N treated samples and the controls in both soil types (Figure 5.8 & Table 5.15) indicates that nitrification had not taken place and, hence, there was no N03-N produced from the applied NH4-N. It is envisaged that high moisture level (140 %WHC) applied in the current experiment hindered 0 2 diffusion into the soil pore space resulting in impaired nitrification. However, the supplied C2H2
at 0.1 volume fraction in the headspace of the incubation bottle would block nitrification. According to the reports by Rolston (1986), Kroeze et al. (1989) and Tiedje et al (1989), nitrification becomes inhibited by C2H2.
The significantly higher N losses from NH4N03 and N03 than from NH4 in both soils (Table 5.15) was attributed to N03-N contents in the former N forms. The lack of significant difference in N losses between NH4N03 and NO, in the case of Vertisol (Table 5.1) suggests that N03 was not limiting denitrification in the NH4NO, treatment. The significant difference between NH4N03 and NO, as relates to N losses in Phaoezem was possibly due to higher available C in this soil, and reflects positive interaction between available C and N03-N supply. The maximal denitrification rates started to decline between 49 and 70 h of the experimental period in both soils (Figure 5.9) well before all the nitrate in the soils was denitrified. Similar results were obtained in Experiment 3. The significant interaction between soil types and N source with respect to maximal denitrification rate (Table 5.14) underscores the influence of soil-inherent factors in modifying denitrification in the presence of different N03-N levels.
5.6 Conclusions
Soil moisture levels within the range of 60 to 140% WHC had similar effects on microbial utilization of soil available C. Critical moisture level for denitrification to occur in these soils was 60% WHC corresponding to 0.41 and 0.35 moisture fractions for the Vertisol and the Phaoezem, respectively, but substantial denitrification losses occurred at > 80 %WHC. Anaerobic conditions lowered critical moisture level for denitrification in both soils to 30% WHC. Soil moisture was necessary for denitrification to occur: even under anaerobic conditions denitrification did not occur
91
Chapter 5
in the absence of moisture. Available C was an important limiting factor to denitrification in these soils. Denitrification potential of Phaoezem was higher than that of Vertisol. In both soils denitrification rates increased with increasing N03-N rate of application to maxima at 100 mg N03-N/kg soil, corresponding to initial total N03-N of 103.1 and 195.3 g/kg soil for Vertisol and Phaoezem, respectively. Higher N03-N rate than 100 mg N03-N/kg soil depressed denitrification rate, and resulted in lowered N losses. Maximal N losses in both soils were obtained with 100 mg N03-N/kg soil supplied, and mean N losses were higher in Phaoezem than in Vertisol at all N03-N levels. Under the conditions of the experiment in which the effects of N source on denitrification was investigated, nitrification did not occur and, hence, the differences in denitrification losses between the N sources were attributed to the N03-N contents of the applied N-forms.
92
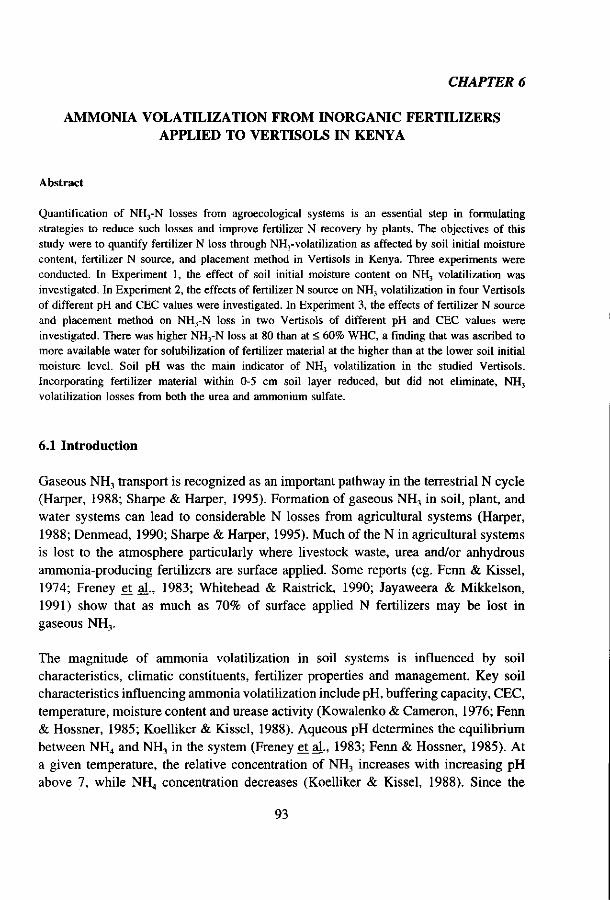
CHAPTER 6
AMMONIA VOLATILIZATION FROM INORGANIC FERTILIZERS APPLIED TO VERTISOLS IN KENYA
Abstract
Quantification of NH,-N losses from agroecological systems is an essential step in formulating strategies to reduce such losses and improve fertilizer N recovery by plants. The objectives of this study were to quantify fertilizer N loss through NH3-volatilization as affected by soil initial moisture content, fertilizer N source, and placement method in Vertisols in Kenya. Three experiments were conducted. In Experiment 1, the effect of soil initial moisture content on NH3 volatilization was investigated. In Experiment 2, the effects of fertilizer N source on NH3 volatilization in four Vertisols of different pH and CEC values were investigated. In Experiment 3, the effects of fertilizer N source and placement method on NH3-N loss in two Vertisols of different pH and CEC values were investigated. There was higher NH3-N loss at 80 than at < 60% WHC, a finding that was ascribed to more available water for solubilization of fertilizer material at the higher than at the lower soil initial moisture level. Soil pH was the main indicator of NH3 volatilization in the studied Vertisols. Incorporating fertilizer material within 0-5 cm soil layer reduced, but did not eliminate, NH3
volatilization losses from both the urea and ammonium sulfate.
6.1 Introduction
Gaseous NH3 transport is recognized as an important pathway in the terrestrial N cycle (Harper, 1988; Sharpe & Harper, 1995). Formation of gaseous NH3 in soil, plant, and water systems can lead to considerable N losses from agricultural systems (Harper, 1988; Denmead, 1990; Sharpe & Harper, 1995). Much of the N in agricultural systems is lost to the atmosphere particularly where livestock waste, urea and/or anhydrous ammonia-producing fertilizers are surface applied. Some reports (eg. Fenn & Kissel, 1974; Freney et al., 1983; Whitehead & Raistrick, 1990; Jayaweera & Mikkelson, 1991) show that as much as 70% of surface applied N fertilizers may be lost in gaseous NH3.
The magnitude of ammonia volatilization in soil systems is influenced by soil characteristics, climatic constituents, fertilizer properties and management. Key soil characteristics influencing ammonia volatilization include pH, buffering capacity, CEC, temperature, moisture content and urease activity (Kowalenko & Cameron, 1976; Fenn & Hossner, 1985; Koelliker & Kissel, 1988). Aqueous pH determines the equilibrium between NH4 and NH3 in the system (Freney et al., 1983; Fenn & Hossner, 1985). At a given temperature, the relative concentration of NH3 increases with increasing pH above 7, while NH4 concentration decreases (Koelliker & Kissel, 1988). Since the
93
Chapter 6
equilibrium between NH4 and NH3 is pH-dependent, the soil's buffering capacity (Buckman & Brady, 1974) has effect on NH3 volatilization. Reports by Vlek and Stumpe (1978), and Ferguson et al. (1984), showed that the amount of NH3-N lost from applied fertilizer N in soil systems varied with the soils' buffering capacities. Ammonia is sorbed by, or desorbed from, soil colloids (Rolston et al., 1972), and the amount of NH4
+ that a soil can sorb is influenced by the soil's CEC (Kowalenko & Cameron, (1976). Many reports (eg. Fenn & Miyamoto, 1981; Fenn & Hossner, 1985; Koelliker & Kissel, 1988) show that NH3 volatilization rate increases with temperature, given other factors favourable and constant. Soil moisture affects NH3 volatilization differently, depending on whether the moisture is added to the soil before or after the fertilizer. Fenn and Escarzaga (1976) reported that evaporation enhanced NH3 loss from originally wet soil. In another report (Fenn & Escarzaga, 1977), it was found that initially wet soil, brought to 60 to 80% of water saturation, resulted in higher NH3
losses in most soils with both ammonium nitrate and ammonium sulfate than losses from initially dry soils. In the same report it was shown that addition of increasing water quantities, after fertilizer application, reduced NH3 loss. Soil moisture content is primarily determined by rainfall pattern, especially where irrigation is not practised. Wind provides the driving force for ammonia volatilization from soil, solution, or plant surfaces by sweeping away ammonia-laden layer thereby lowering NH3 partial pressure at these surfaces (Denmead et al., 1982; Freney et al., 1983).
The urease activity of the soil is largely dependent on the soil's organic matter content, especially the fraction available as a source of energy for urease-producing microorganisms (Kissel & Cabrera, 1988). Fertilizer type, and especially the interaction between fertilizer type and soil type, is known to influence NH3 loss from inorganic fertilizers ( Hargrove et al., 1977; Whitehead & Raistrick, 1990; Gezgin & Bayrakll, 1995). Fertilizer placement method has also been reported (Touchton & Hargrove, 1982; Bouwmeester et al., 1985; Eckert, 1987) to influence the magnitude of NH, loss from fertilizers, depending on the fertilizer type and placement method. Hence, in the final analysis the magnitude of NH3 volatilization from N fertilizers applied to a soil system will be determined by the interaction of soil characteristics (pH, CEC, moisture content, CaC03 content), fertilizer properties (chemical and physical), climatic constituents (rainfall amount and distribution, %RH, temperature, wind), and management practices (rate, time and method of fertilizer application).
From agricultural standpoint, any fertilizer applied to, but not utilized by, a crop is a loss. Thus, gaseous NH3 escaping from fertilizers applied to crops is considered an economic loss to the farmer. In an agricultural system it becomes important to quantify NH3 volatilization losses as affected by various factors and practices under
94

Ammonia volatilization in Vertisols
agroecological conditions in order to formulate specific strategies to reduce the losses. Investigations under controlled laboratory conditions were preferred in order to rank the effects of specific factors on NH3 volatilization, and also to test the effectiveness of selected management options with the limited resources available. The objectives of this study were to quantify fertilizer N loss via NH3-volatilization as affected by soil initial moisture content, fertilizer nitrogen source, and fertilizer material placement mode in Vertisols in Kenya.
6.2 Materials and methods
6.2.1 Experimental treatments
Experiment 1. Initial soil moisture content and N sources
The effects of initial moisture content of the soil and N source on NH3 volatilization were investigated. Information on initial soil moisture content and NH3 volatilization relations in Vertisols was needed for subsequent experiments. Machakos Vertisol with pH of 7.58 (Table 6.1) was used. There were 4 moisture levels, 0, 30, 60, and 80% water holding capacity (WHC) and 2 fertilizer N sources (AS & AN) making 8 treatment combinations. The WHC was determined as described in Chapter 5. The treatments were replicated three times and randomly arranged.
Experiment 2. Soil pH and fertilizer N sources
In this experiment the effects of fertilizer N source on NH3 volatilization in Vertisols of different pH and CEC values were investigated. Soils from Rodi Kopany, Muhoroni, Kitale, and Karaba with pH values of 6.02, 6.07, 7.46, and 7.65, and CEC values of 29.5, 40.4, 38.6 and 45.4, respectively, were used (Table 6.1). Ammonium sulfate and AN were used to provide NH4
+ and NH4N03. The 12 treatments were made up of the 4 soils and the 2 N sources factorially combined, and 4 controls, one for each soil. The treatments were replicated thrice and randomly arranged. All the soil samples were brought to 80 %WHC.
Experiment 3. Fertilizer N sources and placement modes
The effects of fertilizer N source and placement method on NH3 volatilization in two Vertisols of different pH values were investigated. There were 8 treatment combinations comprised of 2 N sources (U and AS), 2 placement methods (surface broadcast, and broadcast and incorporated within 5 cm soil depth), and two Vertisols
95
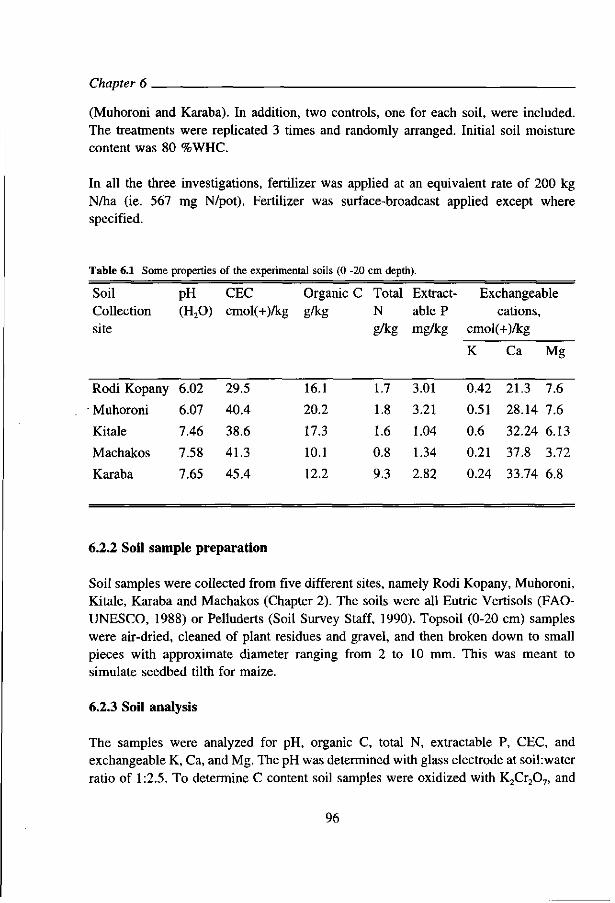
Chapter 6
(Muhoroni and Karaba). In addition, two controls, one for each soil, were included. The treatments were replicated 3 times and randomly arranged. Initial soil moisture content was 80 %WHC.
In all the three investigations, fertilizer was applied at an equivalent rate of 200 kg N/ha (ie. 567 mg N/pot). Fertilizer was surface-broadcast applied except where specified.
Table 6.1 Some properties of the experimental soils (0 -20 cm depth).
Soil pH CEC Organic C Total Extract- Exchangeable Collection (H20) cmol(+)/kg g/kg N able P cations, site g/kg mg/kg cmol(+)/kg
Rodi Kopany 6.02 29.5
Muhoroni 6.07 40.4
Kitale 7.46 38.6
Machakos 7.58 41.3
Karaba 7.65 45.4
16.1
20.2
17.3
10.1
12.2
1.7
1.8
1.6
0.8
9.3
3.01
3.21
1.04
1.34
2.82
K
0.42
0.51
0.6
0.21
0.24
Ca Mg
21.3 7.6
28.14 7.6
32.24 6.13
37.8 3.72
33.74 6.8
6.2.2 Soil sample preparation
Soil samples were collected from five different sites, namely Rodi Kopany, Muhoroni, Kitale, Karaba and Machakos (Chapter 2). The soils were all Eutric Vertisols (FAO-UNESCO, 1988) or Pelluderts (Soil Survey Staff, 1990). Topsoil (0-20 cm) samples were air-dried, cleaned of plant residues and gravel, and then broken down to small pieces with approximate diameter ranging from 2 to 10 mm. This was meant to simulate seedbed tilth for maize.
6.2.3 Soil analysis
The samples were analyzed for pH, organic C, total N, extractable P, CEC, and exchangeable K, Ca, and Mg. The pH was determined with glass electrode at soil:water ratio of 1:2.5. To determine C content soil samples were oxidized with K2Cr207, and
96
Ammonia volatilization in Vertisols
the concentration of Cr3+ formed in the reaction was measured colorimetrically, and compared with standard series of sodium oxalate that had been treated in the same way. Total N was determined by digesting the soil samples with a mixture of H2S04-Se and salicylic acid, and measuring the N in the digest spectrophotometry. Extractable inorganic P and exchangeable K were extracted using modified Olsen extradant used by ICRAF (1995). A mixture of 0.5 M NaHC03 and 0.01 M EDTA at pH 8.5 was used as the extradant. K was determined using flame photometer (Cornig 410) and extractable P was determined spectrophotometry using Spectronic 21 D (Milton Roy CO.). Extractable Ca and Mg were extracted using 1 M KCl extradant at 1:10 soil: solution ratio, and then determined using Atomic Absorption Spectrophotometer. To determine CEC, soil was leached with 1 M NH4OAc (pH = 7). The adsorbed NH4
+ was released by leaching the soil with acidified CaCl2 solution and subsequently determined by spectrophotometry using continuous flow auto-analyzer. Some properties of the soils are given in Table 6.1.
6.2.4 Incubation procedures
Vented closed flux chamber similar to the one described by Oenema and Velthof (1993) was used. Air-dry, coarse soil (3 kg) was put in a dark-coloured PVC container with a provision for closing (Figure 6.1). The soil in the container was brought to the required moisture level by adding appropriate amount of distilled water. The container was then covered and left overnight in the laboratory. This was meant to allow the added water to permeate the soil matrix to ensure uniform wetting of the soil. One day after moisture addition, fertilizer was surface-broadcast applied except where specified, and NH3 trap solution provided. A petri dish containing 20 ml of 0.5 M HCl was held on top of the funnel in the container (Figure 6.1). The HCl provided the driving force for NH3 volatilization by lowering the partial pressure of gaseous NH3 in the headspace. The container was then closed and left on a level surface. The NH3 trap solution was replenished as necessary. The experimental periods were 6, 8, and 11 days for experiments on initial soil moisture content and N sources, soil pH and fertilizer N sources, and fertilizer N sources and placement modes, respectively. The mean maximum and minimum temperatures in the laboratory during the experimental period were 21 and 18 °C, respectively.
At each replenishment of NH3 trap solution, the replaced HCl solution was put in vials which were then closed airtight and kept in a refrigerator at 0 to 4 °C until the time of analysis. The concentration of NH3 in the trap solution was determined using continuous flow auto-analyzer (Skalar Co.).
97
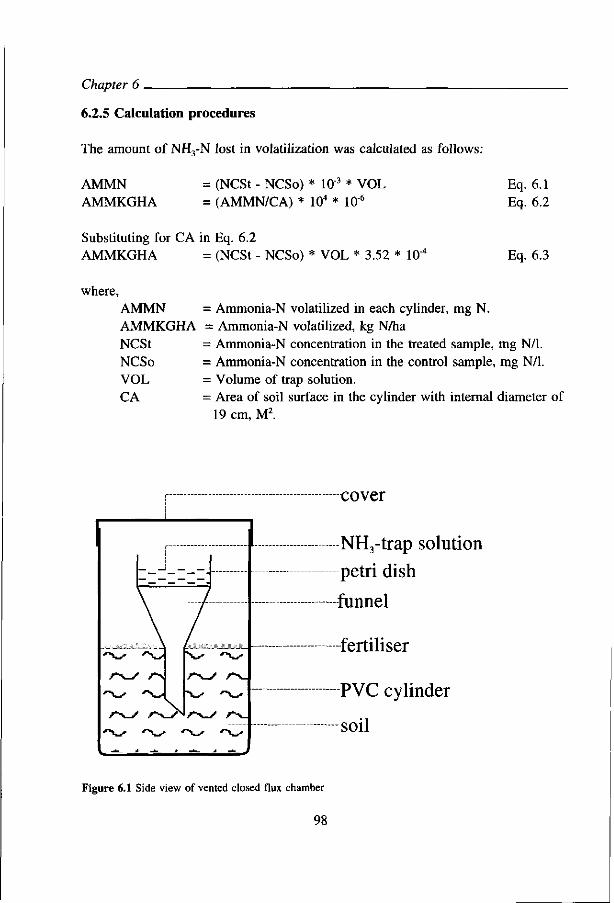
Chapter 6
6.2.5 Calculation procedures
The amount of NH3-N lost in volatilization was calculated as follows:
AMMN AMMKGHA
= (NCSt - NCSo) * 10"3 * VOL = (AMMN/CA) * 104 * 10"6
Substituting for CA in Eq. 6.2 AMMKGHA = (NCSt - NCSo) * VOL * 3.52 * 10"4
where,
Eq. 6.1 Eq. 6.2
Eq. 6.3
AMMN = Ammonia-N volatilized in each cylinder, mg N. AMMKGHA = Ammonia-N volatilized, kg N/ha NCSt = Ammonia-N concentration in the treated sample, mg N/1. NCSo = Ammonia-N concentration in the control sample, mg N/1. VOL = Volume of trap solution. CA = Area of soil surface in the cylinder with internal diameter of
19 cm, M2.
cover
NH3-trap solution
petri dish
funnel
fertiliser
PVC cylinder
soil
Figure 6.1 Side view of vented closed flux chamber
98

Ammonia volatilization in Vertisols
6.3 Results
Soil initial moisture content and N sources
Ammonia volatilization increased with increasing soil initial moisture level, with 80 %WHC resulting in the highest N loss from both N sources (Figure 6.2). Ammonia losses were significantly (p = 0.01) higher from AS than AN at all the soil moisture levels tested. The difference in %N lost between the two N sources became more pronounced as soil moisture content increased.
Soil pH and N sources
The magnitude of NH3 volatilization from AN and AS applied to Rodi Kopany and Muhoroni Vertisols (with respective pH values of 6.02 and 6.07) were extremely low resulting in less than 0.3 %N loss from each N source and, therefore, not included in Figure 6.3. There were higher N losses from AS than from AN in both Karaba and Kitale Vertisols if the losses are expressed as a fraction of total N applied (Figure 6.3a), but there is no difference if the losses are expressed in terms of NH4-N applied (Figure 6.3b). The rate of N loss from both N sources and in both soils increased to maxima within two days following fertilizer application, and then decreased very rapidly (Figure 6.4). Ammonia volatilization was almost completed within 6 days of the experiment. Nitrogen loss rate was higher in Karaba than in Kitale for both AN and AS within the first 4 days, after which the differences were not definitive.
N lost, % of applied total N N lost, % of applied NH4-N
fcWHC
Figure 6.2 Nitrogen volatilized from AN and AS applied to Machakos Vertisol (pH = 7.58) as influenced by initial soil moisture level expressed as a fraction of total N (a) and of NH4-N (b).
99
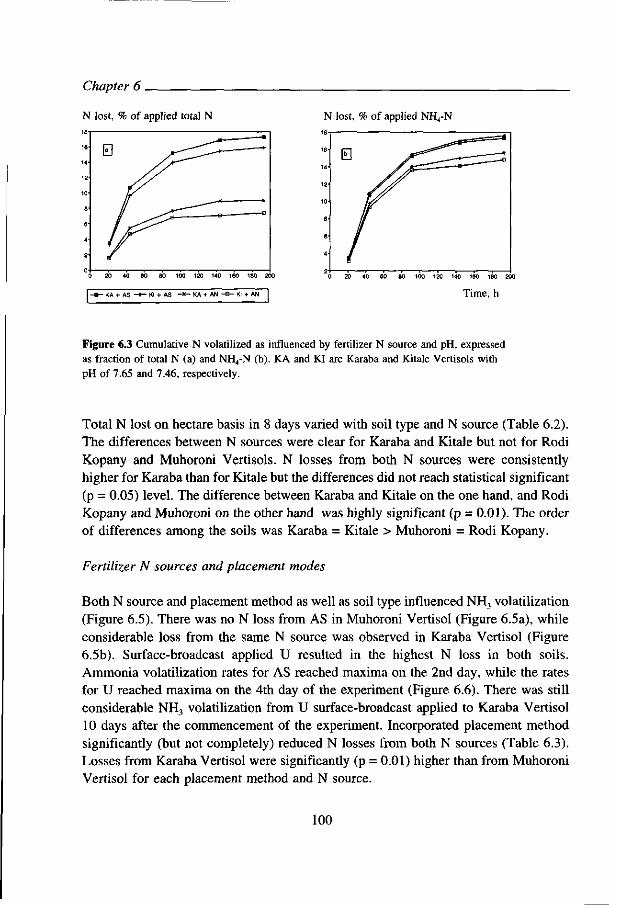
Chapter 6.
N lost, % of applied total N N lost, % of applied NH4-N
20 40 60 80 100 120 140 160 180 200
- Kl + AS - * - KA + AN - B - Kl + AN
20 40 60 80 100 120 140 160 180 200
Time, h
Figure 6.3 Cumulative N volatilized as influenced by fertilizer N source and pH, expressed as fraction of total N (a) and NH4-N (b). KA and Kl are Karaba and Kitale Vertisols with pH of 7.65 and 7.46, respectively.
Total N lost on hectare basis in 8 days varied with soil type and N source (Table 6.2). The differences between N sources were clear for Karaba and Kitale but not for Rodi Kopany and Muhoroni Vertisols. N losses from both N sources were consistently higher for Karaba than for Kitale but the differences did not reach statistical significant (p = 0.05) level. The difference between Karaba and Kitale on the one hand, and Rodi Kopany and Muhoroni on the other hand was highly significant (p = 0.01). The order of differences among the soils was Karaba = Kitale > Muhoroni = Rodi Kopany.
Fertilizer N sources and placement modes
Both N source and placement method as well as soil type influenced NH3 volatilization (Figure 6.5). There was no N loss from AS in Muhoroni Vertisol (Figure 6.5a), while considerable loss from the same N source was observed in Karaba Vertisol (Figure 6.5b). Surface-broadcast applied U resulted in the highest N loss in both soils. Ammonia volatilization rates for AS reached maxima on the 2nd day, while the rates for U reached maxima on the 4th day of the experiment (Figure 6.6). There was still considerable NH3 volatilization from U surface-broadcast applied to Karaba Vertisol 10 days after the commencement of the experiment. Incorporated placement method significantly (but not completely) reduced N losses from both N sources (Table 6.3). Losses from Karaba Vertisol were significantly (p = 0.01) higher than from Muhoroni Vertisol for each placement method and N source.
100
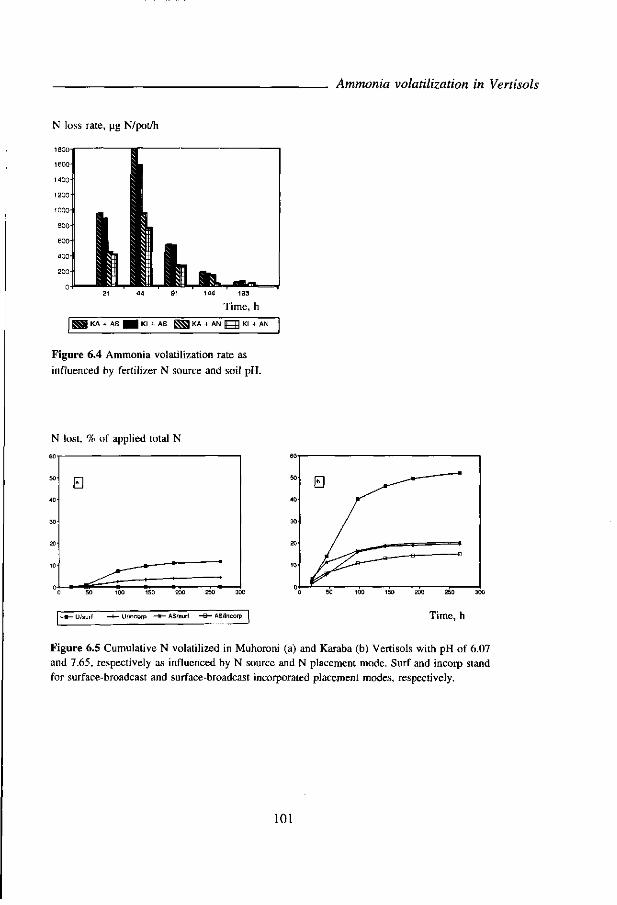
Ammonia volatilization in Vertisols
N loss rate, ug N/pot/h
1600-
1400"
1200-
1000-
800-
600'
400-
200-
21 44 91 144 193
Time, h
^ KA + AS | B Kl + AS J ^ KA + AN [ ^ Kl + AN
Figure 6.4 Ammonia volatilization rate as influenced by fertilizer N source and soil pH.
N lost, % of applied total N
200 250 50 100 150 200 250 300
Time, h
Figure 6.5 Cumulative N volatilized in Muhoroni (a) and Karaba (b) Vertisols with pH of 6.07 and 7.65, respectively as influenced by N source and N placement mode. Surf and incorp stand for surface-broadcast and surface-broadcast incorporated placement modes, respectively.
101
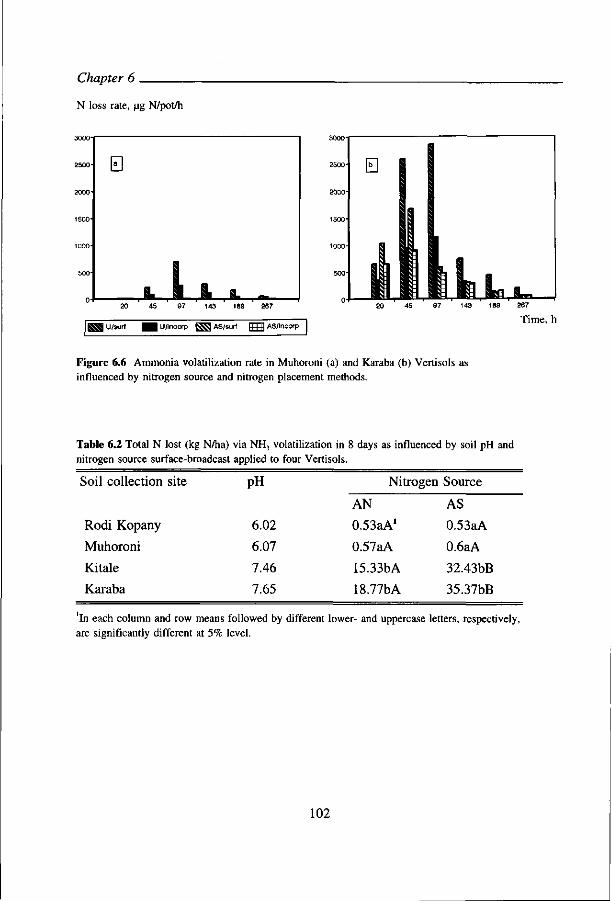
Chapter 6
N loss rate, ug N/pot/h
0
20 45 97 143 189 267
j U/surf ^ | U/incorp ^ ^ AS/surf f ^ AS/lncorp
3000-
2500-
2000-
1500-
1000-
500-
E l
|
45 97 143 189 267
Time, h
Figure 6.6 Ammonia volatilization rate in Muhoroni (a) and Karaba (b) Vertisols as influenced by nitrogen source and nitrogen placement methods.
Table 6.2 Total N lost (kg N/ha) via NH3 volatilization in 8 days as influenced by soil pH and nitrogen source surface-broadcast applied to four Vertisols.
Soil collection site
Rodi Kopany
Muhoroni
Kitale
Karaba
pH Nitrogen Source
6.02
6.07
7.46
7.65
AN
O^aA 1
0.57aA
15.33bA
18.77bA
AS
0.53aA
0.6aA
32.43bB
35.37bB
In each column and row means followed by different lower- and uppercase letters, respectively, are significantly different at 5% level.
102

Ammonia volatilization in Vertisols
Table 6.3 Total N lost (kg N/ha) via NH3 volatilization in 11 days from Muhoroni and Karaba Vertisols as influenced by nitrogen source and placement method.
Soil collection site
PH
Muhoroni
Karaba
6.07
7.65
Placement method
Incorporated
Surface
Incorporated
Surface
Nitrogen source
Ammonium sulfate
0.13aA*
0.13aA
29.93bA
40.91cA
Urea
8.57aB
23.12bB
41.03cB
104.31dB
In each column and row means followed by different lower- and uppercase letters are significantly different 5% level.
6.4 Discussion
Initial soil moisture content and N sources
This experiment was carried out primarily to determine the soil moisture content, in a non-flooded soil, at which NH3 volatilization was highest. This information was required for the subsequent experiments since it is vital to conduct comparison experiments on NH3 volatilization at the same soil moisture level. The WHC of the five Vertisols studied (Table 6.1) were similar and, hence, the WHC of one of the Vertisols was discussed (Section 2.2.2.6). Soil moisture levels 0, 30, 60, and 80% WHC correspond to 0.13, 0.20, 0.41 and 0.54 moisture mass fractions, respectively. The moisture content at field capacity, FC, is approximately 0.54 moisture mass fraction. The maximum ammonia volatilization from both fertilizers occurred at 80 %WHC (Figure 6.2), a finding that agrees with the report by Bouwmeester et al. (1985) who observed maximum NH3 volatilization from soils with initial moisture content at or near field capacity. The progressively less NH3 volatilization at lower moisture levels was ascribed to decreasing availability of moisture for solubilizing the fertilizers. The influence of evaporation was excluded from this experiment since the chamber was closed most of the experimental period.
These results imply that surface application of fertilizer as top dressing (usually not incorporated) late in the season when soil moisture content is high carries higher risk of NH3-volatilization losses than does fertilizer application at planting time when the soil moisture content is still low. This scenario is relevant under rain-fed agriculture
103

Chapter 6
conditions, particularly where fertilizer is top dressed late in the season when rainfall frequency is low. However, if the fertilizer is applied at the beginning of the season when rainfall is frequent the percolating rain water moves the fertilizer in to the soil, thereby reduces NH3 volatilization ( Fenn & Escarzaga, 1976).
pH and N sources
Negligible amounts of N volatilized from AN and AS applied to Rodi Kopany and Muhoroni Vertisols was attributable to the relatively low pH levels of these soils (Table 6.1), a finding that agrees with the reports by Du Plessis and Kroontje (1964), Koelliker and Kissel (1988), and Whitehead and Raistrick (1990). The higher N losses from AS than from AN in both Karaba and Kitale Vertisols if the losses are expressed as fractions of total N applied (Figure 6.3a) is because of the higher NH4-N content of AS. If the N losses are expressed in terms of applied NH4-N to both soils then there is no difference between the two N sources (Figure 6.3b). This finding is in contrast with that by Whitehead and Raistrick (1990) who found less NH3 volatilization from AN than from AS even if the N losses were expressed as fractions of NH4-N applied. The soils used in the present study were not calcareous and, hence, CaS04 precipitation (Eq. 3.3) could not occur to a large extent. This could possibly be the cause of lack of difference in AN and AS in these soils when the N losses are expressed as fractions of initial NH4-N. In the present experiment CEC did not seem to have effect on NH3
volatilization, since soils with different CEC values but similar pH values had similar effects on NH3 volatilization. This is possibly because of high CEC of the soils used (Table 6.1) which could not constitute limitation to, and hence differences in, the sorption of applied NH4
+. Under the present experimental conditions, soil pH was considered the main soil characteristic influencing NH3 volatilization.
Ammonia volatilization rates from both N sources in both Karaba and Kitale Vertisols were similar and rapid (Figure 6.4). This is because NH3 volatilization from AS and AN, results from purely physical-chemical reactions with the soil. Ammonia volatilization was rapid such that most N losses occurred within 4 days, and the process was almost completed by the 6th day. Nitrogen losses via volatilization were significantly higher (p = 0.05) in the high pH group (Karaba and Kitale) than in the low pH group (Rodi Kopany and Muhoroni) Vertisols (Table 6.2). The lack of difference between N sources for Rodi Kopany and Muhoroni Vertisols is because there was no substantial NH3 volatilization from these soils. The narrow difference in pH values between Karaba and Kitale Vertisols was deemed responsible for the low differences in N losses from both N sources in the two soils. However, the effect of pH on NH3 volatilization in these Vertisols is quite clear, with Karaba (pH = 7.65)
104
Ammonia volatilization in Vertisols
losing more N than Kitale (pH = 7.46). The significantly higher (p = 0.05) N losses from AS than from AN is consistent with the finding from Machakos Vertisol (pH = 7.58) used in the previous experiment in this report, and is ascribed to higher NH4-N content of AS.
Fertilizer N sources and placement mode
The N loss from U in Muhoroni Vertisol is attributed to increase in the generated pH of the soil microsites in the immediate vicinity of the fertilizer materials during the hydrolysis of U. This results in the formation of NH3 from NH4
+ in the soil solution. The significantly (p = 0.05) higher N loss from U in Karaba than in Muhoroni Vertisol (Figure 6.5 and Table 6.2) is attributed to higher pH value of Karaba.
Incorporating surface-broadcast applied fertilizer within 0-5 cm soil layer significantly (p = 0.05) reduced N losses from both N sources in both Vertisols (Table 6.3). Incorporation placement method was very effective for U resulting in the reduction of N losses by 63 and 61% in Muhoroni and Karaba, respectively. Incorporating U within the 0-5 cm did not, however, completely eliminate NH3 volatilization. Fenn and Kissel (1976), and Bouwmeester et al. (1985) placed fertilizer materials below various soil depths and reported that placing fertilizer at < 5 cm soil layer completely eliminated NH, volatilization losses from U. In the present study the fertilizer material was incorporated within, and not below, the 0-5 cm soil layer. Placing fertilizer materials at pre-determined soil depths is possible in mechanized agriculture. The present study simulated conditions of an area where farmers use hand implements which can not enable them to place fertilizer at specified soil depth. Hence, incorporating fertilizer material within the 0-5 cm soil layer is more practical in the circumstances under which the present study was conducted.
Incorporation placement mode was not very effective for AS, resulting in the reduction of N loss by 27% as compared to the surface-broadcast placement method. This observation is in agreement with that of Fenn and Miyamoto (1981) who reported low effectiveness of incorporating AS in soil in reducing NH3 volatilization. Incorporating AS in soil increases the contact between AS and soil colloids which can facilitate the adsorption of some of the NH4
+ from AS to soil colloids resulting in modest reduction in NH3-N loss with depth. Ammonia volatilization rate in the case of U reached the maxima much later than in the case of AS (Figure 6.6). This is because U requires some time to be hydrolysed. The product of hydrolysis, (NH4)2C03, is then subject to NH3 volatilization. Hydrolysis of U in both soils was not expected to be different since urease activity, on which hydrolysis depends, is governed primarily by organic C,
105
Chapter 6
temperature and soil moisture content, all of which factors were similar in both soils under the present experimental conditions
6.5 Conclusions
For both AN and AS fertilizer sources, NH3 volatilization was higher at 80% than at WHC < 60% possibly because the higher soil moisture level provided more water for the solubilization of the fertilizer materials than was the case at lower soil moisture levels. Soil pH was the reliable indicator of NH3 volatilization risk in the four Vertisols studied. Soil CEC did not have discernible influence on NH3 volatilization. The higher N losses from AS than from AN was due to higher NH4-N content of AS. When fertilizer materials were surface-broadcast applied, the NH3-N losses were in the order U > AS > AN. Incorporating fertilizer material within 0-5 cm layer was more effective in reducing N losses from urea than from ammonium sulfate. However, fertilizer incorporation did not completely eliminate NH3 loss from urea.
106
CHAPTER 7
EFFECTS OF FERTILIZER NITROGEN SOURCE AND RATE ON NITROGEN LOSS IN BYPASS FLOW IN A KENYAN VERTISOL
Abstract
Bypass flows can lead to considerable losses of fertilizer applied to soils. The amount of fertilizer N lost in leaching or bypass flow can be influenced by fertilizer type and the rate of application. The objective of this study was to determine the effects of fertilizer nitrogen source and rate on N loss in the bypass flow from a Kenyan Vertisol. Calcium nitrate and (NH4)2S04 were surface-broadcast applied to the soil columns at equivalent rates of 50, 100, and 200 kg N/ha. Using rainfall simulator, two rainstorms of 30 mm/h each were applied to soil columns. One rainstorm was applied before, and the other after, fertilizer application. The bypass flow after the 2nd rainstorm (ie. the rainstorm following fertilizer application) was used in determining N03-N, NH4-N, and total-N. Nitrate-N source resulted in substantial amounts of N recovered in the bypass flow. Ammonium-N source had no effect on N recovered in the bypass flow. Nitrate-N was the main N-form in which fertilizer N was recovered in the bypass flow, and the amount of N recovered increased with increasing N03-N rate of application. On the average, 11.8% of applied NO rN and between 16 and 48% of total N (fertilizer + soil) were recovered in the bypass flow. It is concluded that bypass flow is an important avenue of NO,-, and not NH4-N loss from Vertisols.
7.1 Introduction
Bypass flow of water through soil profiles proceeds predominantly via macropores (Bouma et al., 1981; Smettem et al., 1983). It is the vertical flow of free water along the walls of macropores or preferential paths in the soil (Smettem et al., 1983; Andreini & Steenhuis, 1990). The macropores could arise as a result of soil fauna and flora activities and/or due to the soil's physicochemical properties that facilitate crack-formation (White, 1985). In Vertisols, volume changes drastically with soil moisture content leading to shrinking or swelling when the soil is dry or wet, respectively (Chapter 2). The shrink-swell characteristic of these soils is reported to be the main cause of cracks formation (Wilding & Tessier, 1988; Bronswijk & Evers-Vermeer, 1990). Preferential flow paths, such as cracks between peds, have a strong impact on flow processes (Bouma & Loveday, 1988; Bronswijk & Evers-Vermeer, 1990), and facilitate rapid solute fluxes through the soil profile circumventing biologically active root rhizosphere (Andreini & Steenhuis, 1990). Bypass flows can lead to considerable losses of fertilizer applied to land (Dekker & Bouma, 1984; Smettem et al., 1983) and has been shown to be a possible avenue of fertilizer loss in Kenyan Vertisols (Smaling & Bouma, 1992).
The amount of fertilizer N lost in leaching or bypass flow can be influenced by the
107

Chapter 7
type of fertilizer and the rate of N application. Mochoge (1989) reported high N losses from soil columns to which KN03 had been applied, and no N loss from (NH4)2S04
treated soils. Other reports show that the amount of N loss in leaching increase with increasing N03-N application rates (Shepherd et al., 1993). In some cases, the N recovered in the bypass flow exceed the amount of nitrogen derived from fertilizer (Ndff) applied to the soil. The increase in the release of soil N following fertilizer N addition has been reported (Broadbent, 1965; Mochoge 1989), and is referred to as "priming effect" (Hauck & Bremner, 1978) or added nitrogen interaction, ANI (Jenkinson et al., 1985). The phenomenon has been reported in a variety of experiments with and without crops as well as from soil columns (Westerman & Kurtz, 1973; Westerman & Tucker, 1974; Mochoge, 1989). Some researchers have reported that addition of NH4-N does not lead to increase in the release of soil N (Jasson, 1958; Mochoge, 1989). Hamid and Ahmad (1995) found ANI due to ammonium nitrate, urea, and ammonium sulfate to be in the order NH4N03 > CO(NH2)2 = (NH4)2S04. The significantly high ANI from NH4N03 could possibly be due to the N03" component of the NH4N03.
With respect to Kenyan Vertisols, information on fertilizer losses in bypass flow is confined to report by Smaling and Bouma (1992) who considered only one fertilizer type (CAN) and one rate (50 kg N/ha) of application in the experiment. Knowledge and understanding of the magnitude of N losses in bypass flow, as well as the factors affecting the process are essential in formulating measures to reduce such losses in order to improve fertilizer N recovery in crop. The objective of this study was to determine the effects of fertilizer nitrogen source and rate on N loss in the bypass flow from a Kenyan Vertisol.
7.2 Materials and Methods
7.2.1 Treatments
Two fertilizer types, Ca(N03)2 and (NH4)2S04, were surface-broadcast applied to the soil columns at equivalent rates of 50, 100, and 200 kg N/ha, giving 6 treatment combinations. Together with the control (no fertilizer application) there were 7 treatments which were replicated 3 times and randomly arranged.
7.2.2 Technical details
Undisturbed soil columns were excavated using PVC cylinders 40, 20, and 1.5 cm in height, diameter, and thickness, respectively. The cylinders were sharpened at the
108
Nitrogen loss in bypass flow
bottom end for ease of sliding down the soil during sample taking. Liberal amount of vaseline was smeared on the inside wall of each cylinder before sampling in order to prevent water flow along the walls. Column depth of 40 cm was chosen to coincide with the effective rooting depth of maize, the principal crop in the area. The top 15 cm of the soil column in the PVC cylinder was broken down into loose but coarse aggregates using hunter's knife. This was meant to simulate cultivated field situation. A headspace of 2 cm was left between soil surface in the cylinder and the top of the cylinder. This provided cultivated topsoil of 15 cm depth on top of uncultivated subsoil of 23 cm depth.
In simulating rainfall, tap water (pH = 6.4; EC = 0.32) was used. Rainfall intensity of 30 mm/h was applied using rainfall simulator (Figure 7.1).* Two rainstorms were applied per sample. On the 1st day 30 mm/h of rainstorm was applied, and the amount of bypass flow measured. The soil column in the cylinder was left in place without disturbance until the next day, when fertilizer was applied and then followed with the 2nd rainstorm of 30 mm/h. This was meant to simulate fertilizer application after the onset of rainy season in contrast to fertilizer application before the rains set in.
About 50 ml of methylene blue solution (50 g methylene blue in 1000 ml of distilled water) was sprayed on the surface of each soil column before fertilizer application to allow for the observation of bypass flow paths (Bouma & Dekker, 1978; Andreini & Steenhuis, 1990).
7.2.3 Soils and climate
Soil samples used in this study were obtained from Rodi Kopany (Figure 1.1), an established research site in south-western Kenya (FURP, 1987b; Smaling & Bouma, 1992), situated at 0°35' and 34° 30'E, and at an elevation of 1370 meters above sea level. The soils are classified as Eutric Vertisol (FAO-UNESCO, 1988) or Typic Pelluderts (Soil Survey Staff, 1990). Selected soil characteristics are shown in Table 2.2. The site falls under the Lower Midland 2 (LM2) agroecological zone characterized by long to medium cropping season (Jaetzold & Schmidt, 1982). Rainfall distribution and temperature data of the site are given in Table 2.1.
Courtesy of the Department of Water Resources, WAU, P.O. Box 9101, 6700 HB, Wageningen, The Netherlands.
109

Chapter 7.
tube nibber stopper
water reservoir
rain simulator
--headspace - plate with irrigation needles
-soil
—perforated disc
—funnel
- support cylinder
-measuring beaker
level surface
Figure 7.1 S ide view of bypass flow equipment system
7.2.4 Data collection and analysis
The amounts of bypass flows after the 1st and 2nd rainstorms were collected in the beakers (Figure 7.2) and measured. The bypass flow after the 2nd rainstorm (ie. the rainstorm following fertilizer application) was used in determining N03-N, NH4-N, and total-N. The bypass flow was first filtered using Whatman filter paper no. 42, then stored at 4°C in glass bottles with screw tops until the time of laboratory analysis. The NH4
+-N, NOj-N, and total N concentrations in the bypass flow were measured at A, of 655, 525 and 410 nm, respectively, using Spectronic 21D (Milton Roy Co.) according to standard procedures at ICRAF laboratory (ICRAF, 1995).
110
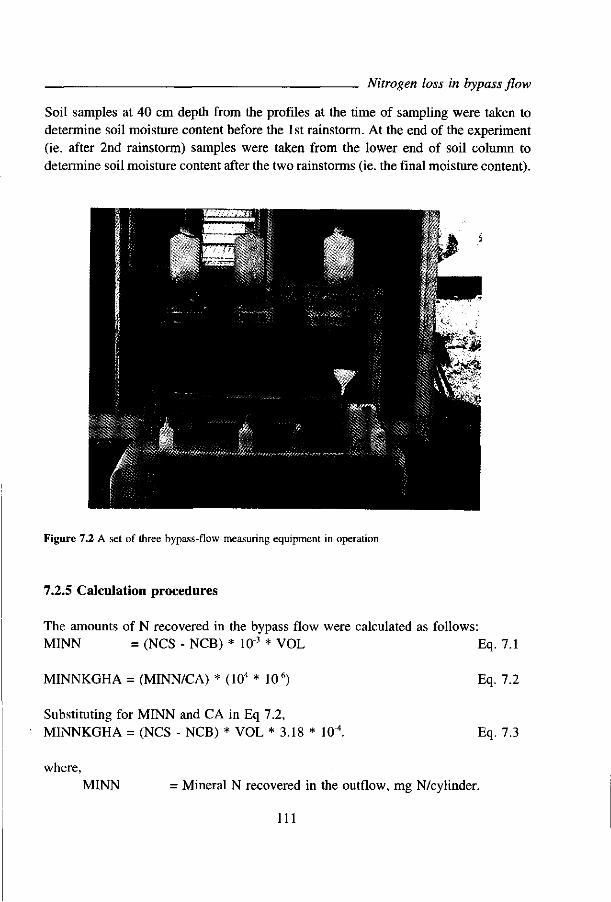
Nitrogen loss in bypass flow
Soil samples at 40 cm depth from the profiles at the time of sampling were taken to determine soil moisture content before the 1st rainstorm. At the end of the experiment (ie. after 2nd rainstorm) samples were taken from the lower end of soil column to determine soil moisture content after the two rainstorms (ie. the final moisture content).
Figure 7.2 A set of three bypass-flow measuring equipment in operation
7.2.5 Calculation procedures
The amounts of N recovered in the bypass flow were calculated as follows: MINN = (NCS - NCB) * 10'3 * VOL Eq. 7.1
MINNKGHA = (MINN/CA) * (104 * 10"6)
Substituting for MINN and CA in Eq 7.2, MINNKGHA = (NCS - NCB) * VOL * 3.18 * 10'4.
where,
Eq. 7.2
Eq. 7.3
MINN = Mineral N recovered in the outflow, mg N/cylinder.
I l l
Chapter 7 .
MINNKGHA = Mineral N recovered in the outflow, kg N/ha NCS = Nitrogen concentration in the treated sample, mg N/1. NCB = Nitrogen concentration in the blank, mg N/1. CA = Area of soil surface in the cylinder with internal diameter of
20 cm, M2. VOL = Volume of the outflow from the cylinder, ml.
In the calculation of total N (mineral + organic), the Eq. 7.3 was used where NCS and NCB referred to total N in sample and blank, respectively.
7.3 Results
7.3.1 Bypass flow and soil moisture content
Amount of bypass flow from the soil columns varied within and between 1st and 2nd rainstorms (hereafter referred to as Application 1 and Application 2, respectively), and more so between the rainstorm treatments (Table 7.1). Bypass flows after the 2nd rainstorm were consistently higher than those following the 1st rainstorm in all the cases. The outflows from the soil columns stopped within 1 h following rainstorms.
Cross-section of the soil columns were observed at 20 and 40 cm depth for the stained bypass flow paths. On the average about 5 to 10% of the surface was stained dark blue at both depths. There was not a marked difference in depths with respect to stained proportions of the surfaces. Gravimetric moisture content immediately before the 1st rainstorm ranged between 38 and 51 %, while after the 2nd rainstorm the range was from 47 to 57% (Table 7.1).
7.3.2 Nitrogen in the bypass flow
The quantity of mineral N recovered in the bypass flow increased with increasing N rate in the case of N03-N but remained extremely low and almost constant in the case of NH4-N (Table 7.2). There was no fertilizer NH4-N recovered in the bypass flow. Nitrate N rate had significant (p<0.01) effect on the mineral N recovered in the bypass flow. In terms of % of fertilizer N recovered in the bypass flow the N rate of application did not have significant effect. The total N (mineral + organic N) and, likewise, the nitrogen derived from soil (Ndfs) increased with increasing N03-N rate of application (Table 7.3). The NH4-N source had no effect on total N. The effect of N03-N rate on total N and Ndfs were highly significant (p<0.01), and the order of significance was 200>100>50>0 kg N/ha. The proportion of the total N that was
112
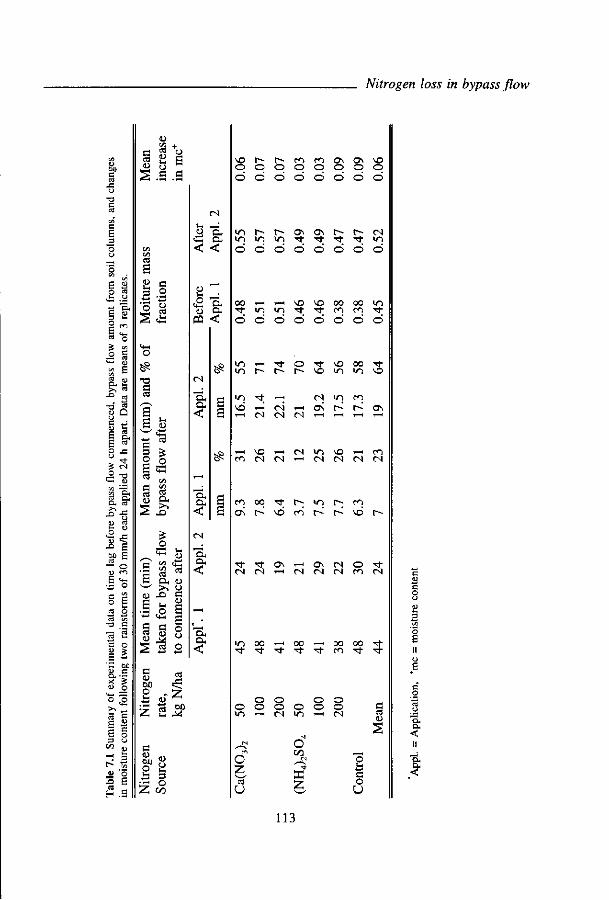
Nitrogen loss in bypass flow
E S o «
,6 O
O
c 55 <u
. o Kt
t= -o 4— D
d OH O- cT > > r-
"^ U
-° E SP E — o
§ 6 « o cd <si
T3 C
e §
CS
S g p <U O C
^ - 1 . ^H . ^ H
3 .a
o
T3
C
? S 2 o
o
8 * CD X>
•S ,°
O* <D
CD S
S3
CM
•— —;
3«
(0 D . PQ <
££
OH
<
g 2 o „ y-
Z 2 ^
c
2 8 I § Z GO
o o o o o o o o d o o d d o o d
d o o d d o o d
d d d d d d d d
« O T - H ' ^ - O ' ^ - V O O O ^ -
V I -Tt T—I N ui m
ro oq ^t r-- >n t-; <Ti
( N C N ' — ' O l i N t N C O l N
• r i o o ^ - i o o ^ - i o o o o - ^ -
O »n
(M
r<i
O Z r )
o o
o o (N
O
O Xfl
C-l
2
o o
o o (N
^ H
ü u c o U
u <D
2
ni O
O-
n •
o. D< <
113

Chapter 7
attributed to Ndfs as a result of NCyN addition ranged from 16 to 48%. In the case
of NH4-N all the total N in the bypass flow was derived from soil.
Table 7.2 Nitrogen recovered in bypass flow from soil columns as affected by fertilizer N source and rate following the 2nd rainstorm of 30 mm/h applied 24 h after the 1st rainstorm of equal intensity. Fertilizer was surface-broadcast applied immediately before the 2nd rainstorm.
Nitrogen
source
Ca(N03)2
(NH4)2S04
Nitrogen
rate,
kg N/ha
Control
50
100
200
Control
50
100
200
Mineral N,
kg N/ha
N03-N
0.22
5.66
11.39
26.52
0.22
0.26
0.24
0.31
NH4-N
0.15
0.15
0.16
0.15
0.15
0.16
0.12
0.21
Fertilizer N,
kg N/ha
NO3-N
0
5.5
11.2
26.3
0
0
0
0
NH4-N
0
0
0
0
0
0
0
0
% Fertilizer N
recovered in
bypass
NO3-N
0
11
11.2
13.1
0
0
0
0
flow
NH4-N
0
0
0
0
0
0
0
0
Table 7.3 Effects of fertilizer N source and rate of application on the amount of soil nitrogen recovered in the bypass flow.
Nitrogen Nitrogen
source rate,
kg N/ha
Total N in Ndff', Ndfs2, Ndfs as %
bypass flow, kg N/ha kg N/ha of total N in
kg N/ha bypass flow
Ca(N03)2
(NH4)2S04
Control
50
100
200
Control
50
100
200
0.71
7.21
21.71
38.77
0.71
0.51
0.81
1.15
0
5.5
11.2
26.3
0
0
0
0
0.71
1.71
10.51
12.47
0.71
0.51
0.81
1.15
100
16.2
48.4
32.2
Ndff = nitrogen derived from fertilizer. 2Ndfs = nitrogen derived from soil.
114
Nitrogen loss in bypass flow
7.4 Discussion
7.4.1 Bypass flow
Bypass flows after the 1st rainstorm (Application 1) were lower than the flows after the 2nd rainstorm (Application 2) in all samples (Table 7.2), and the time taken for the bypass flow to commence following the 1st rainstorm was twice as much as the time taken in the case of the 2nd rainstorm. Similar observations were made by Bouma et al., (1981) and Smaling and Bouma (1992). According to Hoogmoed and Bouma (1980) and Bouma et al., (1981) water flow into the cracks occurs after a critical ponding height is exceeded. Flow into the cracks follows small vertical bands which allow little lateral absorption of water into the adjacent unsaturated peds. In the study of Hoogoed and Bouma (1980) it was reported that the moisture content of the surface of the cracks increased during and after the 1st rainstorm. Consequently, the horizontal infiltration rate decreases and this, in turn, results in more rapid ponding and bypass flow during the 2nd rainstorm.
At saturation the study soil has moisture content of 62%. The average moisture content of the soil samples were 45 and 52% before the 1st rainstorm and after the 2nd rainstorm, respectively. Thus, in the absence of preferential flow paths, drainage in the soil would be expected after complete saturation in which case the average soil moisture content would be 62%. However, the outflow occurred before the equilibrium drainage conditions were met, implying the occurrence of bypass flow phenomenon. The increase in soil moisture content following the two rainstorms was small, being 6% on the average (Table 7.1). This is possibly due to small horizontal contact area between soil and moving water through the macropores (Bouma & Dekker, 1978).
7.4.2 Mineral nitrogen in the bypass flow
Only N03-N, and no NH4-N, was recovered in the bypass flow, an observation that has also been made by other researchers (eg. Mochoge & Beese, 1983; Mochoge, 1989). The ionic NH4
+ would get electrostatically attracted to the negatively charged soil colloids resulting in the low mobility of the NH4
+. The high mobility of N03-N in soil is possibly due to the fact that the dominantly negatively charged soil colloids and ionic N03' electrostatically repel each other. Both attraction and repulsion processes between the ionic N species and soil colloids are influenced by soil's cation exchange capacity (CEC); the higher the CEC the stronger the processes. The soil used in the present study is characterized by high CEC (Table 2.2) and, hence, its capacity to retain NH4
+ and repel N03" is also high. Ionic NH4+ may also be either fixed in the clay
115

Chapter 7
lattice and/or be adsorbed in the soil complexes (Thomas, 1980). The high amount of NO3-N loss in this experiment could have been influenced, to some extent, by the time space between fertilizer application and the 2nd rainstorm. Thomas and Phillips (1979) suggested that N03" may be protected from being carried in bypass flow if it is held within soil aggregates. In the present experiment fertilizer was surface-broadcast applied but not incorporated. This application method may have not provided much aggregate protection to the applied fertilizer. Barraclough et al. (1983) also observed that nitrate recently applied to the soil was lost via bypass flow much faster than it would if it was applied days before water application.
The amount of N03-N lost in leachate from field studies as well as pot studies have shown that the loss increases with increasing rate of N03-N application (Barraclough et al., 1983; Shepherd et al., 1993). It was also observed in the present study that N03-N in the bypass flow increased with increasing rate of application. Thus, reducing fertilizer N03-N would reduce N03-N losses in the bypass flow. Likewise, the use of fertilizer NH4-N would ensure minimal N losses. The % of fertilizer N recovered in the bypass flow was almost constant for all the application rates ranging between 11 and 13. Dekker and Bouma (1984), working with Dutch clay soil, reported %N03-N losses in the bypass flow to vary from 10 to 65%. The fertilizer losses observed in this study were obtained following a single rainstorm of 30 mm/h. More losses would be expected from the same applied fertilizer if more rainstorm events were to occur.
Considering the field situation of the area where the experiment was carried out it seems likely to expect high amounts of bypass flow during the period between end of February to mid March. This is the period marking the beginning of the rainy season, and when the rainfall is high (Table 2.1) while the soil has not enough time to swell and close the cracks. Thereafter, the cracks would have closed to some extent, and the topsoil disturbed considerably during such activities as weeding. Hence, late applied fertilizer will be exposed to less risk of loss in bypass flow.
7.4.3 Total nitrogen in the bypass flow
The amount of total N recovered in the bypass flow exceeded the amount of nitrogen derived from fertilizer, Ndff (Table 7.3) in the case of fertilizer N03-N, and not in the case of fertilizer NH4-N. The amount of Ndfs released increased with fertilizer N application rates, an observation that has also been made by some researchers (eg. Mochoge, 1989; Sen & Chalk, 1995). This would imply that fertilizer N03-N enhanced mineralization of organic N, an implication that would contradict the fact that soil microorganisms prefer NH4-N to N03-N (Alexander, 1977). Some process, other than
116
Nitrogen loss in bypass flow
organic N mineralization, are likely to have taken place. In the present study, considering the period between the addition of fertilizer and the end of bypass flow collection, which was 1 h, the phenomenon is unlikely to be due to microorganism release of soil N. Hence, the observed increase in the release of soil N following fertilizer N application could possibly be due to a chemical process causing the release of soil organic N. Laura (1975) had suggested that the addition of such ions as N03", NH4
+ and CI' to a soil can induce a water mediated protolytic deamination of peptides and amino acids - purely a chemical process - leading to the release of soil organic N. Besides, the nature of the soil organic N which occurs in unknown forms is still not understood (Kelly & Stevenson, 1995). Thus, some of the N in non-humic as well as humic substances could possibly be "broken" loose by N03". The release of soil N as a consequence of N03-N application is suggestive of potential for chemical degradation of soil following N03-N addition.
7.5 Conclusions
Nitrate-N was the main N-form in which fertilizer N was recovered in the bypass flow. The movement of N03-N through the soil was very rapid even with a single rainstorm following the N addition. Ammonium-N had no effect on N loss in the bypass flow. The total N lost from the soil was made up of both Ndff and Ndfs, and increased with increasing N03-N application rate. Bypass flow was an important avenue of not only fertilizer N03-N but also of soil-N losses.
117
Part IV
Field-based experiments
CHAPTER 8
EFFECTS OF DRAIN DEPTH ON TEMPORAL MOISTURE VARIATION AND MAIZE PERFORMANCE IN A VERTISOL IN KENYA
Abstract
Low structural stability, low basic water infiltration rate, and tillage difficulties are some of the salient constraints to utilization of Vertisols for crop production. Water management is vital in the management of Vertisols. The objectives of this study were to determine the effects of drain depth on temporal soil moisture variation, and rooting depth and yields of maize. The effects of 4 drain depths (0, 20, 40 & 60 cm) on maize yields were investigated in two years. The effects of the drain depths on soil moisture variation, and on maize rooting depth were investigated in 1994 and 1995 seasons, respectively. Drains, 40 and 60 cm deep, resulted in lower soil moisture content within the 0-40 cm layer, deeper rooting system, and higher dry matter and grain yields than did the 0 and 20 cm deep drains. It was concluded that provision of 40 to 60 cm deep drains was necessary in preventing waterlogging within the 0-40 cm soil layer, and in creating favourable root environment that was reflected in high maize yields.
8.1 Introduction
Vertisols in Kenya occur in many different parts of the country characterized by different agroclimatic conditions ranging from arid to humid, and are used for the production of different crops under different cropping systems. Vertisols are considered highly productive, but some of their properties such as low structural stability, low basic infiltration rate or low saturated hydraulic conductivity that lead to tillage difficulties make it difficult to exploit their productivity to the full (Blockhuis, 1981; Muchena & Kiome, 1993; Coulombe et al., 1996). The first prerequisite step in Vertisol management for crop production concerns the issue of good water control -both when there is too much or too little (Santanna, 1989). Drainage is essential for all Vertisols occurring in high rainfall areas, or in level or depressed positions which are susceptible to flooding (Dudal & Bramao, 1965). Climate, essentially rainfall except where irrigation is practised, is the overriding determinant in using Vertisols for agricultural production (Hubble, 1984). The total amount of rainfall and especially its distribution dictate the need for water removal, or water conservation, or water removal in the early part, and conservation in the latter part of the season (Pushparajah, 1992). The slow internal drainage and negligible lateral movement of water in Vertisols make subsurface drainage inefficient and practically unfeasible and, hence, excess water must be removed by surface drainage (Dudal & Bramao, 1965). Various land shaping (tillage) techniques, namely cambered beds, broad beds, and flat beds with furrows,
121

Chapter 8 .
have been used to remove excess water to avoid flooding and waterlogging of the Vertisols under crop or pasture production (Ahmed, 1988). Significant crop yield increases have been reported in Kenya, Tanzania, and other African countries with various land shaping techniques (Muchena & Ikitoo, 1992; Gama et al., 1992; Mordi et al., 1992), while other land shaping techniques such as cambered beds have been found unsuccessful (Muchena & Kiome, 1993). In testing various land shaping techniques the aim was to avoid flooding and waterlogging, with no focus on drain depth in relation to crop's rooting depth. Srivastava (1992) and Mordi et al. (1992) suggested that the rooting depth of crops with various drainage methods should be studied. Drain depth may also have deleterious effect on crop growth. In had been reported (Ikitoo, 1989) that excessive drain of surplus moisture in sugar cane farms in Muhoroni sugar belt of Nyanza Province, Kenya resulted in poor water storage in the subsoil, leading to increased water (drought) stress in the crop during the dry season.
Although there has been concern about waterlogging incidences as related to reduced crop yields in Vertisols in Kenya, no consideration has been given to define appropriate drain depth in relation to specific crops. The objectives of this study were to determine the effects of drain depth on temporal soil moisture variation as well as rooting depth and yields of maize in a Vertisol in Kenya.
8.2 Materials and methods
8.2.1. Treatments
Effect of 4 drain depths, namely 0, 20, 40, and 60 cm (from soil surface) on maize growth and yield was investigated in a randomized complete block design, RCBD, in 4 replicates carried out in two years (1994 and 1995) in the same field. Triple superphosphate and calcium nitrate at equivalent rates of 100 kg P 20, and 100 kg N/ha, respectively were banded and incorporated at the time of planting. Recommended commercial maize cultivar, H511, was planted in 6 rows 5 m long at inter- and intra-row spacings of 75 and 50 cm, respectively. Two plants per hill were maintained after thinning, giving a population of 53,000 plants/ha. Effects of the 4 drain depths on temporal soil moisture variation, and on maize rooting were investigated in 1994 and 1995 seasons, respectively.
8.2.2 Site and soils
The experiments were conducted at Muhoroni site located at 35° 15'E and O0 20'S, Kenya (Figure 1.1). Soil properties and long term climatic characteristics of the site are
122
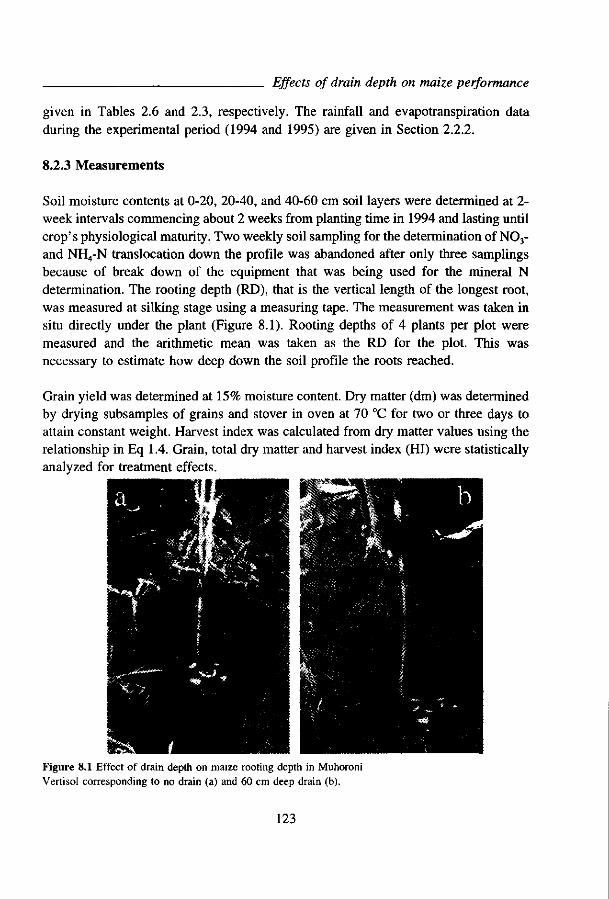
Effects of drain depth on maize performance
given in Tables 2.6 and 2.3, respectively. The rainfall and évapotranspiration data during the experimental period (1994 and 1995) are given in Section 2.2.2.
8.2.3 Measurements
Soil moisture contents at 0-20, 20-40, and 40-60 cm soil layers were determined at 2-week intervals commencing about 2 weeks from planting time in 1994 and lasting until crop's physiological maturity. Two weekly soil sampling for the determination of N03-and NH4-N translocation down the profile was abandoned after only three samplings because of break down of the equipment that was being used for the mineral N determination. The rooting depth (RD), that is the vertical length of the longest root, was measured at silking stage using a measuring tape. The measurement was taken in situ directly under the plant (Figure 8.1). Rooting depths of 4 plants per plot were measured and the arithmetic mean was taken as the RD for the plot. This was necessary to estimate how deep down the soil profile the roots reached.
Grain yield was determined at 15% moisture content. Dry matter (dm) was determined by drying subsamples of grains and stover in oven at 70 °C for two or three days to attain constant weight. Harvest index was calculated from dry matter values using the relationship in Eq 1.4. Grain, total dry matter and harvest index (HI) were statistically analyzed for treatment effects.
Figure 8.1 Effect of drain depth on maize rooting depth in Muhoroni Vertisol corresponding to no drain (a) and 60 cm deep drain (b).
123
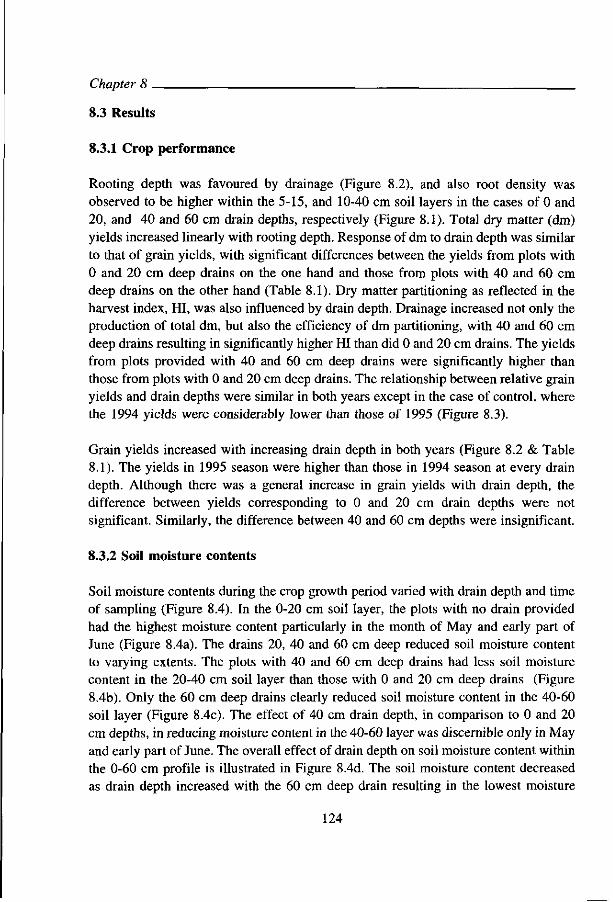
Chapter 8
8.3 Results
8.3.1 Crop performance
Rooting depth was favoured by drainage (Figure 8.2), and also root density was observed to be higher within the 5-15, and 10-40 cm soil layers in the cases of 0 and 20, and 40 and 60 cm drain depths, respectively (Figure 8.1). Total dry matter (dm) yields increased linearly with rooting depth. Response of dm to drain depth was similar to that of grain yields, with significant differences between the yields from plots with 0 and 20 cm deep drains on the one hand and those from plots with 40 and 60 cm deep drains on the other hand (Table 8.1). Dry matter partitioning as reflected in the harvest index, HI, was also influenced by drain depth. Drainage increased not only the production of total dm, but also the efficiency of dm partitioning, with 40 and 60 cm deep drains resulting in significantly higher HI than did 0 and 20 cm drains. The yields from plots provided with 40 and 60 cm deep drains were significantly higher than those from plots with 0 and 20 cm deep drains. The relationship between relative grain yields and drain depths were similar in both years except in the case of control, where the 1994 yields were considerably lower than those of 1995 (Figure 8.3).
Grain yields increased with increasing drain depth in both years (Figure 8.2 & Table 8.1). The yields in 1995 season were higher than those in 1994 season at every drain depth. Although there was a general increase in grain yields with drain depth, the difference between yields corresponding to 0 and 20 cm drain depths were not significant. Similarly, the difference between 40 and 60 cm depths were insignificant.
8.3.2 Soil moisture contents
Soil moisture contents during the crop growth period varied with drain depth and time of sampling (Figure 8.4). In the 0-20 cm soil layer, the plots with no drain provided had the highest moisture content particularly in the month of May and early part of June (Figure 8.4a). The drains 20, 40 and 60 cm deep reduced soil moisture content to varying extents. The plots with 40 and 60 cm deep drains had less soil moisture content in the 20-40 cm soil layer than those with 0 and 20 cm deep drains (Figure 8.4b). Only the 60 cm deep drains clearly reduced soil moisture content in the 40-60 soil layer (Figure 8.4c). The effect of 40 cm drain depth, in comparison to 0 and 20 cm depths, in reducing moisture content in the 40-60 layer was discernible only in May and early part of June. The overall effect of drain depth on soil moisture content within the 0-60 cm profile is illustrated in Figure 8.4d. The soil moisture content decreased as drain depth increased with the 60 cm deep drain resulting in the lowest moisture
124
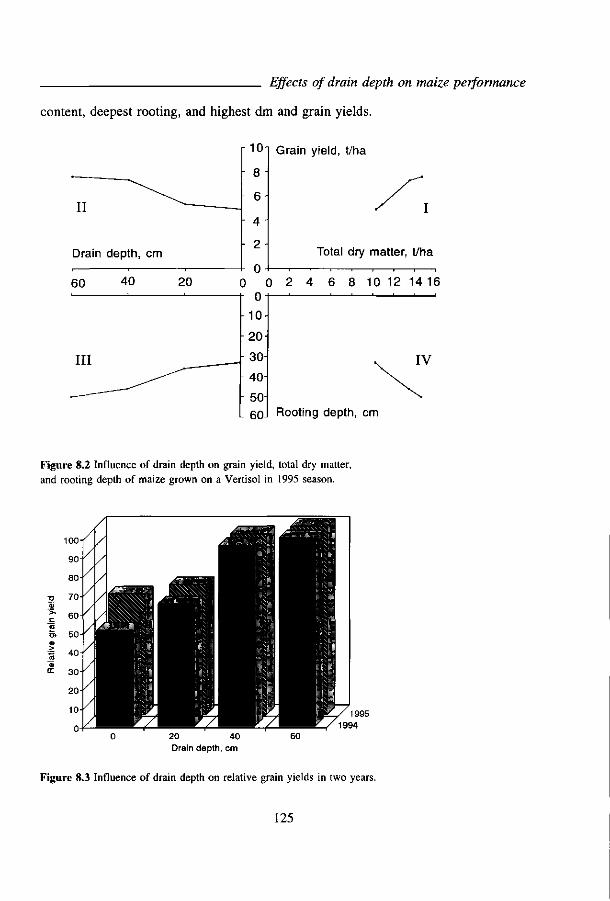
Effects of drain depth on maize performance
content, deepest rooting, and highest dm and grain yields.
Drain depth, cm
10
- 8
- 6
4
2
0
Grain yield,
Total
t/ha
dry matter,
I
t/ha
60 40 20 0 0 2 4 6 8 10 12 14 16 0
10
20
30-
40-
50 60J Rooting depth, cm
Figure 8.2 Influence of drain depth on grain yield, total dry matter, and rooting depth of maize grown on a Vertisol in 1995 season.
20 40 Drain depth, cm
Figure 8.3 Influence of drain depth on relative grain yields in two years.
125
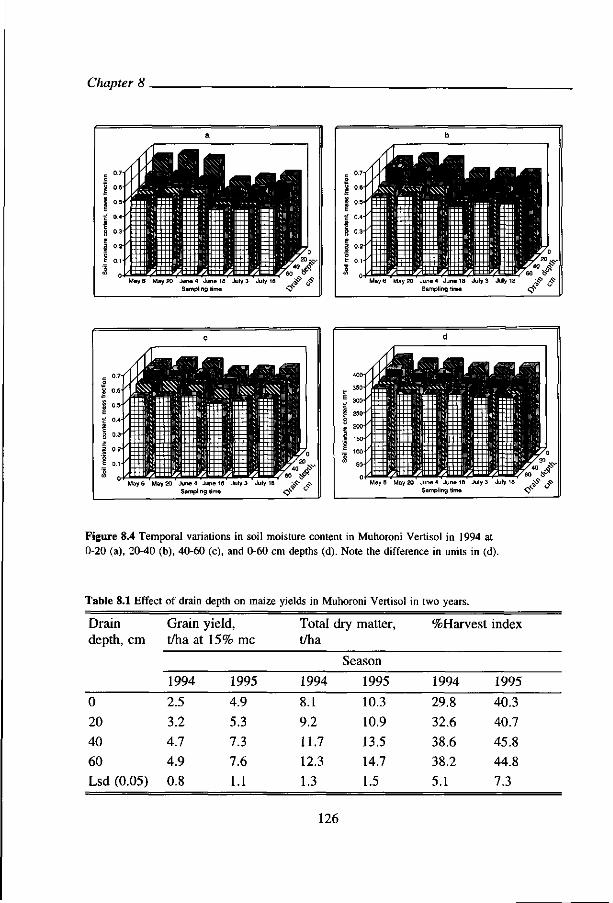
Chapter 8.
May 6 May 20 June 4 June 18 July 3 July 18 Sampling time ^
c °'7l o
1 0.6'
| 0.5-
I 0"'
8 °'3'
1 °'2' 0 E 0.1-5
b
- j f f l ^ 2 0 -1IË/40 ,
0
May 6 May 20 June 4 June 18 July 3 July 18 >$* Sampling time ^ ^
Mays May 20 June 4 June 18 July 3 July 18 Sampling time
May 6 May 20 June 4 June 16 July 3 July 18 Sampling lime
Figure 8.4 Temporal variations in soil moisture content in Muhoroni Vertisol in 1994 at 0-20 (a), 20-40 (b), 40-60 (c), and 0-60 cm depths (d). Note the difference in units in (d).
Table 8.1 Effect of drain depth on maize yields in Muhoroni Vertisol in two years.
Drain depth, cm
0
20
40
60
Lsd (0.05)
Grain yield, t/ha at 15% mc
1994
2.5
3.2
4.7
4.9
0.8
1995
4.9
5.3
7.3
7.6
1.1
Total t/ha
1994
8.1
9.2
11.7
12.3
1.3
dry matter,
Season
1995
10.3
10.9
13.5
14.7
1.5
%Harvest index
1994
29.8
32.6
38.6
38.2
5.1
1995
40.3
40.7
45.8
44.8
7.3
126
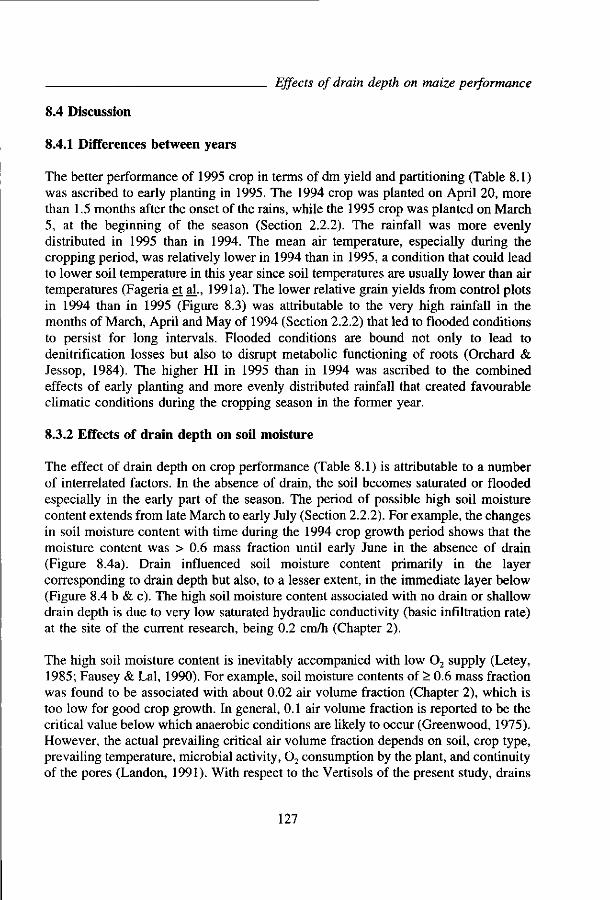
8.4 Discussion
8.4.1 Differences between years
Effects of drain depth on maize performance
The better performance of 1995 crop in terms of dm yield and partitioning (Table 8.1) was ascribed to early planting in 1995. The 1994 crop was planted on April 20, more than 1.5 months after the onset of the rains, while the 1995 crop was planted on March 5, at the beginning of the season (Section 2.2.2). The rainfall was more evenly distributed in 1995 than in 1994. The mean air temperature, especially during the cropping period, was relatively lower in 1994 than in 1995, a condition that could lead to lower soil temperature in this year since soil temperatures are usually lower than air temperatures (Fageria et al., 1991a). The lower relative grain yields from control plots in 1994 than in 1995 (Figure 8.3) was attributable to the very high rainfall in the months of March, April and May of 1994 (Section 2.2.2) that led to flooded conditions to persist for long intervals. Flooded conditions are bound not only to lead to denitrification losses but also to disrupt metabolic functioning of roots (Orchard & Jessop, 1984). The higher HI in 1995 than in 1994 was ascribed to the combined effects of early planting and more evenly distributed rainfall that created favourable climatic conditions during the cropping season in the former year.
8.3.2 Effects of drain depth on soil moisture
The effect of drain depth on crop performance (Table 8.1) is attributable to a number of interrelated factors. In the absence of drain, the soil becomes saturated or flooded especially in the early part of the season. The period of possible high soil moisture content extends from late March to early July (Section 2.2.2). For example, the changes in soil moisture content with time during the 1994 crop growth period shows that the moisture content was > 0.6 mass fraction until early June in the absence of drain (Figure 8.4a). Drain influenced soil moisture content primarily in the layer corresponding to drain depth but also, to a lesser extent, in the immediate layer below (Figure 8.4 b & c). The high soil moisture content associated with no drain or shallow drain depth is due to very low saturated hydraulic conductivity (basic infiltration rate) at the site of the current research, being 0.2 cm/h (Chapter 2).
The high soil moisture content is inevitably accompanied with low 0 2 supply (Letey, 1985; Fausey & Lai, 1990). For example, soil moisture contents of > 0.6 mass fraction was found to be associated with about 0.02 air volume fraction (Chapter 2), which is too low for good crop growth. In general, 0.1 air volume fraction is reported to be the critical value below which anaerobic conditions are likely to occur (Greenwood, 1975). However, the actual prevailing critical air volume fraction depends on soil, crop type, prevailing temperature, microbial activity, 0 2 consumption by the plant, and continuity of the pores (Landon, 1991). With respect to the Vertisols of the present study, drains
127

Chapter 8
effectively reduced soil moisture content but, even with the deepest drain of 60 cm depth, the moisture mass fraction was still about 0.5 during the high rainfall period in May and June. This moisture mass fraction is associated with less than 0.06 air volume fraction (Chapter 2), which is still lower than the general critical value of 0.1, and yet the crops from the plots provided with 40 and 60 cm deep drains performed well. In Vertisols, aeration of subsurface is facilitated by cracks (Ahmed 1985; Kamphorst & El Bhanasawy, 1988), since cracks in Vertisols often do not close completely even with high moisture content (Bouma & Loveday, 1988). It is to be pointed out that instances where soil moisture content values were > 0.62 mass fraction (Figure 8.4) actually corresponded to flooded situations in the field. The water stagnant on the soil surface had to be discarded at the time of taking samples for moisture content determination. Thus, the conditions conducive to denitrification prevailed in the field starting soon after the commencement of the rainy season and extending to early June, particularly if no drain or shallow drain is provided (Figure 8.4). The actual periods during which such flooded conditions could persist continuously depended on the frequency and intensity of rainfall, but were observed to persist for 1- to 6-day intervals during the months of March to May, 1994 and March to June, 1995. Orchard and Jessop (1984) reported that crop can recover well from short-term waterlogging periods of up to 10 days, and that the stress of waterlogging had the most drastic negative effect on annual crops during anthesis. Incidentally, anthesis of maize in the 1994 season occurred in the month of June when the rainfall had reduced (Section 2.2.2) and soil moisture content was relatively low even where no drain was provided especially in the 0-20 and 20-40 cm soil layers (Figure 8.4). Thus, the ability of the crop to recover from short-term waterlogging coupled with the reduced rains later in the season could be a factor ensuring crop yield, though low, in the undrained plots. For the 1995 crop, the anthesis occurred in May, during which period the rainfall was not too high nor too low. The effectiveness of 40 and 60 cm drain depths lies in the soil layer within which maize root concentration occurs. Since the majority of maize roots proliferate the 0-40 cm soil depth, and the highest concentration in the 15-40 cm layer, 40 and 60 cm deep drains created similar moisture/air conditions in this layer, resulting in similar effects in providing favourable growth conditions for roots which were much better than the conditions provided by 0 and 20 cm deep drains.
8.4.3 Effects of drain depth on rooting depth
It is clear that drain had positive influence on rooting depth of maize in the study soil (Figures 8.1 and 8.2). The lower rooting depth in the undrained than in the drained plots could not be attributted to the differences in soil BD since, given the shrink-swell characteristics of these Vertisols, the wetter undrained plots have lower BD than the drained plots. The method used in the study of roots in the present report may not be the best compared to core and rhizotron methods (Wiesler & Horst, 1994a), but it was considered the most appropriate in comparing the effect of drain depths on rooting
128

Effects of drain depth on maize performance
depths of plants that are growing under prevailing climatic conditions in the field. It has been reported (Brown & Scott, 1984; Wiesler & Horst, 1994a) that the concentration of maize root system is often found within the 0 - 40 cm depth, and that the highest concentration is within 15 - 40 cm layer (Wiesier & Horst, 1994a). Smaling and Bouma (1992) found that maize rooting depth in a Vertisol site in Kenya did not extend to below 40 cm soil depth where drainage was not provided. In the present study, it was observed that maize rooting depth extended, in some cases, to 50 cm soil depth, the determining factor being soil aeration. Soil aeration, in turn, is determined by soil moisture content, which is controlled by drain depth and rainfall pattern. Hence, the difference in the rooting depth in the present study and that reported by Smaling and Bouma (1992) lies in the depths of drains provided.
There exists a functional equilibrium between root and shoot systems of annual crops such that a significant change in root growth is transmitted to the shoot and affects the shoot growth, and vice versa (Brown & Scott, 1984). Thus, the significantly lower productivity of the crops in the plots with no and shallow drains are attributable to unfavourable root growth conditions created by high soil moisture contents. In the present experiment, therefore, climatic constituents particularly rainfall, soil hydrological properties especially low basic infiltration rate facilitating waterlogging conditions, and management component essentially water control by drainage interact, consequently affecting denitrification N losses and uptake of nutrients. Besides, the production and translocation of root-produced growth hormones such as the cytokinins may be disrupted (Orchard & Jessop, 1984). Figure 8.2 shows that the levelling off of the line relating drain depth and grain yield between 40 and 60 cm deep drains (quadrant II) was caused by a reduction in all the three underlying relationships: drain depth and rooting depth (quadrant III), rooting depth and dm production (quadrant IV), and dm production and grain yield. The reduction was strongest for the last one, indicating that grain filling was a little limited at 60 cm drains, perhaps because the big plants had transpired so much moisture that some moisture stress was created particularly later in the season when rainfall had tailored off.
8.4.4 Recommended inter-drain spacing
Drains should be spaced such that the loss of the land used for constructing drains does not render the extra crop yields due to drain provision uneconomic. The width of strip of land to be drained should be between 10 and 20 metres depending on the amount and distribution of rainfall (Ikitoo: pers. comm.). The wider the strip of drained land the less land is used for drain construction. In the present study, in every 6 metre-wide strip of land 1 metre was used to construct drain. This applied only to plots for which drains were provided. Thus, in a farming situation 0.83 and 0.17 ha would be used for actual crop production and drain construction, respectively. Hence, the actual grain yield at 40 cm drain depth would be 3.9 (ie. 0.83 * 4.7 t) and 6.3 t/ha (ie. 0.83 * 7.6
129
Chapter 8
t) in 1994 and 1995, respectively. These actual yields are still significantly higher than the yields from undrained hectare (Table 8.1), despite the loss of 17% of the land used for the construction of drains.
It is concluded that provision of drains 40 and 60 cm deep was necessary in reducing soil moisture content in the 0-60 cm profile, thereby preventing waterlogging and reducing denitrification risk in the soil, particularly in the 0-40 cm layer, within which maize roots proliferate. Consequently, root growth was promoted as well as total dm and grain yields were increased.
130
CHAPTER 9
INTERACTIVE EFFECTS OF DRAIN DEPTH, NITROGEN SOURCE AND TIME OF APPLICATION ON NITROGEN USE EFFICIENCY BY MAIZE
IN VERTISOLS IN KENYA.
Abstract
Fertilizer N use efficiency (NUE) by crops is influenced by interacting soil, climatic and management factors as well as fertilizer characteristics. The objectives of this field study were to determine interactive effects of drain depth (DD), time of N application (NT), and N source (NS) on nutrient uptake and NUE by maize grown on Vertisols. The treatments comprised of 3 DD (0, 40, 60 cm), 3 NT (0, 0/40, 40 DAP), and 2 NS (N03-N, NH4-N). A split plot design was used in which NT * NS formed split plots on drain depth as the main plots. The treatments were replicated 4 times, and the experiment was conducted at two sites. Drains, 40 and 60 cm deep, resulted in significantly higher grain and total dry matter yields as well as in higher HI. The grain yields were increased as a result of drain provision by 31 - 45, 31 - 43, and 16 - 21% for the control, N03-N and NH4-N treatments, respectively. Likewise, N recovery increased by 56 - 74, and 27 - 32% for N03-N and NH4-N, respectively. The drains also significantly improved N, P, K uptake and NUE, and reduced N losses. Applying all the N03-N dose at planting time resulted in significantly lower N recovery and maize yields than did any of the rest of treatments where drainage was not provided. The NH4-N was significantly better than N03-N in terms of yields, nutrient uptake and NUE where drain was not provided. It is concluded that draining off excess soil water from the root environment is the key factor in improving NUE in these soils. Ammonium-N is preferable to N03-N where NH3 volatilization is not a serious concern, especially if there is no drainage.
9.1 Introduction
Mineral nutrition is one of the most important soil factors affecting plant production in many soils (Clark, 1990). Nitrogen has been reported to be the most limiting nutrient element to crop production in Vertisols in Kenya (Ikitoo, 1989), and there is a widespread concern about low crop response to fertilizer N in these Vertisols. The low crop response to fertilizer N can be a consequence of N losses by leaching/bypass flow (Bouma & Loveday, 1988; Andrieni & Steenhuis, 1990; Barraclough et al., 1992), NH, volatilization (Fenn & Hossner, 1985; Koelliker & Kissel, 1988), and/or denitrification (Fillery, 1983; Schnabel & Stout, 1994). The N losses through bypass flow appear to be modest (Chapter 7), and NH3-volatilization is variable but easily manageable (Chapter 6). Denitrification appears to be the universal avenue of loss of fertilizer N in these soils during the rainy periods (Chapter 5), when soil moisture content conditions favouring the process are prevalent (Chapter 8). Denitrification is influenced by the substrate NO r among other factors (Weier et al., 1993a). Nitrification rate of NH4-N as influenced by soil type, moisture content and 02 supply
131
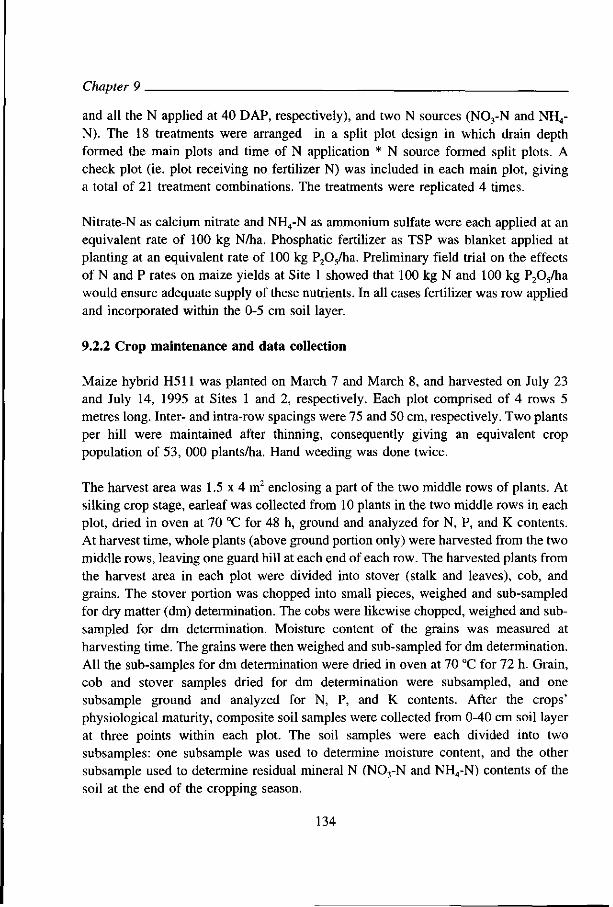
Chapter 9
and all the N applied at 40 DAP, respectively), and two N sources (N03-N and NH4-N). The 18 treatments were arranged in a split plot design in which drain depth formed the main plots and time of N application * N source formed split plots. A check plot (ie. plot receiving no fertilizer N) was included in each main plot, giving a total of 21 treatment combinations. The treatments were replicated 4 times.
Nitrate-N as calcium nitrate and NH4-N as ammonium sulfate were each applied at an equivalent rate of 100 kg N/ha. Phosphatic fertilizer as TSP was blanket applied at planting at an equivalent rate of 100 kg P20,/ha. Preliminary field trial on the effects of N and P rates on maize yields at Site 1 showed that 100 kg N and 100 kg P2Os/ha would ensure adequate supply of these nutrients. In all cases fertilizer was row applied and incorporated within the 0-5 cm soil layer.
9.2.2 Crop maintenance and data collection
Maize hybrid H511 was planted on March 7 and March 8, and harvested on July 23 and July 14, 1995 at Sites 1 and 2, respectively. Each plot comprised of 4 rows 5 metres long. Inter- and intra-row spacings were 75 and 50 cm, respectively. Two plants per hill were maintained after thinning, consequently giving an equivalent crop population of 53, 000 plants/ha. Hand weeding was done twice.
The harvest area was 1.5 x 4 m2 enclosing a part of the two middle rows of plants. At silking crop stage, earleaf was collected from 10 plants in the two middle rows in each plot, dried in oven at 70 °C for 48 h, ground and analyzed for N, P, and K contents. At harvest time, whole plants (above ground portion only) were harvested from the two middle rows, leaving one guard hill at each end of each row. The harvested plants from the harvest area in each plot were divided into stover (stalk and leaves), cob, and grains. The stover portion was chopped into small pieces, weighed and sub-sampled for dry matter (dm) determination. The cobs were likewise chopped, weighed and sub-sampled for dm determination. Moisture content of the grains was measured at harvesting time. The grains were then weighed and sub-sampled for dm determination. All the sub-samples for dm determination were dried in oven at 70 °C for 72 h. Grain, cob and stover samples dried for dm determination were subsampled, and one subsample ground and analyzed for N, P, and K contents. After the crops' physiological maturity, composite soil samples were collected from 0-40 cm soil layer at three points within each plot. The soil samples were each divided into two subsamples: one subsample was used to determine moisture content, and the other subsample used to determine residual mineral N (NO rN and NH4-N) contents of the soil at the end of the cropping season.
134
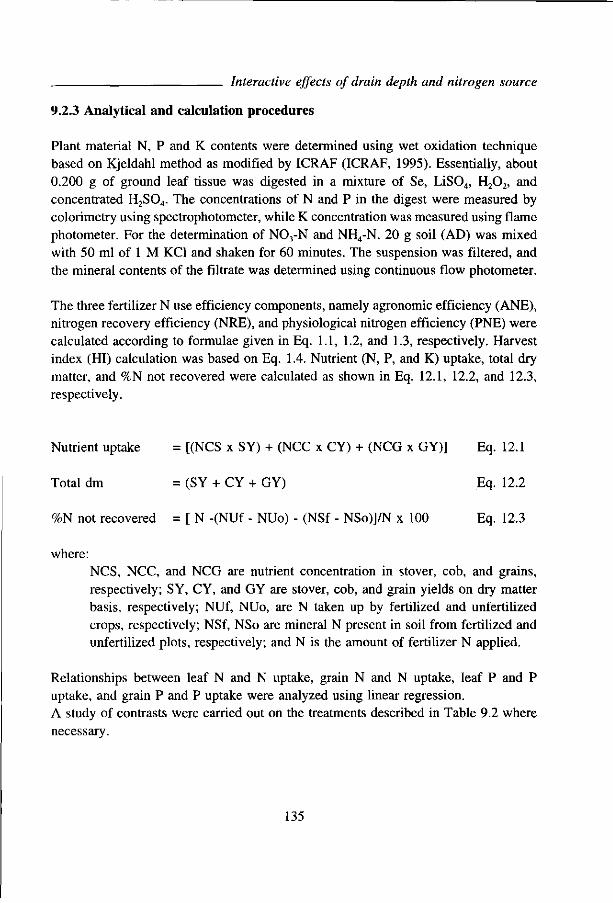
Interactive effects of drain depth and nitrogen source
9.2.3 Analytical and calculation procedures
Plant material N, P and K contents were determined using wet oxidation technique based on Kjeldahl method as modified by ICRAF (ICRAF, 1995). Essentially, about 0.200 g of ground leaf tissue was digested in a mixture of Se, LiS04, H202, and concentrated H2S04. The concentrations of N and P in the digest were measured by colorimetry using spectrophotometer, while K concentration was measured using flame photometer. For the determination of N03-N and NH4-N, 20 g soil (AD) was mixed with 50 ml of 1 M KCl and shaken for 60 minutes. The suspension was filtered, and the mineral contents of the filtrate was determined using continuous flow photometer.
The three fertilizer N use efficiency components, namely agronomic efficiency (ANE), nitrogen recovery efficiency (NRE), and physiological nitrogen efficiency (PNE) were calculated according to formulae given in Eq. 1.1, 1.2, and 1.3, respectively. Harvest index (HI) calculation was based on Eq. 1.4. Nutrient (N, P, and K) uptake, total dry matter, and %N not recovered were calculated as shown in Eq. 12.1, 12.2, and 12.3, respectively.
Nutrient uptake = [(NCS x SY) + (NCC x CY) + (NCG x GY)] Eq. 12.1
Total dm = (SY + CY + GY) Eq. 12.2
%N not recovered = [ N -(NUf - NUo) - (NSf - NSo)]/N x 100 Eq. 12.3
where: NCS, NCC, and NCG are nutrient concentration in stover, cob, and grains, respectively; SY, CY, and GY are stover, cob, and grain yields on dry matter basis, respectively; NUf, NUo, are N taken up by fertilized and unfertilized crops, respectively; NSf, NSo are mineral N present in soil from fertilized and unfertilized plots, respectively; and N is the amount of fertilizer N applied.
Relationships between leaf N and N uptake, grain N and N uptake, leaf P and P uptake, and grain P and P uptake were analyzed using linear regression. A study of contrasts were carried out on the treatments described in Table 9.2 where necessary.
135

Chapter 9 _
9.3 Results
9.3.1 Yields
The overall mean effects of drain depth across fertilized and unfertilized plots showed that grain yields in both sites increased with drain depth (Figure 9.1 quadrant II). Drain
Table 9.2 Treatment combinations as used in the orthogonal contrasts.
Treatment components
Drain depth, cm
0 (Dl)
40 (D2)
60 (D3)
N application time
ODAP*
0/40
40
0
0/40
40
0
0/40
40
N source
Treatment
(T)
control NO,-N NH4-N NO3-N NH4-N NO,-N NH4-N control NO3-N NH4-N NO3-N NH4-N NO,-N NH4-N control NO3-N NH4-N NO3-N NH4-N NO3-N NH4-N
Tl T2 T3 T4 T5 T6 T7 T8 T9 T10 Til T12 T13 T14 T15 T16 T17 T18 T19 T20 T21
*0, 0/40 and 40 DAP refer to cases where all the prescribed fertilizer dose is applied at 0, one-half at 0 and the other half at 40, and all the dose is applied at 40 days after planting, respectively.
136

Interactive effects of drain depth and nitrogen source
depth of 60 cm did not result in higher yield than the 40 cm deep drain. At both sites NO3-N source resulted in consistently lower relative yields than NH4-N source where drain was not provided (Figure 9.2). The effect of drain depth on grain yield was highly significant (Table 9.3). Nitrogen source, and drain depth * nitrogen source interaction also had significant effects on grain yields. The effects of treatments on grain yields at the two sites were quite similar, hence the ANOVA table for grain yields for site 2 is not shown. Orthogonal comparisons of treatments on grain yields revealed that Dl resulted in significantly lower yields than did the other drains (Table 9.4). But there was no significant difference between D2 and D3. The drain effect is also in the case of controls, whereby the control in Dl resulted in significantly lower yields than did the controls in D2 and D3. The N03-N source resulted in significantly lower yields than NH4-N in Dl but not in D2 and D3 (Contrast T2 vs T3 to T7 in Table 9.4). The time of N application did not show significant effect on the variables measured using F-test (Table 9.3). However, detailed orthogonal contrasts revealed that applying all of N03-N prescribed dose at planting (T2) resulted in significantly lower grain yields than the rest of treatments in Dl , and not in D2 and D3 (Table 9.4). Hence, the effect of time of N application is presented in orthogonal contrast tables only. Although grain yields at Site 2 were lower than those at Site 1 (Figure 9.1), the effects of the treatments were similar (Table 9.5). At both sites, total dm yields were significantly improved by drainage but not by N source. There was significant drain depth * nitrogen source interaction effect on HI, in which case NH4-N resulted in higher HI values in Dl , and not in D2 and D3.
9.3.2 Nutrient uptake and utilization
Nitrogen uptake by crop was improved by drainage at both sites (Figure 9.1 quadrant IV), and grain yield increased with increasing N uptake (quadrant I). Since the trends of N uptake were similar at both sites, orthogonal contrasts were performed on data from Site 1 only (Table 9.6). Nitrogen uptake was significantly depressed by Dl , while there was no difference between D2 and D3. The N uptakes in control plots were significantly lower than in plots that received N application. The control plots without drains had lower N uptake than the control plots with drains. Nitrogen source * drain depth interaction was significant, with N03-N resulting in lower N uptake than did NH4-N in Dl . The difference between the two sources was not significant in D2 and D3.
The uptake of P was significantly improved by drainage (Table 9.7). Likewise K uptake was significantly higher where drainage was provided. Nitrogen source had no significant effect on the uptake of either P or K at both sites. The uptake of P was
137
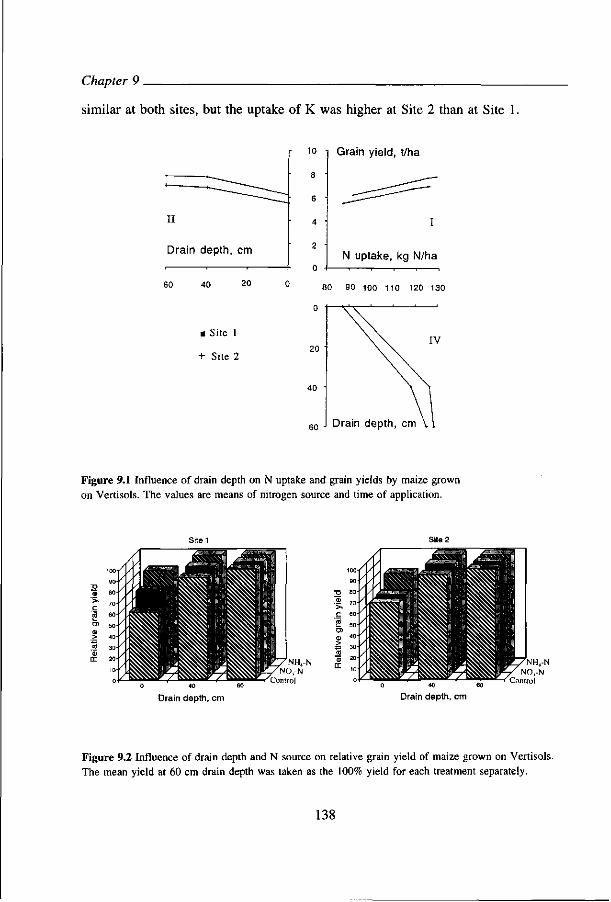
Chapter 9
similar at both sites, but the uptake of K was higher at Site 2 than at Site 1.
Drain depth, cm
60 40 20
• Site 1
+ Site 2
10 -I Grain yield, t/ha
N uptake, kg N/ha
80 90 100 110 120 130
Figure 9.1 Influence of drain depth on N uptake and grain yields by maize grown on Vertisols. The values are means of nitrogen source and time of application.
Drain depth, cm Drain depth, cm
Figure 9.2 Influence of drain depth and N source on relative grain yield of maize grown on Vertisols. The mean yield at 60 cm drain depth was taken as the 100% yield for each treatment separately.
138
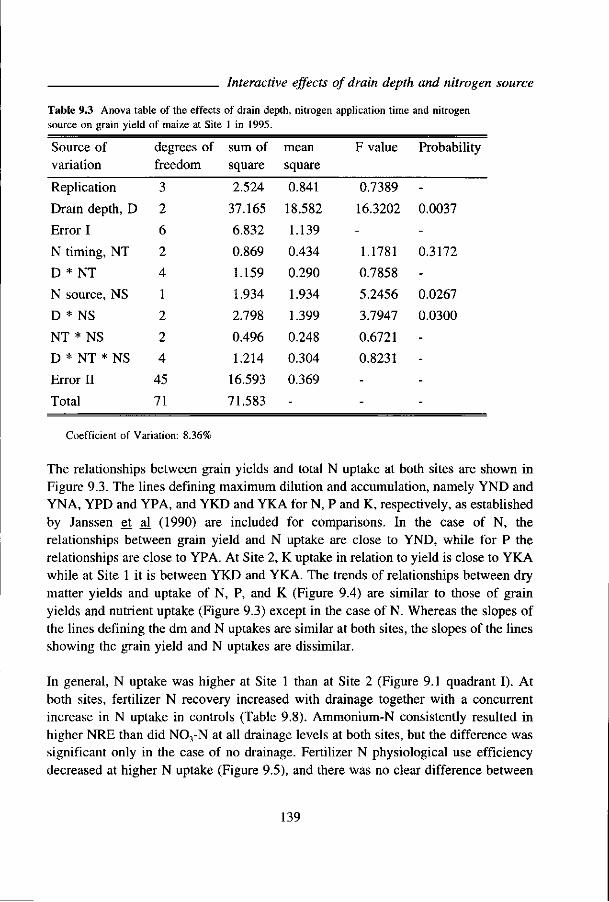
Interactive effects of drain depth and nitrogen source
Table 9.3 Anova table of the effects source on grain yield of maize at Site
of drain depth, nitrogen application time and nitrogen 1 in 1995.
Source of variation
degrees of freedom
sum of square
mean square
F value Probability
Replication
Drain depth, D
Error I
N timing, NT
D * NT
N source, NS
D * NS
NT * NS
D * NT * NS
Error II
Total
3
2
6
2
4
1
2
2
4
45
71
2.524
37.165
6.832
0.869
1.159
1.934
2.798
0.496
1.214
16.593
71.583
0.841
18.582
1.139
0.434
0.290
1.934
1.399
0.248
0.304
0.369
-
0.7389
16.3202
-
1.1781
0.7858
5.2456
3.7947
0.6721
0.8231
-
-
-
0.0037
-
0.3172
-
0.0267
0.0300
-
-
-
-
Coefficient of Variation: 8.36%
The relationships between grain yields and total N uptake at both sites are shown in Figure 9.3. The lines defining maximum dilution and accumulation, namely YND and YNA, YPD and YPA, and YKD and YKA for N, P and K, respectively, as established by Janssen et al (1990) are included for comparisons. In the case of N, the relationships between grain yield and N uptake are close to YND, while for P the relationships are close to YPA. At Site 2, K uptake in relation to yield is close to YKA while at Site 1 it is between YKD and YKA. The trends of relationships between dry matter yields and uptake of N, P, and K (Figure 9.4) are similar to those of grain yields and nutrient uptake (Figure 9.3) except in the case of N. Whereas the slopes of the lines defining the dm and N uptakes are similar at both sites, the slopes of the lines showing the grain yield and N uptakes are dissimilar.
In general, N uptake was higher at Site 1 than at Site 2 (Figure 9.1 quadrant I). At both sites, fertilizer N recovery increased with drainage together with a concurrent increase in N uptake in controls (Table 9.8). Ammonium-N consistently resulted in higher NRE than did NO,-N at all drainage levels at both sites, but the difference was significant only in the case of no drainage. Fertilizer N physiological use efficiency decreased at higher N uptake (Figure 9.5), and there was no clear difference between
139

Chapter 9
the N sources. Agronomic efficiency increased with drain depth only in the case of N03-N and not for NH4-N (Table 9.8). Both residual NCyN and NH4-N recovered in soil at harvest time were higher for NH4-N treated plots than for N03-N for all the drain levels in Site 1 (Table 9.9). Fertilizer N that could be accounted for was lower in Dl than in D2 and D3, and was consistently higher for NH4-N than for N03-N source. Hence, the proportion of fertilizer N not recovered decreased with drain depth, and was lower for NH4-N than for N03-N.
Table 9.4 Orthogonal contrasts of the interactive effects of drain depth, time of fertilizer nitrogen application and nitrogen source on maize grain yields in a Vertisol (Site 1).
Contrast*
Control vs rest
Control 1 vs 2 & 3
Control 2 vs 3
Dl vs D2 & D3
D2 vs D3
T2 vs T3 to T7
T3 vs T4 to T7
T4 vs T5 to T7
T5 vs T6 & T7
T6 vs T7
T9 vs T 10 to T14
T10 v s T l l toT14
T i l vsT12 t oT 14
T12 vsT13 &T14
T13 vsT14
T16 vs T17 to T21
T17 vs T18 to T21
T18 vs T19 to T21
T19 vs T20 & T21
T20 vs T21
Error
0.029
0.134
0.231
0.055
0.094
0.060
0.073
0.094
0.134
0.231
0.060
0.073
0.094
0.134
0.231
0.060
0.073
0.094
0.134
0.231
Effect
-0.395
-0.438
-0.213
-0.505
-0.060
-0.216
0.076
-0.065
0.171
-0.212
-0.007
-0.016
0.023
0.171
-0.137
0.009
0.051
0.052
0.004
0.062
F-value
183.671
10.738
0.844
85.797
0.410
13.067
1.087
0.468
1.637
0.844
0.012
0.049
0.059
1.637
0.354
0.024
0.491
0.304
0.001
0.073
Probability
0.000
0.002
-
0.000
-
0.001
0.301
-
0.206
-
-
-
-
0.206
-
-
-
-
-
-
Dl, D2 and D3 are drains 0, 40 and 60 cm deep, respectively that constituted the main plots; Controls 1, 2 and 3 are unfertilized plots (ie. T l , T8 and T15 in Dl, D2 and D3 main plots, respectively; T2 to T7, T9 to T14, and T16 to T21 are treatments within Dl , D2 and D3 mainplots, respectively, as explained in Table 9.2.
140

9.3.3 Leaf N content.
Interactive effects of drain depth and nitrogen source
At both sites leaf N content increased with drain depth (Figure 9.6). The relationships between grain yield and leaf N content were similar at both sites and followed trends of grain yields in relation to drain depth. Leaf N content at Site 1 was significantly affected by drain depth, while at Site 2 it was significantly affected by both drain depth and N source (Tables 9.10 & 9.11).
Table 9.5 The effects of drain depth and nitrogen source on grain and total dry matter yields and
harvest index of maize grown on Vertisols.
Drain depth, cm
0
40
60
0
40
60
Nitrogen source
Control
NO3-N
NH4-N
Control
NO3-N
NH4-N
Control
NOj-N
NH4-N
Control
NCyN
NH4-N
Control
NO3-N
NH4-N
Control
NO3-N
NH4-N
Grain yield t/ha at 15% mc
3.6a*
5.8c
6.7d
4.7b
7.6e
7.8e
5.1bc
7.9e
7.8e
3.3a
4.9b
5.8c
4.7b
6.6cd
7.0d
4.8b
7.0d
7.0d
Site 1
Site 2
Total dm t/ha
8.8a
12.3cd
13.3d
10.4b
14.3e
14.6e
10.9bc
14.8e
14.7e
7.8a
10.8b
11.7b
10.7b
13.9c
14.0c
10.7b
14.0c
14.2c
HI
35.2a
40.0b
42.6c
39.9b
45.9d
45.7d
40.6bc
45.7d
45.6d
36.8a
39. lab
42.3c
37.5a
40.8bc
42.8c
38.lab
42.8c
42.7c
In each column for each site means followed by different letters are significantly different at 5% level
141

Chapter 9.
Table 9.6 Orthogonal contrasts of the interactive effects of drain depth, time of fertilizer nitrogen application and nitrogen source on N uptake by maize grown on a Vertisol, Site 1.
Contrast
Control vs rest
Control 1 vs 2 & 3
Control 2 vs 3
Dl vs D2 & D3
D2 vs D3
T2 vs T3 to T7
T3 vs T4 to T7
T4 vs T5 to T7
T5 vs T6 & T7
T6 vs T7
T9 vs T 10 to T14
T10 v s T l l toT14
T i l vsT12 t oT 14
T12 vsT13 &T14
T13 vsT14
T16 vs T17 to T21
T17 vs T18 to T21
T18 vs T19 to T21
T19 vs T20 & T21
T20 vs T21
Error
0.515
2.359
4.086
0.963
1.668
1.055
1.292
1.668
2.359
4.086
1.055
1.292
1.668
2.359
4.086
1.055
1.292
1.668
2.359
4.086
Effect
-7,155
-5.818
-4.525
-12.113
-0.946
-2.620
0.459
-1.021
0.180
-4.737
-0.387
0.016
-3.180
-1.451
-5.010
0.160
1.821
-0.624
2.063
1.539
F-value
193.163
6.074
1.227
158.203
0.322
6.169
0.126
0.375
0.006
1.344
0.134
0.000
3.635
0.378
1.504
0.023
1.986
0.140
0.765
0.142
Probability
0.000
0.018
0.275
0.000
-
0.017
-
-
-
0.253
-
-
0.084
-
0.227
-
0.167
-
-
-
142
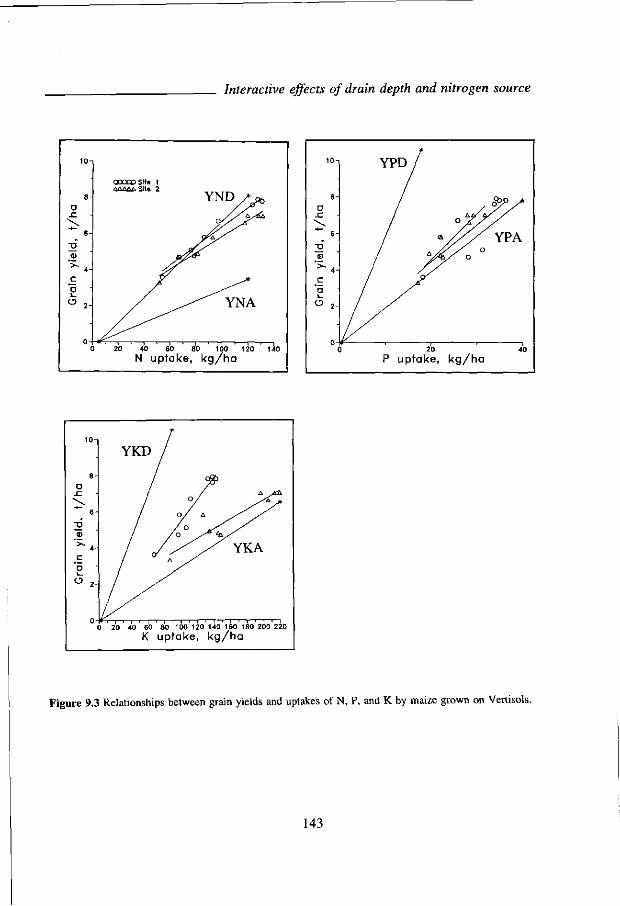
Interactive effects of drain depth and nitrogen source
u
m >-c 'a O
OQQÛDSlt« 1 A A A A A si te 2
YND
20 40 60 80 100 120 140
N uptake, kg/ha 20 40
P uptake, kg/ha
o u a u i u u i i v i - r u i v u I L
K uptake, kg/ha
Figure 9.3 Relationships between grain yields and uptakes of N, P, and K by maize grown on Vertisols.
143
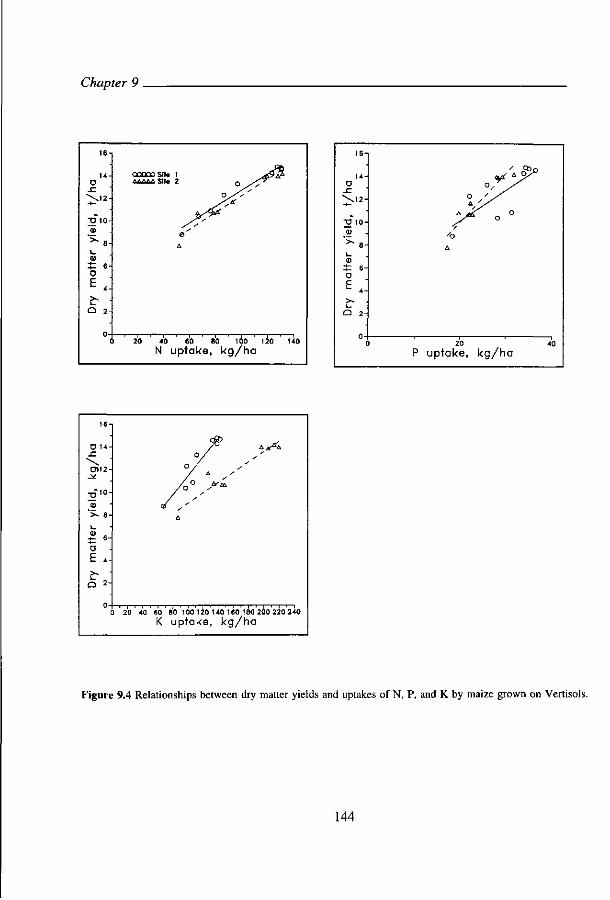
Chapter 9.
16-1
14-O
\ 1 2 -
"O 10-<B
' > - 8 -
t 6-D
E«:
Q 2-
0-{
00000 Sit« 1 J&£' AAAAASIIe 2 0 s^?
A
20 40 60 80 100 120
N uptake, kg/ha 140
1 6 -
14-o
\ 1 2 -
•O 10-a> >- 8-i _ 0}
5= 6 -o £ , > - J i _
Q 2 -
(
' ,?>£>
O ' /
A * £ O
^^ ° 'o
A
20
P uptake, kg/ha 40
1 6 -
D 14-
D112-
2 - i o -
">- 8-
"5 E 4-
a z-
0 / / A •
/ / A
Î 20 40 60 80 100 120 1-iO 160 lào'260 220 240
K uptake, kg/ha
Figure 9.4 Relationships between dry matter yields and uptakes of N, P, and K by maize grown on Vertisols.
144
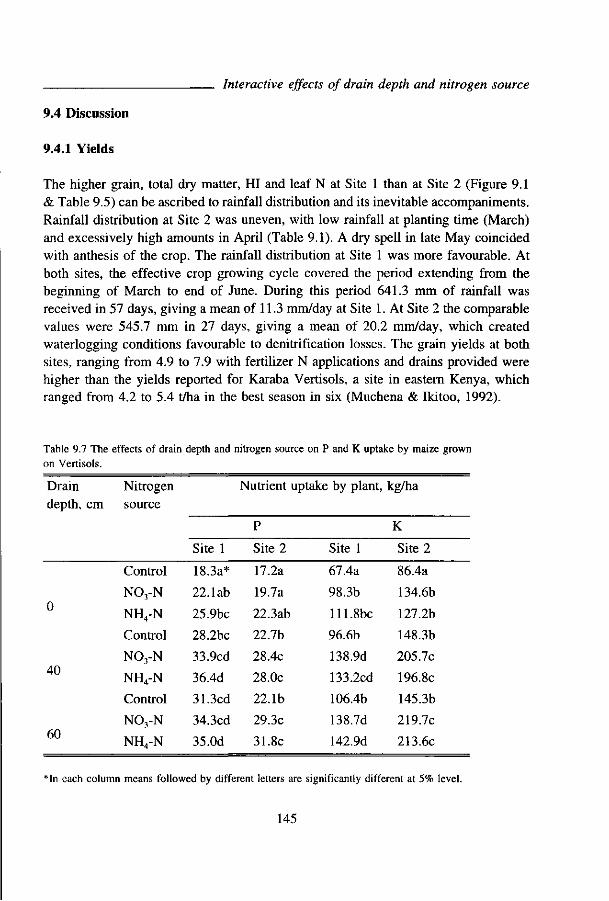
Interactive effects of drain depth and nitrogen source
9.4 Discussion
9.4.1 Yields
The higher grain, total dry matter, HI and leaf N at Site 1 than at Site 2 (Figure 9.1 & Table 9.5) can be ascribed to rainfall distribution and its inevitable accompaniments. Rainfall distribution at Site 2 was uneven, with low rainfall at planting time (March) and excessively high amounts in April (Table 9.1). A dry spell in late May coincided with anthesis of the crop. The rainfall distribution at Site 1 was more favourable. At both sites, the effective crop growing cycle covered the period extending from the beginning of March to end of June. During this period 641.3 mm of rainfall was received in 57 days, giving a mean of 11.3 mm/day at Site 1. At Site 2 the comparable values were 545.7 mm in 27 days, giving a mean of 20.2 mm/day, which created waterlogging conditions favourable to denitrification losses. The grain yields at both sites, ranging from 4.9 to 7.9 with fertilizer N applications and drains provided were higher than the yields reported for Karaba Vertisols, a site in eastern Kenya, which ranged from 4.2 to 5.4 t/ha in the best season in six (Muchena & Ikitoo, 1992).
Table 9.7 The effects of drain depth and nitrogen source on P and K uptake by maize grown on Vertisols.
Drain depth, cm
0
40
60
Nitrogen source
Control
N03-N
NH4-N
Control
NO3-N
NH4-N
Control
NO3-N
NH4-N
Site 1
18.3a*
22. lab
25.9bc
28.2bc
33.9cd
36.4d
31.3cd
34.3cd
35.0d
Nutrient
P
Site 2
17.2a
19.7a
22.3ab
22.7b
28.4c
28.0c
22.1b
29.3c
31.8c
uptake by plant,
Site 1
67.4a
98.3b
111.8bc
96.6b
138.9d
133.2cd
106.4b
138.7d
142.9d
kg/ha
K
Site 2
86.4a
134.6b
127.2b
148.3b
205.7c
196.8c
145.3b
219.7c
213.6c
*In each column means followed by different letters are significantly different at 5% level.
145

Chapter 9
Table 9.8 Mean nitrogen use efficiency values for maize crop grown on Vertisols as influenced by drain depth and nitrogen source.
Drain depth, cm
Nitrogen source
N uptake kgN/ha
Fertilizer Fertililzer Fertilizer NRE(%) PNE ANE
kg grain/kg N kg grain/kg N
Site 1
0
40
60
0
40
60
Control
NCyN
NH4-N
Control
NO3-N
NH4-N
Control
N03-N
NH4-N
Control
NO3-N
NH4-N
Control
NO3-N
NH4-N
Control
NO3-N
NH4-N
53.9a*
86.2c
96.7d
66.9b
123.1e
130.5e
75.9b
127.1e
130.4e
51.7a
81.2c
92.8d
65.9b
117.2e
119.4e
78.4bc
127.7ef
131.If
-
32.3a
42.8b
-
56.2c
63.6c
-
51.2c
54.5c
-
68.1b
72.4b
-
51.6a
48.7a
-
54.7a
49.5a
Site 2
-
29.5a
41.1b
-
51.3c
53.5c
-
49.3c
52.7c
-
54.2b
60.8b
-
37.0a
43.0a
-
44.6a
41.7a
-
22.0a
30.0b
-
29.0b
31.0b
-
28.0b
27.0b
-
16.0a
25.0c
-
19.0b
23.0c
-
22.0c
22.0c
*In each column for each site means followed by different letters are significantly different at 5% level.
146
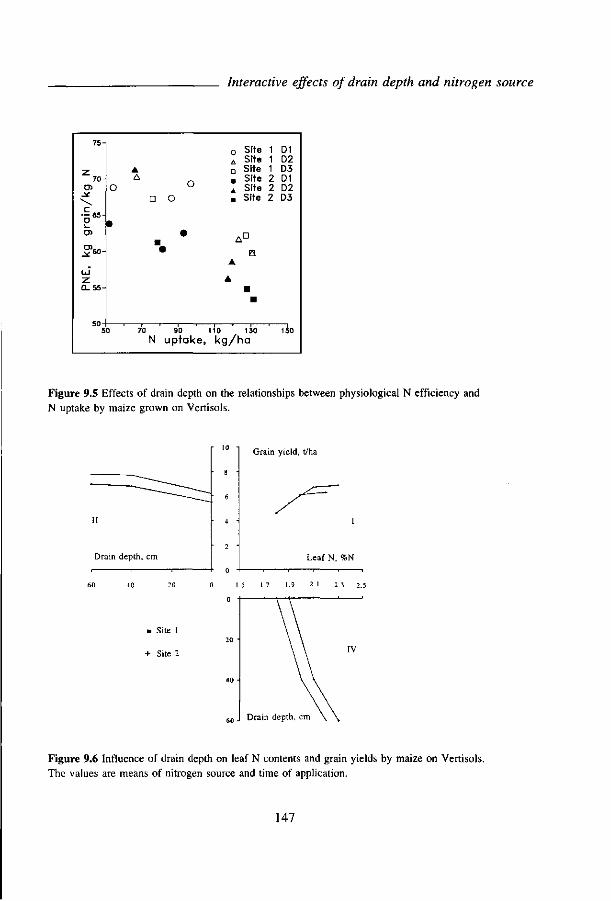
Interactive effects of drain depth and nitrogen source
75-1
Z 70-
O)
c — 6 5 -
a. u>
^ S O
LU z 0 - 5 5 -
O
•
50
• A
O D O
• • •
70 90
N u p t a k e
o Site 1 D1 A Site 1 D2 • Site 1 D3 , Site 2 D1 4 Site 2 D2 . Site 2 D3
A D
0 A
• • •
110 130 150
k g / h a
Figure 9.5 Effects of drain depth on the relationships between physiological N efficiency and N uptake by maize grown on Vertisols.
Drain depth, cm
60 40
• Site 1
+ Site 2
Grain yield, t/ha
Leaf N,
I
%N
Figure 9.6 Influence of drain depth on leaf N contents and grain yields by maize on Vertisols. The values are means of nitrogen source and time of application.
147
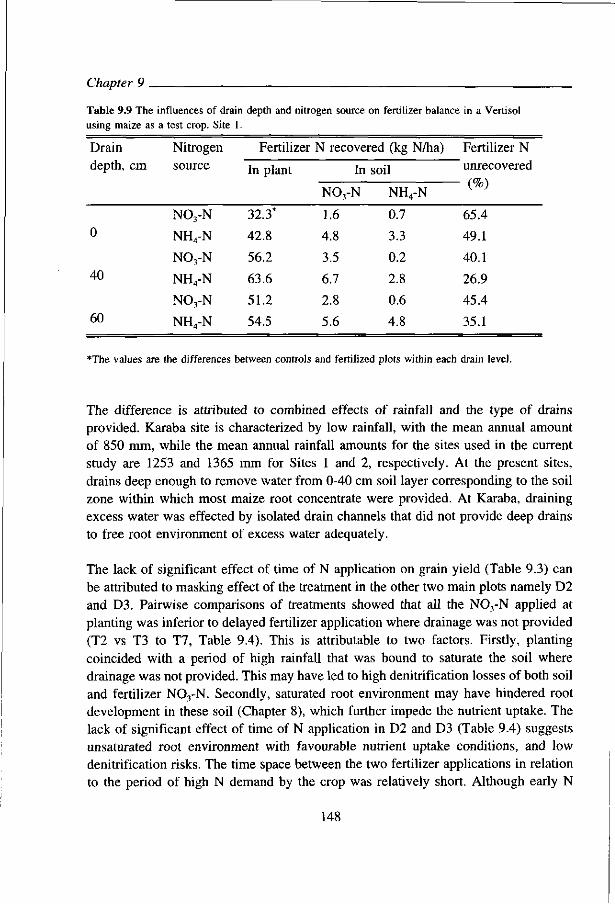
Table 9.9 The influences of drain using maize as
Drain depth, cm
0
40
60
a test crop. Site 1
Nitrogen source
N03-N
NH4-N
NO3-N
NH4-N
NO3-N
NH4-N
depth and nitrogen source on fertilizer balance in a Vertisol
Fertilizer N recovered (kg
In plant
32.3*
42.8
56.2
63.6
51.2
54.5
NO,
1.6
4.8
3.5
6.7
2.8
5.6
In soil
-N NH4
0.7
3.3
0.2
2.8
0.6
4.8
N/ha)
-N
Fertilizer N unrecovered
(%)
65.4
49.1
40.1
26.9
45.4
35.1
*The values are the differences between controls and fertilized plots within each drain level.
The difference is attributed to combined effects of rainfall and the type of drains provided. Karaba site is characterized by low rainfall, with the mean annual amount of 850 mm, while the mean annual rainfall amounts for the sites used in the current study are 1253 and 1365 mm for Sites 1 and 2, respectively. At the present sites, drains deep enough to remove water from 0-40 cm soil layer corresponding to the soil zone within which most maize root concentrate were provided. At Karaba, draining excess water was effected by isolated drain channels that did not provide deep drains to free root environment of excess water adequately.
The lack of significant effect of time of N application on grain yield (Table 9.3) can be attributed to masking effect of the treatment in the other two main plots namely D2 and D3. Pairwise comparisons of treatments showed that all the N03-N applied at planting was inferior to delayed fertilizer application where drainage was not provided (T2 vs T3 to T7, Table 9.4). This is attributable to two factors. Firstly, planting coincided with a period of high rainfall that was bound to saturate the soil where drainage was not provided. This may have led to high denitrification losses of both soil and fertilizer N03-N. Secondly, saturated root environment may have hindered root development in these soil (Chapter 8), which further impede the nutrient uptake. The lack of significant effect of time of N application in D2 and D3 (Table 9.4) suggests unsaturated root environment with favourable nutrient uptake conditions, and low denitrification risks. The time space between the two fertilizer applications in relation to the period of high N demand by the crop was relatively short. Although early N
148
Interactive effects of drain depth and nitrogen source
deprivation of maize plant results in serious reduction of grain yield (Girardin et al., 1987), N requirements of maize during early stages of development are not large. Considering yields from control plots (Table 9.5), it is possible that the soils could supply some N that may have been adequate for the crops during the first 40 days after planting when crop demand for N was not yet high.
The lack of significant difference in the effect of N source on grain yield in D2 and D3 (Table 9.5) implies that the soil factors which influence susceptibility of fertilizer N to such processes as denitrification, volatilization, and leaching/bypass flow did not have impact on the N sources applied under the prevailing experimental conditions of the two drain levels. Drains of 40 cm depth were provided which were found to reduce soil moisture content within the 0-40 cm soil layer (Chapter 8). The soil conditions of relatively low moisture content and high 0 2 supply so created were bound to lead to reduced denitrification losses of N03-N and enhanced NH4-N nitrification since the two processes depend largely on soil moisture content and 0 2 supply (Linn and Doran, 1984 b). The pH of the soils at Site 1 and Site 2 which were 6.07 and 6.02, respectively, were found to result in no NH3 volatilization from (NH4)2S04 (Chapter 6). Bypass flow resulted in no NH4-N loss, but in about 11% N03-N loss from 100 kg N/ha surface applied (Chapter 7). In the present experiment, fertilizer was incorporated, which could reduce N losses in bypass flow by providing aggregate protection for the N03-N from being carried in the outflow.
The significant effect of NS * drain depth on grain yields (Tables 9.3 & 9.4), in which NH4-N resulted in higher yields than did NCyN in Dl and not in D2 and D3 (Table 9.5) is likely due to denitrification losses in Dl . Taking the denitrification rate of 78 ug N/kg soil/h (= 0.169 kg N/ha/h), at 100% WHC for Site 1 (Chapter 5), 100 kg N03-N would be denitrified within 25 days if the conditions, as defined by available C and moisture content, remain status quo. High soil moisture contents > 0.6 moisture mass fraction conducive to denitrification persists in the fields for intervals of 1 to 6 days (Chapter 8). Thus, the loss of N03-N can be considerable, under high soil moisture content, within a very short time vis-a-vis the crop's growth period. Although the denitrification rate of 78 \xg N/kg soil/h was determined for Site 1, it gives an indication of how a lot of N03-N can be lost via denitrification within a short period of time. The NS * drain depth interaction is also reflected in the relative grain yields (Figure 9.2), with the relative yields for N03-N being lower than those for NH4-N where drains were not provided. Whereas drain depth improved total dry matter yields, with D2 and D3 resulting in significantly higher yields than did Dl, NS did not have significant effect on dm yields (Table 9.5). The HI values in the current study (Table 9.5) compare well with those reported by van Duivenbooden et al (1996), who gave
149

Chapter 9 .
Table 9.10 Anova table of the effects of drain depth, nitrogen application time and nitrogen source on maize earleaf N content.
Source of variation
degrees of sum of mean F-value Probability freedom squares square
Site 1 - Coefficient of variation = 13.6%
Replication
Drain depth, D
Error I
N timing, NT
D * NT
N source, NS
D * NS
NT * NS
D * NT * NS
Error II
Total
Replication
Drain depth, D
Error I
N timing, NT
D * NT
N source, NS
D * NS
N T * NS
D * NT * NS
Error II
Total
2
2
4
2
4
1
2
2
4
30
53
Site 2
2
2
4
2
4
1
2
2
4
30
53
0.014
0.992
0.253
0.401
0.394
0.162
0.040
0.017
0.164
2.756
5.194
0.007
0.496
0.063
0.201
0.099
0.162
0.020
0.008
0.041
0.092
-
- Coefficient of variation =
1.777
1.881
0.474
2.179
0.285
0.976
0.015
0.099
0.0279
2.003
7.697
0.888
0.906
0.118
0.089
0.071
0.976
0.007
0.049
0.020
0.067
-
0.1096
7.8337
-
2.1840
1.0723
1.7661
0.2189
0.0899
0.4463
-
-
12.0%
7.5049
7.6506
-
1.3381
1.0651
14.6159
0.1118
0.7378
0.2961
-
-
-
0.0414
-
0.1302
0.3875
0.1939
-
-
-
-
-
0.0443
0.0429
-
0.2776
0.3909
0.0006
-
-
-
-
-
150

Interactive effects of drain depth and nitrogen source
a range from 25 to 56 with a mean of 42%. The significant effect of drain depth * NS interaction on grain yields is reflected in HI, in which case NH4-N resulted in higher values than did N03-N in Dl and not in D2 and D3 (Table 9.5). This is attributed to denitrification losses in Dl that could result in lower N supply in the case of N03-N than NH4-N in Dl , leading to the reduction of both grains and stover yields, with the grain yield being the more reduced. This is likely to be the case since losses from N03-N were much higher than from NH4-N (Table 9.9). Although N translocation from stem and leaves to the grains compensates, in part, the low N supply to grains (Girardin et al., 1987), the N buffer effect apparently provided insufficient N for grain yields. This implies that N supplies in N03-N treated plots became low well before the crop reached anthesis stage. An indication for the early difference in N supply between the two sites is the lower leaf N at Site 2 than at Site 1 (see below). The increase in grain yields as a result of drain provision varied from 31 to 45, 31 to 43, and 16 to 21% for the control, N03-N, and NH4-N, respectively (Table 9.5), strongly indicating the importance of providing drains particulary in the case of N03-N.
Table 9.11 The effect of drain depth and nitrogen source on earleaf N content (%N) of maize grown on Vertisols.
Site
1
2
control
1.8a*
1.5a
0
N03-N
1.9a
1.8a
Drain depth,
40
NH4-N control N03-N
2.0a 1.8a 2.2b
2.0a 1.9a 2.0a
cm
NH4-N
2.4b
2.3bc
control
1.9a
2.0a
60
N03-N NH4-N
2.3b 2.4b
2.2a 2.5c
In each row means followed by different letters are significantly different at 5% level.
9.4.2 Nutrient uptake
Nitrogen uptake in the current study (Table 9.7) compares well with those reported by Simonis (1988) and Killorn and Zourarakis (1992) in respect of 100 to 125 kg N/ha of fertilizer applied to maize crop. The significantly higher N, P and K uptake in D2 and D3 than in Dl (Tables 9.6 & 9.7) suggests a more favourable root environment in the drained plots that lead to general crop vigour and higher demand by crop. The lack of difference in P and K uptake between the N sources even in Dl is in contrast to reports by Sigunga et al (1986), and Smith and Jackson (1987), in which NH4
+ ions were found to stimulate the uptake of negatively charged H2P04 , HP04
=, and reduce the absorption of positively charged K+, while the effect of N03-N was the opposite.
151
Chapter 9
The authors conducted the experiments in water culture, while the present study was conducted under field conditions. In their studies it is envisaged that the NH4-N applied was taken up mainly in the original form. In the present study some must have been taken up in the N03- form following nitrification of the applied NH4-N, and this could mask the effect of NS on the uptake of P and K.
The fertilizer NRE pattern was similar to the N uptake trend (Table 9.8). The NRE values obtained in the present study compare well with those obtained by Arora et al (1987) and Simonis (1988). Similarity in NRE for different agroecological conditions would be a matter of coincidence since regional differences in the recovery of fertilizer N in both crops and soils, as influenced by interacting climatic and soil factors, is common (Pilbeam, 1996). Drain provision resulted in NRE increase by 68 to 74 and 28 to 30% for N03-N and NH4-N (Table 9.8), respectively clearly illustrating the importance of drains in improving fertilizer N use efficiency in these soils.
The line defining the relationships between grain yields and N absorbed is close to the YND indicating that N is still the main limiting factor in these soils especially at lower N uptake (Figure 9.3). The low N uptake represent the uptakes in plots without drainage. Plots without drainage are prone to waterlogging and denitrification losses. Drainage improves N recovery in the crop, but even where drainage is provided there may be still considerable denitrification losses from the microsites given the fine-textured characteristic of Vertisols. In the case of P, the results showed that P was excessively available, which is consistent with the findings of the preliminary experiment conducted at Site 1 in which there was no response to P. At Site 2, K was available in high amounts, while at Site 1 it is just adequately supplied. The soil analysis results of the two sites showed that Site 2 has much higher K content than Site 1 (Chapter 2).
The trends of dry matter yields in relation to nutrient uptake (Figure 9.4) are similar to those of grain yields and nutrient uptakes (Figure 9.3) except for N. The dry matter and N uptake relationships are similar at both sites (Figure 9.4) but the grain and N uptake relationships at the sites are divergent at high N uptakes. This difference is attributed to the dry spell that occurred at Site 2 during the crop's anthesis. The PNE was higher at Site 1 than Site 2 indicating better crop growth conditions at the former than at the latter site. The favourable crop growth conditions at Site 1 are attributed to rainfall pattern.
152
Interactive effects of drain depth and nitrogen source
9.4.3 Apparent nitrogen losses
The high apparent losses of N03-N (Table 9.9) are attributable to denitrification and bypass flow. It is suggested that losses from NH4-N are due to denitrification of N03-produced by nitrification of NH4-N, particularly during the spells of low soil moisture content. Nitrification, nevertheless, proceeds even in saturated soil, though at a low rate (Rolston, 1986). The higher amount of N recovered in soil in the case of NH4-N than in the case of N03-N, can further be utilized by incorporating cropping sequence in the system to take up the residual N within the limitations imposed by soil moisture. However, the N values (Table 9.9) of unrecovered fertilizer N cannot be directly interpreted as N loss values. Firstly, since soil microorganisms prefer NH4-N to N03-N (Recous et al., 1988a; Recous et al., 1992), more of the NH4-N than N03-N would be immobilized under similar conditions, with the result that relatively less NH4-N is actually lost than what is indicated. Secondly, N fertilized plants are known to take up more soil N than do unfertilized plant (Broadbent, 1965; Hamid & Ahmad, 1995), and this results in overestimation of N recovery by the difference method (Rao et al., 1992). However, the results of unrecovered N (Table 9.9) are consistent with the findings in relation to the fertilizer N losses in these soils by denitrification (Chapter 5), NH3 volatilization (Chapter 6), and bypass flow (Chapter 7), and are considered reasonable estimates under the present experimental conditions.
9.4.4. Leaf N contents
The higher leaf N contents at Site 1 than at Site 2 (Figure 9.6) is ascribed to general crop vigour due to favourable crop growth conditions as defined by weather conditions at Site 1. Whereas only drain depth had significant effect on leaf N at Site 1 (Table 9.10), at Site 2 both drain depth and N source had significant effects (Table 9.10). The high rainfall at Site 2 was bound to create conditions favourable to denitrification, and hence lead to low N supply in the soil and consequent low N concentration of the leaves. Comparing the relationship between total N uptake and grain yields (Figure 9.1) with that between leaf N concentration and grain yield (Figure 9.6), it is evident that leaf %N is proportional to, and reflective of, total N uptake.
9.5 Conclusions
Provision of 40 to 60 cm deep drains was found essential for successful maize production in these Vertisols. In the case of fertilizer N03-N, the NRE values were about 30 and over 50% with no drainage and with drainage, respectively. Comparable values for fertilizer NH4-N were about 40 and 60% in undrained and drained plots,
153

Chapter 9
respectively. For the N03-N treatment, grain yields ranged from 5 to 6 t/ha, and 7 and 8 t/ha in undrained and drained plots, respectively. For the NH4-N treatment, the grain yields were between 6 and 7 t/ha, and 7 and 8 t/ha without and with drainage, respectively. The uptake of N, P, and K, as well as leaf N concentration were significantly improved by drainage. Ammonium-N source was found to be significantly superior to the N03-N source in terms of NRE and ANE in situations where drainage was not provided, but the two N sources were not significantly different where drainage was provided. Nitrate-N source is susceptible to enormous losses if drains of at least 40 cm depth are not provided. These results strongly underscore the importance of drainage for crop production in these Vertisols. There was no significant differences between the effects of the 40 and 60 cm deep drains on maize performance and, hence, 40 cm drain depth is recommended in preference to 60 cm depth on the grounds of cost/benefit consideration. Nitrogen use efficiency in these soils depend on NS , rainfall pattern, and water management of the root environment. Phosphorus and K are not limiting, while N is severely limiting maize production in these soils, especially where there is no drainage.
154
CHAPTER 10
INTERACTIVE EFFECTS OF FERTILIZER NITROGEN SOURCE AND RATE, AND MAIZE GENOTYPES ON FERTILIZER NITROGEN USE
EFFICIENCY
Abstract
The productivity of a crop is determined by its genetic characteristics and environment. Under rainfed agriculture maize production is primarily influenced by how well the crop's growth cycle fits within the growing season as defined by climate-provided resources. The objective of this study was to determine the interactive effects of fertilizer N source and rate, and maize genotypes differing in maturity periods on fertilizer N use efficiency in a Vertisol under rainfed conditions. There were 14 treatments comprising three N sources (NO-,, NH4, and NH4N03), two N rates (50 and 100 kg N/ha), and two maize hybrids (H511 and H614 representing medium- and late-maturing hybrids, respectively), together with 2 controls (one for each hybrid). The experiment was conducted in a drained Vertisol in 1995 in Kenya. In both hybrids, leaf N concentrations and grain yields increased with fertilizer N application rate. There was no significant differences between the N sources possibly because of the effect of drainage provided. The hybrid H614 had significantly higher leaf N concentration, grain yield, and agronomic nitrogen efficiency (ANE) than H511. It was concluded that the higher ANE of H614 than of H511 was due to the higher N uptake efficiency of the former than of the latter hybrid.
10.1 Introduction
Since crop is the integrator of all the factors affecting soil-plant productivity both in temporal and spatial dimensions, the capacity of the plant to utilize soil as well as climatic resources is crucial. Strategies developed separately for gainfully exploiting soil and climatic resources in crop production have their values, but a combination of these strategies bringing together different inputs offers much greater synergistic advantages not only in raising, but also in sustaining crop yields (Sivakumar et al., 1992). Genotypic, biotic, and abiotic environmental interactions on nutrient uptake and utilization are known to occur (Duncan & Baligar, 1990). The efficiency with which nutrients such as N are used is dependent largely on the capacity of the crop plant to take up and utilize the nutrient, and this will affect fertilizer N use efficiency as conceptualized in Figure 1.2.
Genetic variability and plant ability to absorb, translocate, distribute and use mineral elements are important in adapting plants to specific environments (Clark, 1990). Inter-and intra-specific variability in nutrient requirements and preference by plants have been recognized for a long time (Gerloff & Gabelman, 1983; Sivakumar et al., 1992; Rao et al., 1993). Maize, with its large number of cultivars of different maturity
155
Chapter 10
periods, can be grown over a wide environmental range (Fageria et al., 1991b). Inevitably, genotypic differences in nutrient requirements are bound to occur. It has been reported by many scientists (eg. Tsai et al., 1984; Mackay & Barber, 1986; Clark, 1990) that maize genotypes differ extensively in their uptake and utilization of N. The higher yielding genotypes are reported to require more nutrients than the lower yielding types, presumably because the former create larger sink for the nutrients and photosynthates than do the latter (Arnon, 1975). The development of high yielding maize cultivars has resulted in important gains in N translocation efficiency from the vegetative to reproductive organs during maturation, the improvement which can be linked with high harvest index, and more grain per unit of N taken up rather than with the increased N uptake per se (Duncan & Baligar, 1990). The differences amongst maize genotypes in relation to nutrient uptake and translocation have been attributed to genetically-controlled differences in root growth (Wiesler & Horst, 1994a). Such genotypic root differences affect not only uptake of water and nutrients, but also improve N utilization (Wiesler & Horst, 1994b).
Fertilizer N use efficiency by the crop is influenced by the nitrification rate in the soil, the form of N applied (N03" or NH4
+), the C supply to the soil and the nature of rhizodeposition (Mary et al., 1988). There are, however, conflicting reports on the effects of nitrogen source on maize yields. Some reports show significant while others show insignificant different responses of maize to different chemical N sources (Arora et al., 1987). Rao et al (1993) compared kinetic parameters of N uptake and translocation from N03- and NH4-N sources among legumes and cereals, and reported significant differences in uptake and translocation between and within the two groups of plants. The authors also reported that N0 3 was more readily translocated than NH4
+
in all the plants tested. Crops are seldom grown under optimal environmental (soil and climatic) conditions that can theoretically enable the crop plant to realize its yield potential. The level of crop productivity in a given soil under prevailing climatic constituents will be determined partly by how well the crop's growth cycle fits within the growing season as defined by climate-provided resources such as water and radiant energy and, partly, by conditions of the root environment.
It was observed (Chapter 6) that high soil moisture content hindered, while low soil moisture content promoted, root development. It was also observed (Chapter 7) that the amount of residual N in the 0-40 cm soil layer at the end of maize cropping season was higher in the plots that received NH4-N than in those plots that received NO r N at the beginning of the season. It is, therefore, suggested that late maturing maize cultivars could benefit more from NH4-N than from N03-N source. The objective of the present study was to determine the interactive effects of fertilizer N source and
156
Fertilizer nitrogen source and maize genotypes
rate, and maize genotypes differing in maturity periods and yield potentials on fertilizer N use efficiency in a Vertisol under rainfed conditions.
10.2 Materials and methods
10.2.1 Treatments and experimental design.
The experiment was conducted at Muhoroni Site in 1995. The site location as well as soil and climatic characteristics of the site have been described in Chapter 2.
There were three N sources (N03, NH4, and NH4N03), two N rates (50 and 100 kg N/ha), and two maize hybrids (H511 and H614 representing medium- and late-maturing hybrids, respectively). The N sources were chosen to provide different N-forms, while the two N rates together with the control (ie. no N application) represented low, medium and high N levels. The treatments were arranged factorially in a randomized complete block design (RCBD), and replicated 4 times. Each replicate was provided with 40 cm deep drains spaced 6 metres apart, and constructed 0.5 metres from the border of the plots. The 40 cm deep drain has been observed to be sufficient for maize growth and yield (Chapters 8 & 9).
10.2.2 Crop maintenance and data collection and analysis.
Each plot comprised of 4 rows 5 metres long. Inter- and intra-row spacings were 75 and 50 cm, respectively. Two plants per hill were maintained after thinning, consequently giving an equivalent crop population of 53,000 plants/ha. Phosphatic fertilizer as TSP was blanket applied at an equivalent rate of 100 kg P205/ha. Both N and P fertilizer materials were banded and incorporated at planting time. Weeding was done twice by hand.
The harvest area was 1.5 x 4 m2 enclosing a part of two middle rows of plants. Earleaf was collected from 10 plants in the two middle rows in each plot at silking crop stage, dried in oven at 70 °C for 48 h, ground and analyzed for N, P, and K contents. The leaf N, P, and K were determined using wet oxidation technique based on Kjeldahl method as modified by ICRAF (ICRAF, 1995). Essentially, about 0.200 g of ground leaf tissue was digested in a mixture of Se, LiS04, H202, and concentrated H2S04. The concentrations of N and P in the digest were measured by colorimetry using spectrophotometer, while K concentration was measured using flame photometer.
At harvest time, ear (cob with grains) numbers per plot were counted. The harvested
157
Chapter 10
plants (above ground only) from the harvest area in each plot were divided into stover (stalk and leaves), cob, and grains. The stover portion was chopped into small pieces, weighed and sub-sampled for dm determination. The cobs were likewise chopped, weighed and sub-sampled for dm determination. Moisture content of the grains was measured at harvest time. The grains were then weighed and sub-sampled for dm determination. All the sub-samples for dm determination were dried in oven at 70 °C for 72 h. Grain yields as affected by treatments were compared at 15% mc, and agronomic N efficiency (ANE) and harvest index (HI) were calculated using the relationships given in Eq 1.1 and Eq 1.4, respectively. Crop response to fertilizer application is defined here as the change in grain yield per unit of N applied, and is calculated for each consecutive N application levels. Agronomic N efficiency, in contrast, considers the increase in yield above the control per unit of N applied.
10.3 Results
10.3.1 Yields and ear numbers per plot
In general, grain yields increased with fertilizer N rate in both hybrids (Figure 10.1). Nitrogen rate had significant effects, while N source did not significantly affect grain yields (Table 10.1). Nitrogen rate * maize hybrid interaction was highly significant, while nitrogen source * maize hybrid interaction was not. The relative grain yield of H614 was slightly higher than that of H511 at fertilizer N application rate of 50 kg N/ha (Figure 10.2). The relative grain yields of H614 from control and 50 kg N/ha fertilizer N supplied plots were 54.5 and 81.1%, respectively. In this case, the yield response was 48 and 34 kg grain/kg N for 50 and 100 kg N/ha applied, respectively. In the case of H511, the relative grain yield values were 52.4 and 75.6% from control and plots supplied with 50 kg N/ha, respectively. The corresponding yield response values for H511 were 38 and 40 kg grain/kg N in respect of 50 and 100 kg N/ha applied, respectively. Fertilizer rate had significant effect on both hybrids (Table 10.2). The control plot for each hybrid was the same for all the N sources, hence the repetitive yield values for control in respect of different N sources in Table 10.2.
The relative ear numbers per plot were lower in control plots than in treated plots (Figure 10.3). In both hybrids, there were significantly less ears per plot from control than from treated plots, but the differences between treated plots were insignificant (Table 10.3).The hybrid H614 produced significantly (p = 0.01) more ears from control and 50 kg N/ha treated plots than did H511.
158

Fertilizer nitrogen source and maize genotypes
o-i Grain yield, t/ha
• H511
+ H614
0 0.5 1.0 1.5 2.0 2.5 3.0
0 •
50-
100- N rate, kg N/ha
IV
Figure 10.1 Influence of fertilizer N application rate on leaf N concentrations and grain yields of two maize hybrids grown on a Vertisol. The values are means of three N sources.
0 50 100 Nitrogen rate, kg N/ha
H511 H614
Figure 10.2 Influence of fertilizer N application rate on relative grain yields of two maize hybrids grown on a Vertisol. The values are means of three N sources.
159
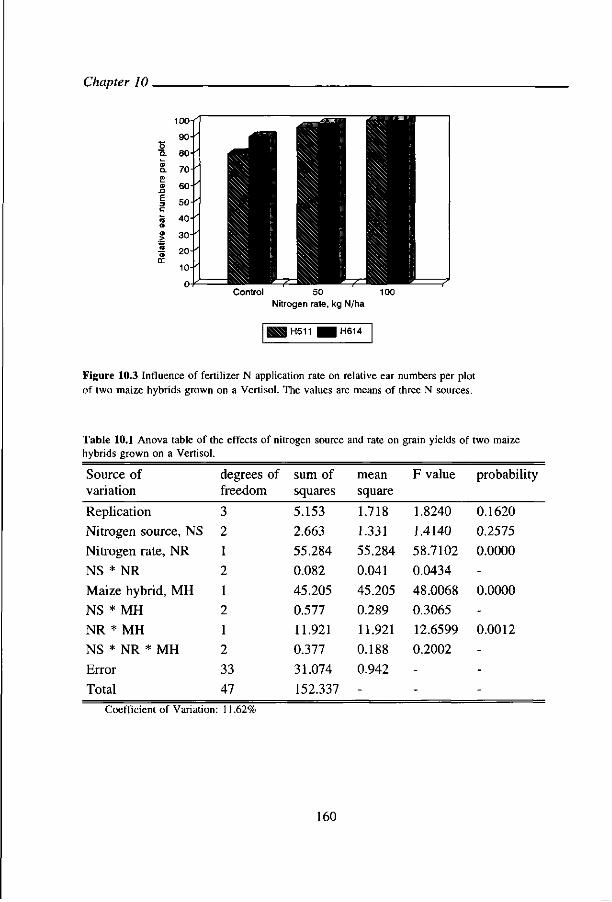
Chapter 10.
Control 50 100 Nitrogen rate, kg N/ha
H511 I H614
Figure 10.3 Influence of fertilizer N application rate on relative ear numbers per plot of two maize hybrids grown on a Vertisol. The values are means of three N sources.
Table 10.1 Anova table of the effects of nitrogen source and rate on grain yields of two maize hybrids grown on a Vertisol.
Source of variation
Replication
Nitrogen source, NS
Nitrogen rate, NR
NS * NR
Maize hybrid, MH
NS * MH
NR * MH
NS * NR * MH
Error
Total
degrees of freedom
3
2
1
2
1
2
1
2
33
47
sum of squares
5.153
2.663
55.284
0.082
45.205
0.577
11.921
0.377
31.074
152.337
mean square
1.718
1.331
55.284
0.041
45.205
0.289
11.921
0.188
0.942
-
F value
1.8240
1.4140
58.7102
0.0434
48.0068
0.3065
12.6599
0.2002
-
-
probability
0.1620
0.2575
0.0000
-
0.0000
-
0.0012
-
-
-
Coefficient of Variation: 11.62%
160
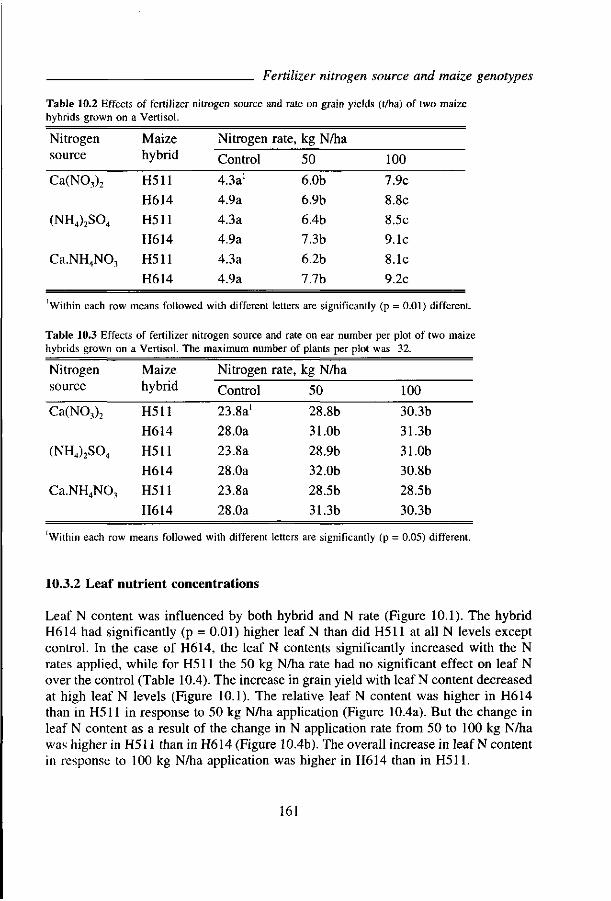
Fertilizer nitrogen source and maize genotypes
Table 10.2 Effects of fertilizer nitrogen source and rate on grain yields (t/ha) of two maize hybrids grown on a Vertisol.
Nitrogen source
Ca(N03)2
(NH4)2S04
Ca.NH4N03
Maize hybrid
H511
H614
H511
H614
H511
H614
Nitrogen rate
Control
4.3a1
4.9a
4.3a
4.9a
4.3a
4.9a
kg N/ha
50
6.0b
6.9b
6.4b
7.3b
6.2b
7.7b
100
7.9c
8.8c
8.5c
9.1c
8.1c
9.2c
'Within each row means followed with different letters are significantly (p = 0.01) different.
Table 10.3 Effects of fertilizer nitrogen source and rate on ear number per plot of two maize hybrids grown on a Vertisol. The maximum number of plants per plot was 32.
Nitrogen source
Ca(N03)2
(NH4)2S04
Ca.NH4NO,
Maize hybrid
H511
H614
H511
H614
H511
H614
Nitrogen rate,
Control
23.8a'
28.0a
23.8a
28.0a
23.8a
28.0a
kg N/ha
50
28.8b
31.0b
28.9b
32.0b
28.5b
31.3b
100
30.3b
31.3b
31.0b
30.8b
28.5b
30.3b
Within each row means followed with different letters are significantly (p = 0.05) different.
10.3.2 Leaf nutrient concentrations
Leaf N content was influenced by both hybrid and N rate (Figure 10.1). The hybrid H614 had significantly (p = 0.01) higher leaf N than did H511 at all N levels except control. In the case of H614, the leaf N contents significantly increased with the N rates applied, while for H511 the 50 kg N/ha rate had no significant effect on leaf N over the control (Table 10.4). The increase in grain yield with leaf N content decreased at high leaf N levels (Figure 10.1). The relative leaf N content was higher in H614 than in H511 in response to 50 kg N/ha application (Figure 10.4a). But the change in leaf N content as a result of the change in N application rate from 50 to 100 kg N/ha was higher in H511 than in H614 (Figure 10.4b). The overall increase in leaf N content in response to 100 kg N/ha application was higher in H614 than in H511.
161
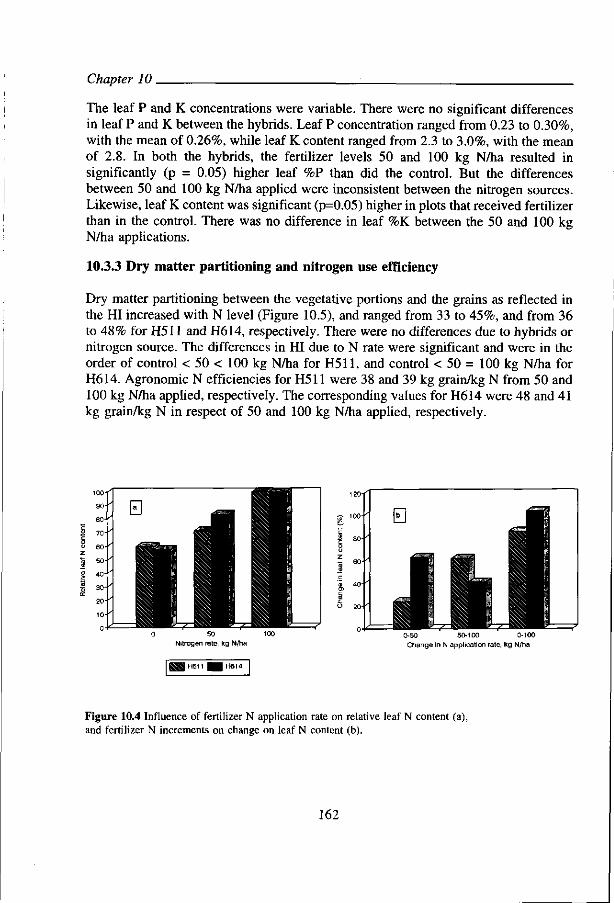
Chapter 10 ;
The leaf P and K concentrations were variable. There were no significant differences in leaf P and K between the hybrids. Leaf P concentration ranged from 0.23 to 0.30%, with the mean of 0.26%, while leaf K content ranged from 2.3 to 3.0%, with the mean of 2.8. In both the hybrids, the fertilizer levels 50 and 100 kg N/ha resulted in significantly (p = 0.05) higher leaf %P than did the control. But the differences between 50 and 100 kg N/ha applied were inconsistent between the nitrogen sources. Likewise, leaf K content was significant (p=0.05) higher in plots that received fertilizer than in the control. There was no difference in leaf %K between the 50 and 100 kg N/ha applications.
10.3.3 Dry matter partitioning and nitrogen use efficiency
Dry matter partitioning between the vegetative portions and the grains as reflected in the HI increased with N level (Figure 10.5), and ranged from 33 to 45%, and from 36 to 48% for H511 and H614, respectively. There were no differences due to hybrids or nitrogen source. The differences in HI due to N rate were significant and were in the order of control < 50 < 100 kg N/ha for H511, and control < 50 = 100 kg N/ha for H614. Agronomic N efficiencies for H511 were 38 and 39 kg grain/kg N from 50 and 100 kg N/ha applied, respectively. The corresponding values for H614 were 48 and 41 kg grain/kg N in respect of 50 and 100 kg N/ha applied, respectively.
50 100 Nitrogen rate, kg N/ha
0-50 50-100 0-100 Change in N application rate, kg N/ha
Figure 10.4 Influence of fertilizer N application rate on relative leaf N content (a), and fertilizer N increments on change on leaf N content (b).
162

Fertilizer nitrogen source and maize genotypes
H511 H614
Control 50 Nitrogen rate, kg N/ha
100
Figure 10.5 Influence of fertilizer N application rate on harvest index of two maize hybrids grown on a Vertisol. The values are means of three N sources.
100 150 kg N or P20,/ha
200 250
Figure 10.6 Influence of N and P fertilization on grain yield of maize (H511) grown on Muhoroni Vetisol in 1994.
10.4 Discussion
10.4.1 Yields
The lack of significant difference in the effect of N source on grain yield (Table 10.1) implies that the soil factors which influence susceptibility of fertilizer N to such processes as denitrification, volatilization, and leaching/bypass flow did not have different impact on the N sources applied under the prevailing experimental conditions. Usually, the relative effectiveness of N sources is determined by interactions between
163
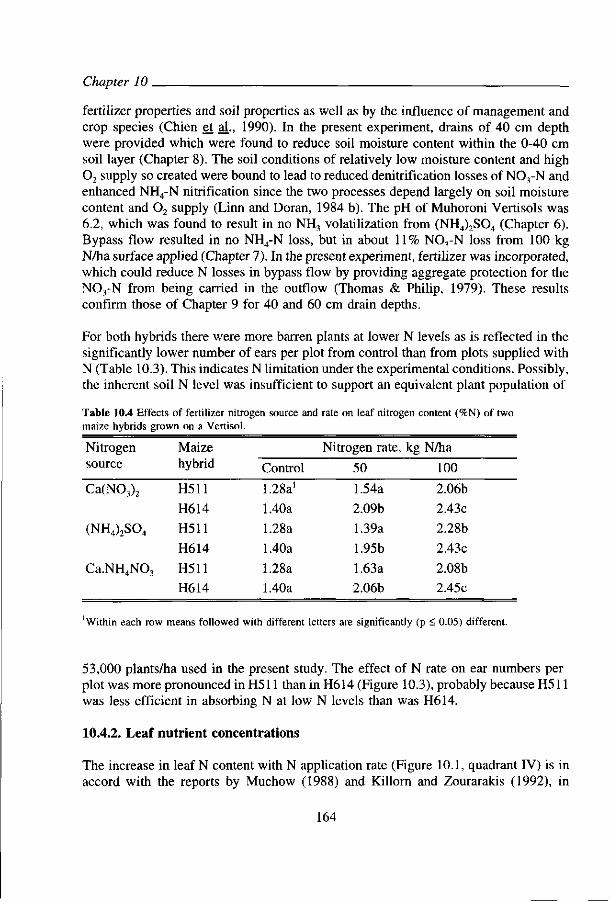
Chapter 10
fertilizer properties and soil properties as well as by the influence of management and crop species (Chien et al., 1990). In the present experiment, drains of 40 cm depth were provided which were found to reduce soil moisture content within the 0-40 cm soil layer (Chapter 8). The soil conditions of relatively low moisture content and high 0 2 supply so created were bound to lead to reduced denitrification losses of N03-N and enhanced NH4-N nitrification since the two processes depend largely on soil moisture content and 0 2 supply (Linn and Doran, 1984 b). The pH of Muhoroni Vertisols was 6.2, which was found to result in no NH3 volatilization from (NH4)2S04 (Chapter 6). Bypass flow resulted in no NH4-N loss, but in about 11% N03-N loss from 100 kg N/ha surface applied (Chapter 7). In the present experiment, fertilizer was incorporated, which could reduce N losses in bypass flow by providing aggregate protection for the N03-N from being carried in the outflow (Thomas & Philip, 1979). These results confirm those of Chapter 9 for 40 and 60 cm drain depths.
For both hybrids there were more barren plants at lower N levels as is reflected in the significantly lower number of ears per plot from control than from plots supplied with N (Table 10.3). This indicates N limitation under the experimental conditions. Possibly, the inherent soil N level was insufficient to support an equivalent plant population of
Table 10.4 Effects of fertilizer nitrogen source and rate on leaf nitrogen content (%N) of two maize hybrids grown on a Vertisol.
Nitrogen source
Ca(N03)2
(NH4)2S04
Ca.NH4N03
Maize hybrid
H511
H614
H511
H614
H511
H614
Control
1.28a'
1.40a
1.28a
1.40a
1.28a
1.40a
Nitrogen rate,
50
1.54a
2.09b
1.39a
1.95b
1.63a
2.06b
kg N/ha
100
2.06b
2.43c
2.28b
2.43c
2.08b
2.45c
Within each row means followed with different letters are significantly (p < 0.05) different.
53,000 plants/ha used in the present study. The effect of N rate on ear numbers per plot was more pronounced in H511 than in H614 (Figure 10.3), probably because H511 was less efficient in absorbing N at low N levels than was H614.
10.4.2. Leaf nutrient concentrations
The increase in leaf N content with N application rate (Figure 10.1, quadrant IV) is in accord with the reports by Muchow (1988) and Killorn and Zourarakis (1992), in
164

Fertilizer nitrogen source and maize genotypes
which maize leaf N content was found to be strongly influenced by N supply. In the case of H614, there were significant differences in leaf N content among all the N levels tested while for H511 there was no difference between control and 50 kg N/ha treatment (Table 10.4), a situation that is reflected in the low and high increase in leaf N concentration of H511 following the N increments from 0 to 50 and 50 to 100 kg N/ha, respectively (Figure 10.4). The implication here is that H511 is poor in taking up N under low N levels but improves under high N status (Figure 10.1, quadrant IV). Although the differences in root growth and characteristics of the hybrids used in the present experiment were not studied, there is a possibility that the two hybrids could differ in their rooting systems given the difference in their maturity periods. Wiesler and Horst (1994a & b) studied the relationships between root growth characteristics and N03-N uptake of several maize hybrids, and reported significant genotypic differences in N03-N uptake that were correlated with the differences in root growth and root length densities. It is suggested that H511 could have lower root length density which could result in lower leaf N concentration particularly at low fertilizer rate of 50 kg N/ha compared to the case with H614. The leaf N concentration of H511 significantly increased at the high fertilizer rate of 100 kg N/ha (Table 10.4) possibly due to two reasons. One, high N application rate was bound to lead to high concentration of N in the rhizosphere facilitating root-N contact and, hence, N absorption. Two, the roots that receive high N supply develop more vigorously and extensively, and thereby ramify more soil volume leading to more absorption of both nutrients and water as compared to roots with low N supply.
The maximum values of leaf N contents corresponding to 100 kg N/ha applied (Table 10.4), were quite similar to those reported by Killorn and Zourarakis (1992) for maize grown in fine-textured soils. However, the maximum leaf N observed in the present study are lower than the critical range of 2.20 to 2.75% N in ear leaf reported by Fox and Piekielek (1983). It appears (Figure 10.1) that higher N rate applied than 100 kg N/ha would result in higher leaf N and correspondingly higher grain yields. However, preliminary trials on the effects of N and P on grain yields of maize (H511 ) at the Site in 1994 indicated that there is not much benefit in grain yield of applying more than 100 kg N/ha (Figure 10.6).
The significantly (p = 0.05) lower leaf P and K from control plots than from plots supplied with 50 and 100 kg N/ha was attributed to the overall crop vigour that resulted from fertilizer N application. Crops that receive fertilizer N develop more extensive root system than those which receive no N (Wiesler & Horst, 1994b), and are likely to take up more nutrients from the soil since the roots ramify more soil volume than do the roots from unfertilized crops.
165
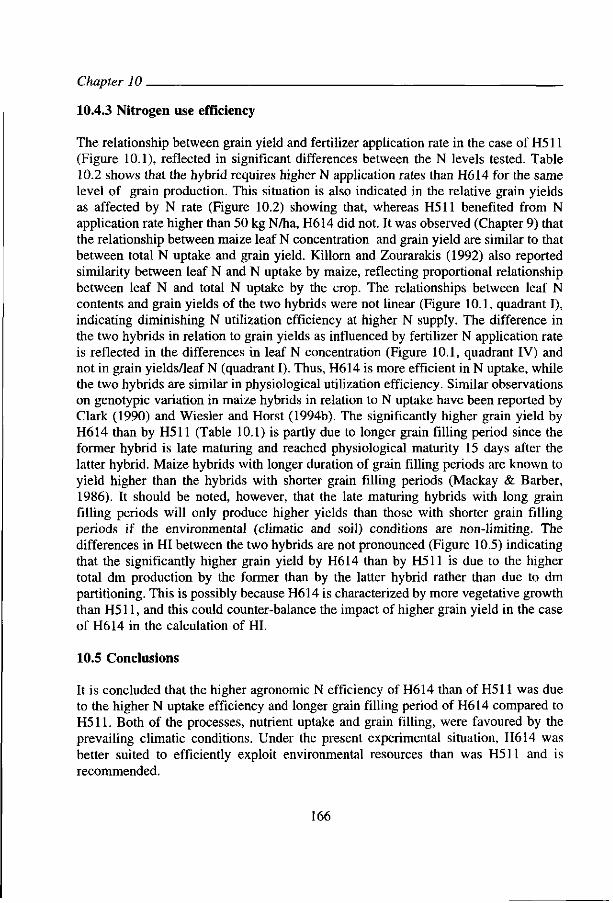
Chapter 10
10.4.3 Nitrogen use efficiency
The relationship between grain yield and fertilizer application rate in the case of H511 (Figure 10.1), reflected in significant differences between the N levels tested. Table 10.2 shows that the hybrid requires higher N application rates than H614 for the same level of grain production. This situation is also indicated in the relative grain yields as affected by N rate (Figure 10.2) showing that, whereas H511 benefited from N application rate higher than 50 kg N/ha, H614 did not. It was observed (Chapter 9) that the relationship between maize leaf N concentration and grain yield are similar to that between total N uptake and grain yield. Killorn and Zourarakis (1992) also reported similarity between leaf N and N uptake by maize, reflecting proportional relationship between leaf N and total N uptake by the crop. The relationships between leaf N contents and grain yields of the two hybrids were not linear (Figure 10.1, quadrant I), indicating diminishing N utilization efficiency at higher N supply. The difference in the two hybrids in relation to grain yields as influenced by fertilizer N application rate is reflected in the differences in leaf N concentration (Figure 10.1, quadrant IV) and not in grain yields/leaf N (quadrant I). Thus, H614 is more efficient in N uptake, while the two hybrids are similar in physiological utilization efficiency. Similar observations on genotypic variation in maize hybrids in relation to N uptake have been reported by Clark (1990) and Wiesler and Horst (1994b). The significantly higher grain yield by H614 than by H511 (Table 10.1) is partly due to longer grain filling period since the former hybrid is late maturing and reached physiological maturity 15 days after the latter hybrid. Maize hybrids with longer duration of grain filling periods are known to yield higher than the hybrids with shorter grain filling periods (Mackay & Barber, 1986). It should be noted, however, that the late maturing hybrids with long grain filling periods will only produce higher yields than those with shorter grain filling periods if the environmental (climatic and soil) conditions are non-limiting. The differences in HI between the two hybrids are not pronounced (Figure 10.5) indicating that the significantly higher grain yield by H614 than by H511 is due to the higher total dm production by the former than by the latter hybrid rather than due to dm partitioning. This is possibly because H614 is characterized by more vegetative growth than H511, and this could counter-balance the impact of higher grain yield in the case of H614 in the calculation of HI.
10.5 Conclusions
It is concluded that the higher agronomic N efficiency of H614 than of H511 was due to the higher N uptake efficiency and longer grain filling period of H614 compared to H511. Both of the processes, nutrient uptake and grain filling, were favoured by the prevailing climatic conditions. Under the present experimental situation, H614 was better suited to efficiently exploit environmental resources than was H511 and is recommended.
166

Part V
Synthesis
CHAPTER 11
GENERAL DISCUSSION AND RECOMMENDATIONS
11.1 Introduction
Nitrogen is the most limiting nutrient to crop production in Vertisols in Kenya (Ikitoo, 1989; KARI, 1991). Besides, there is widespread concern among farmers that crops do not respond to fertilizer N applications. The implication of this concern is that the recovery of applied fertilizer N is low and/or the utilization of the recovered fertilizer N, as determined by crop's potential productivity, is low. We therefore visualized the problem as that of fertilizer N use efficiency (NUE). In the present study, NUE was conceptualized as comprising essentially uptake and utilization efficiencies (Chapter 1). It was further conceptualized that applied fertilizer N will interact with the soil under the influence of climate and management. The plant would then take up its N, among other nutrients and water, in competition with the processes of N loss from the same system. Denitrification, NH3 volatilization and bypass flow were considered the main avenues of N loss from Vertisols (Figure 1.2). The relative importance of the processes of fertilizer N loss is dependent primarily on soil characteristics, fertilizer properties, climate and management. Nitrogen sources (NCy and NH4-N) have different potentials of getting lost in leaching, bypass flow, NH3 volatilization, and in denitrification. The N sources have also different influences on the uptake of other nutrients (Smith & Jackson, 1987a; Sigunga, 1993a), which lead to different nutrient concentrations and balances in the plant tissues and may affect dry matter production, and hence physiological N efficiency.
The research objectives of this thesis are firstly to understand and quantify the effects of fertilizer N and management practices on (i) fertilizer N losses through denitrification, NH, volatilization, and bypass flow, (ii) fertilizer NUE by considering agronomic, recovery and physiological N efficiencies, and (iii) uptake and utilization of other nutrients than N. Secondly, to establish management options to reduce N losses via denitrification, NH3 volatilization and bypass flow, and to improve fertilizer N use efficiency.
11.2 Research organization
Both laboratory- and field-based investigations were conducted. Investigations on factors influencing denitrification, NH3 volatilization, and bypass flow were carried out under controlled laboratory conditions for several reasons. Controlled laboratory
169

Chapter 11
conditions make it possible to study the influences of specific factors affecting denitrification and NH3 volatilization, in order to determine the relative importance of the factors on these processes. The management options to reduce N losses by these processes can then be easily tested. Since the focus of this study was to identify the factors that control the processes of N loss from Vertisol, and to obtain an estimate of the N losses by these processes, with the ultimate objective of formulating management options to reduce such losses under different cropping systems, laboratory-based investigations were considered the better alternative to field experimentation. This is because the large number of factors influencing these processes under field conditions would inevitably restrict the applicability of field results. For example, the functional relationships between denitrification rate and soil nitrate and moisture levels vary with crop species and cropping systems, as well as with sampling locations vis-a-vis plant rows, inter alia (Klemedtsson et al., 1991; Svensson et al., 1991). Thus, denitrification losses obtained in the field for maize monocrop, for instance, will depend on sampling locations in relation to both plant density and planting pattern. Similarly, NH3
volatilization is affected, among other factors, by wind velocity and temperature which facilitate the sweeping away of NH3-laden layer leading to the lowering of partial pressure between gaseous NH3 in the atmosphere and that in the solution (Denmead et al., 1982; Freney et al., 1983). The thickness of the NH3-laden layer in a field of crop, and the rapidity with which it can be swept away, are dependent of the crop density and the height of crop canopy. Thus, crop species and age, as well as cropping system will affect the results of NH3 volatilization as measured in the field. On this score we are in agreement with Fenn and Hossner (1985) who reported that data obtained from laboratory-based investigations may not be precisely reproduced on a field basis, but in most cases the laboratory generalizations are useful in the field. The laboratory-based investigations were carried out in 1993 and 1994, partly at Wageningen Agricultural University in The Netherlands and partly at Egerton University in Kenya.
Based on the findings of the laboratory-based investigations, field experiments were conducted to test a number of promising management options in 1994 and 1995 in Kenya. Field experiments were conducted at two fields, namely Muhoroni (Site 1) and Rodi Kopany (Site 2). Characterization of experimental sites was considered essential in order to facilitate the application of the field results to other agroecological zones with similar conditions. Site 1 was characterized in 1993, while Site 2 had been characterized earlier (Chapter 2). Field experiments addressed three issues. Firstly, the effects of different drain depths, 0, 20, 40, and 60 cm, on temporal variation of soil moisture, and on rooting depth of maize were investigated. The drain depths were chosen in reference to expected rooting depth of maize, which has been reported to
170

General discussion and recommendations
concentrate in the 0-40 cm soil layer (Brown & Scott, 1984; Smaling & Bouma, 1992; Wiesler & Horst, 1994a). The different drain depths were chosen in order to determine specific soil depth within which drainage has the most influence on soil moisture content and maize performance. Secondly, the interactive effects of drain depth * N source * time of N application on NUE were determined. Thirdly, the interactive effects of maize genotypes * N source * N rate on NUE were also determined. The two contrasting maize genotypes used were chosen on the basis of maturity periods and yield potentials, in order to monitor their capacity to exploit environmental resources as defined by rainfall pattern.
11.3 Main findings of the present study
11.3.1 Site characteristics
. The soils of Site 1 are very deep (>180 cm), and are characterized by shrink-swell properties as illustrated by changes in soil volume with moisture variation resulting in strong inverse relationship between bulk density and soil moisture content.
. Slickensides are a pronounced feature below 20 cm in all the profiles. The mean basic infiltration rate was found to be 0.2 cm/h indicating poor permeability.
. The occurrence of reduced iron and manganese concretions reflected in mottles was common at > 20 cm depth indicative of hydromorphic properties.
. The soils have high clay content (>60%), CEC [>30 cmol(+)/kg soil], and BS (>60%). On the basis of the observed characteristics, the soils were classified as eutric Vertisols (FAO-UNESCO, 1988), or Typic Pelluderts (Soil Survey Staff, 1990).
11.3.2 Relationships between soil moisture content and the processes of N losses
. Denitrification was related to soil moisture content, among other factors. A minimum of 30% WHC was necessary for denitrification to occur even if the 0 2 had been displaced from the headspace of the incubation containers by dinitrogen gas. This confirmed the need for water availability for the metabolic functioning of the denitrifying bacteria. With ambient air in the headspace, the critical soil moisture level for denitrification to commence was 60% WHC. Substantial denitrification losses occurred at > 80% WHC. The influence of soil moisture on denitrification was enhanced by available C, as a source of energy for the denitrifying bacteria. For a given soil moisture content, denitrification increased with increasing supply of C, confirming that available C was a limiting factor to the process in the studied soils.
. The maximum NH, volatilization from both calcium ammonium nitrate (AN) and ammonium sulfate (AS) surface applied occurred at initial soil moisture content
171
Chapter 11
of 80% WHC in Vertisols with pH > 7.0, confirming the role of water in solubilizing fertilizer material to facilitate NH-, volatilization. There was negligible NH3
volatilization from Vertisols with pH values of < 7.0. . The amount of bypass flow was higher in soil columns with low initial
moisture content than in soils with high initial moisture content, indicating higher risk of bypass flow losses in dry soils than in wet soils.
11.3.3 Relationships between fertilizer N management and the processes of N losses from the soils
The fertilizer management practices, namely the choice of N source, rate, time of application and mode of placement affected the processes of N losses to varying magnitudes.
.Potential denitrification rates in Vertisol and Phaoezem determined under anaerobic conditions and at 140% WHC were 800 and 1500 ug N/kg soil/h, respectively. Addition of 20 mg glucose/kg soil increased denitrification rates determined with ambient air in the headspace and at 140% WHC 134 to 275, and 512 to 748 |jg N/kg soil/h in Vertisol and Phoezem, respectively.
.At 160% WHC denitrification rates determined with ambient air in the headspace reduced from about 200 to 99, and 900 to 700 ug N/kg soil/h with the increase in NCyN rate from 50 to 200 mg N/kg soil in Vertisol and Phaoezem, respectively.
.There were higher N losses via NH3 volatilization from AS than AN if the losses are expressed as a fraction of total N applied, but there is no difference if the losses are expressed in terms of NH4-N applied, confirming the dependence of NH3
volatilization on the NH4-N form. .Higher NH3-N losses were obtained from U than from AS whether the fertilizer
materials were surface-broadcast applied or broadcast and incorporated. .Considering the susceptibility of N source to NH3 volatilization losses in the
studied Vertisols, the following ranking per unit of N becomes evident: U > AN > AN. .Ammonia-N losses were about 11 and 52% from urea surface applied to
Muhoroni and Karaba Vertisols, respectively. Incorporating fertilizer materials within the 0-5 cm soil layer reduced the losses to about 5 and 21% in Muhoroni and Karaba Vertisols, respectively, indicating the importance of incorporation mode of placement in relation to N losses via volatilization.
. Soil pH was the main soil property influencing NH3 volatilization losses from a given fertilizer type.
. Nitrate was the only N form in which fertilizer N was recovered in the bypass flow. The amount of NCyN recovered in the bypass flow increased with NCyN
172
General discussion and recommendations
application rate. About 11% of applied N03-N was recovered in the bypass flow. The NH4-N source had no effect on N loss in the bypass flow.
11.3.4 Effects of drain depth on soil moisture content and maize root development.
.Drainage was the single most important factor in controlling soil moisture content, maize rooting depth, nutrient uptake and yields.
.Drain influenced soil moisture content primarily in the soil layer corresponding to the drain depth but also, to a lesser extent, in the immediate layer below.
. Drains of 40 and 60 cm depths were effective in reducing soil moisture content within 0-40 cm soil layer from saturation to < 80% WHC, thereby reducing denitrification risk within the soil layer in which maize roots concentrate.
. Rooting depth and root density of maize were facilitated by drain depth of 40 and 60 cm. Maize rooting depths were about 50 and 30 cm with and without drainage, respectively. There were no significant differences between the 40 and 60 cm deep drains in terms of their influence on soil moisture content and maize rooting depth.
11.3.5. Crop yields and NUE
. Grain and total dm, as well as HI of maize were significantly improved by drainage. The effects of drains 40 and 60 cm deep on grain, dm, and HI were similar, although 60 cm drain depth resulted in slightly higher values of these parameters.
. Applying all of the prescribed N03-N dose at the time of planting significantly resulted in lower grain yields and HI compared to split and late applications where drainage was not provided. Such differences did not occur where drainage was provided. There was no effect of time of N application in the case of NH4-N whether or not drainage was provided.
.Drainage improved the uptakes of N, P, and K, as well as nitrogen recovery efficiency (NRE) and agronomic nitrogen efficiency (ANE).
. NH4-N was a better source than NO,-N particularly where drainage was not provided.
. Late maturing maize hybrid, H614, was better than the medium-late maturing hybrid, H511, in yields and NUE under Site 1 conditions, indicating that the use of maize genotype with a growth cycle that fits within the period when soil moisture is adequately available can improve NUE.
173

Chapter 11
11.4 Implications of the research findings to farming situations
11.4.1 Applying the results of laboratory-based investigations to field situations.
Denitrification
The amount of N lost from soils via denitrification is determined by both the rate and duration of denitrification. Both of these parameters depend on anaerobic conditions, inter alia, usually caused by soil wetness in the field. Hence, to translate denitrification data obtained under laboratory conditions to field situation, information on frequency and duration of anaerobic conditions is required. This information can be derived indirectly from determining soil moisture content during the crop growth period. Under field conditions, particularly where irrigation is not practised, anaerobic conditions are determined by rainfall pattern, metabolizable soil organic carbon and the hydrological properties of the soil. The basic water infiltration rate at Site 1 was 0.2 cm/h, indicating low permeability. In the present study, saturated soil conditions coincided with the periods when rainfall exceeded évapotranspiration, and this extended from the onset of rains in March to June. This period covers the exponential growth phase of maize. Thus, it is the period that water management of the root environment by draining off excess water is crucial to reduce denitrification risks, and also to facilitate 0 2 supply for proper root metabolic functioning. Laboratory investigations showed that denitrification rate at critical moisture level of < 60% WHC was negligible, being 0.45 (ig N/kg soil/h, but the rate becomes substantial at soil saturation, being 78 ug N/kg soil/h.
Transferring results from laboratory experiments to real field conditions should be done with caution. For example, denitrification rate at 60% WHC was still very low, apparently because the rate of 0 2 diffusion to the metabolically active microsites of the incubated soil sample was still fast enough to match the 0 2 demand of the heterotrophic microorganisms. Under actual field conditions soil aggregates and peds may be larger than those used in the laboratory experiments. When aggregates are large and inter-aggregate pores small, the rate of 0 2 diffusion may become a critical factor at WHC below 60%, provided that the 0 2 demand remains the same. This would suggest that a threshold value of 60% WHC for denitrification under field conditions could be a lower estimate.
Denitrification rate at saturation as determined for Site 1 was 78 ug N/kg soil/h (= 0.169 kg N/ha/h) which can result in the denitrification of 100 kg N03-N in about 25 days if available C and soil moisture remain non-limiting. Thus, most of the applied
174
General discussion and recommendations
N0 3 can be denitrified in about three weeks after crop emergence, assuming a period of 5 to 7 days for maize to emerge. The implication is that the applied N03-N can possibly be lost before maize crop reaches the phase of higher nutrient demand and rapid nutrient uptake. The likely rapid loss of N03-N via denitrification was reflected in the low NRE and ANE. The NRE values for N03-N and NH4-N under no drainage conditions ranged from 30 to 32, and 41 to 43%, respectively. The comparable values under drainage conditions ranged from 49 to 56, and 53 to 64% for N03-N and NH4-N, respectively. Drainage reduced apparent N losses from 65 and 49% to about 40 and 35% in the case of N03-N and NH4-N, respectively. This underscores the importance of drainage in reducing N losses.
Crop residues such as roots, stubble and maize stover, bean straw and sugarcane leaves are the main sources of organic matter additions to these soils. Crop residue incorporation can increase available C for use by denitrifiers and influence the denitrification rate especially in soils that are prone to waterlogging as is the case with Vertisols. It is suggested that the crop residues be incorporated in good time to decompose before the time of fertilizer N application in order to reduce the availability of water soluble carbohydrates that provide readily utilizable C for the denitrifiers. It is, however, important to investigate the influence of stover incorporation on denitrification losses so as to formulate realistic management strategies on how to use crop residues without enhancing denitrification losses in these soils.
Drainage
Drainage is the most important solution to the problem of low N recovery and ANE in Vertisols. Drains, 40 to 60 cm depth, were found effective in reducing soil moisture content from saturation to < 80% WHC, the moisture level at which denitrification N losses were found to be very low in the laboratory experiments, being < 2 mg N/kg soil in 5 days. Maize rooting depth, nutrient uptake, total dm and grain yields were all significantly increased where drainage was provided (Chapters 8 & 9). It was also found that there was no difference between the N sources, and between times of N application where 40 to 60 cm deep drains were provided. Without drainage, NH4-N source was superior to N03-N in terms of NRE, ANE, as well as total dm and grain yields by maize. It was also found that application of all the N03-N dose at planting time was inferior to split and late application where drainage was not provided.
The rooting depth of the crop must be taken into consideration when planning drainage, lest the soil layer within which the roots concentrate is either inadequately or excessively drained. In the case of maize, 40 and 60 cm deep drains were found
175
Chapter 11
effective in promoting root growth and increasing NRE and ANE. There was no significant difference between the two drain depths. Hence, on the basis of cost/benefit considerations, drain depth of 40 cm is recommended in preference to that of 60 cm for maize and other crops whose rooting depths are comparable to that of maize. Inter-drain spacing should be considered when planning drainage. In the present study (Chapter 8), inter-drain spacing of 6 m significantly lead to higher grain yields despite the loss of 17% of the cropland to drain construction. The wider the inter-drain spacing the less cropland is lost to drain construction. The relationship between drain depth and inter-drain spacing was not addressed in the current studies. However, results from research reported elsewhere (Section 8.4.4) suggest that inter-drain spacing should be between 15 and 20 metres.
The effectiveness of drainage provided for individual farms will depend on the presence of an adequate outlet allowing water drained from the individual farms to flow out of the farming area. This aspect of drain provision is beyond the capability of the individual peasant farmers in Kenya, and therefore requires the involvement of the Kenyan Government. Since Vertisols characteristically occur in expansive flat areas such as Kano Plains and Mwea-Karaba plains, the Government should construct a network of main outlet drains in order to ensure the effectiveness of drains constructed for individual farms.
Ammonia volatilization
From the laboratory investigations it was confirmed that NH3 volatilization depends primarily on soil pH and fertilizer properties. It was also found that Vertisols in Kenya have pH values ranging from 5.5 to 9.1 indicating different potentials for NH3
volatilization. For example, the NH3-N losses from AN and AS in Kitale Vertisol (pH = 7.46) were 8 and 16% in 8 days, respectively. In Karaba Vertisol (pH = 7.65), the losses were 9 and 18% from AN and AS in the same period, respectively. The NH3-N losses from urea (U) surface applied to Muhoroni (pH = 6.07) and Karaba Vertisols were 12 and 52% in 11 days, respectively. Incorporating U within 0-5 cm soil layer reduced the losses by about 4 and 21% in Muhoroni and Karaba, respectively. These results can be directly applied to the field situation by choosing appropriate fertilizer for particular Vertisols. It seems, therefore, that controlling NH3-N losses from these Vertisols do not constitute a serious problem.
Bypass flow
Fertilizer N losses in bypass flow depend on the initial soil moisture content and
176

General discussion and recommendations
application rate. In the present study, between 11 and 13% of surface applied N from calcium nitrate to a pre-wetted, cultivated soil were lost. In absolute sense, losses from 50, 100, and 200 kg N/ha were 6, 11, and 26 kg N/ha, respectively. There was no loss from NH4-N source. Thus, the amount of N lost increased with increasing N03-N rate. For Kenyan Vertisols, there is no evidence to justify the application of more than 100 kg N/ha. This may result in a loss of about 11%, if the dose were to be given all as N03-based fertilizer. This loss can be reduced by incorporating fertilizer material in the soil to provide aggregate protection for the fertilizer against the loss in the bypass flow (Thomas & Philips, 1979). Further, N03-N source can be applied later, about 40 DAP, when cracks in the soil have been reduced as a result of soil swelling in response to high moisture content. Delaying fertilizer application to later times is particularly important if no-till technology is to be practised in these soils. Conventional tillage leads to disruption of preferential flow paths and reduces bypass losses, while no-till leaves the macropores intact. The problem that would be created by late application is the difficulty in incorporating the fertilizer material in the soil. It was found that the use of NH4-N source eliminates the problem of fertilizer N in the bypass flow. The use of NH4-N, however, carries the risk of lowering the soil pH as a result of H+ produced during nitrification of NH4
+. The necessity of a cost of lime application is likely to be low for two reasons. First, the Vertisols in Kenya are characterized by high CEC [> 30 cmol(+)/kg soil] and %BS (> 60%), the properties that indicate high buffering capacity of these soils. This is bound to lower the frequency of the need to apply lime to these soils. Two, liming materials are locally available and cheap.
11.4.2 Nutrient utilization
The main nutrient limiting maize production in these Vertisols is N. At both sites, grain yield-N uptake relations showed that the utilization of absorbed N was close to maximum especially at the low N uptake range corresponding to situations where drainage was not provided. Drainage significantly increased rooting depth and N utilization (NRE & ANE), indicating that waterlogged conditions constitute the main constraint to efficient nutrient utilization in these Vertisols. Maize genotype with high N uptake efficiency can improve ANE. The maize hybrid H614 had higher N uptake and ANE than the H511. The results suggest that there is still scope for improving ANE and crop yield by selecting hybrids suitable for particular agroecological zones. High yielding late maturing hybrids seem appropriate for zones with long rainy seasons, whilst early maturing hybrids seem more suitable for zones with short rainy seasons. It is suggested further that late maturing hybrids likely to take more advantage of split fertilizer application than early maturing hybrids, but this needs to be tested.
177

Chapter 11
11.5 Recommended management options
Drainage is a main solution to the problems of controlling soil moisture in the rhizosphere, root development, nitrogen recovery and agronomic nitrogen efficiency, as well as the uptake of nutrients other than nitrogen in Kenyan Vertisols. Fertilizer management in Vertisols largely depend on drainage, rainfall pattern, soil pH, and crop characteristics in relation to the length of rainy season. In agroeclogical zones where rainfall duration and intensity lead to waterlogging conditions, denitrification risks are high, and plant root development is poor creating the necessity for drainage. It is recommended to construct drains 40 cm deep, with inter-drain spacing of 15 to 20 to drain off excess water and facilitate 0 2 supply to root environment. Where drainage is provided either NH4N03, N03- or NH4-N source can be used, provided NH3
volatilization and bypass flow risks are considered.
Where there is no drainage, NH4N03 should be given priority over N03- and NH4-N, since it is not a strong acidifying fertilizer, and it has low risks of losses in bypass flow, denitrification and NH3 volatilization. It can be applied to soils with low or high pH values, and can be applied at the beginning of the season or later. Ammonium is preferably applied if soil pH < 7. If urea is applied to soils with pH > 7, incorporation of fertilizer material should be practised. Ammonium sulfate should not be applied to soils with pH > 7 since even incorporation does not eliminate NH3 volatilization losses. Where NH4-N is used repeatedly, liming must be considered. If N03-N is to be used on undrained plots then it must be applied later in the season to minimize the risks of losses by denitrification and bypass flow. All fertilizer materials should be incorporated in order to reduce losses in runoff, bypass flow and NH3 volatilization.
Maize cultivars whose growth cycles fit well within crop growing season as determined by rainfall period should be selected to efficiently exploit environmental resources and increase NUE. Inorganic fertilizers should be used together with organic manure, whenever possible, in order to improve soil physicochemical properties and fertilizer N use efficiency by crops.
178

REFERENCES
Abbes, C , Parent, L.E. & Karam, A. (1994). Nitrification of ammoniated peat and ammonium sulfate in mineral soils. Soil Biol. Biochem,. 26(8): 1041-1051 Ahmed, N. (1985). Fertilizer efficiency and crop yields in Pakistan. Feit. Agric. 89: 17-31. Ahmed, N (1988). Management of Vertisols in humid tropics. In: Wilding, L.P. & Puentes, R. (eds.). Vertisols: Their distribution, properties, classification and management. Techn. Mono. # 18, Texas A & M. pp. 97-115. Akunna, J.C., Bizeau, C. & Moletta, R. (1994). Nitrate reduction by anaerobic sludge using glucose at various concentrations: Ammonification, denitrification and methanogenic activities. Environ. Techn., 15: 41-49 Aleksic, Z., Broeshart, H. & Middelboe, V. (1968). The effect of nitrogen fertilizer on the release of soil nitrogen. Plant & Soil, XXIX, (3): 474-478. Alexander, M. (1977). Introduction to Soil Microbiology. John Wiley Sons, Inc., New York. Anderson, J.M. & Ingram, J.S.I, (eds.) (1993). Tropical Soil Biology and Fertility: A Handbook of Methods. TSBF: Nairobi, Kenya. Andrade, F.H. & Anderson, I.C. (1986). Physiological effects of the form of nitrogen on corn root tips: A 3'P Nuclear Magnetic Resonance Study. Crop Sei., 26: 293-296. Andreini, M.S. & Steenhuis, T.S. (1990). Preferential paths of flow under conventional and conservation tillage. Geoderma, 46: 85-102. Anon. (1991). Atlas of the world. Phillips-Heimann: London. Arnon, I (1975). Mineral nutrition of maize. International Potash Inst.: Bern Arora, Y., Nnadi, L.A. & Juo, A.S.R. (1987). Nitrogen efficiency of urea and calcium ammonium nitrate for maize (Zea mays L.) in humid and subhumid regions of Nigeria. L agric. Sei., Camb. 109: 47-51. Asghari, M. & Hanson, R.G. (1984a). Nitrogen, climate, and previous crop effect on corn yield and grain N. Agron. J., 76: 536-542. Asghari, M. & Hanson, R.G. (1984b). Climate, Management, and N effect on corn leaf N, yield, and grain N. Agron. J„ 76: 911-916. Aulakh, M.S. & Doran, J.W. (1991). Effectiveness of acetylene inhibition of N20 reduction for measuring denitrification in soils of varying wetness. Commun, in Soil Sei. Plant Anal.. 22(1&2): 11-21. Aulakh, M.S., Doran, J.W. & Mosier, A.R. (1991). Field evaluation of four methods for measuring denitrification. Soil Sei. Soc. Am. J., 55: 1332-1338. Aulakh, M.S., Doran, J.W. & Mosier, A.R. (1992). Soil denitrification - Significant, measurement, and effects of management. Adv. Soil Sei., 18: 1-57. Avnimelech, Y. & Laher, M. (1977). Ammonia volatilization from soils: equilibrium considerations. Soil Sei. Soc. Am. J„ 41: 1080-1084. Azam, F., Simmons, F.W. & Mulvaney, R.L. (1994a). Effect of ammonium fixation and displacement on the added nitrogen interaction in incubation experiments. Biol. Fertil. Soils, 18: 99-102. Azam, F., Simmons, F.W. & Mulvaney, R.L. (1994b). The effect of inorganic nitrogen on the added nitrogen interaction of soils in incubation experiments.
179

References
Biol. Fertil. Soils, 18: 103-108. Bache, B.W. & Heathcote, R.G. (1969). Long-term effects of fertilizers and manure on soil and leaves of cotton in Nigeria. Experimental Agric, 5: 241-247. Balasubramanian, V. & Singh, L. (1982). Efficiency of nitrogen fertilizer use under rainfed maize and irrigated wheat at Kadawa, northern Nigeria. Fert. Res.. 3: 315-324. Bändel, V.A., Dzienia, S. & Stanford, G. (1980). Comparison of N fertilizers for no-tillage corn. Agron. J. 72: 337-341. Bändel, V.A., Mulford, F.R. and Bauer, H.J. (1984). Influence of fertilizer source and placement on no-tillage corn. J. Fert. Issues. 1: 38-43. Bandibas, J., Vermoesen, A., De Groot, C.J., & Van Cleemput, O. (1994). The effect of different moisture regimes and soil characteristics on nitrous oxide emission and consumption by different soils. Soil Science. 158(2): 106-114 Barraclough, D. Hyden, M.J. & Davies, G.P. (1983). Fate of fertilizer nitrogen applied to grassland. I. Field leaching results. J. Soil Sei.. 34: 483-497. Barraclough, D., Jarvis, S.C., Davies, G.P. & Williams, J. (1992). The relation between fertilizer nitrogen applications and nitrate leaching from grazed glassland. Soil Use and Management. 8(2): 51-56. Bartonda, J. & Waring, S.A. (1984). Denitrification in relation to soil carbon for soils of the Darling Downs, Queensland. In: McGarity, J.W., Hault, E.H & So, H.B. (eds.). The Properties and Utilization of Cracking Clay Soils. New South Wales: University of New England, pp. 231-239. Bayene, D. (1988). Soil fertility research on some Ethiopian Vertisols. In: Jutzi, S.C., Haque, I., Malutire, J. & Stares, J.E. (eds.). Management of Vertisols in sub-Saharan Africa. ILCA: Addis Ababa, pp. 223-231. Beauchamp, E.G., Gale, C, & Yeomans, J.C. (1980). Organic matter availability for denitrification in soils of different textures and drainage classes. Commun. In Soil Sei, and Plant Anal. 11(12): 1221-1233. Beauchamp, E.G., Trevors, J.T. and Paul, J.W. (1989). Carbon sources for bacterial denitrification. Adv. Soil Sei., 10: 113-142. Below, F.E. & Gentry, L.E. (1987). Effect of mixed N nutrition on nutrient accumulation, partitioning and productivity of corn. J. Fertilizers Issues, 4(3): 79-85. Benckiser, G. (1994). Relationships between field-measured denitrification losses, C02
formation and diffusional constraints. Soil Biol. Biochem., 26(7): 891-899. Benoit, G.R., Hatfield, A.L. & Ragland, J.L. (1965). The growth and yield of corn: III. Soil moisture and temperature effects. Agron. J., 57: 223-226. Benoit, G.R., Olness, A. & Van Sickle, K.A. (1990). Day-night temperature effects on leaf expansion and height of field-grown corn. Agron. J., 82: 690-695. Beven, K. (1981). Micro-, meso-, macroporosity and channelling flow phenomena in soils. Soil Sei. Soc. Amer. J., 45: 1245. Bijay-Singh, Ryden, J.C. & Whitehead, D.C. (1988). Some relationships between denitrification potential and fractions of organic carbon in air-dried and field-moist soils. Soil Biol. Biochem., 20: 737-741.
180
References
Binstock, D.A. (1984). Potential denitrification in an acid forest soil: dependence on wetting and drying. Soil Biol. Biochem., 16(3): 287-288.
Birch, F.H. (1958). The effect of soil drying on humus decomposition and nitrogen availability. Plant and Soil, X(l): 9-31. Birch, F.H. (1959). Further observations on humus decomposition and nitrification. Plant and Soil, IX(3): 262-287.
Black, C.A. & Scott, C O . (1956). Fertilizer evaluation: I. Fundamental principles. Soil Sei. Soc. Proc, 1956, pp. 176-179. Blair, G.J., Miller, M.H. & Mitchel, W.A. (1970). Nitrate and ammonium as sources of nitrogen for corn, and their influence on the uptake of other ions. Agron. J. 62: 530-532. Blaise, D. & Prasad, R. (1995). Effect of blending urea with pyrite or coating urea with polymer on ammonia volatilization loss from surface-applied prilled urea. Biol. Fertil. Soils, 20: 83-85.
Blokhuis, W.A. (1981). Problem soils: their reclamation and management - Vertisols. In: ILRI. Land Reclamation and Water Managt. Int. Inst. Land Reclam. Improve., ILRI, Pub. 27: 44-48. Blokhuis, W.A. (1993). Vertisols in the central clay plain of the Sudan. PhD thesis, Wageningen Agricultural University, Wageningen, The Netherlands. Boswell, F.C., Meisinger, J.J. & Case, N.L. (1985). Production, marketing, and use of nitrogen fertilizers. In: Engelstad, O.P. (ed.). Fertilizer Technology and Use. SSSA: Madison, Wisconsin, pp. 229-292.
Bouma, J., Belmans, C , Dekker, L.W. & Jeurissen, W.J.M. (1983). Assessing the stability of soils with macropores for subsurface liquid waste disposal. J. Environ. Qual.. 12: 305-310. Bouma, J. & Dekker, L.W. (1978). A case study of infiltration into dry clay soil. I. Morphological observations. Geoderma, 20: 27-40.
Bouma, J., Dekker, L.W. & Muilwijk, C.J. (1981). A field method for measuring short-circuiting in clay soils. J. Hydrol. 52: 347-354. Bouma, J. & Loveday, J. (1988). Characterizing soil water regimes in swelling clay soils. In: L.P. Wilding and R. Puentes (eds.), Vertisols: Their distribution, properties, classification and management. SMSS Techn. Mono. # 18, Texas A & M University, pp. 83-95. Bouwmeester, R.J.B., Vlek, P.L.G. & Stumpe, J.M. (1985). Effect of environmental factors on ammonia volatilization from a urea-fertilized soil. Soil Sei. Soc. Am. J., 49: 376-381. Bowman, R.A. & Focht, D.D. (1974). The influence of glucose and nitrate concentrations upon denitrification rates in sandy soils. Soil Biol. Biochem., 6: 297-301. Braschkat, J., Mannheim, T., Horlacher, D. & Marschner, H. (1993). Measurement ammonia emissions after liquid manure application: I. Construction of a windtunnel system of measurements under field conditions. Z. Pflanzenernähr. Bodenk, 156: 393-396. Brasher, B.R., Franzmeier, D.P., Valassis, V. & Davidson, S.E (1966). Use of SARAN resin to coat natural soil clods for bulk density and water retention measurements . Soil Sei., 101: 108.
Broadbent, F.E. (1965). Effect of fertilizer nitrogen on the release of soil nitrogen. Soil Sei. Soc. Amer. Proc, 29: 692-696.
181

References
Broadbent, F.E. & Nakashima, T. (1971). Effect of added salts on nitrogen mineralization in three California soils. Soil Sei, Soc. Amer. Proc. 35: 457-460. Bronswijk. J.J.B. (1986). Manual for determination of swelling and shrinkage potential of soils (In Dutch). ICW note 1719. DLO-Winand Staring Centre: Wageningen, The Netherlands, 10 pp. Bronswijk, J.J.B. & Evers-Vermeer, J.J. (1990). Shrinkage of Dutch clay soil aggregates. Netherlands J. Agric. Sei., 38: 175-194. Brown, D.A. & Scott, H.D. (1984). Dependence of crop growth and yield on root development and activity. In: Roots, nutrient and water influx, and plant growth. ASA special publication # 49. pp. 101-136. Buckman, H.O. & Brady, N.C. (1974). The Nature and Properties of Soils, 6th Edn. MacMillan: New York. Burford, J.R. & Bremner, J.M. (1975). Relationships between the denitrification capacities of soils and total, water-soluble and readily decomposable soil organic matter Soil Biol. Biochem, 7: 389-394. Bussink, D.W. (1994). Relationships between ammonia volatilization and nitrogen fertilizer application rate, intake and excretion of herbage nitrogen by cattle on grazed swards. Fertilizer Research, 38: 111-121. Bussink, D.W. (1996). Ammonia volatilization from intensively managed dairy pastures. PhD thesis, Wageningen Agricultural University, The Netherlands. Campbell, CA., Selles, F., Zentner, R.P. & McConkey, B.G. (1993). Nitrogen management for zero-till spring wheat: Disposition in plant and utilization efficiency. Commun, soil Sei. Plant Anal., 24(17 & 18): 2223-2239. Capurro, E. & Voss, R. (1981). An index of nutrient efficiency and its application to corn yield response to fertilizer N. I. Derivation, estimation and application. Agron. J. 73: 128-134. Carefoot, J.M., Bole, J.B. & Entz, T. (1989). Relative efficiency of fertilizer N and soil nitrate at various depths for the production of soft white wheat. Can. J. Soil Sei., 69: 867-874. Chalk, P.M. & Smith, C.J. (1983). Chemodenitrification. In: Freney, J.R. and Simpson, J.R. (eds.). Gaseous Loss of Nitrogen from Plant-Soil Systems: Developments in Plant and Soil Science Vol. 9, pp. 65-89. Martinus Nijhoff/Dr. W. Junk Publishers: The Hague. Chao, T. & Kroontije, W. (1964). Relationship between ammonia volatilization, ammonia concentration and water evaporation. Soil Sei. Soc. Amer. Proc, (28): 393-395. Chien, S.H., Sale, P.W.G. & Friesen, D.K. (1990). A discussion of the methods for comparing the relative effectiveness of phosphate fertilizers varying in solubility. Fertilizer Research, 24: 149-157. Cho, CM., Sakdinan, L. & Chang, C (1979). Denitrification intensity and capacity of three irrigated Alberta soils. Soil Sei. Soc. Am. J., 43: 945-950. Christensen, S., Simkins, S. & Tiedje, J.M. (1990). Spatial variation in denitrification: dependence of activity centres on the soil environment. Soil Sei. Soc. Am. J., 54: 1608-1613.
182
References
Christianson, C.B., Carmona, G., Klein, M.O. & Howard, R.G. (1995). Impact on ammonia volatilization losses of mixing KCl of high pH with urea. Fert. Res., 40: 89-92. Clark, R.B (1990). Physiology of cereals for mineral nutrition uptake, use, and efficiency. In: Baligar, V.C. & Duncan, R.R. (eds.). Crops as enhancers of nutrient use. Academic press: London, pp. 131-209. Colbourn, P. & Harper, I.W. (1987). Denitrification in drained and undrained arable clay soil. J. Soil Sei., 38: 531-539. Coulombe, C.E., Wilding, L.P. & Dixon, J.B. (1996). Overview of Vertisols: characteristics and impacts on society. Adv. Agron,, 57: 289-375. Court, M.N., Stephen, R.C. & Waid, J.S. (1964). Toxicity as a cause of the inefficiency of urea as a fertilizer. J. Soil Sei., 15: 42-48. Davidson, E.A., Galloway, L.F. & Strand, M.K. (1987). Assessing available carbon: comparison of techniques across forest soils. Commun. Soil Sei. Plant Anal., 18: 45-64. Davies, D.M. & Williams, P.J. (1995). The effect of the nitrification inhibitor Dicyandiamide on nitrate leaching and ammonia volatilization: A U.K. nitrate sensitive areas perspective. L Environ. Managt., 45: 263-272. D'Costa, V.P., Gatahi, M.M. & Gachene, C.K.K. (1988). The characteristics, classification and land use significance of swell-shrink soils East of Lake Victoria, Kenya. In: Classification, management and use potential of swell-shrink soil, October 24-28, 1988, Nagpur, India. Dekker, L.W. & Bouma, J. (1984). Nitrogen leaching during sprinkler irrigation of a Dutch clay soil. Agric. Water Managt, 9: 37-45. Denmead, O.T. (1983). Micrometeorological methods for measuring gaseous losses of nitrogen in the field. In: Freney, J.R. & Simpson, J.R. (eds.). Gaseous Loss of Nitrogen from Plant-Soil Systems: Developments in Plant and Soil Science Vol. 9. pp. 133-157. Martinus Nijhoff: The Hague. Denmead, O.T. (1990). An ammonia budget for Australia. Aust. J. Soil Res., 28: 887-900. Denmead, O.T., Freney, J.R. & Simpson, J.R. (1982). Dynamics of ammonia volatilization during furrow irrigation of maize. Soil Sei. Soc. Am. J., 46: 149-155. Denmead, O.T., Nulsen, R. & Thurtell, G.W. (1978). Ammonia exchange over a corn crop. Soil Sei. Soc. Am. J., 42: 840-842. Demead, O.T., Simpson, J.R. & Freney, J.R. (1974). Ammonia flux in the atmosphere from a grazed pasture, Science, 185: 609-610. Dennett, M.D. (1984). The tropical environment. In: Goldsworthy, P.R. & Fischer, N.M. (eds.). The Physiology of Tropical Field Crops, pp. 1-38. John Wiley: New York Dibb, D.W. & Welch, L.F. (1976). Corn growth as affected by ammonium vs. nitrate absorbed from soil. Agron. J., 68: 89-93. Dudal, R. & Bramao, D.L. (1965). Dark clay soils of tropical and subtropical regions. FAQ Agricultural Development Paper # 83. FAO: Rome. Duncan, R.R. & Baligar, V.C. (1990). Genetics, Breeding, and Physiological Mechanisms of Nutrient Uptake and Use Efficiency: An Overview. In: Baligar, V.C. & Duncan, R.R. (eds.). Crops as enhancers of nutrient use. Academic press: London, pp. 3-35.
183
References _ _
Du Plessis, M.C.F. & Kroontje, W. (1964). The relationship between pH and ammonia equilibria in soil. Soil Sei. Soc. Amer. Proc, 28: 751-754. Duxbury, J.M. (1986). Advantages of the acetylene method for measuring denitrification. In: Hauck, R.D. and Weaver, R.W. (eds.), Field Measurement of Dinitrogen Fixation and Denitrification. Madison, Wisconsin: SSSA. pp. 73-91. Ebelhar, S.A., Kamprath, E.J. & Moll, R.H. (1987). Effects of nitrogen and potassium on growth and cation composition of corn genotypes differing in average ear number. Agron. J. 79: 875-881 Eck, H.V. (1984). Irrigated corn yield response to nitrogen and water. Agron. J„ 76: 421-428. Eckert, D.J. (1987). UAN management practices for no-tillage corn production. J. Fert. Issues, 4: 13-18 Eswaran, H. & Reich, P. (1992). Variability in soil and climatic conditions in IBSRAM Vertisol network sites in Africa. In: Report of the 1992 annual review meeting on AFRICALAND Management of Vertisols in Africa. Network Document # 3. pp. 141-166, IBSRAM: Bangkok. Fageria, N.K., Baligar, V.C. & Jones, C.A. (1991a). Growth and mineral nutrition of field crops. Dekker: New York. Chapter 2 Fageria, N.K., Baligar, V.C. & Jones, C.A. (1991b). Growth and mineral nutrition of field crops. Dekker: New York. Chapter 7. FAO (1977). Guidelines for soil profile description. 2nd Ed. FAO: Rome. FAO (1978). Report on the Agro-ecological Zones Project, Vol. I: Methodology and Results for Africa. World Soil Res. Rep. # 48. FAO: Rome. FAO-UNESCO (1988). Soil Map of the World: Revised legend. World Soil Res. Rep. # 60. FAO: Rome. Farquhar, G.D., Firth, P.M., Wetselaar, R. & Weir, B. (1980). On the gaseous exchange of ammonia between leaves and the environment: Determination of the ammonia compensation point. Plant Physiol. 66: 710-714. Fausey, N.R. & Lai, R. (1990). Soil wetness and anaerobiosis. In: Lai, R. and Steward, B.A. (eds.). Adv. Soil Sei. Vol. II, pp. 173-186, Springer - Verlag: London: Fenn, L.B. & Escarzaga, R. (1976). Ammonia volatilization from surface applications of ammonium compounds on calcareous soils: V. Soil water content and method of nitrogen application. Soil Sei. Soc. Am. J., 40: 537-541. Fenn, L.B. & Escarzaga, R. (1977). Ammonia volatilization from surface applications of ammonium compounds to calcareous soils: VI. Effects of initial soil water content and quantity of applied water. Soil Sei. Soc. Am. J., 41: 358-363. Fenn, L.B. Hossner, L.R. (1985). Ammonia volatilization from ammonium or ammonium-forming nitrogen fertilizers. In: Stewart, B.A (ed.). Advances in Soil Science. 1: 123-169. Fenn, L.B. & Kissel, D.E. (1973). Ammonia volatilization from surface applications of ammonium compounds on calcareous soils: I. General Theory. Soil Sei. Soc. Amer. Proc, 37: 855-859. Fenn, L.B. & Kissel, D.E. (1974). Ammonia volatilization from surface applications of ammonium compounds on calcareous soils: II. Effect of temperature and rate of ammonium
184

References
nitrogen application. Soil Sei. Soc, Amer, Proc, 38: 606-611. Fenn, L.B. Kissel, D.E. (1975). Ammonia volatilization from surface applications of ammonium compounds on calcareous soils: IV. Effect of calcium carbonate content. Soil Sei. Soc. Amer. Proc, 39: 631-633. Fenn, L.B. & Kissel, D.E. (1976). The influence of cation exchange capacity and depth of incorporation on ammonia volatilization from ammonium compounds applied to calcareous soils. Soil Sei. Soc. Am. J. , 40: 394-398. Fenn, L.B. & Miyamoto (1981). Ammonia loss and associated reactions of urea in calcareous soils. Soil Sei. Soc. Am. J.. 45: 537-540. Ferguson, R.B., Kissel, D.E., Koelliker, J.K. & Basel, W. (1984). Ammonia volatilization from surface-applied urea: Effect of hydrogen ion buffering capacity. Soil Sei. Soc. Am. J.. 48: 578-582. Ferguson, R.B., Mclnnes, K.J. & Kissel, D.E. (1988). A comparison of methods of estimating ammonia volatilization in the field. Fertilizer Research. 15: 55-69. Ferguson, R.B., Schepers, J.S., Hergert, G.W. & Lohry, R.D. (1991). Corn uptake and soil accumulation of nitrogen: Management and Hybrid effects. Soil Sei. Soc. AM. J.. 55: 875-880. Fillery, I.R.P. (1983). Biological denitrification. In: Freney, J.R. and Simpson, J.R. (eds). Gaseous Loss of Nitrogen from Plant-Soil Systems: Developments in Plant and Soil Sciences Vol. 9, pp.33-63. Martinus Nijhoff/Dr. W. Junk Publishers: The Hague. Firestone, D.D. (1982). Biological denitrification. In: Stevenson, F.J. (ed.). Nitrogen in Agricultural Soils, Agronomy # 22, ASA, CSSA and SSSA: Madison, Wisconsin, 289-326. Fischer, N.M. and Dunham, R.J. (1984). Root morphology and nutrient uptake. In: Goldsworthy, P.R. and Fischer, N.M. (eds.). Physiology of Tropical Field Crops. pp. 85-117. John Wiley: London. Focht, D.D. (1978). Methods for analysis of denitrification in soils. In: Nielsen, D.R. and MacDonald, J.G. (eds.). Nitrogen in the Environment, 2: 433-490, Academic Press, New York. Fox, R.H. & Hoffman, L.D. (1981). The effect of N fertilizer source on grain yield, N uptake, soil pH, and lime requirement in no-till corn. Agron. J., 73: 891-895. Fox, R.H., Kern, J.M. & Piekielek, W.P. (1986). Nitrogen fertilizer source, and method and time of application effects on no-till corn yields and nitrogen uptake. Agron. J., 78:741-746. Fox, R.H. & Piekielek, W.P. (1983). Response of corn to nitrogen fertilizer and the prediction of soil nitrogen availability with chemical test in Pennsylvania State Univ. Agric Exp. Stn. Bull. # 843. Francis, D.D. & Schepers, J.S. (1994). Nitrogen uptake efficiency in maize production using irrigation water high in nitrate. Fert. Res., 39: 239-244. Francis, D.D., Schepers, J.S. & Vigil, M.F. (1993). Post-anthesis nitrogen loss from corn. Agron. J„ 85: 659-663. Freney, J.R. Simposon, J.R. & Denmead, O.T. (1983). Volatilization of ammonia. In: Freney, J.R. and Simpson, J.R. (eds.). Gaseous Loss of Nitrogen from Plant-Soil Systems: Development in Plant and Soil Sciences Vol. 9. pp. 1-32, Martinus Nijhoff/Dr. W. Junk
185
References
Publishers: The Hague. FURP (1987a). Fertilizer Use Recommendation Project Phase I. Annex I, Vol. 1 & 2: Compilation of results from former fertilizer trials in Kenya. Ministry of Agriculture:Nairobi, Kenya. FURP (1987b). Fertilizer Use Recommendation Project Phase I. Annex III, Vol. 3(2): Description of the first priority trial sites in the various districts; South Nyanza District. Ministry of Agriculture: Nairobi, Kenya. Gama, B.M., Bagarama, F. & Mowo, J.G. (1992). The effect of seedbed preparation methods on the yield of maize and cotton in a Pelli-Eutric Vertisol at Lubuga village, Mwanza, Tanzania. In: IBSRAM, 1992. Report of the 1992 annual review meeting on AFRICALAND Management of Vertisols in Africa. Network Doc. # 3. pp. 51-62. IBSRAM: Bangkok. Gardner, F.P., Pearce, R.B. & Mitchell, R.L. (1985). Physiology of crop plants. Iowa State University Press: Ames. Gashaw, L. and Mugwira, L.M. (1981). Ammonium N and nitrate-N effects on the growth and mineral composition of Triticale, wheat, and rye. Agron. J. 73:47-51. Gee, G.W. & Bauder, J.W. (1986). Particle-size analysis. In: Klute, A. (ed.). Methods of soil analysis. Part I: Physical and Mineralogical Methods. SSSA: Madison, Wisconsin, USA. pp. 383-412. Gerloff, G.C.& Gabelman, W.H. (1983). Genetic basis of inorganic plant nutrition. In: Lauchli, A. & Bieleski, R.L. (eds.). Encyclopedia of Plant Physiology, New series, # 15B. Springer-Verlag: Berlin, pp. 453-480. Gezgin, S. & Bayrakll, F. (1995). Ammonia volatilization from ammonium sulfate, ammonium nitrate, and urea surface applied to winter wheat on a calcareous soil. J. Plant Nutr., 18(11): 2483-2494. Girardin, P., Tollenaar, M., Deltour, R. & Muldoon, J. (1987). Temporary N starvation in maize (Zea mays L.): effects on development, dry matter accumulation and grain yield. Agronomie, 7(4): 289-296. Goense, D. & Wienk, J.F. (1990). Potential and actual yields of crops. In: Janssen, B.H. & Wienk, J.F. (eds.). Mechanized annual cropping on low fertility acid soils in the tropics. WAU Papers 90.5. pp. 41-47. Goodroad, L.L. & Jellum, M.D. (1988). Effect of N fertilizer rate and soil pH on N efficiency in corn. Plant and Soil, 106: 85-89. Goulding, K.W.T., Webster, C.P., Powlson, D.S. & Poulton, P.R. (1993). Denitrification losses of nitrogen fertilizer applied to winter wheat following ley and arable rotations as estimated by acetylene inhibition and '5N balance. J. Soil Sei., 44: 63-72 Greenwood, D.J. (1975). Measurement of soil aeration. In: Soil physical conditions and crop production. MAFF Tech. Bull. # 29. pp. 261-272. Groffman, P.M. (1995). A conceptual assessment of the importance of denitrification as a source of soil nitrogen loss in tropical agro-ecosystems. Fert. Res., 42: 139-148. Groffman, P.M., Tiedje, J.M., Robertson, G.P. & Christensen, S. (1988). Denitrification at different temporal and geographical scales: Proximal and distal controls. In: Wilson, J.R.
186

References
(ed.). Adv. in Nitrogen cycling in Agric. ecosystems, pp. 174-192. CAB Int.: Wallingford. Hales, J.M. & Drewes, D.R. (1979). Solubility of ammonia in water at low concentrations. Atmos. Environ., 13: 1133-1147. Hamid, A. & Ahmad, M. (1995). Interaction of l5N-labelled ammonium nitrate, urea and ammonium sulfate with soil N during growth of wheat (Triticum aestivum L.) under field conditions. Biol. Fertil. Soils, 20: 185-189. Hargrove, W.L. (1988 a). Evaluation of ammonia volatilization in the field. J. Prod. Agric, 1(2): 104-111. Hargrove, W.L. (1988 b). Soil, environment, and management factors influencing ammonia volatilization under field conditions. In: Bock, B.R. & Kissel, D.E. (eds.). Ammonia Volatilization from Urea Fertilizers, NFDC, TVA: Muscle Shoals, Alabama, pp. 17-36. Hargrove, W.L. & Kissel, D.E. (1979). Ammonia volatilization from surface applications of urea in the field and laboratory. Soil Sei. Soc. Am. J., 43: 359-363. Hargrove, W.L., Kissel, D.E. & Fenn, L.B. (1977). Field measurements of ammonia volatilization from surface applications of ammonium salts to a calcareous soil. Agron. J., 69: 473-476. Harper, L.A. (1988). Comparisons of methods to measure ammonia volatilization in the field. In: Bock, B.R. & Kissel, D.E. (eds.). Ammonia Volatilization from Urea Fertilizers. NFDC. TVA: Muscle Shoals, Alabama, pp. 93-109. Harper, L.A., Giddens, J.E., Langdale, G.W. & Sharpe. R.R. (1989). Environmental effects on nitrogen dynamics in soybean under conservation and clean tillage systems. Agron. J^ 81: 623-631 Harper, L.A., Sharpe, R.R., Langdale, G.W. & Gidens, J.E. (1987). Nitrogen cycling in a wheat crop: Soil, plant, and aerial nitrogen transport. Agron. J., 79: 965-973. Harris, B.L. (1989). Management of cropland Vertisols in Texas. In: IBSRAM. Vertisol Management in Africa, IBSRAM Proc. # 9. pp. 253-267. Hauck, R.D. (1986). Field measurement of denitrification: An Overview. In: Hauck, R.D. & Weaver, R.W. (eds.). Field Measurements of Dinitrogen Fixation and Denitrification. SSSA Special Publication # 18 Madison, Wisconsin, USA. pp. 59-72. Hauck, R.D. & Bremner, J.M. (1978). Use of tracers for soil and fertilizer nitrogen research. Advances in Agronomy. 28: 219-266. Haynes, R.J. & Swift, R.S. (1986). Effect of soil acidification and subsequent leaching on levels of extractable nutrients in a soil. Plant and Soil, 95: 327-336. Haynes, R.J. & Swift, R.S. (1987). Effect of trickle fertigation with three forms of nitrogen on soil pH, levels of extractable nutrients below the emitter and plant growth. Plant and Soil, 102: 211-221. Hoogmoed, W.B. & Bouma, J. (1980). A simulation model for predicting infiltration into cracked clay soil. Soil Sei. Soc. Am. J., 44(3): 458-461. Howard, D.M. & Howard, P.J.A. (1993). Relationships between C02 evolution, moisture content and temperature for a range of soil types. Soil Biol. Biochem., 25(11): 1537-1546. Hubble, G.D. (1984). The cracking clay soils: definition, distribution, nature, genesis and use. In: McGarity, J., Hoult, E.H. & So, H.B. (eds.). Properties and Utilization of Cracking Clay
187
References
Soils, Reviews in Rural Science # 5. University of New England, Armidale, New South Wales, Australia, pp. 3-13. IBSRAM (1989). Vertisols Management in Africa. IBSRAM Proc # 9, IBSRAM: Bangkok. IBSRAM (1992). AFRICALAND: Management of Vertisols in Africa. Network Doc, # 3. IBSRAM: Bangkok. ICRISAT (1989). Management of Vertisols for improved agricultural production. ICRISAT report. ICRISAT: India. ICRAF (1995). Laboratory Methods for Soil and Plant Analysis. ICRAF: Nairobi, Kenya. Ikitoo, E.C. (1989). Some properties of Vertisols in Kenya and their current level of management for crop production. In: Vertisol Management in Africa, IBSRAM Proc. # 9, pp. 193-208. IBSRAM: Bangkok. Jaetzold, R. & Schmidt, H. (1982). Farm Management Handbook of Kenya, VolII/A. West Kenya. MoA: Nairobi, Kenya. Janssen, B.H., Guiking, F.C.T., van der Eijk, D., Smaling, E.M.A., Wolf, J. and van Reuier, H. (1990). A system for quantitative evaluation of the fertility of tropical soils (QUEFTS). Geoderma, 46: 299-318. Jarvis, S.C., Barraclough, D., Williams, J. & Rook, A.J. (1991). Patterns of denitrification loss from grazed grassland: Effect of N fertilizer inputs at different sites. Plant and Soil, 131: 77-88. Jarvis, S.C. & Hatch, D.J. (1994). Potential for denitrification at depth below long-term grass swards. Soil Biol. Biochem., 26(12): 1629-1636. Jasson, S.L. (1958). Tracer studies on nitrogen transformations in soil with attention to mineralisation-immobilization relationships. Annals of the Royal Agricultural College of Sweden, 24: 101-361. Jayaweera, G.R. & Mikkelsen, D.S. (1991). Assessment of ammonia volatilization from flooded soil systems. Adv. Agron., 45: 303-356. Jenkinsori, D.S., Fox, R.H. & Rayner, J.H. (1985). Interactions between fertilizer nitrogen and soil nitrogen - the so-called 'priming effect'. J. Soil Sei., 36:425-444. Jokela, W.E. & Randall, G.W. (1989). Corn yield and residual soil nitrate as affected by time and rate of nitrogen application. Agron. J., 81: 720-726. Jones, M.J. (1976). Effects of three nitrogen fertilizers and lime on pH and exchangeable cation content at different depth in cropped soils at two sites in the Nigerian Savanna. Trop. Agric. (Trinidad), 53(3): 243-254. Jorgensen, R.G. & Richter, G.M. (1992). Composition of carbon fractions and potential denitrification in drained peat soils. J. Soil Sei., 43: 347-358. Jung, P.E., Peterson, L.A. & Schrader, L.E. (1972). Response of irrigated corn to time, rate and source of applied N on sandy soils. Agron. J. 64: 668 - 670. Kamphorst, A. & El Bhanasawy, N. (1988). Experimental laboratory simulation of the leaching of salt from an aggregate of a cracking clay soil. In: Classification, Management and Use Potential of Swell-Shrink Soils, pp. 101-106. Transactions International Workshop on Swell-Shrink Soils, Nagpur, India.
188
References
Kamukondiwa, W. & Bergstrom, L. (1994a). Leaching and crop recovery of 15N from ammonium sulphate and labelled maize (Zea mays) material in lysimeters at a site in Zimbabwe. Plant and Soil, 162: 193-201.
Kamukondiwa, W. & Bergstrom, L. (1994b). Nitrate leaching in field lysimeters at an agricultural site in Zimbabwe. Soil Use and Management, 10: 118-124. Kang, M.S. & Gorman, D.P. (1989). Genotype * environment interaction in maize. Agron. L, 81: 662-664. KARI (1991). Kenya's Agricultural Research Priorities to the Year 2000. Kenya Agricultural Research Institute: Nairobi, Kenya. Keller, G.D. & Mengel, D.B. (1986). Ammonia volatilization from nitrogen fertilizers surface applied to no-till corn. Soil Sei. Soc. Am. J„ 50: 1060-1063. Kelly, K.R. & Stevenson, F.J. (1995). Forms and nature of organic N in soil. Fert. Res.. 42:
1-11. Killorn, R. & Zourarakis, D. (1992). Nitrogen fertilizer management effects on corn grain
yield and nitrogen uptake. J. Prod. Agric, 5(1): 142-148. Kissel, D.E. & Cabrera, M.L. (1988). Factors affecting urea hydrolysis, In: Bock, B.R. & Kissel, D.E. (eds.). Ammonia Volatilization from Urea Fertilizers, pp. 53-66. NFDC, TVA: Muscle Shoals, Alabama. Klemedtsson, L. Simkins, S., Svensson, Bo. H., Johnsson, H. & Rosswall, T. (1991). Soil denitrification in three cropping systems characterized by differences in nitrogen and carbon supply. II. Water and NO-, effects on denitrification process. Plant and Soil, 138: 273-286. Klute, A. (1973). Soil water flow theory and its application in field situations. In: Bruce, R.R., Flach, K.W. and Taylor, H.M. (eds.). Field Soil Water Regime, SSSA- Special Publ.
Series # 5. SSSA: Madison Wise, USA. pp. 9-31. Knowles, R. (1982a). Denitrification, Microbiol. Rev., 46:43-70. Knowles, R. (1982b). Denitrification in soils. In: Subba Rao, N.S. (ed.). Advances in Agricultural Microbiology, pp. 243-266. Butterworth Scientific: London. Koelliker, J.K. & Kissel, D.E. (1988). Chemical equilibria affecting ammonia volatilization. In: Bock, B.R. & Kissel, D.E. (eds.). Ammonia Volatilization from Urea Fertilizers, pp. 37-
52. NFDC, TVA: Muscle Shoals, Alabama. Koops, J.G., Oenema, O. & Van Beusichem, M.L. (1996). Denitrification in the top and sub soil of grassland on peat soils. Plant and Soil, 184: 1-10. Kowalenko, C.G. & Cameron, D.R. (1976). Nitrogen transformations in an incubated soil as affected by combinations of moisture content and temperature and adsorption-fixation of ammonium. Can. J. Soil Sei., 56: 63-70. Kroeze, C , Van Faassen, H.G. & Ruiter, P.C. (1989). Potential denitrification rates in acid soils under pine forest, Netherlands J. Agric. Sei., 37: 345-354. Kuchenbuch, R.O. & Barber, S.A. (1988). Significance of temperature and precipitation for maize root distribution in the field. Plant and Soil, 106: 9-14. Landon, J.R. (ed.). (1991). Booker Tropical Soil Manual. Longman: New York. Laura, R.D. (1975). On the priming effect of ammonium fertilizers. Soil Sei. Soc. Amer.
Proa, 39: 385.
189

References
Le Mare, P.H. (1989). Chemical fertility characteristics of Vertisols. In: IBSRAM. Management of Vertisols under semi-arid conditions, IBSRAM Proc. # 6, pp. 125-136, IBSRAM: Bangkok. Letey, J. (1985). Relationship between soil physical properties and crop production. Adv. Soil Sei., 1: 277-294. Linn, D. M. & Doran, J. W. (1984a). Aerobic and anaerobic microbial populations in no-till and plowed soils. Soil Sei. Soc. Am. J., 48: 794-799. Linn, D. M. & Doran, J. W. (1984b). Effect of water-filled pore space on carbon dioxide and nitrous oxide production in tilled and non-tilled soils. Soil Sei. Soc. Am. J„ 48: 1267-1272. Logsdon, S.D. (1995). Flow mechanisms through continuous and burried macropores. Soil Science, 160(4): 237-242. Lu, D.Q., Chien, S.H., Henao, J. & Sompongse, D. (1987). Evaluation of short-term efficiency of diammonium phosphate versus urea-plus-single superphosphate on a calcareous soil. Agron. J. 79: 896-900. Mackay, A.D. & Barber, S.A. (1985). Soil moisture effects on root growth and phosphorus uptake by corn. Agron. J„ 77: 519-523. Mackay, A.D. & Barber, S.A. (1986). Effect of nitrogen on root growth of two corn genotypes in the field. Agron. J. 78: 699-703. Malhi, S.S., Nyborg, M. & Solberg, E.D. (1990). Potential for nitrate-N loss in central Alberta soils. Fert. Res., 25: 175-178. Mannheim, T., Braschkat, J. & Marschner, H. (1994). Measurement of ammonia emission after liquid manure application: II. Comparison of the wind tunnel and the IHF method under field conditions. Z. Pflanzenernähr. Bodenk., 158: 215-219. Marschner, H. (1986). Mineral Nutrition of Higher Plants. Academic Press: London. Marshall, V.G. & Debbel, D.S. (1980). Comparisons of four methods of measuring volatilization losses of nitrogen following urea fertilization of forest soils. Can. J. Soil Sei., 60: 549-563. Mary, B., Recous, S. & Machet, J.M. (1988). A comprehensive approach to the assessment of the fertilizer part of plant nitrogen uptake. In: Jenkinson, D.S. & Smith, K.A. (eds.). Nitrogen efficiency in agricultural soils. Elsevier: London, pp. 85-94. McCarty, G.W. & Bremner, J.M. (1992). Availability of organic carbon for denitrification of nitrate in subsoils. Biol. Fertil. Soils, 14: 219-222. McCarty, G.W. & Bremner, J.M. (1993). Factors affecting the availability of organic carbon for denitrification of nitrate in subsoils. Biol. Fertil. Soils, 15: 132-136. McKenney, D.J., Wang, S.W., Drury, CF. & Findlay, W.I. (1993). Denitrification and mineralization in soil amended with legume, grass, and corn residues. Soil Sei. Soc. Am.J,, 57: 1013-1020. Mengel, K. & Kirkby, E.A. (1987). Principles of Plant Nutrition, 4th. Edn. International Potash Institute: Bern. Mochoge, B.O. (1984). Simulation of nitrate movement in undisturbed soil columns. Agric. Ecosys. Environ., 11: 105-115.
190
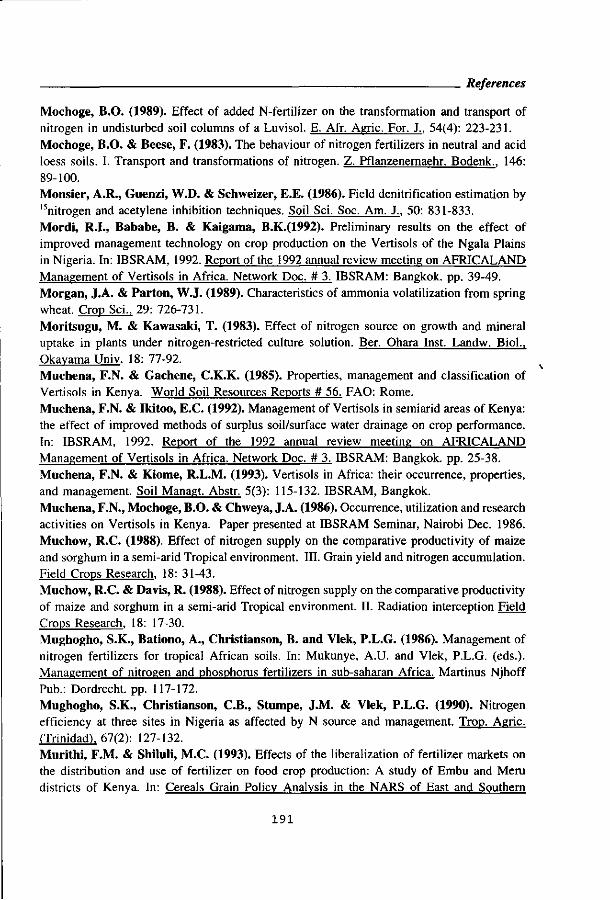
References
Mochoge, B.O. (1989). Effect of added N-fertilizer on the transformation and transport of nitrogen in undisturbed soil columns of a Luvisol. E. Afr. Agric. For, J,, 54(4): 223-231. Mochoge, B.O. & Beese, F. (1983). The behaviour of nitrogen fertilizers in neutral and acid loess soils. I. Transport and transformations of nitrogen. Z. Pflanzenernaehr. Bodenk.. 146: 89-100. Monsier, A.R., Guenzi, W.D. & Schweizer, E.E. (1986). Field denitrification estimation by l5nitrogen and acetylene inhibition techniques. Soil Sei. Soc. Am. J., 50: 831-833. Mordi, R.I., Bababe, B. & Kaigama, B.K.(1992). Preliminary results on the effect of improved management technology on crop production on the Vertisols of the Ngala Plains in Nigeria. In: IBSRAM, 1992. Report of the 1992 annual review meeting on AFRICALAND Management of Vertisols in Africa. Network Doc. # 3. IBSRAM: Bangkok, pp. 39-49. Morgan, J.A. & Parton, W.J. (1989). Characteristics of ammonia volatilization from spring wheat. Crop Sei., 29: 726-731. Moritsugu, M. & Kawasaki, T. (1983). Effect of nitrogen source on growth and mineral uptake in plants under nitrogen-restricted culture solution. Ber. Ohara Inst. Landw. Biol.. Okavama Univ. 18: 77-92. Muchena, F.N. & Gachene, C.K.K. (1985). Properties, management and classification of Vertisols in Kenya. World Soil Resources Reports # 56. FAO: Rome. Muchena, F.N. & Ikitoo, E.C. (1992). Management of Vertisols in semiarid areas of Kenya: the effect of improved methods of surplus soil/surface water drainage on crop performance. In: IBSRAM, 1992. Report of the 1992 annual review meeting on AFRICALAND Management of Vertisols in Africa. Network Doc. # 3. IBSRAM: Bangkok, pp. 25-38. Muchena, F.N. & Kiome, R.L.M. (1993). Vertisols in Africa: their occurrence, properties, and management. Soil Managt. Abstr. 5(3): 115-132. IBSRAM, Bangkok. Muchena, F.N., Mochoge, B.O. & Chweya, J.A. (1986). Occurrence, utilization and research activities on Vertisols in Kenya. Paper presented at IBSRAM Seminar, Nairobi Dec. 1986. Muchow, R.C. (1988). Effect of nitrogen supply on the comparative productivity of maize and sorghum in a semi-arid Tropical environment. III. Grain yield and nitrogen accumulation. Field Crops Research, 18: 31-43. Muchow, R.C. & Davis, R. (1988). Effect of nitrogen supply on the comparative productivity of maize and sorghum in a semi-arid Tropical environment. II. Radiation interception Field Crops Research, 18: 17-30. Mughogho, S.K., Bationo, A., Christiansen, B. and Vlek, P.L.G. (1986). Management of nitrogen fertilizers for tropical African soils. In: Mukunye, A.U. and Vlek, P.L.G. (eds.). Management of nitrogen and phosphorus fertilizers in sub-saharan Africa. Martinus Njhoff Pub.: Dordrecht, pp. 117-172. Mughogho, S.K., Christianson, C.B., Stumpe, J.M. & Vlek, P.L.G. (1990). Nitrogen efficiency at three sites in Nigeria as affected by N source and management. Trop. Agric. (Trinidad), 67(2): 127-132. Murithi, F.M. & Shiluli, M.C. (1993). Effects of the liberalization of fertilizer markets on the distribution and use of fertilizer on food crop production: A study of Embu and Meru districts of Kenya. In: Cereals Grain Policy Analysis in the NARS of East and Southern
191
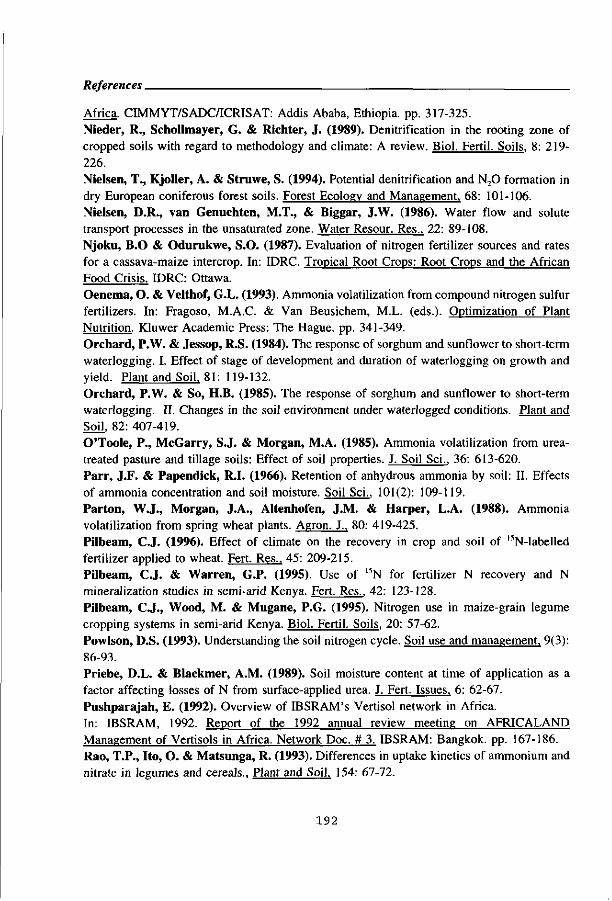
References
Africa. CIMMYT/SADC/ICRISAT: Addis Ababa, Ethiopia, pp. 317-325. Nieder, R., Schollmayer, G. & Richter, J. (1989). Denitrification in the rooting zone of cropped soils with regard to methodology and climate: A review. Biol. Fertil. Soils. 8: 219-226.
Nielsen, T., Kjoller, A. & Struwe, S. (1994). Potential denitrification and N 20 formation in dry European coniferous forest soils. Forest Ecology and Management. 68: 101-106. Nielsen, D.R., van Genuchten, M.T., & Biggar, J.W. (1986). Water flow and solute transport processes in the unsaturated zone. Water Resour. Res.. 22: 89-108. Njoku, B.O & Odurukwe, S.O. (1987). Evaluation of nitrogen fertilizer sources and rates for a cassava-maize intercrop. In: IDRC. Tropical Root Crops: Root Crops and the African Food Crisis. IDRC: Ottawa.
Oenema, O. & Veithof, G.L. (1993). Ammonia volatilization from compound nitrogen sulfur fertilizers. In: Fragoso, M.A.C. & Van Beusichem, M.L. (eds.). Optimization of Plant Nutrition. Kluwer Academic Press: The Hague, pp. 341-349.
Orchard, P.W. & Jessop, R.S. (1984). The response of sorghum and sunflower to short-term waterlogging. I. Effect of stage of development and duration of waterlogging on growth and yield. Plant and Soil, 81: 119-132. Orchard, P.W. & So, H.B. (1985). The response of sorghum and sunflower to short-term waterlogging. II. Changes in the soil environment under waterlogged conditions. Plant and Soil, 82: 407-419.
O'Toole, P., McGarry, S.J. & Morgan, M.A. (1985). Ammonia volatilization from urea-treated pasture and tillage soils: Effect of soil properties. J. Soil Sei., 36: 613-620. Parr, J.F. & Papendick, R.I. (1966). Retention of anhydrous ammonia by soil: II. Effects of ammonia concentration and soil moisture. Soil Sei., 101(2): 109-119. Parton, W.J., Morgan, J.A., Altenhofen, J.M. & Harper, L.A. (1988). Ammonia volatilization from spring wheat plants. Agron. J., 80: 419-425.
Pilbeam, C.J. (1996). Effect of climate on the recovery in crop and soil of l5N-labelled fertilizer applied to wheat. Fert. Res., 45: 209-215. Pilbeam, C.J. & Warren, G.P. (1995). Use of 15N for fertilizer N recovery and N mineralization studies in semi-arid Kenya. Fert. Res., 42: 123-128. Pilbeam, C.J., Wood, M. & Mugane, P.G. (1995). Nitrogen use in maize-grain legume cropping systems in semi-arid Kenya. Biol. Fertil. Soils, 20: 57-62. Powlson, D.S. (1993). Understanding the soil nitrogen cycle. Soil use and management, 9(3): 86-93.
Priebe, D.L. & Blackmer, A.M. (1989). Soil moisture content at time of application as a factor affecting losses of N from surface-applied urea. J. Fert. Issues, 6: 62-67. Pushparajah, E. (1992). Overview of IBSRAM's Vertisol network in Africa. In: IBSRAM, 1992. Report of the 1992 annual review meeting on AFRICALAND Management of Vertisols in Africa. Network Doc. # 3. IBSRAM: Bangkok, pp. 167-186. Rao, T.P., Ito, O. & Matsunga, R. (1993). Differences in uptake kinetics of ammonium and nitrate in legumes and cereals., Plant and Soil. 154: 67-72.
192
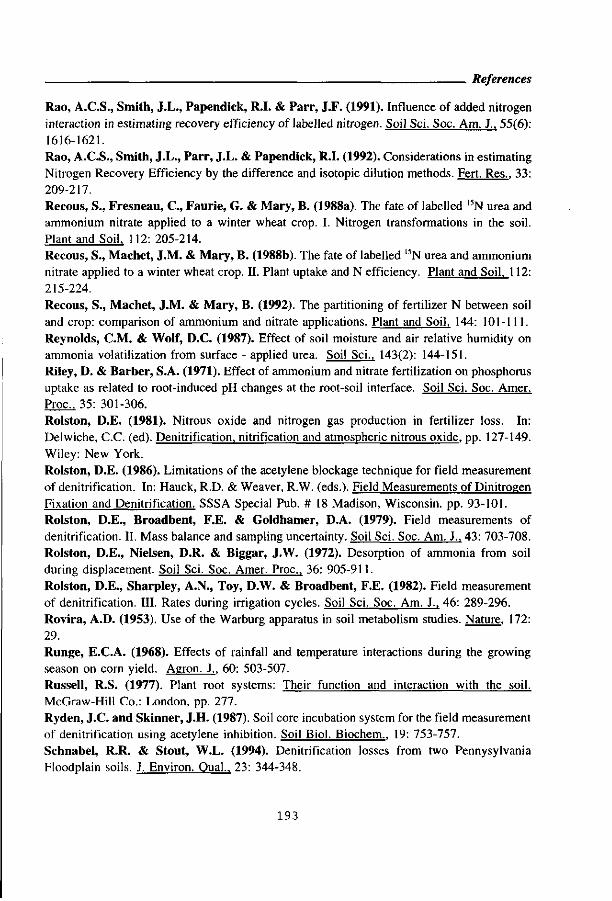
References
Rao, A.C.S., Smith, J.L., Papendick, R.I. & Parr, J.F. (1991). Influence of added nitrogen interaction in estimating recovery efficiency of labelled nitrogen. Soil Sei. Soc. Am. J„ 55(6): 1616-1621. Rao, A.C.S., Smith, J.L., Parr, J.L. & Papendick, R.I. (1992). Considerations in estimating
Nitrogen Recovery Efficiency by the difference and isotopic dilution methods. Fert. Res., 33: 209-217. Recous, S., Fresneau, C , Faurie, G. & Mary, B. (1988a). The fate of labelled 15N urea and ammonium nitrate applied to a winter wheat crop. I. Nitrogen transformations in the soil. Plant and Soil, 112: 205-214. Recous, S., Machet, J.M. & Mary, B. (1988b). The fate of labelled "N urea and ammonium nitrate applied to a winter wheat crop. II. Plant uptake and N efficiency. Plant and Soil. 112: 215-224. Recous, S., Machet, J.M. & Mary, B. (1992). The partitioning of fertilizer N between soil and crop: comparison of ammonium and nitrate applications. Plant and Soil, 144: 101-111. Reynolds, C M . & Wolf, D.C. (1987). Effect of soil moisture and air relative humidity on ammonia volatilization from surface - applied urea. Soil Sei., 143(2): 144-151. Riley, D. & Barber, S.A. (1971). Effect of ammonium and nitrate fertilization on phosphorus uptake as related to root-induced pH changes at the root-soil interface. Soil Sei. Soc. Amer. Proa, 35: 301-306. Rolston, D.E. (1981). Nitrous oxide and nitrogen gas production in fertilizer loss. In: Delwiche, C.C. (ed). Denitrification, nitrification and atmospheric nitrous oxide, pp. 127-149.
Wiley: New York. Rolston, D.E. (1986). Limitations of the acetylene blockage technique for field measurement of denitrification. In: Hauck, R.D. & Weaver, R.W. (eds.). Field Measurements of Dinitrogen Fixation and Denitrification. SSSA Special Pub. # 18 Madison, Wisconsin, pp. 93-101. Rolston, D.E., Broadbent, F.E. & Goldhamer, D.A. (1979). Field measurements of denitrification. II. Mass balance and sampling uncertainty. Soil Sei. Soc. Am. J„ 43: 703-708. Rolston, D.E., Nielsen, D.R. & Biggar, J.W. (1972). Desorption of ammonia from soil during displacement. Soil Sei. Soc. Amer. Proa, 36: 905-911. Rolston, D.E., Sharpley, A.N., Toy, D.W. & Broadbent, F.E. (1982). Field measurement
of denitrification. III. Rates during irrigation cycles. Soil Sei. Soc. Am. J., 46: 289-296. Rovira, A.D. (1953). Use of the Warburg apparatus in soil metabolism studies. Nature, 172: 29. Runge, E.C.A. (1968). Effects of rainfall and temperature interactions during the growing season on corn yield. Agron. J., 60: 503-507. Russell, R.S. (1977). Plant root systems: Their function and interaction with the soil. McGraw-Hill Co.: London, pp. 277. Ryden, J.C. and Skinner, J.H. (1987). Soil core incubation system for the field measurement of denitrification using acetylene inhibition. Soil Biol. Biochem., 19: 753-757. Schnabel, R.R. & Stout, W.L. (1994). Denitrification losses from two Pennysylvania Floodplain soils. J. Environ. Qual., 23: 344-348.
193
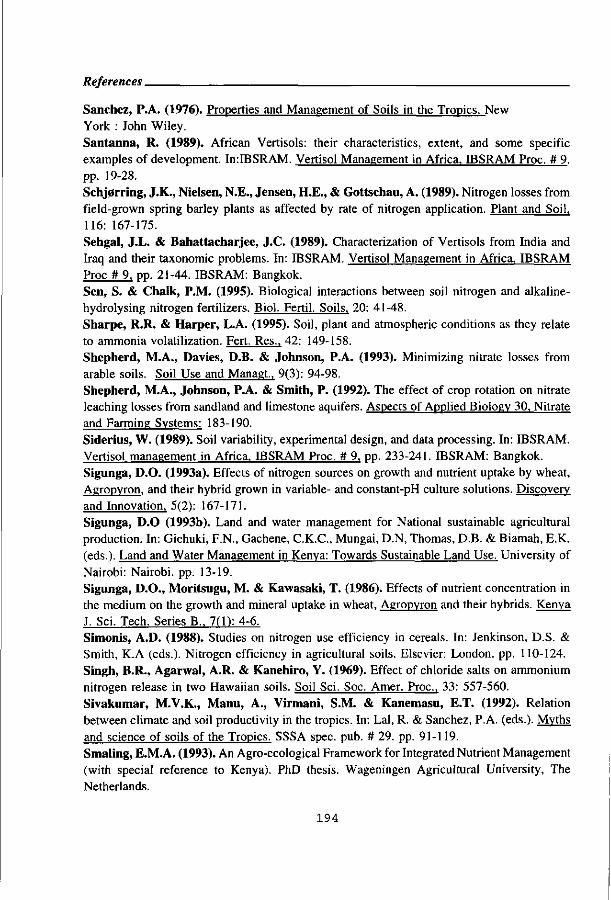
References
Sanchez, P.A. (1976). Properties and Management of Soils in the Tropics. New York : John Wiley. Santanna, R. (1989). African Vertisols: their characteristics, extent, and some specific examples of development. In:IBSRAM. Vertisol Management in Africa, IBSRAM Proc. # 9. pp. 19-28. Schj0rring, J.K., Nielsen, N.E., Jensen, H.E., & Gottschau, A. (1989). Nitrogen losses from field-grown spring barley plants as affected by rate of nitrogen application. Plant and Soil, 116: 167-175. Sehgal, J.L. & Bahattacharjee, J.C. (1989). Characterization of Vertisols from India and Iraq and their taxonomie problems. In: IBSRAM. Vertisol Management in Africa, IBSRAM Proc # 9, pp. 21-44. IBSRAM: Bangkok. Sen, S. & Chalk, P.M. (1995). Biological interactions between soil nitrogen and alkaline-hydrolysing nitrogen fertilizers. Biol. Fertil. Soils, 20: 41-48. Sharpe, R.R. & Harper, L.A. (1995). Soil, plant and atmospheric conditions as they relate to ammonia volatilization. Fert. Res., 42: 149-158. Shepherd, M.A., Davies, D.B. & Johnson, P.A. (1993). Minimizing nitrate losses from arable soils. Soil Use and Managt., 9(3): 94-98. Shepherd, M.A., Johnson, P.A. & Smith, P. (1992). The effect of crop rotation on nitrate leaching losses from sandland and limestone aquifers. Aspects of Applied Biology 30, Nitrate and Farming Systems: 183-190. Siderius, W. (1989). Soil variability, experimental design, and data processing. In: IBSRAM. Vertisol management in Africa, IBSRAM Proc. # 9, pp. 233-241. IBSRAM: Bangkok. Sigunga, D.O. (1993a). Effects of nitrogen sources on growth and nutrient uptake by wheat, Agropyron, and their hybrid grown in variable- and constant-pH culture solutions. Discovery and Innovation, 5(2): 167-171. Sigunga, D.O (1993b). Land and water management for National sustainable agricultural production. In: Gichuki, F.N., Gachene, C.K.C., Mungai, D.N, Thomas, D.B. & Biamah, E.K. (eds.). Land and Water Management in Kenya: Towards Sustainable Land Use. University of Nairobi: Nairobi, pp. 13-19. Sigunga, D.O., Moritsugu, M. & Kawasaki, T. (1986). Effects of nutrient concentration in the medium on the growth and mineral uptake in wheat, Agropyron and their hybrids. Kenya J. Sei. Tech. Series B„ 7(1): 4-6. Simonis, A.D. (1988). Studies on nitrogen use efficiency in cereals. In: Jenkinson, D.S. & Smith, K.A (eds.). Nitrogen efficiency in agricultural soils. Elsevier: London, pp. 110-124. Singh, B.R., Agarwal, A.R. & Kanehiro, Y. (1969). Effect of chloride salts on ammonium nitrogen release in two Hawaiian soils. Soil Sei. Soc. Amer. Proc, 33: 557-560. Sivakumar, M.V.K., Manu, A., Virmani, S.M. & Kanemasu, E.T. (1992). Relation between climate and soil productivity in the tropics. In: Lai, R. & Sanchez, P.A. (eds.). Myths and science of soils of the Tropics. SSSA spec. pub. # 29. pp. 91-119. Smaling, E.M.A. (1993). An Agro-ecological Framework for Integrated Nutrient Management (with special reference to Kenya). PhD thesis. Wageningen Agricultural University, The Netherlands.
194

References
Smaling, E.M.A. & Bouma, J. (1992). Bypass flow and leaching of nitrogen in a Kenyan Vertisol at the onset of the growing season. Soil Use and Management, 8: 44-48. Smettem, K.R.J., Trudgill, S.T. & Pickles, A.M. (1983). Nitrate loss in soil drainage waters in relation to by-pass flow and discharge on an arable site. J. Soil Sei., 34: 499-509. Smith, C. J. (1988). Denitrification in the field. In: Wilson, J. R. (ed.). Advances in nitrogen cycling in agricultural ecosystems. CAB Int.: Wallingford, UK.
Smith, F.W. & Jackson, W.A. (1987a). Nitrogen enhancement of phosphate transport in roots of Zea mays L. I. Effects of ammonium and nitrate pretreatment. Plant Physiol.. 84: 1314-1318.
Smith, F.W. & Jackson, W.A. (1987b). Nitrogen enhancement of phosphate transport in roots of Zea mays L. II. Kinetic and inhibitor studies. Plant Physiol., 84: 1319-1324. Smith, R.L., Mills, H.A. Hoveland, CS. , & Hanna, W.W. (1990). Influence of ammonium-nitrate ratios on the growth and nitrogen uptake of pearl millet. Journal of Plant Nutrition, 13(5): 541-553.
Soil Survey Staff (1990). Keys to Soil Taxonomy. SMSS Techn. Mono. # 19. Virginia Polytechnic Inst. & State University: Blacksburg, VA. Sombroek, W.G., Braun, H.M.H. & Van der Pouw, B.J.A. (1982). Exploratory Soil Map and Agro-Climatic Zone Map of Kenya. Scale 1 : IM. KSS: Nairobi, Kenya. Srivastava, K.L. (1992). Management of Vertisols in Africa: ICRISAT'S experience. In: IBSRAM, 1992. Report of the 1992 annual review meeting on AFRICALAND Management of Vertisols in Africa. Network Doc. # 3. IBSRAM: Bangkok, pp. 131-139. Ssali, H. (1990). Initial and residual effects of nitrogen fertilizers on grain yield of a maize/bean intercrop grown on a Humic Nitosol and the fate and efficiency of the applied nitrogen. Fert. Res., 23: 63-72.
Stanford, G., Vander, R.A. & Dzienia, S. (1975). Denitrification rates in relation to total and extractable soil carbon, Soil Sei. Soc. Amer. Proc, 39: 284-289. Starr, J.L. & Parlange, J.Y. (1975). Nonlinear denitrification kinetics with continuous flow columns. Soil Sei. Soc. Am. Proc, 39: 875-880. Stevenson, F.J. (1986). Cycles of soil: Carbon, Nitrogen, Phosphorus, Sulfur, and Micronutrients. John Wiley & Sons: New York. Stolzy, L.H. & Letey, J. (1964). Measurement of oxygen diffusion rates with platinum microelectrode. III. Correlation of plant response to soil oxygen diffusion rates. Hilgardia, 35(20): 567-576.
Stoorvogel, J.J., Smaling, E.M.A. & Janssen, B.H. (1993). Calculating soil nutrient balances in Africa at different scales. I. Supra-national scale. Fert. Res., 35(3): 237-250. Svensson, Bo. H., Klemedtsson, L., Simkins, S., Paustian, K. & Rosswall, T. (1991). Soil denitrification in three cropping systems characterized by differences in nitrogen and carbon supply. I. Rate-distribution frequencies comparison between systems and seasonal N losses. Plant and Soil, 138: 257-271.
Sylvester-Bradley, R. (1993). Scope for more efficient use of fertilizer nitrogen. Soil Use and Managt., 9(3): 112-117.
195
References
Tandon, H.L.S. (1989). Secondary and Micronutrient Recommendations for Soils and Crops: A Guidebook. Fertilizer Development Consultation Org: New Delhi. Terman, G.L. & Brown, M.A. (1968). Crop recovery of applied fertilizer nitrogen. Plant and Soil, XXIX(l): 48-65. Terry, D.L. & McCants, C.B. (1973). Estimating the leaching of ammonium and nitrate nitrogen, potassium, and magnesium in certain north Carolina soils. North Carolina Agric. Expt. Station, Tech. Bui. # 221. Thomas, G.W. (1980). Delayed nitrogen applications on corn. Soil Sei. News and Views, l(2):l-2. Thomas, G.W. & Phillips, R.E. (1979). Consequences of water movement in macropores. J. Environ. Qual., 8: 149-152. Thompson, L.M. (1986). Climatic change, weather variability, and corn production. Agron. L, 78: 649-653. Tiedje, J.M., Sextone, A.J., Parkin, T.B. & Revsbech, N.P. (1984). Anaerobic processes in soil, Plant and Soil, 76: 197-212. Tiedje, J.M., Simkins, S. and Groffman, P.M. (1989). Perspectives of measurement of denitrification in the field including recommended protocols for acetylene based methods, Plant and Soil, 115: 261-284. Tills. A.R. & Alloway, B.J. (1981). The effects of ammonium and nitrate nitrogen source on copper uptake and amino acid status of cereals. Plant and Soil. 62: 279- 290. Tisdale, S.L., Nelson, W.L., & Beaton, J.D.(1985). Soil Fertility and Fertilizers, 4th edn. MacMillan: New York Tollenar, M. (1989). Response of dry matter accumulation of maize to temperature: II. Leaf photosynthesis. Crop Science, 29: 1275-1279. Torbert, H.A., Hoeft, R.G. Vanden Heuvel R.M. & Mulvaney, R.L. (1992). Effect of moisture regime on recovery and utilization of fertilizer N applied to corn. Commun. Soil Sei. Plant Anal. 23(13 & 14): 1409-1426. Touchton, J.T. & Hargrove, W.L. (1982). Nitrogen sources and methods of application for no-tillage corn production. Agron. J., 74: 823-826. Trudell, M.R., Gillham, R.W., & Cherry, J.A.(1986). An in-situ study of the occurrence and rate of denitrification in a shallow unconfined sand aquifer. J. Hydro. 83: 251-268. Tsai, C.Y., Huber, D.M., Glover, D.V. & Warren, H.L. (1984). Relationship of N deposition to grain yield and N response of three maize hybrids. Crop Sei., 24: 277-281. Van Duivenbooden, N., De Wit, C.T. & Van Keulen, H. (1996). Nitrogen, phosphorus and potassium relations in five major cereals reviewed in respect to fertilizer recommendations using simulation modelling. Fert. Res., 44: 37-49. Van Ommen, H.C., Dekker, L.W., Dijksma, R., Hulshof, J.& Vander Molen, W.H. (1988). A new technique for evaluating the presence of preferential flow paths in non-structured soils. Soil Sei. Soc. Am. J„ 52: 1192-1193. Varvel, G.E. & Peterson, T.A. (1990). Nitrogen fertilizer recovery by corn in monoculture and rotation systems. Agron. J., 82: 935-938. Vlek, P.L.G. & Stumpe, J.M. (1978). Effect of solution chemistry and environmental
196
References
conditions on ammonia volatilization losses from aqueous systems. Soil Sei. Soc, Am. J.. 42: 416-421. Warrington, I.J. & Kanemasu, E.T. (1983). Corn growth response to temperature and photoperiod. I: Seedling emergence, tassel initiation, and anthesis. Agron. J., 75: 749-754. Weier, K.L., Doran, J.W., Power, J.F. & Walters, D.T. (1993a). Denitrification and the dinitrogen/nitrous oxide ratio as affected by soil water, available carbon, and nitrate. Soil Sei. Soc. Am. J„ 57: 66-72. Weier, K.L., MacRae, I.C. & Myers, R.J.K. (1993b). Denitrification in a clay soil under pasture and annual crop: Losses from 15N-labelled nitrate in the subsoil in the field using C2H2
inhibition. Soil Biol Biochem., 25(8): 999-1004. Weier, K.L., MacRae, I.C. & Myers, R.J.K. (1991). Seasonal variation in denitrification in a clay soil under a cultivated crop and a permanent pasture. Soil Biol. Biochem., 23(7): 629-635. Westerman, R.L. & Kurtz L.T. (1973). Priming effect of l5N-labelled fertilizers on soil nitrogen in field experiments. Soil Sei. Soc. Amer. Proc, 37: 725-727. Westerman, R.L. & Kurtz, L.T. (1974). Isotopic and non-isotopic estimations of fertilizer nitrogen uptake by Sudan grass in field experiments. Soil Sei. Soc. Amer. Proc, 38: 107-109. Westerman, R.L. & Tucker, T.C. (1974). Effects of salts and salts plus nitrogen-15-labelled ammonium chloride on mineralization of soil nitrogen, nitrification, and immobilization. Soil Sei. Soc. Amer. Proc, 38: 602-605. Wetselaar, R. & Farquhar, G.D. (1980). Nitrogen losses from tops of plants. Adv. Agron., 33: 263-302. White, R.E. (1985). The influence of macropores on the transport of dissolved suspended matter through soil. Adv. Soil Sei., 3: 95-121. White, R.E., Dyson, J.S., Haigh, J.A., Jury, W.A. & Sposito, G. (1986). A transfer function model of solute transport through soil. II. Illustrative applications. Water Resour. Res., 22: 248-254. White, R.F., Kempthorne, O., Black, C.A. & Webb, J.R. (1956). Fertilizer evaluation: II. Estimation of availability coefficients. Soil Sei. Soc. Proc, 1956, pp. 179-186. Whitehead, D.C. & Raistrick, N. (1990). Ammonia volatilization from five nitrogen compounds used as fertilizers following surface application to soils. J. Soil Sei., 41: 387-394. Wielemaker, W.G. & Boxem, H.W. (1982). Soils of the Kisii area, Kenya. Agric Res. Report 922. PUDOC, Wageningen. Wiesler, F. & Horst, W.J. (1994a). Root growth of maize cultivars under field conditions as studied by the core and minirhizotron methods and relationships to shoot growth. Z^ Pflanzenernaehr. Bodenk., 157: 351-358. Wiesler, F. & Horst, W.J. (1994b). Root growth and nitrate utilization of maize cultivars under field conditions. Plant and Soil, 163: 267-277. Wilding, L.P. & Tessier, D. (1988). Genesis of Vertisols: shrink-swell phenomena. In: L.P. Wilding and R. Puentes (eds.), Vertisols: Their distribution, properties, classification and management. SMSS Techn. Mono. # 18, Texas A & M University pp. 55-79. Woodhead, T. (1968). Studies of potential evaporation in Kenya. E A AFRO, Nairobi, Kenya.
197
References
Yeomans, J.C., Bremner, J.M. & McCarty, G.W. (1992). Denitrification capacity and denitrification potential of subsurface soils. Zwarich, M.A. & Shaykewich, C.F. (1969). An evaluation of several methods of measuring bulk densities of soils. Can. J. Soil Sei., 49: 241-245.
198
SUMMARY
Vertisols, occupying about 2.8 million hectares of land in Kenya, occur in different agroclimatic conditions in the country. Main food crops commonly produced on these soils include maize, sorghum, millet and various legumes and vegetables. Maize is the staple food crop grown by almost every household engaged in farming in Kenya. Nitrogen is the most limiting nutrient to maize production in Kenyan Vertisols, and yet the crop's response to applied fertilizer N is low. The objectives of this research were to understand and quantify the effects of fertilizer N sources, and management practices, namely N application rate, timing and splitting, and provision of drainage on (i) fertilizer N losses through denitrification, NH3-volatilization, and bypass flow, (ii) fertilizer N use efficiency by maize considering agronomic, recovery, physiological N efficiencies, and (iii) uptake of nutrients other than N.
Both laboratory- and field-based experiments were carried out. Laboratory investigations on factors influencing denitrification, NH3-volatilization, and bypass flow were conducted under controlled laboratory conditions in order to study the effects of specific factors on the processes, and to determine the relative importance of the factors on the processes. In the case of denitrification experiments, Phaoezem - a perfectly draining soil - was included for comparison with Vertisol. Field-based experiments were conducted in two years at two sites in Kenya to test various management options. The field trials addressed three issues: (i) the effects of drain depths on temporal soil moisture variation, and maize rooting depth, (ii) interactive effects of drain depth * N source * time of N application on nitrogen use efficiency (NUE), and (iii) interactive effects of maize genotype * N source * N rate on NUE.
The influence of soil moisture content, available C, as well as N rate and N source on denitrification were investigated and reported in Chapter 5. The results showed that the critical soil moisture level for denitrification to commence was 60% of water holding capacity (WHC), corresponding to 0.41 and 0.35 moisture mass fractions for Vertisol and Phaoezem, respectively. Substantial denitrification occurred at soil moisture level > 80% WHC. Soil moisture was necessary for denitrification to occur: even under anaerobic (N2 flushing) conditions denitrification did not occur in soils with moisture lower than 30% WHC. Denitrification rate depended largely on soil moisture content and available C. The total N lost from soils through denitrification is a function of the rate and duration of denitrification. Both of these parameters are primarily dependent on soil moisture content. In order to translate denitrification data obtained under laboratory conditions to field situation it is necessary, therefore, to consider the frequency and duration of soil moisture content > 80% WHC in the field.
199

Summary
In Chapter 6 the influences of soil moisture, fertilizer N source, and placement mode on NH3-N losses in Vertisols were investigated. Surface application of NH4-based fertilizers on soils with initial moisture content of 80% WHC had higher risk of losing NH3-N than soils with lower initial moisture content, indicating the important role of water in solubilizing fertilizer materials. Incorporating fertilizer materials within the 0-5 cm soil layer was effective in reducing NH3-N losses, underscoring the need of incorporation mode of fertilizer N placement where there is NH3 volatilization risk. Soil pH and fertilizer properties were the main factors influencing NH3-N loss in these soils. Comparing the magnitude of NH r N losses from various fertilizers in the Vertisols studied, the following ranking became evident: urea > ammonium sulfate > ammonium nitrate. These results are directly applicable to field situation by choosing appropriate fertilizer for particular Vertisols, and considering fertilizer placement options.
The studies on the effects of fertilizer source and rate on nitrogen loss in bypass flow in a Kenyan Vertisol reported in Chapter 7 revealed that N03-N was the main N-form in which N was recovered in the bypass flow, and the amount of N recovered increased with increasing rate of N03-N application. On the average, 12% of applied NO3-N was recovered in the bypass flow. Ammonium-N source had no influence on the N recovered in the bypass flow. These results showed that bypass flow is an important avenue of N03-N loss from Vertisols especially if applied early in the season before the characteristic cracks providing preferential flow paths close.
In Chapter 8 the effects of drain depth on soil moisture variation and maize performance were investigated. Drains, 40 and 60 cm deep, resulted in lower soil moisture within 0-40 cm soil layer, deeper rooting depth and higher dm and grain yields than the 0 and 20 cm deep drains. By reducing soil moisture content, the drains favoured 0 2 supply and reduced denitrification risk within the 0-40 cm soil layer, the layer in which maize roots are concentrated.
The effectiveness of 40 and 60 cm deep drains on maize performance and NUE are illustrated in Chapter 9. It was found that dm and grain yields, nitrogen recovery efficiency (NRE) and agronomic nitrogen efficiency (ANE) as well as the uptake of P and K by maize were higher on drained than undrained plots. It was shown that applying all the N03-N dose at planting time was inferior to split and late application in terms of crop yields and nutrient uptake and NUE under conditions where drainage was not provided. Such effects of time of N03-N application did not exist where drainage was provided. There was no effect of time of application in the case of NH4-N on drained and undrained plots. The lower recovery of N03-N in undrained than in
200
Summary
drained plots indicates the susceptibility of N03-N to denitrification losses under high soil moisture conditions. The 40 cm deep drains are preferable to the 60 cm deep drains on the basis of cost/benefit considerations since there was no difference between the two drain depths in terms of maize performance and NUE. Perusal of maize yields - nutrient uptake relationships revealed that P and K are adequate, while N is severely limiting in the Vertisols studied.
The late maturing maize hybrid, H614, had higher N uptake and ANE than the medium late hybrid, H511 (Chapter 10), underscoring the importance of using maize genotypes whose growth cycles fit well within the growing season as determined by soil moisture in order to enhance NRE and ANE.
Provision of 40 cm deep drains, with inter-drain spacing of 15 to 20 metres, is prerequisite in successful maize growing and improved NUE in Kenyan Vertisols. Incorporating nitrogenous fertilizer materials within the top soil layer, is recommended in order to reduce bypass flow and NH3 volatilization risks. When NH4-based fertilizer is applied to soils with pH < 7, incorporation is not necessary. Soil pH must be considered in choosing N source and mode of application for particular Vertisols.
201

SAMENVATTING
Het areaal aan Vertisols in Kenya is ongeveer 2.8 miljoen hectares groot. De Vertisols komen in verschillende agroklimatologische zones van het land voor. Tot de belangrijkste voedselgewassen die op deze gronden worden verbouwd horen mais, sorghum, gierst, verschillende peulvruchten en groenten. Mais is het basisvoedsel en het wordt in Kenia verbouwd door vrijwel iedere huishouding waarin iets aan landbouw gedaan wordt. Stikstof is het meest opbrengstbeperkende nutriënt voor mais op de Keniaanse Vertisols, maar toch is de reactie van het gewas op toegediende meststofstikstof gering. Het doel van dit onderzoek was de effecten te kwantificeren van verschillende vormen van kunstmeststikstof, en van praktijkmaatregelen, te weten de grootte, het tijdstip van toediening en het delen van de stikstofgift en drainage op (i) kunstmest N verliezen door denitrificatie, NH3-vervluchtiging, en preferente stroming (bypass flow), (ii) kunstmest N gebruiksefficiëntie van mais waarbij de agronomische efficiëntie, het elementrendement en de fysiologische N efficiëntie in de beschouwing werden betrokken, en (iii) opname van andere nutriënten dan N.
Er werden zowel laboratorium- als veldproeven uitgevoerd. Onderzoek in het laboratorium naar de faktoren die invloed hebben op denitrificatie, NHrvervluchtiging, en preferente stroming werd onder geconditioneerde omstandigheden uitgevoerd om de effecten van specifieke faktoren op de processen te kunnen bestuderen, en hun relatieve belangrijkheid te kunnen vaststellen. In de denitrificatieproeven werd een goed drainerende grond (een Phaoezem) meegenomen ter vergelijking met de Vertisol. Veldproeven werden gedurende twee jaren op twee plaatsen in Kenya uitgevoerd om het effect van verschillende praktijkmaatregelen te toetsen. Drie onderwerpen stonden daarbij centraal: (i) de effecten van de greppeldiepte op de variatie in de tijd van het vochtgehalte in de bodem en op de bewortelingsdiepte van mais, (ii) de interactieve effecten van greppeldiepte * aard van kunstmest N * toedieningstijdstip op de gebruiksefficiëntie van N, en (iii) interactieve effecten van het genotype van de mais * aard van kunstmest N * grootte van de N-gift op de gebruiksefficiëntie van N.
In Hoofdstuk 5 wordt verslag gedaan van het onderzoek naar de invloeden van het vochtgehalte in de grond, van beschikbaar C, van de grootte van de N-gift en van de N-vorm op denitrificatie. De resultaten lieten zien dat het kritische vochtgehalte waarbij denitrificatie begon op te treden gelijk was aan 60% van het waterhoudend vermogen (WHV), hetgeen overkwam met een vochtmassa-fractie van 0,41 en 0,35 voor respectievelijk de Vertisol en de Phaoezem. Aanzienlijke denitrificatie vond plaats bij vochtgehaltes van > 80% WHV. Om denitrificatie te laten verlopen was vocht in de grond nodig: zelfs onder anaerobe omstandigheden (N2-omgeving) werd geen denitrificatie gevonden bij een vochtgehalte beneden 30% WHV. De snelheid van
203

Samenvatting
denitrificatie hing sterk af van het vochtgehalte in de grond en beschikbaar C. Het totale N-verlies door denitrificatie is een functie van de snelheid en de duur van de denitrificatie, die beide indiret afhankelijk zijn van het vochtgehalte in de grond. Voor de vertaling van denitrificatiegegevens vanuit de laboratorium- naar de veldsituatie is het noodzakelijk de frequentie en de duur van de perioden waarin het vochtgehalte in het veld > 80% WHV is, in de beschouwing te betrekken.
In Hoofdstuk 6 werden de invloeden van bodemvocht, vorm van de meststof N, en wijze van toedienen op de NH3-N-verliezen in Vertisols onderzocht. Bij oppervlakkige toediening van NH4-meststoffen op gronden met een initieel vochtgehalte van 80% WHV waren de risico's van NH3-N-verlies groter dan op gronden met een lager initieel vochtgehalte, wat wijst op het belang van vocht voor het oplossen van de meststof. Onderwerken van de meststoffen in de 0-5 cm laag leidde tot vermindering van NH3-N-verliezen, hetgeen het belang van de toedieningswijze onderstreept wanneer er kans bestaat op NH3-vervluchtiging. De pH van de grond en de eigenschappen van de meststof waren de belangrijkste faktoren die invloed hadden op NH3-N-verlies in deze gronden. De omvang van de NH3-N- verliezen in de bestudeerde Vertisols nam af in de volgorde: ureum > zwavelzure ammoniak > ammoniumnitraat. Deze resultaten zijn direct toepasbaar in het veld door de juiste meststoffen en plaatsingsmethoden voor een bepaalde Vertisol te kiezen.
De studies naar de effecten van de vorm van meststofstikstof en de grootte van de gift op stikstofverlies via preferente stroming in een Keniaanse Vertisol, beschreven in Hoofdstuk 7, gaven aan dat N03-N de belangrijkste N-vorm was die in de 'bypass flow' werd gevonden, en dat de hoeveelheid N, die via 'bypass flow' verlorenging, toenam met toenemende giften van N03-N. Gemiddeld werd 12% van de toegediende N03-N in de bypass flow teruggevonden. Ammonium-N had geen invloed op de hoeveelheid N in de bypass flow. Deze resultaten toonden aan dat de bypass flow een belangrijke verliespost van N03-N kan zijn in Vertisols, vooral indien de meststof vroeg in het seizoen wordt toegediend voordat de karakteristieke scheuren die als preferente stroombanen fungeren zich sluiten.
In Hoofdstuk 8 werden de effecten van greppeldiepte op bodemvochtgehalte en de produktie van mais onderzocht. Greppels van 40 en 60 cm diep resulteerden in lagere bodemvochtgehalten binnen de laag van 0-40 cm, diepere beworteling en hogere drogestof- en korrelopbrengsten dan 20 cm diepe greppels of geen greppels. Door de verlaging van het vochtgehalte bevorderden de greppels de 02-voorziening en verminderden het risico van denitrificatie binnen de 0-40 cm bodemlaag, de laag waarin de maiswortels zijn geconcentreerd.
204

Samenvatting
De effectiviteit van 40 en 60 cm diepe greppels m.b.t. de productiviteit van mais en de gebruiksefficiëntie van stikstof worden geïllustreerd in Hoofdstuk 9. Gevonden werd dat drogestof- en korrelopbrengsten, het elementrendement en de agronomische efficiëntie van N, evenals de opname van P en K door mais hoger waren in de begreppelde dan in de niet-begreppelde veldjes. Voorts bleek dat, wanneer niet begreppeld was, toediening van de hele N03-N-gift ineens bij zaaien minder goed was m.b.t. gewasopbrengst, nutriëntenopname en stikstofefficiëntie dan deling of uitstel van de gift. Zulke effecten van het tijdstip van toediening waren er niet wanneer er wel greppels aanwezig waren. In het geval van NH4-N was er noch in de begreppelde noch in de onbegreppelde veldjes een effect van het tijdstip van toediening van de meststof. Het lagere elementrendement van N03-N in de niet-begreppelde veldjes wijst op de gevoeligheid van N03-N voor denitrificatieverliezen bij hoge vochtgehaltes in de bodem. Op grond van kosten/baten overwegingen zijn greppels van 40 cm diep te verkiezen boven die van 60 cm diep, omdat er geen verschil is tussen de twee greppeldiepten wat betreft maisproduktie en efficiëntie van stikstof gebruik. Uit de relaties tussen maisopbrengst en nutriëntenopname bleek dat P en K in voldoende mate aanwezig zijn, terwijl N sterk beperkend is in de bestudeerde Vertisols.
De laat afrijpende mais hybride H614 had een hogere N opname en efficiëntie van stikstofgebruik dan de matig late hybride H511 (Hoofdstuk 10), waaruit blijkt dat het voor de bevordering van het elementrendement en de algehele efficiëntie van stikstofgebruik van belang is genotypes te gebruiken waarvan de groeicycli goed passen binnen het groeiseizoen zoals dat bepaald wordt door onder andere het bodemvochtgehalte.
Begreppeling tot 40 cm diep, met een afstand tussen de greppels van 15 to 20 meters, is een voorwaarde voor een succesvolle teelt van mais en een meer efficiënt stikstofgebruik in Keniaanse Vertisols. Inwerken van stikstofmeststoffen in de bovenste bodemlaag wordt aanbevolen om verliezen via bypass flow en het risico van NH3-vervluchtiging te verminderen. Wanneer NH4-meststoffen worden toegediend aan gronden met een pH < 7, is inwerken niet per se nodig. De pH van de grond kan worden gezien als een belangrijk criterium voor de keus van het type stikstofmeststof en de wijze van toedienen op een bepaalde Vertisol.
205

CURRICULUM VITAE
Dalmas Owino Sigunga was born on October 16, 1949 in Kisumu, Kenya. From 1972 to 1975 he studied agriculture at Makerere University, Kampala, Uganda, where he obtained a BSc degree in crop science. After graduation he was employed at Bukura Institute of Agriculture as an Assistant Lecturer. In October 1978 he started MSc Agronomy Programme at the University of Nairobi, Kenya. Upon completion of the programme in 1981, he went to Japan where he was attached to the Laboratory of Plant Breeding and Nutrition of Okayama University. On his return to Kenya in 1983, he was promoted to a Lecturer and deployed to Jomo Kenyatta College of Agriculture and Technology (the present Jomo Kenyatta University College of Agriculture and Technology). Between January 1986 and July 1987 he studied Educational Administration and Curriculum Development at the University of Alberta, Canada. On returning to Kenya in 1987, he was promoted to Senior Lecturer and appointed the head of Agriculture Department of Moi Teachers College (the present Chepkoilel Campus of Moi University). He joined the Department of Agronomy of Egerton University in August 1988. In 1990 he attended Research Programme Design for Maize Agronomists course at the Centro Internacional de Mejoramiento de Maiz y Trigo (CIMMYT) at El Batan, Mexico. He has been working for Crop Management Research Training Project (CMRT) on secondment since 1991. The CMRT is jointly managed by Egerton University, Kenya Agricultural Research Institute, and CIMMYT. He started PhD programme at the Department of Soil Science and Plant Nutrition, WAU in October 1993 on sandwich arrangement.
207