NIGERIA - African Fertilizer and Agribusiness Partnership ...
Upload
khangminh22Category
view
1download
0
47IMPROVING FERTILIZER SUPPLY | 2015
Improving fertilizer supply A farmer in Mozambique’s Xai-Xai region, Fernanda grows maize, beans and vegetables. She produces enough to sustain her family of 5, but would like to grow surplus production to sell at the local market. Fernanda has heard from other women at her village that if she uses fertilizer she can sig-
she hears that this agricultural input is very expensive. Therefore, Fernanda has decided not to use fertilizer this season.
1 No world region has been able to boost agricultural growth and tackle hunger without increasing the use
2
-
-
-
in the future through the ongoing depletion of soil nutrients.3
-
infrastructure.4
Agribusiness Indicators
-7

48 ENABLING THE BUSINESS OF AGRICULTURE | 2015
What improving fertilizer supply data focus on
-
1. Domestic production and blending of fertilizer.
-
-
2. Regulatory framework for fertilizer. These -
existence of national and supranational laws and regulations.
3. Registration of fertilizer. -
-
-
The data set also highlights supranation-
4. Importing of fertilizer. -
-
Subsidies, taxes and tariffs on fertiliz-er.
---
-
8 Taxes and tariffs can be an -
-
Quality control of fertilizer. These data -
-
7. Fertilizer use and soil health. These data
look at whether soil testing facilities and --

49IMPROVING FERTILIZER SUPPLY | 2015
--
countries.
What the initial pilot results show
-
Four of the 10 pilot countries produce fer-
-
neither production nor blending facilities. All 10
Regional harmonization leads to easier registration of fertilizer
-
FIGURE 6.1: Fertilizer laws by country
Countries that have a unified lawregulating chemical fertilizers
Countries that do not have a lawregulating chemical fertilizers
Countries that have a supranationalfertilizer law in addition to the
national fertilizer law
8
1
2
Morocco
Guatemala Spain
Ethiopia Guatemala
Philippines Rwanda
Mozambique Nepal
Uganda Ukraine
Source: Enabling the Business of Agriculture database.

50 ENABLING THE BUSINESS OF AGRICULTURE | 2015
-
FIGURE 6.3:
Registration issubject toa specific
time period
Registrationreguired to legally
commercializefertilizer
No registrationreguired
3 years
10 years
9
1
8
Ethiopia Guatemala
Rwanda Spain
Mozambique Nepal
Uganda Ukraine
Morocco
Philippines
Nepal Philippines Uganda
Guatemala Spain Ukraine
No specific time
5 years
Rwanda
Mozambique
Source: Enabling the Business of Agriculture database.
FIGURE 6.2: Fertilizer production and blending by country
4
6
Morocco Philippines Spain Ukraine Fertilizer producing countries
Countries that mix/blend fertilizerdomestically
Guatemala Morocco Philippines
Spain
Mozambique
Ukraine
Source: Enabling the Business of Agriculture database.

51IMPROVING FERTILIZER SUPPLY | 2015
-position is and when the registration expires.
-
-
(SADC).
Public sector is often involved in the procurement of fertilizer
So it is no
10
-
-
-
Fertilizer prices are the highest in African pilot countries

52 ENABLING THE BUSINESS OF AGRICULTURE | 2015
BOX 6.1: Harmonizing fertilizer registration and trade for lower cost and greater choice
-
-
MAP B6.1.1: Regional organizations with pilot countries as members
CACU+P
EU
CIS
SADC
EAC
ASEAN
Source:
53IMPROVING FERTILIZER SUPPLY | 2015
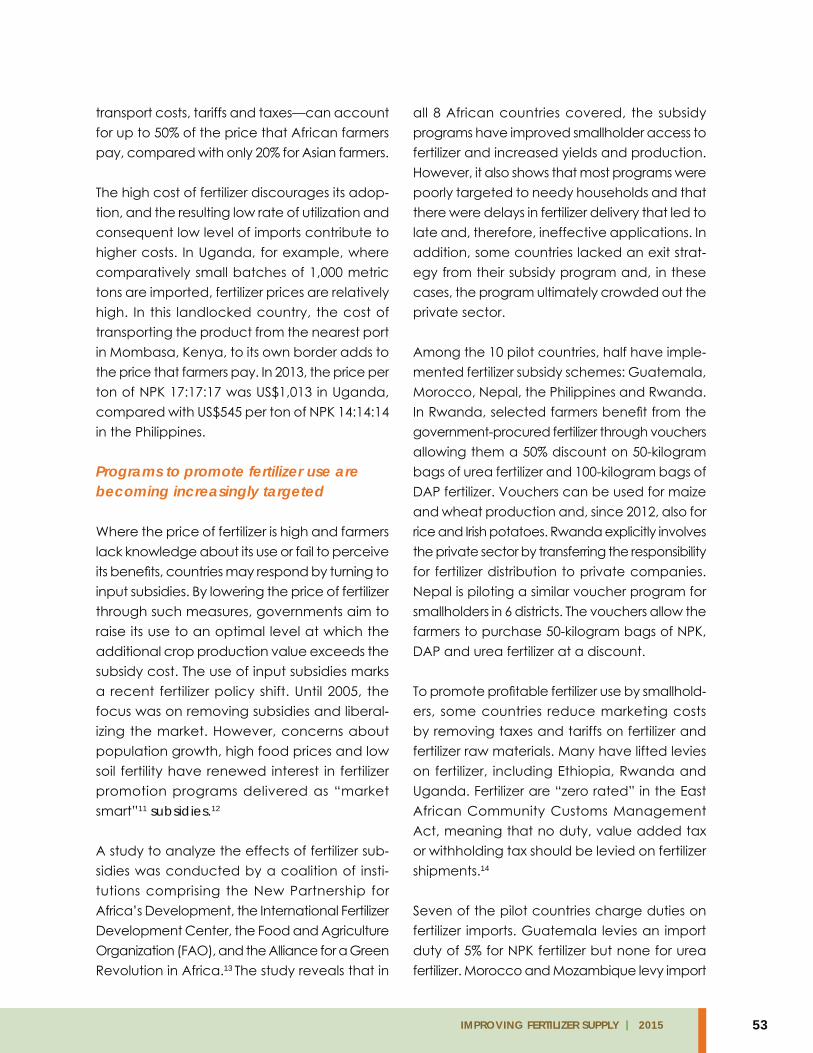
-
Programs to promote fertilizer use are becoming increasingly targeted
-
11 subsidies.12
--
13
-
-
-
14

54 ENABLING THE BUSINESS OF AGRICULTURE | 2015
Quality controls are common, but not always effective
Countries use both labeling and inspections
include the results that can be expected when
-
Enabling the Business of Agriculture
-
--
-tainers. In the countries where open containers
-
a technical data sheet.
17 Adulteration and dilution
-
-

55IMPROVING FERTILIZER SUPPLY | 2015
FIGURE 6.4: Average fertilizer use rates by country
Ethiopia Guatemala PhilippinesUkraineMozambique MoroccoNepal SpainUganda
Kilo
gram
s pe
r hec
tare
0
80
60
40
20
100
120
140
160
52
150150
131
78
40
2423
Source: Enabling the Business of Agriculture database.
18
with 3 functional laboratories and a population
-
-
-
of the countries.
Next steps
This chapter presented the initial pilot results for
health. The results presented were selected
focus areas will be narrowed down during the

56 ENABLING THE BUSINESS OF AGRICULTURE | 2015
be considered. Further research that would be
following 3 areas:
1. -
2.
3. -
BOX 6.2: Extending reach through a mobile soil lab in Uganda
-
--
Source:

57IMPROVING FERTILIZER SUPPLY | 2015
Notes
3 World Bank 2013b.
would not otherwise use purchased inputs (or to the
12 Minde et al. 2008.
annex 1.
Copyright © 2022 FDOKUMEN