Federated Hermes Investment Funds Public Limited Company
441
Federated Hermes Investment Funds Public Limited Company (An umbrella investment company with variable capital and having segregated liability between its Sub-Funds incorporated with limited liability in Ireland) Annual Report and Audited Financial Statements For the financial year ended 31 December 2020 Company Registration Number: 463628
-
Upload
khangminh22 -
Category
Documents
-
view
0 -
download
0
Transcript of Federated Hermes Investment Funds Public Limited Company

Federated Hermes Investment Funds Public Limited Company
(An umbrella investment company with variable capital and having segregated liability between its Sub-Funds incorporated with limited liability in Ireland)
Annual Report and Audited Financial StatementsFor the financial year ended 31 December 2020
Company Registration Number: 463628

Federated Hermes Investment Funds Public Limited CompanyContents
2
Management and Administration ������������������������������������������������������������������������������������������������������������������������������� 3
Directors’ Report ������������������������������������������������������������������������������������������������������������������������������������������������������� 5
Investment Manager Information (Unaudited) ����������������������������������������������������������������������������������������������������������� 9
Investment Manager’s Report ��������������������������������������������������������������������������������������������������������������������������������� 13
Depositary’s Report to the Shareholders ����������������������������������������������������������������������������������������������������������������� 51
Independent Auditor’s Report ���������������������������������������������������������������������������������������������������������������������������������� 52
Portfolio Statements ������������������������������������������������������������������������������������������������������������������������������������������������ 55
Balance Sheet ������������������������������������������������������������������������������������������������������������������������������������������������������� 218
Income Statement ������������������������������������������������������������������������������������������������������������������������������������������������� 229
Statement of Changes in Net Assets Attributable to Holders of Redeemable Participating Shares ���������������������� 239
Cash Flow Statement �������������������������������������������������������������������������������������������������������������������������������������������� 249
Notes to the Financial Statements ������������������������������������������������������������������������������������������������������������������������� 259
Unaudited Schedule of Significant Portfolio Movements ��������������������������������������������������������������������������������������� 411
Unaudited Investment Manager Remuneration Disclosure ����������������������������������������������������������������������������������� 440
Unaudited Securities Financing Transaction Regulation Disclosures ������������������������������������������������������������������� 441

3
Federated Hermes Investment Funds Public Limited CompanyManagement and Administration
DirectorsPaul McNaughton (Irish) (resigned 31 December 2020)1
Joseph Kagan (British)2
Carol Mahon (Irish)2
Ian Kennedy (British) (resigned 31 December 2020)2
Denise Kinsella (Irish) (resigned 16 December 2020)1
Gregory Dulski (American) (appointed 2 July 2020)2
Peter Germain (American) (appointed 1 January 2021)2
Ronan Walsh (Chairman) (Irish) (appointed 1 January 2021)1
Michael Boyce (Irish) (appointed 1 January 2021)1
Investment Manager and DistributorHermes Investment Management Limited150 CheapsideLondon EC2V 6ETEngland
Investment ManagerFederated Investment Counselling3
1001 Liberty AvenuePittsburgh, PA 15222-3779United States
ManagerHermes Fund Managers Ireland LimitedThe Wilde53 Merrion SquareDublin 2Ireland
DepositaryNorthern Trust Fiduciary Services (Ireland) LimitedGeorges Court54-62 Townsend StreetDublin 2Ireland
Independent AuditorDeloitte Ireland LLPChartered Accountants & Statutory Audit FirmDeloitte & Touche House29 Earlsfort TerraceDublin 2Ireland
Advisor on Voting and EngagementHermes Equity Ownership Services Limited150 CheapsideLondon EC2V 6ET England
Registered Office – Up to 31 January 2020Georges Court 54-62 Townsend StreetDublin 2Ireland
Registered Office – Effective 1 February 2020The Wilde53 Merrion SquareDublin 2Ireland
Legal Advisor to the Company – up to 30 September 2020Matheson70 Sir John Rogerson’s QuayDublin 2Ireland
Legal Advisor to the Company – Effective 1 October 2020Arthur Cox10 Earlsfort TerraceDublin 2Ireland
Administrator, Registrar, and Transfer AgentNorthern Trust International Fund Administration Services (Ireland) Limited Georges Court 54-62 Townsend StreetDublin 2Ireland

4
Federated Hermes Investment Funds Public Limited CompanyManagement and Administration (continued)
Secretary – Up to 31 January 2020Northern Trust International Fund Administration Services (Ireland) Limited Georges Court 54-62 Townsend StreetDublin 2Ireland
Secretary – Effective 1 February 2020 Up to 30 September 2020Matsack Trust Limited70 Sir John Rogerson’s QuayDublin 2Ireland
Secretary – Effective 1 October 2020Bradwell Limited10 Earlsfort TerraceDublin 2Ireland
1 Independent Directors� All Independent Directors are non-executive2 Non-executive Directors3 Investment Manager for Federated Hermes US High Yield Credit Fund only

5
Federated Hermes Investment Funds Public Limited CompanyDirectors’ Report
The Directors of Federated Hermes Investment Funds Public Limited Company (the “Company”) present their Annual Report and the Audited Financial Statements of the Company for the financial year ended 31 December 2020�
Statement of Directors' Responsibilities The Directors are responsible for preparing the Directors’ report and the Financial Statements in accordance with the Companies Act 2014 and the applicable regulations�
Irish company law requires the Directors to prepare Financial Statements for each financial year. Under the law, the Directors have elected to prepare the Financial Statements in accordance with International Financial Reporting Standards (“IFRS”) as adopted by the European Union (“relevant financial reporting framework”). Under Irish company law, the Directors must not approve the Financial Statements unless they are satisfied that they give a true and fair view of the assets, liabilities and financial position of the Company as at the financial year end date and of the profit or loss of the Company for the financial year and otherwise comply with the Companies Act 2014.
In preparing those Financial Statements, the Directors are required to:
• select suitable accounting policies for the Financial Statements and then apply them consistently;• make judgements and estimates that are reasonable and prudent;• state whether the Financial Statements have been prepared in accordance with applicable accounting
standards, identify those standards, and note the effect and the reasons for any material departure from those standards; and
• prepare the Financial Statements on the going concern basis unless it is inappropriate to presume that the Company will continue in business�
The Directors are responsible for ensuring that the Company keeps or causes to be kept adequate accounting records which correctly explain and record the transactions of the Company, enable at any time the assets, liabilities, financial position and profit or loss of the Company to be determined with reasonable accuracy, enable them to ensure that the Financial Statements and Directors’ Report comply with the Companies Act 2014 and with the European Communities (Undertakings for Collective Investment in Transferable Securities) Regulations, 2011 (“the UCITS Regulations”), as amended and the Central Bank (Supervision and Enforcement) Act 2013 (Section 48(1)) (Undertakings for Collective Investment in Transferable Securities) Regulations 2019 (the "Central Bank UCITS Regulations”) and enable the Financial Statements to be audited� They are also responsible for safeguarding the assets of the Company and hence for taking reasonable steps for the prevention and detection of fraud and other irregularities�
Principal Activity The Company was incorporated on 23 October 2008 under the laws of Ireland as an open ended umbrella type investment company with variable capital and limited liability in which different funds may be created from time to time� The Company is authorised by the Central Bank of Ireland as an Investment Company pursuant to the Central Bank UCITS Regulations�
Business Review Please refer to the Investment Manager Reports on pages 13 to 50 for a review of business�
The principal risks and uncertainties faced by the Company are the investment risks associated with the portfolio of investments held for the account of each sub-fund (the term “sub-fund” relates to the sub-funds listed on pages 259 to 265) and the operational risks associated with their management and administration (see note 8 to the Financial Statements)�
Accounting Records The measures taken by the Directors to secure compliance with the requirements of sections 281 to 285 of the Companies Act 2014 with regard to the keeping of accounting records are the use of appropriate systems and procedures and employment of competent persons� The accounting records of the Company are maintained by Northern Trust International Fund Administration Services (Ireland) Limited, at Georges Court, 54-62 Townsend Street, Dublin 2, Ireland�
Transactions Involving Directors There were no contracts or agreements of any significance in relation to the business of the Company in which the Directors had any interest, as defined in the Companies Act, 2014, at any time during the financial year, other than those set out in note 6 to the Financial Statements�

6
Federated Hermes Investment Funds Public Limited CompanyDirectors’ Report (continued)
Revenue The results of operations for the financial year are set out in the Income Statement on pages 229 to 233.
Directors’ Interests in Shares of the Company No Director, nor the Company Secretary, had any beneficial interest in the shares of the Company throughout the financial year.
Distributions Details of distributions paid and proposed are set out in note 14 to the Financial Statements�
Independent Auditor The independent auditor, Deloitte Ireland LLP (“Deloitte”), have indicated their willingness to continue in office in accordance with section 383(2) of the Companies Act, 2014�
Directors The Directors of the Company who served at any time during the financial year are stated below:
Paul McNaughton (Irish) (Chairman) (resigned 31 December 2020)Joseph Kagan (British)Carol Mahon (Irish)Ian Kennedy (British) (resigned 31 December 2020)Denise Kinsella (Irish) (resigned 16 December 2020)Gregory Dulski (American) (appointed 2 July 2020)
Connected Persons The Central Bank UCITS Regulations require that any transaction carried out with a UCITS by a management company or depositary to the UCITS, the delegates or sub-delegates of the management company or depositary and any associated or group of such a management company, depositary, delegate or sub-delegate (“connected persons”) must be carried out as if negotiated at arm’s length� Transactions must be in the best interests of the shareholders�
The Board of Directors are satisfied that there are arrangements (evidenced by written procedures) in place, to ensure that the obligations set out in Regulation 43(1) of the Central Bank UCITS Regulations are applied to all transactions with connected persons, and are satisfied that transactions with connected persons entered into during the year complied with the obligations set out in Regulation 43(1) of the Central Bank UCITS Regulations�
Significant Events During the Financial Year On 1 January 2020 the Federated Hermes Europe ex-UK Equity Fund benchmark changed from FTSE World Europe Ex UK Index to MSCI Europe Ex UK Index and the Federated Hermes European Alpha Equity Fund benchmark changed from FTSE All World Europe Index to MSCI Europe Index�
On 20 January 2020 the Central Bank of Ireland withdrew approval for the Hermes US All Cap Equity Fund and Hermes Multi-Asset Inflation Fund following an application by the Company.
On 23 June 2016, the United Kingdom held a referendum and voted to leave the European Union� At 11pm (GMT) on 31 January 2020, the United Kingdom formally left the European Union and entered into a transition period that lasted until 11pm (GMT) on 31 December 2020, creating a period of uncertainty� Leaving the European Union is likely to result in significant changes to law and regulation in the United Kingdom. It is not currently possible to assess the effect of these changes on the Company�
On 3 February 2020 Federated Investors, Inc� and Hermes Investment Management combined their names to become Federated Hermes, Inc�
On 17 February 2020 the Prospectus and Supplements of the Company were updated� A key update is the introduction of new monthly, quarterly and annual distribution options with clarification regarding the method, calculation and frequency for payment of dividends�

7
Federated Hermes Investment Funds Public Limited CompanyDirectors’ Report (continued)
On 27 February 2020 the board of NMC Health PLC announced that the FCA has agreed to its request under Chapter 5 of the Listing Rules for the temporary suspension of its shares to ensure the smooth operation of the market� A temporary suspension was issued by the FCA and therefore the Hermes Liquidity & Valuation Committee has endorsed valuing this security at nil� There is a material impact to the net asset value of the sub-funds holding this security� NMC Health is held by the Federated Hermes Global Emerging Markets Equity Fund and Federated Hermes Global Emerging Markets SMID Equity Fund and was 1�19% and 1�43% of the respective sub - fund’s net asset value on the 27 February 2020 �
On 6 May 2020 there was an addendum made to the Prospectus to include South Korea (The Korea Stock Exchange (Stock Market) Korean Exchange (KOSDAQ)) and Vietnam (Ho Chi Minh Stock Exchange (HSX or HOSE) and Hanoi Stock Exchange (HNX)) under the Appendix 1 headed “Stock Exchanges and Regulated Markets”�
On 26 June 2020 Hermes Investment Funds plc rebranded and changed the company name to Federated Hermes Investment Funds plc, individual sub-fund names were also updated to include ‘Federated’�
The company prospectus was updated to include the new investment policies that explain how ESG is integrated into the investment process and updates to the share class descriptions were made to make it clearer how they are differentiated�
On 2 July 2020 Gregory Dulski was appointed as a director of Federated Hermes Investment Funds Public Limited Company�
The Federated Hermes US High Yield Credit Fund launched on 21 July 2020� The Investment Manager for this sub-fund is Federated Investment Counseling�
On 16 December 2020 Denise Kinsella resigned as a director of Federated Hermes Investment Funds Public Limited Company�
On 31 December 2020 Paul McNaughton resigned as a director and Chairman of Federated Hermes Investment Funds Public Limited Company�
On 31 December 2020 Ian Kennedy resigned as a director of Federated Hermes Investment Funds Public Limited Company�
Since 31 December 2019 some of the sub – funds have experienced significant net outflows as a result of the market disruption� Please note that all sub-funds listed are expected to remain open and are regularly reviewed by the Management Company to assess the risk of their ability to continue to operate. If any risk is identified, a recommendation will be made to the Federated Hermes Investment Funds Plc Board to change a sub – fund or close it entirely� Currently, no recommendations have been made to change or close any of these funds�
The below table shows sub-funds that have had net outflows exceeding 10% of their net asset value between 1 January 2020 and 31 December 2020�
Net Outflow in Fund’s base
currency
NAV – 31 December 2019
Net Outflow as
% of NAVFederated Hermes European Alpha Fund €57,871,503 153,505,228 (37�70%)Federated Hermes Europe Ex-UK Equity Fund €182,593,559 215,035,625 (84�91%)Federated Hermes US SMID Equity Fund $204,795,490 1,069,591,549 (19�15%)Federated Hermes Asia Ex-Japan Equity Fund $1,115,105,829 3,523,724,813 (31�65%)Federated Hermes Multi Strategy Credit Fund $363,676,294 992,092,893 (36�66%)
Subsequent EventsOn 1 January 2021 Ronan Walsh was appointed as a director and Chairman of Federated Hermes Investment Funds Public Limited Company�
On 1 January 2021 Peter Germain and Michael Boyce were appointed as directors of Federated Hermes Investment Funds Public Limited Company�
Significant Events During the Financial Year (continued)

8
Federated Hermes Investment Funds Public Limited CompanyDirectors’ Report (continued)
On 20 January 2021 there was a large redemption from the Federated Hermes Europe ex-UK Equity Fund of approximately 72% of the fund’s value� On 19 April 2021, the Fund’s NAV was $7,975,079�
On 22 January 2021 Federated Hermes Sustainable Global Equity Fund was launched�
On 1 March 2021, the Annual Management Charge of the Federated Hermes SDG Engagement High Yield Credit Fund W class was reduced from 1�05% to 0�80%�
Up to the date of approval of these Financial Statements there have been no other events affecting the Company subsequent to the year end, which would impact on the Financial Statements for the financial year ended 31 December 2020�
Corporate Governance Statement The Board of Directors has voluntarily adopted the Corporate Governance Code for Irish domiciled Collective Investment Schemes as published by Irish Funds, as the Company’s corporate governance code�
Directors’ Compliance StatementThe Directors acknowledge that they are responsible for securing the Company’s compliance with the relevant obligations as set out in section 225 of the Companies Act 2014�
The Directors confirm that:
1) A compliance policy document has been drawn up that sets out policies that in their opinion are appropriate to the Company, respecting compliance by the Company with its relevant obligations�
2) Appropriate arrangements or structures are in place that are, in their opinion, designed to secure material compliance with the Company’s relevant obligations, and
3) During the financial year, the arrangements or structures referred to in (2) have been reviewed.
Directors’ Statement on Relevant Audit InformationThe Directors confirm that:
1) so far as the Directors are aware, there is no relevant audit information of which the Company’s statutory auditors are unaware, and
2) the Directors have taken all the steps they ought to have taken as a Director in order to make themselves aware of any relevant audit information and to establish that the Company’s statutory auditors are aware of that information�
Director
Director21 April 2021
Subsequent Events (continued)
Joseph Kagan
Ronan Walsh

9
Federated Hermes Investment Funds Public Limited CompanyInvestment Manager Information (Unaudited)
Hermes Investment Management Limited
Responsibility: a core value
Hermes Investment Management is an active asset manager working to deliver excellent, long-term, risk adjusted performance – responsibly� We strive to lead the debate and contribute to the transformation of the investment industry for the benefit of our clients, their stakeholders and, ultimately, society at large.
Our agenda and activities are driven by the long term objectives of our clients’ beneficiaries and we act in their interests�
Responsibility in practice
We have a comprehensive programme to ensure our responsibility approach and activities are integrated seamlessly in our funds and stewardship service� This includes:
• Delivering sustainable performance within the terms of the mandate and within the clients’ risk appetite• Taking into account all material investment factors including environmental, social and governance (ESG)
ensuring that we are informed though not constrained by these considerations• Acting as a responsible, engaged, long-term steward of investments encompassing constructive dialogue
and taking action where necessary• Engaging with public policy makers and industry bodies to encourage a sustainable economy beyond the
timeframe of a specific mandate
Hermes investment teams across Real Estate, Equities and Fixed Income integrate ESG factors into their investment decisions by accessing in-house expertise, proprietary and third-party research� This includes Hermes’ proprietary ESG Dashboard which provides an ESG score per stock and the ESG Portfolio Monitor, which provides a holistic view of ESG statistics at a portfolio level� The ESG dashboard and Portfolio Monitor draw on best-in-class data from various sources including ISS, MSCI, Sustainalytics, Trucost as well as voting and engagement progress data from Hermes Equity Ownership Services Limited (“EOS”), our stewardship service� Through the dashboard and close interaction with the EOS team, our investment teams are able to benefit from the unique data insights and positive impact of our engagement work�
EOS at Federated Hermes, which provides stewardship services, is a global market leader in voting and engagement with both companies and public policy makers� The team makes voting recommendations over 10,000 company meetings and actively engages with more than 400 companies a year at executive and board level on a range of issues including board governance, executive remuneration, risk management, business strategy, corporate culture, carbon, pollution, water stress, labour and community rights� We are also active participants in a wide range of public policy discussions and our Chief Executive, Saker Nusseibeh, founded the 300 Club, an independent forum for discussion and debate about the responsibilities of the investment industry�
Whilst the responsibility for implementation resides with all Federated Hermes personnel, the ESG and engagement integration programme is led, coordinated and supported by Federated Hermes Responsibility Office: a head of responsibility reporting to Federated Hermes’ CEO, a head of policy and advocacy, three executives responsible for facilitating integration in public and private market funds and a head of Hermes’ corporate citizenship activities� This team is further supported by the Responsibility Working Group, which meets quarterly, to set Federated Hermes policy and lead initiatives� The Responsibility Working Group includes investment, product development, marketing, legal, compliance, human resources and responsibility representatives as members�
Voting
Throughout 2020, for Federated Hermes Investment Funds Public Limited Company, we voted at 468 shareholder meetings (5,472 resolutions)� At 198 of those meetings we opposed one or more resolutions� We voted with management by exception at 87 meetings and abstained at 3 meetings� We supported management on all resolutions at the remaining 180 meetings�

10
Federated Hermes Investment Funds Public Limited CompanyInvestment Manager Information (Unaudited) (continued)
Statistics TotalTotal meetings voted in favour 180
Meetings where voted against (or voted against AND abstained) 198
Meetings where abstained 3
Meetings where voted with management by exception 87
Total meetings 468
Source: Hermes 01/01/2020 - 31/12/2020
Engagement
Throughout 2020, for Federated Hermes Investment Funds Public Limited Company, we engaged with 410 companies on 1,478 issues and objectives� Federated Hermes’ holistic approach to engagement means that we typically engage with companies on more than one issue simultaneously� The engagements included in these figures are in addition to our discussions with companies around voting matters.
Theme TotalEnvironmental 328
Social and Ethical 297
Governance 564
Strategy, Risk and Communication 289
Total 1,478
Source: Hermes 01/01/2020 - 31/12/2020
Hermes Investment Management Limited (continued)
Voting (continued)

11
Federated Hermes Investment Funds Public Limited CompanyInvestment Manager Information (Unaudited) (continued)
Federated Investment Counselling
About the adviser
Federated Investment Counseling and other subsidiaries of Federated Hermes advise approximately 163 equity, fixed-income and money market mutual funds as well as a variety of other pooled investment vehicles, private investment companies, and customized separately managed accounts (including non-U�S�/offshore funds), which totaled approximately $619�4 billion in assets as of December 31, 2020� Federated Hermes was established in 1955 as Federated Investors, Inc�, and is one of the largest investment managers in the United States with nearly 1,900 employees� Federated Hermes provides investment products to more than 11,000 investment professionals and institutions. The Adviser advises approximately 75 fixed-income and money market mutual funds (including sub-advised funds) and private investment companies, which totaled approximately $370�2 billion in assets as of December 31, 2020�
Our commitment to Responsible Investing
As a global investment manager Federated Hermes’ mission is to be a responsible steward of the financial assets entrusted to us by our clients� Whether clients are state pension funds, an endowment fund, businesses seeking liquidity solutions, or investors saving for retirement, helping clients achieve their financial goals informs our decision making at every level� It is a responsibility we undertake with great care, guided by the conviction that responsible investing is the best way to create wealth over the long term�
All of our efforts on behalf of our clients start with our investment process where our goal is to produce superior, risk-adjusted returns� In pursuit of this goal, Federated Hermes employs an intensive, research-driven, bottom-up fundamental approach to our security selection and portfolio construction processes� Quantitative and qualitative factors are incorporated into our analyses in order to better understand the full spectrum of risks and opportunities inherent in each security�
While we believe that quantitative analysis provides the most concrete insight into the financial return potential of an issuer we also understand that investing in today’s global and complex businesses requires a broader view of a company or an issuer and must include an assessment of intangible risk and, as long-term shareholders and debtholders, future risk. Today’s economy is heavily influenced by intangible assets where potential risks and opportunities include qualitative factors such as brand and reputational risk, global supply chain risk or poor governance structure – also known as Environmental, Social and Governance (ESG) factors�
Federated Hermes views ESG factors as qualitative or non-financial metric information that is integral to our fundamental analysis process because consideration of these factors helps us assess risks that, while real, can be less apparent or have yet to fully manifest themselves or are inconsistent with long-term secular trends� We believe relevant and material ESG factors help identify business and operational risks – and opportunities – and add a contextual dimension to the overall evaluation of a security� This integrated approach to security analysis provides important insights into how a company leverages its tangible and intangible assets to create long-term value for stakeholders and determine if there are material risks to an investment thesis that have not been adequately assessed�
Our approach to responsible investing emphasizes proprietary, in-house resources: ESG data analytics, research and issuer engagement supported by a global team of ESG subject-matter experts across our engagement and stewardship and responsible investing offices.
Our Commitment to ESG Integration
Our commitment to incorporating ESG factors into our investment process is rooted in integration – an inclusive investment strategy in which material ESG factors are complementary and additive to the fundamental research and analysis process� We believe ESG factors provide a different lens by which to assess a company and work in tandem with traditional financial metrics to provide a more holistic view of an issuer and the risks and opportunities it faces�

12
Federated Hermes Investment Funds Public Limited CompanyInvestment Manager Information (Unaudited) (continued)
Responsible asset managers, including Federated Hermes, can approach the inclusion of ESG factors through a variety of strategies either separate from or in addition to ESG integration, depending on the specific investment needs of the investor� We believe ESG integration is the most broadly applicable strategy across all asset classes and investment objectives because we believe it offers three advantages: it provides the broadest universe of potential investments; it includes the financial insights derived by the critical scrutiny of a balance sheet; and, it includes those metrics that are not measured by a balance sheet but can contribute greatly to the overall long-term success of an enterprise�
However, in meeting the needs of specific investors Federated Hermes can employ some or all of these other widely-accepted ESG strategies:
• Exclusions, where specific sectors, industries or companies are excluded from the universe of potential investments to accommodate the specific values or mission statement of an investor;
• Best-in-Class, where issuers are selected based on their ESG ratings as ESG leaders within their peer group, tilting the portfolio holdings to higher ESG-rated companies;
• Thematic, where a portfolio is constructed around a specific ESG theme such as renewable energy or women-led businesses;
• Impact, where investment are made with the intention of generating positive, measurable social or environmental impact alongside a financial return. These societal and environmental benefits are considered equally important as financial returns.
Federated Investment Counselling (continued)
Our Commitment to ESG Integration (continued)

13
Federated Hermes Investment Funds Public Limited CompanyInvestment Manager’s Report
Performance Update Returns to the financial year ended 31 December 2020
One Year
Return % Benchmark %Relative
Performance %
Federated Hermes Global Emerging Markets Equity Fund1 20�26 14�65 4�89Federated Hermes Global Equity Fund1 12�66 12�32 0�30Federated Hermes European Alpha Equity Fund 12�60 2�13 10�26Federated Hermes Global High Yield Credit Fund 1�24 4�66 (3�27)Federated Hermes Europe ex-UK Equity Fund 23�37 7�49 14�78Federated Hermes US SMID Equity Fund1,2 5�50 16�18 (9�19)Federated Hermes Asia ex-Japan Equity Fund1 6�98 21�27 (11�78)Federated Hermes Global Equity ESG Fund1 15�46 12�67 2�48Federated Hermes Multi-Strategy Credit Fund3 4�72 6�61 (1�77)Federated Hermes Global Small Cap Equity Fund1 8�53 12�39 (3�43)Federated Hermes Absolute Return Credit Fund4 3�11 3�28 (0�16)Federated Hermes SDG Engagement Equity Fund1 4�08 12�10 (7�16)Federated Hermes Impact Opportunities Equity Fund1 24�20 12�66 10�24Federated Hermes Unconstrained Credit Fund5 11�63 6�26 5�06Federated Hermes Global Emerging Markets SMID Equity Fund 17�23 10�80 5�81Federated Hermes SDG Engagement High Yield Credit Fund 7�40 6�48 0�87Federated Hermes US High Yield Credit Fund6 5�71 7�77 (1�91)
Note:Relative performance returns are calculated on a geometric basis. Total Return is calculated on the primary ‘F’ share class and is shown in GBP except Federated Hermes Global High Yield Credit Fund which is shown in EUR and Federated Hermes Multi-Strategy Credit Fund, Federated Hermes Absolute Return Credit Fund, Federated Hermes Unconstrained Credit Fund and Federated Hermes SDG Engagement High Yield Credit fund which are shown in USD, net of fees�
Returns are based on the midday F GBP Acc NAV since seeding except Federated Hermes Global High Yield Credit Fund, which is based on F EUR Acc and Federated Hermes Multi-Strategy Credit Fund, Federated Hermes Absolute Return Credit Fund and Federated Hermes Unconstrained Credit Fund and Federated Hermes SDG Engagement High Yield Credit Fund which are based on F USD Acc�
Returns are all based on midday pricing apart from Federated Hermes Global High Yield Credit Fund, Federated Hermes Multi-Strategy Credit Fund, Federated Hermes Absolute Return Credit Fund and Federated Hermes Unconstrained Credit Fund which are based on close of business� All benchmarks/targets are based on close of business prices�
1 Benchmark is net of withholding tax�2 Russell 2500 TR net benchmark is calculated from the penultimate working day of each month�3 ICE BofA Merrill Lynch Global High Yield Index (Hedged USD) is a measure used to monitor the performance of the Federated Hermes Multi-Strategy Credit Fund but not the benchmark�4 3M LIBOR +2�0% is a target not a benchmark�5 3M LIBOR +5�0% is a target not a benchmark�6 As Hermes US High Yield Credit Fund launched on 21 July 2020, the performance data presented is from inception date to year end�

14
Federated Hermes Investment Funds Public Limited CompanyInvestment Manager’s Report (continued)
Federated Hermes Global Emerging Markets Equity Fund
Market ReviewThe MSCI Emerging Markets benchmark index returned 18�31% in US dollar terms (14�65% in sterling terms) over the period to outperform developed markets, measured by the MSCI World which returned 14�0%�
Emerging-market equities fell sharply in the first quarter as the spread of coronavirus, initially isolated to China, quickly morphed into a pandemic� Markets sold off aggressively in March as the increase in cases outside China, notably in Europe and the United States, and the ensuing response to lockdown in affected economies, prompted central banks into swift action to help steady fears of a prolonged recession� Oil was caught in a perfect storm with an agreement between OPEC and Russia to constrain supply breaking down just as the outlook for demand fell� A stronger US dollar and plummeting oil prices further pressured emerging markets�
The second quarter delivered a strong initial rebound as central banks and governments cut borrowing rates and announced significant stimulus packages to reduce the damage caused by the economic shutdown, restoring positive sentiment to markets� The number of reported cases in some parts of Asia trended down and economies began reopening, particularly in China, South Korea, and Taiwan, while concern increased around rising cases in the United States, India, and Latin America�
Markets climbed higher in the third quarter despite an acceleration in the number of new cases of Covid-19 reported in several countries and an escalation in US-China tensions� Emerging-market equities recorded the highest quarterly gain in over a decade in the fourth quarter, boosted by the announcement of three vaccines deemed effective against the coronavirus, which added fuel to the post-US-election rally� The risk-on mood helped eclipse worries about the near-term global economic outlook and new variants of the virus which surfaced in the closing weeks of the year� The rally in commodity prices was supportive of emerging-market exporters, the year’s biggest losers gaining the most in the final quarter: Columbia, Brazil, Mexico, Peru, Czech Republic, Hungary, Turkey, and Thailand all returned more than 20%�
Since equity markets hit bottom in late March, the dollar has weakened overall by 11%� In addition to the expectation that the Federal Reserve will keep US interest rates low for some time, sizable fiscal stimulus is likely under the new administration, potentially leading to a wider fiscal deficit and ultimately a stable or weaker US dollar in 2021.
The MSCI EM Index posted an impressive recovery of more than 70% following the precipitous drop in global stock markets in the first quarter, on par with both US equities and the broader developed markets.
South Korea was the best-performing market in the index, followed by Taiwan and China� Their respective governments dealt well with Covid-19 outbreaks and reopened to a much greater extent than most� Korea and Taiwan were boosted by strong gains from the technology sector. As the "first in, first out” in the Covid-19 pandemic, China enjoyed a much faster recovery in 2020, leading to a return of 29% in US dollar terms� Though China’s recovery since the bottom has not been as large as the broader index, its equity market fell significantly less in the first quarter as the government was able to effectively manage the spread of the virus. However, the launch of an anti-trust investigation into Alibaba and further escalation in US-China tensions in the final quarter dragged on sentiment�
At the sector level, Information Technology, Health Care and Consumer Discretionary outperformed, while Real Estate, Energy and Financials lagged the most�
Investment Strategy At a country level, we believe the Fund is well positioned for either the prospect of a global economic recovery or any near-term challenges from new variants of the virus, lockdown delays and withdrawal of stimulus� We maintain the Fund’s underweight to China given escalating geopolitical tensions and domestic risks, and an overweight to Korea and Taiwan, which are likely to benefit from a global economic recovery given their strong capability in semiconductors, memory, 5G, automation, artificial intelligence (AI) and electric vehicles (EV).
We continue to avoid what we view as the most vulnerable markets, such as South Africa, Saudi Arabia, Malaysia, the Philippines, Argentina, and Columbia� The Fund is underweight Brazil given its weak domestic sector, fragile fiscal situation, and elevated valuations. We retain the Fund’s overweight position in Mexico, which shows no major vulnerability and should benefit from strong earnings rebound in 2021.

15
Federated Hermes Investment Funds Public Limited CompanyInvestment Manager’s Report (continued)
We initiated a Fund position in China Merchant’s Bank (CMB), China’s sixth-largest commercial bank and the largest joint-stock bank in China� CMB is distinct from China’s big four banks, which are state-owned and called upon to enact government policy� In contrast, CMB is a market-driven bank where the interest of minority shareholders is aligned with the management. CMB has China’s most profitable retail-banking franchise, one of the strongest wealth-management platforms and largest credit-card businesses, as well as a solid corporate banking unit� Drivers of market share include its service quality, solid technology, and emphasis on cross-selling� As a leading retail bank with proven track record, CMB looks well positioned to capture the long-term growth potential in retail banking, particularly given still heathy household financial asset growth, despite some moderation in China’s GDP.
We used market weakness to add to Fund positions in Polymetal, Baozun, Banorte and KB Financial Services� We also added to holdings in Epiroc, Samsung Electronics and AIA, given our assessment of these stocks’ attractive risk-reward profiles.
We trimmed several Fund names, including NC Soft, Tech Mahindra, WEG, Delta Electronic, TSMC and Aier Eye Hospital following strong performance year-to-date� We reduced Alibaba given the heightened delisting threat from the US government and an intensification of domestic regulatory pressure.
Performance ReviewThe Fund returned 20�26% over the period in Sterling terms (net of fees, outperforming on a relative (geometric) basis by 4�89%)� The outperformance was driven primarily by country allocations, notably our exposure to China, which was ‘first in’ and ‘first out’. The currency impact associated with China exposure as the Renminbi appreciated, and avoiding underperforming markets hit hardest by the pandemic, including Thailand, Malaysia, South Africa, Chile, and Saudi Arabia, helped the performance. Our overweight Taiwan, which outperformed, also benefitted. Stock selection in Taiwan, Russia, and Hungary contributed positively, offsetting a Healthcare name’s negative impact in the United Arab Emirates and disappointing selection in China�
The overweight allocation and stock selection in Communication Services and Information Technology contributed the most to relative returns at the sector level. Non-exposure to energy, the underweight financials, and selection within also benefited, offsetting Health Care and Consumer Discretionary names that detracted.
Delta Electronics, a Taiwanese global leader in switching power supply solutions, was the largest individual contributor� Delta rose as earnings for its power business were driven by strong PC/server demand� The company’s’ leading position in power should ensure it keeps benefiting from increasing cloud applications and telecom infrastructure upgrades. Its Industrial Automation (IA) business should also benefit from ongoing supply chain relocation and increasing automation� Shares in Tencent rose on strong results driven by a rebound in revenue from social advertising and mobile gaming revenue, which benefitted from several hit games and the pandemic’s stay-at-home environment, which attracted traffic and increased user time. Techtronic Industries, a Hong-Kong listed manufacturer of cordless power tools, rose after delivering strong results through the year, benefitting from the positive momentum in DIY, strong traction in e-commerce sales, and innovative new product launches�
NMC Healthcare, which operates hospitals in the Middle East, detracted the most from relative returns� Shares in NMC were suspended on 27th February 2020, after an independent investigation into the allegations made by short-seller Muddy Waters discovered businesses controlled by a founder of the company and an associate allegedly accessed US$4bn in secret off-balance-sheet financing without the knowledge of its Board. We marked down the shares to zero� NMC subsequently went into administration, and shares were delisted on 28th April 2020� Shares in China Communication Services, a leading 5G infrastructure service provider, fell as its majority shareholder China Telecom was named in a US executive order banning US investment in 31 Chinese companies deemed to have ties to China’s military� Non-exposure to Meituan Dianping, a Chinese e-commerce provider, detracted as its shares more than doubled during the period thanks to strong demand for its food delivery business and increased market share�
OutlookAfter a surprisingly robust recovery in 2020, emerging market equities look set for a positive year in 2021 as North Asia, which constitutes the majority of the benchmark, exhibited notable competence in dealing with the virus and thus looks set to build on good numbers in 2020�
Federated Hermes Global Emerging Markets Equity Fund (continued)
Investment Strategy (continued)

16
Federated Hermes Investment Funds Public Limited CompanyInvestment Manager’s Report (continued)
But North Asia won’t be the only place for performance� The global economy should see a recovery in the second half of the year, as vaccines are distributed and global confidence returns, helping commodity producers like Indonesia, Peru, Russia, and Mexico� Of course, the Democrats’ victory may see less infrastructure spending than previously hoped, as the prospect of vaccination lends credence to a policy of fiscal prudence, one which will be wholeheartedly endorsed by the Republicans in the US Senate� Emerging market valuations appear supportive as they are at the low end of their long-term range relative to developed ones�
In Latin America, although Biden should be more engaged, local politics will remain volatile� However, economic growth should be positive, even if not all countries have secured vaccines� The EMEA region will see a more difficult US/Russia relationship but better demand for energy, base metals, and platinum/palladium, aiding Russia, and South Africa� However, politics will remain challenging in the latter, and prospects for the current rally to last through 2021 are modest�
Overall, 2021 is likely to be a good year for financials and materials, but longer-term, high economic growth rates are not on the cards, so cyclicals remain more of a trade for 2021 than a secular investment� Secular trends like digitalisation, increasing spending on health care, logistics, and premium products should continue�
Hermes Investment Management Limited February 2021
Federated Hermes Global Emerging Markets Equity Fund (continued)
Outlook (continued)

17
Federated Hermes Investment Funds Public Limited CompanyInvestment Manager’s Report (continued)
Federated Hermes Global Equity Fund
Market ReviewThe MSCI World Net Index returned 12�32%, in sterling terms in 2020� It is easy to forget that investors entered 2020 in a positive frame of mind� Global equity markets were boosted by some real progress in the US-China trade dispute, a positive earnings season and the expected cut in interest rates by the Federal Reserve� However, news was already filtering through about the Covid-19 outbreak in China and hopes that it would be contained proved to be forlorn. As the virus started to spread across the globe, turmoil, reminiscent of the great financial crisis, gripped the markets as volatility spiked, risk aversion spiked and markets plummeted� Compounding matters was the collapse of the oil price after Russia and Saudi Arabia initiated a price war�
As whole economies shut down, companies perceived to have the ability to survive the looming economic slump performed relatively well. This was reflected by a clear preference for balance sheet strength and operational efficiency. Markets then rallied, fuelled by unprecedented government interventions and a massive loosening of monetary policy. The recovery period saw markets become polarised between companies that benefited from the pandemic, such as health care, mega cap tech and eCommerce exposure, and those that lost out, such as travel, tourism and financials. This continued into Q4, bar a couple of short and sharp rotations and, from a factor perspective, investors favoured growth, profitability and sentiment at the expense of valuation.
The US elections, which saw Joe Biden emerge victorious gave markets a boost in early November, but it was Pfizer’s announcement of a Covid-19 vaccine a few days later (swiftly followed by announcements from Moderna and AstraZeneca) that resulted in a real change in risk appetite� Share prices of companies that had been most challenged by the pandemic surged, which saw investors rotate towards value and little else�
Investment StrategyOur investment approach remains focused on stock selection, with neutral sector and regional biases� The Global Equity Fund uses systematic fundamental analysis to assess the attractiveness of over 5,000 stocks on a daily basis� This analysis involves a disciplined bottom-up stock-selection process, which is based on well-documented anomalies and trends in investor behaviour� The Fund aims to take advantage of the systematic behavioural biases of market participants, while remaining cognisant of the risks associated with modelling such behaviour�
We determine a stock’s fair value using metrics from a company’s financial statements. Our modelling looks at a wide variety of stock characteristics (often referred to as factors) and is designed to proxy expected investment returns and the behaviour of market participants� The Fund’s multi-factor approach ensures it remains exposed to a range of styles, and it aims to generate outperformance in all market environments� We closely monitor the performance of each factor and aim to build stock-selection models that deliver consistent and sustainable excess returns�
Portfolio modelling is used in the portfolio-construction process to develop a trade-off between expected return and portfolio risk, allowing for both portfolio constraints and transaction costs� The process is further supplemented by portfolio-exposure analysis using our proprietary risk-modelling system, MultiFRAME, which allows us to assess the Fund’s exposure to any quantifiable risk factor.
Unlike traditional quantitative strategies, we also undertake analysis on a disciplined and subjective stock-level basis� The team uses its extensive experience to challenge the output of the investment model and remove trades that are subject to significant non-quantifiable factors or unreliable inputs.
Performance ReviewThe Fund returned 12�66% during the period, outperforming the benchmark index return of 12�32% by 0�30%� Stock selection was the driving force behind the outperformance, although given the divergence in returns at both the sector and regional level, allocation also had a considerable influence. From a sector viewpoint, selection in Health Care, Industrials, Consumer Staples, Utilities and Real Estate contributed the most to relative returns� These outweighed detractions from selection in Consumer Discretionary and Communication Services and our underweight in Information Technology� From a regional viewpoint, selection in Europe and Japan was successful, outweighing detractions from selection in North America and our overweight in Europe�

18
Federated Hermes Investment Funds Public Limited CompanyInvestment Manager’s Report (continued)
The largest individual contributors were ASML, Lonza Group and West Pharmaceuticals� ASML saw little impact from Covid-19, with demand for its EUV machinery strong as the requirement for smaller, more powerful and more efficient semiconductors increased. Lonza Group benefited from high demand for outsourced drug manufacturing and gained further after announcing a global collaboration with Moderna to manufacture its coronavirus vaccine� West Pharmaceuticals is exposed to the same outsourcing trends as Lonza Group and consistently beat expectations over the year�
The largest detractors were Tesla, Delta Air Lines and Oasis Petroleum� Tesla, which is not held in the Fund, performed extremely well in 2020� Model 3 and Model Y production and deliveries continue to exceed expectations with China becoming a source of real strength� However, concerns over governance and its valuation have prevented our investment in the company� Delta Air Lines was impacted by Covid-19 and the subsequent global lockdown that decimated air travel in the period� Oasis Petroleum was impacted by the fall in the oil price in the first half of the year as consumption fell, but supply remained high.
OutlookThe roll-out of vaccines have provided genuine hope that, despite rising numbers of cases, the worst may soon be behind us. This has already benefited areas that were most challenged by the pandemic and there are reasons to believe this could continue, especially when you consider the relatively low earnings base for these areas� Meanwhile, those that benefited the most, especially if the benefit was temporary, will have more challenging comparable earnings to beat� In other words, markets could remain polarized for a while, but in a mirror image of 2020�
Over the longer-term, the transition to a more sustainable economy continues to represent an exceptional market opportunity� Fiscal spending is going to play an important role in stimulating economic recovery and we believe that issues such as climate change will be at the centre of future policy and legislation� Moreover, consumers are becoming more aware of environmental and social issues, affecting all corners of the market� As such, those helping to address the major challenges we face today should continue to benefit, while those that fail to become cleaner and greener will likely suffer�
Hermes Investment Management Limited February 2021
Federated Hermes Global Equity Fund (continued)
Performance Review (Continued)

19
Federated Hermes Investment Funds Public Limited CompanyInvestment Manager’s Report (continued)
Federated Hermes European Alpha Equity Fund
Market ReviewThe MSCI Europe returned 2�13% (GBP) in 2020� The year started with investors in a positive frame of mind as European equity markets initially increased� However, this was short-lived as the coronavirus outbreak spread across the globe, resulting in widespread lockdowns� Compounding matters was the breakdown in talks between Russia and Saudi Arabia that led to the oil price collapsing�
The result was a sharp decline in global equity markets, while volatility spiked to levels not seen since the financial crisis� In response, central banks across the globe slashed interest rates and expanded quantitative easing� Markets then staged a strong recovery, driven by beneficiaries of the pandemic and sustainable growth areas such as renewable energy�
Over the summer months, sentiment continued to be driven by news surrounding the virus and while there was much talk of the growth-value tussle, it was quality that investors ultimately sought the most as fears of a second wave of Covid-19 weighed on risk appetite towards the end of the summer�
This environment continued into Q4, but things were about to change. Pfizer’s positive vaccine data (swiftly followed by Moderna and AstraZeneca) resulted in an overnight change in risk appetite� Equity markets surged as investors switched preference to areas of the market that had been most challenged throughout the year, despite the rising numbers of cases in the region�
Investment StrategyAmong the most notable trades were purchases of Idorsia, Soitec and Experian� Spun out from Actelion after its 2017 buy-out by Johnson & Johnson, Idorsia retained the predecessor’s leadership team who negotiated a carve-out, including the right to early-stage drug developments� Among these is the insomnia treatment, Daridorexant, which is in the latter stages of clinical development and, we believe that it offers the most exciting opportunity�
Soitec is seeing rising demand for its specialised semi-conductor wafers due the increasing complexity of smartphones. The French company is one of the handful making energy-efficient ‘silicon on insulator’ (SOI) wafers that are attractive components for the new breed of power-hungry devices�
Experian is the world's largest credit bureau, maintaining credit information on consumers and businesses worldwide. It is a high-quality company, operating in oligopolistic markets and is benefiting from regulatory change and the data monetisation megatrend�
We also exited Griflols following concerns that new therapies for two diseases - Antitrypsin Deficiency and Myasthenia Gravis – could damage the long-term earnings of the company�
The structure of the Fund has remained broadly the same over the period� The largest overweight positions remain in Information Technology, Health Care, Consumer Discretionary and Industrials, while Consumer Staples, Utilities, Financials and Materials are the largest underweights� From a style perspective, the structure also looks similar with a bias away from value and towards growth and quality� The Fund’s largest exposures are a lower book-to-price ratio, market capitalisation and dividend yield� It also has a notable tilt towards companies with higher forecast growth and net profit margins.
Performance ReviewThe Fund returned 12�60%, outperforming the benchmark index by 10�26% in 2020� The largest contributions came from selection in Health Care, Industrials, Financials and Energy, alongside our overweights in Information Technology, Health Care and Consumer Discretionary and our underweight in Energy� These were partially offset by detractions from selection in Information Technology and Consumer Discretionary and our underweights in Utilities and Materials�
On an individual basis, the largest contributors were Siemens Gamesa, Lonza Group and Pandora� Siemens Gamesa has continued to see a strong order book, while earnings have been robust, particularly on the service side. In addition, renewable energy stocks have benefited from strong sentiment. Lonza Group benefited from high demand for outsourced drug manufacturing and gained further after announcing a global collaboration with Moderna to manufacture its proposed coronavirus vaccine� Pandora has reported earnings and sales ahead of expectations, driven by online sales, which have boosted margins�

20
Federated Hermes Investment Funds Public Limited CompanyInvestment Manager’s Report (continued)
Wirecard, Bayer and Sodexo were the largest detractors� Wirecard fell after Ernst & Young failed to sign off its annual report, citing €1�9bn-worth of unaccounted cash� Bayer had the largest negative impact on the portfolio after it agreed an $11bn class action settlement relating to its weedkiller, Roundup� It also reported mixed results in September with higher-than-expected earnings leavened by disappointing revenue guidance (attributed to projected under-target growth in crop science)� Sodexo fell due to the impact of the economic lockdown which affected its catering services business�
OutlookThe development and roll-out of Covid-19 vaccines is undoubtedly positive: while the rising number of cases offers a sobering reminder that we are not yet out of the woods, there is now a clear pathway out of the crisis� From here, we should start to see more companies demonstrate earnings growth� This should be especially the case within the more cyclical areas as weak earnings previously should lead to rapidly improving earnings in relative terms� There is a danger, however, that this strong growth could be over-extrapolated into the future�
Meanwhile, the likelihood of rising yields and inflation is an increasingly popular topic among market participants, and one that we are paying close attention to� Such an environment would make higher-multiple stocks more vulnerable and provide a boost to value companies� However, momentum remains strong for some of the higher-multiple names and as valuations rise, company fundamentals will become more important� As such, being selective will be important in a market that is likely to become more discriminating�
Hermes Investment Management Limited February 2021
Federated Hermes European Alpha Equity Fund (continued)
Performance Review (continued)

21
Federated Hermes Investment Funds Public Limited CompanyInvestment Manager’s Report (continued)
Federated Hermes Global High Yield Credit Fund
Market Review2020 was an unprecedented year on many counts and credit markets were extremely volatile as Covid-19 rapidly spread across the world� In March at the peak of the sell off, credit markets sold off to the lowest levels seen since the Global Financial Crisis but then rallied back over the course of the year driven by huge support from the world’s largest central banks who launched large bond buying programmes and fiscal relief programmes from governments around the world�
The S&P 500, the Dow Jones and the MSCI World index closed at record levels on 31 December 2020 with the S&P experiencing an +18�4% advance in total return terms over the year� However, the best equity performance came from technology stocks, with the NASDAQ seeing a +45�1% return over the year� Within credit, returns from investment grade (IG) led the way, with the ICE BofA Global Corporate index returning 7�7% for 2020� High yield returns were not far behind: the ICE BofA Global High Yield index returned 6�3% for 2020� The iTraxx Crossover ended the year at 242, having started the year trading at 207 (its 2020 range was 207 – 708)� The VIX index ended the year at 23 having started the year at 12 (its 2020 range was 12 – 83)�
After seeing $14tn of fiscal stimulus in 2020, we note that the quantity of global debt now stands at a record $277tn� The price of debt also stands at a record 5,000-year low with global negative-yielding debt in the region of $18tn. December 2020 saw the approval of three Covid-19 vaccines with high efficacy ratios, and this helped markets to stage a strong close to the year�
Investment StrategyAt the start of the year we continued to optimise the Fund’s convexity profile by selling bonds trading above call, particularly in cyclical sectors� In some cases, we re-allocated that capital into more defensive sectors via the primary market� We switched from CDS into bonds in structures, where we saw attractive relative-value opportunities� On the back of changes in relative value, we reduced our exposure to UK speciality insurance�
During Q1 and entering the Covid-19 selloff, we shifted capital away from cyclical industries into more defensive, higher-quality names that had underperformed in the first stage of the sell-off.
In May, given some material changes to the index, with many fallen angels entering the benchmark, we added to the Energy and Automotive sectors, particularly via fallen angels� Towards the end of Q2, we also noticeably saw that compression between secured and unsecured bonds in the market created opportunities to switch from unsecured into senior parts of the capital structure. We also took advantage of flatter curves by switching from longer dated to shorter dated�
In the second half on the year, we increased our exposure to European corporate bonds and financials as Europe had underperformed the rest of the world� Due to compression between senior and subordinated securities we switched from senior into secured in certain capital structures (such as the Metals & Mining sector)�
From Q3 onwards, we witnessed a strong recovery in some of our idiosyncratic holdings� As such, we reduced our exposure to Retail, Energy and Aircraft Lessors, and added to core holdings across non-cyclical sectors, such as Telecommunications, Packaging and Healthcare� We took advantage of some attractive capital structure opportunities, particularly in Financials as current valuations remain attractive� In our view, investors are being well compensated for future risks�
Performance ReviewThe Fund returned 1�24% in 2020, underperforming its benchmark by 3�27%�
The Fund’s positioning in Banking, Basic Industry and Telecommunications were its top contributors to its relative performance� Its positioning in Leisure, Energy and Real Estate were its biggest detractors on a sectoral basis� At the individual holdings level, the Fund’s positions in Air Lease (Financial Services), Phoenix (Insurance) and Occidental Petroleum (Energy) boosted its relative return the most, while its positioning in Plains All American Pipeline and Pemex (both Energy) and AerCap (Financial Services) detracted from its relative return the most� From a rating’s perspective, the Fund’s positioning in BBB issuers and underweight positioning in CCC- and lower-rated issuers positively impacted its relative performance, while BBs and moderate underweight in single Bs negatively impacted its relative performance� At the regional level, the Fund’s positioning in Western Europe and the UK were its top contributors to its relative performance, while its positioning in MEA, Asia EM and North America detracted the most�

22
Federated Hermes Investment Funds Public Limited CompanyInvestment Manager’s Report (continued)
OutlookWe remain reasonably constructive on the high-yield asset class for 2021� Historically, we have seen that high yield tends to outperform as the US climbs out of recession, and this cycle should not be different� The are several positives such as economic conditions that are showing signs of improving, with global Purchasing Managers’ Indices (PMIs) continuing to print above 50 and positive breakthroughs on the vaccine front providing some visibility on a return to normality� In addition, corporate earnings continue to surprise to the upside and rating downgrades have slowed� That said, we do not rule out further bouts of volatility, although unlikely to be at last year’s extreme levels, as the global recovery may be slower than expected as many countries shutter their economies in the early part of Q1 2021� Temporary cost-cutting measures are rolling off and companies are beginning to reintroduce capital expenditure (capex) spending and dividend programmes and we observe an increase in global M&A activity�
We believe that credit investors will need to focus more on relative value to generate alpha this year� High-yield credit should see positive tailwinds from the continued high proportion of negative-yielding assets and pressure on dividends in equities. Inflation expectations are slightly higher since September, especially in the US, however the likelihood of an inflation surprise in the short term remains low. We have a preference to still be defensively positioned in our sector and regional allocations, given current valuations� We also see some merit in taking subordinated risk in industry leaders and national champions, rather than chasing yield in much weaker and lower-rated credits. Interest rate curves are flatter in Europe than the US. This means that it is more expensive to hedge interest rate exposure using US rates as opposed to European rates� However, taking into account the divergent inflation expectations between the two regions, we still prefer to express our portfolio hedge via US rates.
Hermes Investment Management Limited February 2021
Federated Hermes Global High Yield Credit Fund (continued)

23
Federated Hermes Investment Funds Public Limited CompanyInvestment Manager’s Report (continued)
Federated Hermes Europe ex-UK Equity Fund
Market ReviewThe MSCI Europe ex UK returned 7�49% (GBP) in 2020� The year started with investors in a positive frame of mind as European equity markets initially increased� However, this was short-lived as the coronavirus outbreak spread across the globe, resulting in widespread lockdowns� Compounding matters was the breakdown in talks between Russia and Saudi Arabia that led to the oil price collapsing�
The result was a sharp decline in global equity markets, while volatility spiked to levels not seen since the financial crisis� In response, central banks across the globe slashed interest rates and expanded quantitative easing� Markets then staged a strong recovery, driven by beneficiaries of the pandemic and sustainable growth areas such as renewable energy�
Over the summer months, sentiment continued to be driven by news surrounding Covid-10 and, while there was much talk of the growth-value tussle, it was quality that investors ultimately sought the most as fears of a second wave of Covid-19 weighed on risk appetite towards the end of the summer�
This environment continued into Q4, but things were about to change. Pfizer’s positive vaccine data (swiftly followed by Moderna and AstraZeneca) resulted in an overnight change in risk appetite� Equity markets surged as investors switched preference to areas of the market that had been most challenged throughout the year, despite the rising numbers of cases in the region�
Investment StrategyAmong the most notable trades were purchases of Idorsia, Alcon and Schneider Electric�
Idorsia is the product of a spin-off from Actelion after the latter’s 2017 buy-out by Johnson & Johnson� Idorsia’s leadership team negotiated a carve-out, including the right to early-stage drug developments� Among these is the insomnia treatment, Daridorexant, which is in the latter stages of clinical development and, we believe it offers the most exciting opportunity�
Alcon is most commonly known for its contact lenses, but it is a leading med-tech business, specialising in equipment for eyecare specialists and surgeons�
Schneider Electric is emerging from an intense restructuring period incorporating acquisitions as well as the active offloading of unattractive assets. Now on the other side of its reinvention process, it has transformed itself into a company with exposure to two significant structural growth trends: energy efficiency and industry 4.0.
We also exited Barrick Gold and Lundin Energy� Barrick Gold had enjoyed a great run, driven by the rising gold price. Lundin Energy was one of the smallest weights in the portfolio, reflecting our lack of conviction. From a medium-to-long term perspective, we worry about the supply-demand balance in oil markets, and the potential for increasing adverse regulation on fossil fuels sectors�
The structure of the Fund has remained broadly the same over the period� The largest overweight positions remain in Information Technology and Health Care, while Consumer Staples and Financials are the largest underweights� From a style perspective, the structure also looks similar with a bias away from value and towards growth and quality� The Strategy’s largest exposures are a lower earnings yield, market capitalisation and dividend yield� The Strategy also has a notable tilt towards companies with higher forecast growth and sales growth�
Performance ReviewThe Fund returned 23�37%, outperforming the benchmark index by 14�78% in 2020� The largest contributions came from selection in Health Care, Industrials, Utilities, Information Technology, Materials and Energy, alongside our overweight in Information Technology� These were partially offset by detractions from selection in Consumer Discretionary and our overweight in Energy�

24
Federated Hermes Investment Funds Public Limited CompanyInvestment Manager’s Report (continued)
On an individual basis, the largest contributors were Sartorius, Siemens Gamesa and Lonza Group� Sartorius has consistently reported solid results that highlighted huge order intake in its Bio Processing Solutions business� Siemens Gamesa benefited from positive structural tailwinds from the renewable energy sector, solid order flow and signals from peers that most projects remain on track in spite of pandemic-related distractions. Lonza Group benefited from high demand for outsourced drug manufacturing and gained further after announcing a global collaboration with Moderna to manufacture its proposed coronavirus vaccine�
Bankinter, Lundin Energy and ING Groep were the largest detractors� Bankinter and ING Groep were affected by the economic impact of the lockdown and the increased likelihood that interest rates will be lower-for longer� Lundin Energy was impacted by the lower oil price due to a combination of reduced demand and plentiful supply�
OutlookOur current mood is one of cautious optimism� The development and roll-out of the Covid-19 vaccine is an undoubted positive. It offers a clear pathway out of the crisis and reflects a high degree of innovation in the private sector, which bodes well for the future� Many companies are also leaner than they were, having been forced to cut costs during the crisis. As fiscal stimulus and easy monetary policy trickles through, we should start to see an upturn in operating leverage as top-line growth accelerates�
Stimulus will also be consistent with the “build back better” policies that politicians across the globe have been championing� Central to this will be tackling climate change, which is one of the reasons why companies addressing this challenge have performed so well� There are some frothy areas though, but this is a natural consequence of ultra-low interest rates and while some are starting to talk of a bubble, we are a long way off the excesses of the TMT bubble in 2000� However, with valuations on the rise, it will be important to remain selective�
Hermes Investment Management LimitedFebruary 2021
Federated Hermes Europe ex-UK Equity Fund (continued)
Performance Review (continued)

25
Federated Hermes Investment Funds Public Limited CompanyInvestment Manager’s Report (continued)
Federated Hermes US SMID Equity Fund
Market ReviewWhile a headline return of 20% for US equity markets may suggest a smooth ride, it’s been anything but� 2020 has been a year of once-in-a-lifetime extremes; the deadliest global pandemic in a century; the deepest quarterly decline in US GDP in history, followed by the steepest quarterly increase on record; the quickest bear market and fastest market recovery ever; congressional approval of the largest-ever fiscal stimulus package ($2.2tn); and development, testing and distribution of efficacious vaccines in less than a year, a process that traditionally takes a decade or longer�
The Russell 2500 Index rose 19�99% (in USD terms)� Equity markets fell sharply in late-February as the spread of Covid-19 triggered fears of a severe global economic slowdown, with a peak-to-trough decline of over 40%� Since the lows in late-March, markets have recovered to new highs buoyed by record low interest rates, financial stimulus from the government and optimism over a recovery� Within the index, there has been a wide variety of returns� Technology and Health Care sectors (the perceived winners from the pandemic) have risen approximately 50%, while Financials and Energy sectors sit in negative territory and lag behind�
Investment StrategySince the start of the year, the team have used the market volatility to trim positions in what they believe are fully valued stocks, or stocks that are set to be materially impacted by the changing landscape and reinvest into high-quality stocks where they see attractive upside potential� We have slightly reduced the total number of positions and continue to upgrade the fund’s sustainability characteristics� Over the full year, we initiated 10 new positions and sold out of 16 companies� With 50-60 holdings, this is in line with our average holding period of 3-5 years�
New positions included PerkinElmer, a leader in kits and associated consumables for the life sciences, food and environmental/industrial testing end markets� NVR, an asset-light homebuilder, which provides high quality exposure to an industry that we believe has been undershooting on supply for the last 10 years� CarGurus, an online auto shopping marketplace that is a two-sided platform, connecting retail car buyers with car dealerships, who pay a monthly subscription� The recent acquisition of CarOffer, a leading automated online wholesale dealing platform, should supercharge growth given the opportunity to sell CarOffer across CarGurus 30,000 dealer base�
Sales included Alliant Energy, which performed well on a relative basis and we believe there are now more attractive ways of capitalising on the shift to renewable energy sources, e�g� Chart Industries� We exited our position in Alimentation Couche-Tard, the leading convenience store operator and fuel retailer in North America with 15,000 stores, as tobacco falls within excluded activities and cigarette sales account for one quarter of sales� Couche-Tard was also no-benchmark� Weingarten Realty Investors was sold as the Covid-19 situation escalated because we believed lockdown restrictions would accelerate a secular move away from retail malls�
Performance ReviewIn a year of excessive volatility, the fund underperformed the index as the extreme market performance left stable, well run businesses behind� The Federate Hermes US SMID Equity Fund returned 10�01% in gross USD terms over the period, underperforming the benchmark index by 8�32%� In net GBP returns, the F GBP Accumulating share class returned 5�50% underperforming the benchmark index return of 16�18% by -9�19%�
Underperformance was primarily driven by negative stock selection in the Financials and Industrials sectors� Sector allocation marginally contributed to relative returns� More pertinently, style has been a headwind for the fund; it is underweight speculative growth companies which outperformed the market in March to May, and underweight cheap, low-quality businesses, which outperformed in November�
The top individual contributor was Abiomed, which has performed well primarily due to the long-term growth opportunity for its “Impella” heart pump� Teradyne saw strong earnings and revenue growth with positive sentiment in the semiconductor cycle, specifically 5G testing and industrial automation. West Pharmaceuticals performed well after reporting an acceleration in revenues driven by higher demand for injection devices from biologic companies�
The largest individual detractor was Reinsurance Group of America� The business has suffered due to prevailing concerns over mortality risk exposure� Tank barge operator, Kirby, saw a sharp drop in revenue from the previous year, particularly across its marine transportation and distribution and services businesses� Wintrust Financial has suffered due to concerns of rising credit losses and the impact of lower for longer interest rates�

26
Federated Hermes Investment Funds Public Limited CompanyInvestment Manager’s Report (continued)
OutlookWhile it is unlikely that 2021 will be as eventful as 2020, it is not safe to assume we are out of the woods yet� Deep divisions remain in the US, both economically and politically, government borrowing is high, and the virus impact will rollover into 2021� Despite this continued uncertainty, it is widely expected to be another positive year for equities and markets are supported by several positive factors, accommodative monetary policy, potential additional fiscal stimulus and an improving economic picture as countries reopen. The Fund is invested in high quality, profitable companies with strong balance sheets and is well positioned to benefit from the normalisation of the US economy and increasing focus on ‘quality’, a factor that has been underappreciated in a world of excess liquidity�
Hermes Investment Management Limited February 2021
Federated Hermes US SMID Equity Fund (continued)

27
Federated Hermes Investment Funds Public Limited CompanyInvestment Manager’s Report (continued)
Federated Hermes Asia ex-Japan Equity Fund
Market ReviewThe MSCI AC Asia ex Japan IMI benchmark index rose 25�13% in US dollar terms (21�27% in sterling terms) over the period to outperform developed markets, measured by the MSCI World Index which returned 16% in US dollar terms�
Asian equities fell sharply in the first quarter as the spread of coronavirus, initially isolated to China, quickly morphed into a global pandemic� Markets sold off aggressively in March as the increase in cases outside China, notably in Europe and the United States, and the ensuing response to lockdown measures in affected economies, prompted central banks into swift action to help steady fears of a prolonged recession� Oil was caught in a perfect storm with an agreement between OPEC and Russia to constrain supply breaking down just as the outlook for demand fell� A stronger US dollar and plummeting oil prices further pressured emerging markets�
The second quarter delivered a strong initial rebound as central banks and governments cut borrowing rates and announced significant stimulus packages to reduce the damage caused by the economic shutdown, restoring positive sentiment to markets� The number of reported cases in some parts of Asia trended down and economies began reopening, particularly in China, South Korea, and Taiwan, while concern increased around rising cases in India�
Markets climbed higher in the third quarter despite an acceleration in the number of new cases of Covid-19 reported in several countries globally and an escalation in US-China tensions� In the fourth quarter, Asian equity markets were boosted by the announcement of three vaccines deemed effective against the coronavirus, which added fuel to the post-US-election rally� The risk-on mood helped eclipse worries about the near-term global economic outlook and new variants of the virus which surfaced in the closing weeks of the year�
Since equity markets hit bottom in late March, the dollar has weakened overall by 11%� In addition to the expectation that the Federal Reserve will keep US interest rates low for some time, sizable fiscal stimulus is likely under the new administration, potentially leading to a wider fiscal deficit and, ultimately, a stable or weaker US dollar in 2021.
South Korea was the best-performing market in the index, followed by Taiwan and China� Their respective governments dealt well with Covid-19 outbreaks and reopened to a much greater extent than most� Korea and Taiwan were boosted by strong gains from the information technology sector. As the "first in, first out” in the Covid-19 pandemic, China enjoyed a much faster recovery in 2020, leading to a return of 29% in US dollar terms� Though China’s recovery since the bottom has not been as large as the broader index, its equity market fell significantly less in the first quarter as the government was able to effectively manage the spread of the virus. However, further escalation in US-China tensions and the launch of an anti-trust investigation into Alibaba in the final quarter hurt sentiment.
At the sector level, Health Care, Information Technology and Consumer Discretionary outperformed, while Real Estate, Utilities and Energy lagged the most�
Investment StrategyThe worst performing parts of our benchmark have been value stocks and their cousin, cyclicals� Companies with leverage have been particularly hard hit (because they are at greater risk of financial distress – even though the credit markets might disagree, with many having the perceived financial strength to continue to tap borrowing markets at very low interest rates)� But paradoxically value stocks with high cash balances have in some cases been hit almost as hard as indebted ones, perhaps on the logic that low interest rates and the potential for general debt monetisation by central banks, reduces the absolute and relative advantage of holding cash�
Looking at our positions (‘short’ mega-cap quality growth and thematic stocks and ‘long’ value and cyclical stocks) has been painful – and it explains the degree of our underperformance� Still, it has not been a perfect storm� We have been aided by our companies being financially strong but, for the most part, not having too much debt (or cash), our underweight in an underperforming cyclically-driven and expensive Indian market, and our overweight in an outperforming technology-driven Taiwan market�

28
Federated Hermes Investment Funds Public Limited CompanyInvestment Manager’s Report (continued)
Most of our trades in the first quarter were to take advantage of volatility and dislocation. For example, some firms that are highly sensitive to the economy have fallen by similar amounts to firms that are less sensitive to the economy� In such cases, we added to the less economically sensitive stock that had been punished or cut the more sensitive stock that had held up relatively well� We tended to trim sharp outperformers and add to sharp underperformers intra-day� In certain cases, we adjusted the market on which we held dual-listed stocks to take advantage of large, likely transient, price differences� We sold KLA Corporation after a strong performance and added to Samsung Electronics and Alibaba, which may prosper in a low-interest-rate environment� We opened positions in Haier Smart Home, a leading global home appliance firm, and Yunnan Baiyao, a leading Chinese health care company�
In the second quarter, we added to some economically sensitive stocks with strong balance sheets that had been hit hard and continued to seek opportunities in stocks that had fallen disproportionately in response to the changing economic landscape� We sold Chinese A-share Shenergy after it held up well in the initial sell-off and opened positions in real estate company China Overseas Land & Investment and port operator Adani Ports at attractive entry points. We also opened a position in Kumho PetroChemical, which stands to benefit from an eventual resumption in economic activity and increased demand for its synthetic rubber components, which are used to manufacture gloves�
In the second half of the year, we sold Kinsus Interconnect and Rohm, and trimmed Mediatek, while adding to our position in JD�Com� We initiated a position in Naspers which has an indirect holding in Tencent that is worth substantially more than 100% of Naspers’ value� In the last year, Naspers has appreciated in dollars by 25% compared to Tencent’s 51%, enabling us to access Tencent’s earnings growth at a multiple below 20x forward earnings� We added to our position in Asustek which is now among our largest top 10 positions and offers a dividend yield of 6% - 15 times the Taiwanese government’s benchmark risk-free 10-year bond rate of 0�35%� We hope that the market recognises the inherent value in the stock and the price rises, but even if Asustek remains a victim of the market’s disdain for value stocks, we are satisfied to be paid to wait while banking the annual yield.
More recently, we added ACC Limited, an Indian cement manufacturer trades at an attractive valuation versus its peers, while delivering strong volume and earnings delivery, capacity expansions and diversified market presence. We also added Hyundai Motor Company which offers exposure to an attractive fast-growing market through its presence in electric vehicles (EV) and fuel cell electric vehicles (FCEV), at a PE of 9x forward earnings� We reduced our exposure to China Oilfield Services and added to Trip.Com and Baidu. Trip.com, China’s largest online travel agency, will benefit from an eventual resumption in travel. Baidu has a relatively cheap valuation and is beginning to attract greater investor attention for its cloud business, self-driving car initiatives and planned Hong Kong dual listing, which will mitigate US regulations requiring the delisting of Chinese companies from US exchanges� We trimmed our positions in Samsung Electronics, TSMC and MediaTek following recent strength, reinvesting the proceeds in Honda Motor and Kunlun Energy� Kunlun Energy recently announced a value-accretive asset disposal�
Performance ReviewThe Fund returned 6�98% in sterling terms (net of fees) over the period, underperforming the benchmark by 11�78%� This was primarily due to stock selection in China and Taiwan, eclipsing gains from our underweight allocation to India and our avoidance of Indonesia, two underperforming markets� The overweight allocation to Korea benefited as the market outperformed while the currency impact associated with our China allocation also contributed as the Renminbi appreciated during the period�
At the stock level, MediaTek, Alibaba and Samsung Electronics contributed the most to the Fund’s relative return� MediaTek, a Taiwanese chip supplier, rose sharply after the US tightened restrictions on Huawei as MediaTek is viewed as an alternative supplier� Our underweight to Alibaba contributed following a sharp sell-off in December on concerns about Chinese regulators targeting the company� Samsung Electronics rose on an improving outlook for memory and potential smartphone market share gains from Huawei, which is subject to US sanctions�
Federated Hermes Asia ex-Japan Equity Fund (continued)
Investment Strategy (continued)

29
Federated Hermes Investment Funds Public Limited CompanyInvestment Manager’s Report (continued)
CK Hutchison, Sinopharm and Beijing Enterprises detracted the most from the Fund’s relative return� CK Hutchison, a Hong-Kong based conglomerate of telecommunications, infrastructure, global ports and energy, fell amid the renewed protests in Hong Kong and a resumption of the US-China trade rhetoric despite a small part of its earnings being derived from Hong Kong� Sinopharm, China’s largest drug distributor, detracted after H1 results highlighted the impact of Covid-19-related disruptions. While the results reflected a steady recovery and were in line with expectations, hospital channel disruption has impacted the pharmaceutical distribution business� Beijing Enterprise Holdings, a holding company mainly involved in the distribution and sale of piped natural gas, fell on expectations of lower growth in gas consumption in 2020�
OutlookLow interest rates have resulted in investors paying for stocks that they consider to be able to grow quickly and sustainably� But low interest rates should support all asset classes� Many stocks in Asia are now offering dividend yields that are many multiples of the relevant risk-free benchmark rate�
In most markets, the price an investor must pay for investing in a high-dividend stock is the likelihood of future earnings (and thus dividends) falling from a high starting point for either structural or cyclical reasons� However, there are now many stocks in Asia offering high dividend yields while having cyclically depressed earnings that are expected to grow� This makes these stocks look particularly attractive (especially relative to some stocks that have performed very well recently) and holds the promise of a potential re-rating� Encouraging vaccine developments could be the catalyst that leads investors’ perceptions of relative attractiveness to change�
Hermes Investment Management Limited February 2021
Federated Hermes Asia ex-Japan Equity Fund (continued)
Performance Review (continued)

30
Federated Hermes Investment Funds Public Limited CompanyInvestment Manager’s Report (continued)
Federated Hermes Global Equity ESG Fund
Market ReviewThe MSCI All-Country World Net Index returned 12�67%, in sterling terms in 2020� It is easy to forget that investors entered 2020 in a positive frame of mind� Global equity markets were boosted by some real progress in the US-China trade dispute, a positive earnings season and the expected cut in interest rates by the Federal Reserve� However, news was already filtering through about the Covid-19 outbreak in China and hopes that it would be contained proved to be forlorn� As the virus started to spread across the globe, turmoil, reminiscent of the great financial crisis, gripped the markets as volatility spiked, risk aversion spiked and markets plummeted. Compounding matters was the collapse of the oil price after Russia and Saudi Arabia initiated a price war�
As whole economies shut down, companies perceived to have the ability to survive the looming economic slump performed relatively well. This was reflected by a clear preference for balance sheet strength and operational efficiency. Markets then rallied, fuelled by unprecedented government interventions and a massive loosening of monetary policy. The recovery period saw markets become polarised between companies that benefited from the pandemic, such as health care, mega cap tech and eCommerce exposure and those that lost out, such as travel, tourism and financials. This continued into Q4, bar a couple of short and sharp rotations and, from a factor perspective, investors favoured growth, profitability and sentiment at the expense of valuation.
The US elections, which saw Joe Biden emerge victorious gave markets a boost in early November, but it was Pfizer’s announcement of a Covid-19 vaccine a few days later (swiftly followed by announcements from Moderna and AstraZeneca) that resulted in a real change in risk appetite� Share prices of companies that had been most challenged by the pandemic surged, which saw investors rotate towards value and little else�
Investment StrategyThe investment approach remains focused on stock selection, with neutral sector and regional biases� The Global Equity ESG Fund uses systematic fundamental analysis to assess the attractiveness of over 5,000 stocks on a daily basis� This analysis involves a disciplined bottom-up stock selection process, which is based on well-documented anomalies and trends in investor behaviour� The strategy aims to take advantage of systematic behavioural biases of market participants while remaining cognisant of the risks associated with the modelling of such behaviour�
We determine fair value for a stock by using metrics from the full range of a company’s financial statements, and our modelling employs a wide variety of stock characteristics (often referred to as factors) designed to proxy expected investment returns and the behaviour of market participants� ESG is embedded in the Alpha Model, using the team’s proprietary QESG Score, which enables the team to identify stocks that have good or improving ESG characteristics� The Fund’s multi-factor approach ensures we remain exposed to a range of styles and it aims to generate consistent outperformance over the long-term� We closely monitor the performance of each factor with the aim of building stock selection models that deliver consistent and sustainable excess returns�
Portfolio modelling is utilised in the portfolio construction process to trade-off between expected return and portfolio risk, allowing for both portfolio constraints and transaction costs� The process is further supplemented by portfolio exposure analysis using our proprietary risk modelling system, MultiFRAME, which allows us to assess the Fund’s exposure to any quantifiable risk factor.
Unlike traditional quantitative strategies, analysis is also completed on a disciplined subjective, stock level basis� The team uses their extensive experience to challenge the output of the investment model and remove trades subject to significant non-quantifiable factors or unreliable inputs. The team also work closely with EOS at Federated Hermes, our in-house stewardship team, who vote and engage with companies on our behalf to further understand the ESG risks and opportunities facing a company�
Performance ReviewThe Fund returned 15�46% during the period, outperforming the benchmark index return of 12�67% by 2�48%� Stock selection was the driving force behind the outperformance and from a sector viewpoint, selection in Health Care, Real Estate, Industrials, Materials, Utilities and Energy, our overweight in Information Technology and underweight in Energy contributed the most to relative returns� These outweighed detractions from selection in Communication Services and Consumer Discretionary� From a regional viewpoint, selection in Europe, Japan and Latin America was successful, outweighing detractions from selection in North America, Emerging Asia and our overweight in Europe�

31
Federated Hermes Investment Funds Public Limited CompanyInvestment Manager’s Report (continued)
The largest individual contributors were Lonza Group, ASML and Daifuku and West Pharmaceuticals� Lonza Group benefited from high demand for outsourced drug manufacturing and gained further after announcing a global collaboration with Moderna to manufacture its proposed coronavirus vaccine� ASML saw little impact from Covid-19, with demand for its EUV machinery strong as the requirement for smaller, more powerful and more efficient semiconductors increased. Daifuku, benefited from growing demand for its distribution centre automation systems used by online retailers and its material handling systems used in warehouses and semiconductor fabs�
The largest detractors were Tesla, Delta Air Lines and M&T Bank� Tesla, which is not held in the Fund, performed extremely well in 2020� Model 3 and Model Y production and deliveries continue to exceed expectations with China becoming a source of real strength� However, concerns over governance and its valuation have prevented our investment in the company� Delta Air Lines was impacted by Covid-19 and the subsequent global lockdown that decimated travel and tourism in the period. M&T Bank, like many financials, was weak due to the economic slowdown and the likelihood that interest rates would be lower-for-longer�
OutlookThe roll-out of vaccines have provided genuine hope that, despite rising numbers of cases, the worst may soon be behind us. This has already benefited areas that were most challenged by the pandemic and there are reasons to believe this could continue, especially when you consider the relatively low earnings base for these areas� Meanwhile, those that benefited the most, especially if the benefit was temporary, will have more challenging comparable earnings to beat� In other words, markets could remain polarized for a while, but in a mirror image of 2020�
Over the longer-term, the transition to a more sustainable economy continues to represent an exceptional market opportunity� Fiscal spending is going to play an important role in stimulating economic recovery and we believe that issues such as climate change will be at the centre of future policy and legislation� Moreover, consumers are becoming more aware of environmental and social issues, affecting all corners of the market� As such, those helping to address the major challenges we face today should continue to benefit, while those that fail to become cleaner and greener will likely suffer�
Hermes Investment Management Limited February 2021
Federated Hermes Global Equity ESG Fund (continued)
Performance Review (continued)

32
Federated Hermes Investment Funds Public Limited CompanyInvestment Manager’s Report (continued)
Federated Hermes Multi-Strategy Credit Fund
Market Review2020 was an unprecedented year on many counts and credit markets were extremely volatile as Covid-19 rapidly spread across the world� In March at the peak of the sell off, credit markets sold off to the lowest levels seen since the Global Financial Crisis but then rallied back over the course of the year driven by huge support from the world’s largest central banks (who launched large bond-buying programmes) and fiscal relief programmes from governments around the world�
The S&P 500, the Dow Jones and the MSCI World index closed at record levels on 31 December 2020, with the S&P experiencing an +18�4% advance in total return terms over the year� However, the best equity performance came from technology stocks, with the NASDAQ seeing a +45�1% return over the year� Within credit, returns from investment grade led the way, with the ICE BofA Global Corporate index returning 7�7% for 2020� High-yield returns were not far behind with the ICE BofA Global High Yield index returning 6�3% for 2020� iTraxx Crossover ended the year at 242 having started the year trading at 207 (and in 2020 it ranged from 207 to 708)� The VIX index ended the year at 23 having started the year at 12 (its range was 12 – 83 in 2020)�
After seeing $14tn of fiscal stimulus in 2020, we note that the quantity of global debt now stands at a record $277tn� The price of debt also stands at a record 5,000-year low, with global negative-yielding debt in the region of $18tn. In December 2020, three coronavirus vaccines with high efficacy ratios were approved, and this helped markets to stage a strong close to the year�
Investment StrategyAt the start of the year we continued to optimise the Fund’s convexity profile by selling bonds trading above call, particularly in cyclical sectors� We also reduced our exposure to UK speciality insurance and switched from CDS into bonds in structures where we identified attractive relative-value opportunities.
Within the income bucket, we increased exposure by rolling front-end CDS further out on the curve to optimise roll-down� We also increased our defensive exposure by increasing certain existing positions and initiating new bearish-biased trades, for example in the auto rentals space�
However, given the broad market rally in Q2, we proceeded to reduce this defensive trade in the auto rental space and added a new curve trade in the retail space� Compression between secured and unsecured bonds in the market created opportunities to switch from unsecured into senior parts of the capital structure� We also took advantage of flatter curves by switching from the long end into the belly.
In the second half of the year, as curves continued to steepen, we increased our allocation to the income bucket� After a strong recovery for some of the idiosyncratic stories we held, we reduced our exposure to the Retail and Energy sectors, as well as Aircraft Lessors within the best selection bucket, reducing the Strategy’s overall risk profile in the process. We took advantage of some attractive capital structure opportunities, particularly in Financials� As the market further strengthened in Q4, we reduced our exposure to cyclical sectors (in particular energy), and to emerging markets on the back of strong performance� We have replaced these positions with more defensive names in sectors such as Telecommunications, Packaging and Healthcare� We also added to Banking, which we see as attractive at current valuations� Within the outright short bucket, we added a new position in Energy. We also boosted the income enhanced bucket as curves remained flat in some areas of the market (for example in European packaging names)�
Performance ReviewThe Fund returned 4�72% in 2020, underperforming its target return by 1�77%�
The main sources of absolute performance came from positioning in the Energy, Financials and Basic Industry sectors�
At the individual holdings level, Avis Budget Group (Services), AbbVie Inc (Healthcare) and Kinder Morgan (Energy) contributed to absolute returns� Antero Resources (Energy), Ineos Group (Basic Industry) and Crown Americas (Capital Goods) detracted�
From a ratings perspective, BB- and BBB-rated bonds boosted the Fund’s absolute return the most� At the regional level, returns were driven by positioning in North America and the UK�

33
Federated Hermes Investment Funds Public Limited CompanyInvestment Manager’s Report (continued)
OutlookWe remain reasonably constructive on the high-yield asset class for 2021� Historically, we have seen that high yield tends to outperform as the US climbs out of recession, and this cycle should not be different� The are several positives such as economic conditions that are showing signs of improving, with global Purchasing Managers Indices (PMIs) continuing to print above 50 and positive breakthroughs on the vaccine front providing some visibility on a return to normality� In addition, corporate earnings continue to surprise to the upside and rating downgrades have slowed� That said, we do not rule out further bouts of volatility, although this is unlikely to be similar to the extreme levels we experienced last year, as the global recovery may be slower than expected as many countries shutter their economies in the early part of Q1 2021� Temporary cost-cutting measures are rolling off and companies are beginning to reintroduce capital expenditure (capex) spending and dividend programmes and we observe an increase in global M&A activity�
We believe that credit investors will need to focus more on relative value to generate alpha this year� High yield should see positive tailwinds from the continued high proportion of negative-yielding assets and pressure on dividends in equities. Inflation expectations are slightly higher since September, especially in the US, however the likelihood of an inflation surprise in the short term remains low. We have a preference to still be defensively positioned in our sector and regional allocations, given current valuations� We also see some merit in taking subordinated risk in industry leaders and national champions, rather than chasing yield in much weaker and lower-rated credits. Interest rate curves are flatter in Europe than the US. This means it is more expensive to hedge interest rate exposure using US rates as opposed to European rates� However, taking into account the divergent inflation expectations between the two regions, we still prefer to express our portfolio hedge via US rates.
Hermes Investment Management Limited February 2021
Federated Hermes Multi-Strategy Credit Fund (continued)

34
Federated Hermes Investment Funds Public Limited CompanyInvestment Manager’s Report (continued)
Federated Hermes Global Small Cap Equity Fund
Market ReviewOver the past 12 months the MSCI World Small Cap Index returned 12�39%, in sterling terms� This compares with returns for equivalent Large Caps of 12�32%� Having started the year on a positive note, global equity markets fell dramatically towards the end of the first quarter as the global spread of the Covid-19 pandemic triggered countrywide lockdowns and slowed economic activity alongside a dramatic fall in the oil price�
Nevertheless, as central banks and governing bodies announced unprecedented stimulus packages, we saw a strong rally, particularly in growth stocks� Later in the year, a broader market rally occurred with the announcement of several vaccine contenders, as participants tried to look past the pandemic and hope that economic activity could recover�
Despite everything that happened in 2020, Small Caps had a good year, with US smaller companies’ indices particularly strong� From a regional perspective, North America was the best performing region in the year, followed by Europe� Information Technology and Health Care sectors (the Covid-19 winners) were the best performing sectors in the year, while Energy and Real Estate were significant laggards.
Investment StrategyGlobal Small Cap Equity is a bottom-up, stock-picking strategy and the lead manager aims to invest in high-quality stocks over the long term� The team looks for stocks that have high returns on equity and/or high sustainability of revenue and returns� The investment approach taken by the team is a bottom-up, fundamental approach� The team believes that excess returns are best and most consistently generated by concentrating on stock-specific risk and not having significant regional and industry exposures.
In general, we have tried to not get caught up in the extreme levels of volatility but have used sharp moves to sell positions in over-valued or structurally challenged companies and buy high-quality names below their intrinsic value� Since the middle of the year we have taken the opportunity to establish holdings in some attractively positioned names and sell a combination of stocks that have performed well or that we expect to be challenged over the coming period�
Some notable trades include: Breedon (UK), a leading construction materials group in Great Britain and Ireland, that operates a vertically integrated business model providing control over costs and the capture of margins through the value chain� In the US, we bought Power Integrations, a manufacturer of analogue and mixed-signal semiconductor components with a market leading position in power efficiency, Altair Engineering, an engineering software company which provides exposure to the secular shift from physical testing to virtual simulation tools as well as a broader set of secular growth thematics, and, CarGurus, a passenger vehicle research and shopping platform� In Australia, we started a position in Ansell, a global leader in advanced surgical and industrial protective gloves, as well as chemical hazard protection� In Japan, we initiated a position in Noritsu Koki Group, a holding company with businesses including pens and DJ equipment, however, we believe their most valuable asset is JMDC, a data analytics company specialising in healthcare�
We funded the new positions by selling technology name Teradyne (US), and trimming health care names Abiomed and West Pharmaceuticals (US) following strong performance� In Japan, we sold Tadano, a Japanese crane manufacturer, and Hitachi Capital, a consumer lending company� In the UK we sold Cineworld, as we were increasingly concerned about the outlook for the company with further closures of cinemas and a delay to large box-office films. Earlier in the year
Performance ReviewThe fund returned 8�53% in 2020 in sterling terms, underperforming the benchmark index by 3�43%� This was driven by stock selection predominantly in Information Technology and Consumer Discretionary sector� Sector allocation was additive to relative returns due to our small underweight in Energy and overweight in Information Technology�
The Fund weathered the initial coronavirus-induced market fall, but trailed the market in the sharp rally through April and May� With a beta below one and a bias towards quality, the fund lagged the index in this environment�

35
Federated Hermes Investment Funds Public Limited CompanyInvestment Manager’s Report (continued)
West Pharmaceutical Services was among the top contributors to performance� It provides essential manufacturing services and therefore was able to continue work through lockdowns� The company also saw increased demand for products required for the Covid-19 vaccine and therapeutics� Air cargo transport company, Cargojet, has seen strong revenue growth benefiting from e-commerce demand and reduced global air cargo capacity as a result of reduced passenger flights. Forklift and warehouse handling equipment company, Jungheinrich, also benefited from the rise in e-commerce demand and need for improved warehouse logistics�
The largest detractor from relative performance was Cineworld, whose share price fell due to the forced closure of their cinemas and their leverage position coming under scrutiny� The Fund’s position in the company was sold after the James Bond film was deferred again. Kirby shares fell in the period with revenues and profits down year-on-year for its petrochemical transport and diesel engine maintenance operations� Reinsurance Group of America are a life insurance company and therefore their earnings were impacted by higher death rates�
OutlookThe current backdrop has resulted in great divergence in stock performance� Whist the extremes being experienced are getting much press, we are finding opportunities to buy into good businesses at prices that are more attractive than they were pre-Covid-19 when market volatility was very low� For patient investors, we believe this bodes well for market-beating returns in the future�
Hermes Investment Management Limited February 2021
Federated Hermes Global Small Cap Equity Fund (continued)
Performance Review (continued)

36
Federated Hermes Investment Funds Public Limited CompanyInvestment Manager’s Report (continued)
Federated Hermes Absolute Return Credit Fund
Market Review2020 was an unprecedented year on many counts and credit markets were extremely volatile as Covid-19 rapidly spread across the world� In March at the peak of the sell off, credit markets sold off to the lowest levels seen since the Global Financial Crisis but then rallied back over the course of the year driven by huge support from the world’s largest central banks who launched large bond buying programmes and fiscal relief programmes from governments around the World�
The S&P 500, the Dow Jones and the MSCI World index closed at record levels on 31 December 2020, with the S&P experiencing an +18�4% advance in total return terms over the year� However, the best equity performance came from technology stocks, with the NASDAQ seeing a +45�1% return over the year� Within credit, returns from investment grade (IG) led the way, with the ICE BofA Global Corporate index returning 7�7% for 2020� High yield returns were not far behind with the ICE BofA Global High Yield index returning 6�3% for 2020� The iTraxx Crossover ended the year at 242, having started the year trading at 207 (its 2020 range was 207 – 708)� The VIX index ended the year at 23, having started the year at 12 (its 2020 range was 12 – 83)�
After seeing $14tn of fiscal stimulus in 2020, we note that the quantity of global debt now stands at a record $277tn� The price of debt also stands at a record 5,000-year low with global negative-yielding debt in the region of $18tn. December 2020 saw the approval of three coronavirus vaccines with high efficacy ratios and this helped markets to stage a strong close to the year�
Investment StrategyAt the start of the year we continued to optimise the convexity profile of the core long bucket by selling bonds trading above call, particularly in cyclical sectors. We reduced exposure to UK speciality insurance firms and added some new names in non-cyclical sectors� We also switched from CDS into bonds in structures where there was an attractive relative-value opportunity� In the income bucket, we increased our exposure by further rolling out front-end CDS on the curve to optimise roll-down and added some new income opportunities�
Over the course of the year, we continued the theme to further reduce the overall exposure to cyclical sectors, in particular, Energy and Autos, switching to names deemed as less cyclical in sectors such as Telecommunications, Packaging and Healthcare�
During Q1 and entering the Covid-19 sell off, we continued to increase our defensive exposure both by adding to existing positions and initiating new bearish-biased trades, for example in the auto rentals space� We also trimmed our defensive index trades in European corporate and financial CDS indices.
During Q2 as markets rebounded from the pandemic lows of March, credit curves remained relatively flat, we took the opportunity to add more risk in the front end of issuer curves�
From Q3 onwards, we reduced the Fund’s overall risk level through an increase in cross-over CDS index hedges and by allocating more to the relatively defensive income bucket� As we expected curves to continue steepening, we increased our exposure to the income bucket� After a strong recovery for some of the idiosyncratic stories held, we reduced our exposure to the Retail and Energy sectors and Aircraft Lessors within the core long bucket� We took advantage of some attractive capital structure opportunities, particularly in Financials as valuations remain attractive� We reduced our short index position in the outright short bucket as the market weakened towards the end of the quarter�
Towards the year-end, as we observed volatility in the indices, we increased protection in the portfolio via our book hedge which we reduced slightly�
Performance ReviewThe Fund returned 3�11% (net of fees) in 2020, underperforming against its target by 0�16%�
Its exposures to the Energy, Banking and Basic Industry sectors boosted its return the most� Given the broad market rally, the Fund’s downside protection both through CDS indices and single-name CDS detracted from returns as did its exposure to Leisure and Retail�

37
Federated Hermes Investment Funds Public Limited CompanyInvestment Manager’s Report (continued)
Individual names that contributed positively to the Fund’s performance over the period included Avis (Services), EDF (Utilities) and Bank of Ireland (Banking)� AerCap and Aircastle (both Financial Services) and Macy’s (Retail) detracted�
In terms of credit quality, BBB-rated names contributed the most to the Fund’s performance� At the regional level, North America, Latin America and the UK boosted the Fund’s return the most, while Western Europe and Asia DM detracted the most�
OutlookWe remain reasonably constructive on the high-yield asset class for 2021� Historically, we have seen that high yield tends to outperform as the US climbs out of recession, and this cycle should not be different� The are several positives such as economic conditions that are showing signs of improving, with global Purchasing Managers’ Indices (PMIs) continuing to print above 50 and positive breakthroughs on the vaccine front providing some visibility on a return to normality� In addition, corporate earnings continue to surprise to the upside and rating downgrades have slowed� That said, we do not rule out further bouts of volatility, although unlikely to be to last year’s extreme levels, as the global recovery maybe slower than expected as many countries shutter their economies in the early part of Q121� Temporary cost cutting measures are rolling off and companies are beginning to reintroduce capital expenditure (capex) spending and dividend programmes and we observe an increase in global M&A activity�
We believe that credit investors will need to focus more on relative value to generate alpha this year� High yield should see positive tailwinds from the continued high proportion of negative-yielding assets and pressure on dividends in equities. Inflation expectations are slightly higher since September, especially in the US, however the likelihood of an inflation surprise in the short term remains low. We have a preference to still be defensively positioned in our sector and regional allocations, given current valuations� We also see some merit in taking subordinated risk in industry leaders and national champions, rather than chasing yield in much weaker and lower-rated credits. Interest rate curves are flatter in Europe than the US. This means that it is more expensive to hedge interest rate exposure using US rates as opposed to European rates� However, taking into account the divergent inflation expectations between the two regions, we still prefer to express our portfolio hedge via US rates.
Hermes Investment Management Limited February 2021
Federated Hermes Absolute Return Credit Fund (continued)
Performance Review (continued)

38
Federated Hermes Investment Funds Public Limited CompanyInvestment Manager’s Report (continued)
Federated Hermes SDG Engagement Equity Fund
Market ReviewOver the past 12 months the MSCI ACWI SMID Cap Index returned 12�10%, in sterling terms� Having started the year on a positive note, global equity markets fell dramatically towards the end of the first quarter as the global spread of Covid-19 triggered countrywide lockdowns and slowed economic activity alongside a dramatic fall in the oil price�
Nevertheless, as central banks and governing bodies announced unprecedented stimulus packages, we saw a strong rally, particularly in growth stocks� Later in the year, a broader market rally occurred with the announcement of several vaccine contenders, as participants tried to look past the pandemic and hope that economic activity could recover�
Despite everything that happened in 2020, small caps had a good year, with US and emerging market smaller companies’ indices particularly strong� From a regional perspective, emerging markets Asia was the best performing region in the year, followed by North America� Emerging markets Latin America was the only region to provide a negative total return for the period� Information Technology and Health Care were the best performing sectors in the year, while Energy and Real Estate were the only sectors that provided a negative total return�
Investment StrategyThe SDG Engagement Fund is a Small and Mid-Cap investment product that aims to produce above-benchmark investment returns while also delivering a social return�
The investment team seek to invest in higher-quality stocks over long time periods and runs a high active-share portfolio� The team also analyses companies to establish which of the UN’s Sustainable Development Goals (SDGs) apply to each potential investment, and what else a company could do in order to contribute to those goals�
The team will then engage with the management teams of stocks selected for the Fund to encourage companies to, for example, change business practices, manage their supply chain better, or develop new products, in order to contribute to the delivery of the goals� The team, in conjunction with EOS at Federated Hermes, our stewardship service, will in turn help facilitate this by communicating industry best practice, advising on reporting and disclosure, and, where relevant, introduce third parties to assist companies in their efforts�
The investment approach taken by the team is a bottom-up, fundamental approach� The team believes that excess returns are best and most consistently generated by concentrating on stock-specific risk and not having significant regional and industry exposures. The risk profile of the Fund seeks to maximise investors’ exposure, to the extent practically possible, to the achievements of individual stocks and related SDG impact� The investment team has extensive local market knowledge and operates on a regional basis�
Full due diligence on a potential holding will include both an investment thesis and an engagement one� The engagement thesis will detail the proposed ongoing engagement activity, with appropriate milestones, which will then be further enhanced and form a plan once assessed and agreed with the company� The outcomes from engagement will be measured and reported on a semi-annual basis�
Performance ReviewThe fund returned 4�08% in 2020 in sterling terms, underperforming the benchmark index by 7�20%� This was driven by stock selection predominantly in Information Technology and Communication Services�
Whist there were some material underperformers at the stock level (although the contribution of the two largest contributors exceeded the negative amount from the two largest detractors), style also accounted for much of the underperformance� With the Fund’s focus on engagement with impact towards the UN SDGs, it is under-represented at the growthier end of the market, particularly in Information Technology�
The Fund weathered the initial Covid-19-induced market fall and bounce back, but then steadily lost ground to September as growth stocks climbed relentlessly� Performance improved in September and October with a good earnings season and as growth stock gains slowed with positive vaccine news� However, the Fund exhibits high earnings stability, which is a style that moved out of favour as the market sought reflationary, and therefore improving, earnings�

39
Federated Hermes Investment Funds Public Limited CompanyInvestment Manager’s Report (continued)
Among the top contributors to performance, West Pharmaceutical Services provide essential manufacturing services and therefore it was able to continue work through lockdowns� The company also saw increased demand for products required for the Covid-19 vaccine and therapeutics� Techtronic Industries, who produce power tools, benefited from the trend towards doing more DIY as people spent more time at home. IMCD shares performed well having provided resilient earnings and announced purchases of Indian and Finnish materials distributors�
The largest detractor from relative performance was Cineworld, whose share price fell due to the forced closure of their cinemas and their leverage position coming under scrutiny� The Fund’s position in the company was sold after the James Bond film was deferred again. Kirby shares fell in the period with revenues and profits down year-on-year for its petrochemical transport and diesel engine maintenance operations� Reinsurance Group of America is a life insurance company and therefore its earnings were impacted by higher death rates�
Pleasingly, despite the uncertainty caused by the coronavirus in 2020, the Fund’s management team still found investee companies willing and open to engagement� Over 190 individual company engagements with investee companies took place and many of the investee companies showed positive progress towards engagement objectives by initiating plans and implementing environmental and social targets�
OutlookThe Fund’s focus on engaging for impact towards the UN SDGs causes our positioning to diverge from the benchmark in certain sectors� Engagement opportunities are often more abundant in companies with higher capital requirements such as personnel and manufacturing facilities, whereas low-capital intensive tech companies have less opportunity for productive engagement� Therefore, the Fund is less exposed to these businesses�
The current backdrop has resulted in great divergence in stock performance� While the extremes being experienced are getting much press, we are finding opportunities to buy into good businesses at prices that are more attractive than they were pre-Covid-19 when market volatility was very low� For patient investors, we believe this bodes well for market-beating returns in the future�
Hermes Investment Management Limited February 2021
Federated Hermes SDG Engagement Equity Fund (continued)
Performance Review (continued)

40
Federated Hermes Investment Funds Public Limited CompanyInvestment Manager’s Report (continued)
Federated Hermes Impact Opportunities Equity Fund
Market ReviewThe MSCI All Country World IMI Index returned 12�66%, in Sterling terms, for the period�
Having started the year on a positive note, global equity markets fell dramatically towards the end of the first quarter, with a peak-to-trough decline of over 40%, as the global spread of Covid-19 triggered countrywide lockdowns, slowed economic activity and a dramatic fall in the oil price�
However, towards the end of March we began to see a recovery in markets, particularly within growth stocks, as investors tried to look past the pandemic and as governing bodies and central banks around the world announced unprecedented levels of stimulus to try and help support economies� Later in the year, a broader market rally occurred with the announcement of several vaccine contenders, as participants tried to look past the pandemic and hope that economic activity could recover�
Within the Index, Information Technology and Consumer Discretionary were the best performing sectors, whereas, Energy was the worst performing sector providing a negative return of over 20% for the year� Financials and Real Estate were the only other sectors to record negative absolute returns in the period� North America was the best performing region in the period, with Latin America and Eastern Europe and Africa the laggards during the period�
Investment StrategyThe Federated Hermes Impact Opportunities Fund aims to generate attractive financial returns by investing in companies creating positive impact for people and the planet� By investing in companies that are tackling underserved needs of society and the environment, the fund is exposed to sources of enduring demand and therefore secular growth opportunities�
Last year we utilised the heightened market volatility to add several new names to the portfolio, including Dexcom, Kingspan, Strategic Education, Ballard Power and Straumann� Dexcom is a medical device company with a dominant position in continuous glucose monitoring systems, which enable more accurate insulin management for people with Diabetes� Kingspan is a global leader in high performance insulation products which help reduce carbon emissions� Strategic Education provide education services with a focus on improving access, via technology and pricing, to adults either looking for first time higher education, or vocational courses enabling a career change. Ballard Power is a manufacturer of polymer electrolyte membrane fuel cells which are particularly useful for heavy duty vehicles; and Straumann is a global leader in dental implants, helping to ensure dental health and therefore providing a positive impact towards health and wellbeing�
We also sold out of names where the team had less conviction including Autolus Therapeutics, Duerr, Horiba and Cogna Educacao� The position in Autolus Therapeutics position was sub-scale and we believe the fund has better exposure elsewhere to cell therapies through already cash generative businesses� Duerr, an Auto paint and assembly business, was sold due to competition for capital� Horiba, a manufacturer of measuring equipment and analysers, was sold due to concerns on the business model and strength of impact case; a better technology business was found in new holding Itron� We also sold a small position in Cogna Educacao, a Brazilian education provider, due to concerns over macro-economic headwinds, operating leverage and a stretched balance sheet�
With 32 holdings, the portfolio remains high conviction and benchmark agnostic, with positioning driven by stock specific fundamentals. Compared to the benchmark the portfolio is particularly underweight Information Technology (not holding some of the largest technology stocks), Communication Services, Consumer Discretionary and Financials sectors, whereas it has an overweight position in Health Care and Industrials sectors� It also continues to be overweight in European stocks and underweight in those from Asia Pacific and North America.
Performance ReviewThe Federated Hermes Impact Opportunities Fund returned 24.20% in 2020 in sterling terms, significantly outperforming the MSCI All Country World index which returned 12�66%�
This outperformance was almost solely driven by stock selection, particularly in Health Care, Industrials, Utilities and Financials�

41
Federated Hermes Investment Funds Public Limited CompanyInvestment Manager’s Report (continued)
The largest stock contributors to relative performance included three of our renewable energy focused stocks which contribute to our Energy Transition impact theme: Siemens Gamesa, Hannon Armstrong and Orsted� All three companies showed earnings resilience in the period and are benefiting from increased investment in sustainable infrastructure and are particularly supportive of renewable energy across the globe, as countries seek to lower their carbon emissions�
The largest stock detractor was Cogna Educacao, a Brazilian education company whose share price was affected by weaker investment sentiment towards Brazil; the small position in the Fund has now been sold� Not holding Apple detracted as the large benchmark constituent rallied significantly in the year, alongside the technology sector� Valeo a manufacturer of components for cars, saw weaker performance as the Covid-19 pandemic caused concerns around economic activity� The holding in Valeo was also sold due to concerns about the company’s outlook, with proceeds utilised to top up higher conviction ideas�
Sector allocation was neutral in the period; the positive effect from our underweight position in Financials and Energy sectors was almost offset by the negative effect of our underweight in Information Technology and Consumer Discretionary sectors� In terms of regional performance, the fund’s outperformance came predominantly from stock selection in Europe and North America�
OutlookThe coronavirus pandemic has created a large amount of uncertainty in near term supply and demand trends within many industries which is likely to continue� Nevertheless, the macro uncertainty is likely to mean that low interest rates endure, and ongoing stimulus is provided, which will in-turn offer further liquidity to global markets�
We have been encouraged by the resilience in earnings of the majority of our companies over the last three quarters. We remain confident of the long-term outlook for our strategy; believing that impactful companies are essential to help service the unmet needs of the environment and society and so are exposed to enduring sources of demand – providing secular growth opportunities as well as positive impact towards people and the planet� The impacts of Covid-19 have highlighted the importance of improving the provision of food and water security, health care systems and supply chains, as well as heightened awareness of climate change and workers’ rights� While we already invest and engage on these topics, we hope that this increased consciousness endures and leads to further investment and innovation. As governments worldwide utilise fiscal stimulus to support economies, we believe that companies addressing the SDGs remain best placed to benefit.
Hermes Investment Management Limited February 2021
Federated Hermes Impact Opportunities Equity Fund (continued)
Performance Review (continued)

42
Federated Hermes Investment Funds Public Limited CompanyInvestment Manager’s Report (continued)
Federated Hermes Unconstrained Credit Fund
Market Review2020 was an unprecedented year on many counts and credit markets were extremely volatile as Covid-19 rapidly spread across the world� In March at the peak of the sell off, credit markets sold off to the lowest levels seen since the Global Financial Crisis but then rallied back over the course of the year driven by huge support from the world’s largest central banks (who launched large bond buying programmes) and fiscal relief programmes from governments around the world�
The S&P 500, the Dow Jones and the MSCI World index closed at record levels on 31 December 2020 with the S&P experiencing an +18�4% advance in total return terms over the year� However, the best equity performance came from technology stocks, with the NASDAQ seeing a +45�1% return over the year� Within credit, returns from investment grade (IG) led the way, with the ICE BofA Global Corporate index returning 7�7% for 2020� High yield returns were not far behind with the ICE BofA Global High Yield index returning 6�3% for 2020� The iTraxx Crossover ended the year at 242, having started the year trading at 207 (in 2020 its range was 207 – 708)� The VIX index ended the year at 23, having started the year at 12 (its 2020 range was 12 – 83)�
After seeing $14tn of fiscal stimulus in 2020 we note that the quantity of global debt now stands at a record $277tn. The price of debt also stands at a record 5,000-year low with global negative-yielding debt in the region of $18tn� December 2020 saw the approval of three coronavirus vaccines with high efficacy ratios, and this helped markets to stage a strong close to the year�
Investment StrategyDuring the more volatile Q1, we reduced our exposure to cyclical sectors such as Energy and parts of the market that had outperformed, such as Russia and emerging sovereign debt, and increased our exposure to Financials and higher-quality non-cyclical corporates� We increased our exposure in the options book at the start of the year and managed to roll our exposure to maintain the portfolio’s gamma profile as market volatility increased. As volatility peaked, we started to reduce the options book, monetising the increase in volatility since the start of the year�
During Q2, compression between secured and unsecured bonds in the market created opportunities to switch from unsecured into senior parts of the capital structure. We also took advantage of flatter curves by switching from the long end into the belly and increased our hedge overlay using options on both the US and European high-yield markets�
As emerging markets and cyclicality premiums continued to shrink towards the end of 2020, we reduced exposure to the emerging markets sleeve� Additionally, we sold Energy names within the Investment Grade sleeve that had performed well� In the high yield sleeve, we added to defensive names in Telecommunications, Packaging, and Healthcare� We also increased our exposure to Financials which we see as attractive at current valuations� The rally that started post US elections has allowed us to add additional short risk protection via a mix of outright index and options on the US and European High Yield market� As a result of curves having almost completely normalised, we have added a defensive curve flattener using European investment-grade credit as the underlying instrument�
We further increased our defensive exposure by switching to less cyclical names in sectors such as Telecommunications, Packaging and Healthcare� We added to our Banking sector investments as current valuations remain attractive� In our view, investors are being well compensated for future risks�
Performance ReviewThe Fund returned 11�63% in 2020, outperforming it’s target by 5�06%�
The main source of absolute performance came from the fund’s hedge overlay, while Basic Industry, Energy and Financials also contributed�
At the individual holdings level, AbbVie Inc (Healthcare), Suzano (Basic Industry) and Commerzbank (Banking) contributed to absolute returns� Antero Resources (Energy), AK Steel Corp (Basic Industry) and Pemex (Energy) detracted�
From a ratings perspective, BB- and BBB-rated bonds boosted the Fund’s absolute return the most� At the regional level, returns were driven by positioning in North America and Western Europe�

43
Federated Hermes Investment Funds Public Limited CompanyInvestment Manager’s Report (continued)
OutlookWe remain reasonably constructive on the high-yield asset class for 2021� Historically, we have seen that high yield tends to outperform as the US climbs out of recession, and this cycle should not be different� The are several positives such as economic conditions that are showing signs of improving, with global Purchasing Managers’ Indices (PMIs) continuing to print above 50 and positive breakthroughs on the vaccine front providing some visibility on a return to normality� In addition, corporate earnings continue to surprise to the upside and rating downgrades have slowed� That said, we do not rule out further bouts of volatility, although it is unlikely to near last year’s extreme levels, as the global recovery may be slower than expected as many countries shutter their economies in the early part of Q1 2021� Temporary cost-cutting measures are rolling off and companies are beginning to reintroduce capital expenditure spending and dividend programmes and we observe an increase in global M&A activity�
We believe that credit investors will need to focus more on relative value to generate alpha this year� High-yield credit should see positive tailwinds from the continued high proportion of negative-yielding assets and pressure on dividends in equities. Inflation expectations are slightly higher since September, especially in the US, however the likelihood of an inflation surprise in the short term remains low. We have a preference to still be defensively positioned in our sector and regional allocations, given current valuations� We also see some merit in taking subordinated risk in industry leaders and national champions, rather than chasing yield in much weaker and lower-rated credits. Interest rate curves are flatter in Europe than the US. This means that it is more expensive to hedge interest rate exposure using US rates as opposed to European rates. However, considering the divergent inflation expectations between the two regions, we still prefer to express our portfolio hedge via US rates�
Hermes Investment Management Limited February 2021
Federated Hermes Unconstrained Credit Fund (continued)

44
Federated Hermes Investment Funds Public Limited CompanyInvestment Manager’s Report (continued)
Federated Hermes Global Emerging Markets SMID Equity Fund
Market ReviewThe MSCI Emerging Markets SMID Net TR index returned 14�31% in US dollar terms (10�80% in sterling terms) over the period, underperforming the broader emerging markets, measured by the MSCI Emerging Markets index which returned 18�31%� The relative underperformance of the EM SMID index is partly due to its overweight to fiscally sensitive pro-cyclical sectors such as industrials, materials, and real estate compared to the broader All Cap MSCI EM Index�
Emerging-market equities fell sharply in the first quarter as the spread of coronavirus, initially isolated to China, quickly morphed into a global pandemic� Markets sold off aggressively in March as the increase in cases outside China, notably in Europe and the United States, and the ensuing response to lockdown measures in affected economies, prompted central banks into swift action to help steady fears of a prolonged recession� Oil was caught in a perfect storm with an agreement between OPEC and Russia to constrain supply breaking down just as the outlook for demand fell� A stronger US dollar and plummeting oil prices further pressured emerging markets�
The second quarter delivered a strong initial rebound as central banks and governments cut borrowing rates and announced significant stimulus packages to reduce the damage caused by the economic shutdown, restoring positive sentiment to markets� The number of reported cases in some parts of Asia trended down and economies began reopening, particularly in China, South Korea, and Taiwan, while concern increased around rising cases in the United States, India, and Latin America�
Markets climbed higher in the third quarter despite an acceleration in the number of new cases of Covid-19 reported in several countries and an escalation in US-China tensions� Emerging-market equities recorded the highest quarterly gain in over a decade in the fourth quarter, boosted by the announcement of three vaccines deemed effective against the coronavirus, which added fuel to the post-US-election rally� The risk-on mood helped eclipse worries about the near-term global economic outlook and new variants of the virus which surfaced in the closing weeks of the year� The rally in commodity prices was supportive of emerging-market exporters, with the year’s biggest losers gaining the most in the final quarter: Columbia, Brazil, Mexico, Peru, Czech Republic, Hungary, Turkey, and Thailand all returned more than 20%�
Since equity markets hit bottom in late March, the dollar has weakened overall by 11%� In addition to the expectation that the Federal Reserve will keep US interest rates low for some time, sizable fiscal stimulus is likely under the new administration, potentially leading to a wider fiscal deficit and, ultimately, a stable or weaker US dollar in 2021.
The MSCI EM Index posted an impressive recovery of more than 70% following the precipitous drop in global stock markets in the first quarter, on par with both US equities and the broader developed markets. EM SMID caps recovered from the March ‘20 bottom but they still lag US peers and the broader EM index�
China was the best-performing of the major markets in the index, followed by Korea and Taiwan� Their respective governments dealt well with Covid-19 outbreaks and reopened to a much greater extent than most. As the "first in, first out” in the Covid-19 pandemic, China enjoyed a much faster recovery in 2020, leading to a return of 34% in US dollar terms� Though China’s recovery since the bottom has not been as large as the broader index, its equity market fell significantly less in the first quarter as the government was able to effectively manage the spread of the virus� However, the launch of an anti-trust investigation into Alibaba and further escalation in US-China tensions in the final quarter weighed on sentiment. Korea and Taiwan were boosted by strong gains from the technology sector�
At the sector level, Information Technology rose more than 50%, Health Care and Materials outperformed, while Energy, Real Estate, and Utilities lagged the most�
Investment StrategyAt a country level, we believe the Fund is well positioned for either the prospect of a global economic recovery or any near-term challenges from new variants of the virus, lockdown delays and withdrawal of stimulus� We maintain the Fund’s overweight to China given the strength of the economy, and an overweight to Taiwan, which is likely to benefit from a global economic recovery given their strong capability in semiconductors, memory, 5G, automation, artificial intelligence (AI) and electric vehicles (EV).

45
Federated Hermes Investment Funds Public Limited CompanyInvestment Manager’s Report (continued)
We continue to avoid what we view as the most vulnerable markets, such as Saudi Arabia, Malaysia, the Philippines, Argentina, and Columbia. The Fund is underweight Brazil given its weak domestic sector, fragile fiscal situation, and elevated valuations� The Fund retains a neutral position in Mexico, which shows no major vulnerability and should benefit from strong earnings rebound in 2021.
In terms of stock selection in the second half of the year, we initiated several positions in the Fund and sold several others on strength or market concerns�
We initiated a position in Sunny Friend Environmental Technology, an industrial infectious waste disposal company which operates medical and industrial waste treatment plants� The company uses technology to handle various types of hazardous waste and collects, incinerates, solidifies, and develops solutions to streamline the disposal� Sunny Friend is the only listed medical and industrial hazardous waste company and is well-placed for an ongoing expansion into China� We added Tokai Carbon Korea, a subsidiary of Tokai Carbon Japan� The company manufactures silicon carbide rings (SiC) that are widely utilised during the etching process in the NAND market and produces single silicon crystal and purified graphite products mostly for the semiconductor industry in Korea� Today, TCK is the only company that has the technology, and manufacturing know-how to make SiC rings� We added Polymetal, a leading gold (and silver) producer with a high-quality, low-cost asset base with long asset life� Polymetal produces some of the highest quality gold ore in the world and due to its favourable position on the cost curve, it is one of the most profitable gold miners globally: the company has consistently generated returns (ROE and ROIC) above 15-20%, well above its global peers� We initiated a position in NICE Information Systems, a leading credit bureau (CB) in Korea providing individual credit information services based on an accumulated credit information database of ~ 43m economically active population� The demand for CB service is driven by: usual day-to-day lending by financial institutions; financial institutes’ lending practice increasingly shifting to credit based from collateral based; the emergence of internet banks and fin-tech companies; and individuals becoming more interested in managing their own credit related information�
In the fourth quarter, we initiated a position in Enel Chile, a Chilean electricity generation and distribution company� Chile’s economy is set to be a major beneficiary of the global shift to electric vehicles and renewable energy. As the economy will become more electricity intensive going forwards, electricity demand is expected to grow faster than GDP� Low valuations, low expectations, and forced selling mean that returns are very positively skewed� Enel Chile also offers a dividend yield of 6%� We added Win Semiconductors, a Taiwan go-to foundry manufacturer of compound semiconductors which are fast becoming a larger part of the new, technology-driven world� Today, the world is dependent on connectivity, which requires radio frequency (RF) chips that are deployed in every mobile phone, base station, satellite, and Wi-Fi device� Win Semi is the only foundry in the world with about 70%+ non-IDM global market share that can support all the compound semi-dependent applications and processes� We bought Livechat Software, a Polish software as a service (SaaS) company with a strong track-record of growth in revenues, earnings and cashflows. The business operates in the niche market of online chat tools, which have become increasingly relevant in today’s world – with Covid-19, companies need to find ways to communicate online effectively, efficiently, and safely with their customers.
We continued to build positions in newly added names VA Tech Wabag (Wabag), India’s largest private water treatment technology company, Bajaj Finserve, an Indian financial services company focused on consumer lending, and NICE, a leading credit bureau (CB) in Korea providing individual credit information services� The team used market weakness to add to Polymetal, Groupo Aeroportuario del Centro Norte and Genomma Lab�
We sold down China Communication Services following the then US President Donald Trump’s executive order prohibiting US investments in Chinese companies that Washington says are owned or controlled by the Chinese military� We trimmed several names including Techtronic Industries, Mail�RU, Yandex, Nari Technology, Delta and Eugene Technology following strong performance year-to-date� We sold out of Notre Dame Intermedica following strong performance and a change in the company valuation�
Federated Hermes Global Emerging Markets SMID Equity Fund (continued)
Investment Strategy (continued)

46
Federated Hermes Investment Funds Public Limited CompanyInvestment Manager’s Report (continued)
Performance ReviewThe Fund returned 17�23% over the period in Sterling terms (net of fees, outperforming on a relative (geometric) basis by 5�81%� The outperformance was driven primarily by country allocations, notably our overweight exposure to China, which outperformed being ‘first in’ and ‘first out’ of the pandemic, and the associate currency which benefitted as the Renminbi appreciated. Avoiding underperforming markets hit hardest by the pandemic, including Thailand, the Philippines, Indonesia, South Africa (underweight), Chile and Argentina aided returns� Stock selection in Taiwan, Russia, Korea, and Brazil contributed positively, offsetting a Healthcare name’s negative impact in the United Arab Emirates and disappointing selection in India and China� The overweight allocation and stock selection in Communication Services and Information Technology contributed the most to relative returns at the sector level. Non-exposure to energy and the underweight in financials also benefited, offsetting Health Care and Consumer Discretionary names that detracted�
Delta Electronics, a Taiwanese global leader in switching power supply solutions, was the largest individual contributor� Delta rose as earnings for its power business were driven by strong PC/server demand� The company’s leading position in power should ensure it keeps benefiting from increasing cloud applications and telecom infrastructure upgrades. It’s Industrial Automation (IA) business should also benefit from ongoing supply chain relocation and increasing automation� Weimob, a leading provider of cloud-based commerce and marketing solutions for SMEs operating on Tencent’s social networking service platforms in China, rose sharply on strong growth rates of 70-80% for its software services business which recovered from a soft first half and strong revenues from its targeted marketing business� SITC International, a Hong Kong-listed provider of shipping services across Asia, rose after reporting strong earnings growth despite trade disruptions, thanks mainly to lower costs, capacity expansion and improved demand outlook� The conclusion of the Regional Comprehensive Economic Partnership (RCEP), securing one of the largest free trade agreements in history – representing 15 ASEAN countries and five regional partners – also boosted its shares�
NMC Healthcare, which operates hospitals in the Middle East, detracted the most from relative returns� Shares in NMC were suspended on 27th February 2020, after an independent investigation into the allegations made by short-seller Muddy Waters discovered businesses controlled by a founder of the company and an associate allegedly accessed US$4bn in secret off-balance-sheet financing without the knowledge of its Board. Source: Bloomberg, August 2020� We marked down the shares to zero� NMC subsequently went into administration, and shares were delisted on 28th April 2020� Shares in China Communication Services, a leading 5G infrastructure service provider, fell as its majority shareholder China Telecom was named in a US executive order banning US investment in 31 Chinese companies deemed to have ties to China’s military� Shenzhen International, a state-owned enterprise that operates a wide range of transportation businesses, fell as the Covid-19 pandemic had a severe impact on Shenzhen Airlines in which the company has a 49% equity interest�
OutlookAfter a surprisingly robust recovery in 2020, emerging-market equities look set for a positive year in 2021 as North Asia, which constitutes the majority of the benchmark, exhibited notable competence in dealing with the coronavirus and thus, it looks set to build on good numbers in 2021�
But North Asia won’t be the only place for performance� The global economy should see a recovery in the second half of the year, as vaccines are distributed and global confidence returns, helping commodity producers like Indonesia, Peru, Russia, and Mexico� Of course, the Democrats’ victory may see less infrastructure spending than previously hoped, as the prospect of vaccination lends credence to a policy of fiscal prudence, one which will be wholeheartedly endorsed by the Republicans in the US Senate� Emerging market SMID valuations appear supportive as they are at the low end of their long-term range relative to developed ones, and trading at a discount to the broader index�
In Latin America, although US President Joe Biden should be more engaged, local politics will remain volatile� However, economic growth should be positive, even if not all countries have secured vaccines� The EMEA region will see a more difficult US-Russia relationship but better demand for energy, base metals, and platinum/palladium, aiding Russia, and South Africa� However, politics will remain challenging in the latter, and prospects for the current rally to last through 2021 are modest�
Federated Hermes Global Emerging Markets SMID Equity Fund (continued)

47
Federated Hermes Investment Funds Public Limited CompanyInvestment Manager’s Report (continued)
Fiscal stimulus, infrastructure spending, a weak dollar, pro-cyclical index composition and middling valuations could create an ideal runway for emerging-market small and mid-cap stocks to lead in 2021� Overall, it is likely to be a good year for financials and materials, but longer-term, high economic growth rates are not on the cards, so cyclicals remain more of a trade for 2021 than a secular investment� Secular trends like digitalisation, increasing spending on health care, logistics, and premium products should continue�
Hermes Investment Management Limited February 2021
Federated Hermes Global Emerging Markets SMID Equity Fund (continued)
Outlook (continued)

48
Federated Hermes Investment Funds Public Limited CompanyInvestment Manager’s Report (continued)
Federated Hermes SDG Engagement High Yield Credit Fund
Market Review2020 was an unprecedented year on many counts and credit markets were extremely volatile as Covid-19 rapidly spread across the world� In March at the peak of the sell off, credit markets sold off to the lowest levels seen since the Global Financial Crisis but then rallied back over the course of the year driven by huge support from the world’s largest central banks (who launched large bond-buying programmes) and fiscal relief programmes from governments around the world�
The S&P 500, the Dow Jones and the MSCI World index closed at record levels on 31 December 2020, with the S&P experiencing an +18�4% advance in total return terms over the year� However, the best equity performance came from technology stocks, with the NASDAQ seeing a +45�1% return over the year� Within credit, returns from investment grade (IG) led the way, with the ICE BofA Global Corporate index returning 7�7% for 2020� High yield returns were not far behind: the ICE BofA Global High Yield index returned 6�3% in 2020� iTraxx Crossover ended the year at 242, having started the year trading at 207 (in 2020, its range was 207 – 708)� The VIX index ended the year at 23 having started the year at 12, (it ranged between 12 – 83 in 2020)�
After seeing $14tn of fiscal stimulus in 2020, we note that the quantity of global debt now stands at a record $277tn� The price of debt also stands at a record 5,000-year low with global negative-yielding debt in the region of $18tn. In December 2020, three coronavirus vaccines with high efficacy ratios were approved, and this helped markets to stage a strong close to the year�
Investment StrategyGiven our views on the prevailing market conditions, we added some protection in the form of the CDS index to the Fund before the pandemic-induced market volatility� Following the February/March sell-off, we were initially very conservative, adding risk and only issuers that we had high conviction in regarding their fundamentals and engagement potential�
We also noticeably saw credit curves flatten and took advantage of that by adding proportionately more risk in the front end of issuers’ curves� As primary markets re-opened, we saw curves start to normalise and this then allowed us to rotate our curve exposure in certain issuers�
We initially added risk in the US and Europe, where the market was being supported by the US Federal Reserve and the European Central Bank’s corporate bond-buyback programmes� This then led to a value differentiation between developed markets and emerging markets (EM) which we took advantage of by adding more EM exposure in late summer�
From Q3 onwards, we noticed a discrepancy between cyclical and non-cyclical risk, with the former having lagged� We took advantage of this and rotated some of our more defensive exposures out and invested in more cyclical names� This trade worked out particularly well in Q4 following the result of the US election and the positive vaccine news�
Performance reviewThe fund returned 7�40% in 2020, outperforming its benchmark by 0�87%�
The Fund’s overweight positioning in Basic Industry and Capital Goods and its underweight positioning in Energy boosted its relative return the most� Its overweight positioning in Automotive and its underweight positioning in Real Estate and Leisure detracted from its relative return the most�
At the individual holding level, the Fund’s positioning in Hess (Energy), Intelsat (Telecommunications) and Orbia (Basic Industry) were the top contributors to its relative outperformance� Pemex (Energy), Ford (Automotive) and Neptune Energy (Energy) detracted the most�
From a ratings perspective, BB- and BBB-rated bonds boosted the Fund’s relative return the most, while the fund’s underweight positioning in CCC- and lower-rated bonds detracted the most� At the regional level, the Fund’s overweight positioning in Western Europe and the UK and its underweight positioning in the Americas positively impacted its relative return the most�

49
Federated Hermes Investment Funds Public Limited CompanyInvestment Manager’s Report (continued)
OutlookWe remain reasonably constructive on the high-yield asset class for 2021� Historically, we have seen that high yield tends to outperform as the US climbs out of recession, and this cycle should not be different� The are several positives such as economic conditions that are showing signs of improving, with global Purchasing Managers’ Indices (PMIs) continuing to print above 50 and positive breakthroughs on the vaccine front providing some visibility on a return to normality� In addition, corporate earnings continue to surprise to the upside and rating downgrades have slowed� That said, we do not rule out further bouts of volatility, although it is unlikely to near last year’s extreme levels, as the global recovery may be slower than expected as many countries shutter their economies in the early part of Q1 2021� Temporary cost-cutting measures are rolling off and companies are beginning to reintroduce capital expenditure spending and dividend programmes and we observe an increase in global M&A activity�
We believe that credit investors will need to focus more on relative value to generate alpha this year� High-yield credit should see positive tailwinds from the continued high proportion of negative-yielding assets and pressure on dividends in equities. Inflation expectations are slightly higher since September, especially in the US, however the likelihood of an inflation surprise in the short term remains low. We have a preference to still be defensively positioned in our sector and regional allocations, given current valuations� We also see some merit in taking subordinated risk in industry leaders and national champions, rather than chasing yield in much weaker and lower-rated credits. Interest rate curves are flatter in Europe than the US. This means that it is more expensive to hedge interest rate exposure using US rates as opposed to European rates. However, considering the divergent inflation expectations between the two regions, we still prefer to express our portfolio hedge via US rates�
Hermes Investment Management Limited February 2021
Federated Hermes SDG Engagement High Yield Credit Fund (continued)

50
Federated Hermes Investment Funds Public Limited CompanyInvestment Manager’s Report (continued)
Federated Hermes US High Yield Credit Fund
Market ReviewThe fund made its initial investment in the high-yield market on July 21, 2020� From that date through December 31, 2020 the high-yield market outperformed the investment grade bond market� For example, the ICE BofA US High Yield 2% Constrained Index (HUC0) returned 7�77% versus a 0�25% return for the ICE BofA US Corporate, Government & Mortgage Index (D0A0), a measure of high-quality bond performance�
The main driver of the strong relative and absolute performance of high-yield bonds over the period was the decline of uncertainty and confidence that the US economy would continue to recover from the second quarter’s historic decline in GDP� As the period began, uncertainty was paramount in investors’ minds concentrated around the Covid-19 pandemic, US elections, oil prices and economic growth� As the period progressed the pressure of these uncertainties lessened as vaccines to combat the virus were approved, the elections occurred, oil prices increased, and economic growth rebounded strongly in the second half of 2020� Within the high-yield market, volatile sectors and virus-exposed sectors led the rebound, with the Transportation, Leisure and Energy sectors outperforming� From a quality perspective, the CCC-rated sector was the clear outperformer returning 17�06% while the B-rated and BB-rated sectors returned 6�92% and 6�35%, respectively�
Investment StrategyAt the end of the period under review, the portfolio was overweight the Media, Insurance, Healthcare, Capital Goods and Energy industry sectors relative to the HUC0� The overweight position in Insurance is concentrated in insurance brokerage companies, in Capital Goods the concentration is in packaging companies and in Energy the overweight is largely attributable to gas distribution companies� The portfolio was underweight the Telecommunications, Real Estate, Financial Services and Retail industry segments� The portfolio’s effective duration approximated the effective duration of HUC0�
Performance ReviewWith a total return of 5�71%, the portfolio underperformed the HUC0 over the period� Several factors negatively impacted the fund over the period� First, its cash holdings and transaction costs during the initial investment period in late July/early August hurt performance relative to the benchmark� Post the ramp up period, security selection in the Capital Goods, Basic Industry, Healthcare, Leisure and Retail industry sectors negatively impacted performance. The fund did benefit from its underweight to the poor performing Telecommunication sector.
OutlookAs 2020 comes to a close, the near-term future looks bright for the relative performance of high-yield bonds� The worst of the Covid-19 pandemic will hopefully soon be behind us. Monetary and fiscal policy remain extremely stimulative� Corporate earnings should rebound nicely in 2021 and we believe high-yield default rates should fall substantially in 2021� While valuations are not cheap, we believe high-yield credit spreads are poised to move lower� Risks to high yield as we enter 2021 would include a lack of progress in mitigating the impact of Covid-19 or a substantial decline in energy prices� Also, while an increase in intermediate term interest rates would initially lead to good relative performance, it could lead to negative absolute returns and increased short term volatility�
Federated Investment Counselling February 2021

51
Federated Hermes Investment Funds Public Limited CompanyDepositary’s Report to the ShareholdersFor the financial year ended 31 December 2020
We, Northern Trust Fiduciary Services (Ireland) Limited, appointed Depositary to Federated Hermes Investment Funds Public Limited Company (“the Company”) provide this report solely in favour of the shareholders of the Company for the year ended 31 December 2020 (“Annual Accounting Period”)� This report is provided in accordance with the UCITS Regulations – European Communities (Undertakings for Collective Investment in Transferable Securities) Regulations 2011 (SI No 352 of 2011) as amended, which implemented Directive 2009/65/EU into Irish Law (“the Regulations”)� We do not, in the provision of this report, accept nor assume responsibility for any other purpose or person to whom this report is shown�
In accordance with our Depositary obligation as provided for under the Regulations, we have enquired into the conduct of the Company for this Annual Accounting Period and we hereby report thereon to the shareholders of the Company as follows;
We are of the opinion that the Company has been managed during the Annual Accounting period, in all material respects:
(i) in accordance with the limitations imposed on the investment and borrowing powers of the Company by theconstitutional documents and by the Regulations; and
(ii) otherwise in accordance with the provisions of the constitutional document and the Regulations�
_______________________________________________For and on behalf ofNorthern Trust Fiduciary Services (Ireland) Limited
SG385
Stamp

52
Deloitte Ireland LLP Chartered Accountants & Statutory Audit Firm
INDEPENDENT AUDITOR’S REPORT TO THE SHAREHOLDERS OF FEDERATED HERMES INVESTMENT FUNDS PUBLIC LIMITED COMPANY
Report on the audit of the financial statements
Opinion on the financial statements of Federated Hermes Investment Funds PLC (“the Company”) In our opinion the financial statements:
• give a true and fair view of the assets, liabilities and financial position of the Company as at 31 December 2020 and of the profit for the financial year then ended; and
• have been properly prepared in accordance with the relevant financial reporting framework, the applicable Regulationsand, in particular, with the requirements of the Companies Act 2014.
The financial statements we have audited comprise:
• the Balance Sheet;• the Income Statement;• the Statement of Changes in Net Assets Attributable to Holders of Redeemable Participating Shares; • the Cash Flow Statement; and • the related notes 1 to 20, including a summary of significant accounting policies as set out in note 2.
The relevant financial reporting framework that has been applied in their preparation is the Companies Act 2014 and International Financial Reporting Standards (IFRS) as adopted by the European Union (“the relevant financial reporting framework”).
The applicable regulations that have been applied in their preparation is the European Communities (Undertakings for Collective Investment in Transferable Securities) Regulations, 2011 and Central Bank (Supervision and Enforcement) Act 2013 (Section 48(1)) (Undertakings for Collective Investment in Transferable Securities) Regulations, 2019 (“the applicable Regulations”).
Basis for opinion We conducted our audit in accordance with International Standards on Auditing (Ireland) (ISAs (Ireland)) and applicable law. Our responsibilities under those standards are described below in the “Auditor's responsibilities for the audit of the financial statements” section of our report.
We are independent of the Company in accordance with the ethical requirements that are relevant to our audit of the financial statements in Ireland, including the Ethical Standard issued by the Irish Auditing and Accounting Supervisory Authority, and we have fulfilled our other ethical responsibilities in accordance with these requirements. We believe that the audit evidence we have obtained is sufficient and appropriate to provide a basis for our opinion.
Conclusions relating to going concern In auditing the financial statements, we have concluded that the directors’ use of the going concern basis of accounting in the preparation of the financial statements is appropriate.
Based on the work we have performed, we have not identified any material uncertainties relating to events or conditions that, individually or collectively , may cast significant doubt on the company’s ability to continue as a going concern for a period of at least twelve months from when the financial statements are authorised for issue.
Our responsibilities and the responsibilities of the directors with respect to going concern are described in the relevant sections of this report
Continued on next page/

53
/Continued from previous page
INDEPENDENT AUDITOR’S REPORT TO THE SHAREHOLDERS OF FEDERATED HERMES INVESTMENT FUNDS PUBLIC LIMITED COMPANY
Other information The other information comprises the information included in the annual report and the audited financial statements, other than the financial statements and our auditor’s report thereon. The directors are responsible for the other information contained within the annual report and audited financial statements. Our opinion on the financial statements does not cover the other information and, except to the extent otherwise explicitly stated in our report, we do not express any form of assurance conclusion thereon. Our responsibility is to read the other information and, in doing so, consider whether the other information is materially inconsistent with the financial statements or our knowledge obtained in the audit or otherwise appears to be materially misstated. If we identify such material inconsistencies or apparent material misstatements, we are required to determine whether there is a material misstatement in the financial statements or a material misstatement of the other information. If, based on the work we have performed, we conclude that there is a material misstatement of this other information, we are required to report that fact. We have nothing to report in this regard. Responsibilities of directors As explained more fully in the Directors Report, the directors are responsible for the preparation of the financial statements and for being satisfied that they give a true and fair view and otherwise comply with the Companies Act 2014, and for such internal control as the directors determine is necessary to enable the preparation of financial statements that are free from material misstatement, whether due to fraud or error. In preparing the financial statements, the directors are responsible for assessing the Company’s ability to continue as a going concern, disclosing, as applicable, matters related to going concern and using the going concern basis of accounting unless the directors either intend to liquidate the Company or to cease operations, or have no realistic alternative but to do so. Auditor’s responsibilities for the audit of the financial statements Our objectives are to obtain reasonable assurance about whether the financial statements as a whole are free from material misstatement, whether due to fraud or error, and to issue an auditor's report that includes our opinion. Reasonable assurance is a high level of assurance, but is not a guarantee that an audit conducted in accordance with ISAs (Ireland) will always detect a material misstatement when it exists. Misstatements can arise from fraud or error and are considered material if, individually or in the aggregate, they could reasonably be expected to influence the economic decisions of users taken on the basis of these financial statements. As part of an audit in accordance with ISAs (Ireland), we exercise professional judgment and maintain professional scepticism throughout the audit. We also: • Identify and assess the risks of material misstatement of the financial statements, whether due to fraud or error, design and
perform audit procedures responsive to those risks, and obtain audit evidence that is sufficient and appropriate to provide a basis for our opinion. The risk of not detecting a material misstatement resulting from fraud is higher than for one resulting from error, as fraud may involve collusion, forgery, intentional omissions, misrepresentations, or the override of internal control.
• Obtain an understanding of internal control relevant to the audit in order to design audit procedures that are appropriate in the circumstances, but not for the purpose of expressing an opinion on the effectiveness of the Company’s internal control.
• Evaluate the appropriateness of accounting policies used and the reasonableness of accounting estimates and related
disclosures made by the directors.
Continued on next page/

54
/Continued from previous page
INDEPENDENT AUDITOR’S REPORT TO THE SHAREHOLDERS OF FEDERATED HERMES INVESTMENT FUNDS PUBLIC LIMITED COMPANY
• Conclude on the appropriateness of the directors’ use of the going concern basis of accounting and, based on the audit
evidence obtained, whether a material uncertainty exists related to events or conditions that may cast significant doubt on the Company’s ability to continue as a going concern. If we conclude that a material uncertainty exists, we are required to draw attention in our auditor’s report to the related disclosures in the financial statements or, if such disclosures are inadequate, to modify our opinion. Our conclusions are based on the audit evidence obtained up to the date of the auditor’s report. However, future events or conditions may cause the entity (or where relevant, the group) to cease to continue as a going concern.
• Evaluate the overall presentation, structure and content of the financial statements, including the disclosures, and whether
the financial statements represent the underlying transactions and events in a manner that achieves fair presentation. We communicate with those charged with governance regarding, among other matters, the planned scope and timing of the audit and significant audit findings, including any significant deficiencies in internal control that the auditor identifies during the audit. Report on other legal and regulatory requirements Opinion on other matters prescribed by the Companies Act 2014 Based solely on the work undertaken in the course of the audit, we report that: • We have obtained all the information and explanations which we consider necessary for the purposes of our audit. • In our opinion the accounting records of the Company were sufficient to permit the financial statements to be readily and
properly audited. • The financial statements are in agreement with the accounting records. • In our opinion the information given in the directors’ report is consistent with the financial statements and the directors’ report
has been prepared in accordance with the Companies Act 2014. Matters on which we are required to report by exception Based on the knowledge and understanding of the Company and its environment obtained in the course of the audit, we have not identified material misstatements in the directors' report. We have nothing to report in respect of the provisions in the Companies Act 2014 which require us to report to you if, in our opinion, the disclosures of directors’ remuneration and transactions specified by law are not made. Use of our report This report is made solely to the company’s shareholders, as a body, in accordance with Section 391 of the Companies Act 2014. Our audit work has been undertaken so that we might state to the company’s shareholders those matters we are required to state to them in an auditor’s report and for no other purpose. To the fullest extent permitted by law, we do not accept or assume responsibility to anyone other than the company and the company’s shareholders as a body, for our audit work, for this report, or for the opinions we have formed.
Michael Hartwell For and on behalf of Deloitte Ireland LLP Chartered Accountants and Statutory Audit Firm Deloitte & Touche House, Earlsfort Terrace, Dublin 2 Date: 26 April 2021

55
Federated Hermes Investment Funds Public Limited CompanyPortfolio StatementAs at 31 December 2020
a Header 1a Federated Hermes Global Emerging Markets Equity Fund
Nominal Holdings Financial assets at fair value through profit or loss
Fair Value $
% of Net Assets
. . . . .American Depositary Receipts: 15.08% (2019: 17.82%)
People's Republic of China: 5.98% (2019: 9.53%)
976,223 Alibaba ADR 232,721,801 3�31786,774 Autohome ADR 78,370,558 1�11
3,250,106 Baozun ADR 109,463,570 1�56
Total People's Republic of China 420,555,929 5.98
Russian Federation: 2.36% (2019: 2.65%)
11,382,568 Sberbank of Russia ADR 166,128,580 2�36
Total Russian Federation 166,128,580 2.36
Taiwan: 6.74% (2019: 5.64%)
4,358,022 Taiwan Semiconductor Manufacturing ADR 474,588,596 6�74
Total Taiwan 474,588,596 6.74
Total American Depositary Receipts 1,061,273,105 15.08
Equities: 82.70% (2019: 81.01%)
Brazil: 4.65% (2019: 8.75%)
17,447,553 BB Seguridade Participacoes 99,528,512 1�4120,073,339 Duratex 73,967,831 1�0526,173,300 Hapvida Participacoes e Investimentos 76,894,336 1�09
5,295,000 WEG 77,209,830 1�10
Total Brazil 327,600,509 4.65
Egypt: 0.33% (2019: 1.51%)
6,194,890 Commercial International Bank Egypt 23,259,390 0�33
Total Egypt 23,259,390 0.33
Hong Kong: 4.91% (2019: 6.16%)
13,406,633 AIA 164,285,317 2�3312,722,305 Techtronic Industries 181,499,885 2�58
Total Hong Kong 345,785,202 4.91
Hungary: 0.92% (2019: 1.89%)
2,577,324 Richter Gedeon 64,589,484 0�92
Total Hungary 64,589,484 0.92

56
Federated Hermes Investment Funds Public Limited CompanyPortfolio Statement As at 31 December 2020 (continued)
a Header 1a Federated Hermes Global Emerging Markets Equity Fund (continued)
Nominal Holdings Financial assets at fair value through profit or loss
Fair Value $
% of Net Assets
. . . . . Equities: 82.70% (2019: 81.01%) (continued)
India: 12.19% (2019: 12.97%)
1,219,784 Bajaj Finance 88,397,718 1�2610,439,786 Bharat Forge 75,054,156 1�07
9,859,696 Container Corporation of India 53,881,365 0�765,175,472 HCL Technologies 67,017,112 0�957,067,084 HDFC Bank 138,918,845 1�971,654,215 Hero MotoCorp 70,408,987 1�00
16,249,741 ICICI Bank 118,991,671 1�6940,471,960 Motherson Sumi Systems 91,503,990 1�30
6,416,356 SBI Life Insurance 79,405,891 1�135,618,722 Tech Mahindra 74,836,832 1�06
Total India 858,416,567 12.19
Indonesia: 3.52% (2019: 2.98%)
39,323,600 Bank Central Asia 94,740,488 1�35264,108,664 Bank Rakyat Indonesia Persero 78,386,700 1�11143,043,000 Unilever Indonesia 74,830,324 1�06
Total Indonesia 247,957,512 3.52
Mexico: 3.87% (2019: 1.45%)
29,687,645 Grupo Financiero Banorte SAB de CV 165,779,418 2�3536,934,200 Wal-Mart de Mexico SAB de CV 106,736,791 1�52
Total Mexico 272,516,209 3.87
People's Republic of China: 22.39% (2019: 15.73%)
6,303,025 Aier Eye Hospital 72,564,726 1�035,428,976 Alibaba Group 162,885,737 2�31
22,436,000 Alibaba Health Information Technology 66,272,955 0�94141,611,081 China Communications Services 62,471,045 0�8925,104,788 China Mengniu Dairy 151,550,661 2�15
5,468,500 China Merchants Bank 34,563,660 0�4912,979,285 Gree Electric Appliances 123,587,535 1�76
3,987,763 Hangzhou Tigermed Consulting 99,071,849 1�4142,169,821 NARI Technology 172,193,439 2�44
738,288 Prosus 80,804,678 1�1553,885,749 Shenzhen International 87,022,925 1�24
6,365,125 Tencent 463,064,476 6�58
Total People's Republic of China 1,576,053,686 22.39

57
Federated Hermes Investment Funds Public Limited CompanyPortfolio Statement As at 31 December 2020 (continued)
a Header 1a Federated Hermes Global Emerging Markets Equity Fund (continued)
Nominal Holdings Financial assets at fair value through profit or loss
Fair Value $
% of Net Assets
. . . . . Equities: 82.70% (2019: 81.01%) (continued)
Peru: 1.46% (2019: 1.10%)
628,095 Credicorp 102,787,747 1�46
Total Peru 102,787,747 1.46
Republic of South Korea: 13.80% (2019: 11.16%)
3,022,167 KB Financial 120,742,012 1�7288,854 LG Household & Health Care 132,508,037 1�88
104,999 NCSoft 89,988,096 1�288,423,255 Samsung Electronics 628,080,323 8�92
Total Republic of South Korea 971,318,468 13.80
Russian Federation: 2.92% (2019: 2.60%)
1,855,538 Mail�Ru Group GDR 48,336,765 0�693,028,926 Polymetal International 70,069,244 1�001,249,809 Yandex 86,861,725 1�23
Total Russian Federation 205,267,734 2.92
South Africa: 0.00% (2019: 2.15%) - -
Sweden: 1.72% (2019: 0.00%)
6,595,716 Epiroc 120,840,442 1�72
Total Sweden 120,840,442 1.72
Taiwan: 8.01% (2019: 7.77%)
11,924,000 Accton Technology 134,101,502 1�916,346,939 Advantech 79,060,027 1�12
29,219,014 Chipbond Technology 69,049,133 0�9824,553,000 Delta Electronics 229,818,457 3�26
5,133,200 Land Mark Optoelectronics 51,609,687 0�74
Total Taiwan 563,638,806 8.01
Turkey: 0.66% (2019: 1.23%)
4,552,176 BIM Birlesik Magazalar 46,502,700 0�66
Total Turkey 46,502,700 0.66

58
Federated Hermes Investment Funds Public Limited CompanyPortfolio Statement As at 31 December 2020 (continued)
a Header 1a Federated Hermes Global Emerging Markets Equity Fund (continued)
Nominal Holdings Financial assets at fair value through profit or loss
Fair Value $
% of Net Assets
. . . . . Equities: 82.70% (2019: 81.01%) (continued)
United Arab Emirates: 0.00% (2019: 2.17%)
5,655,991 NMC Health** - -
Total United Arab Emirates - -
United States: 1.35% (2019: 1.39%)
53,822,792 Samsonite 95,391,215 1�35
Total United States 95,391,215 1.35
Total Equities 5,821,925,671 82.70
P-Notes: 0.22% (2019: 0.27%)
People's Republic of China: 0.22% (2019: 0.27%)
1,597,665 Gree Electric Appliances 19/01/2022 (CLSA*) 15,212,816 0�22
Total People's Republic of China 15,212,816 0.22
Total P-Notes 15,212,816 0.22
Financial Derivative Instruments: 0.04% (2019: 0.02%)
Forward Currency Contracts: 0.04% (2019: 0.02%)
CounterpartyCurrency Buys
Currency Sells
Currency Rate
Maturity Date
Unrealised Gain
$
% of Net Assets
Northern Trust GBP 28,163,377 USD 37,409,948 1�3283 29/01/2021 1,034,941 0�02Northern Trust GBP 20,799,404 USD 27,628,244 1�3283 29/01/2021 764,331 0�01Northern Trust GBP 16,706,239 USD 22,191,215 1�3283 29/01/2021 613,917 0�01Northern Trust EUR 27,556,855 USD 33,563,532 1�2180 29/01/2021 279,273 -Northern Trust EUR 17,227,780 USD 20,982,988 1�2180 29/01/2021 174,594 -Northern Trust CHF 9,005,569 USD 10,151,146 1�1272 29/01/2021 80,228 -Northern Trust EUR 5,875,069 USD 7,155,682 1�2180 29/01/2021 59,540 -Northern Trust GBP 953,308 USD 1,266,297 1�3283 29/01/2021 35,032 -Northern Trust CHF 3,875,537 USD 4,368,535 1�1272 29/01/2021 34,526 -Northern Trust EUR 800,000 USD 974,569 1�2182 29/01/2021 7,918 -Northern Trust EUR 2,099,997 USD 2,574,512 1�2260 29/01/2021 4,512 -Northern Trust EUR 412,956 USD 504,076 1�2207 29/01/2021 3,079 -Northern Trust GBP 63,549 USD 84,420 1�3284 29/01/2021 2,329 -Northern Trust GBP 100,000 USD 134,309 1�3431 29/01/2021 2,198 -Northern Trust GBP 77,139 USD 103,604 1�3431 29/01/2021 1,696 -Northern Trust GBP 70,899 USD 95,112 1�3415 29/01/2021 1,670 -Northern Trust GBP 40,655 USD 54,006 1�3284 29/01/2021 1,490 -Northern Trust GBP 180,118 USD 244,780 1�3590 29/01/2021 1,093 -Northern Trust EUR 106,164 USD 129,305 1�2180 29/01/2021 1,076 -

59
Federated Hermes Investment Funds Public Limited CompanyPortfolio Statement As at 31 December 2020 (continued)
a Header 1a Federated Hermes Global Emerging Markets Equity Fund (continued)
Nominal Holdings Financial assets at fair value through profit or loss
Fair Value $
% of Net Assets
. . . . . Financial Derivative Instruments: 0.04% (2019: 0.02%) (continued) Forward Currency Contracts: 0.04% (2019: 0.02%) (continued)
CounterpartyCurrency Buys
Currency Sells
Currency Rate
Maturity Date
Unrealised Gain
$
% of Net Assets
Northern Trust EUR 40,063 USD 48,806 1�2182 29/01/2021 396 -Northern Trust GBP 108,073 USD 147,130 1�3614 29/01/2021 396 -Northern Trust CHF 36,272 USD 40,848 1�1262 29/01/2021 361 -Northern Trust EUR 34,963 USD 42,584 1�2180 29/01/2021 354 -Northern Trust GBP 8,976 USD 12,055 1�3431 29/01/2021 197 -Northern Trust EUR 23,092 USD 28,187 1�2207 29/01/2021 172 -Northern Trust EUR 588,902 USD 723,169 1�2280 29/01/2021 66 -Northern Trust CHF 6,200 USD 6,990 1�1274 29/01/2021 54 -Northern Trust CHF 2,749 USD 3,110 1�1313 29/01/2021 13 -Northern Trust EUR 1,880 USD 2,308 1�2280 29/01/2021 - -
Unrealised Gains on Forward Currency Contracts 3,105,452 0.04
Total Financial Derivative Instruments 3,105,452 0.04
Total financial assets at fair value through profit or loss 6,901,517,044 98.04
Financial liabilities at fair value through profit or loss
Financial Derivative Instruments: 0.00% (2019: 0.00%)
Forward Currency Contracts: 0.00% (2019: 0.00%)
CounterpartyCurrency Buys
Currency Sells
Currency Rate
Maturity Date
Unrealised Loss
$
% of Net Assets
Northern Trust USD 365 EUR 297 1�2260 29/01/2021 - -Northern Trust USD 5,084 GBP 3,734 1�3614 29/01/2021 (14) -Northern Trust USD 9,596 GBP 7,048 1�3614 29/01/2021 (26) -Northern Trust USD 5,262 CHF 4,675 1�1255 29/01/2021 (50) -Northern Trust USD 13,180 GBP 9,698 1�3590 29/01/2021 (59) -Northern Trust USD 59,254 EUR 48,563 1�2201 29/01/2021 (386) -Northern Trust USD 27,547 GBP 20,534 1�3415 29/01/2021 (484) -Northern Trust USD 127,890 EUR 104,815 1�2201 29/01/2021 (834) -Northern Trust USD 247,045 GBP 181,784 1�3590 29/01/2021 (1,103) -Northern Trust EUR 889,351 USD 1,093,693 1�2298 29/01/2021 (1,474) -Northern Trust USD 112,914 GBP 84,999 1�3284 29/01/2021 (3,115) -
Unrealised Losses on Forward Currency Contracts (7,545) -
Total Financial Derivative Instruments (7,545) -
Total financial liabilities at fair value through profit or loss (7,545) -

60
Federated Hermes Investment Funds Public Limited CompanyPortfolio Statement As at 31 December 2020 (continued)
a Header 1a Federated Hermes Global Emerging Markets Equity Fund (continued)
Nominal Holdings Financial assets at fair value through profit or loss
Fair Value $
% of Net Assets
. . . . .Net financial assets at fair value through profit or loss (2019: 99.12%) (Cost: $ 5,229,966,527)
6,901,509,499 98.04
Net Cash (2019: 0.98%) 162,923,549 2.31
Other Net Liabilities (2019: (0.10%)) (25,103,421) (0.35)
Net Assets Attributable to Holders of Redeemable Participating Shares 7,039,329,627 100.00
Portfolio Classification
% of Total Assets
Transferable securities admitted to official stock exchange listing 97�16Transferable securities traded on a regulated market 0�21OTC financial derivative instruments 0�04Cash 2�30Other assets 0�29Total 100.00
*The counterparty for the P-Notes is Credit Lyonnais Securities Asia�
**Level 3 Security�

61
Federated Hermes Investment Funds Public Limited CompanyPortfolio StatementAs at 31 December 2020 (continued)
a Header 1a Federated Hermes Global Equity Fund
Nominal Holdings Financial assets at fair value through profit or loss
Fair Value $
% of Net Assets
. . . . .Equities: 97.87% (2019: 96.67%)
Australia: 1.00% (2019: 1.28%)
3,404 Ampol 74,883 0�208,982 BHP Billiton Ltd 294,995 0�80
Total Australia 369,878 1.00
Austria: 0.27% (2019: 0.26%)
4,519 AMS 99,317 0�27
Total Austria 99,317 0.27
Canada: 1.88% (2019: 2.44%)
8,812 Barrick Gold 205,265 0�561,176 Canadian National Railway 128,969 0�354,249 Rogers Communications 198,952 0�542,833 Toronto-Dominion Bank 160,239 0�43
Total Canada 693,425 1.88
Denmark: 1.12% (2019: 1.22%)
3,491 Novo Nordisk 245,701 0�66823 Orsted 168,822 0�46
Total Denmark 414,523 1.12
Finland: 1.56% (2019: 1.52%)
22,863 Metso Outotec 229,398 0�638,348 Neles 111,219 0�30
12,115 Stora Enso 232,631 0�63
Total Finland 573,248 1.56
France: 1.88% (2019: 1.84%)
1,391 Gaztransport Et Technigaz 135,811 0�374,111 Legrand 369,845 1�001,839 Vinci 186,391 0�51
Total France 692,047 1.88
Germany: 0.79% (2019: 1.46%)
547 Adidas 199,998 0�541,229 Vonovia 90,143 0�25
Total Germany 290,141 0.79

62
Federated Hermes Investment Funds Public Limited CompanyPortfolio Statement As at 31 December 2020 (continued)
a Header 1a Federated Hermes Global Equity Fund (continued)
Nominal Holdings Financial assets at fair value through profit or loss
Fair Value $
% of Net Assets
. . . . . Equities: 97.87% (2019: 96.67%) (continued)
Hong Kong: 1.78% (2019: 2.07%)
39,906 AIA 489,009 1�332,981 Jardine Matheson 166,936 0�45
Total Hong Kong 655,945 1.78
Ireland: 0.36% (2019: 0.30%)
2,819 Smurfit Kappa 132,583 0�36
Total Ireland 132,583 0.36
Italy: 0.94% (2019: 0.44%)
4,907 Prysmian Group 175,137 0�4818,082 UniCredit 169,732 0�46
Total Italy 344,869 0.94
Japan: 7.76% (2019: 7.21%)
1,500 Daifuku 185,708 0�51100 Fast Retailing 89,720 0�24
4,400 Hitachi 173,541 0�479,500 Inpex 51,249 0�142,400 Kao 185,591 0�505,400 Kurita Water Industries 206,695 0�561,796 Kyocera 110,236 0�304,300 Lion 104,220 0�28
29,500 Mitsubishi Chemical 178,663 0�482,000 NEC 107,505 0�291,000 Nitto Denko 89,556 0�243,400 Omron 303,498 0�82
16,300 ORIX 250,593 0�683,000 Sony Corporation 299,374 0�816,500 Toagosei 76,374 0�213,000 Toyota Motor 231,611 0�631,558 Yaoko 108,689 0�307,300 Yokohama Rubber 108,652 0�30
Total Japan 2,861,475 7.76
Netherlands: 3.20% (2019: 2.55%)
1,553 ASML Holding 764,336 2�07894 Heineken 99,389 0�27
33,660 ING Groep 316,124 0�86
Total Netherlands 1,179,849 3.20

63
Federated Hermes Investment Funds Public Limited CompanyPortfolio Statement As at 31 December 2020 (continued)
a Header 1a Federated Hermes Global Equity Fund (continued)
Nominal Holdings Financial assets at fair value through profit or loss
Fair Value $
% of Net Assets
. . . . . Equities: 97.87% (2019: 96.67%) (continued)
Norway: 1.92% (2019: 0.82%)
13,939 Aker BP 353,688 0�96106,270 Elkem 353,961 0�96
Total Norway 707,649 1.92
Singapore: 0.64% (2019: 0.73%)
25,400 City Developments 153,200 0�415,675 Jardine Cycle & Carriage 83,961 0�23
Total Singapore 237,161 0.64
Spain: 1.34% (2019: 2.13%)
11,595 Iberdrola 167,144 0�458,093 Siemens Gamesa Renewable Energy 328,582 0�89
Total Spain 495,726 1.34
Sweden: 1.97% (2019: 1.57%)
4,016 Essity AB 130,045 0�3515,969 Husqvarna Group 208,210 0�5716,308 Volvo 386,926 1�05
Total Sweden 725,181 1.97
Switzerland: 3.30% (2019: 4.43%)
572 Lonza Group 369,342 1�002,225 Nestle 263,342 0�72
824 Roche 289,041 0�78698 Zurich Insurance Group 295,951 0�80
Total Switzerland 1,217,676 3.30
United Kingdom: 3.44% (2019: 4.59%)
3,115 AstraZeneca 311,922 0�8581,054 M&G 219,585 0�5915,485 Prudential 286,365 0�78
5,977 Smith & Nephew 124,360 0�3435,455 Tate & Lyle 325,174 0�88
Total United Kingdom 1,267,406 3.44
United States: 62.72% (2019: 59.81%)
3,292 Abbott Laboratories 356,985 0�971,854 Accenture 477,479 1�29

64
Federated Hermes Investment Funds Public Limited CompanyPortfolio Statement As at 31 December 2020 (continued)
a Header 1a Federated Hermes Global Equity Fund (continued)
Nominal Holdings Financial assets at fair value through profit or loss
Fair Value $
% of Net Assets
. . . . . Equities: 97.87% (2019: 96.67%) (continued) United States: 62.72% (2019: 59.81%) (continued)
2,549 Activision Blizzard 233,437 0�632,013 Allstate 217,706 0�59
429 Alphabet Class A 744,851 2�02107 Alphabet Class C 186,129 0�50340 Amazon�com 1,117,189 3�03
1,705 American Water Works 256,824 0�701,081 Amgen 245,571 0�671,017 Analog Devices 148,665 0�40
10,748 Apple 1,437,223 3�909,259 Atkore International 381,471 1�038,519 Bank of America 255,400 0�691,126 Baxter International 89,179 0�241,510 Berkshire Hathaway 346,772 0�941,232 Best Buy 124,900 0�344,732 BorgWarner 185,447 0�505,968 Brighthouse Financial 213,475 0�584,588 Capital One Financial 449,073 1�221,152 Chubb 175,023 0�486,073 Citigroup 369,603 1�001,735 Copart 219,547 0�601,077 Costco Wholesale 403,283 1�093,436 CVS Health 232,789 0�637,762 Delta Air Lines 314,827 0�869,408 Discovery 280,452 0�761,920 Dollar Tree 206,976 0�563,754 Duke Energy 339,962 0�921,853 Eaton 221,063 0�60
987 FedEx 256,600 0�702,517 Fortune Brands Home & Security 215,984 0�594,990 General Mills 292,214 0�794,250 Hess 228,523 0�62
998 Home Depot 264,729 0�72690 Humana 280,216 0�76
2,450 Ingersoll Rand 110,838 0�302,698 JPMorgan Chase 338,221 0�921,504 Keysight Technologies 197,385 0�531,456 Kimberly-Clark 193,837 0�532,449 Kirby 128,033 0�35
667 Lam Research 323,128 0�88968 Lockheed Martin 342,827 0�93704 Lululemon Athletica 246,949 0�67
2,060 M&T Bank 258,818 0�7012,415 Marathon Oil 84,422 0�23
6,127 Marathon Petroleum 254,699 0�693,333 Merck 268,607 0�733,735 MetLife 173,304 0�476,038 Microsoft 1,338,504 3�63
435 MSCI 190,091 0�52

65
Federated Hermes Investment Funds Public Limited CompanyPortfolio Statement As at 31 December 2020 (continued)
a Header 1a Federated Hermes Global Equity Fund (continued)
Nominal Holdings Financial assets at fair value through profit or loss
Fair Value $
% of Net Assets
. . . . . Equities: 97.87% (2019: 96.67%) (continued) United States: 62.72% (2019: 59.81%) (continued)
1,767 Nike 250,172 0�68669 NVIDIA 351,780 0�95
1,508 PayPal 349,117 0�951,691 PPG Industries 242,185 0�663,534 Procter & Gamble 486,879 1�322,730 Prudential Financial 211,439 0�574,009 Pulte 176,757 0�488,238 Radian 163,854 0�451,434 Robert Half International 89,051 0�242,104 Royal Caribbean Cruises 155,170 0�422,183 RPM International 197,561 0�53
891 salesforce�com 198,158 0�54680 STERIS 126,677 0�34771 Thermo Fisher Scientific 355,994 0�96
2,678 TJX 182,907 0�501,687 Trane Technologies 244,328 0�661,462 Travelers 203,335 0�553,660 UGI 126,051 0�34
542 Veeva Systems 149,625 0�414,031 Verizon Communications 234,362 0�642,113 VF 182,035 0�492,238 Visa 488,690 1�332,042 Walmart 294,416 0�804,204 Walt Disney 761,639 2�071,275 West Pharmaceutical Services 356,924 0�971,948 Zoetis 319,998 0�87
Total United States 23,118,334 62.72
Total Equities 36,076,433 97.87
REITS: 1.87% (2019: 2.39%)
Australia: 0.64% (2019: 0.52%)
15,940 Goodman REITS 233,319 0�64
Total Australia 233,319 0.64
United States: 1.23% (2019: 1.87%)
1,429 American Tower REITS 314,866 0�85

66
Federated Hermes Investment Funds Public Limited CompanyPortfolio Statement As at 31 December 2020 (continued)
a Header 1a Federated Hermes Global Equity Fund (continued)
Nominal Holdings Financial assets at fair value through profit or loss
Fair Value $
% of Net Assets
. . . . . REITS: 1.87% (2019: 2.39%) (continued) United States: 1.23% (2019: 1.87%) (continued)
4,148 Weyerhaeuser REITS 139,580 0�38
Total United States 454,446 1.23
Total REITS 687,765 1.87
Total financial assets at fair value through profit or loss 36,764,198 99.74
Net financial assets at fair value through profit or loss (2019: 99.06%) (Cost: $ 30,382,203)
36,764,198 99.74
Net Cash (2019: 0.70%) 81,340 0.22
Other Net Assets (2019: 0.24%) 14,285 0.04
Net Assets Attributable to Holders of Redeemable Participating Shares 36,859,823 100.00
Portfolio Classification
% of Total Assets
Transferable securities admitted to official stock exchange listing 99�50Cash 0�22Other assets 0�28Total 100.00

67
Federated Hermes Investment Funds Public Limited CompanyPortfolio StatementAs at 31 December 2020 (continued)
a Header 1a Federated Hermes European Alpha Equity Fund
Nominal Holdings Financial assets at fair value through profit or loss
Fair Value €
% of Net Assets
. . . . .Equities: 99.46% (2019: 99.71%)
Denmark: 7.50% (2019: 5.10%)
66,991 Novo Nordisk 3,841,527 3�9138,592 Pandora 3,532,320 3�59
Total Denmark 7,373,847 7.50
Finland: 2.20% (2019: 2.35%)
687,922 Nokia 2,167,642 2�20
Total Finland 2,167,642 2.20
France: 15.03% (2019: 10.25%)
61,543 Edenred 2,882,059 2�9338,832 Legrand 2,846,386 2�8923,896 Schneider Electric 2,866,325 2�9228,577 Sodexo 1,998,104 2�0312,753 Soitec 2,041,755 2�0866,032 Valeo 2,139,436 2�18
Total France 14,774,065 15.03
Germany: 19.70% (2019: 24.38%)
14,167 Adidas 4,220,349 4�2957,369 Bayer 2,762,604 2�8123,843 Deutsche Boerse 3,320,138 3�3857,968 Fresenius 2,193,509 2�2326,444 Merck 3,711,416 3�7829,426 SAP 3,155,056 3�21
Total Germany 19,363,072 19.70
Jersey: 2.08% (2019: 0.00%)
65,594 Experian 2,045,962 2�08
Total Jersey 2,045,962 2.08
Netherlands: 11.23% (2019: 10.17%)
15,006 ASML Holding 6,017,406 6�12266,912 ING Groep 2,042,410 2�08
42,983 Wolters Kluwer 2,983,880 3�03
Total Netherlands 11,043,696 11.23
Norway: 3.64% (2019: 4.21%)
133,015 DNB 2,136,849 2�17

68
Federated Hermes Investment Funds Public Limited CompanyPortfolio Statement As at 31 December 2020 (continued)
a Header 1a Federated Hermes European Alpha Equity Fund (continued)
Nominal Holdings Financial assets at fair value through profit or loss
Fair Value €
% of Net Assets
. . . . . Equities: 99.46% (2019: 99.71%) (continued) Norway: 3.64% (2019: 4.21%) (continued)
104,190 Equinor 1,444,136 1�47
Total Norway 3,580,985 3.64
Spain: 12.93% (2019: 13.14%)
20,698 Aena 2,943,256 2�9953,066 Amadeus IT 3,180,776 3�24
111,023 Inditex 2,906,582 2�96111,144 Siemens Gamesa Renewable Energy 3,676,643 3�74
Total Spain 12,707,257 12.93
Sweden: 6.11% (2019: 4.49%)
130,393 Epiroc 1,946,419 1�98101,182 Lundin Petroleum 2,243,613 2�28126,397 Swedbank 1,817,047 1�85
Total Sweden 6,007,079 6.11
Switzerland: 9.26% (2019: 7.07%)
68,492 Idorsia 1,616,685 1�647,416 Lonza Group 3,901,524 3�97
16,033 Sika 3,585,717 3�65
Total Switzerland 9,103,926 9.26
United Kingdom: 9.78% (2019: 14.01%)
287,469 Barratt Developments 2,141,739 2�181,167,799 ConvaTec 2,604,952 2�65
192,131 Prudential 2,894,925 2�9427,020 Reckitt Benckiser 1,972,817 2�01
Total United Kingdom 9,614,433 9.78
United States: 0.00% (2019: 4.54%) - -
Total Equities 97,781,964 99.46

69
Federated Hermes Investment Funds Public Limited CompanyPortfolio Statement As at 31 December 2020 (continued)
a Header 1a Federated Hermes European Alpha Equity Fund (continued)
Nominal Holdings Financial assets at fair value through profit or loss
Fair Value €
% of Net Assets
. . . . .Financial Derivative Instruments: 0.05% (2019: 0.00%)
Forward Currency Contracts: 0.05% (2019: 0.00%)
CounterpartyCurrency Buys
Currency Sells
Currency Rate
Maturity Date
Unrealised Gain
€
% of Net Assets
Northern Trust GBP 1,739,180 EUR 1,896,548 1�0905 29/01/2021 36,585 0�04Northern Trust GBP 714,127 EUR 778,744 1�0905 29/01/2021 15,022 0�01Northern Trust GBP 101,130 EUR 111,831 1�1058 29/01/2021 577 -Northern Trust USD 97,822 EUR 79,545 0�8132 29/01/2021 107 -Northern Trust CHF 4,302 EUR 3,966 0�9220 29/01/2021 13 -Northern Trust USD 5,188 EUR 4,218 0�8132 29/01/2021 6 -
Unrealised Gains on Forward Currency Contracts 52,310 0.05
Total Financial Derivative Instruments 52,310 0.05
Total financial assets at fair value through profit or loss 97,834,274 99.51
Financial liabilities at fair value through profit or loss
Financial Derivative Instruments: (0.02%) (2019: (0.02%))
Forward Currency Contracts: (0.02%) (2019: (0.02%))
CounterpartyCurrency Buys
Currency Sells
Currency Rate
Maturity Date
Unrealised Loss
€
% of Net Assets
Northern Trust CHF 78,299 EUR 72,467 0�9255 29/01/2021 (32) -Northern Trust USD 88,198 EUR 72,414 0�8210 29/01/2021 (598) -Northern Trust USD 1,350,193 EUR 1,108,557 0�8210 29/01/2021 (9,148) (0�01)Northern Trust USD 1,663,167 EUR 1,365,519 0�8210 29/01/2021 (11,268) (0�01)
Unrealised Losses on Forward Currency Contracts (21,046) (0.02)
Total Financial Derivative Instruments (21,046) (0.02)
Total financial liabilities at fair value through profit or loss (21,046) (0.02)

70
Federated Hermes Investment Funds Public Limited CompanyPortfolio Statement As at 31 December 2020 (continued)
a Header 1a Federated Hermes European Alpha Equity Fund (continued)
Nominal Holdings Financial assets at fair value through profit or loss
Fair Value €
% of Net Assets
. . . . .Net financial assets at fair value through profit or loss (2019: 99.69%) (Cost: € 83,391,941)
97,813,228 99.49
Net Cash (2019: 0.93%) 631,805 0.64
Other Net Liabilities (2019: (0.62%)) (131,545) (0.13)
Net Assets Attributable to Holders of Redeemable Participating Shares 98,313,488 100.00
Portfolio Classification
% of Total Assets
Transferable securities admitted to official stock exchange listing 99�20OTC financial derivative instruments 0�05Cash 0�64Other assets 0�11Total 100.00

71
Federated Hermes Investment Funds Public Limited CompanyPortfolio StatementAs at 31 December 2020 (continued)
a Header 1a Federated Hermes Global High Yield Credit Fund
Nominal Holdings Financial assets at fair value through profit or loss
Fair Value €
% of Net Assets
. . . . .Corporate Bonds: 64.17% (2019: 65.62%)
Belgium: 0.09% (2019: 0.00%)
300,000 Telenet Finance Lux Note 3�500% 01/03/2028 312,000 0�09
Total Belgium 312,000 0.09
Brazil: 3.14% (2019: 4.84%)
1,247,000 Gerdau Trade 4�875% 24/10/2027 1,183,516 0�35270,000 GUSAP III 4�250% 21/01/2030 246,600 0�07200,000 NBM US 7�000% 14/05/2026 178,213 0�05710,000 Petrobras Global Finance 4�750% 14/01/2025 814,585 0�24
1,101,000 Petrobras Global Finance 5�375% 01/10/2029 1,422,562 0�43494,000 Petrobras Global Finance 5�600% 03/01/2031 464,628 0�14
3,450,000 Suzano Austria 5�000% 15/01/2030 3,206,325 0�962,100,000 Vale 3�750% 10/01/2023 2,242,189 0�67
208,000 Vale Overseas 3�750% 08/07/2030 189,294 0�06551,000 Vale Overseas 6�250% 10/08/2026 559,083 0�17
Total Brazil 10,506,995 3.14
Canada: 0.22% (2019: 0.47%)
871,000 First Quantum Minerals 6�875% 01/03/2026 743,452 0�22
Total Canada 743,452 0.22
Chile: 0.32% (2019: 0.80%)
750,000 SACI Falabella 3�750% 30/10/2027 662,522 0�20200,000 VTR Finance 6�375% 15/07/2028 178,783 0�05250,000 VTR Finance 6�375% 15/07/2028 223,479 0�07
Total Chile 1,064,784 0.32
Colombia: 0.14% (2019: 0.00%)
550,000 Millicom International Cellular 5�125% 15/01/2028 478,460 0�14
Total Colombia 478,460 0.14
Finland: 0.29% (2019: 0.71%)
850,000 Stora Enso 7�250% 15/04/2036 961,959 0�29
Total Finland 961,959 0.29
France: 0.55% (2019: 1.08%)
750,000 Altice France SA 3�375% 15/01/2028 743,539 0�22579,000 Faurecia 2�375% 15/06/2027 585,876 0�18

72
Federated Hermes Investment Funds Public Limited CompanyPortfolio Statement As at 31 December 2020 (continued)
a Header 1a Federated Hermes Global High Yield Credit Fund (continued)
Nominal Holdings Financial assets at fair value through profit or loss
Fair Value €
% of Net Assets
. . . . . Corporate Bonds: 64.17% (2019: 65.62%) (continued) France: 0.55% (2019: 1.08%) (continued)
500,000 Faurecia 2�625% 15/06/2025 508,792 0�15
Total France 1,838,207 0.55
Germany: 0.24% (2019: 0.53%)
600,000 ADLER Group 2�750% 13/11/2026 616,123 0�18200,000 ADLER Real Estate 2�125% 06/02/2024 202,843 0�06
Total Germany 818,966 0.24
India: 0.37% (2019: 0.64%)
1,400,000 Bharti Airtel International 4�375% 10/06/2025 1,246,098 0�37
Total India 1,246,098 0.37
Ireland: 3.06% (2019: 1.11%)
3,650,000 AerCap Ireland Cap/Global 3�650% 21/07/2027 3,243,512 0�972,700,000 Ardagh Packaging Finance 4�750% 15/07/2027 3,139,938 0�933,705,000 Smurfit Kappa 1.500% 15/09/2027 3,884,747 1�16
Total Ireland 10,268,197 3.06
Italy: 1.61% (2019: 1.93%)
500,000 Banco BPM 1�625% 18/02/2025 496,501 0�154,335,000 Intesa Sanpaolo 5�017% 26/06/2024 3,878,152 1�15
500,000 Telecom Italia 2�750% 15/04/2025 525,057 0�16500,000 Telecom Italia Capital 6�000% 30/09/2034 498,790 0�15
Total Italy 5,398,500 1.61
Japan: 0.06% (2019: 0.00%)
200,000 SoftBank 4�500% 20/04/2025 215,500 0�06
Total Japan 215,500 0.06
Luxembourg: 2.26% (2019: 1.17%)
1,427,000 Altice Financing 3�000% 15/01/2028 1,378,075 0�411,022,000 Altice Luxembourg SA 4�000% 15/02/2028 977,288 0�29
600,000 ArcelorMittal 3�600% 16/07/2024 529,453 0�16600,000 Eurofins Scientific 2.125% 25/07/2024 639,234 0�19135,000 Eurofins Scientific 3.375% 30/01/2023 143,393 0�04818,000 Eurofins Scientific 3.750% 17/07/2026 961,482 0�29200,000 Matterhorn Telecom 3�125% 15/09/2026 198,899 0�06477,000 Millicom International Cellular 5�125% 15/01/2028 414,956 0�12

73
Federated Hermes Investment Funds Public Limited CompanyPortfolio Statement As at 31 December 2020 (continued)
a Header 1a Federated Hermes Global High Yield Credit Fund (continued)
Nominal Holdings Financial assets at fair value through profit or loss
Fair Value €
% of Net Assets
. . . . . Corporate Bonds: 64.17% (2019: 65.62%) (continued) Luxembourg: 2.26% (2019: 1.17%) (continued)
2,219,000 SIG Combibloc 2�125% 18/06/2025 2,338,826 0�70
Total Luxembourg 7,581,606 2.26
Mexico: 1.87% (2019: 2.13%)
1,550,000 Cemex 5�450% 19/11/2029 1,395,716 0�421,300,000 Orbia Advance Corp SAB de CV 5�500% 15/01/2048 1,291,181 0�38
500,000 Orbia Advance Corp SAB de CV 4�000% 04/10/2027 453,418 0�142,300,000 Petroleos Mexicanos 2�750% 21/04/2027 2,170,556 0�65
480,000 Petroleos Mexicanos 6�625% 15/06/2038 378,375 0�11750,000 Petroleos Mexicanos 6�950% 28/01/2060 577,663 0�17
Total Mexico 6,266,909 1.87
Netherlands: 3.78% (2019: 1.22%)
3,162,000 Ashland Services 2�000% 30/01/2028 3,165,953 0�941,200,000 NXP 3�875% 01/09/2022 1,033,899 0�312,000,000 NXP BV / NXP Funding 3�875% 01/09/2022 1,723,165 0�51
688,000 Q-Park Holding 2�000% 01/03/2027 667,598 0�20350,000 Trivium Packaging 3�750% 15/08/2026 361,156 0�11
1,057,000 United Group 3�625% 15/02/2028 1,038,502 0�311,467,000 VEON 3�375% 25/11/2027 1,233,273 0�37
300,000 VEON 4�000% 09/04/2025 259,942 0�081,130,000 VZ Vendor Financing 2�875% 15/01/2029 1,128,305 0�342,044,000 Ziggo 3�375% 28/02/2030 2,062,141 0�61
Total Netherlands 12,673,934 3.78
Norway: 0.08% (2019: 0.00%)
304,000 Aker BP 3�750% 15/01/2030 261,937 0�08
Total Norway 261,937 0.08
People's Republic of China: 0.28% (2019: 0.32%)
450,000 Country Garden 5�125% 17/01/2025 386,919 0�12600,000 Country Garden 5�625% 14/01/2030 544,072 0�16
Total People's Republic of China 930,991 0.28
Poland: 0.13% (2019: 0.00%)
423,000 Canpack SA Eastern Land 2�375% 01/11/2027 437,276 0�13
Total Poland 437,276 0.13

74
Federated Hermes Investment Funds Public Limited CompanyPortfolio Statement As at 31 December 2020 (continued)
a Header 1a Federated Hermes Global High Yield Credit Fund (continued)
Nominal Holdings Financial assets at fair value through profit or loss
Fair Value €
% of Net Assets
. . . . . Corporate Bonds: 64.17% (2019: 65.62%) (continued)
Russian Federation: 0.13% (2019: 0.00%)
200,000 Novolipetsk Steel Via Steel Funding DAC 4�700% 30/05/2026 185,368 0�05300,000 Severstal Via Steel Capital 3�150% 16/09/2024 256,911 0�08
Total Russian Federation 442,279 0.13
South Africa: 1.85% (2019: 2.44%)
3,400,000 Anglo American Capital 3�375% 11/03/2029 4,296,914 1�281,044,000 Sappi Papier 3�125% 15/04/2026 1,020,265 0�301,100,000 Sappi Papier 7�500% 15/06/2032 890,033 0�27
Total South Africa 6,207,212 1.85
Spain: 2.21% (2019: 0.53%)
400,000 Cellnex Telecom 0�750% 20/11/2031 387,104 0�122,500,000 Cellnex Telecom 1�000% 20/04/2027 2,476,560 0�74
300,000 Grifols 1�625% 15/02/2025 301,350 0�093,657,000 Grifols 2�250% 15/11/2027 3,719,169 1�11
487,000 Lorca Telecom Bond 4�000% 18/09/2027 513,980 0�15
Total Spain 7,398,163 2.21
Sweden: 0.22% (2019: 0.00%)
700,000 Volvo Car 2�125% 02/04/2024 724,002 0�22
Total Sweden 724,002 0.22
Turkey: 1.08% (2019: 1.84%)
350,000 Akbank 5�125% 31/03/2025 290,344 0�08978,000 Arcelik 5�000% 03/04/2023 831,606 0�25
2,009,000 Turk Telekomunikasyon 4�875% 19/06/2024 1,702,662 0�51700,000 Turkiye Garanti Bankasi 5�875% 16/03/2023 595,535 0�18255,000 Turkiye Vakiflar Bankasi 5.250% 05/02/2025 205,844 0�06
Total Turkey 3,625,991 1.08
United Kingdom: 3.38% (2019: 1.52%)
1,775,000 FCE Bank 2�727% 03/06/2022 2,010,552 0�601,200,000 Fiat Chrysler Automobiles 5�250% 15/04/2023 1,053,083 0�31
950,000 Fiat Chrysler Automobiles 5�250% 15/04/2023 833,691 0�25250,000 Fiat Chrysler Finance Europe 4�750% 22/03/2021 252,604 0�08700,000 International Consolidated Airlines 0�500% 04/07/2023 651,764 0�20
1,116,000 Marks & Spencer 3�250% 10/07/2027 1,299,293 0�39100,000 Marks & Spencer 3�750% 19/05/2026 114,320 0�03515,000 Neptune Energy 6�625% 15/05/2025 417,442 0�12100,000 Pension Insurance 4�625% 07/05/2031 132,581 0�04

75
Federated Hermes Investment Funds Public Limited CompanyPortfolio Statement As at 31 December 2020 (continued)
a Header 1a Federated Hermes Global High Yield Credit Fund (continued)
Nominal Holdings Financial assets at fair value through profit or loss
Fair Value €
% of Net Assets
. . . . . Corporate Bonds: 64.17% (2019: 65.62%) (continued) United Kingdom: 3.38% (2019: 1.52%) (continued)
462,000 Pension Insurance 5�625% 20/09/2030 652,159 0�20500,000 Phoenix Group 4�125% 20/07/2022 582,955 0�17250,000 Phoenix Group 5�625% 28/04/2031 345,308 0�10
1,675,000 Rothesay Life 3�375% 12/07/2026 1,998,853 0�60100,000 Virgin Media Finance 3�750% 15/07/2030 102,125 0�03750,000 Virgin Media Secured Finance 4�250% 15/01/2030 864,085 0�26
Total United Kingdom 11,310,815 3.38
United States: 36.81% (2019: 42.34%)
3,550,000 Air Lease 3�625% 01/12/2027 3,136,734 0�94599,000 Aircastle 4�125% 01/05/2024 518,301 0�16
1,300,000 Aircastle 4�250% 15/06/2026 1,120,283 0�331,850,000 Alcoa Nederland 6�125% 15/05/2028 1,654,688 0�49
136,000 Ally Financial 3�875% 21/05/2024 121,889 0�044,235,000 Ally Financial 4�625% 30/03/2025 3,949,027 1�18
500,000 Ally Financial 5�750% 20/11/2025 476,170 0�14760,000 Apache 4�250% 15/01/2030 653,365 0�19
1,745,000 Ardagh Packaging Finance 2�125% 15/08/2026 1,752,122 0�52200,000 Ardagh Packaging Finance 4�125% 15/08/2026 171,019 0�05
2,700,000 Ball 1�500% 15/03/2027 2,779,785 0�832,876,000 Ball Corporation 0�875% 15/03/2024 2,884,628 0�86
500,000 Berry Global 1�000% 15/01/2025 505,625 0�153,920,000 Berry Global 1�500% 15/01/2027 4,007,220 1�20
100,000 Berry Global Inc 1�000% 15/01/2025 101,125 0�031,330,000 Calpine 5�125% 15/03/2028 1,145,030 0�343,195,000 Catalent Pharma Solutions 2�375% 01/03/2028 3,223,148 0�96
202,000 CCO 4�250% 01/02/2031 174,192 0�051,250,000 CCO 4�750% 01/03/2030 1,103,602 0�33
103,000 CenturyLink 4�000% 15/02/2027 87,032 0�03715,000 CenturyLink 6�875% 15/01/2028 678,845 0�20200,000 Cf Industries 3�450% 01/06/2023 170,610 0�05
1,350,000 Charter Communications Operating 5�375% 01/05/2047 1,379,191 0�41250,000 CIT 4�750% 16/02/2024 223,799 0�07
1,000,000 Citylink 7�500% 01/04/2024 926,607 0�28981,000 Clearway Energy 4�750% 15/03/2028 860,647 0�26551,000 Clearway Energy 5�000% 15/09/2026 467,694 0�14
1,617,000 Cleveland-Cliffs 6�750% 15/03/2026 1,428,941 0�43202,000 Cleveland-Cliffs 7�000% 15/03/2027 160,553 0�05923,000 Crown European 0�750% 15/02/2023 922,630 0�28
3,597,000 Crown European 2�875% 01/02/2026 3,863,327 1�154,150,000 CSC 3�375% 15/02/2031 3,332,414 0�991,835,000 DCP Midstream Operating 5�125% 15/05/2029 1,665,920 0�50
121,000 DCP Midstream Operating 5�600% 01/04/2044 102,405 0�031,806,000 Dell 5�400% 10/09/2040 1,668,205 0�501,007,000 Dell 6�020% 15/06/2026 1,004,722 0�301,400,000 Domtar 6�750% 15/02/2044 1,454,298 0�44

76
Federated Hermes Investment Funds Public Limited CompanyPortfolio Statement As at 31 December 2020 (continued)
a Header 1a Federated Hermes Global High Yield Credit Fund (continued)
Nominal Holdings Financial assets at fair value through profit or loss
Fair Value €
% of Net Assets
. . . . . Corporate Bonds: 64.17% (2019: 65.62%) (continued) United States: 36.81% (2019: 42.34%) (continued)
685,000 EnLink Midstream Partners 5�050% 01/04/2045 448,541 0�13817,000 EnLink Midstream Partners 5�450% 01/06/2047 539,372 0�16
1,614,000 EnLink Midstream Partners 5�600% 01/04/2044 1,064,253 0�32617,000 EQM Midstream Partners 6�500% 15/07/2048 525,230 0�16
1,512,000 EQT 3�900% 01/10/2027 1,229,971 0�371,500,000 Ford Motor Credit 3�200% 15/01/2021 1,228,852 0�37
700,000 General Motors Financial 0�850% 26/02/2026 705,688 0�21500,000 General Motors Financial 4�200% 01/03/2021 409,655 0�12
3,148,000 Goodyear Tire & Rubber 4�875% 15/03/2027 2,635,554 0�792,940,000 Hanesbrands 4�875% 15/05/2026 2,613,093 0�78
250,000 HCA 5�375% 01/02/2025 230,071 0�07750,000 HCA 5�875% 01/02/2029 738,743 0�22645,000 HCA 7�500% 15/11/2095 690,201 0�21
2,742,000 Huntsman International 4�250% 01/04/2025 3,086,039 0�92900,000 Huntsman International 4�500% 01/05/2029 848,952 0�25
2,758,000 IQVIA 2�250% 15/01/2028 2,789,717 0�83800,000 IQVIA 2�875% 15/06/2028 828,960 0�25500,000 KB Home 4�800% 15/11/2029 449,256 0�13
2,539,000 Kinder Morgan Energy Partners 4�700% 01/11/2042 2,383,532 0�71472,000 Kinder Morgan Energy Partners 5�625% 01/09/2041 471,812 0�14
1,850,000 Kraft Heinz Foods 2�250% 25/05/2028 1,960,031 0�593,068,000 Kraft Heinz Foods 4�375% 01/06/2046 2,717,146 0�81
627,000 L Brands 6�875% 01/11/2035 576,178 0�1727,000 L Brands 7�600% 15/07/2037 23,832 0�01
2,375,000 Lennar 4�125% 15/01/2022 1,990,813 0�592,998,000 Lennar 4�750% 29/11/2027 2,898,765 0�86
540,000 Lennar 5�000% 15/06/2027 520,780 0�16962,000 Levi Strauss 3�375% 15/03/2027 997,911 0�30925,000 Marathon Oil 5�200% 01/06/2045 862,315 0�26300,000 Marathon Oil 6�600% 01/10/2037 303,400 0�09250,000 Marathon Oil 6�800% 15/03/2032 252,176 0�07233,000 MPT Operating Partnership 3�500% 15/03/2031 196,976 0�06
3,300,000 MPT Operating Partnership 3�692% 05/06/2028 4,001,934 1�19450,000 Netflix 3.000% 15/06/2025 482,940 0�14
1,000,000 Netflix 5.375% 01/02/2021 821,891 0�251,400,000 Novelis 4�750% 30/01/2030 1,234,879 0�37
44,000 NRG Energy 2�450% 02/12/2027 37,884 0�011,071,000 Occidental Petroleum 3�500% 15/08/2029 802,469 0�245,093,000 Occidental Petroleum 4�100% 15/02/2047 3,410,422 1�02
60,000 OI European Group 4�000% 15/03/2023 50,172 0�0197,000 Onemain Financial 4�000% 15/09/2030 82,358 0�02
2,198,000 Post 4�625% 15/04/2030 1,891,999 0�571,447,000 Range Resources 4�875% 15/05/2025 1,119,313 0�332,950,000 Sealed Air 4�000% 01/12/2027 2,579,788 0�77
400,000 Sealed Air 4�500% 15/09/2023 436,888 0�13150,000 Sealed Air 6�875% 15/07/2033 162,207 0�05
3,125,000 Silgan 2�250% 01/06/2028 3,179,594 0�9592,000 Tenet Healthcare 4�625% 15/06/2028 78,904 0�02

77
Federated Hermes Investment Funds Public Limited CompanyPortfolio Statement As at 31 December 2020 (continued)
a Header 1a Federated Hermes Global High Yield Credit Fund (continued)
Nominal Holdings Financial assets at fair value through profit or loss
Fair Value €
% of Net Assets
. . . . . Corporate Bonds: 64.17% (2019: 65.62%) (continued) United States: 36.81% (2019: 42.34%) (continued)
4,353,000 Tenet Healthcare 4�875% 01/01/2026 3,726,136 1�11200,000 Tenet Healthcare 6�875% 15/11/2031 173,031 0�05
1,630,000 Terraform Power 4�750% 15/01/2030 1,428,386 0�432,500,000 T-Mobile USA 4�500% 15/04/2050 2,523,926 0�75
350,000 Toll Brothers Finance 3�800% 01/11/2029 309,652 0�094,759,000 Toll Brothers Finance 4�350% 15/02/2028 4,331,194 1�291,600,000 Toll Brothers Finance 4�875% 15/03/2027 1,498,669 0�451,046,000 WPX Energy 4�500% 15/01/2030 907,465 0�27
454,000 WPX Energy 5�250% 15/10/2027 393,801 0�12678,000 WPX Energy 5�750% 01/06/2026 583,355 0�17
Total United States 123,342,865 36.81
Total Corporate Bonds 215,057,098 64.17
Government Bonds: 8.36% (2019: 3.46%)
Brazil: 0.07% (2019: 0.00%)
275,000 Petrobras Global Finance 5�093% 15/01/2030 251,446 0�07
Total Brazil 251,446 0.07
United States: 8.29% (2019: 3.46%)
34,000,000 United States Treasury Bill 0�010% 17/06/2021 27,778,815 8�29
Total United States 27,778,815 8.29
Total Government Bonds 28,030,261 8.36
Floating Rate Notes: 24.55% (2019: 27.10%)
Australia: 1.73% (2019: 0.16%)
4,750,000 BHP Billiton Finance 22/10/2077 5,803,794 1�73
Total Australia 5,803,794 1.73
Austria: 0.31% (2019: 0.50%)
1,000,000 BAWAG Group 31/12/2049 1,025,525 0�31
Total Austria 1,025,525 0.31

78
Federated Hermes Investment Funds Public Limited CompanyPortfolio Statement As at 31 December 2020 (continued)
a Header 1a Federated Hermes Global High Yield Credit Fund (continued)
Nominal Holdings Financial assets at fair value through profit or loss
Fair Value €
% of Net Assets
. . . . . Floating Rate Notes: 24.55% (2019: 27.10%) (continued)
Belgium: 0.52% (2019: 0.68%)
1,600,000 Solvay 31/12/2049 1,734,608 0�52
Total Belgium 1,734,608 0.52
Brazil: 0.35% (2019: 0.98%)
250,000 Banco BTG Pactual 15/02/2029 222,766 0�07200,000 Banco BTG Pactual SA/Cayman Islands 15/02/2029 178,212 0�05913,000 Itau Unibanco 21/11/2029 772,500 0�23
Total Brazil 1,173,478 0.35
Canada: 1.75% (2019: 1.95%)
7,008,000 Enbridge 15/07/2077 5,880,174 1�75
Total Canada 5,880,174 1.75
Denmark: 0.15% (2019: 0.00%)
500,000 Orsted 09/12/3019 514,187 0�15
Total Denmark 514,187 0.15
France: 2.75% (2019: 1.89%)
1,400,000 BNP Paribas 31/12/2049 1,156,975 0�34750,000 BNP Paribas 31/12/2049 636,456 0�19
3,400,000 Electricite de France 31/12/2049 4,339,289 1�301,100,000 Groupama Assurances Mutuelles 31/12/2049 1,270,913 0�381,800,000 Veolia Environnement 30/12/2049 1,823,625 0�54
Total France 9,227,258 2.75
Germany: 1.29% (2019: 1.61%)
1,800,000 Commerzbank 31/12/2049 1,926,018 0�57600,000 Commerzbank 31/12/2049 680,637 0�20
1,136,000 Deutsche Postbank Funding Trust I 31/12/2049 1,070,194 0�32702,000 Deutsche Postbank Funding Trust III 31/12/2049 660,652 0�20
Total Germany 4,337,501 1.29
India: 0.42% (2019: 0.27%)
1,600,000 Network i2i 31/12/2049 1,393,323 0�42
Total India 1,393,323 0.42

79
Federated Hermes Investment Funds Public Limited CompanyPortfolio Statement As at 31 December 2020 (continued)
a Header 1a Federated Hermes Global High Yield Credit Fund (continued)
Nominal Holdings Financial assets at fair value through profit or loss
Fair Value €
% of Net Assets
. . . . . Floating Rate Notes: 24.55% (2019: 27.10%) (continued)
Ireland: 0.34% (2019: 0.86%)
1,150,000 Aercap Holdings 10/10/2079 966,586 0�29200,000 Bank of Ireland 19/09/2027 166,536 0�05
Total Ireland 1,133,122 0.34
Italy: 1.33% (2019: 0.17%)
200,000 Enel 31/12/2049 208,855 0�06550,000 Enel 24/11/2078 575,437 0�17714,000 Intesa Sanpaolo 31/12/2049 679,104 0�20
1,525,000 UniCredit 31/12/2049 1,376,313 0�41214,000 Unione di Banche 12/07/2029 230,369 0�07
1,266,000 Unipolsai Assicurazioni 31/12/2049 1,383,105 0�42
Total Italy 4,453,183 1.33
Luxembourg: 0.12% (2019: 0.19%)
200,000 Eurofins Scientific 31/12/2049 209,475 0�06400,000 Mitsubishi UFJ Investor Services & Banking 15/12/2050 204,000 0�06
Total Luxembourg 413,475 0.12
Mexico: 0.22% (2019: 0.30%)
200,000 Banco Mercantil del Norte 31/12/2049 177,557 0�05400,000 Banco Mercantil del Norte 31/12/2049 369,825 0�11200,000 Banco Mercantil del Norte 31/12/2049 185,732 0�06
Total Mexico 733,114 0.22
Netherlands: 2.48% (2019: 2.51%)
200,000 ABN AMRO Bank 31/12/2049 213,040 0�062,800,000 ABN AMRO Bank 31/12/2049 3,009,160 0�903,200,000 Cooperatieve Rabobank 31/12/2049 3,236,198 0�97
818,000 Tennet Holding 31/12/2049 853,788 0�251,000,000 Ziggo 17/01/2029 999,420 0�30
Total Netherlands 8,311,606 2.48
Norway: 0.70% (2019: 0.89%)
2,780,000 DNB 31/12/2049 2,361,456 0�70
Total Norway 2,361,456 0.70
Portugal: 0.45% (2019: 0.18%)
200,000 Caixa Geral de Depositos 31/12/2049 220,687 0�06

80
Federated Hermes Investment Funds Public Limited CompanyPortfolio Statement As at 31 December 2020 (continued)
a Header 1a Federated Hermes Global High Yield Credit Fund (continued)
Nominal Holdings Financial assets at fair value through profit or loss
Fair Value €
% of Net Assets
. . . . . Floating Rate Notes: 24.55% (2019: 27.10%) (continued) Portugal: 0.45% (2019: 0.18%) (continued)
1,300,000 Energias de Portugal 20/07/2080 1,298,453 0�39
Total Portugal 1,519,140 0.45
Russian Federation: 0.00% (2019: 0.21%) - -
Spain: 1.10% (2019: 0.66%)
800,000 Bankia 31/12/2049 828,900 0�25200,000 Ibercaja Banco 23/07/2030 194,653 0�06
1,400,000 Telefonica Europe 05/02/2050 1,430,752 0�431,200,000 Telefonica Europe 31/12/2049 1,219,500 0�36
Total Spain 3,673,805 1.10
Sweden: 0.24% (2019: 0.00%)
800,000 Samhallsbygg 31/12/2049 797,172 0�24
Total Sweden 797,172 0.24
Switzerland: 0.36% (2019: 0.00%)
389,000 Credit Suisse 31/12/2049 320,280 0�10700,000 Credit Suisse 31/12/2049 596,420 0�18300,000 Credit Suisse Group 31/12/2049 273,283 0�08
Total Switzerland 1,189,983 0.36
United Kingdom: 2.79% (2019: 5.21%)
2,630,000 Barclays Bank 31/12/2049 2,700,933 0�801,500,000 Barclays Bank 31/12/2049 1,540,456 0�46
200,000 HSBC Bank 31/12/2049 144,434 0�041,520,000 National Westminster Bank 31/12/2049 1,155,637 0�341,180,000 National Westminster Bank 31/12/2049 897,168 0�271,479,000 Phoenix Group 31/12/2049 1,769,432 0�53
390,000 Rothesay Life 31/12/2049 491,241 0�15738,000 Royal Bank of Scotland Group 31/12/2049 662,195 0�20
Total United Kingdom 9,361,496 2.79
United States: 5.15% (2019: 7.88%)
990,000 Calpine 12/08/2026 799,650 0�243,371,000 CIT 31/12/2049 2,813,644 0�84
992,500 CSC 15/04/2027 806,094 0�24718,000 Energy Transfer Operating 31/12/2049 467,987 0�14
40,000 Energy Transfer Operating 31/12/2049 31,139 0�015,735,000 Enterprise Products Operating 15/02/2078 4,744,539 1�42

81
Federated Hermes Investment Funds Public Limited CompanyPortfolio Statement As at 31 December 2020 (continued)
a Header 1a Federated Hermes Global High Yield Credit Fund (continued)
Nominal Holdings Financial assets at fair value through profit or loss
Fair Value €
% of Net Assets
. . . . . Floating Rate Notes: 24.55% (2019: 27.10%) (continued) United States: 5.15% (2019: 7.88%) (continued)
1,550,000 General Electric 31/12/2049 1,180,029 0�351,808,000 General Motors Financial 31/12/2049 1,610,658 0�481,500,000 Hanesbrands Finance Luxembourg 15/06/2024 1,579,065 0�47
200,000 JPMorgan Chase 31/12/2049 162,428 0�054,578,000 Plains All American Pipeline 31/12/2049 3,049,381 0�91
Total United States 17,244,614 5.15
Total Floating Rate Notes 82,282,014 24.55
Financial Derivative Instruments: 2.24% (2019: 2.20%)
Credit Default Swaps: 0.63% (2019: 0.73%)
Credit Default Swaps: Receive Fixed (Sell Protection) - Unrealised Gains: 0.63% (2019: 0.73%)
European Union: 0.38% (2019: 0.73%)
(1,250,000) Altice France 5% 20/12/2025 (JP Morgan) 103,920 0�03(1,000,000) ArcelorMittal 5% 20/06/2026 (Merrill Lynch) 182,837 0�05
(500,000) ArcelorMittal 5% 20/12/2025 (Merrill Lynch) 87,207 0�03(1,200,000) ArcelorMittal 5% 20/12/2025 (JP Morgan) 209,298 0�06
(100,000) ArcelorMittal 5% 20/12/2026 (Credit Suisse) 19,109 0�01(2,050,000) Fiat Chrysler Automobiles 5% 20/12/2023 (JP Morgan) 244,745 0�07
(500,000) Fiat Chrysler Automobiles 5% 20/06/2025 (BNP Paribas) 81,325 0�02(200,000) Jaguar Land Rover Automotive 5% 20/12/2021 (Goldman Sachs) 2,148 -
(3,425,000) Tesco 1% 20/12/2023 (Merrill Lynch) 59,028 0�02(600,000) Tesco 1% 20/12/2025 (Goldman Sachs) 8,260 -
(1,150,000) Virgin Media Finance 5% 20/12/2025 (Goldman Sachs) 124,355 0�04(1,000,000) Virgin Media Finance 5% 20/12/2025 (Credit Suisse) 108,135 0�03
(500,000) Virgin Media Finance 5% 20/12/2025 (JP Morgan) 54,067 0�02
Total European Union 1,284,434 0.38
United States: 0.25% (2019: 0.00%)
(600,000) Dell 1% 20/12/2023 (Goldman Sachs) 2,184 -(3,000,000) HCA 5% 20/12/2025 (Goldman Sachs) 457,809 0�14
(875,000) UPC 5% 20/12/2025 (JP Morgan) 113,442 0�03(250,000) UPC 5% 20/12/2025 (JP Morgan) 32,412 0�01
(1,000,000) UPC 5% 20/12/2025 (BNP Paribas) 129,647 0�04

82
Federated Hermes Investment Funds Public Limited CompanyPortfolio Statement As at 31 December 2020 (continued)
a Header 1a Federated Hermes Global High Yield Credit Fund (continued)
Nominal Holdings Financial assets at fair value through profit or loss
Fair Value €
% of Net Assets
. . . . . Financial Derivative Instruments: 2.24% (2019: 2.20%) (continued) Credit Default Swaps: 0.63% (2019: 0.73%) (continued)
Credit Default Swaps: Receive Fixed (Sell Protection) - Unrealised Gains: 0.63% (2019: 0.73%) (continued)
United States: 0.25% (2019: 0.00%) (continued)
(625,000) UPC 5% 20/12/2025 (JP Morgan) 81,030 0�03
Total United States 816,524 0.25
Total Credit Default Swaps: Receive Fixed (Sell Protection) - Unrealised Gains 2,100,958 0.63
Total Credit Default Swaps 2,100,958 0.63
Forward Currency Contracts: 1.59% (2019: 1.12%)
CounterpartyCurrency Buys
Currency Sells
Currency Rate
Maturity Date
Unrealised Gain
€
% of Net Assets
Northern Trust GBP 110,309,308 EUR 120,245,822 1�0901 29/01/2021 2,949,140 0�88Northern Trust AUD 62,383,435 EUR 38,590,882 0�6186 29/01/2021 741,102 0�22Northern Trust GBP 17,161,617 EUR 18,707,513 1�0901 29/01/2021 458,819 0�14State Street EUR 93,045,523 USD 113,500,000 0�8198 17/03/2021 425,771 0�13Royal Bank of Canada EUR 93,044,227 USD 113,500,000 0�8198 17/03/2021 424,474 0�13Northern Trust GBP 7,217,239 EUR 7,867,358 1�0901 29/01/2021 192,954 0�06Northern Trust CHF 28,922,545 EUR 26,693,135 0�9229 29/01/2021 52,463 0�01Northern Trust GBP 797,285 EUR 869,103 1�0901 29/01/2021 21,316 0�01Northern Trust GBP 710,835 EUR 774,866 1�0901 29/01/2021 19,004 0�01JP Morgan GBP 1,100,000 EUR 1,209,053 1�0991 17/03/2021 18,501 -Northern Trust GBP 514,568 EUR 562,856 1�0938 29/01/2021 11,821 -Northern Trust GBP 175,623 EUR 191,419 1�0899 29/01/2021 4,720 -Northern Trust GBP 259,115 EUR 287,806 1�1107 29/01/2021 1,577 -Northern Trust AUD 81,413 EUR 50,286 0�6177 29/01/2021 1,044 -Northern Trust GBP 89,772 EUR 99,294 1�1061 29/01/2021 965 -Northern Trust CHF 162,555 EUR 149,721 0�9210 29/01/2021 599 -Northern Trust AUD 80,605 EUR 50,345 0�6246 29/01/2021 475 -Northern Trust GBP 30,615 EUR 33,958 1�1092 29/01/2021 233 -Northern Trust USD 5,874 EUR 4,772 0�8124 29/01/2021 26 -Northern Trust GBP 1,009 EUR 1,104 1�0938 29/01/2021 23 -Northern Trust GBP 336 EUR 371 1�1061 29/01/2021 4 -Northern Trust GBP 281 EUR 312 1�1092 29/01/2021 2 -Northern Trust CHF 4,454 EUR 4,117 0�9244 29/01/2021 1 -Northern Trust EUR 1,538 CHF 1,664 0�9246 06/01/2021 - -
Unrealised Gains on Forward Currency Contracts 5,325,034 1.59

83
Federated Hermes Investment Funds Public Limited CompanyPortfolio Statement As at 31 December 2020 (continued)
a Header 1a Federated Hermes Global High Yield Credit Fund (continued)
Nominal Holdings Financial assets at fair value through profit or loss
Fair Value €
% of Net Assets
. . . . . Financial Derivative Instruments: 2.24% (2019: 2.20%) (continued)
Futures Contracts - Unrealised Gains: 0.02% (2019: 0.35%)
Clearing Broker
Description
Currency
No. of Contracts
Unrealised Gain
€
% of Net Assets
Germany: 0.00% (2019: 0.09%) - -
United States: 0.02% (2019: 0.26%)
Morgan Stanley US Ultra CBT March 2021 USD (51) 54,379 0�02
Total United States 54,379 0.02
Total Futures Contracts - Unrealised Gains 54,379 0.02
Total Financial Derivative Instruments 7,480,371 2.24
Total financial assets at fair value through profit or loss 332,849,744 99.32
Financial liabilities at fair value through profit or loss
Financial Derivative Instruments: (0.94%) (2019: (0.22%))
Credit Default Swaps: (0.78%) (2019: (0.02%))
Credit Default Swaps: Pay Fixed (Buy Protection) - Unrealised Losses: (0.71%) (2019: 0.00%)
European Union: (0.71%) (2019: 0.00%)
19,950,000 Itraxx Europe 5% 20/12/2025 (Morgan Stanley) (2,370,359) (0�71)
Total European Union (2,370,359) (0.71)
Total Credit Default Swaps: Pay Fixed (Buy Protection) - Unrealised Losses (2,370,359) (0.71)
Credit Default Swaps: Receive Fixed (Sell Protection) - Unrealised Losses: (0.07%) (2019: (0.02%))
European Union: (0.03%) (2019: (0.01%))
(986,000) Marks & Spencer 1% 20/12/2023 (JP Morgan) (26,558) (0�01)(1,500,000) Renault 1% 20/12/2023 (Credit Suisse) (9,117) -(1,000,000) Telecom Italia 1% 20/12/2023 (BNP Paribas) (9,467) -(3,850,000) Telecom Italia 1% 20/12/2023 (Credit Suisse) (36,449) (0�01)
(250,000) Thyssenkrupp 1% 20/06/2023 (Goldman Sachs) (3,848) -(200,000) Thyssenkrupp 1% 20/06/2023 (Goldman Sachs) (3,078) -
(1,500,000) Thyssenkrupp 1% 20/06/2023 (Goldman Sachs) (23,087) (0�01)

84
Federated Hermes Investment Funds Public Limited CompanyPortfolio Statement As at 31 December 2020 (continued)
a Header 1a Federated Hermes Global High Yield Credit Fund (continued)
Nominal Holdings Financial liabilities at fair value through profit or loss
Fair Value €
% of Net Assets
. . . . . Financial Derivative Instruments: (0.94%) (2019: (0.22%)) (continued) Credit Default Swaps: (0.78%) (2019: (0.02%)) (continued)
Credit Default Swaps: Receive Fixed (Sell Protection) - Unrealised Losses: (0.07%) (2019: (0.02%)) (continued)
European Union: (0.03%) (2019: (0.01%)) (continued)
(400,000) Valeo 1% 20/12/2023 (Credit Suisse) (19) -
Total European Union (111,623) (0.03)
United States: (0.04%) (2019: (0.01%))
(450,000) Macy's Retail Holdings 1% 20/06/2025 (Barclays Bank) (61,549) (0�02)(450,000) Macy's Retail Holdings 1% 20/06/2025 (Goldman Sachs) (61,550) (0�02)
Total United States (123,099) (0.04)
Total Credit Default Swaps: Receive Fixed (Sell Protection) - Unrealised Losses (234,722) (0.07)
Total Credit Default Swaps (2,605,081) (0.78)
Forward Currency Contracts: (0.16%) (2019: (0.20%))
CounterpartyCurrency Buys
Currency Sells
Currency Rate
Maturity Date
Unrealised Loss
€
% of Net Assets
Northern Trust USD 231 EUR 190 0�8197 29/01/2021 (1) -Northern Trust USD 1,021 EUR 835 0�8177 29/01/2021 (1) -Northern Trust USD 1,021 EUR 835 0�8177 29/01/2021 (1) -Northern Trust USD 1,064 EUR 870 0�8177 29/01/2021 (1) -Northern Trust USD 4,115 EUR 3,364 0�8175 29/01/2021 (3) -Northern Trust EUR 328 GBP 300 1�0938 29/01/2021 (7) -Northern Trust EUR 13,405 CHF 14,527 0�9228 29/01/2021 (28) -Northern Trust EUR 17,573 GBP 15,843 1�1092 29/01/2021 (121) -Northern Trust EUR 14,304 GBP 12,932 1�1061 29/01/2021 (139) -Northern Trust USD 172,210 EUR 140,816 0�8177 29/01/2021 (142) -Northern Trust EUR 10,651 AUD 17,127 0�6219 29/01/2021 (147) -Northern Trust EUR 45,319 GBP 40,801 1�1107 29/01/2021 (248) -Northern Trust EUR 13,920 GBP 12,726 1�0938 29/01/2021 (292) -Northern Trust EUR 29,628 GBP 27,183 1�0899 29/01/2021 (730) -Northern Trust USD 1,126,653 EUR 921,266 0�8177 29/01/2021 (928) -Royal Bank of Canada EUR 1,464,690 USD 1,800,000 0�8137 17/03/2021 (4,169) -Northern Trust USD 5,274,531 EUR 4,312,992 0�8177 29/01/2021 (4,345) -Northern Trust USD 6,642,090 EUR 5,431,248 0�8177 29/01/2021 (5,471) -

85
Federated Hermes Investment Funds Public Limited CompanyPortfolio Statement As at 31 December 2020 (continued)
a Header 1a Federated Hermes Global High Yield Credit Fund (continued)
Nominal Holdings Financial liabilities at fair value through profit or loss
Fair Value €
% of Net Assets
. . . . . Financial Derivative Instruments: (0.94%) (2019: (0.22%)) (continued) Forward Currency Contracts: (0.16%) (2019: (0.20%)) (continued)
CounterpartyCurrency Buys
Currency Sells
Currency Rate
Maturity Date
Unrealised Loss
€
% of Net Assets
Lloyds Bank EUR 34,633,729 GBP 31,500,000 1�0995 17/03/2021 (518,951) (0�16)
Unrealised Losses on Forward Currency Contracts (535,725) (0.16)
Futures Contracts - Unrealised Losses: 0.00% (2019: 0.00%)
Clearing Broker
Description
Currency
No. of Contracts
Unrealised Loss
€
% of Net Assets
United States: 0.00% (2019: 0.00%)
Morgan Stanley 10 Year Note CBT March 2021 USD (66) (6,551) -
Total United States (6,551) -
Total Futures Contracts - Unrealised Loss (6,551) -
Total Financial Derivative Instruments (3,147,357) (0.94)
Total financial liabilities at fair value through profit or loss (3,147,357) (0.94)
Financial assets at fair value through profit or lossNet financial assets at fair value through profit or loss (2019: 98.16%) (Cost: € 311,895,178)
329,702,387 98.38
Net Cash (2019: 1.52%) 2,491,744 0.74
Other Net Assets (2019: 0.32%) 2,934,858 0.88
Net Assets Attributable to Holders of Redeemable Participating Shares 335,128,989 100.00
Portfolio Classification
% of Total Assets
Transferable securities traded on a regulated market 95�29OTC financial derivative instruments 2�17Financial derivative instruments dealt in on a regulated market 0�02Cash 1�47Other assets 1�05Total 100.00

86
Federated Hermes Investment Funds Public Limited CompanyPortfolio StatementAs at 31 December 2020 (continued)
a Header 1a Federated Hermes Europe ex-UK Equity Fund
Nominal Holdings Financial assets at fair value through profit or loss
Fair Value €
% of Net Assets
. . . . .Equities: 99.57% (2019: 99.10%)
Belgium: 2.56% (2019: 3.70%)
23,014 Umicore 897,776 2�56
Total Belgium 897,776 2.56
Canada: 0.00% (2019: 2.23%) - -
Denmark: 8.41% (2019: 8.03%)
25,105 Novo Nordisk 1,439,619 4�128,990 Orsted 1,502,523 4�29
Total Denmark 2,942,142 8.41
France: 13.77% (2019: 8.26%)
17,155 Edenred 803,368 2�2911,609 Gaztransport Et Technigaz 923,496 2�648,282 Schneider Electric 993,426 2�842,307 Soitec 369,351 1�069,623 Ubisoft Entertainment 766,568 2�19
29,727 Valeo 963,155 2�75
Total France 4,819,364 13.77
Germany: 26.57% (2019: 26.12%)
4,723 Adidas 1,406,981 4�024,274 Deutsche Boerse 595,155 1�70
29,638 Duerr 989,909 2�8319,800 Fresenius 749,232 2�1422,583 Hella 1,194,641 3�4115,764 KION 1,121,766 3�21
9,009 Merck 1,264,413 3�619,359 SAP 1,003,472 2�872,836 Sartorius - Preferred 974,450 2�78
Total Germany 9,300,019 26.57
Ireland: 0.00% (2019: 1.49%) - -
Italy: 1.99% (2019: 2.83%)
93,317 Cerved Information Solutions 695,212 1�99
Total Italy 695,212 1.99
Netherlands: 20.06% (2019: 17.45%)
460 Adyen 882,510 2�52

87
Federated Hermes Investment Funds Public Limited CompanyPortfolio Statement As at 31 December 2020 (continued)
a Header 1a Federated Hermes Europe ex-UK Equity Fund (continued)
Nominal Holdings Financial assets at fair value through profit or loss
Fair Value €
% of Net Assets
. . . . . Equities: 99.57% (2019: 99.10%) (continued) Netherlands: 20.06% (2019: 17.45%) (continued)
6,954 ASM International 1,258,326 3�595,245 ASML Holding 2,103,245 6�01
10,197 Euronext 926,908 2�65145,413 ING Groep 1,112,700 3�18
10,616 Wolters Kluwer 736,963 2�11
Total Netherlands 7,020,652 20.06
Norway: 2.43% (2019: 5.02%)
21,057 Tomra Systems 850,922 2�43
Total Norway 850,922 2.43
Spain: 7.97% (2019: 10.79%)
17,277 Amadeus IT 1,035,583 2�9631,994 Grifols 486,949 1�3938,294 Siemens Gamesa Renewable Energy 1,266,766 3�62
Total Spain 2,789,298 7.97
Sweden: 0.00% (2019: 3.60%) - -
Switzerland: 12.80% (2019: 7.02%)
12,894 Alcon 701,722 2�0027,988 Idorsia 660,629 1�89
2,147 Lonza Group 1,129,527 3�236,029 Sika 1,348,362 3�85
670 Straumann 639,218 1�83
Total Switzerland 4,479,458 12.80
United States: 3.01% (2019: 2.56%)
24,801 Qiagen 1,052,802 3�01
Total United States 1,052,802 3.01
Total Equities 34,847,645 99.57

88
Federated Hermes Investment Funds Public Limited CompanyPortfolio Statement As at 31 December 2020 (continued)
a Header 1a Federated Hermes Europe ex-UK Equity Fund (continued)
Nominal Holdings Financial assets at fair value through profit or loss
Fair Value €
% of Net Assets
. . . . .Financial Derivative Instruments: 0.02% (2019: 0.00%)
Forward Currency Contracts: 0.02% (2019: 0.00%)
CounterpartyCurrency Buys
Currency Sells
Currency Rate
Maturity Date
Unrealised Gain
€
% of Net Assets
Northern Trust GBP 331,174 EUR 361,140 1�0905 29/01/2021 6,966 0�02Northern Trust GBP 57,032 EUR 62,192 1�0905 29/01/2021 1,200 -Northern Trust GBP 100 EUR 110 1�1003 29/01/2021 1 -Northern Trust EUR 5 USD 6 0�8209 29/01/2021 - -Northern Trust EUR 5 USD 6 0�8202 29/01/2021 - -
Unrealised Gains on Forward Currency Contracts 8,167 0.02
Total Financial Derivative Instruments 8,167 0.02
Total financial assets at fair value through profit or loss 34,855,812 99.59
Financial liabilities at fair value through profit or loss
Financial Derivative Instruments: 0.00% (2019: 0.00%)
Forward Currency Contracts: 0.00% (2019: 0.00%)
CounterpartyCurrency Buys
Currency Sells
Currency Rate
Maturity Date
Unrealised Loss
€
% of Net Assets
Northern Trust EUR 7 GBP 7 1�0909 29/01/2021 - -Northern Trust EUR 2,739 GBP 2,471 1�1086 29/01/2021 (7) -
Unrealised Losses on Forward Currency Contracts (7) -
Total Financial Derivative Instruments (7) -
Total financial liabilities at fair value through profit or loss (7) -

89
Federated Hermes Investment Funds Public Limited CompanyPortfolio Statement As at 31 December 2020 (continued)
a Header 1a Federated Hermes Europe ex-UK Equity Fund (continued)
Nominal Holdings Financial assets at fair value through profit or loss
Fair Value €
% of Net Assets
. . . . .Net financial assets at fair value through profit or loss (2019: 99.10%) (Cost: € 27,411,524)
34,855,805 99.59
Net Cash (2019: 0.97%) 196,199 0.56
Other Net Liabilities (2019: (0.07%)) (52,152) (0.15)
Net Assets Attributable to Holders of Redeemable Participating Shares 34,999,852 100.00
Portfolio Classification
% of Total Assets
Transferable securities admitted to official stock exchange listing 99�29OTC financial derivative instruments 0�02Cash 0�57Other assets 0�12Total 100.00

90
Federated Hermes Investment Funds Public Limited CompanyPortfolio StatementAs at 31 December 2020 (continued)
Header 1XX Federated Hermes US SMID Equity Fund
Nominal Holdings Financial assets at fair value through profit or loss
Fair Value $ I
% of Net Assets
. . . . .Equities: 95.76% (2019: 94.29%)
Canada: 0.00% (2019: 2.71%) - -
Consumer, Cyclical: 0.00% (2019: 1.42%) - -
Financial: 0.00% (2019: 1.29%) - -
United States: 95.76% (2019: 91.58%)
Basic Materials: 2.83% (2019: 3.51%) 404,721 Axalta Coating Systems 11,558,832 1�35139,560 RPM International 12,630,180 1�48
Total Basic Materials 24,189,012 2.83
Communications: 2.45% (2019: 1.80%) 647,518 Cargurus 20,947,207 2�45
Total Communications 20,947,207 2.45
Consumer, Cyclical: 8.25% (2019: 5.27%) 238,918 Brunswick 18,695,334 2�19121,778 Columbia Sportswear 10,770,046 1�26400,142 LKQ 14,153,023 1�65
4,156 NVR 17,154,555 2�00272,872 Skechers USA 9,828,849 1�15
Total Consumer, Cyclical 70,601,807 8.25
Consumer, Non-cyclical: 18.57% (2019: 20.40%) 54,528 Abiomed 17,662,710 2�07
264,090 AMN Healthcare Services 17,992,452 2�1024,461 Bio-Rad Laboratories 14,060,916 1�64
100,276 Gartner 15,898,760 1�8663,340 ICU Medical 13,545,892 1�58
135,364 Ingredion 10,661,269 1�25157,014 Livanova 10,513,657 1�23
79,137 STERIS 14,742,432 1�72384,188 Terminix Global 19,474,490 2�28
28,390 West Pharmaceutical Services 7,947,496 0�9381,415 WEX 16,374,999 1�91
Total Consumer, Non-cyclical 158,875,073 18.57

91
Federated Hermes Investment Funds Public Limited CompanyPortfolio Statement As at 31 December 2020 (continued)
Header 1XX Federated Hermes US SMID Equity Fund (continued)
Nominal Holdings Financial assets at fair value through profit or loss
Fair Value $ I
% of Net Assets
. . . . .Equities: 95.76% (2019: 94.29%) (continued)
United States: 95.76% (2019: 91.58%) (continued)
Energy: 0.00% (2019: 2.10%) - -
Financial: 18.59% (2019: 20.36%) 27,802 Alleghany 16,681,756 1�95
318,483 Brown & Brown 14,729,839 1�72177,412 Community Bank System 11,008,415 1�29354,630 Lazard 14,908,645 1�74244,506 Palomar 21,247,571 2�48142,008 Reinsurance of America 16,387,723 1�92913,427 Sterling Bancorp 16,414,283 1�92349,671 TCF Financial 12,895,866 1�51
11,782 White Mountains Insurance 11,761,971 1�37376,359 Wintrust Financial 22,984,244 2�69
Total Financial 159,020,313 18.59
Industrial: 25.79% (2019: 25.99%) 302,879 AO Smith 16,570,510 1�94125,453 AptarGroup 17,110,535 2�00
89,912 Axon Enterprise 11,138,299 1�30159,891 Chart Industries 19,150,145 2�24134,077 Clean Harbors 10,089,294 1�18159,962 Cognex 12,939,326 1�51166,319 Eagle Materials 16,956,222 1�98234,211 Fortune Brands Home & Security 20,097,646 2�35148,972 Kirby 7,788,256 0�91
43,453 Martin Marietta Materials 12,207,686 1�43269,948 National Instruments 11,791,329 1�38432,341 nVent Electric 10,060,575 1�18
92,672 PerkinElmer 13,027,830 1�52126,520 Simpson Manufacturing 11,741,056 1�37152,941 Timken 11,819,280 1�38148,764 Woodward 18,116,480 2�12
Total Industrial 220,604,469 25.79
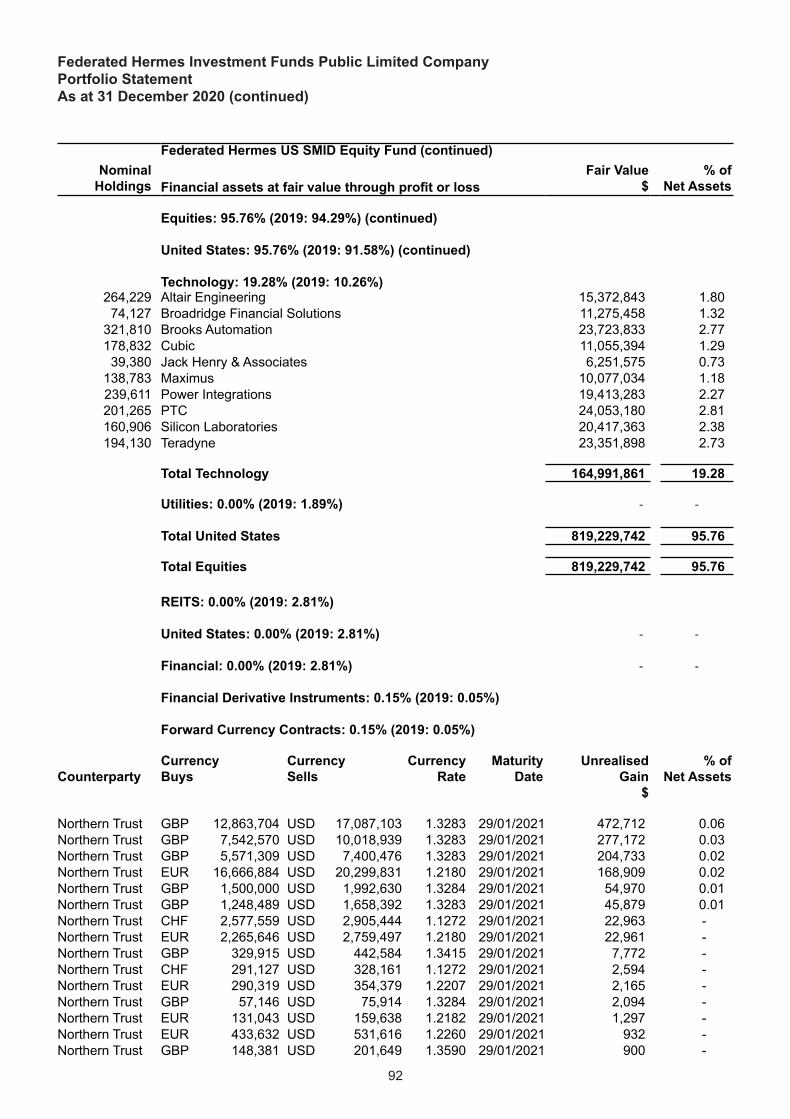
92
Federated Hermes Investment Funds Public Limited CompanyPortfolio Statement As at 31 December 2020 (continued)
Header 1XX Federated Hermes US SMID Equity Fund (continued)
Nominal Holdings Financial assets at fair value through profit or loss
Fair Value $ I
% of Net Assets
. . . . .Equities: 95.76% (2019: 94.29%) (continued)
United States: 95.76% (2019: 91.58%) (continued)
Technology: 19.28% (2019: 10.26%) 264,229 Altair Engineering 15,372,843 1�80
74,127 Broadridge Financial Solutions 11,275,458 1�32321,810 Brooks Automation 23,723,833 2�77178,832 Cubic 11,055,394 1�29
39,380 Jack Henry & Associates 6,251,575 0�73138,783 Maximus 10,077,034 1�18239,611 Power Integrations 19,413,283 2�27201,265 PTC 24,053,180 2�81160,906 Silicon Laboratories 20,417,363 2�38194,130 Teradyne 23,351,898 2�73
Total Technology 164,991,861 19.28
Utilities: 0.00% (2019: 1.89%) - -
Total United States 819,229,742 95.76
Total Equities 819,229,742 95.76
REITS: 0.00% (2019: 2.81%)
United States: 0.00% (2019: 2.81%) - -
Financial: 0.00% (2019: 2.81%) - -
Financial Derivative Instruments: 0.15% (2019: 0.05%)
Forward Currency Contracts: 0.15% (2019: 0.05%)
CounterpartyCurrency Buys
Currency Sells
Currency Rate
Maturity Date
Unrealised Gain
$
% of Net Assets
Northern Trust GBP 12,863,704 USD 17,087,103 1�3283 29/01/2021 472,712 0�06Northern Trust GBP 7,542,570 USD 10,018,939 1�3283 29/01/2021 277,172 0�03Northern Trust GBP 5,571,309 USD 7,400,476 1�3283 29/01/2021 204,733 0�02Northern Trust EUR 16,666,884 USD 20,299,831 1�2180 29/01/2021 168,909 0�02Northern Trust GBP 1,500,000 USD 1,992,630 1�3284 29/01/2021 54,970 0�01Northern Trust GBP 1,248,489 USD 1,658,392 1�3283 29/01/2021 45,879 0�01Northern Trust CHF 2,577,559 USD 2,905,444 1�1272 29/01/2021 22,963 -Northern Trust EUR 2,265,646 USD 2,759,497 1�2180 29/01/2021 22,961 -Northern Trust GBP 329,915 USD 442,584 1�3415 29/01/2021 7,772 -Northern Trust CHF 291,127 USD 328,161 1�1272 29/01/2021 2,594 -Northern Trust EUR 290,319 USD 354,379 1�2207 29/01/2021 2,165 -Northern Trust GBP 57,146 USD 75,914 1�3284 29/01/2021 2,094 -Northern Trust EUR 131,043 USD 159,638 1�2182 29/01/2021 1,297 -Northern Trust EUR 433,632 USD 531,616 1�2260 29/01/2021 932 -Northern Trust GBP 148,381 USD 201,649 1�3590 29/01/2021 900 -

93
Federated Hermes Investment Funds Public Limited CompanyPortfolio Statement As at 31 December 2020 (continued)
Header 1XX Federated Hermes US SMID Equity Fund (continued)
Nominal Holdings Financial assets at fair value through profit or loss
Fair Value $ I
% of Net Assets
. . . . .Financial Derivative Instruments: 0.15% (2019: 0.05%) (continued)
Forward Currency Contracts: 0.15% (2019: 0.05%) (continued)
CounterpartyCurrency Buys
Currency Sells
Currency Rate
Maturity Date
Unrealised Gain
$
% of Net Assets
Northern Trust EUR 100,000 USD 122,015 1�2201 29/01/2021 796 -Northern Trust EUR 79,343 USD 96,810 1�2201 29/01/2021 631 -Northern Trust GBP 100,811 USD 137,002 1�3590 29/01/2021 612 -Northern Trust EUR 273,826 USD 335,700 1�2260 29/01/2021 588 -Northern Trust EUR 51,422 USD 62,631 1�2180 29/01/2021 521 -Northern Trust CHF 31,352 USD 35,340 1�1272 29/01/2021 279 -Northern Trust CHF 25,000 USD 28,154 1�1262 29/01/2021 249 -Northern Trust GBP 4,244 USD 5,638 1�3284 29/01/2021 156 -Northern Trust GBP 4,333 USD 5,820 1�3431 29/01/2021 95 -Northern Trust GBP 2,125 USD 2,855 1�3431 29/01/2021 47 -Northern Trust GBP 1,817 USD 2,438 1�3415 29/01/2021 43 -Northern Trust EUR 150,000 USD 184,199 1�2280 29/01/2021 17 -Northern Trust GBP 4,125 USD 5,616 1�3614 29/01/2021 15 -Northern Trust EUR 1,101 USD 1,342 1�2180 29/01/2021 11 -Northern Trust EUR 1,043 USD 1,270 1�2180 29/01/2021 11 -Northern Trust EUR 9,170 USD 11,261 1�2280 29/01/2021 1 -
Total Unrealised Gains on Forward Currency Contracts 1,292,125 0.15
Total Financial Derivative Instruments 1,292,125 0.15
Total financial assets at fair value through profit or loss 820,521,867 95.91
Financial liabilities at fair value through profit or loss
Financial Derivative Instruments: 0.00% (2019: 0.00%)
Forward Currency Contracts: 0.00% (2019: 0.00%)
CounterpartyCurrency Buys
Currency Sells
Currency Rate
Maturity Date
Unrealised Loss
$
% of Net Assets
Northern Trust USD 8,500 GBP 6,244 1�3614 29/01/2021 (23) -Northern Trust USD 2,764 GBP 2,058 1�3431 29/01/2021 (45) -Northern Trust USD 162,955 GBP 121,471 1�3415 29/01/2021 (2,862) -
Total Unrealised Losses on Forward Currency Contracts (2,930) -
Total Financial Derivative Instruments (2,930) -
Total financial liabilities at fair value through profit or loss (2,930) -

94
Federated Hermes Investment Funds Public Limited CompanyPortfolio Statement As at 31 December 2020 (continued)
Header 1XX Federated Hermes US SMID Equity Fund (continued)
Nominal Holdings Financial liabilities at fair value through profit or loss
Fair Value $ I
% of Net Assets
. . . . .Net financial assets at fair value through profit or loss (2019: 97.15%) (Cost: $ 656,638,714)
820,518,937 95.91
Net Cash (2019: 2.94%) 35,298,619 4.13
Other Net Liabilities (2019: (0.09%)) (339,694) (0.04)
Net Assets Attributable to Holders of Redeemable Participating Shares 855,477,862 100.00Header 1
Portfolio Classification
% of Total Assets
Transferable securities admitted to official stock exchange listing 95�64OTC financial derivative instruments 0�15Cash 4�12Other assets 0�09Total 100.00

95
Federated Hermes Investment Funds Public Limited CompanyPortfolio StatementAs at 31 December 2020 (continued)
Header 1XX Federated Hermes Asia ex-Japan Equity Fund
Nominal Holdings Financial assets at fair value through profit or loss
Fair Value $ I
% of Net Assets
. . . . .American Depositary Receipts: 7.01% (2019: 11.24%)
Japan: 0.12% (2019: 0.00%)
Consumer, Cyclical: 0.12% (2019: 0.00%) 105,972 Honda Motor ADR 2,984,171 0�12
Total Consumer, Cyclical 2,984,171 0.12
Total Japan 2,984,171 0.12
People's Republic of China: 6.89% (2019: 11.24%)
Communications: 6.89% (2019: 11.24%) 116,441 Alibaba ADR 27,758,370 1�12384,387 Baidu ADR 84,422,917 3�42638,751 Trip�com Group ADR 21,238,471 0�86896,957 Weibo ADR 36,793,176 1�49
Total Communications 170,212,934 6.89
Total People's Republic of China 170,212,934 6.89
Total American Depositary Receipts 173,197,105 7.01
Equities: 91.82% (2019: 86.64%)
Hong Kong: 1.45% (2019: 1.95%)
Consumer, Cyclical: 1.45% (2019: 1.95%) 20,023,000 Chow Tai Fook Jewellery Group 25,181,940 1�0213,392,776 Lifestyle International 10,624,320 0�43
Total Consumer, Cyclical 35,806,260 1.45
Total Hong Kong 35,806,260 1.45
India: 4.59% (2019: 1.89%)
Consumer, Non-cyclical: 2.59% (2019: 0.00%) 9,679,860 Adani Ports & Special Economic Zone 64,086,390 2�59
Total Consumer, Non-cyclical 64,086,390 2.59
Industrial: 0.74% (2019: 0.00%) 829,364 ACC 18,361,387 0�74
Total Industrial 18,361,387 0.74

96
Federated Hermes Investment Funds Public Limited CompanyPortfolio Statement As at 31 December 2020 (continued)
Header 1XX Federated Hermes Asia ex-Japan Equity Fund (continued)
Nominal Holdings Financial assets at fair value through profit or loss
Fair Value $ I
% of Net Assets
. . . . .Equities: 91.82% (2019: 86.64%) (continued)
India: 4.59% (2019: 1.89%) (continued)
Utilities: 1.26% (2019: 1.89%) 11,990,315 Power Grid of India 31,154,225 1�26
Total Utilities 31,154,225 1.26
Total India 113,602,002 4.59
Japan: 4.30% (2019: 2.58%)
Consumer, Cyclical: 2.34% (2019: 1.66%) 2,066,550 Honda Motor 57,696,576 2�34
Total Consumer, Cyclical 57,696,576 2.34
Technology: 1.96% (2019: 0.92%) 1,573,400 Nexon 48,546,180 1�96
Total Technology 48,546,180 1.96
Total Japan 106,242,756 4.30
People's Republic of China: 29.36% (2019: 29.68%)
Basic Materials: 1.00% (2019: 1.09%) 155,757,517 China BlueChemical 24,712,094 1�00
Total Basic Materials 24,712,094 1.00
Communications: 8.25% (2019: 2.67%) 1,895,864 Alibaba 56,881,667 2�304,861,000 China Mobile 27,714,262 1�12
26,770,091 China South Publishing & Media 39,218,903 1�581,820,700 JD�com 80,319,301 3�25
Total Communications 204,134,133 8.25
Consumer, Cyclical: 0.19% (2019: 1.11%) 1,050,600 Haier Smart Home 4,717,606 0�19
Total Consumer, Cyclical 4,717,606 0.19
Consumer, Non-cyclical: 10.99% (2019: 10.42%) 85,060,190 COSCO Shipping Ports 59,138,532 2�3925,279,200 Sinopharm 61,497,922 2�4942,607,190 Tingyi Cayman Islands 72,765,631 2�94
4,488,083 Yunnan Baiyao 78,377,591 3�17
Total Consumer, Non-cyclical 271,779,676 10.99

97
Federated Hermes Investment Funds Public Limited CompanyPortfolio Statement As at 31 December 2020 (continued)
Header 1XX Federated Hermes Asia ex-Japan Equity Fund (continued)
Nominal Holdings Financial assets at fair value through profit or loss
Fair Value $ I
% of Net Assets
. . . . .Equities: 91.82% (2019: 86.64%) (continued)
People’s Republic of China: 29.36% (2019: 29.68%) (continued)
Energy: 3.36% (2019: 6.14%) 14,908,000 China Oilfield Services 12,614,750 0�5181,494,000 Kunlun Energy 70,429,704 2�85
Total Energy 83,044,454 3.36
Financial: 2.16% (2019: 1.62%) 10,924,000 China Overseas Land & Investment 23,757,169 0�9639,173,000 PICC Property & Casualty 29,660,629 1�20
Total Financial 53,417,798 2.16
Industrial: 1.36% (2019: 2.57%) 2,956,500 AAC Technologies 16,550,954 0�67
20,404,543 Beijing Capital International Airport 17,028,899 0�69
Total Industrial 33,579,853 1.36
Utilities: 2.05% (2019: 4.06%) 15,514,404 Beijing Enterprises 50,630,363 2�05
Total Utilities 50,630,363 2.05
Total People's Republic of China 726,015,977 29.36
Republic of South Korea: 22.21% (2019: 14.74%)
Basic Materials: 7.49% (2019: 3.49%) 1,175,310 Hyundai Steel 42,844,772 1�74
572,699 Kumho Petrochemical 76,444,219 3�091,295,396 LOTTE Fine Chemical 65,825,149 2�66
Total Basic Materials 185,114,140 7.49
Consumer, Cyclical: 2.99% (2019: 2.06%) 132,794 Hankook AtlasBX 6,906,804 0�28
92,020 Hyundai Motor - 2nd Preferred 7,589,977 0�312,036,383 Youngone 59,424,966 2�40
Total Consumer, Cyclical 73,921,747 2.99
Financial: 2.81% (2019: 3.74%) 1,738,615 KB Financial 69,461,374 2�81
Total Financial 69,461,374 2.81

98
Federated Hermes Investment Funds Public Limited CompanyPortfolio Statement As at 31 December 2020 (continued)
Header 1XX Federated Hermes Asia ex-Japan Equity Fund (continued)
Nominal Holdings Financial assets at fair value through profit or loss
Fair Value $ I
% of Net Assets
. . . . .Equities: 91.82% (2019: 86.64%) (continued)
Republic of South Korea: 22.21% (2019: 14.74%) (continued)
Technology: 8.92% (2019: 5.45%) 60,916 LG 4,906,702 0�20
2,892,981 Samsung Electronics 215,715,236 8�72
Total Technology 220,621,938 8.92
Total Republic of South Korea 549,119,199 22.21
South Africa: 2.64% (2019: 0.00%)
Communications: 2.64% (2019: 0.00%) 317,707 Naspers 65,367,539 2�64
Total Communications 65,367,539 2.64
Total South Africa 65,367,539 2.64
Taiwan: 19.74% (2019: 25.27%)
Basic Materials: 0.00% (2019: 1.37%) - -
Industrial: 2.64% (2019: 5.64%) 5,894,879 Hon Hai Precision Industry 19,301,334 0�783,689,237 Simplo Technology 45,954,621 1�86
Total Industrial 65,255,955 2.64
Technology: 17.10% (2019: 18.26%) 37,061,500 ASE Technology 107,235,389 4�34
7,226,000 Asustek Computer 64,421,418 2�6020,958,000 Lite-On Technology 37,145,291 1�50
2,203,000 MediaTek 58,567,905 2�3716,084,990 Powertech Technology 54,326,484 2�20
5,362,000 Taiwan Semiconductor Manufacturing 101,141,007 4�09
Total Technology 422,837,494 17.10
Total Taiwan 488,093,449 19.74
Thailand: 3.39% (2019: 3.25%)
Consumer, Cyclical: 1.86% (2019: 1.55%) 189,653,255 AP Thailand 45,894,062 1�86
Total Consumer, Cyclical 45,894,062 1.86

99
Federated Hermes Investment Funds Public Limited CompanyPortfolio Statement As at 31 December 2020 (continued)
Header 1XX Federated Hermes Asia ex-Japan Equity Fund (continued)
Nominal Holdings Financial assets at fair value through profit or loss
Fair Value $ I
% of Net Assets
. . . . .Equities: 91.82% (2019: 86.64%) (continued)
Thailand: 3.39% (2019: 3.25%) (continued)
Financial: 1.53% (2019: 1.70%) 1,378,600 Bangkok Bank 5,475,748 0�228,176,600 Bangkok Bank GDR 32,340,691 1�31
Total Financial 37,816,439 1.53
Total Thailand 83,710,501 3.39
United Kingdom: 3.72% (2019: 4.52%)
Diversified: 3.72% (2019: 4.52%) 13,175,500 CK Hutchison 91,943,238 3�72
Total Diversified 91,943,238 3.72
Total United Kingdom 91,943,238 3.72
United States: 0.00% (2019: 2.76%) - -
Technology: 0.00% (2019: 2.76%) - -
Vietnam: 0.42% (2019: 0.00%)
Consumer, Non-cyclical: 0.42% (2019: 0.00%) 2,208,324 Vietnam Dairy Products 10,408,996 0�42
Total Consumer, Non-cyclical 10,408,996 0.42
Total Vietnam 10,408,996 0.42
Total Equities 2,270,309,917 91.82
P-Notes: 0.00% (2019: 1.06%)
People's Republic of China: 0.00% (2019: 1.06%) - -
Participatory Notes: 0.00% (2019: 1.06%) - -
Financial Derivative Instruments: 0.04% (2019: 0.02%)
Forward Currency Contracts: 0.04% (2019: 0.02%)
CounterpartyCurrency Buys
Currency Sells
Currency Rate
Maturity Date
Unrealised Gain
$
% of Net Assets
Northern Trust GBP 16,917,363 USD 22,471,654 1�3283 29/01/2021 621,675 0�02Northern Trust GBP 5,646,532 USD 7,500,396 1�3283 29/01/2021 207,497 0�01Northern Trust EUR 15,384,024 USD 18,737,341 1�2180 29/01/2021 155,908 0�01Northern Trust EUR 6,053,189 USD 7,372,626 1�2180 29/01/2021 61,346 -

100
Federated Hermes Investment Funds Public Limited CompanyPortfolio Statement As at 31 December 2020 (continued)
Header 1XX Federated Hermes Asia ex-Japan Equity Fund (continued)
Nominal Holdings Financial assets at fair value through profit or loss
Fair Value $ I
% of Net Assets
. . . . . Financial Derivative Instruments: 0.04% (2019: 0.02%) (continued) Forward Currency Contracts: 0.04% (2019: 0.02%) (continued)
CounterpartyCurrency Buys
Currency Sells
Currency Rate
Maturity Date
Unrealised Gain
$
% of Net Assets
Northern Trust CHF 4,456,324 USD 5,023,202 1�1272 29/01/2021 39,700 -Northern Trust CHF 1,746,065 USD 1,968,178 1�1272 29/01/2021 15,555 -Northern Trust EUR 860,857 USD 1,048,501 1�2180 29/01/2021 8,724 -Northern Trust GBP 110,402 USD 150,036 1�3590 29/01/2021 670 -
Total Unrealised Gains on Forward Currency Contracts 1,111,075 0.04
Total Financial Derivative Instruments 1,111,075 0.04
Total financial assets at fair value through profit or loss 2,444,618,097 98.87
Financial liabilities at fair value through profit or loss
Financial Derivative Instruments: 0.00% (2019: 0.00%)
Forward Currency Contracts: 0.00% (2019: 0.00%)
CounterpartyCurrency Buys
Currency Sells
Currency Rate
Maturity Date
Unrealised Loss
$
% of Net Assets
Northern Trust USD 1,001 GBP 754 1�3284 29/01/2021 (28) -Northern Trust USD 25,291 GBP 18,577 1�3614 29/01/2021 (68) -Northern Trust USD 19,503 CHF 17,234 1�1316 29/01/2021 (77) -Northern Trust USD 5,189 GBP 3,906 1�3284 29/01/2021 (143) -Northern Trust USD 180,207 GBP 132,368 1�3614 29/01/2021 (485) -Northern Trust USD 378,088 GBP 281,838 1�3415 29/01/2021 (6,639) -
Total Unrealised Losses on Forward Currency Contracts (7,440) -
Total Financial Derivative Instruments (7,440) -
Total financial liabilities at fair value through profit or loss (7,440) -

101
Federated Hermes Investment Funds Public Limited CompanyPortfolio Statement As at 31 December 2020 (continued)
Header 1XX Federated Hermes Asia ex-Japan Equity Fund (continued)
Nominal Holdings Financial liabilities at fair value through profit or loss
Fair Value $ I
% of Net Assets
. . . . .Net financial assets at fair value through profit or loss (2019: 98.96%) (Cost: $ 2,237,403,027)
2,444,610,657 98.87
Net Cash (2019: 0.78%) 12,784,934 0.52
Other Net Assets (2019: 0.26%) 15,100,153 0.61
Net Assets Attributable to Holders of Redeemable Participating Shares 2,472,495,744 100.00Header 1
Portfolio Classification
% of Total Assets
Transferable securities admitted to official stock exchange listing 98�55OTC financial derivative instruments 0�04Cash 0�52Other assets 0�89Total 100.00

102
Federated Hermes Investment Funds Public Limited CompanyPortfolio StatementAs at 31 December 2020 (continued)
a Header 1a Federated Hermes Global Equity ESG Fund
Nominal Holdings Financial assets at fair value through profit or loss
Fair Value $
% of Net Assets
. . . . .Equities: 95.92% (2019: 95.50%)
Australia: 0.33% (2019: 0.69%)
240,547 Ampol 5,291,673 0�33
Total Australia 5,291,673 0.33
Austria: 0.50% (2019: 0.60%)
197,916 OMV 8,016,103 0�50
Total Austria 8,016,103 0.50
Brazil: 1.01% (2019: 0.66%)
3,410,200 Magazine Luiza 16,380,673 1�01
Total Brazil 16,380,673 1.01
Canada: 0.00% (2019: 0.16%) - -
Denmark: 1.61% (2019: 1.83%)
253,581 Novo Nordisk 17,847,300 1�1040,057 Orsted 8,216,905 0�51
Total Denmark 26,064,205 1.61
Finland: 1.06% (2019: 1.99%)
897,779 Stora Enso 17,239,055 1�06
Total Finland 17,239,055 1.06
France: 1.02% (2019: 1.46%)
75,269 Gaztransport Et Technigaz 7,348,941 0�4689,897 Vinci 9,111,471 0�56
Total France 16,460,412 1.02
Germany: 0.34% (2019: 0.62%)
75,809 Vonovia 5,560,320 0�34
Total Germany 5,560,320 0.34
Hong Kong: 1.32% (2019: 0.24%)
1,741,833 AIA 21,344,478 1�32
Total Hong Kong 21,344,478 1.32

103
Federated Hermes Investment Funds Public Limited CompanyPortfolio Statement As at 31 December 2020 (continued)
a Header 1a Federated Hermes Global Equity ESG Fund (continued)
Nominal Holdings Financial assets at fair value through profit or loss
Fair Value $
% of Net Assets
. . . . . Equities: 95.92% (2019: 95.50%) (continued)
Hungary: 0.76% (2019: 0.79%)
272,179 OTP Bank 12,248,444 0�76
Total Hungary 12,248,444 0.76
India: 0.41% (2019: 0.00%)
93,000 Dr� Reddy's Laboratories 6,625,029 0�41
Total India 6,625,029 0.41
Indonesia: 0.59% (2019: 0.51%)
40,454,300 Telekomunikasi Indonesia Persero 9,530,515 0�59
Total Indonesia 9,530,515 0.59
Italy: 1.39% (2019: 0.91%)
307,825 Prysmian Group 10,986,686 0�681,231,821 UniCredit 11,562,824 0�71
Total Italy 22,549,510 1.39
Japan: 5.58% (2019: 5.96%)
97,100 Daifuku 12,021,501 0�74131,100 Fujifilm 6,917,206 0�43281,500 Kurita Water Industries 10,774,924 0�67208,000 Lion 5,041,323 0�31157,400 Nitto Denko 14,095,978 0�87155,100 Omron 13,844,855 0�85840,100 ORIX 12,915,524 0�80148,000 Sony Corporation 14,769,126 0�91
Total Japan 90,380,437 5.58
Netherlands: 2.15% (2019: 2.59%)
70,670 ASML Holding 34,781,467 2�15
Total Netherlands 34,781,467 2.15
Norway: 2.04% (2019: 0.42%)
759,996 Aker BP 19,284,100 1�192,945,636 Norsk Hydro 13,779,985 0�85
Total Norway 33,064,085 2.04

104
Federated Hermes Investment Funds Public Limited CompanyPortfolio Statement As at 31 December 2020 (continued)
a Header 1a Federated Hermes Global Equity ESG Fund (continued)
Nominal Holdings Financial assets at fair value through profit or loss
Fair Value $
% of Net Assets
. . . . .Equities: 95.92% (2019: 95.50%) (continued)
People's Republic of China: 3.21% (2019: 3.96%)
373,634 Alibaba 11,210,153 0�691,609,000 China Mengniu Dairy 9,713,088 0�601,153,000 China Resources Gas 6,134,917 0�381,410,500 Ping An Insurance Group 17,284,313 1�074,777,927 Shenzhen International 7,716,125 0�47
Total People's Republic of China 52,058,596 3.21
Republic of South Korea: 3.85% (2019: 2.73%)
4,098 LG Household & Health Care 6,111,350 0�38535,690 Samsung Electronics 39,943,745 2�46
45,788 Samsung Fire & Marine Insurance 7,903,204 0�4977,000 SK Hynix 8,399,613 0�52
Total Republic of South Korea 62,357,912 3.85
Spain: 1.75% (2019: 2.21%)
740,440 Iberdrola 10,673,610 0�66436,868 Siemens Gamesa Renewable Energy 17,737,164 1�09
Total Spain 28,410,774 1.75
Sweden: 2.64% (2019: 2.64%)
445,198 Essity AB 14,416,257 0�89626,040 Husqvarna Group 8,162,540 0�50
1,152,943 Svenska Cellulosa 20,226,823 1�25
Total Sweden 42,805,620 2.64
Switzerland: 3.90% (2019: 4.68%)
51,024 Lonza Group 32,946,363 2�03121,252 Nestle 14,350,929 0�89
45,000 Roche 15,784,993 0�98
Total Switzerland 63,082,285 3.90
Taiwan: 2.65% (2019: 2.08%)
1,425,000 Giant Manufacturing 13,946,722 0�861,537,315 Taiwan Semiconductor Manufacturing 28,997,685 1�79
Total Taiwan 42,944,407 2.65
United Kingdom: 2.31% (2019: 2.20%)
3,438,574 M&G 9,315,538 0�58

105
Federated Hermes Investment Funds Public Limited CompanyPortfolio Statement As at 31 December 2020 (continued)
a Header 1a Federated Hermes Global Equity ESG Fund (continued)
Nominal Holdings Financial assets at fair value through profit or loss
Fair Value $
% of Net Assets
. . . . . Equities: 95.92% (2019: 95.50%) (continued) United Kingdom: 2.31% (2019: 2.20%) (continued)
818,611 Prudential 15,138,608 0�931,415,387 Tate & Lyle 12,981,161 0�80
Total United Kingdom 37,435,307 2.31
United States: 55.50% (2019: 55.57%)
277,221 Abbott Laboratories 30,061,845 1�86100,903 Accenture 25,986,559 1�60105,410 Activision Blizzard 9,653,448 0�60
16,242 Alphabet Class A 28,200,172 1�746,636 Alphabet Class C 11,543,455 0�71
15,752 Amazon�com 51,758,709 3�2078,752 American Water Works 11,862,414 0�7376,564 Amgen 17,393,044 1�0780,463 Analog Devices 11,762,081 0�73
486,467 Apple 65,050,367 4�02833,146 Bank of America 24,977,717 1�54
80,912 Baxter International 6,408,230 0�4079,255 Berkshire Hathaway 18,200,911 1�1269,432 Best Buy 7,039,016 0�44
233,623 Capital One Financial 22,867,019 1�4186,064 Chubb 13,075,703 0�81
350,284 Citigroup 21,318,284 1�3279,988 Copart 10,121,681 0�62
389,426 Delta Air Lines 15,795,119 0�98537,519 Discovery 16,023,441 0�99
48,290 FedEx 12,554,434 0�77122,079 Fortune Brands Home & Security 10,475,599 0�65216,453 Hess 11,638,678 0�72131,089 Ingersoll Rand 5,930,467 0�37
93,289 Keysight Technologies 12,243,248 0�7680,100 Kimberly-Clark 10,663,713 0�6642,881 Lam Research 20,773,700 1�2831,356 Lululemon Athletica 10,999,058 0�68
133,176 M&T Bank 16,732,233 1�03213,686 Microsoft 47,369,913 2�92
18,430 MSCI 8,053,726 0�5035,641 NVIDIA 18,741,107 1�1619,921 O'Reilly Automotive 9,000,308 0�5656,648 PayPal 13,114,579 0�81
162,434 Procter & Gamble 22,378,532 1�38184,722 Prudential Financial 14,306,719 0�88101,956 Robert Half International 6,331,468 0�39136,883 Royal Caribbean Cruises 10,095,121 0�62
59,858 salesforce�com 13,312,419 0�8269,008 Thermo Fisher Scientific 31,863,064 1�97
333,427 TJX 22,773,064 1�41

106
Federated Hermes Investment Funds Public Limited CompanyPortfolio Statement As at 31 December 2020 (continued)
a Header 1a Federated Hermes Global Equity ESG Fund (continued)
Nominal Holdings Financial assets at fair value through profit or loss
Fair Value $
% of Net Assets
. . . . . Equities: 95.92% (2019: 95.50%) (continued) United States: 55.50% (2019: 55.57%) (continued)
142,589 Trane Technologies 20,651,165 1�27151,001 Travelers 21,001,219 1�30174,983 UGI 6,026,414 0�37
24,812 Veeva Systems 6,849,601 0�42245,618 Verizon Communications 14,280,231 0�88125,228 Visa 27,344,786 1�69213,549 Walt Disney 38,688,672 2�39
93,882 Zoetis 15,421,996 0�95
Total United States 898,714,449 55.50
Total Equities 1,553,345,756 95.92
REITS: 2.58% (2019: 2.67%)
Australia: 0.95% (2019: 0.77%)
1,049,252 Goodman REITS 15,358,201 0�95
Total Australia 15,358,201 0.95
United States: 1.63% (2019: 1.90%)
66,319 American Tower REITS 14,612,729 0�90351,331 Weyerhaeuser REITS 11,822,288 0�73
Total United States 26,435,017 1.63
Total REITS 41,793,218 2.58
Financial Derivative Instruments: 0.29% (2019: 0.22%)
Forward Currency Contracts: 0.29% (2019: 0.22%)
CounterpartyCurrency Buys
Currency Sells
Currency Rate
Maturity Date
Unrealised Gain
$
% of Net Assets
Northern Trust EUR 140,216,851 USD 170,780,479 1�2180 29/01/2021 1,421,017 0�09Northern Trust CHF 144,421,350 USD 162,792,849 1�1272 29/01/2021 1,286,606 0�08Northern Trust GBP 27,962,888 USD 37,143,636 1�3283 29/01/2021 1,027,573 0�07Northern Trust EUR 10,226,846 HKD 96,572,312 0�1059 29/01/2021 101,653 0�01Northern Trust GBP 3,470,436 EUR 3,784,455 0�9170 29/01/2021 89,656 0�01Northern Trust CHF 10,151,651 HKD 88,714,901 0�1144 29/01/2021 89,055 0�01Northern Trust GBP 2,042,724 HKD 21,036,302 0�0971 29/01/2021 74,730 0�01Northern Trust GBP 2,444,869 JPY 336,412,171 0�0073 29/01/2021 72,320 0�01Northern Trust CHF 5,243,785 USD 5,910,835 1�1272 29/01/2021 46,715 -Northern Trust GBP 1,669,098 CHF 1,966,815 0�8486 29/01/2021 43,900 -Northern Trust EUR 12,233,512 JPY 1,543,529,728 0�0079 29/01/2021 43,160 -

107
Federated Hermes Investment Funds Public Limited CompanyPortfolio Statement As at 31 December 2020 (continued)
a Header 1a Federated Hermes Global Equity ESG Fund (continued)
Nominal Holdings Financial assets at fair value through profit or loss
Fair Value $
% of Net Assets
. . . . . Financial Derivative Instruments: 0.29% (2019: 0.22%) (continued) Forward Currency Contracts: 0.29% (2019: 0.22%) (continued)
CounterpartyCurrency Buys
Currency Sells
Currency Rate
Maturity Date
Unrealised Gain
$
% of Net Assets
Northern Trust CHF 12,144,927 JPY 1,418,135,711 0�0086 29/01/2021 34,158 -Northern Trust EUR 3,365,269 USD 4,098,810 1�2180 29/01/2021 34,105 -Northern Trust EUR 3,303,923 USD 4,024,092 1�2180 29/01/2021 33,483 -Northern Trust CHF 3,380,864 USD 3,810,935 1�1272 29/01/2021 30,119 -Northern Trust EUR 1,704,120 HUF 615,254,223 0�0028 29/01/2021 20,476 -Northern Trust CHF 1,691,373 HUF 565,172,501 0�0030 29/01/2021 17,919 -Northern Trust GBP 685,055 DKK 5,560,486 0�1232 29/01/2021 17,347 -Northern Trust GBP 1,336,221 USD 1,808,634 1�3535 29/01/2021 15,397 -Northern Trust GBP 340,432 HUF 134,028,866 0�0025 29/01/2021 13,261 -Northern Trust EUR 1,423,100 USD 1,737,110 1�2207 29/01/2021 10,611 -Northern Trust GBP 1,119,554 SEK 12,402,161 0�0903 29/01/2021 9,418 -Northern Trust EUR 926,147 USD 1,128,243 1�2182 29/01/2021 9,167 -Northern Trust NOK 3,300,009 USD 378,730 0�1148 29/01/2021 8,556 -Northern Trust GBP 231,181 USD 307,082 1�3283 29/01/2021 8,495 -Northern Trust GBP 284,310 USD 380,067 1�3368 29/01/2021 8,034 -Northern Trust CHF 1,549,577 USD 1,753,570 1�1316 29/01/2021 6,930 -Northern Trust CHF 675,519 USD 760,928 1�1264 29/01/2021 6,540 -Northern Trust EUR 845,755 USD 1,032,228 1�2205 29/01/2021 6,451 -Northern Trust CHF 650,313 USD 733,185 1�1274 29/01/2021 5,646 -Northern Trust EUR 705,265 USD 860,529 1�2201 29/01/2021 5,613 -Northern Trust GBP 212,972 USD 286,040 1�3431 29/01/2021 4,682 -Northern Trust GBP 763,447 USD 1,037,524 1�3590 29/01/2021 4,632 -Northern Trust CHF 512,749 USD 577,975 1�1272 29/01/2021 4,568 -Northern Trust EUR 8,354,347 CHF 9,026,789 0�9255 29/01/2021 4,562 -Northern Trust EUR 448,882 USD 546,726 1�2180 29/01/2021 4,549 -Northern Trust CHF 407,355 USD 458,472 1�1255 29/01/2021 4,330 -Northern Trust USD 2,501,440 HUF 741,473,590 0�0034 29/01/2021 3,925 -Northern Trust NOK 1,910,457 EUR 179,831 10�6237 29/01/2021 3,358 -Northern Trust CHF 368,468 HKD 3,220,028 0�1144 29/01/2021 3,232 -Northern Trust GBP 135,827 USD 182,214 1�3415 29/01/2021 3,200 -Northern Trust CHF 348,028 USD 392,299 1�1272 29/01/2021 3,101 -Northern Trust NOK 1,732,824 CHF 176,508 9�8173 29/01/2021 2,830 -Northern Trust EUR 1,067,046 USD 1,308,155 1�2260 29/01/2021 2,293 -Northern Trust CHF 221,848 USD 249,837 1�1262 29/01/2021 2,208 -Northern Trust GBP 53,799 USD 71,467 1�3284 29/01/2021 1,972 -Northern Trust CHF 440,896 JPY 51,482,477 0�0086 29/01/2021 1,240 -Northern Trust CHF 134,929 USD 152,094 1�1272 29/01/2021 1,202 -Northern Trust GBP 324,167 USD 441,323 1�3614 29/01/2021 1,187 -Northern Trust CHF 129,425 USD 145,889 1�1272 29/01/2021 1,153 -Northern Trust CHF 403,420 EUR 372,338 1�0835 29/01/2021 1,061 -Northern Trust CHF 214,980 USD 243,200 1�1313 29/01/2021 1,042 -Northern Trust GBP 27,335 EUR 29,808 0�9170 29/01/2021 706 -Northern Trust EUR 95,852 HKD 907,146 0�1057 29/01/2021 693 -Northern Trust CHF 61,391 HUF 20,513,813 0�0030 29/01/2021 650 -

108
Federated Hermes Investment Funds Public Limited CompanyPortfolio Statement As at 31 December 2020 (continued)
a Header 1a Federated Hermes Global Equity ESG Fund (continued)
Nominal Holdings Financial assets at fair value through profit or loss
Fair Value $
% of Net Assets
. . . . . Financial Derivative Instruments: 0.29% (2019: 0.22%) (continued) Forward Currency Contracts: 0.29% (2019: 0.22%) (continued)
CounterpartyCurrency Buys
Currency Sells
Currency Rate
Maturity Date
Unrealised Gain
$
% of Net Assets
Northern Trust EUR 63,547 HKD 600,149 0�1059 29/01/2021 622 -Northern Trust GBP 16,421 HKD 169,103 0�0971 29/01/2021 601 -Northern Trust GBP 19,515 JPY 2,685,217 0�0073 29/01/2021 577 -Northern Trust CHF 56,427 USD 63,605 1�1272 29/01/2021 503 -Northern Trust CHF 107,681 HKD 944,697 0�1140 29/01/2021 471 -Northern Trust EUR 116,768 JPY 14,728,303 0�0079 29/01/2021 456 -Northern Trust CHF 182,328 EUR 168,308 1�0833 29/01/2021 445 -Northern Trust CHF 44,621 HKD 390,009 0�1144 29/01/2021 382 -Northern Trust EUR 48,190 HKD 455,849 0�1057 29/01/2021 377 -Northern Trust GBP 13,421 CHF 15,815 0�8486 29/01/2021 353 -Northern Trust EUR 34,975 USD 42,607 1�2182 29/01/2021 346 -Northern Trust AUD 40,386 GBP 22,656 1�7826 29/01/2021 341 -Northern Trust GBP 15,982 EUR 17,490 0�9137 29/01/2021 336 -Northern Trust GBP 24,413 EUR 26,862 0�9088 29/01/2021 336 -Northern Trust GBP 17,475 JPY 2,425,469 0�0072 29/01/2021 313 -Northern Trust GBP 14,345 HKD 149,376 0�0960 29/01/2021 312 -Northern Trust GBP 52,166 HKD 549,612 0�0949 29/01/2021 309 -Northern Trust CHF 27,437 HKD 239,412 0�1146 29/01/2021 287 -Northern Trust EUR 78,522 JPY 9,908,126 0�0079 29/01/2021 269 -Northern Trust EUR 2,297,187 USD 2,820,936 1�2280 29/01/2021 258 -Northern Trust CHF 33,424 JPY 3,886,698 0�0086 29/01/2021 251 -Northern Trust CHF 132,466 JPY 15,481,248 0�0086 29/01/2021 241 -Northern Trust GBP 11,611 JPY 1,608,677 0�0072 29/01/2021 237 -Northern Trust GBP 9,439 HKD 98,166 0�0962 29/01/2021 221 -Northern Trust EUR 20,036 USD 24,408 1�2182 29/01/2021 198 -Northern Trust CHF 17,610 HUF 5,881,182 0�0030 29/01/2021 198 -Northern Trust CHF 46,695 EUR 43,053 1�0846 29/01/2021 177 -Northern Trust EUR 21,006 USD 25,630 1�2201 29/01/2021 167 -Northern Trust GBP 6,429 EUR 7,010 0�9171 29/01/2021 167 -Northern Trust CHF 15,159 HKD 132,345 0�1145 29/01/2021 149 -Northern Trust CHF 55,136 JPY 6,438,772 0�0086 29/01/2021 149 -Northern Trust EUR 74,150 HKD 704,762 0�1052 29/01/2021 149 -Northern Trust AUD 9,967 USD 7,573 0�7598 04/01/2021 142 -Northern Trust GBP 5,530 DKK 44,882 0�1232 29/01/2021 140 -Northern Trust GBP 4,561 JPY 627,619 0�0073 29/01/2021 135 -Northern Trust GBP 3,691 HKD 38,016 0�0971 29/01/2021 135 -Northern Trust GBP 37,972 EUR 42,097 0�9020 29/01/2021 134 -Northern Trust EUR 11,157 HUF 4,028,432 0�0028 29/01/2021 133 -Northern Trust CHF 25,182 EUR 23,197 1�0856 29/01/2021 121 -Northern Trust EUR 12,127 HUF 4,386,935 0�0028 29/01/2021 116 -Northern Trust GBP 2,737 HUF 1,077,418 0�0025 29/01/2021 107 -Northern Trust GBP 11,437 CHF 13,648 0�8380 29/01/2021 106 -Northern Trust NOK 61,082 CHF 6,222 9�8173 29/01/2021 100 -Northern Trust CHF 37,901 DKK 260,364 0�1456 29/01/2021 84 -

109
Federated Hermes Investment Funds Public Limited CompanyPortfolio Statement As at 31 December 2020 (continued)
a Header 1a Federated Hermes Global Equity ESG Fund (continued)
Nominal Holdings Financial assets at fair value through profit or loss
Fair Value $
% of Net Assets
. . . . . Financial Derivative Instruments: 0.29% (2019: 0.22%) (continued) Forward Currency Contracts: 0.29% (2019: 0.22%) (continued)
CounterpartyCurrency Buys
Currency Sells
Currency Rate
Maturity Date
Unrealised Gain
$
% of Net Assets
Northern Trust GBP 3,122 CHF 3,678 0�8487 29/01/2021 82 -Northern Trust CHF 7,834 HUF 2,618,002 0�0030 29/01/2021 82 -Northern Trust GBP 21,873 HKD 230,852 0�0947 29/01/2021 78 -Northern Trust GBP 8,937 SEK 99,001 0�0903 29/01/2021 75 -Northern Trust GBP 26,924 JPY 3,779,027 0�0071 29/01/2021 75 -Northern Trust CHF 17,855 JPY 2,082,478 0�0086 29/01/2021 74 -Northern Trust GBP 5,156 DKK 42,203 0�1222 29/01/2021 72 -Northern Trust EUR 16,421 HUF 5,966,472 0�0028 29/01/2021 70 -Northern Trust CHF 14,506 HKD 127,213 0�1140 29/01/2021 69 -Northern Trust GBP 3,322 DKK 27,060 0�1228 29/01/2021 69 -Northern Trust CHF 26,061 EUR 24,055 1�0834 29/01/2021 66 -Northern Trust EUR 24,381 GBP 21,887 1�1139 29/01/2021 65 -Northern Trust NOK 672,491 GBP 57,770 11�6409 29/01/2021 64 -Northern Trust EUR 8,108 HUF 2,937,365 0�0028 29/01/2021 63 -Northern Trust CHF 18,467 JPY 2,155,269 0�0086 29/01/2021 62 -Northern Trust GBP 8,777 HUF 3,540,400 0�0025 29/01/2021 56 -Northern Trust GBP 1,544 HUF 610,977 0�0025 29/01/2021 49 -Northern Trust EUR 58,706 JPY 7,423,521 0�0079 29/01/2021 48 -Northern Trust DKK 153,922 GBP 18,570 8�2886 04/01/2021 47 -Northern Trust GBP 2,457 HUF 982,229 0�0025 29/01/2021 46 -Northern Trust GBP 5,368 SEK 59,462 0�0903 29/01/2021 46 -Northern Trust CHF 9,862 DKK 67,635 0�1458 29/01/2021 41 -Northern Trust CHF 4,700 HUF 1,575,022 0�0030 29/01/2021 35 -Northern Trust GBP 1,312 DKK 10,648 0�1232 29/01/2021 33 -Northern Trust HUF 31,230,437 USD 105,161 0�0034 29/01/2021 33 -Northern Trust EUR 53,738 CHF 58,061 0�9255 29/01/2021 31 -Northern Trust GBP 7,817 DKK 64,480 0�1212 29/01/2021 28 -Northern Trust GBP 648 HUF 255,158 0�0025 29/01/2021 25 -Northern Trust CHF 5,184 DKK 35,532 0�1459 29/01/2021 25 -Northern Trust NOK 64,439 CHF 6,641 9�7027 04/01/2021 24 -Northern Trust GBP 2,126 SEK 23,551 0�0903 29/01/2021 18 -Northern Trust CHF 5,396 DKK 37,054 0�1456 29/01/2021 15 -Northern Trust CHF 7,665 GBP 6,369 1�2035 29/01/2021 14 -Northern Trust GBP 8,342 SEK 92,871 0�0898 29/01/2021 13 -Northern Trust EUR 34,453 DKK 256,274 0�1344 29/01/2021 12 -Northern Trust CHF 8,528 SEK 79,022 0�1079 29/01/2021 12 -Northern Trust NOK 4,348 USD 499 0�1148 29/01/2021 11 -Northern Trust EUR 1,095 USD 1,334 1�2180 29/01/2021 11 -Northern Trust GBP 375 USD 501 1�3368 29/01/2021 11 -Northern Trust CHF 1,148 USD 1,295 1�1272 29/01/2021 10 -Northern Trust CHF 976 USD 1,100 1�1264 29/01/2021 9 -Northern Trust EUR 1,123 USD 1,371 1�2205 29/01/2021 9 -Northern Trust CHF 2,450 HUF 824,046 0�0030 29/01/2021 7 -Northern Trust EUR 715 USD 871 1�2180 29/01/2021 7 -

110
Federated Hermes Investment Funds Public Limited CompanyPortfolio Statement As at 31 December 2020 (continued)
a Header 1a Federated Hermes Global Equity ESG Fund (continued)
Nominal Holdings Financial assets at fair value through profit or loss
Fair Value $
% of Net Assets
. . . . .Financial Derivative Instruments: 0.29% (2019: 0.22%) (continued)
Forward Currency Contracts: 0.29% (2019: 0.22%) (continued)
CounterpartyCurrency Buys
Currency Sells
Currency Rate
Maturity Date
Unrealised Gain
$
% of Net Assets
Northern Trust EUR 715 USD 871 1�2180 29/01/2021 7 -Northern Trust GBP 3,694 HUF 1,494,919 0�0025 29/01/2021 7 -Northern Trust CHF 706 USD 796 1�1272 29/01/2021 6 -Northern Trust CHF 706 USD 796 1�1272 29/01/2021 6 -Northern Trust USD 3,289 HUF 974,861 0�0034 29/01/2021 5 -Northern Trust USD 744 HUF 219,504 0�0034 29/01/2021 5 -Northern Trust EUR 55,396 DKK 412,149 0�1344 29/01/2021 4 -Northern Trust USD 2,105 HUF 624,023 0�0034 29/01/2021 3 -Northern Trust EUR 17,155 DKK 127,629 0�1344 29/01/2021 2 -Northern Trust EUR 19,875 USD 24,407 1�2280 29/01/2021 2 -Northern Trust EUR 52 HKD 487 0�1059 29/01/2021 1 -Northern Trust EUR 52 HKD 487 0�1059 29/01/2021 1 -Northern Trust NOK 5,362 GBP 461 11�6409 29/01/2021 1 -Northern Trust CHF 52 HKD 451 0�1144 29/01/2021 - -Northern Trust CHF 52 HKD 451 0�1144 29/01/2021 - -Northern Trust EUR 155,000 HKD 1,475,610 0�1050 29/01/2021 - -Northern Trust EUR 62 JPY 7,786 0�0079 29/01/2021 - -Northern Trust EUR 62 JPY 7,786 0�0079 29/01/2021 - -Northern Trust USD 4,540 HUF 1,347,952 0�0034 29/01/2021 - -Northern Trust CHF 62 JPY 7,201 0�0086 29/01/2021 - -Northern Trust CHF 62 JPY 7,201 0�0086 29/01/2021 - -Northern Trust EUR 17 USD 21 1�2181 29/01/2021 - -Northern Trust EUR 17 USD 21 1�2181 29/01/2021 - -Northern Trust CHF 17 USD 20 1�1274 29/01/2021 - -Northern Trust CHF 17 USD 20 1�1274 29/01/2021 - -Northern Trust EUR 9 HUF 3,103 0�0028 29/01/2021 - -Northern Trust EUR 9 HUF 3,103 0�0028 29/01/2021 - -Northern Trust CHF 9 HUF 2,870 0�0030 29/01/2021 - -Northern Trust CHF 9 HUF 2,870 0�0030 29/01/2021 - -Northern Trust CHF 36 USD 41 1�1338 29/01/2021 - -Northern Trust CHF 36 USD 41 1�1338 29/01/2021 - -Northern Trust HUF 41,153 USD 139 0�0034 29/01/2021 - -Northern Trust GBP 1 USD 1 1�3333 29/01/2021 - -Northern Trust NOK 12 USD 1 0�1144 29/01/2021 - -Northern Trust GBP 1 USD 1 1�3400 29/01/2021 - -Northern Trust NOK 12 USD 1 0�1146 29/01/2021 - -Northern Trust EUR 42 CHF 46 0�9255 29/01/2021 - -Northern Trust NOK 9 CHF 1 9�8523 29/01/2021 - -Northern Trust EUR 42 CHF 46 0�9255 29/01/2021 - -Northern Trust NOK 9 CHF 1 9�8523 29/01/2021 - -Northern Trust NOK 9 EUR 1 10�6477 29/01/2021 - -Northern Trust AUD 1 EUR 1 1�6212 29/01/2021 - -Northern Trust NOK 9 EUR 1 10�6477 29/01/2021 - -Northern Trust GBP 1 EUR 1 0�9167 29/01/2021 - -

111
Federated Hermes Investment Funds Public Limited CompanyPortfolio Statement As at 31 December 2020 (continued)
a Header 1a Federated Hermes Global Equity ESG Fund (continued)
Nominal Holdings Financial assets at fair value through profit or loss
Fair Value $
% of Net Assets
. . . . . Financial Derivative Instruments: 0.29% (2019: 0.22%) (continued) Forward Currency Contracts: 0.29% (2019: 0.22%) (continued)
CounterpartyCurrency Buys
Currency Sells
Currency Rate
Maturity Date
Unrealised Gain
$
% of Net Assets
Northern Trust CHF 2 USD 3 1�1261 29/01/2021 - -Northern Trust EUR 3 USD 4 1�2207 29/01/2021 - -Northern Trust EUR 3 USD 4 1�2200 29/01/2021 - -Northern Trust CHF 2 USD 3 1�1261 29/01/2021 - -Northern Trust CHF 2 EUR 2 1�0829 29/01/2021 - -Northern Trust CHF 2 EUR 2 1�0829 29/01/2021 - -Northern Trust SEK 11 EUR 1 10�1132 29/01/2021 - -Northern Trust USD 9 HUF 2,606 0�0034 29/01/2021 - -Northern Trust USD 9 HUF 2,608 0�0034 29/01/2021 - -Northern Trust CHF 1 AUD 1 0�6800 29/01/2021 - -Northern Trust CHF 1 AUD 1 0�6800 29/01/2021 - -Northern Trust ZAR - CHF - 10�0000 29/01/2021 - -Northern Trust EUR 18 DKK 131 0�1344 29/01/2021 - -Northern Trust EUR 18 DKK 131 0�1344 29/01/2021 - -Northern Trust HUF 106 EUR - 366�2414 29/01/2021 - -Northern Trust DKK 6 EUR 1 7�4598 29/01/2021 - -Northern Trust CHF 3 EUR 3 1�0794 29/01/2021 - -Northern Trust NOK 1 EUR - 10�7692 29/01/2021 - -Northern Trust USD - EUR - 1�2222 29/01/2021 - -Northern Trust CHF 2 GBP 1 1�1969 29/01/2021 - -Northern Trust EUR 2 GBP 1 1�1087 29/01/2021 - -Northern Trust CHF 2 GBP 1 1�1969 29/01/2021 - -Northern Trust EUR 2 GBP 1 1�1087 29/01/2021 - -Northern Trust CHF 1 NOK 12 0�1029 29/01/2021 - -Northern Trust CHF 1 NOK 12 0�1029 29/01/2021 - -Northern Trust USD - SGD - 1�0000 29/01/2021 - -Northern Trust HUF 110 USD - 0�0034 29/01/2021 - -Northern Trust HKD 17 USD 2 0�1289 29/01/2021 - -Northern Trust HKD 17 USD 2 0�1289 29/01/2021 - -Northern Trust HUF 110 USD - 0�0034 29/01/2021 - -
Unrealised Gains on Forward Currency Contracts 4,673,980 0.29
Total Financial Derivative Instruments 4,673,980 0.29
Total financial assets at fair value through profit or loss 1,599,812,954 98.79

112
Federated Hermes Investment Funds Public Limited CompanyPortfolio Statement As at 31 December 2020 (continued)
a Header 1a Federated Hermes Global Equity ESG Fund (continued)
Nominal Holdings Financial liabilities at fair value through profit or loss
Fair Value $
% of Net Assets
. . . . .
Financial Derivative Instruments: (0.13%) (2019: (0.07%))
Forward Currency Contracts: (0.13%) (2019: (0.07%))
CounterpartyCurrency Buys
Currency Sells
Currency Rate
Maturity Date
Unrealised Loss
$
% of Net Assets
Northern Trust CHF 18 DKK 123 0�1452 29/01/2021 - -Northern Trust CHF 18 DKK 123 0�1452 29/01/2021 - -Northern Trust JPY 374 EUR 3 126�3514 29/01/2021 - -Northern Trust USD 1 GBP 1 1�3556 29/01/2021 - -Northern Trust USD 1 GBP 1 1�3529 29/01/2021 - -Northern Trust USD 1 GBP 1 1�3529 29/01/2021 - -Northern Trust USD 1 GBP 1 1�3556 29/01/2021 - -Northern Trust USD 53 HKD 409 0�1290 29/01/2021 - -Northern Trust USD 53 HKD 409 0�1290 29/01/2021 - -Northern Trust USD 1 NOK 11 0�1165 29/01/2021 - -Northern Trust USD 1 NOK 11 0�1168 29/01/2021 - -Northern Trust EUR 1 NOK 13 0�0949 29/01/2021 - -Northern Trust EUR 1 NOK 13 0�0949 29/01/2021 - -Northern Trust EUR 1 SEK 13 0�0993 29/01/2021 - -Northern Trust EUR 1 SEK 13 0�0993 29/01/2021 - -Northern Trust HKD 27 EUR 3 9�4472 29/01/2021 - -Northern Trust CHF 88 EUR 81 1�0805 29/01/2021 - -Northern Trust CHF 88 EUR 81 1�0805 29/01/2021 - -Northern Trust USD 11,991 HKD 92,954 0�1290 29/01/2021 - -Northern Trust HKD 6,410 USD 827 0�1290 29/01/2021 - -Northern Trust USD 13 EUR 11 1�2185 29/01/2021 - -Northern Trust USD 18 DKK 112 0�1637 29/01/2021 - -Northern Trust SEK 1,090 CHF 118 9�2659 29/01/2021 - -Northern Trust USD 18 DKK 112 0�1636 29/01/2021 - -Northern Trust GBP 88 CHF 106 0�8309 29/01/2021 - -Northern Trust CHF 1,091 GBP 908 1�2012 29/01/2021 - -Northern Trust CHF 14 AUD 21 0�6668 29/01/2021 - -Northern Trust CHF 14 AUD 21 0�6668 29/01/2021 - -Northern Trust USD 43 CHF 38 1�1272 29/01/2021 - -Northern Trust USD 43 CHF 38 1�1273 29/01/2021 - -Northern Trust USD 63 JPY 6,546 0�0097 29/01/2021 - -Northern Trust USD 63 JPY 6,540 0�0097 29/01/2021 - -Northern Trust EUR 14 AUD 23 0�6169 29/01/2021 - -Northern Trust EUR 14 AUD 23 0�6169 29/01/2021 - -Northern Trust USD 7,529 DKK 45,616 0�1650 29/01/2021 - -Northern Trust USD 14 AUD 19 0�7513 29/01/2021 - -Northern Trust USD 14 AUD 19 0�7516 29/01/2021 - -Northern Trust CHF 29 SEK 269 0�1064 29/01/2021 - -Northern Trust CHF 29 SEK 269 0�1064 29/01/2021 - -Northern Trust EUR 28 SEK 288 0�0984 29/01/2021 - -Northern Trust EUR 28 SEK 288 0�0984 29/01/2021 - -Northern Trust USD 4,549 HKD 35,265 0�1290 29/01/2021 (1) -Northern Trust USD 10,057 HKD 77,968 0�1290 29/01/2021 (1) -Northern Trust CHF 25 GBP 21 1�1782 29/01/2021 (1) -

113
Federated Hermes Investment Funds Public Limited CompanyPortfolio Statement As at 31 December 2020 (continued)
a Header 1a Federated Hermes Global Equity ESG Fund (continued)
Nominal Holdings Financial liabilities at fair value through profit or loss
Fair Value $
% of Net Assets
. . . . . Financial Derivative Instruments: (0.13%) (2019: (0.07%)) (continued) Forward Currency Contracts: (0.13%) (2019: (0.07%)) (continued)
CounterpartyCurrency Buys
Currency Sells
Currency Rate
Maturity Date
Unrealised Loss
$
% of Net Assets
Northern Trust CHF 25 GBP 21 1�1782 29/01/2021 (1) -Northern Trust EUR 25 GBP 23 1�0905 29/01/2021 (1) -Northern Trust EUR 25 GBP 23 1�0905 29/01/2021 (1) -Northern Trust CHF 22 NOK 220 0�1009 29/01/2021 (1) -Northern Trust CHF 22 NOK 220 0�1009 29/01/2021 (1) -Northern Trust GBP 374 NOK 4,358 0�0859 29/01/2021 (1) -Northern Trust EUR 22 NOK 238 0�0934 29/01/2021 (1) -Northern Trust EUR 22 NOK 238 0�0934 29/01/2021 (1) -Northern Trust USD 29 SEK 243 0�1199 29/01/2021 (1) -Northern Trust USD 29 SEK 243 0�1199 29/01/2021 (1) -Northern Trust USD 26 GBP 19 1�3285 29/01/2021 (1) -Northern Trust USD 26 GBP 19 1�3283 29/01/2021 (1) -Northern Trust USD 23 NOK 200 0�1138 29/01/2021 (1) -Northern Trust USD 23 NOK 200 0�1138 29/01/2021 (1) -Northern Trust USD 90 EUR 74 1�2180 29/01/2021 (1) -Northern Trust USD 90 EUR 74 1�2180 29/01/2021 (1) -Northern Trust HKD 1,755 CHF 200 8�7700 29/01/2021 (1) -Northern Trust JPY 28,729 CHF 246 116�6328 29/01/2021 (1) -Northern Trust EUR 320 CHF 347 0�9212 29/01/2021 (2) -Northern Trust USD 21,066 HKD 163,315 0�1290 29/01/2021 (2) -Northern Trust USD 458 GBP 336 1�3598 29/01/2021 (2) -Northern Trust USD 461 NOK 3,948 0�1168 29/01/2021 (2) -Northern Trust USD 26,987 HKD 209,220 0�1290 29/01/2021 (3) -Northern Trust USD 19,734 HKD 152,996 0�1290 29/01/2021 (3) -Northern Trust USD 1,601 DKK 9,720 0�1647 29/01/2021 (3) -Northern Trust USD 36,571 EUR 29,781 1�2280 29/01/2021 (3) -Northern Trust USD 436 GBP 322 1�3543 29/01/2021 (3) -Northern Trust GBP 1,020 AUD 1,802 0�5658 29/01/2021 (4) -Northern Trust HUF 52,776 GBP 133 396�7550 29/01/2021 (4) -Northern Trust HUF 1,346,806 USD 4,540 0�0034 04/01/2021 (4) -Northern Trust USD 3,557 HUF 1,057,663 0�0034 29/01/2021 (5) -Northern Trust USD 3,125 EUR 2,549 1�2260 29/01/2021 (6) -Northern Trust GBP 3,963 NOK 46,155 0�0859 29/01/2021 (7) -Northern Trust GBP 12,860 SEK 143,401 0�0897 29/01/2021 (7) -Northern Trust EUR 26,098 DKK 194,233 0�1344 29/01/2021 (8) -Northern Trust GBP 1,644 NOK 19,193 0�0857 29/01/2021 (8) -Northern Trust EUR 22,584 DKK 168,087 0�1344 29/01/2021 (8) -Northern Trust CHF 15,858 DKK 109,229 0�1452 29/01/2021 (13) -Northern Trust USD 5,596 JPY 577,918 0�0097 29/01/2021 (13) -Northern Trust USD 7,702 EUR 6,283 1�2260 29/01/2021 (14) -Northern Trust USD 3,355 CHF 2,966 1�1313 29/01/2021 (14) -Northern Trust USD 3,799 CHF 3,357 1�1316 29/01/2021 (15) -Northern Trust CHF 6,547 NOK 63,508 0�1031 29/01/2021 (15) -Northern Trust GBP 4,376 AUD 7,734 0�5657 29/01/2021 (15) -

114
Federated Hermes Investment Funds Public Limited CompanyPortfolio Statement As at 31 December 2020 (continued)
a Header 1a Federated Hermes Global Equity ESG Fund (continued)
Nominal Holdings Financial liabilities at fair value through profit or loss
Fair Value $
% of Net Assets
. . . . .Financial Derivative Instruments: (0.13%) (2019: (0.07%)) (continued)
Forward Currency Contracts: (0.13%) (2019: (0.07%)) (continued)
CounterpartyCurrency Buys
Currency Sells
Currency Rate
Maturity Date
Unrealised Loss
$
% of Net Assets
Northern Trust USD 25,931 JPY 2,673,475 0�0097 29/01/2021 (17) -Northern Trust HKD 8,201 GBP 791 10�3628 29/01/2021 (22) -Northern Trust CHF 11,022 GBP 9,190 1�1993 29/01/2021 (23) -Northern Trust USD 3,615 DKK 22,045 0�1640 29/01/2021 (24) -Northern Trust GBP 2,567 AUD 4,556 0�5633 29/01/2021 (24) -Northern Trust CHF 6,641 NOK 64,500 0�1030 29/01/2021 (24) -Northern Trust CHF 8,653 NOK 83,987 0�1030 29/01/2021 (25) -Northern Trust CHF 4,149 AUD 6,122 0�6777 29/01/2021 (27) -Northern Trust USD 2,587 SEK 21,362 0�1211 29/01/2021 (29) -Northern Trust USD 11,132 GBP 8,177 1�3614 29/01/2021 (30) -Northern Trust USD 1,237 AUD 1,637 0�7558 29/01/2021 (30) -Northern Trust GBP 3,960 AUD 7,024 0�5637 29/01/2021 (33) -Northern Trust CHF 4,863 AUD 7,179 0�6773 29/01/2021 (34) -Northern Trust GBP 7,088 NOK 82,745 0�0857 29/01/2021 (35) -Northern Trust GBP 6,267 NOK 73,195 0�0856 29/01/2021 (35) -Northern Trust USD 1,910 NOK 16,582 0�1152 29/01/2021 (36) -Northern Trust USD 4,262 DKK 26,040 0�1637 29/01/2021 (37) -Northern Trust CHF 8,827 SEK 82,192 0�1074 29/01/2021 (37) -Northern Trust USD 2,147 GBP 1,601 1�3415 29/01/2021 (38) -Northern Trust USD 12,386 SEK 101,450 0�1221 29/01/2021 (39) -Northern Trust GBP 17,441 CHF 20,990 0�8309 29/01/2021 (39) -Northern Trust CHF 136,793 GBP 113,880 1�2012 29/01/2021 (40) -Northern Trust CHF 77,717 EUR 71,930 1�0805 29/01/2021 (42) -Northern Trust USD 12,252 JPY 1,266,949 0�0097 29/01/2021 (44) -Northern Trust EUR 26,175 HUF 9,557,050 0�0027 29/01/2021 (46) -Northern Trust CHF 4,254 AUD 6,303 0�6749 29/01/2021 (47) -Northern Trust GBP 9,872 NOK 115,246 0�0857 29/01/2021 (49) -Northern Trust GBP 18,570 DKK 153,883 0�1207 29/01/2021 (50) -Northern Trust HKD 4,854,578 USD 626,309 0�1290 29/01/2021 (59) -Northern Trust USD 6,856 DKK 41,899 0�1636 29/01/2021 (59) -Northern Trust USD 6,025 AUD 7,859 0�7666 29/01/2021 (60) -Northern Trust USD 9,508 NOK 81,532 0�1166 29/01/2021 (60) -Northern Trust USD 13,654 GBP 10,047 1�3590 29/01/2021 (61) -Northern Trust GBP 6,256 AUD 11,109 0�5631 29/01/2021 (62) -Northern Trust USD 9,607 DKK 58,580 0�1640 29/01/2021 (62) -Northern Trust USD 2,776 AUD 3,667 0�7571 29/01/2021 (63) -Northern Trust EUR 91,217 JPY 11,549,090 0�0079 29/01/2021 (67) -Northern Trust USD 16,798 CHF 14,849 1�1313 29/01/2021 (72) -Northern Trust USD 8,019 CHF 7,125 1�1255 29/01/2021 (76) -Northern Trust GBP 47,787 NOK 556,490 0�0859 29/01/2021 (77) -Northern Trust USD 14,817 JPY 1,534,649 0�0097 29/01/2021 (78) -Northern Trust USD 10,140 CHF 8,994 1�1274 29/01/2021 (78) -Northern Trust USD 5,040 GBP 3,753 1�3431 29/01/2021 (83) -Northern Trust USD 4,394 NOK 38,211 0�1150 29/01/2021 (90) -

115
Federated Hermes Investment Funds Public Limited CompanyPortfolio Statement As at 31 December 2020 (continued)
a Header 1a Federated Hermes Global Equity ESG Fund (continued)
Nominal Holdings Financial liabilities at fair value through profit or loss
Fair Value $
% of Net Assets
. . . . . Financial Derivative Instruments: (0.13%) (2019: (0.07%)) (continued) Forward Currency Contracts: (0.13%) (2019: (0.07%)) (continued)
CounterpartyCurrency Buys
Currency Sells
Currency Rate
Maturity Date
Unrealised Loss
$
% of Net Assets
Northern Trust USD 5,849 SEK 48,512 0�1206 29/01/2021 (93) -Northern Trust CHF 128,026 DKK 881,829 0�1452 29/01/2021 (100) -Northern Trust CHF 15,955 SEK 148,831 0�1072 29/01/2021 (100) -Northern Trust USD 3,313 AUD 4,408 0�7515 29/01/2021 (100) -Northern Trust USD 17,117 EUR 14,023 1�2207 29/01/2021 (105) -Northern Trust EUR 38,404 CHF 41,607 0�9230 29/01/2021 (106) -Northern Trust CHF 13,750 GBP 11,522 1�1934 29/01/2021 (107) -Northern Trust CHF 7,574 AUD 11,258 0�6728 29/01/2021 (112) -Northern Trust GBP 63,549 JPY 8,950,515 0�0071 29/01/2021 (121) -Northern Trust USD 16,224 CHF 14,393 1�1272 29/01/2021 (128) -Northern Trust USD 23,619 JPY 2,446,831 0�0097 29/01/2021 (129) -Northern Trust EUR 190,792 JPY 24,155,525 0�0079 29/01/2021 (131) -Northern Trust USD 4,953 GBP 3,729 1�3283 29/01/2021 (137) -Northern Trust USD 7,573 AUD 9,965 0�7600 29/01/2021 (142) -Northern Trust EUR 21,113 NOK 222,159 0�0950 29/01/2021 (143) -Northern Trust USD 11,824 NOK 101,969 0�1160 29/01/2021 (143) -Northern Trust USD 6,906 SEK 57,582 0�1199 29/01/2021 (146) -Northern Trust CHF 11,987 NOK 117,317 0�1022 29/01/2021 (150) -Northern Trust USD 5,210 AUD 6,933 0�7514 29/01/2021 (158) -Northern Trust EUR 61,925 CHF 67,083 0�9231 29/01/2021 (164) -Northern Trust USD 5,965 GBP 4,490 1�3284 29/01/2021 (165) -Northern Trust USD 5,340 NOK 46,938 0�1138 29/01/2021 (168) -Northern Trust USD 20,885 EUR 17,144 1�2182 29/01/2021 (170) -Northern Trust USD 21,507 CHF 19,097 1�1262 29/01/2021 (190) -Northern Trust USD 32,876 JPY 3,407,295 0�0096 29/01/2021 (194) -Northern Trust USD 15,716 SEK 129,943 0�1209 29/01/2021 (198) -Northern Trust EUR 13,524 AUD 21,711 0�6229 29/01/2021 (201) -Northern Trust EUR 28,063 SEK 283,091 0�0991 29/01/2021 (205) -Northern Trust USD 10,973 SEK 91,519 0�1199 29/01/2021 (235) -Northern Trust GBP 22,855 NOK 267,857 0�0853 29/01/2021 (237) -Northern Trust EUR 81,908 GBP 73,881 1�1086 29/01/2021 (261) -Northern Trust USD 9,546 GBP 7,187 1�3283 29/01/2021 (264) -Northern Trust GBP 89,686 EUR 99,904 0�8977 29/01/2021 (266) -Northern Trust USD 8,518 NOK 74,864 0�1138 29/01/2021 (267) -Northern Trust USD 33,524 EUR 27,524 1�2180 29/01/2021 (279) -Northern Trust GBP 14,639 AUD 26,177 0�5592 29/01/2021 (284) -Northern Trust GBP 41,572 CHF 50,201 0�8281 29/01/2021 (285) -Northern Trust USD 46,397 EUR 38,026 1�2201 29/01/2021 (303) -Northern Trust CHF 12,327 AUD 18,491 0�6666 29/01/2021 (312) -Northern Trust EUR 76,420 CHF 82,885 0�9220 29/01/2021 (314) -Northern Trust CHF 625,953 EUR 579,323 1�0805 29/01/2021 (316) -Northern Trust GBP 30,378 SEK 341,330 0�0890 29/01/2021 (333) -Northern Trust EUR 91,130 SEK 916,608 0�0994 29/01/2021 (336) -Northern Trust CHF 25,697 SEK 241,585 0�1064 29/01/2021 (391) -

116
Federated Hermes Investment Funds Public Limited CompanyPortfolio Statement As at 31 December 2020 (continued)
a Header 1a Federated Hermes Global Equity ESG Fund (continued)
Nominal Holdings Financial liabilities at fair value through profit or loss
Fair Value $
% of Net Assets
. . . . .Financial Derivative Instruments: (0.13%) (2019: (0.07%)) (continued)
Forward Currency Contracts: (0.13%) (2019: (0.07%)) (continued)
CounterpartyCurrency Buys
Currency Sells
Currency Rate
Maturity Date
Unrealised Loss
$
% of Net Assets
Northern Trust EUR 17,555 AUD 28,454 0�6170 29/01/2021 (471) -Northern Trust HUF 6,636,914 GBP 16,728 396�7519 29/01/2021 (480) -Northern Trust EUR 42,173 SEK 426,885 0�0988 29/01/2021 (486) -Northern Trust CHF 22,196 GBP 18,837 1�1783 29/01/2021 (497) -Northern Trust CHF 61,244 SEK 572,240 0�1070 29/01/2021 (499) -Northern Trust EUR 26,459 AUD 42,643 0�6205 29/01/2021 (521) -Northern Trust CHF 19,872 NOK 196,889 0�1009 29/01/2021 (530) -Northern Trust EUR 44,330 AUD 71,009 0�6243 29/01/2021 (536) -Northern Trust EUR 69,958 NOK 736,654 0�0950 29/01/2021 (537) -Northern Trust EUR 20,163 AUD 32,705 0�6165 29/01/2021 (560) -Northern Trust EUR 36,597 SEK 371,757 0�0984 29/01/2021 (583) -Northern Trust EUR 182,297 GBP 164,435 1�1086 29/01/2021 (585) -Northern Trust EUR 48,036 GBP 43,656 1�1003 29/01/2021 (601) -Northern Trust EUR 55,739 SEK 563,936 0�0988 29/01/2021 (609) -Northern Trust CHF 306,548 GBP 255,599 1�1993 29/01/2021 (635) -Northern Trust EUR 123,596 CHF 134,171 0�9212 29/01/2021 (644) -Northern Trust EUR 31,132 NOK 331,358 0�0940 29/01/2021 (654) -Northern Trust EUR 35,003 GBP 31,984 1�0944 29/01/2021 (673) -Northern Trust CHF 29,281 AUD 43,841 0�6679 29/01/2021 (677) -Northern Trust CHF 245,428 NOK 2,382,036 0�1030 29/01/2021 (719) -Northern Trust EUR 41,877 NOK 444,503 0�0942 29/01/2021 (738) -Northern Trust EUR 31,611 GBP 28,990 1�0904 29/01/2021 (753) -Northern Trust CHF 45,211 NOK 444,185 0�1018 29/01/2021 (764) -Northern Trust CHF 50,832 GBP 42,874 1�1856 29/01/2021 (775) -Northern Trust EUR 28,301 NOK 302,977 0�0934 29/01/2021 (801) -Northern Trust CHF 135,270 AUD 199,707 0�6773 29/01/2021 (940) -Northern Trust EUR 3,472,109 DKK 25,841,762 0�1344 29/01/2021 (1,247) -Northern Trust USD 349,425 GBP 256,961 1�3598 29/01/2021 (1,344) -Northern Trust USD 351,870 NOK 3,012,077 0�1168 29/01/2021 (1,625) -Northern Trust EUR 250,847 SEK 2,529,030 0�0992 29/01/2021 (1,654) -Northern Trust EUR 247,786 NOK 2,607,807 0�0950 29/01/2021 (1,742) -Northern Trust GBP 555,392 AUD 981,700 0�5657 29/01/2021 (1,925) -Northern Trust EUR 307,797 GBP 278,343 1�1058 29/01/2021 (1,948) -Northern Trust USD 15,009,045 HKD 116,364,709 0�1290 29/01/2021 (2,237) -Northern Trust CHF 97,969 AUD 146,952 0�6667 29/01/2021 (2,472) -Northern Trust USD 331,822 GBP 245,015 1�3543 29/01/2021 (2,640) -Northern Trust CHF 3,527,244 DKK 24,295,232 0�1452 29/01/2021 (2,747) -Northern Trust HKD 1,027,765 GBP 99,178 10�3628 29/01/2021 (2,801) -Northern Trust CHF 207,953 SEK 1,954,879 0�1064 29/01/2021 (3,148) -Northern Trust CHF 178,239 GBP 151,259 1�1784 29/01/2021 (3,978) -Northern Trust CHF 159,057 NOK 1,575,615 0�1009 29/01/2021 (4,205) -Northern Trust GBP 881,796 NOK 10,293,383 0�0857 29/01/2021 (4,312) -Northern Trust CHF 17,234,440 EUR 15,950,578 1�0805 29/01/2021 (8,710) -Northern Trust EUR 7,128,335 USD 8,766,184 1�2298 29/01/2021 (11,816) -

117
Federated Hermes Investment Funds Public Limited CompanyPortfolio Statement As at 31 December 2020 (continued)
a Header 1a Federated Hermes Global Equity ESG Fund (continued)
Nominal Holdings Financial liabilities at fair value through profit or loss
Fair Value $
% of Net Assets
. . . . . Financial Derivative Instruments: (0.13%) (2019: (0.07%)) (continued) Forward Currency Contracts: (0.13%) (2019: (0.07%)) (continued)
CounterpartyCurrency Buys
Currency Sells
Currency Rate
Maturity Date
Unrealised Loss
$
% of Net Assets
Northern Trust USD 638,626 GBP 480,778 1�3283 29/01/2021 (17,668) -Northern Trust USD 5,214,823 DKK 31,867,458 0�1636 29/01/2021 (45,136) -Northern Trust CHF 2,698,676 AUD 4,047,982 0�6667 29/01/2021 (68,106) -Northern Trust EUR 2,792,854 AUD 4,526,686 0�6170 29/01/2021 (74,821) -Northern Trust CHF 5,626,952 SEK 52,896,614 0�1064 29/01/2021 (85,183) (0�01)Northern Trust EUR 5,624,054 SEK 57,126,825 0�0984 29/01/2021 (89,166) (0�01)Northern Trust USD 12,265,519 CHF 10,881,331 1�1272 29/01/2021 (96,939) (0�01)Northern Trust USD 17,962,771 JPY 1,860,873,027 0�0097 29/01/2021 (98,163) (0�01)Northern Trust CHF 4,910,660 GBP 4,167,332 1�1784 29/01/2021 (109,606) (0�01)Northern Trust CHF 4,382,181 NOK 43,409,732 0�1009 29/01/2021 (115,864) (0�01)Northern Trust EUR 4,946,856 GBP 4,536,386 1�0905 29/01/2021 (117,194) (0�01)Northern Trust USD 3,962,923 AUD 5,273,912 0�7514 29/01/2021 (120,360) (0�01)Northern Trust EUR 4,414,750 NOK 47,254,397 0�0934 29/01/2021 (123,945) (0�01)Northern Trust USD 8,285,405 SEK 69,103,595 0�1199 29/01/2021 (177,460) (0�01)Northern Trust USD 7,260,700 GBP 5,466,082 1�3283 29/01/2021 (200,866) (0�01)Northern Trust USD 6,478,889 NOK 56,939,064 0�1138 29/01/2021 (203,434) (0�01)Northern Trust USD 25,490,800 EUR 20,928,854 1�2180 29/01/2021 (212,102) (0�01)
Unrealised Losses on Forward Currency Contracts (2,043,788) (0.13)
Total Financial Derivative Instruments (2,043,788) (0.13)
Total financial liabilities at fair value through profit or loss (2,043,788) (0.13)

118
Federated Hermes Investment Funds Public Limited CompanyPortfolio Statement As at 31 December 2020 (continued)
a Header 1a Federated Hermes Global Equity ESG Fund (continued)
Nominal Holdings Financial assets at fair value through profit or loss
Fair Value $
% of Net Assets
. . . . .Net financial assets at fair value through profit or loss (2019: 98.32%) (Cost: $ 1,284,745,778)
1,597,769,166 98.66
Net Cash (2019: 1.92%) 24,426,379 1.51
Other Net Liabilities (2019: (0.24%)) (2,794,987) (0.17)
Net Assets Attributable to Holders of Redeemable Participating Shares 1,619,400,558 100.00
Portfolio Classification
% of Total Assets
Transferable securities admitted to official stock exchange listing 98�05OTC financial derivative instruments 0�29Cash 1�50Other assets 0�16Total 100.00

119
Federated Hermes Investment Funds Public Limited CompanyPortfolio StatementAs at 31 December 2020 (continued)
a Header 1a Federated Hermes Multi-Strategy Credit Fund
Nominal Holdings Financial assets at fair value through profit or loss
Fair Value $
% of Net Assets
. . . . .Corporate Bonds: 49.69% (2019: 62.06%)
Austria: 0.00% (2019: 0.70%) - -
Brazil: 3.16% (2019: 4.33%)
2,212,000 Petrobras Global Finance 5�375% 01/10/2029 3,496,962 0�561,663,000 Petrobras Global Finance 5�600% 03/01/2031 1,913,781 0�304,677,000 Suzano Austria 5�000% 15/01/2030 5,318,357 0�852,500,000 Vale 3�750% 10/01/2023 3,265,989 0�524,644,000 Vale Overseas 6�250% 10/08/2026 5,765,526 0�93
Total Brazil 19,760,615 3.16
Canada: 0.00% (2019: 0.83%) - -
Finland: 1.61% (2019: 0.90%)
7,250,000 Stora Enso 7�250% 15/04/2036 10,039,156 1�61
Total Finland 10,039,156 1.61
France: 0.64% (2019: 0.00%)
3,300,000 Altice France SA 3�375% 15/01/2028 4,002,930 0�64
Total France 4,002,930 0.64
Germany: 0.00% (2019: 1.27%) - -
Hong Kong: 0.26% (2019: 0.57%)
1,550,000 FTL Capital 4�125% 25/04/2023 1,609,729 0�26
Total Hong Kong 1,609,729 0.26
Ireland: 2.61% (2019: 3.47%)
2,226,000 AerCap Ireland Cap/Global 3�650% 21/07/2027 2,420,302 0�395,600,000 AerCap Ireland Cap/Global 3�875% 23/01/2028 6,035,267 0�965,514,000 Ardagh Packaging Finance 4�750% 15/07/2027 7,845,956 1�26
Total Ireland 16,301,525 2.61
Italy: 1.52% (2019: 1.84%)
8,701,000 Intesa Sanpaolo 5�017% 26/06/2024 9,524,158 1�52
Total Italy 9,524,158 1.52

120
Federated Hermes Investment Funds Public Limited CompanyPortfolio Statement As at 31 December 2020 (continued)
a Header 1a Federated Hermes Multi-Strategy Credit Fund (continued)
Nominal Holdings Financial assets at fair value through profit or loss
Fair Value $
% of Net Assets
. . . . .Corporate Bonds: 49.69% (2019: 62.06%) (continued)
Mexico: 0.61% (2019: 1.22%)
3,150,000 Orbia Advance Corp SAB de CV 5�500% 15/01/2048 3,828,038 0�61
Total Mexico 3,828,038 0.61
Netherlands: 2.84% (2019: 2.16%)
3,875,000 Ashland Services 2�000% 30/01/2028 4,747,183 0�76650,000 NXP 3�400% 01/05/2030 738,569 0�12
3,840,000 NXP 3�875% 01/09/2022 4,048,087 0�652,850,000 NXP BV / NXP Funding 3�875% 01/09/2022 3,004,440 0�482,531,000 VEON 3�375% 25/11/2027 2,603,412 0�412,140,000 VZ Vendor Financing 2�875% 15/01/2029 2,614,469 0�42
Total Netherlands 17,756,160 2.84
Norway: 0.00% (2019: 0.79%) - -
Russian Federation: 0.00% (2019: 1.86%) - -
South Africa: 0.98% (2019: 1.11%)
6,155,000 Sappi Papier 7�500% 15/06/2032 6,093,450 0�98
Total South Africa 6,093,450 0.98
Spain: 1.25% (2019: 0.75%)
1,300,000 Cellnex Telecom 0�750% 20/11/2031 1,539,334 0�25600,000 Cellnex Telecom 1�000% 20/04/2027 727,247 0�12
1,500,000 Grifols 1�625% 15/02/2025 1,843,584 0�292,950,000 Grifols 2�250% 15/11/2027 3,670,834 0�59
Total Spain 7,780,999 1.25
Turkey: 0.50% (2019: 0.63%)
3,042,000 Turk Telekomunikasyon 4�875% 19/06/2024 3,154,493 0�50
Total Turkey 3,154,493 0.50
United Kingdom: 1.36% (2019: 3.24%)
1,950,000 Fiat Chrysler Automobiles 5�250% 15/04/2023 2,093,813 0�341,000,000 Fiat Chrysler Finance Europe 4�750% 22/03/2021 1,236,293 0�203,517,000 Rothesay Life 3�375% 12/07/2026 5,135,233 0�82
Total United Kingdom 8,465,339 1.36

121
Federated Hermes Investment Funds Public Limited CompanyPortfolio Statement As at 31 December 2020 (continued)
a Header 1a Federated Hermes Multi-Strategy Credit Fund (continued)
Nominal Holdings Financial assets at fair value through profit or loss
Fair Value $
% of Net Assets
. . . . .Corporate Bonds: 49.69% (2019: 62.06%) (continued)
United States: 32.35% (2019: 36.39%)
13,713,000 AbbVie 4�550% 15/03/2035 17,383,737 2�788,420,000 Air Lease 3�625% 01/12/2027 9,102,972 1�468,799,000 Ally Financial 4�625% 30/03/2025 10,039,031 1�611,243,000 Ally Financial 5�750% 20/11/2025 1,448,386 0�236,000,000 Ball 1�500% 15/03/2027 7,558,236 1�212,000,000 Ball Corporation 0�875% 15/03/2024 2,454,441 0�392,000,000 Berry Global 1�000% 15/01/2025 2,474,630 0�403,250,000 Berry Global 1�500% 15/01/2027 4,065,016 0�65
500,000 Berry Global Inc 1�000% 15/01/2025 618,658 0�103,800,000 Catalent Pharma Solutions 2�375% 01/03/2028 4,690,452 0�751,605,000 CenturyLink 6�875% 15/01/2028 1,864,497 0�302,428,000 Crown European 0�750% 15/02/2023 2,969,590 0�47
635,000 Dell 5�400% 10/09/2040 717,674 0�1219,815,000 Dell 6�020% 15/06/2026 24,189,811 3�87
1,200,000 Domtar 6�250% 01/09/2042 1,444,191 0�235,355,000 Domtar 6�750% 15/02/2044 6,806,227 1�093,571,000 EnLink Midstream Partners 5�450% 01/06/2047 2,884,547 0�466,251,000 EnLink Midstream Partners 5�600% 01/04/2044 5,043,276 0�813,185,000 EQM Midstream Partners 6�500% 15/07/2048 3,317,384 0�53
744,000 HCA 3�500% 01/09/2030 791,178 0�132,410,000 HCA 4�750% 01/05/2023 2,629,155 0�422,759,000 HCA 7�500% 15/11/2095 3,612,345 0�581,000,000 IQVIA 2�250% 15/01/2028 1,237,621 0�203,681,000 Kinder Morgan Energy Partners 4�700% 01/11/2042 4,228,106 0�68
10,512,000 Kinder Morgan Energy Partners 5�625% 01/09/2041 12,856,833 2�062,000,000 Kraft Heinz Foods 2�250% 25/05/2028 2,592,644 0�41
160,000 Kraft Heinz Foods 4�250% 01/03/2031 178,555 0�031,200,000 Kraft Heinz Foods 4�375% 01/06/2046 1,300,351 0�213,735,000 L Brands 6�875% 01/11/2035 4,199,540 0�67
841,000 L Brands 7�600% 15/07/2037 908,280 0�154,550,000 Lennar 4�125% 15/01/2022 4,666,594 0�757,995,000 Lennar 4�750% 29/11/2027 9,458,485 1�511,054,000 Lennar 5�000% 15/06/2027 1,243,720 0�204,308,000 Occidental Petroleum 3�500% 15/08/2029 3,949,445 0�631,408,000 Range Resources 4�875% 15/05/2025 1,332,623 0�21
14,814,000 Tenet Healthcare 4�875% 01/01/2026 15,515,443 2�48800,000 Tenet Healthcare 6�875% 15/11/2031 846,848 0�14510,000 T-Mobile USA 2�550% 15/02/2031 536,173 0�08
4,500,000 T-Mobile USA 4�500% 15/04/2050 5,558,670 0�898,750,000 Toll Brothers Finance 4�350% 15/02/2028 9,743,650 1�564,900,000 Toll Brothers Finance 4�875% 15/03/2027 5,615,694 0�90
Total United States 202,074,709 32.35
Total Corporate Bonds 310,391,301 49.69

122
Federated Hermes Investment Funds Public Limited CompanyPortfolio Statement As at 31 December 2020 (continued)
a Header 1a Federated Hermes Multi-Strategy Credit Fund (continued)
Nominal Holdings Financial assets at fair value through profit or loss
Fair Value $
% of Net Assets
. . . . .Government Bonds: 12.72% (2019: 1.01%)
United States: 12.72% (2019: 1.01%)
79,500,000 United States Treasury Bill 0�010% 17/06/2021 79,473,743 12�72
Total United States 79,473,743 12.72
Total Government Bonds 79,473,743 12.72
Floating Rate Notes: 32.58% (2019: 32.40%)
Australia: 2.63% (2019: 3.36%)
11,005,000 BHP Billiton Finance 22/10/2077 16,452,436 2�63
Total Australia 16,452,436 2.63
Belgium: 0.49% (2019: 0.29%)
2,500,000 Telenet International Finance 0% 21/04/2030 3,060,802 0�49
Total Belgium 3,060,802 0.49
Canada: 2.06% (2019: 2.29%)
12,560,000 Enbridge 15/07/2077 12,894,588 2�06
Total Canada 12,894,588 2.06
France: 1.96% (2019: 1.81%)
5,600,000 Electricite de France 31/12/2049 8,744,790 1�402,800,000 Veolia Environnement 30/12/2049 3,470,906 0�56
Total France 12,215,696 1.96
Germany: 2.33% (2019: 2.59%)
3,200,000 Commerzbank 31/12/2049 4,189,475 0�67800,000 Commerzbank 31/12/2049 1,110,391 0�18200,000 Deutsche Bank 31/12/2049 201,000 0�03
7,865,000 Deutsche Postbank Funding Trust I 31/12/2049 9,065,767 1�45
Total Germany 14,566,633 2.33
India: 0.92% (2019: 1.01%)
5,403,000 Network i2i 31/12/2049 5,756,897 0�92
Total India 5,756,897 0.92

123
Federated Hermes Investment Funds Public Limited CompanyPortfolio Statement As at 31 December 2020 (continued)
a Header 1a Federated Hermes Multi-Strategy Credit Fund (continued)
Nominal Holdings Financial assets at fair value through profit or loss
Fair Value $
% of Net Assets
. . . . .Floating Rate Notes: 32.58% (2019: 32.40%) (continued)
Ireland: 1.60% (2019: 3.09%)
5,247,000 Aercap Holdings 10/10/2079 5,396,041 0�864,537,000 Bank of Ireland 19/09/2027 4,622,424 0�74
Total Ireland 10,018,465 1.60
Italy: 0.52% (2019: 0.00%)
852,000 Intesa Sanpaolo 31/12/2049 991,515 0�162,038,000 UniCredit 31/12/2049 2,250,470 0�36
Total Italy 3,241,985 0.52
Netherlands: 2.08% (2019: 0.63%)
500,000 ABN AMRO Bank 31/12/2049 651,662 0�104,500,000 ABN AMRO Bank 31/12/2049 5,917,272 0�955,200,000 Cooperatieve Rabobank 31/12/2049 6,434,432 1�03
Total Netherlands 13,003,366 2.08
Norway: 0.99% (2019: 1.19%)
5,934,000 DNB 31/12/2049 6,167,432 0�99
Total Norway 6,167,432 0.99
Sweden: 0.37% (2019: 0.00%)
1,900,000 Samhallsbygg 31/12/2049 2,316,527 0�37
Total Sweden 2,316,527 0.37
Switzerland: 1.20% (2019: 0.00%)
608,000 Credit Suisse 31/12/2049 612,499 0�106,600,000 Credit Suisse 31/12/2049 6,880,500 1�10
Total Switzerland 7,492,999 1.20
United Kingdom: 5.79% (2019: 6.11%)
3,900,000 Barclays Bank 31/12/2049 3,499,528 0�566,890,000 Barclays Bank 31/12/2049 8,657,630 1�393,613,876 Castell 2019-1 25/07/2052 4,966,222 0�805,560,000 National Westminster Bank 31/12/2049 5,172,190 0�833,490,000 National Westminster Bank 31/12/2049 3,246,677 0�523,127,000 Phoenix Group 31/12/2049 4,577,362 0�73

124
Federated Hermes Investment Funds Public Limited CompanyPortfolio Statement As at 31 December 2020 (continued)
a Header 1a Federated Hermes Multi-Strategy Credit Fund (continued)
Nominal Holdings Financial assets at fair value through profit or loss
Fair Value $
% of Net Assets
. . . . .Floating Rate Notes: 32.58% (2019: 32.40%) (continued)
United Kingdom: 5.79% (2019: 6.11%) (continued)
4,500,000 Virgin Media Investment Term Loan 15/11/2027 6,026,312 0�96
Total United Kingdom 36,145,921 5.79
United States: 9.64% (2019: 10.03%)
8,754,000 CIT 31/12/2049 8,940,022 1�4314,250,000 Enterprise Products Operating 15/02/2078 14,424,382 2�31
5,234,000 General Electric 31/12/2049 4,875,471 0�789,403,308 Ineos Group 31/10/2024 11,381,620 1�824,824,561 IQVIA 03/03/2024 5,898,989 0�959,934,000 Plains All American Pipeline 31/12/2049 8,096,210 1�306,591,485 Reynolds 05/02/2023 6,575,006 1�05
Total United States 60,191,700 9.64
Total Floating Rate Notes 203,525,447 32.58
Asset Backed Securities: 0.57% (2019: 0.00%)
Netherlands: 0.30% (2019: 0.00%)
1,500,000 Dutch Property Finance 2020-2 28/01/2058 1,839,192 0�30
Total Netherlands 1,839,192 0.30
United Kingdom: 0.27% (2019: 0.00%)
1,247,124 Together 2019-1 Class A 15/07/2061 1,713,998 0�27
Total United Kingdom 1,713,998 0.27
Total Asset Backed Securities 3,553,190 0.57
Financial Derivative Instruments: 3.98% (2019: 3.31%)
Credit Default Swaps: 2.07% (2019: 1.49%)
Credit Default Swaps: Pay Fixed (Buy Protection) - Unrealised Gains: 0.13% (2019: 0.06%)
United States: 0.13% (2019: 0.06%)
20,000,000 Freeport-Mcmoran 1% 20/12/2025 (Goldman Sachs) 64,938 0�011,750,000 L Brands 1% 20/12/2025 (Goldman Sachs) 100,970 0�023,500,000 L Brands 1% 20/12/2025 (Goldman Sachs) 201,939 0�03

125
Federated Hermes Investment Funds Public Limited CompanyPortfolio Statement As at 31 December 2020 (continued)
a Header 1a Federated Hermes Multi-Strategy Credit Fund (continued)
Nominal Holdings Financial assets at fair value through profit or loss
Fair Value $
% of Net Assets
. . . . . Financial Derivative Instruments: 3.98% (2019: 3.31%) (continued) Credit Default Swaps: 2.07% (2019: 1.49%) (continued)
Credit Default Swaps: Pay Fixed (Buy Protection) - Unrealised Gains: 0.13% (2019: 0.06%) (continued)
United States: 0.13% (2019: 0.06%) (continued)
2,500,000 Macy's Retail Holdings 1% 20/06/2025 (BNP Paribas) 418,385 0�07
Total United States 786,232 0.13
Total Credit Default Swaps: Pay Fixed (Buy Protection) - Unrealised Gains 786,232 0.13
Credit Default Swaps: Receive Fixed (Sell Protection) - Unrealised Gains: 1.94% (2019: 1.43%)
European Union: 1.06% (2019: 0.90%)
(11,550,000) ArcelorMittal 5% 20/12/2023 (JP Morgan) 1,705,341 0�27(2,000,000) CNH Industrial Finance 5% 20/12/2023 (Goldman Sachs) 327,168 0�05(7,000,000) CNH Industrial Finance 5% 20/12/2023 (BNP Paribas) 1,145,090 0�18(5,400,000) Fiat Chrysler Automobiles 5% 20/12/2023 (JP Morgan) 788,815 0�13
(70,000,000) Itraxx Europe 1% 20/12/2025 (Morgan Stanley) 2,230,373 0�36(3,000,000) Virgin Media Finance 5% 20/12/2025 (Goldman Sachs) 396,925 0�07
Total European Union 6,593,712 1.06
United States: 0.88% (2019: 0.53%)
(2,500,000) Canadian National Resources 5% 20/12/2025 (Credit Suisse) 330,771 0�05(3,000,000) Dell 1% 20/12/2023 (Goldman Sachs) 13,362 -
(18,000,000) Ford Motor 5% 20/12/2023 (Goldman Sachs) 1,508,780 0�24(11,950,000) General Motors 5% 20/12/2023 (JP Morgan) 1,485,742 0�24(6,700,000) HCA 5% 20/12/2025 (Goldman Sachs) 1,251,007 0�20
(900,000) UPC 5% 20/12/2025 (JP Morgan) 142,767 0�02(1,500,000) UPC 5% 20/12/2025 (JP Morgan) 237,945 0�04(1,000,000) UPC 5% 20/12/2025 (JP Morgan) 158,630 0�03(2,500,000) UPC 5% 20/12/2025 (JP Morgan) 396,575 0�06
Total United States 5,525,579 0.88
Total Credit Default Swaps: Receive Fixed (Sell Protection) - Unrealised Gains 12,119,291 1.94
Total Credit Default Swaps 12,905,523 2.07
Open Purchased Swaptions - Unrealised Gains: 0.04% (2019: 0.00%)
United States: 0.04% (2019: 0.00%)
100,000,000 SWO Cdx�Na�Hy�35 20/01/2021 (JP Morgan) 88,960 0�02

126
Federated Hermes Investment Funds Public Limited CompanyPortfolio Statement As at 31 December 2020 (continued)
a Header 1a Federated Hermes Multi-Strategy Credit Fund (continued)
Nominal Holdings Financial assets at fair value through profit or loss
Fair Value $
% of Net Assets
. . . . .Financial Derivative Instruments: 3.98% (2019: 3.31%) (continued)
Open Purchased Swaptions - Unrealised Gains: 0.04% (2019: 0.00%) (continued)
United States: 0.04% (2019: 0.00%) (continued)40,000,000 SWO Itraxx Europe Crossover 3�5 17/02/2021 (Merrill Lynch) 129,363 0�02
Total United States 218,323 0.04
Total Open Purchased Swaptions - Unrealised Gains 218,323 0.04
Forward Currency Contracts: 1.85% (2019: 1.48%)
CounterpartyCurrency Buys
Currency Sells
Currency Rate
Maturity Date
Unrealised Gain
$
% of Net Assets
Northern Trust GBP 147,885,474 USD 197,135,774 1�3330 29/01/2021 5,049,356 0�81Northern Trust GBP 146,506,434 USD 195,297,472 1�3330 29/01/2021 5,002,270 0�80Northern Trust GBP 38,394,651 USD 51,181,221 1�3330 29/01/2021 1,310,935 0�21Northern Trust EUR 45,591,559 USD 55,755,741 1�2229 29/01/2021 56,229 0�01Northern Trust EUR 30,721,194 USD 37,570,177 1�2229 29/01/2021 37,889 0�01Northern Trust EUR 25,451,132 USD 31,125,208 1�2229 29/01/2021 31,389 0�01Northern Trust GBP 807,778 USD 1,076,704 1�3329 29/01/2021 27,668 -Northern Trust GBP 556,916 USD 742,386 1�3330 29/01/2021 19,015 -Northern Trust NOK 8,444,385 USD 973,099 0�1152 29/01/2021 13,153 -Northern Trust GBP 337,840 USD 457,113 1�3530 29/01/2021 4,772 -Northern Trust USD 308,568 EUR 250,679 1�2309 29/01/2021 1,694 -Northern Trust USD 2,330,006 EUR 1,900,000 1�2263 17/03/2021 1,669 -Northern Trust CHF 400,736 USD 452,268 1�1286 29/01/2021 1,378 -Northern Trust EUR 361,358 USD 441,919 1�2229 29/01/2021 446 -Northern Trust GBP 17,283 USD 23,404 1�3542 29/01/2021 225 -Northern Trust GBP 16,875 USD 22,851 1�3542 29/01/2021 219 -Northern Trust USD 27,690 EUR 22,495 1�2309 29/01/2021 152 -Northern Trust NOK 133,426 USD 15,439 0�1157 29/01/2021 144 -Northern Trust EUR 1,663 USD 2,029 1�2197 29/01/2021 7 -Northern Trust CHF 1,029 USD 1,162 1�1286 29/01/2021 3 -Northern Trust GBP 8,395 USD 11,476 1�3670 06/01/2021 - -
Unrealised Gains on Forward Currency Contracts 11,558,613 1.85

127
Federated Hermes Investment Funds Public Limited CompanyPortfolio Statement As at 31 December 2020 (continued)
a Header 1a Federated Hermes Multi-Strategy Credit Fund (continued)
Nominal Holdings Financial assets at fair value through profit or loss
Fair Value $
% of Net Assets
. . . . . Financial Derivative Instruments: 3.98% (2019: 3.31%) (continued)
Futures Contracts - Unrealised Gains: 0.02% (2019: 0.34%)
Clearing Broker
Description
Currency
No. of Contracts
Unrealised Gain
$
% of Net Assets
Germany: 0.00% (2019: 0.09%) - -
United States: 0.02% (2019: 0.25%)
Morgan Stanley US Ultra CBT March 2021 USD (104) 131,386 0�02
Total United States 131,386 0.02
Total Futures Contracts - Unrealised Gains 131,386 0.02
Total Financial Derivative Instruments 24,813,845 3.98
Total financial assets at fair value through profit or loss 621,757,526 99.54
Financial liabilities at fair value through profit or loss
Financial Derivative Instruments: (5.41%) (2019: (5.84%))
Credit Default Swaps: (5.14%) (2019: (5.80%))
Credit Default Swaps: Pay Fixed (Buy Protection) - Unrealised Losses: (4.95%) (2019: (5.78%))
European Union: (4.21%) (2019: (4.21%))
9,625,000 Anglo American Capital 5% 20/12/2025 (Merrill Lynch) (2,335,790) (0�37)11,250,000 Glencore Finance 5% 20/12/2025 (Goldman Sachs) (2,498,430) (0�40)8,500,000 Ineos Group 5% 20/12/2025 (Credit Suisse) (798,426) (0�13)
107,300,000 Itraxx Europe 5% 20/12/2025 (Morgan Stanley) (15,598,856) (2�50)130,000,000 Itraxx Europe 1% 20/12/2023 (Morgan Stanley) (3,468,813) (0�55)
16,250,000 Safeway 1% 20/12/2021 (Goldman Sachs) (171,069) (0�03)7,400,000 Stora Enzo OYJ 5% 20/06/2024 (Barclays Bank) (1,441,968) (0�23)
Total European Union (26,313,352) (4.21)
United States: (0.74%) (2019: (1.57%))
3,432,000 American Axle & Manufacturing 5% 20/12/2025 (Goldman Sachs) (217,368) (0�04)4,818,000 American Axle & Manufacturing 5% 20/12/2025 (Goldman Sachs) (305,151) (0�05)6,166,000 Avis Budget 5% 20/12/2025 (Goldman Sachs) (201,968) (0�03)4,000,000 Canadian National Resources 1% 20/12/2025 (Credit Suisse) (33,096) (0�01)2,400,000 Canadian National Resources 1% 20/12/2025 (Credit Suisse) (19,858) -1,600,000 Canadian National Resources 1% 20/12/2025 (Credit Suisse) (13,239) -
29,092,000 Dell 1% 20/06/2024 (JP Morgan) (20,396) -9,000,000 Domtar Corporation 1% 20/12/2021 (Goldman Sachs) (74,374) (0�01)8,254,000 International Lease Finance 5% 20/12/2025 (Goldman Sachs) (1,708,874) (0�27)

128
Federated Hermes Investment Funds Public Limited CompanyPortfolio Statement As at 31 December 2020 (continued)
a Header 1a Federated Hermes Multi-Strategy Credit Fund (continued)
Nominal Holdings Financial liabilities at fair value through profit or loss
Fair Value $
% of Net Assets
. . . . .Financial Derivative Instruments: (5.41%) (2019: (5.84%)) (continued)
Credit Default Swaps: (5.14%) (2019: (5.80%)) (continued)
Credit Default Swaps: Pay Fixed (Buy Protection) - Unrealised Losses: (4.95%) (2019: (5.78%)) (continued)
United States: (0.74%) (2019: (1.57%)) (continued)
9,200,000 Pactiv 5% 20/12/2021 (Morgan Stanley) (408,793) (0�07)15,000,000 Tenet Healthcare 5% 20/12/2024 (Goldman Sachs) (1,220,043) (0�20)
4,083,000 Tenet Healthcare 5% 20/12/2024 (Goldman Sachs) (332,096) (0�05)817,000 Tenet Healthcare 5% 20/12/2024 (Goldman Sachs) (66,452) (0�01)
Total United States (4,621,708) (0.74)
Total Credit Default Swaps: Pay Fixed (Buy Protection) - Unrealised Losses (30,935,060) (4.95)
Credit Default Swaps: Receive Fixed (Sell Protection) - Unrealised Losses: (0.19%) (2019: (0.02%))
European Union: (0.11%) (2019: 0.00%)
(8,947,000) Marks & Spencer 1% 20/12/2023 (JP Morgan) (294,860) (0�05)(11,150,000) Telecom Italia 1% 20/12/2023 (Credit Suisse) (129,160) (0�02)(11,000,000) Thyssenkrupp 1% 20/06/2023 (Credit Suisse) (207,148) (0�04)
Total European Union (631,168) (0.11)
United States: (0.08%) (2019: (0.02%))
(9,500,000) Macy's Retail Holdings 1% 20/06/2023 (Goldman Sachs) (519,317) (0�08)
Total United States (519,317) (0.08)
Total Credit Default Swaps: Receive Fixed (Sell Protection) - Unrealised Losses (1,150,485) (0.19)
Total Credit Default Swaps (32,085,545) (5.14)
Forward Currency Contracts: (0.26%) (2019: (0.04%))
CounterpartyCurrency Buys
Currency Sells
Currency Rate
Maturity Date
Unrealised Loss
$
% of Net Assets
Northern Trust USD 17,783 EUR 14,538 1�2232 29/01/2021 (14) -Northern Trust USD 3,402 EUR 2,792 1�2187 29/01/2021 (15) -Northern Trust USD 7,807 EUR 6,406 1�2187 29/01/2021 (35) -Northern Trust USD 62,797 EUR 51,338 1�2232 29/01/2021 (50) -Northern Trust USD 19,375 EUR 15,885 1�2197 29/01/2021 (71) -

129
Federated Hermes Investment Funds Public Limited CompanyPortfolio Statement As at 31 December 2020 (continued)
a Header 1a Federated Hermes Multi-Strategy Credit Fund (continued)
Nominal Holdings Financial liabilities at fair value through profit or loss
Fair Value $
% of Net Assets
. . . . .Financial Derivative Instruments: (5.41%) (2019: (5.84%)) (continued)
Forward Currency Contracts: (0.26%) (2019: (0.04%)) (continued)
CounterpartyCurrency Buys
Currency Sells
Currency Rate
Maturity Date
Unrealised Loss
$
% of Net Assets
Northern Trust USD 3,130 GBP 2,348 1�3329 29/01/2021 (80) -Northern Trust USD 37,602 EUR 30,823 1�2199 29/01/2021 (131) -Northern Trust USD 33,141 GBP 24,473 1�3542 29/01/2021 (318) -Northern Trust USD 134,705 EUR 110,419 1�2199 29/01/2021 (468) -Northern Trust USD 149,231 GBP 109,636 1�3612 29/01/2021 (660) -Northern Trust USD 70,193 GBP 51,878 1�3530 29/01/2021 (733) -Northern Trust USD 28,779 GBP 21,591 1�3329 29/01/2021 (740) -Northern Trust USD 175,833 GBP 129,179 1�3612 29/01/2021 (778) -Northern Trust USD 39,833 GBP 29,881 1�3331 29/01/2021 (1,019) -Northern Trust USD 133,942 GBP 98,993 1�3530 29/01/2021 (1,398) -Northern Trust USD 94,301 GBP 70,740 1�3331 29/01/2021 (2,414) -Northern Trust USD 282,282 NOK 2,450,000 0�1152 29/01/2021 (3,863) -Royal Bank of Canada USD 3,299,930 EUR 2,700,000 1�2222 17/03/2021 (8,759) -Northern Trust USD 1,017,718 GBP 763,448 1�3331 29/01/2021 (26,048) (0�01)Royal Bank of Canada USD 44,951,473 EUR 36,850,000 1�2199 17/03/2021 (206,015) (0�03)State Street USD 44,950,846 EUR 36,850,000 1�2198 17/03/2021 (206,642) (0�03)State Street USD 60,359,760 GBP 45,000,000 1�3413 17/03/2021 (1,179,558) (0�19)
Unrealised Losses on Forward Currency Contracts (1,639,809) (0.26)
Futures Contracts - Unrealised Losses: (0.01%) (2019: 0.00%)
Clearing Broker Description CurrencyNo. of
ContractsUnrealised
Loss $
% of Net Assets
United States: (0.01%) (2019: 0.00%)
Morgan Stanley 10 Year Note CBT March 2021 USD (502) (62,750) (0�01)
Total United States (62,750) (0.01)
Total Futures Contracts - Unrealised Loss (62,750) (0.01)
Total Financial Derivative Instruments (33,788,104) (5.41)
Total financial liabilities at fair value through profit or loss (33,788,104) (5.41)

130
Federated Hermes Investment Funds Public Limited CompanyPortfolio Statement As at 31 December 2020 (continued)
a Header 1a Federated Hermes Multi-Strategy Credit Fund (continued)
Nominal Holdings Financial assets at fair value through profit or loss
Fair Value $
% of Net Assets
. . . . .Net financial assets at fair value through profit or loss (2019: 92.94%) (Cost: $ 528,529,584)
587,969,422 94.13
Net Cash (2019: 7.90%) 32,369,087 5.18
Other Net Assets (2019: (0.84%)) 4,294,856 0.69
Net Assets Attributable to Holders of Redeemable Participating Shares 624,633,365 100.00
Portfolio Classification
% of Total Assets
Transferable securities traded on a regulated market 89�59OTC financial derivative instruments 3�70Financial derivative instruments dealt in on a regulated market 0�02Cash 5�87Other assets 0�82Total 100.00

131
Federated Hermes Investment Funds Public Limited CompanyPortfolio StatementAs at 31 December 2020 (continued)
a Header 1a Federated Hermes Global Small Cap Equity Fund
Nominal Holdings Financial assets at fair value through profit or loss
Fair Value $
% of Net Assets
. . . . .Equities: 95.08% (2019: 94.06%)
Australia: 2.11% (2019: 1.25%)
44,936 Ansell 1,209,743 0�92405,169 Evolution Mining 1,564,969 1�19
Total Australia 2,774,712 2.11
Austria: 0.51% (2019: 0.87%)
17,471 Schoeller-Bleckmann 666,878 0�51
Total Austria 666,878 0.51
Canada: 3.41% (2019: 3.00%)
80,930 CAE 2,262,709 1�7213,126 Cargojet 2,228,111 1�69
Total Canada 4,490,820 3.41
Finland: 1.75% (2019: 1.81%)
44,463 Huhtamaki 2,306,199 1�75
Total Finland 2,306,199 1.75
France: 1.09% (2019: 0.00%)
7,338 Soitec 1,441,908 1�09
Total France 1,441,908 1.09
Germany: 2.18% (2019: 2.18%)
63,814 Jungheinrich - Preferred 2,866,589 2�18
Total Germany 2,866,589 2.18
Ireland: 1.39% (2019: 1.04%)
143,379 Glanbia 1,835,432 1�39
Total Ireland 1,835,432 1.39
Italy: 3.48% (2019: 3.75%)
164,121 Cerved Information Solutions 1,500,683 1�1466,271 MARR 1,371,354 1�04
151,178 Technogym 1,714,466 1�30
Total Italy 4,586,503 3.48

132
Federated Hermes Investment Funds Public Limited CompanyPortfolio Statement As at 31 December 2020 (continued)
a Header 1a Federated Hermes Global Small Cap Equity Fund (continued)
Nominal Holdings Financial assets at fair value through profit or loss
Fair Value $
% of Net Assets
. . . . .Equities: 95.08% (2019: 94.06%) (continued)
Japan: 11.13% (2019: 15.12%)
35,669 Horiba 2,093,800 1�5985,533 Nifco 3,356,920 2�5530,200 Noritsu Koki 712,329 0�5469,041 Open House 2,538,839 1�9331,436 SCSK 1,799,567 1�3741,582 TS Tech 1,287,019 0�9741,158 Yaoko 2,871,256 2�18
Total Japan 14,659,730 11.13
Jersey: 1.35% (2019: 0.00%)
1,492,538 Breedon Aggregates 1,776,278 1�35
Total Jersey 1,776,278 1.35
Netherlands: 4.67% (2019: 3.77%)
58,456 Aalberts 2,623,750 1�9927,473 IMCD 3,528,692 2�68
Total Netherlands 6,152,442 4.67
South Africa: 0.00% (2019: 0.16%) - -
Sweden: 3.70% (2019: 3.07%)
61,886 Thule 2,330,518 1�77113,960 Trelleborg 2,546,179 1�93
Total Sweden 4,876,697 3.70
Switzerland: 1.83% (2019: 1.66%)
6,911 Burckhardt Compression 2,408,533 1�83
Total Switzerland 2,408,533 1.83
United Kingdom: 6.05% (2019: 7.30%)
160,453 Beazley 805,870 0�61407,089 Central Asia Metals 1,330,650 1�01320,295 CLS 980,802 0�75
27,605 Dechra Pharmaceuticals 1,315,622 1�00480,398 Harworth Group 698,264 0�53247,359 Paragon Group of Companies 1,660,971 1�26257,815 SSP 1,175,232 0�89
Total United Kingdom 7,967,411 6.05

133
Federated Hermes Investment Funds Public Limited CompanyPortfolio Statement As at 31 December 2020 (continued)
a Header 1a Federated Hermes Global Small Cap Equity Fund (continued)
Nominal Holdings Financial assets at fair value through profit or loss
Fair Value $
% of Net Assets
. . . . .Equities: 95.08% (2019: 94.06%) (continued)
United States: 50.43% (2019: 49.08%)
27,298 Altair Engineering 1,588,198 1�2137,669 AMN Healthcare Services 2,566,389 1�9518,000 AptarGroup 2,455,020 1�86
3,170 Bio-Rad Laboratories 1,822,211 1�3847,043 Brooks Automation 3,468,010 2�6338,577 Brown & Brown 1,784,186 1�3538,838 Brunswick 3,039,074 2�31
8,109 CACI International 2,011,924 1�5375,930 Cargurus 2,456,336 1�8721,361 Clean Harbors 1,607,415 1�2218,489 Columbia Sportswear 1,635,167 1�2433,214 Community Bank System 2,060,929 1�56
1,395,621 Diversified Gas & Oil 2,167,598 1�6518,078 Eagle Materials 1,843,052 1�40
9,442 Jack Henry & Associates 1,498,917 1�1440,846 John Wiley & Sons 1,888,719 1�4326,624 Kirby 1,391,903 1�0618,607 Livanova 1,245,925 0�9546,408 MDU Resources 1,201,967 0�9145,070 National Instruments 1,968,658 1�5014,251 Palomar 1,238,412 0�9422,164 Power Integrations 1,795,727 1�3612,986 Reinsurance of America 1,498,584 1�1433,681 RPM International 3,048,130 2�3122,446 Silicon Laboratories 2,848,173 2�1611,990 STERIS 2,233,617 1�7050,711 TCF Financial 1,870,222 1�4238,269 Terminix Global 1,939,856 1�4711,428 WD-40 3,047,733 2�317,865 West Pharmaceutical Services 2,201,728 1�67
12,622 WEX 2,538,663 1�9340,272 Wintrust Financial 2,459,411 1�87
Total United States 66,421,854 50.43
Total Equities 125,231,986 95.08
REITS: 3.10% (2019: 3.10%)
Japan: 0.77% (2019: 0.00%)
680 Hulic REITS 1,015,398 0�77
Total Japan 1,015,398 0.77

134
Federated Hermes Investment Funds Public Limited CompanyPortfolio Statement As at 31 December 2020 (continued)
a Header 1a Federated Hermes Global Small Cap Equity Fund (continued)
Nominal Holdings Financial assets at fair value through profit or loss
Fair Value $
% of Net Assets
. . . . .REITS: 3.10% (2019: 3.10%) (continued)
Spain: 1.05% (2019: 0.57%)
145,862 Merlin Properties REITS 1,387,434 1�05
Total Spain 1,387,434 1.05
United States: 1.28% (2019: 2.53%)
127,421 Retail Opportunity Investments REITS 1,684,506 1�28
Total United States 1,684,506 1.28
Total REITS 4,087,338 3.10
Total financial assets at fair value through profit or loss 129,319,324 98.18
Net financial assets at fair value through profit or loss (2019: 97.16%) (Cost: $ 105,939,923)
129,319,324 98.18
Net Cash (2019: 2.99%) 2,523,855 1.92
Other Net Liabilities (2019: (0.15%)) (121,320) (0.10)
Net Assets Attributable to Holders of Redeemable Participating Shares 131,721,859 100.00
Portfolio Classification
% of Total Assets
Transferable securities admitted to official stock exchange listing 98�05Cash 1�91Other assets 0�04Total 100.00

135
Federated Hermes Investment Funds Public Limited CompanyPortfolio StatementAs at 31 December 2020 (continued)
a Header 1a Federated Hermes Absolute Return Credit Fund
Nominal Holdings Financial assets at fair value through profit or loss
Fair Value $
% of Net Assets
. . . . .Corporate Bonds: 59.37% (2019: 63.32%)
Australia: 0.05% (2019: 0.00%)
150,000 FMG Resources 5�125% 15/05/2024 163,031 0�05
Total Australia 163,031 0.05
Austria: 0.00% (2019: 0.18%) - -
Belgium: 0.49% (2019: 0.00%)
1,000,000 Barry Callebaut 5�500% 15/06/2023 1,090,000 0�33400,000 Telenet Finance Lux Note 3�500% 01/03/2028 508,997 0�16
Total Belgium 1,598,997 0.49
Brazil: 2.73% (2019: 2.35%)
200,000 Gerdau Trade 4�750% 15/04/2023 215,252 0�07650,000 Gerdau Trade 4�875% 24/10/2027 754,819 0�23463,000 GUSAP III 4�250% 21/01/2030 517,407 0�16400,000 NBM US 7�000% 14/05/2026 436,104 0�13700,000 Petrobras Global Finance 4�750% 14/01/2025 982,648 0�30324,000 Petrobras Global Finance 5�375% 01/10/2029 512,213 0�16911,000 Petrobras Global Finance 5�600% 03/01/2031 1,048,379 0�32
1,145,000 Suzano Austria 5�000% 15/01/2030 1,302,014 0�401,750,000 Vale 3�750% 10/01/2023 2,286,192 0�70
114,000 Vale Overseas 3�750% 08/07/2030 126,940 0�04575,000 Vale Overseas 6�250% 10/08/2026 713,863 0�22
Total Brazil 8,895,831 2.73
Canada: 0.18% (2019: 1.58%)
572,000 First Quantum Minerals 6�875% 01/03/2026 597,382 0�18
Total Canada 597,382 0.18
Chile: 0.42% (2019: 0.47%)
600,000 SACi Falabella 3�750% 30/10/2027 648,503 0�20450,000 VTR Finance 6�375% 15/07/2028 492,188 0�15200,000 VTR Finance 6�375% 15/07/2028 218,750 0�07
Total Chile 1,359,441 0.42
Colombia: 0.08% (2019: 0.00%)
250,000 Ecopetrol 4�125% 16/01/2025 272,190 0�08
Total Colombia 272,190 0.08

136
Federated Hermes Investment Funds Public Limited CompanyPortfolio Statement As at 31 December 2020 (continued)
a Header 1a Federated Hermes Absolute Return Credit Fund (continued)
Nominal Holdings Financial assets at fair value through profit or loss
Fair Value $
% of Net Assets
. . . . .Corporate Bonds: 59.37% (2019: 63.32%) (continued)
Finland: 0.28% (2019: 0.09%)
200,000 Nokia 2�000% 15/03/2024 254,182 0�08400,000 Stora Enso 2�125% 16/06/2023 514,757 0�16100,000 Stora Enso 7�250% 15/04/2036 138,471 0�04
Total Finland 907,410 0.28
France: 0.97% (2019: 1.44%)
450,000 BNP Paribas 5�750% 24/01/2022 649,091 0�20300,000 Crown European 3�375% 15/05/2025 398,567 0�12200,000 Elis 1�750% 11/04/2024 248,944 0�07281,000 Faurecia 2�375% 15/06/2027 347,900 0�11150,000 Faurecia 2�625% 15/06/2025 186,760 0�06150,000 Loxam 3�500% 15/04/2022 185,834 0�06200,000 Nexans 3�750% 08/08/2023 263,216 0�08200,000 Renault 1�000% 08/03/2023 245,327 0�07200,000 Rexel 2�125% 15/06/2025 246,496 0�08300,000 Ubisoft Entertainment 1�289% 30/01/2023 375,240 0�12
Total France 3,147,375 0.97
Germany: 1.89% (2019: 2.19%)
300,000 ADLER Real Estate 2�125% 06/02/2024 372,283 0�111,000,000 Commerzbank 1�750% 22/01/2025 1,392,129 0�43
700,000 Fresenius Medical Care AG & Co 0�250% 29/11/2023 864,657 0�27756,000 Fresenius Medical Care US Finance II 5�750% 15/02/2021 760,219 0�23
2,250,000 Fresenius US Finance II 4�500% 15/01/2023 2,391,743 0�73300,000 IHO Verwaltungs 3�625% 15/05/2025 375,293 0�12
Total Germany 6,156,324 1.89
Hong Kong: 0.07% (2019: 0.16%)
200,000 FTL Capital 4�125% 25/04/2023 207,707 0�07
Total Hong Kong 207,707 0.07
India: 0.27% (2019: 0.27%)
700,000 Bharti Airtel International 3�375% 20/05/2021 867,427 0�27
Total India 867,427 0.27
Ireland: 1.44% (2019: 1.92%)
1,000,000 AerCap Ireland Cap/Global 3�650% 21/07/2027 1,087,288 0�33578,000 Ardagh Packaging Finance 4�750% 15/07/2027 822,445 0�25
1,150,000 Avolon Funding 3�625% 01/05/2022 1,175,251 0�361,050,000 Smurfit Kappa 1.500% 15/09/2027 1,347,056 0�42

137
Federated Hermes Investment Funds Public Limited CompanyPortfolio Statement As at 31 December 2020 (continued)
a Header 1a Federated Hermes Absolute Return Credit Fund (continued)
Nominal Holdings Financial assets at fair value through profit or loss
Fair Value $
% of Net Assets
. . . . .Corporate Bonds: 59.37% (2019: 63.32%) (continued)
Ireland: 1.44% (2019: 1.92%) (continued)
200,000 Smurfit Kappa 2.750% 01/02/2025 266,337 0�08
Total Ireland 4,698,377 1.44
Italy: 2.39% (2019: 1.07%)
500,000 Banco BPM 1�625% 18/02/2025 607,494 0�181,250,000 Enel Finance International 2�750% 06/04/2023 1,308,760 0�40
600,000 FCA Bank SpA/Ireland 1�625% 29/09/2021 826,368 0�25100,000 Infrastrutture Wireless Italiane 1�625% 21/10/2028 125,781 0�04
1,150,000 Intesa Sanpaolo 5�017% 26/06/2024 1,258,796 0�39300,000 Intesa Sanpaolo 5�148% 10/06/2030 481,013 0�15
2,600,000 Telecom Italia 1�125% 26/03/2022 3,175,377 0�98
Total Italy 7,783,589 2.39
Japan: 0.12% (2019: 0.77%)
300,000 SoftBank 4�500% 20/04/2025 395,513 0�12
Total Japan 395,513 0.12
Luxembourg: 1.87% (2019: 0.47%)
200,000 Altice Financing 3�000% 15/01/2028 236,320 0�07376,000 Altice Luxembourg SA 4�000% 15/02/2028 439,927 0�14560,000 ArcelorMittal 3�600% 16/07/2024 604,625 0�18950,000 Eurofins Scientific 2.125% 25/07/2024 1,238,380 0�38167,000 Eurofins Scientific 3.375% 30/01/2023 217,037 0�07
1,193,000 Logicor Financing 1�500% 13/07/2026 1,541,981 0�47263,000 Matterhorn Telecom 3�125% 15/09/2026 320,023 0�10400,000 Millicom International Cellular 5�125% 15/01/2028 425,760 0�13825,000 SIG Combibloc 2�125% 18/06/2025 1,063,938 0�33
Total Luxembourg 6,087,991 1.87
Malaysia: 0.09% (2019: 0.20%)
250,000 Malaysia Sukuk Global 3�179% 27/04/2026 279,804 0�09
Total Malaysia 279,804 0.09
Mexico: 1.50% (2019: 2.04%)
1,100,000 America Movil 3�125% 16/07/2022 1,142,620 0�35100,000 Cemex 2�750% 05/12/2024 123,882 0�04650,000 Cemex 5�450% 19/11/2029 716,144 0�22950,000 Orbia Advance Corp SAB de CV 4�000% 04/10/2027 1,054,082 0�33400,000 Orbia Advance Corp SAB de CV 4�875% 19/09/2022 426,300 0�13400,000 Orbia Advance Corp SAB de CV 5�500% 15/01/2048 486,100 0�15

138
Federated Hermes Investment Funds Public Limited CompanyPortfolio Statement As at 31 December 2020 (continued)
a Header 1a Federated Hermes Absolute Return Credit Fund (continued)
Nominal Holdings Financial assets at fair value through profit or loss
Fair Value $
% of Net Assets
. . . . .Corporate Bonds: 59.37% (2019: 63.32%) (continued)
Mexico: 1.50% (2019: 2.04%) (continued)
800,000 Petroleos Mexicanos 2�750% 21/04/2027 923,751 0�28
Total Mexico 4,872,879 1.50
Netherlands: 3.97% (2019: 3.05%)
1,000,000 ABN AMRO Bank 7�125% 06/07/2022 1,354,381 0�42700,000 Ashland Services 2�000% 30/01/2028 857,556 0�26950,000 ING Groep 3�150% 29/03/2022 982,658 0�30300,000 NXP 2�700% 01/05/2025 323,150 0�10
4,875,000 NXP 3�875% 01/09/2022 5,139,173 1�58650,000 NXP 4�625% 01/06/2023 710,864 0�22100,000 Q-Park Holding 1�500% 01/03/2025 118,493 0�03165,000 Q-Park Holding 2�000% 01/03/2027 195,899 0�06200,000 Trivium Packaging 3�750% 15/08/2026 252,510 0�08276,000 United Group 3�625% 15/02/2028 331,790 0�10859,000 VEON 3�375% 25/11/2027 883,576 0�27650,000 VEON 4�000% 09/04/2025 689,114 0�21893,000 VZ Vendor Financing 2�875% 15/01/2029 1,090,991 0�34
Total Netherlands 12,930,155 3.97
Norway: 0.35% (2019: 2.19%)
150,000 Aker BP 3�750% 15/01/2030 158,138 0�05700,000 DNB 1�375% 12/06/2023 982,656 0�30
Total Norway 1,140,794 0.35
People's Republic of China: 0.21% (2019: 0.20%)
650,000 Country Garden 5�125% 17/01/2025 683,821 0�21
Total People's Republic of China 683,821 0.21
Poland: 0.18% (2019: 0.00%)
469,000 Canpack SA Eastern Land 2�375% 01/11/2027 593,212 0�18
Total Poland 593,212 0.18
Portugal: 0.50% (2019: 0.00%)
1,250,000 EDP Finance 2�375% 23/03/2023 1,616,435 0�50
Total Portugal 1,616,435 0.50
Russian Federation: 0.80% (2019: 1.87%)
240,000 Gaz Capital 4�250% 06/04/2024 350,454 0�11

139
Federated Hermes Investment Funds Public Limited CompanyPortfolio Statement As at 31 December 2020 (continued)
a Header 1a Federated Hermes Absolute Return Credit Fund (continued)
Nominal Holdings Financial assets at fair value through profit or loss
Fair Value $
% of Net Assets
. . . . .Corporate Bonds: 59.37% (2019: 63.32%) (continued)
Russian Federation: 0.80% (2019: 1.87%) (continued)
400,000 Novolipetsk Steel Via Steel Funding DAC 4�000% 21/09/2024 429,761 0�13300,000 Novolipetsk Steel Via Steel Funding DAC 4�700% 30/05/2026 340,210 0�10400,000 Sberbank of Russia 5�125% 29/10/2022 421,910 0�13400,000 Severstal Via Steel Capital 3�150% 16/09/2024 419,125 0�13600,000 Severstal Via Steel Capital 5�900% 17/10/2022 648,150 0�20
Total Russian Federation 2,609,610 0.80
South Africa: 0.70% (2019: 0.70%)
900,000 Anglo American Capital 3�375% 11/03/2029 1,391,688 0�43177,000 Sappi Papier 3�125% 15/04/2026 211,645 0�06675,000 Sappi Papier 7�500% 15/06/2032 668,250 0�21
Total South Africa 2,271,583 0.70
Spain: 1.24% (2019: 0.31%)
900,000 Banco Santander 2�500% 18/03/2025 1,194,629 0�36800,000 Cellnex Telecom 0�750% 20/11/2031 947,283 0�29500,000 Cellnex Telecom 1�000% 20/04/2027 606,039 0�19400,000 Grifols 1�625% 15/02/2025 491,622 0�15544,000 Grifols 2�250% 15/11/2027 676,927 0�21100,000 Lorca Telecom Bond 4�000% 18/09/2027 129,134 0�04
Total Spain 4,045,634 1.24
Sweden: 0.46% (2019: 0.00%)
1,010,000 Volvo 3�250% 18/05/2021 1,253,476 0�38200,000 Volvo Car 2�125% 02/04/2024 253,101 0�08
Total Sweden 1,506,577 0.46
Switzerland: 1.01% (2019: 0.20%)
1,750,000 Credit Suisse 3�000% 27/05/2022 2,481,086 0�76750,000 Credit Suisse 3�800% 09/06/2023 808,216 0�25
Total Switzerland 3,289,302 1.01
Turkey: 0.77% (2019: 0.59%)
200,000 Akbank 5�125% 31/03/2025 203,000 0�06150,000 Akbank Turk 5�000% 24/10/2022 152,155 0�04200,000 Arcelik 5�000% 03/04/2023 208,080 0�06200,000 Coca-Cola Icecek 4�215% 19/09/2024 211,000 0�07800,000 Turk Telekomunikasyon 4�875% 19/06/2024 829,584 0�26400,000 Turkiye Garanti Bankasi 5�875% 16/03/2023 416,381 0�13

140
Federated Hermes Investment Funds Public Limited CompanyPortfolio Statement As at 31 December 2020 (continued)
a Header 1a Federated Hermes Absolute Return Credit Fund (continued)
Nominal Holdings Financial assets at fair value through profit or loss
Fair Value $
% of Net Assets
. . . . .Corporate Bonds: 59.37% (2019: 63.32%) (continued)
Turkey: 0.77% (2019: 0.59%) (continued)
486,000 Turkiye Vakiflar Bankasi 5.250% 05/02/2025 480,017 0�15
Total Turkey 2,500,217 0.77
United Kingdom: 4.12% (2019: 5.18%)
1,000,000 Anglo American Capital 3�250% 03/04/2023 1,313,700 0�40531,000 Anglo American Capital 4�125% 15/04/2021 535,273 0�17507,000 Barclays Bank 1�875% 08/12/2023 654,602 0�20549,000 Centrica 6�375% 10/03/2022 802,837 0�25300,000 FCE Bank 1�660% 11/02/2021 367,524 0�11442,000 FCE Bank 2�727% 03/06/2022 612,578 0�19
1,000,000 Fiat Chrysler Automobiles 5�250% 15/04/2023 1,073,750 0�33800,000 Fiat Chrysler Automobiles 5�250% 15/04/2023 859,000 0�26
1,000,000 Fiat Chrysler Finance Europe 4�750% 22/03/2021 1,236,293 0�38200,000 International Consolidated Airlines 0�500% 04/07/2023 227,847 0�07100,000 Marks & Spencer 3�750% 19/05/2026 139,876 0�05462,000 Neptune Energy 6�625% 15/05/2025 458,198 0�14200,000 Pension Insurance 4�625% 07/05/2031 324,439 0�10150,000 Pension Insurance 5�625% 20/09/2030 259,074 0�08
1,200,000 Phoenix Group 4�125% 20/07/2022 1,711,858 0�531,209,000 Rothesay Life 3�375% 12/07/2026 1,765,282 0�54
100,000 Tesco 2�500% 02/05/2025 146,646 0�04100,000 Tesco 3�500% 25/07/2025 147,052 0�04540,000 Tesco 6�125% 24/02/2022 785,428 0�24
Total United Kingdom 13,421,257 4.12
United States: 30.15% (2019: 33.83%)
1,250,000 Abbvie 0�500% 01/06/2021 1,533,799 0�471,000,000 Abbvie 3�450% 15/03/2022 1,031,565 0�322,307,000 AbbVie 4�550% 15/03/2035 2,924,545 0�90
207,000 AES Corporation 2�450% 15/01/2031 209,974 0�06811,000 AES Corporation 3�950% 15/07/2030 918,283 0�28
1,232,000 Air Lease 2�750% 15/01/2023 1,273,849 0�391,175,000 Air Lease 3�625% 01/12/2027 1,270,308 0�39
968,000 Aircastle 4�125% 01/05/2024 1,024,832 0�31100,000 Aircastle 4�250% 15/06/2026 105,440 0�03900,000 Alcoa Nederland 6�125% 15/05/2028 984,938 0�30300,000 Ally Financial 3�875% 21/05/2024 328,980 0�10
1,930,000 Ally Financial 4�625% 30/03/2025 2,201,992 0�68200,000 Ally Financial 5�125% 30/09/2024 230,767 0�07200,000 Ally Financial 5�750% 20/11/2025 233,047 0�07374,000 Apache 4�250% 15/01/2030 393,401 0�12578,000 Ardagh Packaging Finance 2�125% 15/08/2026 710,098 0�22
2,000,000 Ball Corporation 0�875% 15/03/2024 2,454,441 0�75500,000 Ball Corporation 4�000% 15/11/2023 533,438 0�16600,000 Berry Global 1�000% 15/01/2025 742,389 0�23

141
Federated Hermes Investment Funds Public Limited CompanyPortfolio Statement As at 31 December 2020 (continued)
a Header 1a Federated Hermes Absolute Return Credit Fund (continued)
Nominal Holdings Financial assets at fair value through profit or loss
Fair Value $
% of Net Assets
. . . . .Corporate Bonds: 59.37% (2019: 63.32%) (continued)
United States: 30.15% (2019: 33.83%) (continued)
1,000,000 Berry Global 1�500% 15/01/2027 1,250,774 0�39400,000 Calpine 4�500% 15/02/2028 416,600 0�13459,000 Calpine 5�125% 15/03/2028 483,504 0�15797,000 Catalent Pharma Solutions 2�375% 01/03/2028 983,761 0�30
80,000 CCO 4�250% 01/02/2031 84,409 0�03425,000 CCO 4�500% 01/05/2032 454,312 0�14200,000 CCO 4�750% 01/03/2030 216,050 0�07650,000 Celanese US 1�125% 26/09/2023 812,646 0�25415,000 Celanese US 3�500% 08/05/2024 449,620 0�14403,000 CenturyLink 4�000% 15/02/2027 416,650 0�13100,000 CenturyLink 6�875% 15/01/2028 116,168 0�03875,000 Cf Industries 3�450% 01/06/2023 913,281 0�28
1,550,000 Charter Communications Operating 4�464% 23/07/2022 1,634,520 0�50200,000 Charter Communications Operating 4�500% 01/02/2024 221,963 0�07250,000 Charter Communications Operating 4�908% 23/07/2025 290,534 0�09250,000 Charter Communications Operating 5�375% 01/05/2047 312,502 0�10200,000 CIT 4�750% 16/02/2024 219,063 0�07
2,255,000 CIT 5�000% 01/08/2023 2,467,816 0�76114,000 Citylink 7�500% 01/04/2024 129,247 0�04362,000 Clearway Energy 4�750% 15/03/2028 388,585 0�12433,000 Clearway Energy 5�000% 15/09/2026 449,696 0�14302,000 Cleveland-Cliffs 6�750% 15/03/2026 326,538 0�10
57,000 Cleveland-Cliffs 7�000% 15/03/2027 55,433 0�02100,000 Colfax Corporation 6�000% 15/02/2024 103,877 0�03
2,059,000 Crown European 0�750% 15/02/2023 2,518,281 0�77750,000 Crown European 2�250% 01/02/2023 941,720 0�29
1,283,000 Crown European 2�875% 01/02/2026 1,686,046 0�52600,000 CSC 3�375% 15/02/2031 589,500 0�18450,000 D�R Horton 4�750% 15/02/2023 484,470 0�15234,000 DCP Midstream Operating 3�875% 15/03/2023 241,605 0�07900,000 DCP Midstream Operating 5�125% 15/05/2029 999,729 0�31
65,000 DCP Midstream Operating 5�600% 01/04/2044 67,308 0�0250,000 Dell 5�400% 10/09/2040 56,510 0�02
2,478,000 Dell 6�020% 15/06/2026 3,025,100 0�932,430,000 Dell International LLC/EMC 5�450% 15/06/2023 2,688,505 0�82
350,000 Domtar 4�400% 01/04/2022 360,140 0�11461,000 Domtar 6�250% 01/09/2042 554,810 0�17
1,200,000 EMC 3�375% 01/06/2023 1,260,540 0�39224,000 EnLink Midstream Partners 4�150% 01/06/2025 218,960 0�07443,000 EnLink Midstream Partners 5�050% 01/04/2045 354,925 0�11266,000 EnLink Midstream Partners 5�450% 01/06/2047 214,867 0�07352,000 EnLink Midstream Partners 5�600% 01/04/2044 283,992 0�09100,000 EQM Midstream Partners 4�750% 15/07/2023 105,323 0�03473,000 EQM Midstream Partners 6�500% 15/07/2048 492,660 0�15623,000 EQT 3�900% 01/10/2027 620,087 0�19200,000 Ford Motor Credit 3�200% 15/01/2021 200,475 0�06500,000 Ford Motor Credit LLC 2�979% 03/08/2022 508,975 0�16
1,000,000 Ford Motor Credit LLC 5�085% 07/01/2021 1,002,500 0�30

142
Federated Hermes Investment Funds Public Limited CompanyPortfolio Statement As at 31 December 2020 (continued)
a Header 1a Federated Hermes Absolute Return Credit Fund (continued)
Nominal Holdings Financial assets at fair value through profit or loss
Fair Value $
% of Net Assets
. . . . .Corporate Bonds: 59.37% (2019: 63.32%) (continued)
United States: 30.15% (2019: 33.83%) (continued)
750,000 General Motors Financial 4�200% 01/03/2021 751,850 0�231,350,000 Goldman Sachs 3�250% 01/02/2023 1,770,682 0�54
400,000 Goodyear Tire & Rubber 4�875% 15/03/2027 409,750 0�13450,000 Goodyear Tire & Rubber 5�125% 15/11/2023 451,125 0�14
3,553,000 HCA 4�750% 01/05/2023 3,876,094 1�19132,000 HCA 7�500% 15/11/2095 172,827 0�05860,000 Hess 3�500% 15/07/2024 905,614 0�28
1,059,000 Hess 4�300% 01/04/2027 1,168,450 0�36450,000 Huntsman International 4�250% 01/04/2025 619,681 0�19400,000 Huntsman International 4�500% 01/05/2029 461,660 0�14250,000 Huntsman International 5�125% 15/04/2021 307,080 0�09350,000 IQVIA 2�250% 15/01/2028 433,167 0�13500,000 IQVIA 3�250% 15/03/2025 619,804 0�19484,000 KB Home 4�800% 15/11/2029 532,097 0�16900,000 Kinder Morgan Energy Partners 3�500% 01/03/2021 900,000 0�28405,000 Kinder Morgan Energy Partners 4�700% 01/11/2042 465,195 0�14
2,225,000 Kinder Morgan Energy Partners 5�000% 01/10/2021 2,273,463 0�70501,000 Kinder Morgan Energy Partners 5�625% 01/09/2041 612,754 0�19450,000 Kraft Heinz Foods 2�250% 25/05/2028 583,345 0�18100,000 Kraft Heinz Foods 3�500% 06/06/2022 104,428 0�03
35,000 Kraft Heinz Foods 4�250% 01/03/2031 39,059 0�01315,000 Kraft Heinz Foods 4�375% 01/06/2046 341,342 0�11
36,000 L Brands 7�600% 15/07/2037 38,880 0�013,075,000 Lennar 4�125% 15/01/2022 3,153,797 0�971,875,000 Lennar 4�750% 29/11/2027 2,218,219 0�68
249,000 Lennar 5�000% 15/06/2027 293,820 0�09500,000 Levi Strauss 3�375% 15/03/2027 634,613 0�19357,000 Marathon Oil 2�800% 01/11/2022 367,063 0�11
50,000 Marathon Oil 3�850% 01/06/2025 53,652 0�02175,000 Marathon Oil 5�200% 01/06/2045 199,611 0�06300,000 Marathon Oil 6�600% 01/10/2037 371,225 0�11100,000 MPLX 4�125% 01/03/2027 115,426 0�03740,000 MPLX 4�700% 15/04/2048 880,402 0�27318,000 MPLX 4�875% 01/12/2024 365,057 0�11897,000 MPT Operating Partnership 2�550% 05/12/2023 1,248,997 0�38209,000 MPT Operating Partnership 3�692% 05/06/2028 310,116 0�10800,000 Mylan 3�125% 15/01/2023 840,303 0�26
50,000 Navient 5�875% 25/10/2024 53,250 0�0250,000 Navient 6�750% 25/06/2025 54,437 0�02
400,000 Netflix 3.625% 15/06/2025 429,046 0�131,700,000 Netflix 5.375% 01/02/2021 1,709,563 0�52
327,000 Novelis 4�750% 30/01/2030 352,911 0�1174,000 NRG Energy 2�450% 02/12/2027 77,958 0�02
500,000 Occidental Petroleum 3�500% 15/08/2029 458,385 0�14183,000 Occidental Petroleum 4�100% 15/02/2047 149,936 0�05
50,000 OI European Group 4�000% 15/03/2023 51,156 0�023,000 Onemain Financial 4�000% 15/09/2030 3,117 -
995,000 Plains All American Pipeline 2�850% 31/01/2023 1,030,981 0�32

143
Federated Hermes Investment Funds Public Limited CompanyPortfolio Statement As at 31 December 2020 (continued)
a Header 1a Federated Hermes Absolute Return Credit Fund (continued)
Nominal Holdings Financial assets at fair value through profit or loss
Fair Value $
% of Net Assets
. . . . .Corporate Bonds: 59.37% (2019: 63.32%) (continued)
United States: 30.15% (2019: 33.83%) (continued)
338,000 Post 4�625% 15/04/2030 355,985 0�11305,000 Range Resources 4�875% 15/05/2025 288,672 0�09
43,000 Range Resources 9�250% 01/02/2026 45,000 0�01160,000 Seagate HDD Cayman 3�375% 15/07/2031 161,166 0�05150,000 Seagate HDD Cayman 4�750% 01/01/2025 163,500 0�05
1,300,000 Sealed Air 4�500% 15/09/2023 1,737,301 0�53100,000 Sealed Air 6�875% 15/07/2033 132,313 0�04
1,288,000 Silgan 2�250% 01/06/2028 1,603,464 0�49500,000 Southwest Airlines 5�250% 04/05/2025 579,529 0�18100,000 Springleaf Finance 6�875% 15/03/2025 116,312 0�04768,750 Sprint Spectrum 3�360% 20/09/2021 777,179 0�24200,000 Steel Dynamics 2�400% 15/06/2025 212,795 0�07149,000 Tenet Healthcare 4�625% 15/06/2028 156,357 0�05
1,000,000 Tenet Healthcare 4�875% 01/01/2026 1,047,350 0�32333,000 Terraform Power 4�750% 15/01/2030 357,046 0�11726,000 T-Mobile USA 2�550% 15/02/2031 763,258 0�23
50,000 T-Mobile USA 4�000% 15/04/2022 51,718 0�02100,000 T-Mobile USA 4�500% 15/04/2050 123,526 0�04370,000 T-Mobile USA 7�875% 15/09/2023 428,848 0�13
1,050,000 Toll Brothers Finance 4�350% 15/02/2028 1,169,238 0�36250,000 Toll Brothers Finance 4�375% 15/04/2023 265,937 0�08928,000 Toll Brothers Finance 5�625% 15/01/2024 1,028,822 0�32100,000 Vulcan Materials 3�500% 01/06/2030 114,953 0�04150,000 Vulcan Materials 4�500% 15/06/2047 186,430 0�06427,000 WPX Energy 4�500% 15/01/2030 453,260 0�14550,000 WPX Energy 5�250% 15/10/2027 583,720 0�18194,000 WPX Energy 5�750% 01/06/2026 204,234 0�06
Total United States 98,149,964 30.15
Zambia: 0.07% (2019: 0.00%)
200,000 First Quantum Minerals 6�875% 01/03/2026 208,875 0�07
Total Zambia 208,875 0.07
Total Corporate Bonds 193,258,704 59.37
Government Bonds: 12.27% (2019: 6.44%)
Brazil: 0.09% (2019: 0.00%)
273,000 Petrobras Global Finance 5�093% 15/01/2030 305,419 0�09
Total Brazil 305,419 0.09

144
Federated Hermes Investment Funds Public Limited CompanyPortfolio Statement As at 31 December 2020 (continued)
a Header 1a Federated Hermes Absolute Return Credit Fund (continued)
Nominal Holdings Financial assets at fair value through profit or loss
Fair Value $
% of Net Assets
. . . . .Government Bonds: 12.27% (2019: 6.44%) (continued)
Chile: 0.12% (2019: 0.95%)
375,000 Chile Government International Bond 2�250% 30/10/2022 388,716 0�12
Total Chile 388,716 0.12
Colombia: 0.00% (2019: 0.24%) - -
India: 0.15% (2019: 0.20%)
200,000 Export-Import Bank of India 3�250% 15/01/2030 214,440 0�07250,000 Export-Import Bank of India 3�875% 12/03/2024 268,368 0�08
Total India 482,808 0.15
People's Republic of China: 0.06% (2019: 0.32%)
200,000 China Government International Bond 1�875% 03/12/2022 206,118 0�06
Total People's Republic of China 206,118 0.06
Peru: 0.19% (2019: 0.44%)
550,000 Peruvian Government International Bond 2�844% 20/06/2030 610,808 0�19
Total Peru 610,808 0.19
Philippines: 0.30% (2019: 0.22%)
800,000 Philippine Government International Bond 0�010% 03/02/2023 979,310 0�30
Total Philippines 979,310 0.30
Republic of South Korea: 0.00% (2019: 0.40%) - -
South Africa: 0.00% (2019: 0.43%) - -
United States: 11.36% (2019: 3.24%)
37,000,000 United States Treasury Bill 0�010% 17/06/2021 36,987,780 11�36
Total United States 36,987,780 11.36
Total Government Bonds 39,960,959 12.27

145
Federated Hermes Investment Funds Public Limited CompanyPortfolio Statement As at 31 December 2020 (continued)
a Header 1a Federated Hermes Absolute Return Credit Fund (continued)
Nominal Holdings Financial assets at fair value through profit or loss
Fair Value $
% of Net Assets
. . . . .Floating Rate Notes: 18.85% (2019: 21.77%)
Australia: 1.93% (2019: 2.43%)
4,200,000 BHP Billiton Finance 22/10/2077 6,278,985 1�93
Total Australia 6,278,985 1.93
Austria: 0.15% (2019: 0.19%)
400,000 BAWAG Group 31/12/2049 501,912 0�15
Total Austria 501,912 0.15
Belgium: 0.99% (2019: 1.21%)
1,300,000 Solvay 31/12/2049 1,638,333 0�501,200,000 Solvay 31/12/2049 1,591,785 0�49
Total Belgium 3,230,118 0.99
Brazil: 0.31% (2019: 0.61%)
300,000 Banco BTG Pactual 15/02/2029 327,078 0�10662,000 Itau Unibanco 21/11/2029 685,342 0�21
Total Brazil 1,012,420 0.31
Canada: 1.12% (2019: 1.07%)
3,545,000 Enbridge 15/07/2077 3,639,436 1�12
Total Canada 3,639,436 1.12
Denmark: 0.10% (2019: 0.00%)
250,000 Orsted 09/12/3019 314,567 0�10
Total Denmark 314,567 0.10
France: 2.24% (2019: 1.38%)
900,000 BNP Paribas 31/12/2049 910,039 0�28800,000 Credit Agricole 31/12/2049 1,002,944 0�31
1,500,000 Electricite de France 31/12/2049 2,342,355 0�72400,000 Groupama Assurances Mutuelles 31/12/2049 565,464 0�17
2,000,000 Veolia Environnement 30/12/2049 2,479,218 0�76
Total France 7,300,020 2.24
Germany: 0.69% (2019: 0.95%)
600,000 Commerzbank 31/12/2049 785,527 0�24200,000 Commerzbank 31/12/2049 277,598 0�09

146
Federated Hermes Investment Funds Public Limited CompanyPortfolio Statement As at 31 December 2020 (continued)
a Header 1a Federated Hermes Absolute Return Credit Fund (continued)
Nominal Holdings Financial assets at fair value through profit or loss
Fair Value $
% of Net Assets
. . . . . Floating Rate Notes: 18.85% (2019: 21.77%) (continued) Germany: 0.69% (2019: 0.95%) (continued)
200,000 Deutsche Bank 31/12/2049 201,000 0�06606,000 Deutsche Postbank Funding Trust I 31/12/2049 698,519 0�21243,000 Deutsche Postbank Funding Trust III 31/12/2049 279,810 0�09
Total Germany 2,242,454 0.69
India: 0.36% (2019: 0.19%)
1,100,000 Network i2i 31/12/2049 1,172,050 0�36
Total India 1,172,050 0.36
Ireland: 0.44% (2019: 1.11%)
700,000 Aercap Holdings 10/10/2079 719,884 0�22716,000 Bank of Ireland 19/09/2027 729,481 0�22
Total Ireland 1,449,365 0.44
Italy: 0.92% (2019: 0.26%)
400,000 Enel 24/11/2078 512,056 0�16552,000 Intesa Sanpaolo 31/12/2049 642,390 0�20846,000 UniCredit 31/12/2049 934,199 0�29486,000 Unione di Banche 12/07/2029 640,131 0�19200,000 Unipolsai Assicurazioni 31/12/2049 267,345 0�08
Total Italy 2,996,121 0.92
Luxembourg: 0.12% (2019: 0.11%)
100,000 Eurofins Scientific 31/12/2049 128,152 0�04400,000 Mitsubishi UFJ Investor Services & Banking 15/12/2050 249,604 0�08
Total Luxembourg 377,756 0.12
Mexico: 0.14% (2019: 0.16%)
200,000 Banco Mercantil del Norte 31/12/2049 217,250 0�07200,000 Banco Mercantil del Norte 31/12/2049 226,250 0�07
Total Mexico 443,500 0.14
Netherlands: 1.43% (2019: 1.58%)
300,000 ABN AMRO Bank 31/12/2049 390,997 0�12800,000 ABN AMRO Bank 31/12/2049 1,051,960 0�32
1,200,000 Cooperatieve Rabobank 31/12/2049 1,484,869 0�46387,000 Tennet Holding 31/12/2049 494,230 0�15

147
Federated Hermes Investment Funds Public Limited CompanyPortfolio Statement As at 31 December 2020 (continued)
a Header 1a Federated Hermes Absolute Return Credit Fund (continued)
Nominal Holdings Financial assets at fair value through profit or loss
Fair Value $
% of Net Assets
. . . . .Floating Rate Notes: 18.85% (2019: 21.77%) (continued)
Netherlands: 1.43% (2019: 1.58%) (continued)
1,000,000 Ziggo 17/01/2029 1,222,840 0�38
Total Netherlands 4,644,896 1.43
Norway: 0.36% (2019: 0.55%)
1,113,000 DNB 31/12/2049 1,156,783 0�36
Total Norway 1,156,783 0.36
Portugal: 0.28% (2019: 0.21%)
400,000 Caixa Geral de Depositos 31/12/2049 540,044 0�17300,000 Energias de Portugal 20/07/2080 366,628 0�11
Total Portugal 906,672 0.28
Russian Federation: 0.00% (2019: 0.16%) - -
Spain: 0.42% (2019: 0.18%)
600,000 Bankia 31/12/2049 760,651 0�24200,000 Ibercaja Banco 23/07/2030 238,167 0�07300,000 Telefonica Europe 31/12/2049 373,030 0�11
Total Spain 1,371,848 0.42
Sweden: 0.24% (2019: 0.00%)
650,000 Samhallsbygg 31/12/2049 792,496 0�24
Total Sweden 792,496 0.24
Switzerland: 0.37% (2019: 0.34%)
400,000 Argentum Netherlands 15/08/2050 455,150 0�14319,000 Credit Suisse 31/12/2049 321,361 0�10400,000 Credit Suisse 31/12/2049 417,000 0�13
Total Switzerland 1,193,511 0.37
United Kingdom: 2.20% (2019: 2.55%)
1,000,000 Barclays 06/10/2023 1,405,959 0�43100,000 Barclays Bank 31/12/2049 89,731 0�03790,000 Barclays Bank 31/12/2049 992,674 0�30250,000 Barclays Bank 31/12/2049 314,138 0�10200,000 Barclays Bank 31/12/2049 296,081 0�09543,000 BP Capital Markets 31/12/2049 799,315 0�24350,000 HSBC Bank 31/12/2049 309,264 0�10

148
Federated Hermes Investment Funds Public Limited CompanyPortfolio Statement As at 31 December 2020 (continued)
a Header 1a Federated Hermes Absolute Return Credit Fund (continued)
Nominal Holdings Financial assets at fair value through profit or loss
Fair Value $
% of Net Assets
. . . . .Floating Rate Notes: 18.85% (2019: 21.77%) (continued)
United Kingdom: 2.20% (2019: 2.55%) (continued)
530,000 National Westminster Bank 31/12/2049 493,032 0�15420,000 National Westminster Bank 31/12/2049 390,718 0�12598,000 Phoenix Group 31/12/2049 875,364 0�27437,000 Rothesay Life 31/12/2049 673,493 0�21488,000 Royal Bank of Scotland Group 31/12/2049 535,761 0�16
Total United Kingdom 7,175,530 2.20
United States: 4.04% (2019: 6.53%)
100,000 American International 15/03/2067 109,814 0�03840,000 CIT 31/12/2049 857,850 0�26994,987 CSC 15/04/2027 988,769 0�30284,000 Energy Transfer Operating 31/12/2049 226,490 0�07125,000 Energy Transfer Operating 31/12/2049 119,063 0�04
2,180,000 Enterprise Products Operating 15/02/2078 2,206,677 0�68694,000 General Electric 31/12/2049 646,461 0�20400,000 General Motors Financial 31/12/2049 436,000 0�13450,000 Goldman Sachs Group 31/10/2022 451,870 0�14
1,200,000 Hanesbrands 16/12/2024 1,197,000 0�37500,000 Hanesbrands Finance Luxembourg 15/06/2024 644,022 0�20989,822 Ineos Group 31/10/2024 1,198,065 0�37974,684 IQVIA 03/03/2024 1,191,745 0�37400,000 JPMorgan Chase 31/12/2049 397,478 0�12350,000 Liberty Mutual 23/05/2059 442,517 0�14
1,600,000 Plains All American Pipeline 31/12/2049 1,304,000 0�40733,513 Reynolds 05/02/2023 731,679 0�22
Total United States 13,149,500 4.04
Total Floating Rate Notes 61,349,940 18.85
Asset Backed Securities: 4.42% (2019: 4.09%)
Luxembourg: 0.34% (2019: 0.00%)
900,000 SC Germany S�A� Compartment Consumer 2020-1 14/11/2034 1,103,082 0�34
Total Luxembourg 1,103,082 0.34
Netherlands: 0.71% (2019: 0.00%)
907,353 Dutch Property Finance 2020-1 28/07/2054 1,108,921 0�341,000,000 Dutch Property Finance 2020-2 28/01/2058 1,226,128 0�37
Total Netherlands 2,335,049 0.71

149
Federated Hermes Investment Funds Public Limited CompanyPortfolio Statement As at 31 December 2020 (continued)
a Header 1a Federated Hermes Absolute Return Credit Fund (continued)
Nominal Holdings Financial assets at fair value through profit or loss
Fair Value $
% of Net Assets
. . . . .Asset Backed Securities: 4.42% (2019: 4.09%) (continued)
United Kingdom: 3.37% (2019: 4.09%)
427,913 Castell 2018-1 Class A 25/01/2046 586,619 0�181,434,973 Castell 2020-1 Class A 25/09/2052 1,971,583 0�611,081,173 CMF 2020-1 16/01/2057 1,479,145 0�45
835,672 Friary No� 6 21/11/2067 1,154,347 0�3550,186 Globaldrive Auto Receivables UK 2018-A 20/06/2026 68,619 0�02
1,953,571 Ripon Mortgages 20/08/2056 2,668,743 0�821,247,124 Together 2019-1 Class A 15/07/2061 1,713,998 0�53
964,750 Towd Point Mortgage Funding 2020-A14X 20/05/2045 1,318,621 0�41
Total United Kingdom 10,961,675 3.37
Total Asset Backed Securities 14,399,806 4.42
Financial Derivative Instruments: 4.51% (2019: 3.73%)
Credit Default Swaps: 2.00% (2019: 2.25%)
Credit Default Swaps: Pay Fixed (Buy Protection) - Unrealised Gains: 0.03% (2019: 0.05%)
United States: 0.03% (2019: 0.05%)
5,700,000 Freeport-Mcmoran 1% 20/12/2025 (Goldman Sachs) 18,507 0�01167,000 L Brands 1% 20/12/2025 (Goldman Sachs) 9,635 -333,000 L Brands 1% 20/12/2025 (Goldman Sachs) 19,213 0�01250,000 Macy's Retail Holdings 1% 20/06/2025 (BNP Paribas) 41,839 0�01
Total United States 89,194 0.03
Total Credit Default Swaps: Pay Fixed (Buy Protection) - Unrealised Gains 89,194 0.03
Credit Default Swaps: Receive Fixed (Sell Protection) - Unrealised Gains: 1.97% (2019: 2.20%)
European Union: 0.74% (2019: 1.56%)
(75,000,000) Itraxx Europe Index Series 1% 20/12/2025 (Morgan Stanley) 2,389,685 0�74(200,000) Jaguar Land Rover Automotive 5% 20/12/2021 (Goldman Sachs) 2,628 -(400,000) Sainsbury's 1% 20/12/2025 (Goldman Sachs) 8,708 -
Total European Union 2,401,021 0.74
United Kingdom: 0.23% (2019: 0.00%)
(2,500,000) Anglo American Capital 5% 20/12/2023 (Credit Suisse) 408,938 0�13(1,000,000) HeidelbergCement 5% 20/12/2023 (Credit Suisse) 165,430 0�05
(800,000) Media Secured Finance 5% 20/12/2025 (Credit Suisse) 105,847 0�03(3,750,000) Telefonica Emisiones 1% 20/12/2023 (Credit Suisse) 63,215 0�02

150
Federated Hermes Investment Funds Public Limited CompanyPortfolio Statement As at 31 December 2020 (continued)
a Header 1a Federated Hermes Absolute Return Credit Fund (continued)
Nominal Holdings Financial assets at fair value through profit or loss
Fair Value $
% of Net Assets
. . . . .Financial Derivative Instruments: 4.51% (2019: 3.73%) (continued)
Credit Default Swaps: 2.00% (2019: 2.25%) (continued)
Credit Default Swaps: Receive Fixed (Sell Protection) - Unrealised Gains: 1.97% (2019: 2.20%) (continued)
United Kingdom: 0.23% (2019: 0.00%) (continued)(1,000,000) Telefonica Emisiones 1% 20/12/2023 (Credit Suisse) 16,857 -
Total United Kingdom 760,287 0.23
United States: 1.00% (2019: 0.64%)
(275,000) Altice France 5% 20/12/2025 (JP Morgan) 27,973 0�01(4,000,000) ArcelorMittal 5% 20/12/2023 (JP Morgan) 590,594 0�18(2,500,000) AT&T 1% 20/06/2022 (BNP Paribas) 22,607 0�01(3,000,000) CCP CDX 1% 20/12/2024 (Morgan Stanley) 49,368 0�02(3,500,000) CNH Industrial Finance 5% 20/12/2023 (JP Morgan) 572,545 0�18(1,000,000) CNH Industrial Finance 5% 20/12/2023 (Goldman Sachs) 163,584 0�05
(600,000) Fiat Chrysler 5% 20/12/2023 (JP Morgan) 87,646 0�03(1,500,000) Ford Motor 5% 20/12/2023 (Goldman Sachs) 125,732 0�04(3,550,000) General Motors 5% 20/12/2023 (JP Morgan) 441,371 0�14
(300,000) HCA 5% 20/12/2025 (Goldman Sachs) 56,015 0�02(2,500,000) HeidelbergCement 5% 20/12/2023 (Goldman Sachs) 413,575 0�13(1,600,000) Next 1% 20/12/2023 (JP Morgan) 11,975 -(2,600,000) Peugeot 5% 20/12/2023 (Merrill Lynch) 399,809 0�12(2,250,000) Tesco 1% 20/12/2023 (Merrill Lynch) 47,446 0�01
(200,000) UPC 5% 20/12/2025 (JP Morgan) 31,726 0�01(42,000) UPC 5% 20/12/2025 (JP Morgan) 6,662 -(58,000) UPC 5% 20/12/2025 (JP Morgan) 9,201 -
(150,000) UPC 5% 20/12/2025 (JP Morgan) 23,795 0�01(100,000) UPC 5% 20/12/2025 (JP Morgan) 15,863 -
(2,000,000) Verizon Communications 1% 20/06/2022 (Goldman Sachs) 21,706 0�01(300,000) Virgin Media Secured Finance 5% 20/12/2025 (JP Morgan) 39,692 0�01(100,000) Virgin Media Secured Finance 5% 20/12/2025 (Goldman Sachs) 13,231 -
(4,000,000) Volkswagen International Finance 1% 20/12/2023 (JP Morgan) 77,057 0�02
Total United States 3,249,173 1.00
Total Credit Default Swaps: Receive Fixed (Sell Protection) - Unrealised Gains 6,410,481 1.97
Total Credit Default Swaps 6,499,675 2.00

151
Federated Hermes Investment Funds Public Limited CompanyPortfolio Statement As at 31 December 2020 (continued)
a Header 1a Federated Hermes Absolute Return Credit Fund (continued)
Nominal Holdings Financial assets at fair value through profit or loss
Fair Value $
% of Net Assets
. . . . .Financial Derivative Instruments: 4.51% (2019: 3.73%) (continued)
Open Purchased Swaptions - Unrealised Gains: 0.06% (2019: 0.00%)
France: 0.06% (2019: 0.00%)
50,000,000 SWO Itraxx Europe Crossover 4% 17/03/2021 (BNP Paribas) 185,619 0�06
Total France 185,619 0.06
Total Open Purchased Swaptions - Unrealised Gains 185,619 0.06
Forward Currency Contracts: 2.45% (2019: 1.32%)
CounterpartyCurrency Buys
Currency Sells
Currency Rate
Maturity Date
Unrealised Gain
$
% of Net Assets
Northern Trust GBP 214,160,913 USD 285,482,922 1�3330 29/01/2021 7,312,244 2�25Northern Trust GBP 11,812,939 USD 15,747,002 1�3330 29/01/2021 403,338 0�12Northern Trust GBP 7,291,458 USD 9,719,733 1�3330 29/01/2021 248,957 0�08Northern Trust GBP 83,815 USD 111,718 1�3329 29/01/2021 2,871 -Northern Trust GBP 174,928 USD 236,686 1�3530 29/01/2021 2,471 -Northern Trust EUR 1,805,149 USD 2,207,589 1�2229 29/01/2021 2,226 -Northern Trust GBP 102,396 USD 138,547 1�3530 29/01/2021 1,446 -Northern Trust GBP 32,800 USD 43,720 1�3329 29/01/2021 1,124 -Northern Trust GBP 9,416 USD 12,552 1�3331 29/01/2021 321 -Northern Trust GBP 28,247 USD 38,449 1�3612 29/01/2021 170 -Northern Trust GBP 4,694 USD 6,389 1�3612 29/01/2021 28 -Northern Trust GBP 2,072 USD 2,806 1�3542 29/01/2021 27 -Northern Trust EUR 1,016 USD 1,242 1�2229 29/01/2021 1 -
Unrealised Gains on Forward Currency Contracts 7,975,224 2.45

152
Federated Hermes Investment Funds Public Limited CompanyPortfolio Statement As at 31 December 2020 (continued)
a Header 1a Federated Hermes Absolute Return Credit Fund (continued)
Nominal Holdings Financial assets at fair value through profit or loss
Fair Value $
% of Net Assets
. . . . .Financial Derivative Instruments: 4.51% (2019: 3.73%) (continued)
Futures Contracts - Unrealised Gains: 0.00% (2019: 0.16%)
Clearing Broker Description CurrencyNo. of
ContractsUnrealised
Gain $
% of Net Assets
Germany: 0.00% (2019: 0.07%) - -
United States: 0.00% (2019: 0.09%)
Morgan Stanley US Ultra CBT March 2021 USD (7) 8,843 -
Total United States 8,843 -
Total Futures Contracts - Unrealised Gains 8,843 -
Total Financial Derivative Instruments 14,669,361 4.51
Total financial assets at fair value through profit or loss 323,638,770 99.42
Financial liabilities at fair value through profit or loss
Financial Derivative Instruments: (4.56%) (2019: (5.26%))
Credit Default Swaps: (4.17%) (2019: (5.15%))
Credit Default Swaps: Pay Fixed (Buy Protection) - Unrealised Losses: (4.09%) (2019: (5.14%))
European Union: (2.90%) (2019: (3.73%))
800,000 Galp Energia 5% 20/12/2021 (Goldman Sachs) (45,646) (0�01)667,000 Galp Energia 5% 20/12/2021 (Barclays Bank) (38,057) (0�01)
38,775,000 Itraxx Europe Crossover 5% 20/12/2025 (Morgan Stanley) (5,636,958) (1�73)140,000,000 Itraxx Europe Index Series 1% 20/12/2023 (Morgan Stanley) (3,735,645) (1�15)
Total European Union (9,456,306) (2.90)
Eurozone: (0.09%) (2019: 0.00%)
11,700,000 Itraxx Europe Senior Financials 1% 20/12/2025 (Morgan Stanley) (285,982) (0�09)
Total Eurozone (285,982) (0.09)
United Kingdom: (0.06%) (2019: 0.00%)
750,000 Canadian Natural Resources 1% 20/12/2025 (Credit Suisse) (6,206) -300,000 Canadian Natural Resources 1% 20/12/2025 (Credit Suisse) (2,482) -450,000 Canadian Natural Resources 1% 20/12/2025 (Credit Suisse) (3,723) -

153
Federated Hermes Investment Funds Public Limited CompanyPortfolio Statement As at 31 December 2020 (continued)
a Header 1a Federated Hermes Absolute Return Credit Fund (continued)
Nominal Holdings Financial liabilities at fair value through profit or loss
Fair Value $
% of Net Assets
. . . . .Financial Derivative Instruments: (4.56%) (2019: (5.26%)) (continued)
Credit Default Swaps: (4.17%) (2019: (5.15%)) (continued)
Credit Default Swaps: Pay Fixed (Buy Protection) - Unrealised Losses: (4.09%) (2019: (5.14%)) (continued)
United Kingdom: (0.06%) (2019: 0.00%) (continued)
2,000,000 Ineos Group 5% 20/12/2025 (Credit Suisse) (187,865) (0�06)
Total United Kingdom (200,276) (0.06)
United States: (1.04%) (2019: (1.41%))
2,000,000 ADT 5% 20/06/2024 (Goldman Sachs) (248,625) (0�08)1,520,000 American Axle 5% 20/12/2025 (Goldman Sachs) (96,270) (0�03)
980,000 American Axle 5% 20/12/2025 (Goldman Sachs) (62,069) (0�02)5,000,000 Anglo American Capital 5% 20/12/2025 (Merrill Lynch) (1,213,398) (0�37)2,538,000 Avis Budget Finance 5% 20/12/2025 (Goldman Sachs) (83,132) (0�03)3,408,000 Dell 1% 20/06/2024 (JP Morgan) (2,389) -2,000,000 Domtar Corporation 1% 20/12/2021 (Goldman Sachs) (16,528) -5,500,000 Glencore Finance Group 5% 20/12/2025 (Goldman Sachs) (1,221,455) (0�38)
952,000 International Lease 5% 20/12/2025 (Goldman Sachs) (197,098) (0�06)800,000 Pactiv 5% 20/12/2021 (Morgan Stanley) (35,547) (0�01)
3,000,000 Rio Tinto Finance 1% 20/06/2024 (Goldman Sachs) (77,433) (0�02)1,750,000 Safeway 1% 20/12/2021 (Goldman Sachs) (18,423) (0�01)
417,000 Tenet Healthcare 5% 20/12/2024 (Goldman Sachs) (33,917) (0�01)800,000 Tenet Healthcare 5% 20/12/2024 (Goldman Sachs) (65,069) (0�02)
83,000 Tenet Healthcare 5% 20/12/2024 (Goldman Sachs) (6,751) -700,000 United Mexican States 1% 20/06/2025 (Goldman Sachs) (9,247) -500,000 United Mexican States 1% 20/06/2025 (BNP Paribas) (6,605) -
Total United States (3,393,956) (1.04)
Total Credit Default Swaps: Pay Fixed (Buy Protection) - Unrealised Losses (13,336,520) (4.09)
Credit Default Swaps: Receive Fixed (Sell Protection) - Unrealised Losses: (0.08%) (2019: (0.01%))
European Union: (0.01%) (2019: (0.01%))
(1,500,000) Thyssenkrupp 1% 20/06/2023 (Goldman Sachs) (28,247) (0�01)
Total European Union (28,247) (0.01)
United Kingdom: (0.01%) (2019: 0.00%)
(800,000) Renault 1% 20/12/2023 (Credit Suisse) (5,949) -(2,300,000) Valeo 1% 20/12/2023 (Credit Suisse) (135) -

154
Federated Hermes Investment Funds Public Limited CompanyPortfolio Statement As at 31 December 2020 (continued)
a Header 1a Federated Hermes Absolute Return Credit Fund (continued)
Nominal Holdings Financial liabilities at fair value through profit or loss
Fair Value $
% of Net Assets
. . . . .Financial Derivative Instruments: (4.56%) (2019: (5.26%)) (continued)
Credit Default Swaps: (4.17%) (2019: (5.15%)) (continued)
Credit Default Swaps: Receive Fixed (Sell Protection) - Unrealised Losses: (0.08%) (2019: (0.01%)) (continued)
United Kingdom: (0.01%) (2019: 0.00%) (continued)
(2,200,000) Valeo 1% 20/12/2023 (Credit Suisse) (25,485) (0�01)
Total United Kingdom (31,569) (0.01)
United States: (0.06%) (2019: 0.00%)
(1,250,000) Macy's Retail Holdings 1% 20/06/2023 (Goldman Sachs) (68,331) (0�02)(3,750,000) Marks & Spencer 1% 20/12/2023 (JP Morgan) (123,586) (0�04)
Total United States (191,917) (0.06)
Total Credit Default Swaps: Receive Fixed (Sell Protection) - Unrealised Losses (251,733) (0.08)
Total Credit Default Swaps (13,588,253) (4.17)
Forward Currency Contracts: (0.38%) (2019: (0.11%))
CounterpartyCurrency Buys
Currency Sells
Currency Rate
Maturity Date
Unrealised Loss
$
% of Net Assets
Northern Trust USD 53,103 GBP 39,215 1�3542 29/01/2021 (510) -Northern Trust USD 541,220 GBP 400,000 1�3530 29/01/2021 (5,650) -Northern Trust EUR 3,000,000 USD 3,695,193 1�2317 17/03/2021 (18,871) (0�01)Royal Bank of Canada USD 42,694,750 EUR 35,000,000 1�2199 17/03/2021 (195,673) (0�06)State Street USD 42,694,155 EUR 35,000,000 1�2198 17/03/2021 (196,268) (0�06)State Street USD 41,581,168 GBP 31,000,000 1�3413 17/03/2021 (812,584) (0�25)
Unrealised Losses on Forward Currency Contracts (1,229,556) (0.38)

155
Federated Hermes Investment Funds Public Limited CompanyPortfolio Statement As at 31 December 2020 (continued)
a Header 1a Federated Hermes Absolute Return Credit Fund (continued)
Nominal Holdings Financial liabilities at fair value through profit or loss
Fair Value $
% of Net Assets
. . . . .Financial Derivative Instruments: (4.56%) (2019: (5.26%)) (continued)
Futures Contracts - Unrealised Losses: (0.01%) (2019: 0.00%)
Clearing Broker Description CurrencyNo. of
ContractsUnrealised
Loss $
% of Net Assets
Germany: 0.00% (2019: 0.00%)
Morgan Stanley Euro-Bund Eux March 2021 EUR (18) (18,634) -
Total Germany (18,634) -
United States: (0.01%) (2019: 0.00%)
Morgan Stanley 10 Year Note CBT March 2021 USD (157) (19,625) (0�01)
Total United States (19,625) (0.01)
Total Futures Contracts - Unrealised Loss (38,259) (0.01)
Total Financial Derivative Instruments (14,856,068) (4.56)
Total financial liabilities at fair value through profit or loss (14,856,068) (4.56)
Financial assets at fair value through profit or lossNet financial assets at fair value through profit or loss (2019: 94.09%) (Cost: $ 284,919,723)
308,782,702 94.86
Net Cash (2019: 6.86%) 14,041,558 4.31
Other Net Assets (2019: (0.95%)) 2,694,618 0.83
Net Assets Attributable to Holders of Redeemable Participating Shares 325,518,878 100.00
Portfolio Classification
% of Total Assets
Transferable securities traded on a regulated market 90�03OTC financial derivative instruments 4�27Cash 4�80Other assets 0�90Total 100.00

156
Federated Hermes Investment Funds Public Limited CompanyPortfolio StatementAs at 31 December 2020 (continued)
a Header 1a Federated Hermes SDG Engagement Equity Fund
Nominal Holdings Financial assets at fair value through profit or loss
Fair Value $
% of Net Assets
. . . . .Equities: 92.95% (2019: 91.08%)
Brazil: 0.00% (2019: 1.32%) - -
Finland: 2.78% (2019: 2.66%)
717,674 Huhtamaki 37,224,180 2�78
Total Finland 37,224,180 2.78
France: 1.16% (2019: 0.00%)
78,722 Soitec 15,468,774 1�16
Total France 15,468,774 1.16
Hong Kong: 3.06% (2019: 2.91%)
2,873,000 Techtronic Industries 40,987,004 3�06
Total Hong Kong 40,987,004 3.06
India: 0.50% (2019: 0.00%)
530,642 Varun Beverages 6,652,679 0�50
Total India 6,652,679 0.50
Ireland: 1.51% (2019: 1.31%)
1,580,192 Glanbia 20,228,450 1�51
Total Ireland 20,228,450 1.51
Italy: 2.30% (2019: 1.20%)
584,492 MARR 12,094,964 0�901,653,105 Technogym 18,747,391 1�40
Total Italy 30,842,355 2.30
Japan: 13.23% (2019: 11.27%)
432,393 Horiba 25,381,823 1�90931,857 Nifco 36,572,664 2�73559,600 Nissan Chemical 35,075,108 2�62840,517 Open House 30,908,256 2�31656,736 Relo Group 15,917,397 1�19476,044 Yaoko 33,209,687 2�48
Total Japan 177,064,935 13.23

157
Federated Hermes Investment Funds Public Limited CompanyPortfolio Statement As at 31 December 2020 (continued)
a Header 1a Federated Hermes SDG Engagement Equity Fund (continued)
Nominal Holdings Financial assets at fair value through profit or loss
Fair Value $
% of Net Assets
. . . . .Equities: 92.95% (2019: 91.08%) (continued)
Jersey: 0.48% (2019: 0.00%)
5,440,126 Breedon Aggregates 6,474,325 0�48
Total Jersey 6,474,325 0.48
Netherlands: 5.36% (2019: 4.85%)
711,859 Aalberts 31,951,215 2�38310,392 IMCD 39,867,425 2�98
Total Netherlands 71,818,640 5.36
People's Republic of China: 1.54% (2019: 2.01%)
12,774,500 Shenzhen International 20,630,211 1�54
Total People's Republic of China 20,630,211 1.54
Peru: 1.60% (2019: 1.58%)
131,003 Credicorp 21,438,641 1�60
Total Peru 21,438,641 1.60
South Africa: 0.00% (2019: 0.15%) - -
Sweden: 2.07% (2019: 1.61%)
1,242,077 Trelleborg 27,751,408 2�07
Total Sweden 27,751,408 2.07
Switzerland: 2.17% (2019: 1.64%)
83,171 Burckhardt Compression 28,985,693 2�17
Total Switzerland 28,985,693 2.17
Taiwan: 1.91% (2019: 1.96%)
1,546,026 Land Mark Optoelectronics 15,543,895 1�167,258,702 Tong Yang Industry 10,075,072 0�75
Total Taiwan 25,618,967 1.91
United Kingdom: 2.96% (2019: 6.27%)
244,763 DCC 17,437,545 1�304,091,173 Harworth Group 5,946,570 0�45

158
Federated Hermes Investment Funds Public Limited CompanyPortfolio Statement As at 31 December 2020 (continued)
a Header 1a Federated Hermes SDG Engagement Equity Fund (continued)
Nominal Holdings Financial assets at fair value through profit or loss
Fair Value $
% of Net Assets
. . . . .Equities: 92.95% (2019: 91.08%) (continued)
United Kingdom: 2.96% (2019: 6.27%) (continued)
3,548,864 SSP 16,177,257 1�21
Total United Kingdom 39,561,372 2.96
United States: 50.32% (2019: 50.34%)
642,425 Alliant Energy 32,609,493 2�44571,079 AMN Healthcare Services 38,907,612 2�90301,059 AptarGroup 41,061,437 3�06494,454 Brunswick 38,691,025 2�89361,051 Clean Harbors 27,169,088 2�03102,052 Cooper Cos 36,376,436 2�72
4,625,205 Diversified Gas & Oil 7,183,603 0�54272,199 Eagle Materials 27,750,688 2�07370,920 Fortune Brands Home & Security 31,828,645 2�38505,968 John Wiley & Sons 23,395,960 1�75342,499 Kirby 17,905,848 1�34378,039 National Instruments 16,512,743 1�23193,863 Reinsurance of America 22,371,790 1�67424,286 RPM International 38,397,883 2�87
14,624,036 Samsonite 25,918,473 1�93286,460 Silicon Laboratories 36,348,909 2�71353,092 Simpson Manufacturing 32,766,938 2�45186,842 STERIS 34,806,796 2�60613,355 TCF Financial 22,620,532 1�69
90,681 West Pharmaceutical Services 25,385,239 1�90167,334 WEX 33,655,888 2�51515,492 Wintrust Financial 31,481,097 2�35251,808 Woodward 30,665,178 2�29
Total United States 673,811,301 50.32
Total Equities 1,244,558,935 92.95
REITS: 4.80% (2019: 4.00%)
Singapore: 2.06% (2019: 1.74%)
12,603,206 Mapletree Industrial Trust REITS 27,564,148 2�06
Total Singapore 27,564,148 2.06
Spain: 1.13% (2019: 0.52%)
1,592,965 Merlin Properties REITS 15,152,223 1�13
Total Spain 15,152,223 1.13

159
Federated Hermes Investment Funds Public Limited CompanyPortfolio Statement As at 31 December 2020 (continued)
a Header 1a Federated Hermes SDG Engagement Equity Fund (continued)
Nominal Holdings Financial assets at fair value through profit or loss
Fair Value $
% of Net Assets
. . . . . REITS: 4.80% (2019: 4.00%) (continued)
United States: 1.61% (2019: 1.74%)
1,626,585 Retail Opportunity Investments REITS 21,503,454 1�61
Total United States 21,503,454 1.61
Total REITS 64,219,825 4.80
Financial Derivative Instruments: 0.45% (2019: 0.49%)
Forward Currency Contracts: 0.45% (2019: 0.49%)
CounterpartyCurrency Buys
Currency Sells
Currency Rate
Maturity Date
Unrealised Gain
$
% of Net Assets
Northern Trust EUR 166,903,966 USD 203,284,691 1�2180 29/01/2021 1,691,475 0�13Northern Trust CHF 174,638,636 USD 196,854,004 1�1272 29/01/2021 1,555,803 0�12Northern Trust GBP 31,234,725 USD 41,489,678 1�3283 29/01/2021 1,147,806 0�09Northern Trust GBP 7,758,882 JPY 1,067,616,277 0�0073 29/01/2021 229,509 0�02Northern Trust GBP 8,155,879 EUR 8,893,855 0�9170 29/01/2021 210,700 0�02Northern Trust EUR 19,460,230 HKD 183,763,343 0�1059 29/01/2021 193,430 0�02Northern Trust CHF 20,251,761 HKD 176,979,388 0�1144 29/01/2021 177,658 0�01Northern Trust EUR 39,654,126 JPY 5,003,250,313 0�0079 29/01/2021 139,900 0�01Northern Trust GBP 3,619,088 HKD 37,269,948 0�0971 29/01/2021 132,398 0�01Northern Trust CHF 41,549,889 JPY 4,851,686,629 0�0086 29/01/2021 116,861 0�01Northern Trust CHF 5,925,853 USD 6,679,667 1�1272 29/01/2021 52,792 0�01Northern Trust EUR 4,721,206 USD 5,750,307 1�2180 29/01/2021 47,847 -Northern Trust CHF 5,215,178 USD 5,878,588 1�1272 29/01/2021 46,460 -Northern Trust GBP 1,044,072 USD 1,386,860 1�3283 29/01/2021 38,367 -Northern Trust GBP 1,246,978 CHF 1,469,402 0�8486 29/01/2021 32,797 -Northern Trust GBP 1,159,829 SGD 2,060,944 0�5628 29/01/2021 23,547 -Northern Trust GBP 1,583,416 USD 2,143,224 1�3535 29/01/2021 18,245 -Northern Trust CHF 1,680,396 USD 1,892,858 1�1264 29/01/2021 16,267 -Northern Trust GBP 556,850 USD 744,402 1�3368 29/01/2021 15,736 -Northern Trust GBP 317,956 USD 422,380 1�3284 29/01/2021 11,652 -Northern Trust EUR 1,120,647 USD 1,365,184 1�2182 29/01/2021 11,092 -Northern Trust EUR 1,447,805 USD 1,767,266 1�2207 29/01/2021 10,795 -Northern Trust EUR 1,013,408 USD 1,234,304 1�2180 29/01/2021 10,270 -Northern Trust GBP 1,194,981 SEK 13,237,728 0�0903 29/01/2021 10,053 -Northern Trust GBP 254,985 JPY 35,085,803 0�0073 29/01/2021 7,543 -Northern Trust GBP 267,247 EUR 291,429 0�9170 29/01/2021 6,904 -Northern Trust EUR 856,582 USD 1,045,158 1�2201 29/01/2021 6,818 -Northern Trust CHF 1,480,767 USD 1,675,701 1�1316 29/01/2021 6,622 -Northern Trust CHF 686,809 HKD 6,001,998 0�1144 29/01/2021 6,025 -Northern Trust CHF 487,716 USD 548,917 1�1255 29/01/2021 5,185 -Northern Trust EUR 495,610 USD 603,758 1�2182 29/01/2021 4,905 -Northern Trust EUR 463,629 USD 564,688 1�2180 29/01/2021 4,699 -Northern Trust GBP 127,093 USD 168,833 1�3284 29/01/2021 4,658 -Northern Trust EUR 453,443 USD 552,282 1�2180 29/01/2021 4,595 -

160
Federated Hermes Investment Funds Public Limited CompanyPortfolio Statement As at 31 December 2020 (continued)
a Header 1a Federated Hermes SDG Engagement Equity Fund (continued)
Nominal Holdings Financial assets at fair value through profit or loss
Fair Value $
% of Net Assets
. . . . . Financial Derivative Instruments: 0.45% (2019: 0.49%) (continued) Forward Currency Contracts: 0.45% (2019: 0.49%) (continued)
CounterpartyCurrency Buys
Currency Sells
Currency Rate
Maturity Date
Unrealised Gain
$
% of Net Assets
Northern Trust GBP 121,485 HKD 1,251,071 0�0971 29/01/2021 4,444 -Northern Trust GBP 731,307 USD 993,846 1�3590 29/01/2021 4,437 -Northern Trust GBP 196,735 USD 264,232 1�3431 29/01/2021 4,325 -Northern Trust CHF 488,690 USD 550,966 1�1274 29/01/2021 4,243 -Northern Trust CHF 1,409,886 JPY 164,629,226 0�0086 29/01/2021 3,965 -Northern Trust CHF 1,384,477 EUR 1,277,808 1�0835 29/01/2021 3,640 -Northern Trust CHF 359,183 USD 404,499 1�1262 29/01/2021 3,575 -Northern Trust EUR 6,479,411 CHF 7,000,939 0�9255 29/01/2021 3,538 -Northern Trust CHF 385,323 USD 434,339 1�1272 29/01/2021 3,433 -Northern Trust EUR 331,992 USD 404,358 1�2180 29/01/2021 3,365 -Northern Trust JPY 57,780,123 USD 557,863 0�0097 29/01/2021 2,929 -Northern Trust GBP 122,849 USD 164,803 1�3415 29/01/2021 2,894 -Northern Trust EUR 1,292,601 USD 1,584,677 1�2260 29/01/2021 2,777 -Northern Trust GBP 75,288 JPY 10,359,387 0�0073 29/01/2021 2,228 -Northern Trust GBP 81,481 EUR 88,846 0�9171 29/01/2021 2,115 -Northern Trust SEK 731,981 USD 87,786 0�1199 29/01/2021 1,857 -Northern Trust CHF 194,128 USD 218,822 1�1272 29/01/2021 1,729 -Northern Trust GBP 275,121 USD 373,890 1�3590 29/01/2021 1,669 -Northern Trust CHF 312,248 SGD 466,650 0�6691 29/01/2021 1,595 -Northern Trust CHF 305,842 USD 345,989 1�1313 29/01/2021 1,483 -Northern Trust GBP 37,397 HKD 385,133 0�0971 29/01/2021 1,366 -Northern Trust EUR 337,010 JPY 42,508,235 0�0079 29/01/2021 1,316 -Northern Trust EUR 131,806 HKD 1,244,796 0�1059 29/01/2021 1,290 -Northern Trust CHF 134,051 USD 151,103 1�1272 29/01/2021 1,194 -Northern Trust EUR 162,071 HKD 1,533,845 0�1057 29/01/2021 1,172 -Northern Trust EUR 116,604 HKD 1,101,098 0�1059 29/01/2021 1,159 -Northern Trust GBP 308,851 USD 420,472 1�3614 29/01/2021 1,131 -Northern Trust GBP 41,014 CHF 48,330 0�8486 29/01/2021 1,079 -Northern Trust SGD 116,916 USD 87,404 0�7476 29/01/2021 1,077 -Northern Trust CHF 375,774 EUR 346,879 1�0833 29/01/2021 918 -Northern Trust EUR 265,353 JPY 33,482,884 0�0079 29/01/2021 910 -Northern Trust CHF 113,527 JPY 13,201,413 0�0086 29/01/2021 852 -Northern Trust EUR 238,065 JPY 30,037,221 0�0079 29/01/2021 840 -Northern Trust GBP 45,795 JPY 6,356,242 0�0072 29/01/2021 821 -Northern Trust GBP 38,074 SGD 67,654 0�5628 29/01/2021 773 -Northern Trust EUR 97,500 HKD 922,284 0�1057 29/01/2021 764 -Northern Trust CHF 174,642 HKD 1,532,150 0�1140 29/01/2021 764 -Northern Trust CHF 83,916 USD 94,610 1�1274 29/01/2021 729 -Northern Trust GBP 47,893 EUR 52,698 0�9088 29/01/2021 659 -Northern Trust GBP 31,175 EUR 34,118 0�9137 29/01/2021 656 -Northern Trust CHF 358,971 JPY 41,952,819 0�0086 29/01/2021 654 -Northern Trust GBP 29,781 JPY 4,126,046 0�0072 29/01/2021 608 -Northern Trust EUR 58,241 USD 70,936 1�2180 29/01/2021 590 -Northern Trust CHF 65,731 USD 74,092 1�1272 29/01/2021 586 -

161
Federated Hermes Investment Funds Public Limited CompanyPortfolio Statement As at 31 December 2020 (continued)
a Header 1a Federated Hermes SDG Engagement Equity Fund (continued)
Nominal Holdings Financial assets at fair value through profit or loss
Fair Value $
% of Net Assets
. . . . . Financial Derivative Instruments: 0.45% (2019: 0.49%) (continued) Forward Currency Contracts: 0.45% (2019: 0.49%) (continued)
CounterpartyCurrency Buys
Currency Sells
Currency Rate
Maturity Date
Unrealised Gain
$
% of Net Assets
Northern Trust CHF 54,596 HKD 476,398 0�1146 29/01/2021 571 -Northern Trust EUR 53,341 HKD 503,698 0�1059 29/01/2021 530 -Northern Trust EUR 52,166 HKD 492,603 0�1059 29/01/2021 519 -Northern Trust GBP 83,240 HKD 877,009 0�0949 29/01/2021 493 -Northern Trust CHF 57,478 HKD 502,384 0�1144 29/01/2021 493 -Northern Trust GBP 22,023 HKD 229,335 0�0960 29/01/2021 478 -Northern Trust CHF 118,730 EUR 109,470 1�0846 29/01/2021 450 -Northern Trust CHF 40,884 HKD 356,940 0�1145 29/01/2021 403 -Northern Trust CHF 44,694 HKD 390,582 0�1144 29/01/2021 392 -Northern Trust EUR 108,903 JPY 13,740,535 0�0079 29/01/2021 384 -Northern Trust EUR 38,192 HKD 360,646 0�1059 29/01/2021 380 -Northern Trust EUR 106,504 JPY 13,437,892 0�0079 29/01/2021 376 -Northern Trust CHF 75,703 EUR 69,737 1�0856 29/01/2021 363 -Northern Trust GBP 14,489 HKD 150,688 0�0962 29/01/2021 339 -Northern Trust GBP 12,768 CHF 15,045 0�8487 29/01/2021 337 -Northern Trust GBP 39,308 SEK 435,443 0�0903 29/01/2021 331 -Northern Trust CHF 115,715 JPY 13,513,144 0�0086 29/01/2021 312 -Northern Trust EUR 152,450 HKD 1,448,968 0�1052 29/01/2021 305 -Northern Trust EUR 30,109 USD 36,672 1�2180 29/01/2021 305 -Northern Trust CHF 73,079 JPY 8,523,423 0�0086 29/01/2021 301 -Northern Trust CHF 84,343 JPY 9,843,866 0�0086 29/01/2021 283 -Northern Trust EUR 77,974 JPY 9,838,187 0�0079 29/01/2021 275 -Northern Trust GBP 76,448 EUR 84,753 0�9020 29/01/2021 270 -Northern Trust EUR 2,401,327 USD 2,948,820 1�2280 29/01/2021 270 -Northern Trust CHF 91,762 JPY 10,714,787 0�0086 29/01/2021 258 -Northern Trust EUR 349,371 SGD 566,624 0�6166 29/01/2021 251 -Northern Trust CHF 1,812,209 JPY 212,107,459 0�0085 29/01/2021 245 -Northern Trust GBP 11,796 SGD 20,962 0�5627 29/01/2021 238 -Northern Trust CHF 88,272 EUR 81,477 1�0834 29/01/2021 224 -Northern Trust EUR 28,096 USD 34,296 1�2207 29/01/2021 210 -Northern Trust GBP 73,798 JPY 10,358,448 0�0071 29/01/2021 205 -Northern Trust GBP 31,315 HKD 329,935 0�0949 29/01/2021 185 -Northern Trust CHF 35,379 HKD 310,276 0�1140 29/01/2021 169 -Northern Trust EUR 201,143 JPY 25,434,897 0�0079 29/01/2021 164 -Northern Trust EUR 60,952 GBP 54,718 1�1139 29/01/2021 162 -Northern Trust GBP 41,881 USD 57,017 1�3614 29/01/2021 153 -Northern Trust CHF 25,559 GBP 21,165 1�2076 29/01/2021 145 -Northern Trust EUR 13,778 USD 16,781 1�2180 29/01/2021 140 -Northern Trust EUR 13,490 USD 16,431 1�2180 29/01/2021 137 -Northern Trust CHF 15,548 HKD 135,875 0�1144 29/01/2021 136 -Northern Trust GBP 35,727 HKD 377,078 0�0947 29/01/2021 127 -Northern Trust CHF 11,744 USD 13,229 1�1264 29/01/2021 114 -Northern Trust CHF 12,045 USD 13,577 1�1272 29/01/2021 107 -Northern Trust CHF 11,280 USD 12,715 1�1272 29/01/2021 101 -

162
Federated Hermes Investment Funds Public Limited CompanyPortfolio Statement As at 31 December 2020 (continued)
a Header 1a Federated Hermes SDG Engagement Equity Fund (continued)
Nominal Holdings Financial assets at fair value through profit or loss
Fair Value $
% of Net Assets
. . . . . Financial Derivative Instruments: 0.45% (2019: 0.49%) (continued) Forward Currency Contracts: 0.45% (2019: 0.49%) (continued)
CounterpartyCurrency Buys
Currency Sells
Currency Rate
Maturity Date
Unrealised Gain
$
% of Net Assets
Northern Trust EUR 9,857 USD 12,006 1�2180 29/01/2021 100 -Northern Trust GBP 11,847 SEK 131,247 0�0903 29/01/2021 99 -Northern Trust CHF 31,948 JPY 3,730,516 0�0086 29/01/2021 90 -Northern Trust GBP 4,802 CHF 5,693 0�8434 29/01/2021 87 -Northern Trust CHF 7,772 USD 8,755 1�1264 29/01/2021 75 -Northern Trust GBP 2,597 USD 3,472 1�3368 29/01/2021 73 -Northern Trust GBP 7,124 SGD 12,758 0�5584 29/01/2021 69 -Northern Trust EUR 6,791 HKD 64,124 0�1059 29/01/2021 68 -Northern Trust CHF 29,303 HKD 257,548 0�1138 29/01/2021 67 -Northern Trust CHF 7,624 HKD 66,628 0�1144 29/01/2021 67 -Northern Trust CHF 13,226 SGD 19,782 0�6686 29/01/2021 56 -Northern Trust CHF 10,822 SGD 16,174 0�6691 29/01/2021 55 -Northern Trust GBP 5,952 CHF 7,103 0�8380 29/01/2021 55 -Northern Trust EUR 31,542 SGD 51,114 0�6171 29/01/2021 54 -Northern Trust GBP 4,519 SGD 8,085 0�5590 29/01/2021 50 -Northern Trust EUR 13,682 JPY 1,726,263 0�0079 29/01/2021 48 -Northern Trust CHF 15,659 JPY 1,828,476 0�0086 29/01/2021 44 -Northern Trust CHF 22,594 GBP 18,773 1�2035 29/01/2021 42 -Northern Trust GBP 4,496 SEK 49,805 0�0903 29/01/2021 39 -Northern Trust CHF 3,981 USD 4,485 1�1264 29/01/2021 39 -Northern Trust GBP 1,326 USD 1,772 1�3368 29/01/2021 37 -Northern Trust GBP 10,366 EUR 11,493 0�9020 29/01/2021 37 -Northern Trust CHF 3,947 USD 4,450 1�1272 29/01/2021 35 -Northern Trust EUR 415,337 USD 510,051 1�2280 29/01/2021 28 -Northern Trust GBP 10,007 JPY 1,404,622 0�0071 29/01/2021 28 -Northern Trust EUR 45,002 CHF 48,623 0�9255 29/01/2021 26 -Northern Trust EUR 6,540 JPY 824,925 0�0079 29/01/2021 26 -Northern Trust GBP 638 USD 847 1�3283 29/01/2021 23 -Northern Trust GBP 629 USD 835 1�3283 29/01/2021 23 -Northern Trust EUR 3,145 HKD 29,766 0�1057 29/01/2021 23 -Northern Trust CHF 8,255 EUR 7,619 1�0835 29/01/2021 22 -Northern Trust CHF 11,298 SGD 16,933 0�6672 29/01/2021 22 -Northern Trust EUR 39,344 CHF 42,511 0�9255 29/01/2021 22 -Northern Trust EUR 1,731 USD 2,108 1�2180 29/01/2021 18 -Northern Trust CHF 1,935 USD 2,181 1�1272 29/01/2021 17 -Northern Trust GBP 4,845 HKD 51,132 0�0947 29/01/2021 17 -Northern Trust CHF 11,440 SEK 105,999 0�1079 29/01/2021 16 -Northern Trust CHF 1,526 USD 1,718 1�1264 29/01/2021 15 -Northern Trust GBP 509 USD 681 1�3368 29/01/2021 14 -Northern Trust CHF 1,397 HKD 12,209 0�1144 29/01/2021 12 -Northern Trust GBP 7,157 SEK 79,678 0�0898 29/01/2021 11 -Northern Trust CHF 3,774 EUR 3,483 1�0835 29/01/2021 10 -Northern Trust EUR 17,999 CHF 19,448 0�9255 29/01/2021 10 -Northern Trust CHF 3,690 EUR 3,406 1�0835 29/01/2021 10 -

163
Federated Hermes Investment Funds Public Limited CompanyPortfolio Statement As at 31 December 2020 (continued)
a Header 1a Federated Hermes SDG Engagement Equity Fund (continued)
Nominal Holdings Financial assets at fair value through profit or loss
Fair Value $
% of Net Assets
. . . . .Financial Derivative Instruments: 0.45% (2019: 0.49%) (continued)
Forward Currency Contracts: 0.45% (2019: 0.49%) (continued)
CounterpartyCurrency Buys
Currency Sells
Currency Rate
Maturity Date
Unrealised Gain
$
% of Net Assets
Northern Trust EUR 17,604 CHF 19,021 0�9255 29/01/2021 10 -Northern Trust JPY 49,099,665 USD 476,534 0�0097 29/01/2021 9 -Northern Trust CHF 62,980 JPY 7,371,390 0�0085 29/01/2021 9 -Northern Trust CHF 2,868 JPY 334,892 0�0086 29/01/2021 8 -Northern Trust CHF 785 USD 884 1�1264 29/01/2021 8 -Northern Trust GBP 262 USD 351 1�3368 29/01/2021 7 -Northern Trust CHF 2,701 EUR 2,493 1�0835 29/01/2021 7 -Northern Trust EUR 12,888 CHF 13,926 0�9255 29/01/2021 7 -Northern Trust CHF 17,660 SGD 26,503 0�6663 29/01/2021 7 -Northern Trust EUR 621 USD 756 1�2180 29/01/2021 6 -Northern Trust EUR 586 USD 714 1�2180 29/01/2021 6 -Northern Trust CHF 619 USD 697 1�1272 29/01/2021 6 -Northern Trust CHF 610 USD 688 1�1272 29/01/2021 5 -Northern Trust GBP 159 JPY 21,861 0�0073 29/01/2021 5 -Northern Trust GBP 157 JPY 21,551 0�0073 29/01/2021 5 -Northern Trust GBP 167 EUR 182 0�9170 29/01/2021 4 -Northern Trust GBP 165 EUR 180 0�9170 29/01/2021 4 -Northern Trust CHF 812 SGD 1,214 0�6691 29/01/2021 4 -Northern Trust CHF 68,088 USD 77,353 1�1361 29/01/2021 3 -Northern Trust CHF 354 USD 399 1�1272 29/01/2021 3 -Northern Trust GBP 74 HKD 764 0�0971 29/01/2021 3 -Northern Trust GBP 73 HKD 753 0�0971 29/01/2021 3 -Northern Trust GBP 106,522 USD 145,408 1�3650 29/01/2021 2 -Northern Trust HKD 2,148,047 USD 277,100 0�1290 29/01/2021 2 -Northern Trust GBP 11,410 SGD 20,578 0�5544 29/01/2021 1 -Northern Trust EUR 1,787 SGD 2,898 0�6166 29/01/2021 1 -Northern Trust EUR 2,261 CHF 2,443 0�9255 29/01/2021 1 -Northern Trust CHF 474 EUR 438 1�0835 29/01/2021 1 -Northern Trust CHF 233 SGD 348 0�6691 29/01/2021 1 -Northern Trust EUR 72 HKD 684 0�1059 29/01/2021 1 -Northern Trust EUR 976 SGD 1,582 0�6166 29/01/2021 1 -Northern Trust GBP 26 CHF 30 0�8487 29/01/2021 1 -Northern Trust EUR 956 SGD 1,551 0�6166 29/01/2021 1 -Northern Trust EUR 67 HKD 637 0�1059 29/01/2021 1 -Northern Trust GBP 25 CHF 30 0�8485 29/01/2021 1 -Northern Trust CHF 72 HKD 627 0�1144 29/01/2021 1 -Northern Trust CHF 71 HKD 618 0�1144 29/01/2021 1 -Northern Trust CHF 115 SGD 173 0�6691 29/01/2021 1 -Northern Trust EUR 146 JPY 18,401 0�0079 29/01/2021 1 -Northern Trust EUR 701 SGD 1,137 0�6166 29/01/2021 1 -Northern Trust EUR 277,782 HKD 2,644,502 0�1050 29/01/2021 - -Northern Trust EUR 138 JPY 17,370 0�0079 29/01/2021 - -Northern Trust GBP 24 SGD 42 0�5629 29/01/2021 - -Northern Trust GBP 23 SGD 42 0�5628 29/01/2021 - -

164
Federated Hermes Investment Funds Public Limited CompanyPortfolio Statement As at 31 December 2020 (continued)
a Header 1a Federated Hermes SDG Engagement Equity Fund (continued)
Nominal Holdings Financial assets at fair value through profit or loss
Fair Value $
% of Net Assets
. . . . . Financial Derivative Instruments: 0.45% (2019: 0.49%) (continued) Forward Currency Contracts: 0.45% (2019: 0.49%) (continued)
CounterpartyCurrency Buys
Currency Sells
Currency Rate
Maturity Date
Unrealised Gain
$
% of Net Assets
Northern Trust CHF 147 JPY 17,194 0�0086 29/01/2021 - -Northern Trust CHF 145 JPY 16,958 0�0086 29/01/2021 - -Northern Trust GBP 34 USD 46 1�3535 29/01/2021 - -Northern Trust GBP 33 USD 45 1�3534 29/01/2021 - -Northern Trust GBP 24 SEK 271 0�0903 29/01/2021 - -Northern Trust GBP 24 SEK 267 0�0903 29/01/2021 - -Northern Trust GBP 1,547 SGD 2,790 0�5544 29/01/2021 - -Northern Trust EUR 18 USD 22 1�2178 29/01/2021 - -Northern Trust EUR 17 USD 21 1�2180 29/01/2021 - -Northern Trust CHF 18 USD 20 1�1271 29/01/2021 - -Northern Trust CHF 18 USD 20 1�1270 29/01/2021 - -Northern Trust CHF 21 SGD 32 0�6691 29/01/2021 - -Northern Trust EUR 122 SGD 198 0�6166 29/01/2021 - -Northern Trust CHF 5 USD 5 1�1255 29/01/2021 - -Northern Trust GBP 2 USD 2 1�3354 29/01/2021 - -Northern Trust GBP 2 USD 2 1�3397 29/01/2021 - -Northern Trust CHF 5 USD 6 1�1273 29/01/2021 - -Northern Trust EUR 24 CHF 26 0�9255 29/01/2021 - -Northern Trust CHF 5 EUR 4 1�0843 29/01/2021 - -Northern Trust CHF 5 EUR 5 1�0839 29/01/2021 - -Northern Trust GBP 6 JPY 868 0�0071 29/01/2021 - -Northern Trust CHF 120 JPY 14,065 0�0085 29/01/2021 - -Northern Trust EUR 23 CHF 25 0�9255 29/01/2021 - -Northern Trust GBP 6 JPY 882 0�0071 29/01/2021 - -Northern Trust CHF 6 JPY 731 0�0085 29/01/2021 - -Northern Trust CHF 1 SGD 2 0�6708 29/01/2021 - -Northern Trust CHF 1 SGD 2 0�6687 29/01/2021 - -Northern Trust USD - AUD - 1�0000 29/01/2021 - -Northern Trust CHF 2 GBP 2 1�2000 29/01/2021 - -Northern Trust CHF 6 GBP 5 1�2019 29/01/2021 - -Northern Trust CHF 6 JPY 721 0�0085 29/01/2021 - -Northern Trust USD - NOK - 0�1250 29/01/2021 - -Northern Trust EUR 1 SEK 10 0�0993 29/01/2021 - -Northern Trust CHF 1 SEK 10 0�1073 29/01/2021 - -Northern Trust CHF 1 SEK 10 0�1080 29/01/2021 - -Northern Trust EUR 1 SGD 2 0�6161 29/01/2021 - -Northern Trust EUR 1 SGD 2 0�6150 29/01/2021 - -
Unrealised Gains on Forward Currency Contracts 6,096,122 0.45
Total Financial Derivative Instruments 6,096,122 0.45
Total financial assets at fair value through profit or loss 1,314,874,882 98.20

165
Federated Hermes Investment Funds Public Limited CompanyPortfolio Statement As at 31 December 2020 (continued)
a Header 1a Federated Hermes SDG Engagement Equity Fund (continued)
Nominal Holdings Financial liabilities at fair value through profit or loss
Fair Value $
% of Net Assets
. . . . .
Financial Derivative Instruments: (0.19%) (2019: (0.11%))
Forward Currency Contracts: (0.19%) (2019: (0.11%))
CounterpartyCurrency Buys
Currency Sells
Currency Rate
Maturity Date
Unrealised Loss
$
% of Net Assets
Northern Trust CHF 2 GBP 2 1�1964 29/01/2021 - -Northern Trust USD 3 GBP 3 1�3611 29/01/2021 - -Northern Trust CHF 6 GBP 5 1�2008 29/01/2021 - -Northern Trust EUR 2 GBP 2 1�1081 29/01/2021 - -Northern Trust SEK 12 GBP 1 11�0727 29/01/2021 - -Northern Trust SEK 12 GBP 1 11�1261 29/01/2021 - -Northern Trust USD 75 HKD 580 0�1290 29/01/2021 - -Northern Trust USD 80 HKD 619 0�1290 29/01/2021 - -Northern Trust EUR 1 SEK 9 0�0993 29/01/2021 - -Northern Trust EUR 7 GBP 7 1�1091 29/01/2021 - -Northern Trust EUR 2 GBP 2 1�1034 29/01/2021 - -Northern Trust USD 3 GBP 2 1�3583 29/01/2021 - -Northern Trust EUR 7 GBP 6 1�1082 29/01/2021 - -Northern Trust EUR 7 JPY 838 0�0079 29/01/2021 - -Northern Trust EUR 7 JPY 888 0�0079 29/01/2021 - -Northern Trust CHF 20 SEK 186 0�1076 29/01/2021 - -Northern Trust CHF 152 EUR 141 1�0805 29/01/2021 - -Northern Trust CHF 154 EUR 143 1�0805 29/01/2021 - -Northern Trust CHF 40 GBP 33 1�1993 29/01/2021 - -Northern Trust EUR 21 SGD 34 0�6137 29/01/2021 - -Northern Trust EUR 22 SGD 36 0�6138 29/01/2021 - -Northern Trust CHF 22 SGD 33 0�6632 29/01/2021 - -Northern Trust CHF 22 SGD 34 0�6630 29/01/2021 - -Northern Trust GBP 89 CHF 107 0�8309 29/01/2021 - -Northern Trust USD 25 CHF 22 1�1272 29/01/2021 - -Northern Trust JPY 1,082 GBP 8 138�0102 29/01/2021 - -Northern Trust JPY 1,068 GBP 8 137�9845 29/01/2021 - -Northern Trust USD 27 CHF 24 1�1272 29/01/2021 - -Northern Trust USD 38,028 HKD 294,791 0�1290 29/01/2021 - -Northern Trust CHF 107 SEK 999 0�1076 29/01/2021 - -Northern Trust USD 23 SGD 31 0�7475 29/01/2021 - -Northern Trust USD 25 SGD 33 0�7476 29/01/2021 - -Northern Trust CHF 22 SEK 210 0�1064 29/01/2021 - -Northern Trust EUR 21 SEK 215 0�0984 29/01/2021 - -Northern Trust CHF 23 SEK 213 0�1064 29/01/2021 - -Northern Trust EUR 22 SEK 228 0�0984 29/01/2021 - -Northern Trust CHF 215 GBP 180 1�1993 29/01/2021 - -Northern Trust USD 17 GBP 13 1�3281 29/01/2021 - -Northern Trust USD 17 GBP 13 1�3285 29/01/2021 (1) -Northern Trust USD 24 SEK 197 0�1199 29/01/2021 (1) -Northern Trust USD 25 SEK 207 0�1199 29/01/2021 (1) -Northern Trust CHF 218 SEK 2,025 0�1076 29/01/2021 (1) -Northern Trust EUR 92 SEK 927 0�0992 29/01/2021 (1) -Northern Trust HKD 1,466 CHF 167 8�7699 29/01/2021 (1) -

166
Federated Hermes Investment Funds Public Limited CompanyPortfolio Statement As at 31 December 2020 (continued)
a Header 1a Federated Hermes SDG Engagement Equity Fund (continued)
Nominal Holdings Financial liabilities at fair value through profit or loss
Fair Value $
% of Net Assets
. . . . . Financial Derivative Instruments: (0.19%) (2019: (0.11%)) (continued) Forward Currency Contracts: (0.19%) (2019: (0.11%)) (continued)
CounterpartyCurrency Buys
Currency Sells
Currency Rate
Maturity Date
Unrealised Loss
$
% of Net Assets
Northern Trust USD 153 JPY 15,835 0�0097 29/01/2021 (1) -Northern Trust USD 161 JPY 16,675 0�0097 29/01/2021 (1) -Northern Trust GBP 1,567 SEK 17,468 0�0897 29/01/2021 (1) -Northern Trust CHF 442 GBP 368 1�1993 29/01/2021 (1) -Northern Trust CHF 44 GBP 37 1�1783 29/01/2021 (1) -Northern Trust CHF 45 GBP 38 1�1784 29/01/2021 (1) -Northern Trust EUR 42 GBP 38 1�0905 29/01/2021 (1) -Northern Trust EUR 44 GBP 41 1�0906 29/01/2021 (1) -Northern Trust SEK 601,237 USD 73,632 0�1225 29/01/2021 (1) -Northern Trust EUR 190 GBP 172 1�1058 29/01/2021 (1) -Northern Trust CHF 601 SEK 5,589 0�1076 29/01/2021 (1) -Northern Trust USD 46 GBP 35 1�3283 29/01/2021 (1) -Northern Trust USD 161 EUR 132 1�2179 29/01/2021 (1) -Northern Trust USD 24,763 HKD 191,972 0�1290 29/01/2021 (1) -Northern Trust USD 49 GBP 37 1�3283 29/01/2021 (1) -Northern Trust USD 169 EUR 139 1�2180 29/01/2021 (1) -Northern Trust JPY 40,277 CHF 345 116�6334 29/01/2021 (1) -Northern Trust CHF 3,037 EUR 2,811 1�0805 29/01/2021 (2) -Northern Trust EUR 330 CHF 358 0�9212 29/01/2021 (2) -Northern Trust USD 12,479 HKD 96,746 0�1290 29/01/2021 (2) -Northern Trust USD 544 GBP 400 1�3598 29/01/2021 (2) -Northern Trust CHF 438 SGD 661 0�6632 29/01/2021 (2) -Northern Trust USD 23,563 HKD 182,677 0�1290 29/01/2021 (3) -Northern Trust CHF 1,260 GBP 1,051 1�1993 29/01/2021 (3) -Northern Trust EUR 651 JPY 82,689 0�0079 29/01/2021 (3) -Northern Trust GBP 1,283 CHF 1,544 0�8309 29/01/2021 (3) -Northern Trust CHF 10,431 GBP 8,683 1�2012 29/01/2021 (3) -Northern Trust EUR 850 CHF 922 0�9220 29/01/2021 (4) -Northern Trust EUR 531 SEK 5,357 0�0992 29/01/2021 (4) -Northern Trust USD 24,582 HKD 190,584 0�1290 29/01/2021 (4) -Northern Trust EUR 1,017 SGD 1,656 0�6144 29/01/2021 (4) -Northern Trust USD 1,061 GBP 780 1�3598 29/01/2021 (4) -Northern Trust SGD 96,365 USD 72,932 0�7568 29/01/2021 (5) -Northern Trust EUR 730 SEK 7,364 0�0992 29/01/2021 (5) -Northern Trust USD 62,461 HKD 484,226 0�1290 29/01/2021 (5) -Northern Trust EUR 741 SEK 7,471 0�0992 29/01/2021 (5) -Northern Trust GBP 11,552 SEK 128,820 0�0897 29/01/2021 (7) -Northern Trust CHF 442 SEK 4,154 0�1064 29/01/2021 (7) -Northern Trust EUR 1,094 GBP 989 1�1058 29/01/2021 (7) -Northern Trust USD 1,635 CHF 1,445 1�1313 29/01/2021 (7) -Northern Trust CHF 16,365 EUR 15,146 1�0805 29/01/2021 (8) -Northern Trust SEK 19,661 GBP 1,770 11�1077 29/01/2021 (8) -Northern Trust GBP 10,131 SGD 18,285 0�5541 29/01/2021 (9) -Northern Trust USD 96,609 HKD 748,965 0�1290 29/01/2021 (9) -

167
Federated Hermes Investment Funds Public Limited CompanyPortfolio Statement As at 31 December 2020 (continued)
a Header 1a Federated Hermes SDG Engagement Equity Fund (continued)
Nominal Holdings Financial liabilities at fair value through profit or loss
Fair Value $
% of Net Assets
. . . . . Financial Derivative Instruments: (0.19%) (2019: (0.11%)) (continued) Forward Currency Contracts: (0.19%) (2019: (0.11%)) (continued)
CounterpartyCurrency Buys
Currency Sells
Currency Rate
Maturity Date
Unrealised Loss
$
% of Net Assets
Northern Trust EUR 1,492 GBP 1,349 1�1058 29/01/2021 (9) -Northern Trust USD 63,350 HKD 491,148 0�1290 29/01/2021 (9) -Northern Trust EUR 1,521 GBP 1,375 1�1058 29/01/2021 (10) -Northern Trust EUR 2,081 SGD 3,391 0�6137 29/01/2021 (10) -Northern Trust USD 2,774 GBP 2,040 1�3598 29/01/2021 (11) -Northern Trust EUR 1,022 SEK 10,341 0�0988 29/01/2021 (11) -Northern Trust CHF 2,391 SGD 3,605 0�6632 29/01/2021 (12) -Northern Trust USD 133,651 EUR 108,837 1�2280 29/01/2021 (12) -Northern Trust EUR 1,911 SEK 19,265 0�0992 29/01/2021 (13) -Northern Trust EUR 3,756 JPY 476,779 0�0079 29/01/2021 (15) -Northern Trust CHF 33,374 EUR 30,888 1�0805 29/01/2021 (17) -Northern Trust USD 123,589 HKD 958,182 0�1290 29/01/2021 (18) -Northern Trust CHF 867 GBP 735 1�1784 29/01/2021 (19) -Northern Trust EUR 5,119 JPY 649,861 0�0079 29/01/2021 (21) -Northern Trust USD 5,392 GBP 3,965 1�3598 29/01/2021 (21) -Northern Trust EUR 5,214 JPY 661,970 0�0079 29/01/2021 (21) -Northern Trust GBP 9,458 CHF 11,383 0�8309 29/01/2021 (21) -Northern Trust EUR 3,397 GBP 3,072 1�1058 29/01/2021 (22) -Northern Trust GBP 26,929 SGD 48,603 0�5541 29/01/2021 (23) -Northern Trust EUR 1,964 GBP 1,785 1�1003 29/01/2021 (25) -Northern Trust CHF 4,879 SGD 7,358 0�6632 29/01/2021 (25) -Northern Trust CHF 10,016 SEK 93,121 0�1076 29/01/2021 (25) -Northern Trust USD 7,809 CHF 6,901 1�1316 29/01/2021 (31) -Northern Trust HKD 1,809,462 USD 233,456 0�1290 29/01/2021 (32) -Northern Trust USD 4,209 CHF 3,734 1�1272 29/01/2021 (33) -Northern Trust EUR 2,102 SEK 21,353 0�0984 29/01/2021 (33) -Northern Trust CHF 2,412 SEK 22,678 0�1064 29/01/2021 (37) -Northern Trust USD 3,585 SGD 4,791 0�7484 29/01/2021 (40) -Northern Trust CHF 20,450 GBP 17,051 1�1993 29/01/2021 (42) -Northern Trust EUR 11,510 JPY 1,461,138 0�0079 29/01/2021 (46) -Northern Trust CHF 95,931 EUR 88,785 1�0805 29/01/2021 (49) -Northern Trust USD 3,913 SGD 5,235 0�7475 29/01/2021 (49) -Northern Trust USD 19,947 SGD 26,426 0�7548 29/01/2021 (52) -Northern Trust CHF 13,186 SEK 122,773 0�1074 29/01/2021 (55) -Northern Trust GBP 8,333 CHF 10,062 0�8281 29/01/2021 (57) -Northern Trust EUR 11,860 SGD 19,325 0�6137 29/01/2021 (59) -Northern Trust USD 20,196 SEK 165,429 0�1221 29/01/2021 (63) -Northern Trust USD 6,693 CHF 5,947 1�1255 29/01/2021 (63) -Northern Trust USD 8,185 CHF 7,261 1�1272 29/01/2021 (65) -Northern Trust CHF 125,234 EUR 115,908 1�0805 29/01/2021 (67) -Northern Trust USD 7,349 SGD 9,801 0�7498 29/01/2021 (68) -Northern Trust CHF 13,879 SGD 20,929 0�6632 29/01/2021 (70) -Northern Trust USD 16,536 CHF 14,617 1�1313 29/01/2021 (71) -Northern Trust EUR 25,943 CHF 28,107 0�9230 29/01/2021 (71) -

168
Federated Hermes Investment Funds Public Limited CompanyPortfolio Statement As at 31 December 2020 (continued)
a Header 1a Federated Hermes SDG Engagement Equity Fund (continued)
Nominal Holdings Financial liabilities at fair value through profit or loss
Fair Value $
% of Net Assets
. . . . .Financial Derivative Instruments: (0.19%) (2019: (0.11%)) (continued)
Forward Currency Contracts: (0.19%) (2019: (0.11%)) (continued)
CounterpartyCurrency Buys
Currency Sells
Currency Rate
Maturity Date
Unrealised Loss
$
% of Net Assets
Northern Trust USD 8,010 SGD 10,681 0�7500 29/01/2021 (73) -Northern Trust CHF 4,922 SEK 46,274 0�1064 29/01/2021 (75) -Northern Trust USD 505,718 HKD 3,920,819 0�1290 29/01/2021 (75) -Northern Trust EUR 16,200 SGD 26,395 0�6137 29/01/2021 (81) -Northern Trust USD 7,313 SEK 60,381 0�1211 29/01/2021 (82) -Northern Trust EUR 16,564 SGD 26,990 0�6137 29/01/2021 (83) -Northern Trust USD 3,933 SEK 32,799 0�1199 29/01/2021 (84) -Northern Trust USD 129,019 JPY 13,301,979 0�0097 29/01/2021 (85) -Northern Trust USD 50,700 EUR 41,356 1�2260 29/01/2021 (89) -Northern Trust CHF 18,130 SGD 27,341 0�6631 29/01/2021 (94) -Northern Trust USD 7,609 SGD 10,180 0�7475 29/01/2021 (94) -Northern Trust CHF 322,087 GBP 268,136 1�2012 29/01/2021 (95) -Northern Trust EUR 4,157 GBP 3,812 1�0905 29/01/2021 (99) -Northern Trust USD 12,984 CHF 11,516 1�1274 29/01/2021 (100) -Northern Trust CHF 4,730 GBP 4,014 1�1784 29/01/2021 (106) -Northern Trust USD 39,888 GBP 29,299 1�3614 29/01/2021 (107) -Northern Trust GBP 10,100 SEK 113,483 0�0890 29/01/2021 (111) -Northern Trust CHF 17,742 SEK 165,496 0�1072 29/01/2021 (111) -Northern Trust USD 48,433 JPY 5,002,084 0�0097 29/01/2021 (115) -Northern Trust GBP 64,604 JPY 9,099,072 0�0071 29/01/2021 (123) -Northern Trust USD 8,047 SEK 66,749 0�1206 29/01/2021 (127) -Northern Trust EUR 50,524 CHF 54,732 0�9231 29/01/2021 (134) -Northern Trust USD 25,476 JPY 2,639,174 0�0097 29/01/2021 (139) -Northern Trust USD 11,995 SGD 16,045 0�7476 29/01/2021 (148) -Northern Trust GBP 22,149 CHF 26,746 0�8281 29/01/2021 (152) -Northern Trust USD 31,254 SGD 41,508 0�7530 29/01/2021 (159) -Northern Trust USD 7,645 SEK 63,762 0�1199 29/01/2021 (164) -Northern Trust USD 21,370 CHF 18,958 1�1272 29/01/2021 (169) -Northern Trust EUR 43,805 CHF 47,511 0�9220 29/01/2021 (180) -Northern Trust EUR 36,564 SGD 59,576 0�6137 29/01/2021 (182) -Northern Trust USD 51,493 JPY 5,324,738 0�0097 29/01/2021 (187) -Northern Trust EUR 11,978 SEK 121,667 0�0984 29/01/2021 (190) -Northern Trust EUR 52,426 SGD 85,328 0�6144 29/01/2021 (191) -Northern Trust GBP 67,613 EUR 75,316 0�8977 29/01/2021 (200) -Northern Trust CHF 14,028 SEK 131,874 0�1064 29/01/2021 (212) -Northern Trust USD 7,743 GBP 5,829 1�3283 29/01/2021 (214) -Northern Trust CHF 9,646 GBP 8,186 1�1784 29/01/2021 (215) -Northern Trust EUR 41,574 SGD 67,753 0�6136 29/01/2021 (217) -Northern Trust USD 26,785 EUR 21,991 1�2180 29/01/2021 (223) -Northern Trust USD 25,706 CHF 22,826 1�1262 29/01/2021 (227) -Northern Trust EUR 31,446 SEK 317,216 0�0991 29/01/2021 (229) -Northern Trust EUR 313,355 JPY 39,674,446 0�0079 29/01/2021 (231) -Northern Trust USD 13,943 GBP 10,393 1�3415 29/01/2021 (245) -Northern Trust USD 19,863 SGD 26,572 0�7475 29/01/2021 (246) -

169
Federated Hermes Investment Funds Public Limited CompanyPortfolio Statement As at 31 December 2020 (continued)
a Header 1a Federated Hermes SDG Engagement Equity Fund (continued)
Nominal Holdings Financial liabilities at fair value through profit or loss
Fair Value $
% of Net Assets
. . . . . Financial Derivative Instruments: (0.19%) (2019: (0.11%)) (continued) Forward Currency Contracts: (0.19%) (2019: (0.11%)) (continued)
CounterpartyCurrency Buys
Currency Sells
Currency Rate
Maturity Date
Unrealised Loss
$
% of Net Assets
Northern Trust USD 15,464 GBP 11,514 1�3431 29/01/2021 (253) -Northern Trust USD 12,048 SEK 100,455 0�1199 29/01/2021 (255) -Northern Trust SEK 604,374 GBP 54,411 11�1076 29/01/2021 (259) -Northern Trust EUR 16,355 SEK 166,127 0�0984 29/01/2021 (259) -Northern Trust CHF 34,093 GBP 28,569 1�1934 29/01/2021 (265) -Northern Trust EUR 16,727 SEK 169,905 0�0984 29/01/2021 (265) -Northern Trust USD 60,395 GBP 44,441 1�3590 29/01/2021 (270) -Northern Trust USD 49,540 JPY 5,132,169 0�0097 29/01/2021 (271) -Northern Trust EUR 88,710 SGD 144,317 0�6147 29/01/2021 (272) -Northern Trust CHF 18,209 SEK 171,187 0�1064 29/01/2021 (277) -Northern Trust GBP 26,847 SEK 301,652 0�0890 29/01/2021 (295) -Northern Trust JPY 1,679,453 GBP 12,165 138�0601 29/01/2021 (305) -Northern Trust CHF 54,472 SGD 82,207 0�6626 29/01/2021 (327) -Northern Trust GBP 171,726 JPY 24,186,462 0�0071 29/01/2021 (328) -Northern Trust USD 53,853 EUR 44,118 1�2207 29/01/2021 (329) -Northern Trust USD 41,685 CHF 36,980 1�1272 29/01/2021 (329) -Northern Trust EUR 89,819 SEK 903,420 0�0994 29/01/2021 (331) -Northern Trust EUR 73,540 CHF 79,832 0�9212 29/01/2021 (383) -Northern Trust USD 31,158 SEK 257,629 0�1209 29/01/2021 (392) -Northern Trust EUR 573,784 JPY 72,644,963 0�0079 29/01/2021 (395) -Northern Trust USD 76,559 JPY 7,929,560 0�0097 29/01/2021 (402) -Northern Trust USD 15,057 GBP 11,335 1�3283 29/01/2021 (417) -Northern Trust USD 19,950 SEK 166,393 0�1199 29/01/2021 (427) -Northern Trust USD 52,088 EUR 42,766 1�2180 29/01/2021 (433) -Northern Trust EUR 47,550 SGD 77,743 0�6116 29/01/2021 (438) -Northern Trust CHF 54,199 SEK 506,408 0�1070 29/01/2021 (442) -Northern Trust USD 38,759 SGD 51,851 0�7475 29/01/2021 (481) -Northern Trust GBP 179,723 EUR 200,200 0�8977 29/01/2021 (533) -Northern Trust EUR 47,311 SEK 478,896 0�0988 29/01/2021 (545) -Northern Trust EUR 23,695 GBP 21,729 1�0905 29/01/2021 (561) -Northern Trust EUR 177,394 GBP 160,010 1�1086 29/01/2021 (565) -Northern Trust EUR 52,667 SEK 532,848 0�0988 29/01/2021 (576) -Northern Trust EUR 36,659 SEK 372,364 0�0984 29/01/2021 (581) -Northern Trust CHF 27,726 GBP 23,529 1�1784 29/01/2021 (619) -Northern Trust USD 23,170 GBP 17,442 1�3284 29/01/2021 (639) -Northern Trust EUR 41,756 SEK 424,166 0�0984 29/01/2021 (665) -Northern Trust USD 82,858 EUR 68,016 1�2182 29/01/2021 (673) -Northern Trust USD 129,331 JPY 13,398,196 0�0097 29/01/2021 (707) -Northern Trust USD 26,707 GBP 20,106 1�3283 29/01/2021 (739) -Northern Trust CHF 1,474,824 EUR 1,364,958 1�0805 29/01/2021 (745) -Northern Trust CHF 303,873 SEK 2,825,264 0�1076 29/01/2021 (765) -Northern Trust EUR 32,363 GBP 29,678 1�0905 29/01/2021 (767) -Northern Trust CHF 35,020 GBP 29,720 1�1783 29/01/2021 (783) -Northern Trust EUR 33,091 GBP 30,345 1�0905 29/01/2021 (784) -

170
Federated Hermes Investment Funds Public Limited CompanyPortfolio Statement As at 31 December 2020 (continued)
a Header 1a Federated Hermes SDG Engagement Equity Fund (continued)
Nominal Holdings Financial liabilities at fair value through profit or loss
Fair Value $
% of Net Assets
. . . . . Financial Derivative Instruments: (0.19%) (2019: (0.11%)) (continued) Forward Currency Contracts: (0.19%) (2019: (0.11%)) (continued)
CounterpartyCurrency Buys
Currency Sells
Currency Rate
Maturity Date
Unrealised Loss
$
% of Net Assets
Northern Trust USD 38,946 SEK 324,822 0�1199 29/01/2021 (834) -Northern Trust USD 39,311 GBP 29,594 1�3283 29/01/2021 (1,088) -Northern Trust CHF 215,544 SGD 325,026 0�6632 29/01/2021 (1,093) -Northern Trust USD 135,988 EUR 111,651 1�2180 29/01/2021 (1,132) -Northern Trust EUR 353,473 GBP 318,839 1�1086 29/01/2021 (1,134) -Northern Trust USD 199,305 JPY 20,655,946 0�0096 29/01/2021 (1,174) -Northern Trust CHF 594,347 GBP 495,565 1�1993 29/01/2021 (1,232) -Northern Trust EUR 101,208 GBP 91,981 1�1003 29/01/2021 (1,266) -Northern Trust USD 169,759 CHF 150,601 1�1272 29/01/2021 (1,342) -Northern Trust USD 208,587 EUR 170,952 1�2201 29/01/2021 (1,361) -Northern Trust USD 252,312 JPY 26,138,556 0�0097 29/01/2021 (1,379) -Northern Trust CHF 103,338 GBP 87,160 1�1856 29/01/2021 (1,576) -Northern Trust EUR 72,334 GBP 66,332 1�0905 29/01/2021 (1,714) -Northern Trust EUR 90,206 GBP 82,426 1�0944 29/01/2021 (1,734) -Northern Trust EUR 80,307 GBP 73,651 1�0904 29/01/2021 (1,912) -Northern Trust USD 156,867 SGD 209,851 0�7475 29/01/2021 (1,946) -Northern Trust USD 76,682 GBP 57,729 1�3283 29/01/2021 (2,121) -Northern Trust USD 265,276 EUR 217,801 1�2180 29/01/2021 (2,207) -Northern Trust CHF 217,578 SEK 2,045,361 0�1064 29/01/2021 (3,294) -Northern Trust USD 162,244 SEK 1,353,178 0�1199 29/01/2021 (3,475) -Northern Trust EUR 559,195 GBP 505,684 1�1058 29/01/2021 (3,540) -Northern Trust USD 26,690,419 HKD 206,930,070 0�1290 29/01/2021 (3,978) -Northern Trust USD 1,175,664 GBP 864,563 1�3598 29/01/2021 (4,522) -Northern Trust USD 1,029,128 JPY 106,613,669 0�0097 29/01/2021 (5,624) -Northern Trust USD 311,075 GBP 234,187 1�3283 29/01/2021 (8,606) -Northern Trust USD 1,094,803 EUR 898,872 1�2180 29/01/2021 (9,110) -Northern Trust JPY 52,063,254 GBP 377,106 138�0601 29/01/2021 (9,468) -Northern Trust CHF 426,294 GBP 361,766 1�1784 29/01/2021 (9,515) -Northern Trust CHF 43,484,808 EUR 40,245,452 1�0805 29/01/2021 (21,977) -Northern Trust USD 838,603 GBP 631,327 1�3283 29/01/2021 (23,200) -Northern Trust EUR 5,963,460 SGD 9,716,730 0�6137 29/01/2021 (29,724) -Northern Trust CHF 6,351,904 SGD 9,578,246 0�6632 29/01/2021 (32,194) -Northern Trust USD 9,003,571 CHF 7,987,500 1�1272 29/01/2021 (71,158) (0�01)Northern Trust CHF 6,399,359 SEK 60,157,684 0�1064 29/01/2021 (96,876) (0�01)Northern Trust EUR 6,209,148 SEK 63,069,971 0�0984 29/01/2021 (98,443) (0�01)Northern Trust USD 8,373,197 SGD 11,201,369 0�7475 29/01/2021 (103,859) (0�01)Northern Trust USD 8,395,991 SEK 70,025,927 0�1199 29/01/2021 (179,828) (0�01)Northern Trust CHF 12,565,442 GBP 10,663,410 1�1784 29/01/2021 (280,462) (0�02)Northern Trust EUR 11,911,590 GBP 10,923,214 1�0905 29/01/2021 (282,192) (0�02)Northern Trust USD 54,493,518 JPY 5,645,315,937 0�0097 29/01/2021 (297,796) (0�02)Northern Trust USD 16,561,712 GBP 12,468,174 1�3283 29/01/2021 (458,177) (0�04)

171
Federated Hermes Investment Funds Public Limited CompanyPortfolio Statement As at 31 December 2020 (continued)
a Header 1a Federated Hermes SDG Engagement Equity Fund (continued)
Nominal Holdings Financial liabilities at fair value through profit or loss
Fair Value $
% of Net Assets
. . . . .Financial Derivative Instruments: (0.19%) (2019: (0.11%)) (continued)
Forward Currency Contracts: (0.19%) (2019: (0.11%)) (continued)
CounterpartyCurrency Buys
Currency Sells
Currency Rate
Maturity Date
Unrealised Loss
$
% of Net Assets
Northern Trust USD 57,309,623 EUR 47,053,240 1�2180 29/01/2021 (476,857) (0�04)
Unrealised Losses on Forward Currency Contracts (2,568,603) (0.19)
Total Financial Derivative Instruments (2,568,603) (0.19)
Total financial liabilities at fair value through profit or loss (2,568,603) (0.19)
Financial assets at fair value through profit or lossNet financial assets at fair value through profit or loss (2019: 95.46%) (Cost: $ 1,112,388,727)
1,312,306,279 98.01
Net Cash (2019: 3.90%) 31,929,354 2.38
Other Net Liabilities (2019: 0.64%) (5,253,929) (0.39)
Net Assets Attributable to Holders of Redeemable Participating Shares 1,338,981,704 100.00
Portfolio Classification
% of Total Assets
Transferable securities admitted to official stock exchange listing 96�94OTC financial derivative instruments 0�45Cash 2�36Other assets 0�25Total 100.00

172
Federated Hermes Investment Fund Public Limited CompanyPortfolio StatementAs at 31 December 2020 (continued)
a Header 1a Federated Hermes Impact Opportunities Equity Fund
Nominal Holdings Financial assets at fair value through profit or loss
Fair Value $
% of Net Assets
. . . . .American Depositary Receipts: 0.00% (2019: 0.40%)
United Kingdom: 0.00% (2019: 0.40%) - -
Equities: 98.24% (2019: 98.49%)
Australia: 6.05% (2019: 7.66%)
1,450,000 Brambles 11,897,148 2�6470,000 CSL 15,343,684 3�41
Total Australia 27,240,832 6.05
Belgium: 2.66% (2019: 4.29%)
250,000 Umicore 11,969,731 2�66
Total Belgium 11,969,731 2.66
Brazil: 0.00% (2019: 2.39%) - -
Canada: 1.73% (2019: 0.00%)
330,000 Ballard Power Systems 7,774,800 1�73
Total Canada 7,774,800 1.73
Denmark: 10.85% (2019: 8.24%)
240,000 Novo Nordisk 16,891,455 3�75109,554 Orsted 22,472,847 4�99
40,000 Vestas Wind Systems 9,498,515 2�11
Total Denmark 48,862,817 10.85
France: 0.00% (2019: 3.27%) - -
Germany: 9.45% (2019: 13.82%)
104,087 Carl Zeiss Meditec 13,912,104 3�09220,000 Hella 14,283,899 3�17
34,000 Sartorius - Preferred 14,338,394 3�19
Total Germany 42,534,397 9.45
Guernsey: 1.87% (2019: 0.98%)
2,376,500 Syncona 8,419,218 1�87
Total Guernsey 8,419,218 1.87

173
Federated Hermes Investment Fund Public Limited CompanyPortfolio Statement As at 31 December 2020 (continued)
a Header 1a Federated Hermes Impact Opportunities Equity Fund (continued)
Nominal Holdings Financial assets at fair value through profit or loss
Fair Value $
% of Net Assets
. . . . .Equities: 98.24% (2019: 98.49%) (continued)
Indonesia: 1.92% (2019: 4.53%)
29,119,548 Bank Rakyat Indonesia Persero 8,642,599 1�92
Total Indonesia 8,642,599 1.92
Ireland: 3.05% (2019: 0.00%)
190,000 Kingspan Group 13,711,955 3�05
Total Ireland 13,711,955 3.05
Japan: 0.00% (2019: 3.70%) - -
Norway: 3.05% (2019: 3.45%)
276,500 Tomra Systems 13,713,774 3�05
Total Norway 13,713,774 3.05
South Africa: 0.00% (2019: 0.55%) - -
Spain: 4.42% (2019: 3.61%)
490,000 Siemens Gamesa Renewable Energy 19,894,362 4�42
Total Spain 19,894,362 4.42
Switzerland: 6.53% (2019: 3.76%)
28,000 Lonza Group 18,079,691 4�029,660 Straumann 11,311,489 2�51
Total Switzerland 29,391,180 6.53
United Kingdom: 3.62% (2019: 4.10%)
769,900 Abcam 16,276,267 3�62
Total United Kingdom 16,276,267 3.62
United States: 43.04% (2019: 34.14%)
147,000 Agilent Technologies 17,256,330 3�8345,100 ANSYS 16,340,632 3�63
110,000 Blackbaud 6,323,900 1�4050,000 DexCom 18,138,500 4�0369,000 Ecolab 14,851,560 3�30
125,000 Emergent BioSolutions 11,587,500 2�58325,000 Hannon Armstrong Sustainable Infrastructure Capital 20,900,750 4�64
43,000 Illumina 15,655,870 3�4888,752 Itron 8,445,640 1�88

174
Federated Hermes Investment Fund Public Limited CompanyPortfolio Statement As at 31 December 2020 (continued)
a Header 1a Federated Hermes Impact Opportunities Equity Fund (continued)
Nominal Holdings Financial assets at fair value through profit or loss
Fair Value $
% of Net Assets
. . . . .Equities: 98.24% (2019: 98.49%) (continued)
United States: 43.04% (2019: 34.14%) (continued)
160,000 Livanova 10,713,600 2�38142,219 Planet Fitness 11,098,771 2�46345,000 Qiagen 17,974,848 3�99
69,300 Strategic Education 6,652,800 1�48176,700 Xylem 17,807,826 3�96
Total United States 193,748,527 43.04
Total Equities 442,180,459 98.24
Financial Derivative Instruments: 0.00% (2019: 0.00%)
Forward Currency Contracts: 0.00% (2019: 0.00%)
CounterpartyCurrency Buys
Currency Sells
Currency Rate
Maturity Date
Unrealised Gain
$
% of Net Assets
Northern Trust EUR 740,899 USD 902,395 1�2180 29/01/2021 7,509 -Northern Trust GBP 1,331 USD 1,768 1�3283 29/01/2021 49 -Northern Trust GBP 1,324 USD 1,758 1�3283 29/01/2021 49 -Northern Trust GBP 57 USD 77 1�3598 29/01/2021 - -Northern Trust GBP 56 USD 76 1�3598 29/01/2021 - -
Unrealised Gains on Forward Currency Contracts 7,607 -
Total Financial Derivative Instruments 7,607 -
Total financial assets at fair value through profit or loss 442,188,066 98.24
Financial liabilities at fair value through profit or loss
Financial Derivative Instruments: 0.00% (2019: 0.00%)
Forward Currency Contracts: 0.00% (2019: 0.00%)
CounterpartyCurrency Buys
Currency Sells
Currency Rate
Maturity Date
Unrealised Loss
$
% of Net Assets
Northern Trust USD 13,870 EUR 11,386 1�2182 29/01/2021 (113) -
Unrealised Losses on Forward Currency Contracts (113) -
Total Financial Derivative Instruments (113) -
Total financial liabilities at fair value through profit or loss (113) -

175
Federated Hermes Investment Fund Public Limited CompanyPortfolio Statement As at 31 December 2020 (continued)
a Header 1a Federated Hermes Impact Opportunities Equity Fund (continued)
Nominal Holdings Financial assets at fair value through profit or loss
Fair Value $
% of Net Assets
. . . . .Net financial assets at fair value through profit or loss (2019: 98.89%) (Cost: $ 317,918,317)
442,187,953 98.24
Net Cash (2019: 1.10%) 9,283,940 2.06
Other Net Liabilities (2019: 0.01%) (1,374,382) (0.30)
Net Assets Attributable to Holders of Redeemable Participating Shares 450,097,511 100.00
Portfolio Classification
% of Total Assets
Transferable securities admitted to official stock exchange listing 97�92Cash 2�06Other assets 0�02Total 100.00

176
Federated Hermes Investment Funds Public Limited CompanyPortfolio StatementAs at 31 December 2020 (continued)
a Header 1a Federated Hermes Unconstrained Credit Fund
Nominal Holdings Financial assets at fair value through profit or loss
Fair Value $
% of Net Assets
. . . . .Corporate Bonds: 53.65% (2019: 56.00%)
Austria: 0.00% (2019: 0.76%) - -
Belgium: 0.25% (2019: 0.00%)
1,600,000 Telenet Finance Lux Note 3�500% 01/03/2028 2,035,987 0�25
Total Belgium 2,035,987 0.25
Brazil: 1.78% (2019: 2.99%)
900,000 Gerdau Trade 4�875% 24/10/2027 1,045,134 0�12812,000 GUSAP III 4�250% 21/01/2030 907,418 0�11200,000 NBM US 7�000% 14/05/2026 218,052 0�03
1,375,000 Petrobras Global Finance 5�600% 03/01/2031 1,582,350 0�193,528,000 Suzano Austria 5�000% 15/01/2030 4,011,795 0�491,000,000 Vale 3�750% 10/01/2023 1,306,396 0�16
502,000 Vale Overseas 3�750% 08/07/2030 558,982 0�074,077,000 Vale Overseas 6�250% 10/08/2026 5,061,595 0�61
Total Brazil 14,691,722 1.78
Canada: 0.24% (2019: 0.31%)
1,852,000 First Quantum Minerals 6�875% 01/03/2026 1,934,182 0�24
Total Canada 1,934,182 0.24
Chile: 0.35% (2019: 1.08%)
2,200,000 SACI Falabella 3�750% 30/10/2027 2,377,845 0�29250,000 VTR Finance 6�375% 15/07/2028 273,437 0�03200,000 VTR Finance 6�375% 15/07/2028 218,750 0�03
Total Chile 2,870,032 0.35
Colombia: 0.03% (2019: 0.00%)
250,000 Ecopetrol 4�125% 16/01/2025 272,190 0�03
Total Colombia 272,190 0.03
Finland: 0.46% (2019: 0.64%)
2,750,000 Stora Enso 7�250% 15/04/2036 3,807,956 0�46
Total Finland 3,807,956 0.46
France: 0.45% (2019: 0.72%)
301,000 Faurecia 2�375% 15/06/2027 372,662 0�04700,000 Faurecia 2�625% 15/06/2025 871,546 0�11
1,738,000 Renault 1�000% 08/03/2023 2,131,889 0�26

177
Federated Hermes Investment Funds Public Limited CompanyPortfolio Statement As at 31 December 2020 (continued)
a Header 1a Federated Hermes Unconstrained Credit Fund (continued)
Nominal Holdings Financial assets at fair value through profit or loss
Fair Value $
% of Net Assets
. . . . .Corporate Bonds: 53.65% (2019: 56.00%) (continued)
France: 0.45% (2019: 0.72%) (continued)
250,000 Rexel 2�125% 15/06/2025 308,121 0�04
Total France 3,684,218 0.45
Germany: 0.40% (2019: 0.54%)
700,000 ADLER Group 2�750% 13/11/2026 879,500 0�11150,000 ADLER Real Estate 2�125% 06/02/2024 186,141 0�02200,000 ADLER Real Estate 3�000% 27/04/2026 258,328 0�03900,000 Commerzbank 1�750% 22/01/2025 1,252,917 0�15707,000 Fresenius US Finance II 4�500% 15/01/2023 751,539 0�09
Total Germany 3,328,425 0.40
Hong Kong: 0.20% (2019: 0.32%)
1,600,000 FTL Capital 4�125% 25/04/2023 1,661,656 0�20
Total Hong Kong 1,661,656 0.20
India: 0.56% (2019: 0.83%)
4,200,000 Bharti Airtel International 4�375% 10/06/2025 4,573,989 0�56
Total India 4,573,989 0.56
Ireland: 1.07% (2019: 1.36%)
3,250,000 AerCap Ireland Cap/Global 3�650% 21/07/2027 3,533,684 0�431,200,000 Ardagh Packaging Finance 4�750% 15/07/2027 1,707,498 0�212,800,000 Smurfit Kappa 1.500% 15/09/2027 3,592,149 0�43
Total Ireland 8,833,331 1.07
Israel: 0.07% (2019: 0.11%)
539,000 Israel Electric 5�000% 12/11/2024 610,291 0�07
Total Israel 610,291 0.07
Italy: 2.29% (2019: 1.61%)
1,000,000 Banco BPM 1�625% 18/02/2025 1,214,988 0�15200,000 Credito Emiliano 1�125% 17/01/2024 255,484 0�03100,000 Infrastrutture Wireless Italiane 1�625% 21/10/2028 125,781 0�02
5,650,000 Intesa Sanpaolo 5�017% 26/06/2024 6,184,518 0�752,000,000 Telecom Italia 1�125% 26/03/2022 2,442,597 0�295,000,000 Telecom Italia 2�750% 15/04/2025 6,424,338 0�78

178
Federated Hermes Investment Funds Public Limited CompanyPortfolio Statement As at 31 December 2020 (continued)
a Header 1a Federated Hermes Unconstrained Credit Fund (continued)
Nominal Holdings Financial assets at fair value through profit or loss
Fair Value $
% of Net Assets
. . . . .Corporate Bonds: 53.65% (2019: 56.00%) (continued)
Italy: 2.29% (2019: 1.61%) (continued)
1,800,000 Telecom Italia Capital 6�000% 30/09/2034 2,197,062 0�27
Total Italy 18,844,768 2.29
Japan: 0.00% (2019: 0.04%) - -
Luxembourg: 1.80% (2019: 1.10%)
989,796 Altice Financing 0% 31/01/2026 1,191,991 0�151,726,000 Altice Financing 3�000% 15/01/2028 2,039,443 0�251,390,000 Altice Luxembourg SA 4�000% 15/02/2028 1,626,327 0�201,200,000 Eurofins Scientific 2.125% 25/07/2024 1,564,270 0�19
295,000 Eurofins Scientific 3.375% 30/01/2023 383,388 0�051,409,000 Logicor Financing 1�500% 13/07/2026 1,821,166 0�22
100,000 Matterhorn Telecom 3�125% 15/09/2026 121,682 0�011,730,000 Millicom International Cellular 5�125% 15/01/2028 1,841,412 0�223,286,000 SIG Combibloc 2�125% 18/06/2025 4,237,697 0�51
Total Luxembourg 14,827,376 1.80
Malaysia: 0.00% (2019: 0.20%) - -
Mexico: 0.25% (2019: 1.63%)
200,000 Cemex 5�450% 19/11/2029 220,352 0�031,250,000 Orbia Advance Corp SAB de CV 5�500% 15/01/2048 1,519,062 0�18
300,000 Petroleos Mexicanos 2�750% 21/04/2027 346,407 0�04
Total Mexico 2,085,821 0.25
Netherlands: 3.43% (2019: 1.61%)
5,075,000 Ashland Services 2�000% 30/01/2028 6,217,278 0�75653,000 NXP 3�400% 01/05/2030 741,977 0�09
5,750,000 NXP 3�875% 01/09/2022 6,061,589 0�741,801,000 Q-Park Holding 2�000% 01/03/2027 2,138,268 0�26
800,000 Trivium Packaging 3�750% 15/08/2026 1,010,041 0�122,098,000 United Group 3�625% 15/02/2028 2,522,085 0�31
400,000 UPC 3�875% 15/06/2029 504,103 0�063,012,000 VEON 3�375% 25/11/2027 3,098,173 0�38
600,000 VEON 4�000% 09/04/2025 636,105 0�082,181,000 VZ Vendor Financing 2�875% 15/01/2029 2,664,560 0�322,171,000 Ziggo 3�375% 28/02/2030 2,679,902 0�32
Total Netherlands 28,274,081 3.43
Norway: 0.39% (2019: 0.51%)
2,211,000 Aker BP 3�750% 15/01/2030 2,330,955 0�28

179
Federated Hermes Investment Funds Public Limited CompanyPortfolio Statement As at 31 December 2020 (continued)
a Header 1a Federated Hermes Unconstrained Credit Fund (continued)
Nominal Holdings Financial assets at fair value through profit or loss
Fair Value $
% of Net Assets
. . . . .Corporate Bonds: 53.65% (2019: 56.00%) (continued)
Norway: 0.39% (2019: 0.51%) (continued)
864,000 Aker BP 4�750% 15/06/2024 894,081 0�11
Total Norway 3,225,036 0.39
People's Republic of China: 0.21% (2019: 0.19%)
1,000,000 Country Garden 5�125% 17/01/2025 1,052,032 0�13600,000 Country Garden 5�625% 14/01/2030 665,700 0�08
Total People's Republic of China 1,717,732 0.21
Poland: 0.16% (2019: 0.00%)
1,035,000 Canpack SA Eastern Land 2�375% 01/11/2027 1,309,114 0�16
Total Poland 1,309,114 0.16
Portugal: 0.00% (2019: 0.04%) - -
Russian Federation: 0.11% (2019: 1.88%)
620,000 Novolipetsk Steel Via Steel Funding DAC 4�700% 30/05/2026 703,100 0�08200,000 Severstal Via Steel Capital 3�150% 16/09/2024 209,563 0�03
Total Russian Federation 912,663 0.11
South Africa: 1.83% (2019: 2.44%)
6,874,000 Anglo American Capital 3�375% 11/03/2029 10,629,406 1�292,117,000 Sappi Papier 3�125% 15/04/2026 2,531,366 0�311,900,000 Sappi Papier 7�500% 15/06/2032 1,881,000 0�23
Total South Africa 15,041,772 1.83
Spain: 1.96% (2019: 0.28%)
4,000,000 Cellnex Telecom 0�750% 20/11/2031 4,736,414 0�581,700,000 Cellnex Telecom 1�000% 20/04/2027 2,060,533 0�251,600,000 Grifols 1�625% 15/02/2025 1,966,490 0�245,790,000 Grifols 2�250% 15/11/2027 7,204,789 0�87
100,000 Lorca Telecom Bond 4�000% 18/09/2027 129,133 0�02
Total Spain 16,097,359 1.96
Sweden: 0.06% (2019: 0.00%)
400,000 Volvo Car 2�125% 02/04/2024 506,202 0�06
Total Sweden 506,202 0.06

180
Federated Hermes Investment Funds Public Limited CompanyPortfolio Statement As at 31 December 2020 (continued)
a Header 1a Federated Hermes Unconstrained Credit Fund (continued)
Nominal Holdings Financial assets at fair value through profit or loss
Fair Value $
% of Net Assets
. . . . .Corporate Bonds: 53.65% (2019: 56.00%) (continued)
Turkey: 0.62% (2019: 0.85%)
1,600,000 Akbank 5�125% 31/03/2025 1,624,000 0�19600,000 Arcelik 5�000% 03/04/2023 624,240 0�08
1,650,000 Turk Telekomunikasyon 4�875% 19/06/2024 1,711,017 0�21300,000 Turkiye Garanti Bankasi 5�875% 16/03/2023 312,286 0�04816,000 Turkiye Vakiflar Bankasi 5.250% 05/02/2025 805,955 0�10
Total Turkey 5,077,498 0.62
United Kingdom: 3.31% (2019: 1.84%)
9,250,000 Fiat Chrysler Automobiles 5�250% 15/04/2023 9,932,187 1�211,200,000 International Consolidated Airlines 0�500% 04/07/2023 1,367,085 0�172,916,000 Logicor 2019-1 1�875% 17/11/2026 4,261,556 0�521,814,000 Marks & Spencer 3�250% 10/07/2027 2,584,056 0�31
322,000 Marks & Spencer 3�750% 19/05/2026 450,401 0�05659,000 Neptune Energy 6�625% 15/05/2025 653,576 0�08
1,177,000 Pension Insurance 5�625% 20/09/2030 2,032,872 0�24350,000 Phoenix Group 5�625% 28/04/2031 591,502 0�07
3,374,000 Rothesay Life 3�375% 12/07/2026 4,926,436 0�60371,000 Tesco 6�150% 15/11/2037 480,809 0�06
Total United Kingdom 27,280,480 3.31
United States: 31.37% (2019: 32.12%)
9,443,000 AbbVie 4�550% 15/03/2035 11,970,731 1�451,800,000 AES Corporation 2�450% 15/01/2031 1,825,861 0�22
850,000 AES Corporation 3�950% 15/07/2030 962,442 0�125,055,000 Air Lease 3�625% 01/12/2027 5,465,027 0�663,457,000 Aircastle 4�125% 01/05/2024 3,659,963 0�441,996,000 Aircastle 4�250% 15/06/2026 2,104,586 0�262,202,000 Alcoa Nederland 6�125% 15/05/2028 2,409,814 0�29
227,000 Ally Financial 3�875% 21/05/2024 248,928 0�035,820,000 Ally Financial 4�625% 30/03/2025 6,640,205 0�813,400,000 Ally Financial 5�750% 20/11/2025 3,961,797 0�48
554,000 Apache 4�250% 15/01/2030 582,739 0�077,583,000 Ardagh Packaging Finance 2�125% 15/08/2026 9,316,046 1�13
200,000 Ardagh Packaging Finance 4�125% 15/08/2026 209,250 0�02200,000 Ardagh Packaging Finance 5�250% 15/08/2027 210,162 0�03
3,450,000 Ball 1�500% 15/03/2027 4,345,986 0�536,265,000 Ball Corporation 0�875% 15/03/2024 7,688,538 0�931,000,000 Berry Global 1�000% 15/01/2025 1,237,315 0�156,893,000 Berry Global 1�500% 15/01/2027 8,621,585 1�05
900,000 Berry Global Inc 1�000% 15/01/2025 1,113,583 0�131,976,000 Calpine 5�125% 15/03/2028 2,081,489 0�253,973,000 Catalent Pharma Solutions 2�375% 01/03/2028 4,903,991 0�594,338,000 CCO 4�250% 01/02/2031 4,577,067 0�56
100,000 Celanese US 1�125% 26/09/2023 125,022 0�021,505,000 CenturyLink 4�000% 15/02/2027 1,555,974 0�19

181
Federated Hermes Investment Funds Public Limited CompanyPortfolio Statement As at 31 December 2020 (continued)
a Header 1a Federated Hermes Unconstrained Credit Fund (continued)
Nominal Holdings Financial assets at fair value through profit or loss
Fair Value $
% of Net Assets
. . . . .Corporate Bonds: 53.65% (2019: 56.00%) (continued)
United States: 31.37% (2019: 32.12%) (continued)
250,000 CenturyLink 6�875% 15/01/2028 290,420 0�04325,000 Cf Industries 3�450% 01/06/2023 339,219 0�04
2,700,000 Charter Communications Operating 5�375% 01/05/2047 3,375,018 0�411,955,000 CIT 5�000% 01/08/2023 2,139,503 0�26
121,000 Clearway Energy 4�750% 15/03/2028 129,886 0�022,784,000 Clearway Energy 5�000% 15/09/2026 2,891,351 0�352,127,000 Cleveland-Cliffs 6�750% 15/03/2026 2,299,819 0�281,093,000 Cleveland-Cliffs 6�750% 15/03/2026 1,181,806 0�14
644,000 Cleveland-Cliffs 7�000% 15/03/2027 626,290 0�082,300,000 Crown European 0�750% 15/02/2023 2,813,039 0�345,319,000 Crown European 2�875% 01/02/2026 6,989,929 0�856,400,000 CSC 3�375% 15/02/2031 6,288,000 0�76
750,000 D�R Horton 4�750% 15/02/2023 807,450 0�103,742,000 DCP Midstream Operating 5�125% 15/05/2029 4,156,651 0�50
851,000 DCP Midstream Operating 5�600% 01/04/2044 881,223 0�11250,000 Dell 5�400% 10/09/2040 282,549 0�03
6,450,000 Dell 6�020% 15/06/2026 7,874,049 0�963,181,000 Domtar 6�250% 01/09/2042 3,828,310 0�46
500,000 Domtar 6�750% 15/02/2044 635,502 0�08819,000 EnLink Midstream Partners 5�050% 01/04/2045 656,171 0�08
1,345,000 EnLink Midstream Partners 5�450% 01/06/2047 1,086,451 0�135,655,000 EnLink Midstream Partners 5�600% 01/04/2044 4,562,426 0�551,857,000 EQM Midstream Partners 6�500% 15/07/2048 1,934,186 0�244,001,000 EQT 3�900% 01/10/2027 3,982,295 0�481,700,000 Ford Motor Credit 3�200% 15/01/2021 1,704,038 0�211,350,000 Ford Motor Credit LLC 3�336% 18/03/2021 1,355,062 0�164,650,000 Goodyear Tire & Rubber 4�875% 15/03/2027 4,763,344 0�583,594,000 Hanesbrands 4�875% 15/05/2026 3,908,475 0�471,500,000 HCA 3�500% 01/09/2030 1,595,117 0�193,454,000 HCA 4�750% 01/05/2023 3,768,091 0�46
400,000 HCA 5�375% 01/02/2025 450,406 0�061,400,000 HCA 7�500% 15/11/2095 1,833,013 0�223,700,000 Huntsman International 4�250% 01/04/2025 5,095,155 0�625,170,000 IQVIA 2�250% 15/01/2028 6,398,500 0�77
850,000 IQVIA 2�875% 15/06/2028 1,077,666 0�13270,000 KB Home 4�800% 15/11/2029 296,831 0�04
1,450,000 Kinder Morgan Energy Partners 4�700% 01/11/2042 1,665,513 0�205,000,000 Kinder Morgan Energy Partners 5�625% 01/09/2041 6,115,312 0�741,250,000 Kraft Heinz Foods 2�250% 25/05/2028 1,620,402 0�20
125,000 Kraft Heinz Foods 4�250% 01/03/2031 139,496 0�023,844,000 Kraft Heinz Foods 4�375% 01/06/2046 4,165,458 0�51
778,000 L Brands 7�600% 15/07/2037 840,240 0�101,500,000 Lennar 4�125% 15/01/2022 1,538,437 0�193,834,000 Lennar 4�750% 29/11/2027 4,535,814 0�551,309,000 Lennar 5�000% 15/06/2027 1,544,620 0�19
350,000 Levi Strauss 3�375% 15/03/2027 444,229 0�051,850,000 Marathon Oil 5�200% 01/06/2045 2,110,170 0�265,783,000 MPT Operating Partnership 3�692% 05/06/2028 8,580,861 1�04

182
Federated Hermes Investment Funds Public Limited CompanyPortfolio Statement As at 31 December 2020 (continued)
a Header 1a Federated Hermes Unconstrained Credit Fund (continued)
Nominal Holdings Financial assets at fair value through profit or loss
Fair Value $
% of Net Assets
. . . . . Corporate Bonds: 53.65% (2019: 56.00%) (continued) United States: 31.37% (2019: 32.12%) (continued)
650,000 Netflix 3.000% 15/06/2025 853,524 0�10200,000 Netflix 5.375% 01/02/2021 201,125 0�02
1,404,000 Novelis 4�750% 30/01/2030 1,515,253 0�18298,000 NRG Energy 2�450% 02/12/2027 313,937 0�04992,000 Occidental Petroleum 3�500% 15/08/2029 909,436 0�11
1,698,000 Occidental Petroleum 4�100% 15/02/2047 1,391,214 0�17447,000 OI European Group 4�000% 15/03/2023 457,337 0�06
3,000 Onemain Financial 4�000% 15/09/2030 3,117 -4,307,000 Post 4�625% 15/04/2030 4,536,176 0�551,331,000 Range Resources 4�875% 15/05/2025 1,259,745 0�15
228,000 Range Resources 9�250% 01/02/2026 238,602 0�03780,000 Seagate HDD Cayman 3�375% 15/07/2031 785,683 0�10200,000 Seagate HDD Cayman 3�375% 15/07/2031 201,457 0�03
3,400,000 Sealed Air 4�000% 01/12/2027 3,638,000 0�44300,000 Sealed Air 4�500% 15/09/2023 400,916 0�05400,000 Sealed Air 6�875% 15/07/2033 529,250 0�06
4,802,000 Silgan 2�250% 01/06/2028 5,978,132 0�73470,000 Steel Dynamics 2�400% 15/06/2025 500,068 0�06286,000 Tenet Healthcare 4�625% 15/06/2028 300,121 0�04
3,250,000 Tenet Healthcare 4�875% 01/01/2026 3,403,888 0�412,686,000 Terraform Power 4�750% 15/01/2030 2,879,956 0�35
855,000 T-Mobile USA 2�550% 15/02/2031 898,879 0�11200,000 T-Mobile USA 4�500% 15/04/2050 247,052 0�03
8,670,000 Toll Brothers Finance 4�350% 15/02/2028 9,654,565 1�17800,000 Toll Brothers Finance 4�875% 15/03/2027 916,848 0�11
2,000,000 Vulcan Materials 3�500% 01/06/2030 2,299,050 0�28600,000 Vulcan Materials 4�500% 15/06/2047 745,719 0�09
1,515,000 WPX Energy 4�500% 15/01/2030 1,608,172 0�20293,000 WPX Energy 5�250% 15/10/2027 310,964 0�04
Total United States 258,394,080 31.37
Total Corporate Bonds 441,897,961 53.65
Government Bonds: 7.03% (2019: 6.46%)
Brazil: 0.39% (2019: 0.00%)
2,881,000 Petrobras Global Finance 5�093% 15/01/2030 3,223,119 0�39
Total Brazil 3,223,119 0.39
Chile: 0.00% (2019: 0.31%) - -
Colombia: 0.00% (2019: 0.14%) - -
India: 0.37% (2019: 0.20%)
2,000,000 Export-Import Bank of India 3�250% 15/01/2030 2,144,405 0�26

183
Federated Hermes Investment Funds Public Limited CompanyPortfolio Statement As at 31 December 2020 (continued)
a Header 1a Federated Hermes Unconstrained Credit Fund (continued)
Nominal Holdings Financial assets at fair value through profit or loss
Fair Value $
% of Net Assets
. . . . .Government Bonds: 7.03% (2019: 6.46%) (continued)
India: 0.37% (2019: 0.20%) (continued)
800,000 Export-Import Bank of India 3�875% 12/03/2024 858,777 0�11
Total India 3,003,182 0.37
Indonesia: 0.00% (2019: 0.22%) - -
People's Republic of China: 0.00% (2019: 0.19%) - -
Peru: 0.00% (2019: 0.19%) - -
Philippines: 0.00% (2019: 0.17%) - -
Republic of South Korea: 0.00% (2019: 0.15%) - -
South Africa: 0.00% (2019: 0.09%) - -
United States: 6.27% (2019: 4.80%)
51,700,000 United States Treasury Bill 0�010% 17/06/2021 51,682,925 6�27
Total United States 51,682,925 6.27
Total Government Bonds 57,909,226 7.03
Floating Rate Notes: 25.52% (2019: 29.36%)
Australia: 1.79% (2019: 2.29%)
9,866,000 BHP Billiton Finance 22/10/2077 14,749,635 1�79
Total Australia 14,749,635 1.79
Austria: 0.24% (2019: 0.51%)
1,600,000 BAWAG Group 31/12/2049 2,007,650 0�24
Total Austria 2,007,650 0.24
Belgium: 0.55% (2019: 0.77%)
2,100,000 Solvay 31/12/2049 2,646,539 0�321,400,000 Solvay 31/12/2049 1,857,082 0�23
Total Belgium 4,503,621 0.55
Brazil: 0.41% (2019: 0.64%)
1,050,000 Banco BTG Pactual 15/02/2029 1,144,773 0�14

184
Federated Hermes Investment Funds Public Limited CompanyPortfolio Statement As at 31 December 2020 (continued)
a Header 1a Federated Hermes Unconstrained Credit Fund (continued)
Nominal Holdings Financial assets at fair value through profit or loss
Fair Value $
% of Net Assets
. . . . .Floating Rate Notes: 25.52% (2019: 29.36%) (continued)
Brazil: 0.41% (2019: 0.64%) (continued)
2,145,000 Itau Unibanco 21/11/2029 2,220,633 0�27
Total Brazil 3,365,406 0.41
Canada: 1.27% (2019: 1.72%)
10,219,000 Enbridge 15/07/2077 10,491,226 1�27
Total Canada 10,491,226 1.27
Denmark: 0.19% (2019: 0.00%)
1,250,000 Orsted 09/12/3019 1,572,835 0�19
Total Denmark 1,572,835 0.19
France: 3.31% (2019: 2.15%)
989,899 Altice France SA 14/08/2026 988,147 0�126,400,000 BNP Paribas 31/12/2049 6,471,392 0�797,000,000 Electricite de France 31/12/2049 10,930,987 1�332,400,000 Groupama Assurances Mutuelles 31/12/2049 3,392,782 0�414,400,000 Veolia Environnement 30/12/2049 5,454,280 0�66
Total France 27,237,588 3.31
Germany: 1.10% (2019: 1.05%)
1,400,000 Commerzbank 31/12/2049 1,832,895 0�221,000,000 Commerzbank 31/12/2049 1,387,989 0�17
400,000 Deutsche Bank 31/12/2049 402,000 0�052,057,000 Deutsche Postbank Funding Trust I 31/12/2049 2,371,047 0�292,658,000 Deutsche Postbank Funding Trust III 31/12/2049 3,060,642 0�37
Total Germany 9,054,573 1.10
India: 0.45% (2019: 0.49%)
3,485,000 Network i2i 31/12/2049 3,713,267 0�45
Total India 3,713,267 0.45
Ireland: 0.72% (2019: 0.99%)
4,803,000 Aercap Holdings 10/10/2079 4,939,429 0�601,000,000 Bank of Ireland 19/09/2027 1,018,829 0�12
Total Ireland 5,958,258 0.72

185
Federated Hermes Investment Funds Public Limited CompanyPortfolio Statement As at 31 December 2020 (continued)
a Header 1a Federated Hermes Unconstrained Credit Fund (continued)
Nominal Holdings Financial assets at fair value through profit or loss
Fair Value $
% of Net Assets
. . . . .Floating Rate Notes: 25.52% (2019: 29.36%) (continued)
Italy: 1.35% (2019: 0.00%)
600,000 Enel 31/12/2049 766,634 0�091,200,000 Enel 24/11/2078 1,536,167 0�192,372,000 Intesa Sanpaolo 31/12/2049 2,760,416 0�334,025,000 UniCredit 31/12/2049 4,444,622 0�541,218,000 Unipolsai Assicurazioni 31/12/2049 1,628,135 0�20
Total Italy 11,135,974 1.35
Luxembourg: 0.26% (2019: 0.12%)
1,250,000 Eurofins Scientific 31/12/2049 1,601,895 0�19900,000 Mitsubishi UFJ Investor Services & Banking 15/12/2050 561,609 0�07
Total Luxembourg 2,163,504 0.26
Mexico: 0.06% (2019: 0.06%)
200,000 Banco Mercantil del Norte 31/12/2049 217,250 0�03200,000 Banco Mercantil del Norte 31/12/2049 227,252 0�03
Total Mexico 444,502 0.06
Netherlands: 2.66% (2019: 2.63%)
500,000 ABN AMRO Bank 31/12/2049 651,662 0�084,000,000 ABN AMRO Bank 31/12/2049 5,259,797 0�645,600,000 Cooperatieve Rabobank 31/12/2049 6,929,389 0�841,331,000 Tennet Holding 31/12/2049 1,699,794 0�216,000,000 Ziggo 17/01/2029 7,337,042 0�89
Total Netherlands 21,877,684 2.66
Norway: 0.62% (2019: 0.94%)
4,900,000 DNB 31/12/2049 5,092,756 0�62
Total Norway 5,092,756 0.62
Portugal: 0.65% (2019: 0.15%)
600,000 Caixa Geral de Depositos 31/12/2049 810,066 0�103,700,000 Energias de Portugal 20/07/2080 4,521,748 0�55
Total Portugal 5,331,814 0.65
Spain: 0.64% (2019: 0.50%)
1,200,000 Bankia 31/12/2049 1,521,301 0�181,500,000 Ibercaja Banco 23/07/2030 1,786,254 0�22
200,000 Telefonica Europe 05/02/2050 250,085 0�03

186
Federated Hermes Investment Funds Public Limited CompanyPortfolio Statement As at 31 December 2020 (continued)
a Header 1a Federated Hermes Unconstrained Credit Fund (continued)
Nominal Holdings Financial assets at fair value through profit or loss
Fair Value $
% of Net Assets
. . . . .Floating Rate Notes: 25.52% (2019: 29.36%) (continued)
Spain: 0.64% (2019: 0.50%) (continued)
1,400,000 Telefonica Europe 31/12/2049 1,740,806 0�21
Total Spain 5,298,446 0.64
Sweden: 0.42% (2019: 0.00%)
2,850,000 Samhallsbygg 31/12/2049 3,474,791 0�42
Total Sweden 3,474,791 0.42
Switzerland: 0.50% (2019: 0.04%)
200,000 Argentum Netherlands 15/08/2050 227,575 0�03780,000 Credit Suisse 31/12/2049 785,772 0�09
3,000,000 Credit Suisse 31/12/2049 3,127,500 0�38
Total Switzerland 4,140,847 0.50
United Kingdom: 2.97% (2019: 4.06%)
1,100,000 Barclays Bank 31/12/2049 987,047 0�126,140,000 Barclays Bank 31/12/2049 7,715,217 0�94
700,000 Barclays Bank 31/12/2049 879,585 0�11145,000 BP Capital Markets 31/12/2049 213,445 0�02
1,400,000 Ciel No� 1 12/06/2046 1,907,120 0�231,400,000 HSBC Bank 31/12/2049 1,237,054 0�15
900,000 National Westminster Bank 31/12/2049 837,225 0�10410,000 National Westminster Bank 31/12/2049 381,415 0�04
1,749,000 Phoenix Group 31/12/2049 2,560,219 0�31263,000 Rothesay Life 31/12/2049 405,329 0�05
1,000,000 Royal Bank of Scotland Group 14/08/2030 1,472,859 0�181,703,000 Royal Bank of Scotland Group 31/12/2049 1,869,673 0�233,000,000 Virgin Media Investment Term Loan 15/11/2027 4,017,541 0�49
Total United Kingdom 24,483,729 2.97
United States: 5.36% (2019: 10.25%)
1,979,949 Avis Budget Car Rental 06/08/2027 1,917,462 0�23977,387 Charter Communications Operating 30/04/2025 975,217 0�12
6,045,000 CIT 31/12/2049 6,173,456 0�75992,500 CSC 15/04/2027 986,297 0�12
2,553,000 Energy Transfer Operating 31/12/2049 2,036,018 0�25589,000 Energy Transfer Operating 31/12/2049 561,022 0�07
10,596,000 Enterprise Products Operating 15/02/2078 10,725,667 1�303,513,000 General Electric 31/12/2049 3,272,360 0�40
924,000 General Motors Financial 31/12/2049 1,007,160 0�122,000,000 Goodyear Tire & Rubber 07/03/2025 1,951,040 0�24
603,015 Hanesbrands 16/12/2024 601,508 0�07

187
Federated Hermes Investment Funds Public Limited CompanyPortfolio Statement As at 31 December 2020 (continued)
a Header 1a Federated Hermes Unconstrained Credit Fund (continued)
Nominal Holdings Financial assets at fair value through profit or loss
Fair Value $
% of Net Assets
. . . . .Floating Rate Notes: 25.52% (2019: 29.36%) (continued)
United States: 5.36% (2019: 10.25%) (continued)
350,000 Hanesbrands Finance Luxembourg 15/06/2024 450,815 0�06964,913 IQVIA 03/03/2024 1,179,798 0�14
1,075,000 JPMorgan Chase 31/12/2049 1,068,222 0�131,373,000 Liberty Mutual 23/05/2059 1,735,930 0�218,991,000 Plains All American Pipeline 31/12/2049 7,327,665 0�89
444,001 Reynolds 05/02/2023 442,891 0�051,701,661 Western Digital 29/04/2023 1,702,299 0�21
Total United States 44,114,827 5.36
Total Floating Rate Notes 210,212,933 25.52
Asset Backed Securities: 9.44% (2019: 6.97%)
Germany: 0.37% (2019: 0.00%)
2,500,000 RED & Black Auto Germany 7 UG 15/10/2029 3,066,961 0�37
Total Germany 3,066,961 0.37
Ireland: 4.56% (2019: 2.46%)
2,666,000 Aurium CLO I DAC 23/03/2032 3,283,829 0�402,500,000 Cairn CLO XI DAC 15/07/2035 3,091,558 0�381,500,000 Capital Four CLO 1X 15/01/2033 1,864,406 0�23
598,849 Dilosk Rmbs No� 3 20/10/2057 736,263 0�092,000,000 Harvest CLO XXIV DAC 15/07/2033 2,458,530 0�305,000,000 Hayfin Emerald CLO 17/11/2032 6,120,433 0�741,500,000 Hayfin Emerald CLO III 15/10/2032 1,854,634 0�222,000,000 Hayfin Emerald CLO IV DAC 15/02/2033 2,474,860 0�301,929,458 Kantoor Finance 2018-A 22/05/2028 2,347,726 0�29
580,793 Kantoor Finance 2018-C 22/05/2028 699,820 0�082,371,573 Kantoor Finance 2018-D 22/05/2028 2,821,584 0�343,000,000 Montmartre Euro CLO 2020-2 DAC 15/07/2033 3,685,852 0�455,000,000 Providus CLO II DAC 15/07/2031 6,120,554 0�74
Total Ireland 37,560,049 4.56
Italy: 0.48% (2019: 0.32%)
3,328,185 Erna SRL 25/07/2031 3,977,085 0�48
Total Italy 3,977,085 0.48
Luxembourg: 0.57% (2019: 0.00%)
1,800,000 SC Germany SA Compartment Consumer 2020-1 14/11/2034 2,212,721 0�27

188
Federated Hermes Investment Funds Public Limited CompanyPortfolio Statement As at 31 December 2020 (continued)
a Header 1a Federated Hermes Unconstrained Credit Fund (continued)
Nominal Holdings Financial assets at fair value through profit or loss
Fair Value $
% of Net Assets
. . . . .Asset Backed Securities: 9.44% (2019: 6.97%) (continued)
Luxembourg: 0.57% (2019: 0.00%) (continued)
2,000,000 SC Germany SA Compartment Consumer 2020-1 14/11/2034 2,459,830 0�30
Total Luxembourg 4,672,551 0.57
Netherlands: 1.10% (2019: 0.79%)
1,460,000 BNPP IP Euro CLO 2015-1 15/10/2030 1,691,356 0�21500,000 Domi 2019-1 15/06/2051 614,471 0�07
1,550,000 Dutch Property Finance 2020-1 28/07/2054 1,863,141 0�233,825,000 Dutch Property Finance 2020-2 28/01/2058 4,883,208 0�59
Total Netherlands 9,052,176 1.10
United Kingdom: 2.36% (2019: 3.40%)
1,400,000 Castell 2020-1 25/09/2052 1,928,282 0�233,000,000 Finsbury Square 2018-2C 12/09/2068 4,133,731 0�501,300,000 PCL Funding IV 15/09/2024 1,779,255 0�222,200,000 PCL Funding IV 15/09/2024 3,013,058 0�362,000,000 Ripon Mortgages 20/08/2056 2,745,178 0�33
674,197 RMAC Securities No� 1 0% 12/06/2044 782,248 0�101,000,000 Together 2019-1 Class B 15/07/2061 1,365,417 0�172,000,000 Towd Point Mortgage Funding 2020 - Auburn 14 20/05/2045 2,698,070 0�33
750,000 Turbo Finance 8C 20/02/2026 1,020,228 0�12
Total United Kingdom 19,465,467 2.36
Total Asset Backed Securities 77,794,289 9.44
Financial Derivative Instruments: 3.94% (2019: 3.01%)
Credit Default Swaps: 1.50% (2019: 1.00%)
Credit Default Swaps: Receive Fixed (Sell Protection) - Unrealised Gains: 1.50% (2019: 1.00%)
European Union: 0.85% (2019: 0.75%)
(2,250,000) ArcelorMittal 5% 20/12/2025 (Citigroup) 480,162 0�06(2,000,000) CNH Industrial 5% 20/12/2025 (Merrill Lynch) 502,344 0�06(2,500,000) CNH Industrial 5% 20/12/2025 (Merrill Lynch) 627,930 0�07
(170,000,000) Itraxx Europe Series 1% 20/12/2025 (Morgan Stanley) 5,416,619 0�66(650,000) Jaguar Land Rover Automotive 5% 20/12/2021 (Goldman Sachs) 8,540 -
Total European Union 7,035,595 0.85
United Kingdom: 0.05% (2019: 0.00%)
(3,500,000) Telefonica Emisiones 1% 20/12/2023 (Credit Suisse) 59,001 0�01

189
Federated Hermes Investment Funds Public Limited CompanyPortfolio Statement As at 31 December 2020 (continued)
a Header 1a Federated Hermes Unconstrained Credit Fund (continued)
Nominal Holdings Financial assets at fair value through profit or loss
Fair Value $
% of Net Assets
. . . . .Financial Derivative Instruments: 3.94% (2019: 3.01%) (continued)
Credit Default Swaps: 1.50% (2019: 1.00%) (continued)
Credit Default Swaps: Receive Fixed (Sell Protection) - Unrealised Gains: 1.50% (2019: 1.00%) (continued)
United Kingdom: 0.05% (2019: 0.00%) (continued)(2,500,000) Virgin Media Finance 5% 20/12/2025 (Credit Suisse) 330,771 0�04
Total United Kingdom 389,772 0.05
United States: 0.60% (2019: 0.25%)
(2,975,000) Altice France 5% 20/12/2025 (JP Morgan) 302,621 0�04(500,000) ArcelorMittal 5% 20/12/2025 (Merrill Lynch) 106,703 0�01
(4,000,000) ArcelorMittal 5% 20/12/2025 (JP Morgan) 853,621 0�10(2,500,000) Fiat Chrysler Automobiles 5% 20/12/2023 (JP Morgan) 365,192 0�04(6,000,000) Ford Motor 5% 20/12/2023 (Goldman Sachs) 502,926 0�06(6,000,000) General Motors 5% 20/12/2025 (Goldman Sachs) 1,161,565 0�14(1,000,000) General Motors 5% 20/12/2023 (JP Morgan) 124,330 0�02(1,000,000) HeidelbergCement 5% 20/12/2023 (Goldman Sachs) 165,430 0�02
(500,000) HeidelbergCement 5% 20/12/2025 (JP Morgan) 127,225 0�02(3,750,000) Tesco 1% 20/12/2025 (Goldman Sachs) 63,165 0�01
(200,000) UPC Holding 5% 20/12/2025 (JP Morgan) 31,726 -(2,115,000) UPC Holding 5% 20/12/2025 (JP Morgan) 335,503 0�04(1,510,000) UPC Holding 5% 20/12/2025 (JP Morgan) 239,532 0�03
(750,000) UPC Holding 5% 20/12/2025 (Merrill Lynch) 118,973 0�02(1,500,000) Virgin Media Finance 5% 20/12/2025 (Goldman Sachs) 198,462 0�02(1,700,000) Virgin Media Finance 5% 20/12/2025 (JP Morgan) 224,924 0�03
Total United States 4,921,898 0.60
Total Credit Default Swaps: Receive Fixed (Sell Protection) - Unrealised Gains 12,347,265 1.50
Total Credit Default Swaps 12,347,265 1.50
Open Purchased Swaptions - Unrealised Gains: 0.13% (2019: 0.12%)
Egypt: 0.00% (2019: 0.12%) - -
France: 0.00% (2019: 0.00%)
100,000,000 SWO Itraxx Europe Crossover 5�5% 20/01/2021 (BNP Paribas) 25,964 -
Total France 25,964 -
United States: 0.13% (2019: 0.00%)
100,000,000 SWO Cdx�Na�Hy�35 17/02/2021 (Merrill Lynch) 336,010 0�04100,000,000 SWO Cdx�Na�Hy�35 20/01/2021 (JP Morgan) 107,070 0�01
50,000,000 SWO Cdx�Na�Hy�35 20/01/2021 (Morgan Stanley) 17,550 -30,000,000 SWO Cdx�Na�Hy�35 20/01/2021 (Morgan Stanley) 10,530 -

190
Federated Hermes Investment Funds Public Limited CompanyPortfolio Statement As at 31 December 2020 (continued)
a Header 1a Federated Hermes Unconstrained Credit Fund (continued)
Nominal Holdings Financial assets at fair value through profit or loss
Fair Value $
% of Net Assets
. . . . .Financial Derivative Instruments: 3.94% (2019: 3.01%) (continued)
Open Purchased Swaptions - Unrealised Gains: 0.13% (2019: 0.12%) (continued)
United States: 0.13% (2019: 0.00%) (continued)30,000,000 SWO Cdx�Na�Hy�35 20/01/2021 (Morgan Stanley) 10,530 -75,000,000 SWO Itraxx Europe Crossover 3�5% 17/02/2021 (Merrill Lynch) 242,557 0�03
100,000,000 SWO Itraxx Europe Crossover 3�5% 17/02/2021 (Merrill Lynch) 323,409 0�0490,000,000 SWO Itraxx Europe Crossover 5% 20/01/2021 (Merrill Lynch) 33,520 0�01
Total United States 1,081,176 0.13
Total Open Purchased Swaptions - Unrealised Gains 1,107,140 0.13
Forward Currency Contracts: 2.30% (2019: 1.63%)
CounterpartyCurrency Buys
Currency Sells
Currency Rate
Maturity Date
Unrealised Gain
$
% of Net Assets
Northern Trust GBP 336,212,780 USD 448,181,722 1�3330 29/01/2021 11,479,545 1�40Northern Trust GBP 80,638,279 USD 107,493,245 1�3330 29/01/2021 2,753,289 0�34Northern Trust GBP 72,079,728 USD 96,084,439 1�3330 29/01/2021 2,461,068 0�30Northern Trust GBP 41,342,729 USD 55,111,098 1�3330 29/01/2021 1,411,593 0�17Northern Trust GBP 17,654,133 USD 23,533,489 1�3330 29/01/2021 602,777 0�07Northern Trust GBP 4,845,093 USD 6,458,776 1�3331 29/01/2021 165,308 0�02Northern Trust EUR 17,766,100 USD 21,726,875 1�2229 29/01/2021 21,911 -Northern Trust GBP 680,873 USD 921,255 1�3530 29/01/2021 9,617 -Northern Trust GBP 271,909 USD 362,434 1�3329 29/01/2021 9,313 -Northern Trust GBP 214,312 USD 285,662 1�3329 29/01/2021 7,341 -Lloyds Bank USD 7,114,738 EUR 5,800,000 1�2267 17/03/2021 7,183 -Northern Trust EUR 5,673,906 USD 6,938,847 1�2229 29/01/2021 6,998 -Northern Trust EUR 4,196,593 USD 5,132,181 1�2229 29/01/2021 5,176 -Northern Trust EUR 3,654,964 USD 4,469,801 1�2229 29/01/2021 4,508 -Northern Trust GBP 612,832 USD 834,158 1�3612 29/01/2021 3,690 -Northern Trust USD 4,660,012 EUR 3,800,000 1�2263 17/03/2021 3,338 -Northern Trust GBP 230,820 USD 312,311 1�3530 29/01/2021 3,260 -Northern Trust GBP 225,858 USD 305,850 1�3542 29/01/2021 2,937 -Northern Trust GBP 152,348 USD 206,135 1�3530 29/01/2021 2,152 -Northern Trust GBP 132,746 USD 179,761 1�3542 29/01/2021 1,726 -Northern Trust EUR 276,082 USD 336,449 1�2187 29/01/2021 1,523 -Northern Trust GBP 199,822 USD 271,988 1�3612 29/01/2021 1,203 -Northern Trust GBP 30,004 USD 39,992 1�3329 29/01/2021 1,028 -Northern Trust USD 172,783 EUR 140,368 1�2309 29/01/2021 948 -Northern Trust GBP 146,072 USD 198,827 1�3612 29/01/2021 880 -Northern Trust GBP 102,994 USD 140,190 1�3612 29/01/2021 620 -Northern Trust GBP 12,295 USD 16,390 1�3331 29/01/2021 420 -Northern Trust EUR 119,729 USD 146,421 1�2229 29/01/2021 148 -Northern Trust CHF 34,627 USD 39,080 1�1286 29/01/2021 119 -Northern Trust EUR 122,496 USD 149,838 1�2232 29/01/2021 118 -Northern Trust EUR 27,475 USD 33,517 1�2199 29/01/2021 116 -Northern Trust CHF 1,089 USD 1,229 1�1286 29/01/2021 4 -

191
Federated Hermes Investment Funds Public Limited CompanyPortfolio Statement As at 31 December 2020 (continued)
a Header 1a Federated Hermes Unconstrained Credit Fund (continued)
Nominal Holdings Financial assets at fair value through profit or loss
Fair Value $
% of Net Assets
. . . . . Financial Derivative Instruments: 3.94% (2019: 3.01%) (continued) Forward Currency Contracts: 2.30% (2019: 1.63%) (continued)
CounterpartyCurrency Buys
Currency Sells
Currency Rate
Maturity Date
Unrealised Gain
$
% of Net Assets
Northern Trust EUR 1,102 USD 1,347 1�2229 29/01/2021 1 -Northern Trust EUR 1,098 USD 1,343 1�2229 29/01/2021 1 -Northern Trust EUR 1,000 USD 1,223 1�2229 29/01/2021 1 -
Unrealised Gains on Forward Currency Contracts 18,969,860 2.30
Futures Contracts - Unrealised Gains: 0.01% (2019: 0.26%)
Clearing Broker
Description
Currency
No. of Contracts
Unrealised Gain
$
% of Net Assets
Germany: 0.00% (2019: 0.06%) - -
United States: 0.01% (2019: 0.20%)
Morgan Stanley US Ultra CBT March 2021 USD (55) 69,483 0�01
Total United States 69,483 0.01
Total Futures Contracts - Unrealised Gains 69,483 0.01
Total Financial Derivative Instruments 32,493,748 3.94
Total financial assets at fair value through profit or loss 820,308,157 99.58
Financial liabilities at fair value through profit or loss
Financial Derivative Instruments: (3.86%) (2019: (2.87%))
Credit Default Swaps: (3.49%) (2019: (2.76%))
Credit Default Swaps: Pay Fixed (Buy Protection) - Unrealised Losses: (3.40%) (2019: (2.73%))
European Union: (2.55%) (2019: (2.73%))
87,500,000 Itraxx Europe Crossover 5% 20/12/2025 (Morgan Stanley) (12,720,409) (1�55)310,000,000 Itraxx Europe Series 1% 20/12/2023 (Morgan Stanley) (8,271,786) (1�00)
Total European Union (20,992,195) (2.55)

192
Federated Hermes Investment Funds Public Limited CompanyPortfolio Statement As at 31 December 2020 (continued)
a Header 1a Federated Hermes Unconstrained Credit Fund (continued)
Nominal Holdings Financial liabilities at fair value through profit or loss
Fair Value $
% of Net Assets
. . . . .Financial Derivative Instruments: (3.86%) (2019: (2.87%)) (continued)
Credit Default Swaps: (3.49%) (2019: (2.76%)) (continued)
Credit Default Swaps: Pay Fixed (Buy Protection) - Unrealised Losses: (3.40%) (2019: (2.73%)) (continued)
United States: (0.85%) (2019: 0.00%)
75,000,000 CDX�NA�HY�35 5% 20/12/2025 (Morgan Stanley) (6,984,375) (0�85)
Total United States (6,984,375) (0.85)
Total Credit Default Swaps: Pay Fixed (Buy Protection) - Unrealised Losses (27,976,570) (3.40)
Credit Default Swaps: Receive Fixed (Sell Protection) - Unrealised Losses: (0.09%) (2019: (0.03%))
European Union: (0.01%) (2019: (0.01%))
(1,000,000) ThyssenKrupp 1% 20/06/2023 (Credit Suisse) (18,832) -(4,300,000) ThyssenKrupp 1% 20/06/2023 (Goldman Sachs) (80,976) (0�01)
Total European Union (99,808) (0.01)
France: 0.00% (2019: 0.00%)
(300,000) Renault 1% 20/12/2023 (BNP Paribas) (2,231) -
Total France (2,231) -
United Kingdom: (0.01%) (2019: 0.00%)
(1,000,000) Dell 1% 20/12/2025 (Barclays Bank) (17,329) -(1,100,000) Renault 1% 20/12/2023 (Credit Suisse) (8,180) -(2,000,000) Telecom Italia 1% 20/12/2023 (Credit Suisse) (23,168) (0�01)
(800,000) Valeo 1% 20/12/2023 (Credit Suisse) (47) -
Total United Kingdom (48,724) (0.01)
United States: (0.07%) (2019: (0.02%))
(900,000) Macy's Retail Holdings 1% 20/06/2025 (Barclays Bank) (150,619) (0�02)(1,250,000) Macy's Retail Holdings 1% 20/06/2025 (Barclays Bank) (209,192) (0�02)(1,250,000) Macy's Retail Holdings 1% 20/06/2025 (Goldman Sachs) (209,192) (0�03)
(624,000) Marks & Spencer 1% 20/12/2023 (JP Morgan) (20,565) -

193
Federated Hermes Investment Funds Public Limited CompanyPortfolio Statement As at 31 December 2020 (continued)
a Header 1a Federated Hermes Unconstrained Credit Fund (continued)
Nominal Holdings Financial liabilities at fair value through profit or loss
Fair Value $
% of Net Assets
. . . . .Financial Derivative Instruments: (3.86%) (2019: (2.87%)) (continued)
Credit Default Swaps: (3.49%) (2019: (2.76%)) (continued)
Credit Default Swaps: Receive Fixed (Sell Protection) - Unrealised Losses: (0.09%) (2019: (0.03%)) (continued)
United States: (0.07%) (2019: (0.02%)) (continued)
(500,000) Telecom Italia 1% 20/12/2023 (Merrill Lynch) (5,792) -
Total United States (595,360) (0.07)
Total Credit Default Swaps: Receive Fixed (Sell Protection) - Unrealised Losses (746,123) (0.09)
Total Credit Default Swaps (28,722,693) (3.49)
Open Written Swaptions - Unrealised Losses: 0.00% (2019: (0.01%))
Egypt: 0.00% (2019: (0.01%)) - -
Forward Currency Contracts: (0.37%) (2019: (0.10%))
CounterpartyCurrency Buys
Currency Sells
Currency Rate
Maturity Date
Unrealised Loss
$
% of Net Assets
Northern Trust USD 6,965 GBP 5,143 1�3542 29/01/2021 (67) -Northern Trust USD 34,477 GBP 25,460 1�3542 29/01/2021 (331) -Northern Trust USD 41,098 GBP 30,830 1�3331 29/01/2021 (1,052) -Northern Trust USD 791,848 GBP 585,233 1�3530 29/01/2021 (8,266) -Royal Bank of Canada USD 1,952,383 EUR 1,600,000 1�2202 17/03/2021 (8,322) -Northern Trust USD 2,381,793 GBP 1,749,835 1�3612 29/01/2021 (10,535) -Royal Bank of Canada USD 135,098,388 EUR 110,750,000 1�2198 17/03/2021 (619,164) (0�08)State Street USD 135,096,505 EUR 110,750,000 1�2198 17/03/2021 (621,047) (0�08)State Street USD 90,137,242 GBP 67,200,000 1�3413 17/03/2021 (1,761,474) (0�21)
Unrealised Losses on Forward Currency Contracts (3,030,258) (0.37)

194
Federated Hermes Investment Funds Public Limited CompanyPortfolio Statement As at 31 December 2020 (continued)
a Header 1a Federated Hermes Unconstrained Credit Fund (continued)
Nominal Holdings Financial liabilities at fair value through profit or loss
Fair Value $
% of Net Assets
. . . . .Financial Derivative Instruments: (3.86%) (2019: (2.87%)) (continued)
Futures Contracts - Unrealised Losses: 0.00% (2019: 0.00%)
Clearing Broker Description CurrencyNo. of
ContractsUnrealised
Loss $
% of Net Assets
United States: 0.00% (2019: 0.00%)
Morgan Stanley 10 Year Note CBT March 2021 USD (226) (28,250) -
Total United States (28,250) -
Total Futures Contracts - Unrealised Loss (28,250) -
Total Financial Derivative Instruments (31,781,201) (3.86)
Total financial liabilities at fair value through profit or loss (31,781,201) (3.86)
Financial assets at fair value through profit or lossNet financial assets at fair value through profit or loss (2019: 98.93%) (Cost: $ 714,587,387)
788,526,956 95.72
Net Cash (2019: 1.20%) 28,929,607 3.51
Other Net Assets (2019: (0.13%)) 6,291,426 0.77
Net Assets Attributable to Holders of Redeemable Participating Shares 823,747,989 100.00
Portfolio Classification
% of Total Assets
Transferable securities traded on a regulated market 91�08OTC financial derivative instruments 3�75Financial derivative instruments dealt in on a regulated market 0�01Cash 4�29Other assets 0�87Total 100.00

195
Federated Hermes Investment Funds Public Limited CompanyPortfolio StatementAs at 31 December 2020 (continued)
a Header 1a Federated Hermes Global Emerging Markets SMID Equity Fund
Nominal Holdings Financial assets at fair value through profit or loss
Fair Value $
% of Net Assets
. . . . .American Depositary Receipts: 3.64% (2019: 5.02%)
People's Republic of China: 3.64% (2019: 5.02%)
39,431 Autohome ADR 3,927,722 1�36195,650 Baozun ADR 6,589,492 2�28
Total People's Republic of China 10,517,214 3.64
Total American Depositary Receipts 10,517,214 3.64
Equities: 94.80% (2019: 93.78%)
Brazil: 6.82% (2019: 13.00%)
764,800 BB Seguridade Participacoes 4,362,756 1�511,406,400 Duratex 5,182,414 1�792,153,730 Hapvida Participacoes e Investimentos 6,327,427 2�19
254,324 Notre Dame Intermedica Participacoes 3,835,767 1�33
Total Brazil 19,708,364 6.82
Chile: 1.50% (2019: 0.00%)
55,728,259 Enel Chile 4,329,627 1�50
Total Chile 4,329,627 1.50
Egypt: 1.30% (2019: 3.11%)
4,340,587 Cleopatra Hospital 1,296,933 0�45281,583 Commercial International Bank Egypt 1,057,234 0�37
1,337,104 Integrated Diagnostics 1,390,588 0�48
Total Egypt 3,744,755 1.30
Hong Kong: 2.22% (2019: 3.54%)
449,000 Techtronic Industries 6,405,557 2�22
Total Hong Kong 6,405,557 2.22
Hungary: 1.04% (2019: 3.01%)
120,165 Richter Gedeon 3,011,416 1�04
Total Hungary 3,011,416 1.04
India: 16.02% (2019: 13.51%)
44,013 Bajaj Finserv 5,364,836 1�86537,528 Bharat Forge 3,864,419 1�34428,866 Container Corporation of India 2,343,671 0�81
75,951 Hero MotoCorp 3,232,731 1�12

196
Federated Hermes Investment Funds Public Limited CompanyPortfolio Statement As at 31 December 2020 (continued)
a Header 1a Federated Hermes Global Emerging Markets SMID Equity Fund (continued)
Nominal Holdings Financial assets at fair value through profit or loss
Fair Value $
% of Net Assets
. . . . .Equities: 94.80% (2019: 93.78%) (continued)
India: 16.02% (2019: 13.51%) (continued)
251,572 ICICI Lombard General Insurance 5,236,299 1�81655,427 KEC International 3,264,689 1�13739,369 Mahindra Logistics 4,186,731 1�45
1,459,993 Motherson Sumi Systems 3,300,932 1�14401,073 Oberoi Realty 3,202,327 1�11436,487 SBI Life Insurance 5,401,764 1�87269,325 Tech Mahindra 3,587,191 1�24
1,158,078 VA Tech Wabag 3,271,322 1�14
Total India 46,256,912 16.02
Mexico: 4.10% (2019: 1.54%)
6,419,802 Genomma Lab Internacional SAB de CV 6,046,422 2�09886,708 Grupo Aeroportuario del Centro Norte 5,793,314 2�01
Total Mexico 11,839,736 4.10
People's Republic of China: 15.11% (2019: 17.41%)
318,164 Aier Eye Hospital 3,662,921 1�276,854,869 China Communications Services 3,023,993 1�05
785,000 China Mengniu Dairy 4,738,828 1�64137,796 Hangzhou Tigermed Consulting 3,423,399 1�19
1,345,178 NARI Technology 5,494,447 1�904,563,000 Shenzhen International 7,369,029 2�554,543,000 SITC International Holdings 9,809,652 3�403,392,000 Weimob 6,099,216 2�11
Total People's Republic of China 43,621,485 15.11
Peru: 1.38% (2019: 0.00%)
24,292 Credicorp 3,975,386 1�38
Total Peru 3,975,386 1.38
Poland: 0.41% (2019: 0.00%)
41,482 LiveChat Software 1,173,212 0�41
Total Poland 1,173,212 0.41
Republic of South Korea: 11.17% (2019: 1.92%)
182,761 Eugene Technology 5,610,862 1�9496,595 KB Financial 3,859,176 1�3454,229 Koh Young Technology 5,241,687 1�81
7,659 NCSoft 6,564,051 2�27242,490 NICE Information Service 5,535,996 1�92

197
Federated Hermes Investment Funds Public Limited CompanyPortfolio Statement As at 31 December 2020 (continued)
a Header 1a Federated Hermes Global Emerging Markets SMID Equity Fund (continued)
Nominal Holdings Financial assets at fair value through profit or loss
Fair Value $
% of Net Assets
. . . . .Equities: 94.80% (2019: 93.78%) (continued)
Republic of South Korea: 11.17% (2019: 1.92%) (continued)
47,186 Tokai Carbon Korea 5,442,701 1�89
Total Republic of South Korea 32,254,473 11.17
Russian Federation: 4.62% (2019: 5.74%)
170,835 Mail�Ru Group GDR 4,450,252 1�54125,708 Polymetal International 2,908,049 1�01
86,092 Yandex 5,983,394 2�07
Total Russian Federation 13,341,695 4.62
South Africa: 2.53% (2019: 3.98%)
135,472 Shoprite 1,292,407 0�453,542,927 Transaction Capital 6,009,094 2�08
Total South Africa 7,301,501 2.53
Taiwan: 22.07% (2019: 17.39%)
885,000 Accton Technology 9,953,022 3�45440,053 Advantech 5,481,477 1�90
2,063,000 Chipbond Technology 4,875,194 1�691,424,000 Delta Electronics 13,328,778 4�62
657,000 Land Mark Optoelectronics 6,605,541 2�291,392,000 Sinbon Electronics 10,700,833 3�71
618,000 Sunny Friend Environmental Technology 5,124,706 1�772,154,177 Tong Yang Industry 2,989,996 1�03
378,000 Win Semiconductors 4,654,709 1�61
Total Taiwan 63,714,256 22.07
Turkey: 2.02% (2019: 4.02%)
1,251,012 AvivaSA Emeklilik ve Hayat 3,125,424 1�08176,211 BIM Birlesik Magazalar 1,800,081 0�63129,519 Mavi Giyim Sanayi Ve Ticaret 904,453 0�31
Total Turkey 5,829,958 2.02
United Arab Emirates: 0.00% (2019: 2.58%)
225,310 NMC Health** - -
Total United Arab Emirates - -

198
Federated Hermes Investment Funds Public Limited CompanyPortfolio Statement As at 31 December 2020 (continued)
a Header 1a Federated Hermes Global Emerging Markets SMID Equity Fund (continued)
Nominal Holdings Financial assets at fair value through profit or loss
Fair Value $
% of Net Assets
. . . . .Equities: 94.80% (2019: 93.78%) (continued)
United States: 2.49% (2019: 3.03%)
4,064,129 Samsonite 7,202,937 2�49
Total United States 7,202,937 2.49
Total Equities 273,711,270 94.80
Total financial assets at fair value through profit or loss 284,228,484 98.44
Net financial assets at fair value through profit or loss (2019: 98.80%) (Cost: $ 227,846,713)
284,228,484 98.44
Net Cash (2019: 1.63%) 9,365,417 3.24
Other Net Liabilities (2019: (0.43%)) (4,873,516) (1.68)
Net Assets Attributable to Holders of Redeemable Participating Shares 288,720,385 100.00
Portfolio Classification
% of Total Assets
Transferable securities admitted to official stock exchange listing 96�68Cash 3�19Other assets 0�13Total 100.00

199
Federated Hermes Investment Fund Public Limited CompanyPortfolio StatementAs at 31 December 2020 (continued) l
a Header 1a Federated Hermes SDG Engagement High Yield Credit Fund
Nominal Holdings Financial assets at fair value through profit or loss
Fair Value $
% of Net Assets
. . . . .Corporate Bonds: 63.36% (2019: 70.75%)
Austria: 0.13% (2019: 0.00%)
600,000 Suzano Austria 7�000% 16/03/2047 801,306 0�13
Total Austria 801,306 0.13
Brazil: 3.03% (2019: 3.35%)
400,000 Banco BTG Pactual SA/Cayman Islands 4�500% 10/01/2025 428,004 0�072,225,000 GTL Trade Finance 7�250% 16/04/2044 3,202,887 0�50
200,000 Petrobras Global Finance 5�093% 15/01/2030 223,750 0�042,414,000 Petrobras Global Finance 5�375% 01/10/2029 3,816,305 0�591,436,000 Petrobras Global Finance 5�600% 03/01/2031 1,652,549 0�261,600,000 Petrobras Global Finance 6�850% 05/06/2115 1,998,240 0�311,880,000 Petrobras Global Finance 6�900% 19/03/2049 2,387,600 0�375,070,000 Suzano Austria 5�000% 15/01/2030 5,765,249 0�89
Total Brazil 19,474,584 3.03
Chile: 0.15% (2019: 0.00%)
500,000 VTR Finance 6�375% 15/07/2028 546,875 0�08400,000 VTR Finance 6�375% 15/07/2028 437,500 0�07
Total Chile 984,375 0.15
Colombia: 0.38% (2019: 0.66%)
250,000 Millicom International Cellular 4�500% 27/04/2031 270,312 0�041,500,000 Millicom International Cellular 6�250% 25/03/2029 1,690,973 0�27
400,000 Millicom International Cellular 6�250% 25/03/2029 450,926 0�07
Total Colombia 2,412,211 0.38
France: 1.51% (2019: 1.90%)
5,360,000 Altice France SA 3�375% 15/01/2028 6,501,729 1�012,607,000 Faurecia 2�375% 15/06/2027 3,227,674 0�50
Total France 9,729,403 1.51
Germany: 1.03% (2019: 0.85%)
1,300,000 ADLER Group 2�750% 13/11/2026 1,633,358 0�25800,000 ADLER Group 3�250% 05/08/2025 1,022,105 0�16300,000 ADLER Real Estate 2�125% 06/02/2024 372,283 0�06
2,800,000 ADLER Real Estate 3�000% 27/04/2026 3,616,587 0�56
Total Germany 6,644,333 1.03

200
Federated Hermes Investment Fund Public Limited CompanyPortfolio Statement As at 31 December 2020 (continued)
a Header 1a Federated Hermes SDG Engagement High Yield Credit Fund (continued)
Nominal Holdings Financial assets at fair value through profit or loss
Fair Value $
% of Net Assets
. . . . .Corporate Bonds: 63.36% (2019: 70.75%) (continued)
Ireland: 1.64% (2019: 3.27%)
3,725,000 Ardagh Packaging Finance 4�750% 15/07/2027 5,300,360 0�834,055,000 Smurfit Kappa 1.500% 15/09/2027 5,202,201 0�81
Total Ireland 10,502,561 1.64
Italy: 2.30% (2019: 1.97%)
5,281,000 Infrastrutture Wireless Italiane 1�625% 21/10/2028 6,642,485 1�033,370,000 Intesa Sanpaolo 5�710% 15/01/2026 3,859,840 0�601,100,000 Telecom Italia 1�125% 26/03/2022 1,343,429 0�212,416,000 Telecom Italia Capital 6�000% 30/09/2034 2,948,945 0�46
Total Italy 14,794,699 2.30
Luxembourg: 1.40% (2019: 0.00%)
2,331,000 Altice Financing 3�000% 15/01/2028 2,754,311 0�43695,000 Altice Luxembourg SA 4�000% 15/02/2028 813,164 0�13300,000 Eurofins Scientific 2.125% 25/07/2024 391,067 0�06682,000 Eurofins Scientific 3.750% 17/07/2026 980,830 0�15
3,121,000 SIG Combibloc 2�125% 18/06/2025 4,024,910 0�63
Total Luxembourg 8,964,282 1.40
Mexico: 1.97% (2019: 2.07%)
400,000 Cemex 2�750% 05/12/2024 495,529 0�082,821,000 Cemex 5�450% 19/11/2029 3,108,065 0�48
500,000 Orbia Advance Corp SAB de CV 4�000% 04/10/2027 554,780 0�093,480,000 Orbia Advance Corp SAB de CV 5�500% 15/01/2048 4,229,070 0�66
200,000 Petroleos Mexicanos 2�750% 21/04/2027 230,938 0�042,150,000 Petroleos Mexicanos 6�840% 23/01/2030 2,254,339 0�351,859,000 Petroleos Mexicanos 6�950% 28/01/2060 1,751,922 0�27
Total Mexico 12,624,643 1.97
Netherlands: 4.28% (2019: 2.50%)
4,300,000 Ashland Services 2�000% 30/01/2028 5,267,842 0�821,224,000 NXP 3�400% 01/05/2030 1,390,782 0�22
350,000 NXP 4�625% 01/06/2023 382,773 0�062,000,000 Trivium Packaging 3�750% 15/08/2026 2,525,101 0�39
564,000 United Group 3�625% 15/02/2028 678,006 0�112,800,000 UPC 3�875% 15/06/2029 3,528,718 0�552,249,000 VEON 3�375% 25/11/2027 2,313,344 0�362,550,000 VEON 4�000% 09/04/2025 2,703,446 0�421,599,000 VZ Vendor Financing 2�875% 15/01/2029 1,953,522 0�30

201
Federated Hermes Investment Fund Public Limited CompanyPortfolio Statement As at 31 December 2020 (continued)
a Header 1a Federated Hermes SDG Engagement High Yield Credit Fund (continued)
Nominal Holdings Financial assets at fair value through profit or loss
Fair Value $
% of Net Assets
. . . . .Corporate Bonds: 63.36% (2019: 70.75%) (continued)
Netherlands: 4.28% (2019: 2.50%) (continued)
5,461,000 Ziggo 3�375% 28/02/2030 6,741,108 1�05
Total Netherlands 27,484,642 4.28
Norway: 0.82% (2019: 0.59%)
4,994,000 Aker BP 3�750% 15/01/2030 5,264,943 0�82
Total Norway 5,264,943 0.82
People's Republic of China: 0.47% (2019: 0.80%)
1,375,000 Country Garden 5�125% 17/01/2025 1,446,545 0�23800,000 Country Garden 5�625% 15/12/2026 906,449 0�14600,000 Country Garden 5�625% 14/01/2030 665,700 0�10
Total People's Republic of China 3,018,694 0.47
Poland: 0.10% (2019: 0.00%)
512,000 Canpack SA Eastern Land 2�375% 01/11/2027 647,601 0�10
Total Poland 647,601 0.10
Russian Federation: 0.16% (2019: 0.88%)
950,000 Severstal Via Steel Capital 3�150% 16/09/2024 995,422 0�16
Total Russian Federation 995,422 0.16
South Africa: 1.53% (2019: 1.85%)
3,900,000 Anglo American Capital 3�375% 11/03/2029 6,030,649 0�943,130,000 Sappi Papier 3�125% 15/04/2026 3,742,643 0�58
75,000 Sappi Papier 7�500% 15/06/2032 74,250 0�01
Total South Africa 9,847,542 1.53
Spain: 2.91% (2019: 1.63%)
700,000 Cellnex Telecom 0�750% 20/11/2031 828,873 0�13400,000 Cellnex Telecom 1�000% 20/04/2027 484,831 0�07
2,900,000 Cellnex Telecom 1�750% 23/10/2030 3,590,910 0�563,100,000 Cellnex Telecom 1�875% 26/06/2029 3,905,817 0�612,200,000 Grifols 1�625% 15/02/2025 2,703,923 0�425,754,000 Grifols 2�250% 15/11/2027 7,159,992 1�12
Total Spain 18,674,346 2.91

202
Federated Hermes Investment Fund Public Limited CompanyPortfolio Statement As at 31 December 2020 (continued)
a Header 1a Federated Hermes SDG Engagement High Yield Credit Fund (continued)
Nominal Holdings Financial assets at fair value through profit or loss
Fair Value $
% of Net Assets
. . . . .Corporate Bonds: 63.36% (2019: 70.75%) (continued)
Turkey: 1.56% (2019: 1.84%)
1,425,000 Akbank 5�125% 31/03/2025 1,446,375 0�221,525,000 Arcelik 5�000% 03/04/2023 1,586,610 0�251,175,000 Coca-Cola Icecek 4�215% 19/09/2024 1,239,625 0�193,775,000 Turk Telekomunikasyon 4�875% 19/06/2024 3,914,599 0�611,882,000 Turkiye Vakiflar Bankasi 5.250% 05/02/2025 1,858,833 0�29
Total Turkey 10,046,042 1.56
United Kingdom: 2.27% (2019: 4.63%)
3,050,000 Fiat Chrysler Automobiles 5�250% 15/04/2023 3,274,937 0�513,855,000 Marks & Spencer 3�250% 10/07/2027 5,491,474 0�85
228,000 Marks & Spencer 3�750% 19/05/2026 318,917 0�05109,000 Virgin Media Finance 3�750% 15/07/2030 136,201 0�02
3,815,000 Virgin Media Secured Finance 4�250% 15/01/2030 5,377,881 0�84
Total United Kingdom 14,599,410 2.27
United States: 35.72% (2019: 41.96%)
833,000 AES Corporation 2�450% 15/01/2031 844,968 0�13977,000 AES Corporation 3�950% 15/07/2030 1,106,242 0�17
4,150,000 Alcoa Nederland 6�125% 15/05/2028 4,541,656 0�711,400,000 Ally Financial 4�625% 30/03/2025 1,597,300 0�252,300,000 Ally Financial 5�750% 20/11/2025 2,680,039 0�42
869,000 Ally Financial 5�800% 01/05/2025 1,032,886 0�163,183,000 Ardagh Packaging Finance 2�125% 15/08/2026 3,910,454 0�61
200,000 Ardagh Packaging Finance 4�125% 15/08/2026 209,250 0�03250,000 Ardagh Packaging Finance 5�250% 30/04/2025 264,086 0�04
5,300,000 Ball 1�500% 15/03/2027 6,676,442 1�041,200,000 Ball 2�875% 15/08/2030 1,198,500 0�192,909,000 Ball Corporation 0�875% 15/03/2024 3,569,985 0�56
500,000 Berry Global 1�000% 15/01/2025 618,658 0�106,549,000 Berry Global 1�500% 15/01/2027 8,191,319 1�27
500,000 Berry Global Inc 1�000% 15/01/2025 618,658 0�103,000,000 Calpine 4�500% 15/02/2028 3,124,500 0�492,966,000 Calpine 5�125% 15/03/2028 3,124,340 0�484,260,000 Catalent Pharma Solutions 2�375% 01/03/2028 5,258,244 0�823,300,000 CCO 4�750% 01/03/2030 3,564,825 0�55
566,000 CenturyLink 4�000% 15/02/2027 585,170 0�091,040,000 CenturyLink 6�875% 15/01/2028 1,208,147 0�191,550,000 CenturyLink 7�600% 15/09/2039 1,886,691 0�29
400,000 CF Industries 4�950% 01/06/2043 491,750 0�08725,000 CF Industries 5�150% 15/03/2034 892,562 0�14
2,550,000 CIT 6�125% 09/03/2028 3,113,703 0�482,210,000 Clearway Energy 4�750% 15/03/2028 2,372,302 0�372,532,000 Cleveland-Cliffs 6�750% 15/03/2026 2,737,725 0�43
360,000 Cleveland-Cliffs 7�000% 15/03/2027 350,100 0�051,600,000 Crown European 0�750% 15/02/2023 1,956,896 0�30

203
Federated Hermes Investment Fund Public Limited CompanyPortfolio Statement As at 31 December 2020 (continued)
a Header 1a Federated Hermes SDG Engagement High Yield Credit Fund (continued)
Nominal Holdings Financial assets at fair value through profit or loss
Fair Value $
% of Net Assets
. . . . .Corporate Bonds: 63.36% (2019: 70.75%) (continued)
United States: 35.72% (2019: 41.96%) (continued)
5,764,000 Crown European 2�875% 01/02/2026 7,574,723 1�187,310,000 CSC 3�375% 15/02/2031 7,182,075 1�121,082,000 DCP Midstream Operating 5�125% 15/05/2029 1,201,896 0�192,724,000 DCP Midstream Operating 5�600% 01/04/2044 2,820,743 0�444,000,000 Dell 5�400% 10/09/2040 4,520,780 0�70
800,000 Dell 6�500% 15/04/2038 996,000 0�162,450,000 Domtar 6�250% 01/09/2042 2,948,557 0�461,700,000 Domtar 6�750% 15/02/2044 2,160,707 0�34
600,000 Embarq 7�995% 01/06/2036 741,195 0�122,489,000 EnLink Midstream Partners 5�050% 01/04/2045 1,994,149 0�312,350,000 EnLink Midstream Partners 5�450% 01/06/2047 1,898,260 0�29
300,000 EnLink Midstream Partners 5�600% 01/04/2044 242,039 0�043,735,000 EQT 3�900% 01/10/2027 3,717,539 0�58
789,000 EQT 7�000% 01/02/2030 967,511 0�153,175,000 Ford Motor 4�750% 15/01/2043 3,242,469 0�51
200,000 Ford Motor Credit LLC 2�979% 03/08/2022 203,590 0�03400,000 General Motors Financial 0�850% 26/02/2026 493,397 0�08
3,975,000 Goodyear Tire & Rubber 4�875% 15/03/2027 4,071,891 0�645,025,000 Hanesbrands 4�875% 15/05/2026 5,464,687 0�852,640,000 HCA 3�500% 01/09/2030 2,807,405 0�441,875,000 HCA 5�250% 15/06/2049 2,480,558 0�39
450,000 HCA 5�375% 01/02/2025 506,707 0�08900,000 HCA 7�500% 15/11/2095 1,178,366 0�18500,000 Hess 4�300% 01/04/2027 551,676 0�09573,000 Hess 5�600% 15/02/2041 700,165 0�11
3,100,000 Hess 5�800% 01/04/2047 3,950,165 0�613,750,000 Huntsman International 4�500% 01/05/2029 4,328,065 0�67
750,000 Huntsman International 5�125% 15/04/2021 921,242 0�143,300,000 IQVIA 2�250% 15/01/2028 4,084,149 0�643,456,000 IQVIA 3�250% 15/03/2025 4,284,089 0�67
500,000 IQVIA 5�000% 15/05/2027 532,495 0�085,320,000 KB Home 4�800% 15/11/2029 5,848,675 0�91
450,000 Kraft Heinz Foods 2�250% 25/05/2028 583,345 0�09131,000 Kraft Heinz Foods 4�250% 01/03/2031 146,192 0�02
4,375,000 Kraft Heinz Foods 4�375% 01/06/2046 4,740,864 0�74300,000 Lennar 4�125% 15/01/2022 307,687 0�05
4,630,000 Lennar 4�750% 29/11/2027 5,477,521 0�85500,000 Lennar 5�000% 15/06/2027 590,000 0�09900,000 Level 3 Financing 3�625% 15/01/2029 899,437 0�14
2,900,000 Levi Strauss 3�375% 15/03/2027 3,680,753 0�57250,000 MPT Operating Partnership 2�550% 05/12/2023 348,104 0�05485,000 MPT Operating Partnership 3�500% 15/03/2031 501,672 0�08
3,847,000 MPT Operating Partnership 3�692% 05/06/2028 5,708,209 0�892,944,000 Novelis 4�750% 30/01/2030 3,177,283 0�494,100,000 Occidental Petroleum 3�500% 15/08/2029 3,758,757 0�585,194,000 Occidental Petroleum 4�100% 15/02/2047 4,255,574 0�665,421,000 Post 4�625% 15/04/2030 5,709,451 0�893,650,000 Range Resources 4�875% 15/05/2025 3,454,597 0�54

204
Federated Hermes Investment Fund Public Limited CompanyPortfolio Statement As at 31 December 2020 (continued)
a Header 1a Federated Hermes SDG Engagement High Yield Credit Fund (continued)
Nominal Holdings Financial assets at fair value through profit or loss
Fair Value $
% of Net Assets
. . . . .Corporate Bonds: 63.36% (2019: 70.75%) (continued)
United States: 35.72% (2019: 41.96%) (continued)
300,000 Range Resources 9�250% 01/02/2026 313,950 0�053,490,000 Seagate HDD Cayman 3�375% 15/07/2031 3,515,425 0�555,325,000 Sealed Air 4�000% 01/12/2027 5,697,750 0�89
300,000 Sealed Air 4�500% 15/09/2023 400,916 0�06350,000 Sealed Air 6�875% 15/07/2033 463,094 0�07
2,116,000 Silgan 2�250% 01/06/2028 2,634,262 0�41708,000 Tenet Healthcare 4�625% 15/06/2028 742,957 0�11
2,900,000 Tenet Healthcare 4�875% 01/01/2026 3,037,315 0�47250,000 Tenet Healthcare 7�500% 01/04/2025 273,479 0�04
3,400,000 Terraform Power 4�750% 15/01/2030 3,645,514 0�57387,000 T-Mobile USA 2�550% 15/02/2031 406,861 0�06
1,000,000 T-Mobile USA 3�875% 15/04/2030 1,159,450 0�18460,000 T-Mobile USA 4�375% 15/04/2040 561,830 0�09
2,612,000 T-Mobile USA 4�750% 01/02/2028 2,810,878 0�441,050,000 T-Mobile USA 7�875% 15/09/2023 1,217,003 0�194,110,000 Toll Brothers Finance 3�800% 01/11/2029 4,449,075 0�692,200,000 Toll Brothers Finance 4�350% 15/02/2028 2,449,832 0�38
Total United States 229,462,400 35.72
Total Corporate Bonds 406,973,439 63.36
Government Bonds: 13.36% (2019: 9.94%)
Mexico: 0.04% (2019: 0.00%)
270,000 Petroleos Mexicanos 6�750% 21/09/2047 253,558 0�04
Total Mexico 253,558 0.04
United States: 13.32% (2019: 9.94%)
85,600,000 United States Treasury Bill 0�010% 17/06/2021 85,571,729 13�32
Total United States 85,571,729 13.32
Total Government Bonds 85,825,287 13.36
Floating Rate Notes: 21.15% (2019: 16.40%)
Brazil: 0.51% (2019: 1.20%)
800,000 Banco BTG Pactual 15/02/2029 872,208 0�142,306,000 Itau Unibanco 21/11/2029 2,387,310 0�37
Total Brazil 3,259,518 0.51

205
Federated Hermes Investment Fund Public Limited CompanyPortfolio Statement As at 31 December 2020 (continued)
a Header 1a Federated Hermes SDG Engagement High Yield Credit Fund (continued)
Nominal Holdings Financial assets at fair value through profit or loss
Fair Value $
% of Net Assets
. . . . .Floating Rate Notes: 21.15% (2019: 16.40%) (continued)
Chile: 0.34% (2019: 0.82%)
2,000,000 AES Gener 07/10/2079 2,210,020 0�34
Total Chile 2,210,020 0.34
Denmark: 1.01% (2019: 1.78%)
5,136,000 Orsted 09/12/3019 6,462,466 1�01
Total Denmark 6,462,466 1.01
France: 2.35% (2019: 0.00%)
6,700,000 BNP Paribas 31/12/2049 6,774,739 1�06700,000 Groupama Assurances Mutuelles 31/12/2049 989,561 0�15
5,900,000 Veolia Environnement 30/12/2049 7,313,694 1�14
Total France 15,077,994 2.35
Germany: 1.49% (2019: 1.51%)
4,800,000 Commerzbank 31/12/2049 6,284,212 0�98600,000 Deutsche Bank 19/05/2031 850,428 0�13
2,400,000 Deutsche Bank 31/12/2049 2,412,000 0�38
Total Germany 9,546,640 1.49
India: 0.90% (2019: 0.92%)
5,442,000 Network i2i 31/12/2049 5,798,451 0�90
Total India 5,798,451 0.90
Ireland: 0.37% (2019: 0.59%)
2,350,000 Bank of Ireland 19/09/2027 2,394,247 0�37
Total Ireland 2,394,247 0.37
Italy: 2.25% (2019: 0.73%)
1,400,000 Enel 31/12/2049 1,788,812 0�281,500,000 Enel 24/11/2078 1,920,209 0�301,577,000 Intesa Sanpaolo 31/12/2049 1,835,234 0�281,031,000 UniCredit 31/12/2049 1,138,486 0�181,675,000 UniCredit 31/12/2049 1,819,133 0�284,464,000 Unipolsai Assicurazioni 31/12/2049 5,967,156 0�93
Total Italy 14,469,030 2.25

206
Federated Hermes Investment Fund Public Limited CompanyPortfolio Statement As at 31 December 2020 (continued)
a Header 1a Federated Hermes SDG Engagement High Yield Credit Fund (continued)
Nominal Holdings Financial assets at fair value through profit or loss
Fair Value $
% of Net Assets
. . . . .Floating Rate Notes: 21.15% (2019: 16.40%) (continued)
Japan: 0.00% (2019: 0.70%) - -
Luxembourg: 0.36% (2019: 0.31%)
1,800,000 Eurofins Scientific 31/12/2049 2,306,728 0�36
Total Luxembourg 2,306,728 0.36
Mexico: 0.53% (2019: 0.69%)
800,000 Banco Mercantil del Norte 31/12/2049 869,000 0�141,830,000 Banco Mercantil del Norte 31/12/2049 2,070,187 0�32
400,000 Banco Mercantil del Norte 31/12/2049 454,504 0�07
Total Mexico 3,393,691 0.53
Netherlands: 1.41% (2019: 0.00%)
500,000 ABN AMRO Bank 31/12/2049 651,662 0�102,800,000 ABN AMRO Bank 31/12/2049 3,681,858 0�583,800,000 Cooperatieve Rabobank 31/12/2049 4,702,085 0�73
Total Netherlands 9,035,605 1.41
Norway: 0.31% (2019: 0.00%)
1,900,000 DNB 31/12/2049 1,974,742 0�31
Total Norway 1,974,742 0.31
Portugal: 1.16% (2019: 0.63%)
1,200,000 Caixa Geral de Depositos 31/12/2049 1,620,133 0�254,800,000 Energias de Portugal 20/07/2080 5,866,051 0�91
Total Portugal 7,486,184 1.16
Spain: 0.99% (2019: 0.00%)
4,000,000 Telefonica Europe 05/02/2050 5,001,706 0�781,100,000 Telefonica Europe 31/12/2049 1,367,776 0�21
Total Spain 6,369,482 0.99
Sweden: 0.89% (2019: 0.00%)
4,700,000 Samhallsbygg 31/12/2049 5,730,357 0�89
Total Sweden 5,730,357 0.89

207
Federated Hermes Investment Fund Public Limited CompanyPortfolio Statement As at 31 December 2020 (continued)
a Header 1a Federated Hermes SDG Engagement High Yield Credit Fund (continued)
Nominal Holdings Financial assets at fair value through profit or loss
Fair Value $
% of Net Assets
. . . . .Floating Rate Notes: 21.15% (2019: 16.40%) (continued)
Switzerland: 1.62% (2019: 1.35%)
3,600,000 Argentum Netherlands 31/12/2049 3,662,352 0�57568,000 Credit Suisse 31/12/2049 572,203 0�09
5,950,000 Credit Suisse 31/12/2049 6,202,875 0�96
Total Switzerland 10,437,430 1.62
United Kingdom: 2.66% (2019: 3.51%)
100,000 Barclays Bank 31/12/2049 125,655 0�021,250,000 Barclays Bank 31/12/2049 1,570,688 0�243,150,000 Barclays Bank 31/12/2049 4,663,282 0�732,034,000 BP Capital Markets 31/12/2049 2,994,118 0�471,890,000 National Westminster Bank 31/12/2049 1,758,172 0�27
960,000 National Westminster Bank 31/12/2049 893,069 0�14200,000 Phoenix Group 31/12/2049 211,960 0�03
2,550,000 Phoenix Group 31/12/2049 3,732,738 0�58300,000 Royal Bank of Scotland Group 22/05/2024 312,344 0�05250,000 Royal Bank of Scotland Group 14/08/2030 368,215 0�06400,000 Royal Bank of Scotland Group 31/12/2049 439,148 0�07
Total United Kingdom 17,069,389 2.66
United States: 2.00% (2019: 1.66%)
6,625,000 Enterprise Products Operating 15/02/2078 6,706,072 1�051,802,000 General Motors Financial 31/12/2049 1,878,585 0�293,595,000 General Motors Financial 31/12/2049 3,918,550 0�61
250,000 Hanesbrands Finance Luxembourg 15/06/2024 322,011 0�05
Total United States 12,825,218 2.00
Total Floating Rate Notes 135,847,192 21.15
Financial Derivative Instruments: 0.69% (2019: 1.45%)
Credit Default Swaps: 0.46% (2019: 0.55%)
Credit Default Swaps: Receive Fixed (Sell Protection) - Unrealised Gains: 0.46% (2019: 0.55%)
European Union: 0.12% (2019: 0.45%)
(400,000) ArcelorMittal 5% 20/12/2026 (Citigroup) 93,526 0�01(300,000) ArcelorMittal 5% 20/12/2026 (Credit Suisse) 70,144 0�01(700,000) ArcelorMittal 5% 20/12/2026 (Credit Suisse) 163,670 0�03(250,000) ArcelorMittal 5% 20/12/2026 (Credit Suisse) 58,453 0�01
(1,200,000) ArcelorMittal 5% 20/12/2026 (BNP Paribas) 280,577 0�04

208
Federated Hermes Investment Fund Public Limited CompanyPortfolio Statement As at 31 December 2020 (continued)
a Header 1a Federated Hermes SDG Engagement High Yield Credit Fund (continued)
Nominal Holdings Financial assets at fair value through profit or loss
Fair Value $
% of Net Assets
. . . . .Financial Derivative Instruments: 0.69% (2019: 1.45%) (continued)
Credit Default Swaps: 0.46% (2019: 0.55%) (continued)
Credit Default Swaps: Receive Fixed (Sell Protection) - Unrealised Gains: 0.46% (2019: 0.55%) (continued)
European Union: 0.12% (2019: 0.45%) (continued)(500,000) ArcelorMittal 5% 20/12/2026 (BNP Paribas) 116,907 0�02
Total European Union 783,277 0.12
France: 0.05% (2019: 0.00%)
(600,000) Arcelormittal 5% 20/12/2026 (BNP Paribas) 140,289 0�02(650,000) ArcelorMittal 5% 20/12/2023 (BNP Paribas) 95,972 0�02(500,000) Fiat Chrysler 5% 20/12/2023 (BNP Paribas) 73,038 0�01
Total France 309,299 0.05
United Kingdom: 0.06% (2019: 0.00%)
(100,000) Virgin Media Secured Finance 5% 20/12/2025 (Credit Suisse) 13,231 -(2,500,000) Ziggo Secured Finance 5% 20/12/2025 (Credit Suisse) 391,830 0�06
Total United Kingdom 405,061 0.06
United States: 0.23% (2019: 0.10%)
(500,000) ArcelorMittal 5% 20/12/2025 (Merrill Lynch) 106,703 0�02(500,000) ArcelorMittal 5% 20/12/2023 (JP Morgan) 73,824 0�01(700,000) Dell 1% 20/12/2023 (JP Morgan) 3,118 -
(1,500,000) Dell 1% 20/12/2023 (Goldman Sachs) 6,681 -(500,000) Fiat Chrysler 5% 20/12/2023 (Goldman Sachs) 73,038 0�01(700,000) Fiat Chrysler 5% 20/12/2023 (JP Morgan) 102,254 0�02
(1,600,000) Fiat Chrysler 5% 20/12/2023 (JP Morgan) 233,723 0�04(2,500,000) Ford Motor 5% 20/12/2023 (Goldman Sachs) 209,553 0�03
(550,000) General Motors 5% 20/12/2023 (JP Morgan) 68,381 0�01(1,425,000) UPC 5% 20/12/2025 (JP Morgan) 226,048 0�03
(500,000) Virgin Media Secured Finance 5% 20/12/2025 (Citigroup) 66,154 0�01(2,400,000) Virgin Media Secured Finance 5% 20/12/2025 (JP Morgan) 317,540 0�05
Total United States 1,487,017 0.23
Total Credit Default Swaps: Receive Fixed (Sell Protection) - Unrealised Gains 2,984,654 0.46
Total Credit Default Swaps 2,984,654 0.46

209
Federated Hermes Investment Fund Public Limited CompanyPortfolio Statement As at 31 December 2020 (continued)
a Header 1a Federated Hermes SDG Engagement High Yield Credit Fund (continued)
Nominal Holdings Financial assets at fair value through profit or loss
Fair Value $
% of Net Assets
. . . . . Financial Derivative Instruments: 0.69% (2019: 1.45%) (continued)
Forward Currency Contracts: 0.21% (2019: 0.71%)
CounterpartyCurrency Buys
Currency Sells
Currency Rate
Maturity Date
Unrealised Gain
$
% of Net Assets
Northern Trust GBP 17,332,989 USD 23,105,395 1�3330 29/01/2021 591,812 0�09Northern Trust CHF 125,096,261 USD 141,182,926 1�1286 29/01/2021 430,047 0�07Northern Trust EUR 143,108,189 USD 175,012,728 1�2229 29/01/2021 176,498 0�03Northern Trust CHF 13,348,385 USD 15,064,912 1�1286 29/01/2021 45,888 0�01Northern Trust EUR 22,252,879 USD 27,213,936 1�2229 29/01/2021 27,445 0�01Royal Bank of Canada USD 4,301,252 EUR 3,500,000 1�2289 17/03/2021 12,209 -Northern Trust USD 15,942,147 EUR 13,000,000 1�2263 17/03/2021 11,419 -Northern Trust GBP 761,548 USD 1,031,265 1�3542 29/01/2021 9,903 -Northern Trust EUR 7,786,246 USD 9,522,112 1�2229 29/01/2021 9,603 -Northern Trust EUR 994,049 USD 1,211,405 1�2187 29/01/2021 5,484 -Northern Trust CHF 891,299 USD 1,003,998 1�1264 29/01/2021 4,981 -Northern Trust EUR 1,032,465 USD 1,259,544 1�2199 29/01/2021 4,372 -Royal Bank of Canada USD 1,474,238 EUR 1,200,000 1�2285 17/03/2021 3,709 -Northern Trust EUR 2,027,799 USD 2,479,877 1�2229 29/01/2021 2,501 -Northern Trust CHF 681,754 USD 769,423 1�1286 29/01/2021 2,344 -Northern Trust EUR 395,943 USD 482,932 1�2197 29/01/2021 1,770 -Northern Trust GBP 41,996 USD 55,982 1�3331 29/01/2021 1,433 -Northern Trust GBP 229,107 USD 311,849 1�3612 29/01/2021 1,379 -Northern Trust GBP 94,033 USD 127,231 1�3530 29/01/2021 1,328 -Northern Trust CHF 146,458 USD 164,521 1�1233 29/01/2021 1,274 -Northern Trust EUR 289,876 USD 353,631 1�2199 29/01/2021 1,227 -Northern Trust EUR 966,618 USD 1,182,373 1�2232 29/01/2021 934 -Northern Trust GBP 26,552 USD 35,392 1�3329 29/01/2021 910 -Northern Trust CHF 234,396 USD 264,584 1�1288 29/01/2021 759 -Northern Trust CHF 212,388 USD 239,699 1�1286 29/01/2021 730 -Northern Trust CHF 203,187 USD 229,316 1�1286 29/01/2021 699 -Northern Trust GBP 7,478 USD 9,968 1�3330 29/01/2021 255 -Northern Trust CHF 20,116 USD 22,659 1�1264 29/01/2021 112 -Northern Trust EUR 14,049 USD 17,121 1�2187 29/01/2021 78 -Northern Trust EUR 8,821 USD 10,759 1�2197 29/01/2021 39 -Northern Trust GBP 1,077 USD 1,436 1�3330 29/01/2021 37 -Northern Trust GBP 1,027 USD 1,369 1�3330 29/01/2021 35 -Northern Trust USD 1,908 CHF 1,683 1�1335 29/01/2021 3 -Northern Trust EUR 1,056 USD 1,292 1�2229 29/01/2021 1 -Northern Trust EUR 1,044 USD 1,276 1�2229 29/01/2021 1 -Northern Trust GBP 22 USD 29 1�3239 29/01/2021 1 -
Unrealised Gains on Forward Currency Contracts 1,351,220 0.21

210
Federated Hermes Investment Fund Public Limited CompanyPortfolio Statement As at 31 December 2020 (continued)
a Header 1a Federated Hermes SDG Engagement High Yield Credit Fund (continued)
Nominal Holdings Financial assets at fair value through profit or loss
Fair Value $
% of Net Assets
. . . . .Financial Derivative Instruments: 0.69% (2019: 1.45%) (continued)
Futures Contracts - Unrealised Gains: 0.02% (2019: 0.19%)
Clearing Broker Description CurrencyNo. of
ContractsUnrealised
Gain $
% of Net Assets
Germany: 0.00% (2019: 0.01%) - -
United States: 0.02% (2019: 0.18%)
Morgan Stanley US Ultra CBT March 2021 USD (83) 104,856 0�02
Total United States 104,856 0.02
Total Futures Contracts - Unrealised Gains 104,856 0.02
Total Financial Derivative Instruments 4,440,730 0.69
Total financial assets at fair value through profit or loss 633,086,648 98.56
Financial liabilities at fair value through profit or loss
Financial Derivative Instruments: (0.67%) (2019: (0.50%))
Credit Default Swaps: (0.40%) (2019: (0.42%))
Credit Default Swaps: Pay Fixed (Buy Protection) - Unrealised Losses: (0.39%) (2019: (0.42%))
European Union: (0.39%) (2019: (0.42%))
17,190,000 Itraxx Europe Crossover 5% 20/12/2025 (Morgan Stanley) (2,499,015) (0�39)
Total European Union (2,499,015) (0.39)
Total Credit Default Swaps: Pay Fixed (Buy Protection) - Unrealised Losses (2,499,015) (0.39)
Credit Default Swaps: Receive Fixed (Sell Protection) - Unrealised Losses: (0.01%) (2019: 0.00%)
United Kingdom: (0.01%) (2019: 0.00%)
(3,800,000) Telecom Italia 1% 20/12/2023 (Credit Suisse) (44,019) (0�01)
Total United Kingdom (44,019) (0.01)
United States: 0.00% (2019: 0.00%)
(500,000) Telecom Italia 1% 20/12/2023 (Goldman Sachs) (5,792) -(500,000) Telecom Italia 1% 20/12/2023 (Merrill Lynch) (5,792) -

211
Federated Hermes Investment Fund Public Limited CompanyPortfolio Statement As at 31 December 2020 (continued)
a Header 1a Federated Hermes SDG Engagement High Yield Credit Fund (continued)
Nominal Holdings Financial liabilities at fair value through profit or loss
Fair Value $
% of Net Assets
. . . . .Financial Derivative Instruments: (0.67%) (2019: (0.50%)) (continued)
Credit Default Swaps: (0.40%) (2019: (0.42%)) (continued)
Credit Default Swaps: Receive Fixed (Sell Protection) - Unrealised Losses: (0.01%) (2019: 0.00%) (continued)
United States: 0.00% (2019: 0.00%) (continued)
(1,400,000) Telecom Italia 1% 20/12/2023 (Merrill Lynch) (16,217) -
Total United States (27,801) -
Total Credit Default Swaps: Receive Fixed (Sell Protection) - Unrealised Losses (71,820) (0.01)
Total Credit Default Swaps (2,570,835) (0.40)
Forward Currency Contracts: (0.27%) (2019: (0.08%))
CounterpartyCurrency Buys
Currency Sells
Currency Rate
Maturity Date
Unrealised Loss
$
% of Net Assets
Northern Trust CHF 164,253 USD 186,183 1�1335 29/01/2021 (243) -Northern Trust USD 62,097 CHF 55,167 1�1256 29/01/2021 (353) -Northern Trust EUR 109,193 USD 134,410 1�2309 29/01/2021 (738) -Royal Bank of Canada USD 2,048,007 GBP 1,500,000 1�3653 17/03/2021 (3,304) -Royal Bank of Canada USD 2,566,612 EUR 2,100,000 1�2222 17/03/2021 (6,813) -Royal Bank of Canada USD 2,440,479 EUR 2,000,000 1�2202 17/03/2021 (10,402) -Northern Trust EUR 1,915,671 USD 2,358,057 1�2309 29/01/2021 (12,943) -Royal Bank of Canada USD 91,488,750 EUR 75,000,000 1�2199 17/03/2021 (419,299) (0�07)State Street USD 91,487,475 EUR 75,000,000 1�2198 17/03/2021 (420,574) (0�07)State Street USD 42,251,832 GBP 31,500,000 1�3413 17/03/2021 (825,691) (0�13)
Unrealised Losses on Forward Currency Contracts (1,700,360) (0.27)

212
Federated Hermes Investment Fund Public Limited CompanyPortfolio Statement As at 31 December 2020 (continued)
a Header 1a Federated Hermes SDG Engagement High Yield Credit Fund (continued)
Nominal Holdings Financial liabilities at fair value through profit or loss
Fair Value $
% of Net Assets
. . . . .Financial Derivative Instruments: (0.67%) (2019: (0.50%)) (continued)
Futures Contracts - Unrealised Losses: 0.00% (2019: 0.00%)
Clearing Broker Description CurrencyNo. of
ContractsUnrealised
Loss $
% of Net Assets
United States: 0.00% (2019: 0.00%)
Morgan Stanley 10 Year Note CBT March 2021 USD (159) (19,875) -
Total United States (19,875) -
Total Futures Contracts - Unrealised Loss (19,875) -
Total Financial Derivative Instruments (4,291,070) (0.67)
Total financial liabilities at fair value through profit or loss (4,291,070) (0.67)
Financial assets at fair value through profit or lossNet financial assets at fair value through profit or loss (2019: 98.04%) (Cost: $ 586,099,769)
628,795,578 97.89
Net Cash (2019: 3.43%) 9,662,853 1.50
Other Net Assets (2019: (1.47%)) 3,898,872 0.61
Net Assets Attributable to Holders of Redeemable Participating Shares 642,357,303 100.00
Portfolio Classification
% of Total Assets
Transferable securities admitted to official stock exchange listing 96�37OTC financial derivative instruments 0�66Financial derivative instruments dealt in on a regulated market 0�02Cash 1�90Other assets 1�05Total 100.00

213
Federated Hermes Investment Funds Public Limited CompanyPortfolio StatementAs at 31 December 2020 (continued)
a Header 1a Federated Hermes US High Yield Credit Fund
Nominal Holdings Financial assets at fair value through profit or loss
Fair Value $
% of Net Assets
. . . . .Corporate Bonds: 96.70%
Canada: 2.46%
75,000 1011778 BC UL 4�000% 15/10/2030 76,101 1�0450,000 Garda World Security 9�500% 01/11/2027 55,460 0�7625,000 Precision Drilling 5�250% 15/11/2024 21,703 0�3025,000 Stars Group 7�000% 15/07/2026 26,359 0�36
Total Canada 179,623 2.46
United States: 94.24%
25,000 Academy 6�000% 15/11/2027 26,250 0�3650,000 Acadia Healthcare 6�500% 01/03/2024 51,245 0�7025,000 AdaptHealth 4�625% 01/08/2029 25,719 0�3525,000 Affinity Gaming 6.875% 15/12/2027 26,257 0�3625,000 Albertsons Companies 3�250% 15/03/2026 25,406 0�3525,000 Albertsons Companies 3�500% 15/03/2029 25,334 0�3550,000 Alliant Intermediate LLC 6�750% 15/10/2027 53,584 0�7325,000 Allied Universal Holdco LLC 6�625% 15/07/2026 26,689 0�3650,000 Allied Universal Holdco LLC 9�750% 15/07/2027 54,587 0�7525,000 AMC Networks 5�000% 01/04/2024 25,438 0�3550,000 American Builders & Contractors Supply 5�875% 15/05/2026 51,906 0�7150,000 AmWINS Group 7�750% 01/07/2026 53,873 0�7450,000 Antero Midstream Partners 5�750% 15/01/2028 48,130 0�6625,000 Antero Midstream Partners 7�875% 15/05/2026 25,877 0�3525,000 Antero Resources 5�625% 01/06/2023 24,531 0�3425,000 Apache 4�875% 15/11/2027 26,538 0�3625,000 Archrock Partners 6�250% 01/04/2028 26,087 0�3625,000 Archrock Partners 6�875% 01/04/2027 26,969 0�37
200,000 Ardagh Packaging Finance 5�250% 15/08/2027 210,162 2�8725,000 Ascent Resources Utica LLC 7�000% 01/11/2026 23,725 0�3225,000 Ball 2�875% 15/08/2030 24,969 0�3425,000 Bally's 6�750% 01/06/2027 26,859 0�3775,000 Bausch Health 5�000% 30/01/2028 77,384 1�0675,000 Bausch Health 6�125% 15/04/2025 77,375 1�0625,000 Black Knight InfoServ 3�625% 01/09/2028 25,625 0�3525,000 Booz Allen Hamilton 3�875% 01/09/2028 25,797 0�3550,000 Boyd Gaming 6�375% 01/04/2026 52,010 0�7125,000 BY Crown Parent LLC 4�250% 31/01/2026 25,656 0�3525,000 Caesars Entertainment 6�250% 01/07/2025 26,657 0�3625,000 Caesars Entertainment 8�125% 01/07/2027 27,708 0�3825,000 Calpine 4�625% 01/02/2029 25,744 0�3525,000 Calpine 5�000% 01/02/2031 26,163 0�3625,000 Cars�com 6�375% 01/11/2028 26,599 0�3625,000 CCM Merger 6�375% 01/05/2026 26,313 0�36
125,000 CCO 4�250% 01/02/2031 131,889 1�8050,000 CCO 5�500% 01/05/2026 51,883 0�7125,000 CDW LLC/CDW Finance 3�250% 15/02/2029 25,524 0�35
125,000 Centene Corporation 5�375% 01/06/2026 131,995 1�8050,000 Cheniere Energy Partners 5�250% 01/10/2025 51,363 0�7025,000 Clearwater Paper 5�375% 01/02/2025 27,172 0�37

214
Federated Hermes Investment Funds Public Limited CompanyPortfolio Statement As at 31 December 2020 (continued)
a Header 1a Federated Hermes US High Yield Credit Fund (continued)
Nominal Holdings Financial assets at fair value through profit or loss
Fair Value $
% of Net Assets
. . . . . Corporate Bonds: 96.70% (continued) United States: 94.24% (continued)
25,000 CNX Midstream Partners 6�500% 15/03/2026 25,500 0�3525,000 Coeur Mining 5�875% 01/06/2024 25,279 0�3425,000 Community Health Systems 5�625% 15/03/2027 26,912 0�3750,000 Compass Minerals International 4�875% 15/07/2024 52,057 0�7125,000 Continental Resources 5�750% 15/01/2031 27,796 0�3850,000 Core & Main 6�125% 15/08/2025 51,781 0�7125,000 Cornerstone Building Brands 6�125% 15/01/2029 26,609 0�3625,000 Cornerstone Building Brands 8�000% 15/04/2026 26,344 0�3625,000 CP Atlas Buyer 7�000% 01/12/2028 26,047 0�3625,000 CrownRock 5�625% 15/10/2025 25,578 0�35
200,000 CSC 4�125% 01/12/2030 209,320 2�8623,000 Cumulus Media New 6�750% 01/07/2026 23,557 0�3225,000 Dana 5�625% 15/06/2028 26,959 0�3775,000 Dell International LLC 7�125% 15/06/2024 77,859 1�0725,000 Diamond Sports Group LLC 5�375% 15/08/2026 20,359 0�2825,000 Diebold Nixdorf 9�375% 15/07/2025 28,047 0�3850,000 DISH DBS 7�375% 01/07/2028 53,312 0�7325,000 Double Eagle Energy Holdings III LLC 7�750% 15/12/2025 26,572 0�3625,000 Element Solutions 3�875% 01/09/2028 25,765 0�3525,000 Energizer 4�375% 31/03/2029 25,925 0�3525,000 Entercom Media 6�500% 01/05/2027 25,495 0�3525,000 Enviva Partners 6�500% 15/01/2026 26,609 0�3675,000 EQM Midstream Partners 5�500% 15/07/2028 82,124 1�1225,000 EQT 5�000% 15/01/2029 26,420 0�3675,000 Flex Acquisition 7�875% 15/07/2026 78,938 1�08
200,000 Ford Motor Credit LLC 4�271% 09/01/2027 211,375 2�8925,000 Freeport-McMoRan 4�250% 01/03/2030 26,961 0�3725,000 Gartner 3�750% 01/10/2030 26,375 0�3650,000 Gates Global/ Gates 6�250% 15/01/2026 52,584 0�7250,000 Global Medical Response 6�500% 01/10/2025 52,313 0�7150,000 Graphic Packaging International 3�500% 15/03/2028 51,932 0�7125,000 Gray Television 4�750% 15/10/2030 25,516 0�3550,000 GTCR AP Finance 8�000% 15/05/2027 54,423 0�7425,000 H&E Equipment Services 3�875% 15/12/2028 25,299 0�3525,000 HB Fuller 4�250% 15/10/2028 25,672 0�3575,000 HCA 3�500% 01/09/2030 79,756 1�0925,000 HCA 5�875% 01/05/2023 27,505 0�3825,000 Hess Midstream Operations 5�625% 15/02/2026 26,047 0�3625,000 Hexion 7�875% 15/07/2027 26,797 0�3750,000 Hilton Domestic Operating 5�750% 01/05/2028 54,469 0�7425,000 Holly Energy Partners 5�000% 01/02/2028 25,234 0�35
100,000 HUB International Limited 7�000% 01/05/2026 104,680 1�4325,000 iHeartCommunications 4�750% 15/01/2028 25,698 0�3550,000 iHeartCommunications 8�375% 01/05/2027 53,464 0�7325,000 Illuminate Buyer LLC 9�000% 01/07/2028 27,531 0�3825,000 Interface 5�500% 01/12/2028 26,360 0�3625,000 Jagged Peak Energy 5�875% 01/05/2026 25,949 0�3625,000 Jaguar Holding Company II 4�625% 15/06/2025 26,406 0�36

215
Federated Hermes Investment Funds Public Limited CompanyPortfolio Statement As at 31 December 2020 (continued)
a Header 1a Federated Hermes US High Yield Credit Fund (continued)
Nominal Holdings Financial assets at fair value through profit or loss
Fair Value $
% of Net Assets
. . . . .Corporate Bonds: 96.70% (continued)
United States: 94.24% (continued)
25,000 JB Poindexter & 7�125% 15/04/2026 26,500 0�3625,000 KAR Auction Services 5�125% 01/06/2025 25,757 0�3550,000 Koppers 6�000% 15/02/2025 51,594 0�7150,000 Kraft Heinz Foods 4�375% 01/06/2046 54,181 0�7425,000 Lamar Media 4�875% 15/01/2029 26,625 0�3725,000 LifePoint Health 5�375% 15/01/2029 24,978 0�3425,000 LogMeIn 5�500% 01/09/2027 26,219 0�3650,000 Match II 5�000% 15/12/2027 53,320 0�7325,000 Mauser Packaging Solutions 7�250% 15/04/2025 25,281 0�3525,000 MEDNAX 6�250% 15/01/2027 26,843 0�3725,000 MGM Growth Properties LLC 5�750% 01/02/2027 28,086 0�3825,000 MGM Resorts International 5�750% 15/06/2025 27,688 0�3825,000 Mohegan Gaming & Entertainment 7�875% 15/10/2024 26,156 0�3625,000 Molina Healthcare 3�875% 15/11/2030 26,875 0�3725,000 MPH Acquisition 5�750% 01/11/2028 24,601 0�3425,000 Nabors Industries 7�250% 15/01/2026 17,576 0�2425,000 Navient 7�250% 25/09/2023 27,446 0�3850,000 NCR Corporation 6�125% 01/09/2029 55,460 0�7675,000 Nexstar Escrow 5�625% 15/07/2027 80,461 1�1050,000 NFP 6�875% 15/08/2028 53,446 0�7318,000 Nielsen Finance LLC 5�000% 15/04/2022 18,065 0�2525,000 Nielsen Finance LLC 5�875% 01/10/2030 28,328 0�3925,000 NRG Energy 3�375% 15/02/2029 25,642 0�3525,000 NRG Energy 3�625% 15/02/2031 25,767 0�3525,000 NuStar Logistics 5�750% 01/10/2025 26,663 0�3625,000 Occidental Petroleum 3�200% 15/08/2026 23,422 0�3225,000 Occidental Petroleum 4�500% 15/07/2044 21,297 0�2925,000 Occidental Petroleum 6�125% 01/01/2031 26,817 0�3750,000 Occidental Petroleum 8�875% 15/07/2030 58,781 0�8025,000 ON Semiconductor 3�875% 01/09/2028 25,906 0�3525,000 Outfront Media Capital LLC 6�250% 15/06/2025 26,422 0�3650,000 Owens-Brockway Glass Container 6�625% 13/05/2027 54,219 0�7450,000 Panther BF Aggregator 8�500% 15/05/2027 54,403 0�7425,000 PDC Energy 6�125% 15/09/2024 25,737 0�3575,000 Post 5�625% 15/01/2028 80,016 1�0950,000 Prestige Brands 5�125% 15/01/2028 53,406 0�7325,000 QEP Resources 5�250% 01/05/2023 26,350 0�3625,000 Qorvo 4�375% 15/10/2029 27,548 0�3825,000 Quicken Loans LLC 3�625% 01/03/2029 25,547 0�3525,000 Rackspace Technology Global 5�375% 01/12/2028 26,239 0�3625,000 Range Resources 9�250% 01/02/2026 26,162 0�3625,000 Reynolds Group Issuer LLC 4�000% 15/10/2027 25,656 0�3525,000 Scripps Escrow 5�875% 15/07/2027 26,149 0�3625,000 Seagate HDD Cayman 3�125% 15/07/2029 25,050 0�3425,000 Sealed Air 4�875% 01/12/2022 26,266 0�3625,000 Sensata Technologies 3�750% 15/02/2031 25,946 0�3550,000 Sinclair Television 5�125% 15/02/2027 51,151 0�7050,000 Sirius XM Radio 5�500% 01/07/2029 55,109 0�75

216
Federated Hermes Investment Funds Public Limited CompanyPortfolio Statement As at 31 December 2020 (continued)
a Header 1a Federated Hermes US High Yield Credit Fund (continued)
Nominal Holdings Financial assets at fair value through profit or loss
Fair Value $
% of Net Assets
. . . . . Corporate Bonds: 96.70% (continued) United States: 94.24% (continued)
25,000 SM Energy 5�625% 01/06/2025 20,466 0�2875,000 Sprint Nextel Corporation 6�000% 15/11/2022 81,281 1�1125,000 SS&C Technologies 5�500% 30/09/2027 26,732 0�3750,000 Standard Industries 3�375% 15/01/2031 50,312 0�6925,000 Station Casinos 5�000% 01/10/2025 25,336 0�3550,000 Suburban Propane Partners 5�875% 01/03/2027 52,406 0�7225,000 Syneos Health 3�625% 15/01/2029 25,116 0�3425,000 Targa Resources Partners 4�875% 01/02/2031 27,277 0�3775,000 Targa Resources Partners 5�375% 01/02/2027 78,951 1�0850,000 TEGNA 5�000% 15/09/2029 52,868 0�7250,000 Tempo Acquisition LLC 6�750% 01/06/2025 51,740 0�7150,000 Tenet Healthcare 6�125% 01/10/2028 52,193 0�7150,000 Tenet Healthcare 6�250% 01/02/2027 53,070 0�7225,000 TerraForm Power Operating 5�000% 31/01/2028 28,138 0�3950,000 Terrier Media Buyer 8�875% 15/12/2027 55,219 0�7625,000 Townsquare Media 6�875% 01/02/2026 26,230 0�3675,000 Trandim Group 6�500% 15/05/2025 77,203 1�0625,000 Transdigm Group 6�250% 15/03/2026 26,656 0�3625,000 Trident TPI 9�250% 01/08/2024 26,688 0�3725,000 TTM Technologies 5�625% 01/10/2025 25,685 0�3525,000 United Rentals North America 3�875% 15/02/2031 26,273 0�3625,000 United Shore Financial Services 5�500% 15/11/2025 26,406 0�3625,000 USA Compression Partners 6�875% 01/04/2026 26,172 0�3625,000 USA Compression Partners 6�875% 01/09/2027 26,732 0�3750,000 USI 6�875% 01/05/2025 51,406 0�7025,000 Veritas US 7�500% 01/09/2025 25,688 0�3525,000 VICI Properties 4�625% 01/12/2029 26,792 0�3725,000 Watco Companies LLC 6�500% 15/06/2027 27,109 0�3750,000 WESCO Distribution 7�250% 15/06/2028 56,935 0�7825,000 West Street Merger Sub 6�375% 01/09/2025 25,672 0�3525,000 Western Midstream Operating 5�050% 01/02/2030 28,029 0�3825,000 Western Midstream Operating 5�300% 01/03/2048 24,899 0�3425,000 White Cap Buyer 6�875% 15/10/2028 26,703 0�3625,000 WPX Energy 5�250% 15/10/2027 26,533 0�3625,000 Wyndham Hotels & Resorts 4�375% 15/08/2028 26,023 0�36
Total United States 6,892,598 94.24
Total Corporate Bonds 7,072,221 96.70
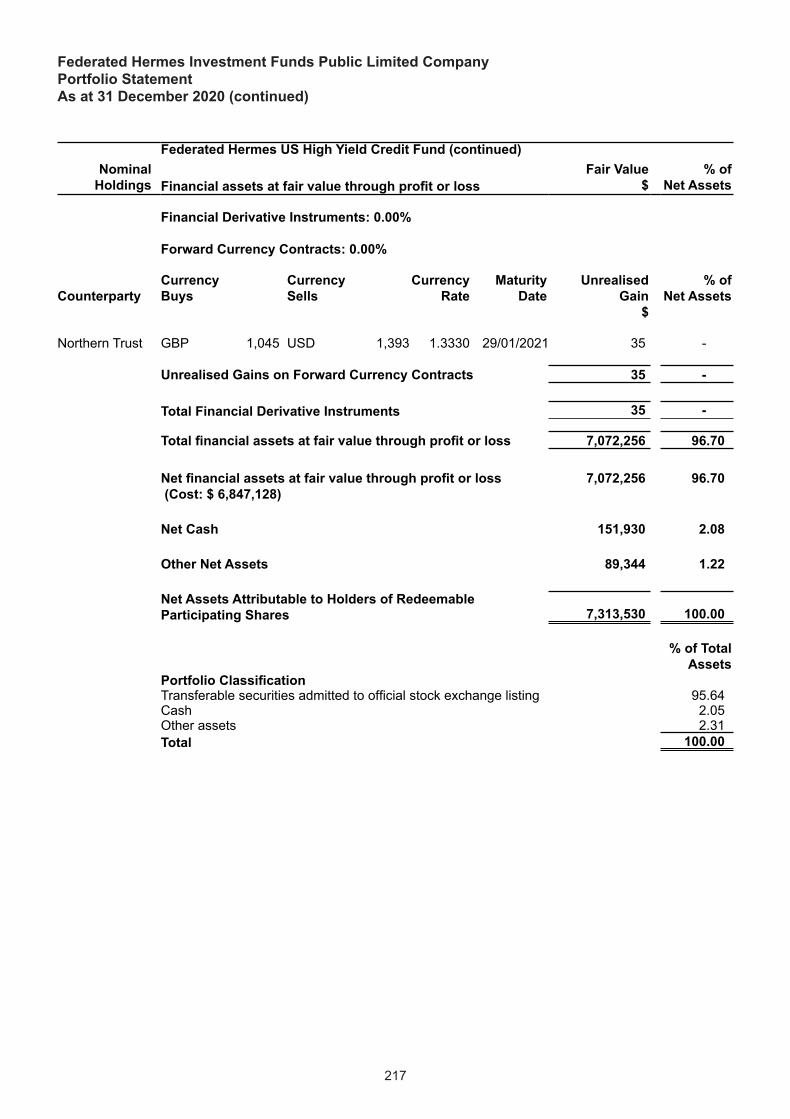
217
Federated Hermes Investment Funds Public Limited CompanyPortfolio Statement As at 31 December 2020 (continued)
a Header 1a Federated Hermes US High Yield Credit Fund (continued)
Nominal Holdings Financial assets at fair value through profit or loss
Fair Value $
% of Net Assets
. . . . .Financial Derivative Instruments: 0.00%
Forward Currency Contracts: 0.00%
CounterpartyCurrency Buys
Currency Sells
Currency Rate
Maturity Date
Unrealised Gain
$
% of Net Assets
Northern Trust GBP 1,045 USD 1,393 1�3330 29/01/2021 35 -
Unrealised Gains on Forward Currency Contracts 35 -
Total Financial Derivative Instruments 35 -
Total financial assets at fair value through profit or loss 7,072,256 96.70
Net financial assets at fair value through profit or loss (Cost: $ 6,847,128)
7,072,256 96.70
Net Cash 151,930 2.08
Other Net Assets 89,344 1.22
Net Assets Attributable to Holders of Redeemable Participating Shares 7,313,530 100.00
Portfolio Classification
% of Total Assets
Transferable securities admitted to official stock exchange listing 95�64Cash 2�05Other assets 2�31Total 100.00

The accompanying notes form an integral part of these Financial Statements
218
Federated Hermes Investment Funds Public Limited Company
As at 31 December 2020 Balance Sheet
Federated Hermes Global Emerging
Markets Equity FundFederated Hermes
Global Equity Fund
Federated Hermes European Alpha
Equity Fund
Federated Hermes Global High Yield
Credit FundAssets Notes $ $ € €Financial assets at fair value through profit or loss 6,901,517,044 36,764,198 97,834,274 332,849,744Cash and cash equivalents 3 162,923,549 81,340 631,805 2,251,744Cash pledged as collateral for derivative positions 4 – – – 240,000Cash received as collateral for derivative positions 4 – – – 3,474,069Dividends and interest receivable 10,501,041 19,715 17,844 3,494,025Securities sold receivable – – – 7,119Subscriptions receivable 9,764,525 – 75,841 56,651Variation margin receivable – – – –Sundry debtors 25,035 83,624 9,064 686Total assets 7,084,731,194 36,948,877 98,568,828 342,374,038LiabilitiesFinancial liabilities at fair value through profit or loss 7,545 – 21,046 3,147,357Cash due to counterparties for derivative positions 4 – – – 3,474,069Securities purchased payable 7,543,203 – – 250Accrued Capital Gains Tax 21,032,130 – – –Sub-custody fee payable 5 (d) 353,073 4,338 4,629 4,663Redemptions payable 5,257,532 – 31,869 142,827Investment Management fee payable 5 (a) 10,523,586 29,921 73,264 295,836Administration fee payable 5 (c) 166,327 2,439 6,673 39,757Depositary fee payable 5 (d) 74,143 689 1,835 5,406Variation margin payable – – – 47,828Other accrued expenses 5 (h) 444,028 51,667 116,024 87,056Total liabilities (excluding net assets attributable to holders of redeemable participating shares) 45,401,567 89,054 255,340 7,245,049
Net assets attributable to holders of redeemable participating shares 7,039,329,627 36,859,823 98,313,488 335,128,989
For information on the Net Asset Value per Share and Shares Outstanding on each share class please refer to note 15�

Federated Hermes Investment Funds Public Limited Company
As at 31 December 2020 (continued)
219
Balance Sheet
The accompanying notes form an integral part of these Financial Statements
Federated Hermes Europe ex-UK Equity
FundFederated Hermes US
SMID Equity Fund
Federated Hermes Asia ex-Japan Equity
Fund
Federated Hermes Global Equity ESG
FundAssets Notes € $ $ $Financial assets at fair value through profit or loss 34,855,812 820,521,867 2,444,618,097 1,599,812,954Cash and cash equivalents 3 196,199 35,298,619 12,784,934 24,426,379Cash pledged as collateral for derivative positions 4 – – – –Cash received as collateral for derivative positions 4 – – – –Dividends and interest receivable – 81,446 8,708,091 1,160,799Securities sold receivable – – 12,832,521 –Subscriptions receivable – 635,550 623,659 1,489,887Variation margin receivable – – – –Sundry debtors 43,054 11,695 10,670 9,345Total assets 35,095,065 856,549,177 2,479,577,972 1,626,899,364LiabilitiesFinancial liabilities at fair value through profit or loss 7 2,930 7,440 2,043,788Cash due to counterparties for derivative positions 4 – – – –Securities purchased payable – – 1,413,721 1,814,754Accrued Capital Gains Tax – – 1,182,795 1,078,335Sub-custody fee payable 5 (d) 5,046 9,036 126,345 31,742Redemptions payable – 57,571 857,494 432,317Investment Management fee payable 5 (a) 33,572 806,074 3,154,249 1,793,790Administration fee payable 5 (c) 2,673 41,439 78,039 56,718Depositary fee payable 5 (d) 736 14,462 31,796 21,328Variation margin payable – – – –Other accrued expenses 5 (h) 53,179 139,803 230,349 226,034Total liabilities (excluding net assets attributable to holders of redeemable participating shares) 95,213 1,071,315 7,082,228 7,498,806
Net assets attributable to holders of redeemable participating shares 34,999,852 855,477,862 2,472,495,744 1,619,400,558
For information on the Net Asset Value per Share and Shares Outstanding on each share class please refer to note 15�gotes

Federated Hermes Investment Funds Public Limited Company
As at 31 December 2020 (continued)
220
Balance Sheet
The accompanying notes form an integral part of these Financial Statements
Federated Hermes Multi-Strategy Credit
Fund
Federated Hermes Global Small Cap
Equity Fund
Federated Hermes Absolute Return
Credit Fund
Federated Hermes SDG Engagement
Equity FundAssets Notes $ $ $ $Financial assets at fair value through profit or loss 621,757,526 129,319,324 323,638,770 1,314,874,882Cash and cash equivalents 3 21,839,087 2,523,855 8,587,475 31,929,354Cash pledged as collateral for derivative positions 4 10,530,000 – 5,454,083 –Cash received as collateral for derivative positions 4 6,710,922 – 2,432,059 –Dividends and interest receivable 5,418,983 44,240 3,043,375 281,098Securities sold receivable – – – –Subscriptions receivable 39,779 – – 2,988,759Variation margin receivable – – 29,416 –Sundry debtors 5,049 523 868 26,870Total assets 666,301,346 131,887,942 343,186,046 1,350,100,963LiabilitiesFinancial liabilities at fair value through profit or loss 33,788,104 – 14,856,068 2,568,603Cash due to counterparties for derivative positions 4 6,710,922 – 2,432,059 –Securities purchased payable – – – 6,170,506Accrued Capital Gains Tax – – – 104,829Sub-custody fee payable 5 (d) 7,433 3,705 5,733 27,521Redemptions payable 4,897 – – 508,201Investment Management fee payable 5 (a) 618,259 109,107 164,897 1,415,311Administration fee payable 5 (c) 46,301 8,367 26,684 50,029Depositary fee payable 5 (d) 11,944 2,301 5,870 18,229Variation margin payable 68,636 – – –Other accrued expenses 5 (h) 411,485 42,603 175,857 256,030Total liabilities (excluding net assets attributable to holders of redeemable participating shares) 41,667,981 166,083 17,667,168 11,119,259
Net assets attributable to holders of redeemable participating shares 624,633,365 131,721,859 325,518,878 1,338,981,704
For information on the Net Asset Value per Share and Shares Outstanding on each share class please refer to note 15�

Federated Hermes Investment Funds Public Limited Company
As at 31 December 2020 (continued)
221
Balance Sheet
The accompanying notes form an integral part of these Financial Statements
Federated Hermes Impact Opportunities
Equity Fund
Federated Hermes Unconstrained Credit
Fund
Federated Hermes Global Emerging
Markets SMID Equity Fund
Federated Hermes SDG Engagement High Yield Credit
FundAssets Notes $ $ $ $Financial assets at fair value through profit or loss 442,188,066 820,308,157 284,228,484 633,086,648Cash and cash equivalents 3 9,283,940 8,403,068 9,365,417 7,202,853Cash pledged as collateral for derivative positions 4 – 20,526,539 – 2,460,000Cash received as collateral for derivative positions 4 – 8,138,063 – 2,705,045Dividends and interest receivable 100,534 7,404,092 390,713 6,159,228Securities sold receivable – 1,627 – –Subscriptions receivable 14,703 134,649 – 551,983Variation margin receivable – – – –Sundry debtors 6,539 11,515 17,204 145,019Total assets 451,593,782 864,927,710 294,001,818 652,310,776LiabilitiesFinancial liabilities at fair value through profit or loss 113 31,781,201 – 4,291,070Cash due to counterparties for derivative positions 4 – 8,138,063 – 2,705,045Securities purchased payable 1,075,616 125,658 3,819,019 2,084,528Accrued Capital Gains Tax – – 1,139,568 –Sub-custody fee payable 5 (d) 9,521 9,549 24,980 6,646Redemptions payable – – – 188,140Investment Management fee payable 5 (a) 303,705 583,565 188,292 405,398Administration fee payable 5 (c) 26,875 51,845 17,110 41,582Depositary fee payable 5 (d) 9,714 13,518 4,705 9,685Variation margin payable – 41,233 – 84,981Other accrued expenses 5 (h) 70,727 435,089 87,759 136,398Total liabilities (excluding net assets attributable to holders of redeemable participating shares) 1,496,271 41,179,721 5,281,433 9,953,473 Net assets attributable to holders of redeemable participating shares 450,097,511 823,747,989 288,720,385 642,357,303
For information on the Net Asset Value per Share and Shares Outstanding on each share class please refer to note 15�

Federated Hermes Investment Funds Public Limited Company
As at 31 December 2020 (continued)
222
Balance Sheet
The accompanying notes form an integral part of these Financial Statements
Federated Hermes US High Yield Credit
Fund* TotalAssets Notes $ £**Financial assets at fair value through profit or loss 7,072,256 12,400,099,274Cash and cash equivalents 3 151,930 247,697,679Cash pledged as collateral for derivative positions 4 – 28,725,731Cash received as collateral for derivative positions 4 – 16,895,377Dividends and interest receivable 103,459 34,907,215Securities sold receivable – 9,395,835Subscriptions receivable – 12,002,334Variation margin receivable – 21,521Sundry debtors 67,001 355,238Total assets 7,394,646 12,750,100,204LiabilitiesFinancial liabilities at fair value through profit or loss – 68,202,208Cash due to counterparties for derivative positions 4 – 16,895,377Securities purchased payable 50,000 17,629,593Accrued Capital Gains Tax – 17,951,750Sub-custody fee payable 5 (d) 1,394 467,169Redemptions payable – 5,501,551Investment Management fee payable 5 (a) 11 15,062,786Administration fee payable 5 (c) 608 493,421Depositary fee payable 5 (d) – 166,910Variation margin payable – 185,363Other accrued expenses 5 (h) 29,103 2,231,717Total liabilities (excluding net assets attributable to holders of redeemable participating shares) 81,116 144,787,845 Net assets attributable to holders of redeemable participating shares 7,313,530 12,605,312,359
For information on the Net Asset Value per Share and Shares Outstanding on each share class please refer to note 15�*Federated Hermes US High Yield Credit Fund launched on 21 July 2020�**Euro and US Dollar denominated sub-funds are converted to Sterling in the company total column using the year end exchange rates of 1�11720 and 1�36695 respectively�

Federated Hermes Investment Funds Public Limited Company
As at 31 December 2020 (continued)
223
Balance Sheet
The accompanying notes form an integral part of these Financial Statements
The Financial Statements were approved on 21 April 2021 by the Board of Directors and signed on its behalf by:
Director Director
Joseph Kagan Ronan Walsh

224
Federated Hermes Investment Funds Public Limited Company
As at 31 December 2019 Balance Sheet
The accompanying notes form an integral part of these Financial Statements
Federated Hermes Global Emerging
Markets Equity FundFederated Hermes
Global Equity Fund
Federated Hermes European Alpha
Equity Fund
Federated Hermes Global High Yield
Credit FundAssets Notes $ $ € €Financial assets at fair value through profit or loss 5,514,309,412 20,454,725 153,058,337 126,337,120Cash and cash equivalents 3 54,420,525 145,368 1,426,275 1,477,128Cash pledged as collateral for derivative positions 4 – – – 480,000Cash received as collateral for derivative positions 4 – – – 1,530,000Dividends and interest receivable 12,090,745 13,705 12,097 1,487,408Securities sold receivable – – – –Subscriptions receivable 2,594,261 – 116,249 143,441Sundry debtors 24,609 140,856 592 342Total assets 5,583,439,552 20,754,654 154,613,550 131,455,439
LiabilitiesFinancial liabilities at fair value through profit or loss 6,198 – 36,127 287,175Bank overdraft 3 – – – –Cash due to counterparties for derivative positions 4 – – – 1,530,000Securities purchased payable 5,615,846 – – 614,000Accrued Capital Gains Tax 7,391,422 – – –Sub-custody fee payable 5 (d) 348,802 7,816 7,211 2,877Redemptions payable 1,383,317 – 879,294 –Investment Management fee payable 5 (a) 4,587,973 8,422 69,068 66,246Administration fee payable 5 (c) 134,396 1,464 10,982 24,732Depositary fee payable 5 (d) 59,107 420 3,020 2,100Variation margin payable – – – 448,114Other accrued expenses 5 (h) 389,604 87,905 102,620 68,091Total liabilities (excluding net assets attributable to holders of redeemable participating shares) 19,916,665 106,027 1,108,322 3,043,335 Net assets attributable to holders of redeemable participating shares 5,563,522,887 20,648,627 153,505,228 128,412,104
For information on the Net Asset Value per Share and Shares Outstanding on each share class please refer to note 15�

Federated Hermes Investment Funds Public Limited Company
As at 31 December 2019 (continued)
225
Balance Sheet
The accompanying notes form an integral part of these Financial Statements
Federated Hermes Europe ex-UK Equity
FundFederated Hermes US
SMID Equity Fund
Federated Hermes Asia ex-Japan Equity
Fund
Federated Hermes Global Equity ESG
FundAssets Notes € $ $ $Financial assets at fair value through profit or loss 213,093,075 1,039,158,711 3,487,145,922 942,440,581Cash and cash equivalents 3 2,095,442 31,469,038 27,545,311 18,421,920Cash pledged as collateral for derivative positions 4 – – – –Cash received as collateral for derivative positions 4 – – – –Dividends and interest receivable 69,875 330,603 9,840,898 830,883Securities sold receivable – – 2,284,743 –Subscriptions receivable – 24,280 519,687 1,473,322Sundry debtors 190 36,389 42,345 16,325Total assets 215,258,582 1,071,019,021 3,527,378,906 963,183,031
LiabilitiesFinancial liabilities at fair value through profit or loss 177 2,320 5,021 709,794Bank overdraft 3 – – – –Cash due to counterparties for derivative positions 4 – – – –Securities purchased payable – 81,447 – 3,818,330Accrued Capital Gains Tax – – – –Sub-custody fee payable 5 (d) 8,102 9,611 159,789 17,518Redemptions payable 16,008 304,029 652,978 82,094Investment Management fee payable 5 (a) 103,145 581,367 2,330,276 470,239Administration fee payable 5 (c) 17,551 46,032 97,246 35,023Depositary fee payable 5 (d) 4,827 16,484 41,306 11,781Variation margin payable – – – –Other accrued expenses 5 (h) 73,147 386,182 367,477 181,972Total liabilities (excluding net assets attributable to holders of redeemable participating shares) 222,957 1,427,472 3,654,093 5,326,751 Net assets attributable to holders of redeemable participating shares 215,035,625 1,069,591,549 3,523,724,813 957,856,280
For information on the Net Asset Value per Share and Shares Outstanding on each share class please refer to note 15�

Federated Hermes Investment Funds Public Limited Company
As at 31 December 2019 (continued)
226
Balance Sheet
The accompanying notes form an integral part of these Financial Statements
Federated Hermes Multi-Strategy Credit
Fund
Federated Hermes Global Small Cap
Equity Fund
Federated Hermes Absolute Return
Credit Fund
Federated Hermes SDG Engagement
Equity FundAssets Notes $ $ $ $Financial assets at fair value through profit or loss 979,955,751 71,745,489 128,646,072 545,155,122Cash and cash equivalents 3 54,105,244 2,209,148 5,442,715 22,240,813Cash pledged as collateral for derivative positions 4 24,301,502 – 3,441,139 –Cash received as collateral for derivative positions 4 7,656,443 – 1,770,008 –Dividends and interest receivable 10,230,796 42,045 1,214,341 252,113Securities sold receivable 3,255,836 – 303,940 6,439,664Subscriptions receivable 23,633 – – 1,733,481Sundry debtors 69,900 18,052 12,040 39,948Total assets 1,079,599,105 74,014,734 140,830,255 575,861,141
LiabilitiesFinancial liabilities at fair value through profit or loss 57,939,379 – 6,814,314 615,912Bank overdraft 3 – – – –Cash due to counterparties for derivative positions 4 7,656,443 – 1,770,008 –Securities purchased payable 17,223,252 70,692 2,361,179 4,205,137Accrued Capital Gains Tax – – – –Sub-custody fee payable 5 (d) 8,319 2,715 3,018 21,238Redemptions payable – – – 35,079Investment Management fee payable 5 (a) 521,430 36,413 47,495 328,245Administration fee payable 5 (c) 60,910 4,707 8,240 28,945Depositary fee payable 5 (d) 15,844 1,294 1,813 8,789Variation margin payable 3,343,332 – 212,432 –Other accrued expenses 5 (h) 737,303 54,141 122,345 171,106Total liabilities (excluding net assets attributable to holders of redeemable participating shares) 87,506,212 169,962 11,340,844 5,414,451 Net assets attributable to holders of redeemable participating shares 992,092,893 73,844,772 129,489,411 570,446,690
For information on the Net Asset Value per Share and Shares Outstanding on each share class please refer to note 15�

Federated Hermes Investment Funds Public Limited Company
As at 31 December 2019 (continued)
227
Balance Sheet
The accompanying notes form an integral part of these Financial Statements
Federated Hermes Impact Opportunities
Equity Fund
Federated Hermes Unconstrained Credit
Fund
Federated Hermes Global Emerging
Markets SMID Equity Fund
Assets Notes $ $ $Financial assets at fair value through profit or loss 250,589,403 528,793,979 175,296,270Cash and cash equivalents 3 2,794,539 – 2,897,881Cash pledged as collateral for derivative positions 4 – 14,360,029 –Cash received as collateral for derivative positions 4 – 7,470,000 –Dividends and interest receivable 190,540 5,516,637 199,560Securities sold receivable – – –Subscriptions receivable – – –Sundry debtors 19,570 54,876 66,234Total assets 253,594,052 556,195,521 178,459,945
LiabilitiesFinancial liabilities at fair value through profit or loss – 14,904,243 –Bank overdraft 3 – 8,130,941 –Cash due to counterparties for derivative positions 4 – 7,470,000 –Securities purchased payable – 4,402,656 883,884Accrued Capital Gains Tax – – –Sub-custody fee payable 5 (d) 9,799 6,542 24,230Redemptions payable – – –Investment Management fee payable 5 (a) 78,110 196,454 64,457Administration fee payable 5 (c) 18,687 38,329 10,333Depositary fee payable 5 (d) 7,338 9,298 2,842Variation margin payable – 1,332,273 –Other accrued expenses 5 (h) 68,281 255,753 41,964Total liabilities (excluding net assets attributable to holders of redeemable participating shares) 182,215 36,746,489 1,027,710 Net assets attributable to holders of redeemable participating shares 253,411,837 519,449,032 177,432,235
For information on the Net Asset Value per Share and Shares Outstanding on each share class please refer to note 15�H

Federated Hermes Investment Funds Public Limited Company
As at 31 December 2019 (continued)
228
Balance Sheet
The accompanying notes form an integral part of these Financial Statements
Federated Hermes SDG Engagement High Yield Credit
Fund* TotalAssets Notes $ £****Financial assets at fair value through profit or loss 247,344,146 10,933,281,828Cash and cash equivalents 3 8,621,791 178,090,719Cash pledged as collateral for derivative positions 4 – 32,188,340Cash received as collateral for derivative positions 4 1,730,706 15,357,311Dividends and interest receivable 2,563,691 34,027,719Securities sold receivable – 9,272,838Subscriptions receivable 757,948 5,599,637Sundry debtors 27,228 429,993Total assets 261,045,510 11,208,248,385
LiabilitiesFinancial liabilities at fair value through profit or loss 1,266,589 62,371,723Bank overdraft 3 – 6,137,722Cash due to counterparties for derivative positions 4 1,730,706 15,357,311Securities purchased payable 6,398,454 34,534,914Accrued Capital Gains Tax – 5,579,489Sub-custody fee payable 5 (d) 2,884 485,148Redemptions payable 16,629 2,626,235Investment Management fee payable 5 (a) 79,727 7,245,356Administration fee payable 5 (c) 15,421 422,361Depositary fee payable 5 (d) 3,393 144,084Variation margin payable 490,548 4,439,779Other accrued expenses 5 (h) 41,800 2,400,125Total liabilities (excluding net assets attributable to holders of redeemable participating shares) 10,046,151 141,744,247 Net assets attributable to holders of redeemable participating shares 250,999,359 11,066,504,138
For information on the Net Asset Value per Share and Shares Outstanding on each share class please refer to note 15�* Federated Hermes SDG Engagement High Yield Credit Fund launched on 02 October 2019�** Euro and US Dollar denominated sub-funds are converted to Sterling in the company total column using the year end exchange rates of 1�18018 and 1�32475 respectively�

The accompanying notes form an integral part of these Financial Statements
229
Federated Hermes Investment Funds Public Limited Company
For the financial year ended 31 December 2020 Income Statement
Federated Hermes Global Emerging
Markets Equity FundFederated Hermes
Global Equity Fund
Federated Hermes European Alpha
Equity Fund
Federated Hermes Global High Yield
Credit FundInvestment Income Notes $ $ € €Dividend income 106,417,307 478,571 1,919,258 –Bank interest income 354,227 5,469 43,545 3,740Bond interest income – – – 11,644,345Other income – – – 27,784Net gain on financial assets and liabilities at fair value through profit or loss 2,5(i) 1,216,886,545 4,765,585 947,804 14,025,898Investment Management fee rebate – 83,535 8,888 –Investment Income 1,323,658,079 5,333,160 2,919,495 25,701,767Expenses General expenses 5(f),(h) (1,542,660) (95,581) (166,298) (222,986)Investment Management fee 5(a) (52,329,417) (131,387) (597,855) (1,240,972)Administration fee 5(c) (820,326) (10,440) (51,376) (116,126)Sub-custodian fee 5(d) (2,076,592) (18,188) (27,997) (29,096)Depositary fee 5(d) (360,290) (2,871) (14,128) (25,548)Directors' fees 5(e) (35,518) (183) (710) (1,804)Audit fee 5(g) (13,152) (8,470) (7,198) (7,292)Operating Expenses (57,177,955) (267,120) (865,562) (1,643,824)Operating Profit 1,266,480,124 5,066,040 2,053,933 24,057,943Finance costsBank interest expense (52,168) (53) (10,803) (81,264)Income distribution 14 (8,021,779) (165,878) (139,630) (4,782,876)Net income equalisation 512,828 17,013 (963,590) 2,708,667
(7,561,119) (148,918) (1,114,023) (2,155,473)Net Profit before taxation 1,258,919,005 4,917,122 939,910 21,902,470Taxation(Withholding tax)/ Reclaims (14,456,863) 20,590 1,739,850 (119,913)Capital gains tax (13,640,708) – – –Increase in net assets attributable to holders of redeemable participating shares from operations 1,230,821,434 4,937,712 2,679,760 21,782,557

Federated Hermes Investment Funds Public Limited Company
For the financial year ended 31 December 2020 (continued)
230
Income Statement
The accompanying notes form an integral part of these Financial Statements
Federated Hermes Europe ex-UK Equity
FundFederated Hermes US
SMID Equity Fund
Federated Hermes Asia ex-Japan Equity
Fund
Federated Hermes Global Equity ESG
FundInvestment Income Notes € $ $ $Dividend income 906,253 8,739,120 75,875,586 18,858,481Bank interest income 9,709 79,731 141,932 51,289Bond interest income – – – –Other income – – – –Net gain/(loss) on financial assets and liabilities at fair value through profit or loss 2,5(i) 2,337,602 (9,986,355) 40,153,696 253,816,367Investment Management fee rebate 42,992 – – –Investment Income/(Expense) 3,296,556 (1,167,504) 116,171,214 272,726,137Expenses General expenses 5(f),(h) (111,178) (304,896) (719,163) (570,343)Investment Management fee 5(a) (374,074) (4,705,626) (19,426,142) (8,428,069)Administration fee 5(c) (28,673) (228,217) (451,060) (284,846)Sub-custodian fee 5(d) (32,128) (54,509) (755,681) (195,051)Depositary fee 5(d) (7,885) (79,369) (183,023) (103,338)Directors' fees 5(e) (324) (4,441) (13,701) (7,992)Audit fee 5(g) (7,172) (10,199) (11,080) (9,200)Operating Expenses (561,434) (5,387,257) (21,559,850) (9,598,839)Operating Profit/(Loss) 2,735,122 (6,554,761) 94,611,364 263,127,298Finance costsBank interest expense (8,487) (2,172) (16,473) (7,374)Income distribution 14 (111,626) (329,726) (16,957,045) (82,313)Net income equalisation (469,959) (208,003) (3,371,046) 1,205,364
(590,072) (539,901) (20,344,564) 1,115,677Net Profit/(Loss) before taxation 2,145,050 (7,094,662) 74,266,800 264,242,975Taxation(Withholding tax)/ Reclaims 412,737 (2,223,536) (9,207,246) (3,721,182)Capital gains tax – – (1,182,795) (1,078,335)Increase/(Decrease) in net assets attributable to holders of redeemable participating shares from operations 2,557,787 (9,318,198) 63,876,759 259,443,458

Federated Hermes Investment Funds Public Limited Company
For the financial year ended 31 December 2020 (continued)
231
Income Statement
The accompanying notes form an integral part of these Financial Statements
Federated Hermes Multi-Strategy Credit
Fund
Federated Hermes Global Small Cap
Equity Fund
Federated Hermes Absolute Return
Credit Fund
Federated Hermes SDG Engagement
Equity FundInvestment Income Notes $ $ $ $Dividend income – 1,288,008 – 13,170,872Bank interest income 84,750 5,774 5,648 42,141Bond interest income 7,104,411 – 1,076,147 –Other income 36,513 – – –Net gain on financial assets and liabilities at fair value through profit or loss 2,5(i) 2,677,236 21,245,043 21,869,011 174,247,961Investment Management fee rebate – – – –Investment Income 9,902,910 22,538,825 22,950,806 187,460,974Expenses General expenses 5(f),(h) (1,012,472) (71,190) (192,657) (579,370)Investment Management fee 5(a) (4,056,558) (455,293) (704,563) (5,713,828)Administration fee 5(c) (280,828) (33,553) (102,452) (234,926)Sub-custodian fee 5(d) (51,748) (21,101) (32,985) (166,707)Depositary fee 5(d) (72,583) (9,227) (22,481) (81,750)Directors' fees 5(e) (3,756) (668) (1,873) (6,169)Audit fee 5(g) (10,102) (8,513) (8,603) (9,036)Operating Expenses (5,488,047) (599,545) (1,065,614) (6,791,786)Operating Profit 4,414,863 21,939,280 21,885,192 180,669,188Finance costsBank interest expense (39,834) (976) (59,236) (7,983)Income distribution 14 (7,799,296) (80,752) (364,193) (96,387)Net income equalisation (358,968) 180,298 (186,055) 1,729,218
(8,198,098) 98,570 (609,484) 1,624,848Net (Loss)/Profit before taxation (3,783,235) 22,037,850 21,275,708 182,294,036Taxation(Withholding tax)/ Reclaims – (256,056) (51,672) (2,361,950)Capital gains tax – – – (104,829)(Decrease)/Increase in net assets attributable to holders of redeemable participating shares from operations (3,783,235) 21,781,794 21,224,036 179,827,257

Federated Hermes Investment Funds Public Limited Company
For the financial year ended 31 December 2020 (continued)
232
Income Statement
The accompanying notes form an integral part of these Financial Statements
Federated Hermes Impact Opportunities
Equity Fund
Federated Hermes Unconstrained Credit
Fund
Federated Hermes Global Emerging
Markets SMID Equity Fund
Federated Hermes SDG Engagement High Yield Credit
FundInvestment Income Notes $ $ $ $Dividend income 2,346,458 11,171 3,785,606 –Bank interest income 19,490 – 11,741 3,105Bond interest income – 25,863,003 – 16,623,553Other income – – – –Net gain on financial assets and liabilities at fair value through profit or loss 2,5(i) 85,242,862 69,158,821 47,943,226 45,653,310Investment Management fee rebate – – 7,176 127,412Investment Income 87,608,810 95,032,995 51,747,749 62,407,380Expenses General expenses 5(f),(h) (203,572) (507,895) (152,209) (308,914)Investment Management fee 5(a) (847,524) (2,634,512) (863,711) (1,618,667)Administration fee 5(c) (114,397) (254,191) (78,153) (183,347)Sub-custodian fee 5(d) (58,499) (58,908) (149,745) (36,545)Depositary fee 5(d) (31,584) (64,195) (21,492) (42,004)Directors' fees 5(e) (2,115) (4,185) (1,368) (2,826)Audit fee 5(g) (8,657) (8,841) (8,604) (2,425)Operating Expenses (1,266,348) (3,532,727) (1,275,282) (2,194,728)Operating Profit 86,342,462 91,500,268 50,472,467 60,212,652Finance costsBank interest expense (1,823) (431,504) (1,887) (25,995)Income distribution 14 (364) (3,143,500) (114,997) (405,987)Net income equalisation 222,956 1,685,217 321,286 6,002,486
220,769 (1,889,787) 204,402 5,570,504Net Profit before taxation 86,563,231 89,610,481 50,676,869 65,783,156Taxation(Withholding tax)/ Reclaims (319,226) (345,791) (440,909) (38,258)Capital gains tax – – (1,139,568) –Increase in net assets attributable to holders of redeemable participating shares from operations 86,244,005 89,264,690 49,096,392 65,744,898

Federated Hermes Investment Funds Public Limited Company
For the financial year ended 31 December 2020 (continued)
233
Income Statement
The accompanying notes form an integral part of these Financial Statements
Federated Hermes US High Yield Credit
Fund* TotalInvestment Income Notes $ £**Dividend income – 182,460,678Bank interest income – 678,058Bond interest income 157,286 49,945,619Other income – 53,139Net gain on financial assets and liabilities at fair value through profit or loss 2,5(i) 250,377 1,553,268,499Investment Management fee rebate 39,760 247,022Investment Income 447,423 1,786,653,015Expenses General expenses 5(f),(h) (33,618) (5,348,837)Investment Management fee 5(a) (25) (81,368,832)Administration fee 5(c) (1,569) (2,572,648)Sub-custodian fee 5(d) (2,750) (2,945,607)Depositary fee 5(d) (345) (879,451)Directors' fees 5(e) (43) (68,619)Audit fee 5(g) (4,242) (113,619)Operating Expenses (42,592) (93,297,613)Operating Profit 404,831 1,693,355,402Finance costsBank interest expense – (593,813)Income distribution 14 – (33,738,556)Net income equalisation – 7,173,243
– (27,159,126)Net Profit before taxation 404,831 1,666,196,276Taxation(Withholding tax)/ Reclaims – (24,217,138)Capital gains tax – (13,358,632)Increase in net assets attributable to holders of redeemable participating shares from operations 404,831 1,628,620,506 * Federated Hermes US High Yield Credit Fund launched on 21 July 2020�**Euro and US Dollar denominated sub-funds are converted to Sterling in the company total column using the average exchange rates of 1�12529 and 1�28361 respectively�Gains and losses arose from continuing and discontinued operations� There were no gains or losses other than those dealt with in the Income Statement�

234
Federated Hermes Investment Funds Public Limited Company
For the financial year ended 31 December 2019 Income Statement
The accompanying notes form an integral part of these Financial Statements
Federated Hermes Global Emerging
Markets Equity FundFederated Hermes
Global Equity Fund
Federated Hermes European Alpha
Equity Fund
Federated Hermes Global High Yield
Credit FundInvestment Income Notes $ $ € €Dividend income 115,448,843 596,732 9,437,904 –Bank interest income 1,441,664 173,014 669,332 19,670Bond interest income – – – 7,211,863Other income – – – –Net gain on financial assets and liabilities at fair value through profit or loss 2,5(i) 939,270,986 7,035,179 77,509,078 19,088,774Investment Management fee rebate – 105,201 – –Investment Income 1,056,161,493 7,910,126 87,616,314 26,320,307Expenses General expenses 5(f),(h) (1,313,665) (68,777) (217,273) (157,764)Investment Management fee 5(a) (46,487,576) (139,582) (1,620,673) (797,054)Administration fee 5(c) (724,535) (11,298) (128,145) (69,539)Sub-custodian fee 5(d) (2,072,043) (70,477) (42,917) (29,974)Depositary fee 5(d) (314,622) (3,107) (36,803) (15,299)Directors' fees 5(e) (37,166) (152) (1,651) (1,066)Audit fee 5(g) (11,568) (8,022) (6,340) (7,447)Operating Expenses (50,961,175) (301,415) (2,053,802) (1,078,143)Operating Profit 1,005,200,318 7,608,711 85,562,512 25,242,164Finance costsBank interest expense (6,472) (221) (340) (28,949)Income distribution 14 (9,906,290) (14,210) (150,026) (442,401)Net income equalisation 3,616,533 (117,736) (5,243,942) (2,287,118)
(6,296,229) (132,167) (5,394,308) (2,758,468)Net Profit before taxation 998,904,089 7,476,544 80,168,204 22,483,696Taxation(Withholding tax)/ Reclaims (14,101,190) 24,577 749,288 (69,637)Capital gains tax (7,391,422) – – –
Increase in net assets attributable to holders of redeemable participating shares from operations 977,411,477 7,501,121 80,917,492 22,414,059

Federated Hermes Investment Funds Public Limited Company
For the financial year ended 31 December 2019 (continued)
235
Income Statement
The accompanying notes form an integral part of these Financial Statements
Federated Hermes Europe ex-UK Equity
FundFederated Hermes US
SMID Equity Fund
Federated Hermes Asia ex-Japan Equity
Fund
Federated Hermes Global Equity ESG
FundInvestment Income Notes € $ $ $Dividend income 5,871,155 10,522,907 118,628,463 9,219,214Bank interest income 205,423 501,438 2,675,204 199,307Bond interest income – – – –Other income – – – –Net gain on financial assets and liabilities at fair value through profit or loss 2,5(i) 60,527,840 249,722,471 348,495,725 95,859,720Investment Management fee rebate – – – –Investment Income 66,604,418 260,746,816 469,799,392 105,278,241Expenses General expenses 5(f),(h) (179,227) (505,327) (1,642,344) (364,560)Investment Management fee 5(a) (1,226,396) (6,050,585) (27,509,532) (3,140,080)Administration fee 5(c) (102,735) (261,534) (588,303) (166,221)Sub-custodian fee 5(d) (39,250) (53,727) (953,146) (103,448)Depositary fee 5(d) (28,252) (92,408) (249,224) (50,310)Directors' fees 5(e) (2,072) (7,224) (25,209) (3,937)Audit fee 5(g) (7,505) (10,945) (10,809) (8,290)Operating Expenses (1,585,437) (6,981,750) (30,978,567) (3,836,846)Operating Profit 65,018,981 253,765,066 438,820,825 101,441,395Finance costsBank interest expense (69) (5,970) (5,247) (1,318)Income distribution 14 (283,509) (134,281) (18,538,922) (81,613)Net income equalisation (1,073,297) (89,859) (5,374,016) 2,721,147
(1,356,875) (230,110) (23,918,185) 2,638,216Net Profit before taxation 63,662,106 253,534,956 414,902,640 104,079,611Taxation(Withholding tax)/ Reclaims (382,652) (2,903,387) (15,342,739) (1,779,317)Capital gains tax – – – –
Increase in net assets attributable to holders of redeemable participating shares from operations 63,279,454 250,631,569 399,559,901 102,300,294

Federated Hermes Investment Funds Public Limited Company
For the financial year ended 31 December 2019 (continued)
236
Income Statement
The accompanying notes form an integral part of these Financial Statements
Federated Hermes Multi-Strategy Credit
Fund
Federated Hermes Global Small Cap
Equity Fund
Federated Hermes Absolute Return
Credit Fund
Federated Hermes SDG Engagement
Equity FundInvestment Income Notes $ $ $ $Dividend income – 1,230,924 – 5,918,592Bank interest income 396,224 31,689 8,927 106,197Bond interest income 35,708,377 – 3,623,036 –Other income 65,273 – 11,433 –Net gain on financial assets and liabilities at fair value through profit or loss 2,5(i) 103,335,496 12,642,939 7,448,502 79,885,549Investment Management fee rebate – 17,886 – –Investment Income 139,505,370 13,923,438 11,091,898 85,910,338Expenses General expenses 5(f),(h) (1,072,531) (93,665) (155,276) (312,439)Investment Management fee 5(a) (5,790,610) (347,335) (551,009) (2,415,010)Administration fee 5(c) (364,222) (24,610) (54,657) (132,425)Sub-custodian fee 5(d) (45,037) (13,243) (19,842) (128,065)Depositary fee 5(d) (94,573) (6,768) (12,024) (37,284)Directors' fees 5(e) (7,100) (452) (577) (2,932)Audit fee 5(g) (9,682) (8,055) (8,059) (8,227)Operating Expenses (7,383,755) (494,128) (801,444) (3,036,382)Operating Profit 132,121,615 13,429,310 10,290,454 82,873,956Finance costsBank interest expense (32,361) (173) (7,156) (166)Income distribution 14 (17,379,913) (161,419) (825,531) (79,781)Net income equalisation (1,588,979) 22,629 (389,407) 2,033,928
(19,001,253) (138,963) (1,222,094) 1,953,981Net Profit before taxation 113,120,362 13,290,347 9,068,360 84,827,937Taxation(Withholding tax)/ Reclaims – (213,758) (25,905) (889,652)Capital gains tax – – – –
Increase in net assets attributable to holders of redeemable participating shares from operations 113,120,362 13,076,589 9,042,455 83,938,285

Federated Hermes Investment Funds Public Limited Company
For the financial year ended 31 December 2019 (continued)
237
Income Statement
The accompanying notes form an integral part of these Financial Statements
Federated Hermes Impact Opportunities
Equity Fund
Federated Hermes Unconstrained Credit
Fund
Federated Hermes Global Emerging
Markets SMID Equity Fund
Investment Income Notes $ $ $Dividend income 3,370,961 – 2,857,320Bank interest income 169,772 1,160 43,291Bond interest income – 19,102,012 –Other income – 84,936 –Net gain on financial assets and liabilities at fair value through profit or loss 2,5(i) 58,903,308 59,583,359 18,817,461Investment Management fee rebate – – 43,380Investment Income 62,444,041 78,771,467 21,761,452Expenses General expenses 5(f),(h) (175,430) (423,651) (89,181)Investment Management fee 5(a) (911,235) (1,923,690) (495,682)Administration fee 5(c) (94,608) (208,517) (43,980)Sub-custodian fee 5(d) (71,961) (55,107) (124,903)Depositary fee 5(d) (26,017) (48,549) (12,094)Directors' fees 5(e) (1,997) (3,705) (1,040)Audit fee 5(g) (8,155) (8,251) (6,141)Operating Expenses (1,289,403) (2,671,470) (773,021)Operating Profit 61,154,638 76,099,997 20,988,431Finance costsBank interest expense (27) (62,092) (108)Income distribution 14 (5) (3,690,375) (85,284)Net income equalisation (50,040) 1,541,489 725,801
(50,072) (2,210,978) 640,409Net Profit before taxation 61,104,566 73,889,019 21,628,840Taxation(Withholding tax)/ Reclaims (600,825) (218,076) (268,468)Capital gains tax – – –
Increase in net assets attributable to holders of redeemable participating shares from operations 60,503,741 73,670,943 21,360,372

Federated Hermes Investment Funds Public Limited Company
For the financial year ended 31 December 2019 (continued)
238
Income Statement
The accompanying notes form an integral part of these Financial Statements
Federated Hermes SDG Engagement High Yield Credit
Fund* TotalInvestment Income Notes $ £**Dividend income – 223,115,825Bank interest income 8,117 5,291,283Bond interest income 1,420,666 53,190,593Other income – 126,574Net gain on financial assets and liabilities at fair value through profit or loss 2,5(i) 8,458,048 1,695,580,479Investment Management fee rebate – 130,352Investment Income 9,886,831 1,977,435,106Expenses General expenses 5(f),(h) (59,472) (5,400,533)Investment Management fee 5(a) (163,889) (78,309,111)Administration fee 5(c) (20,243) (2,373,784)Sub-custodian fee 5(d) (5,004) (3,008,118)Depositary fee 5(d) (4,453) (815,457)Directors' fees 5(e) (814) (76,477)Audit fee 5(g) (2,106) (103,477)Operating Expenses (255,981) (90,086,957)Operating Profit 9,630,850 1,887,348,149Finance costsBank interest expense (1,151) (121,629)Income distribution 14 – (40,623,221)Net income equalisation 561,015 (4,713,721)
559,864 (45,458,571)Net Profit before taxation 10,190,714 1,841,889,578Taxation(Withholding tax)/ Reclaims – (28,179,043)Capital gains tax – (5,787,853)
Increase in net assets attributable to holders of redeemable participating shares from operations 10,190,714 1,807,922,682
* Federated Hermes SDG Engagement High Yield Credit Fund launched on 02 October 2019�** Euro and US Dollar denominated sub-funds are converted to Sterling in the company total column using the average exchange rates of 1�1408 and 1�2771 respectively�Gains and losses arose from continuing operations� There were no gains or losses other than those dealt with in the Income Statement�

The accompanying notes form an integral part of these Financial Statements
239
Federated Hermes Investment Funds Public Limited Company
For the financial year ended 31 December 2020 Statement of Changes in Net Assets Attributable to Holders of Redeemable Participating Shares
Notes
Federated Hermes Global Emerging
Markets Equity Fund
Federated Hermes Global Equity Fund
Federated Hermes European Alpha
Equity Fund
Federated Hermes Global High Yield
Credit Fund$ $ € €
Net assets attributable to holders of redeemable participating shares at the beginning of the year 5,563,522,887 20,648,627 153,505,228 128,412,104
Redeemable participating share transactionsIssue of redeemable participating shares for the year 2,398,012,567 14,127,930 23,555,289 264,873,352Redemption of redeemable participating shares for the year (2,153,027,261) (2,854,446) (81,426,789) (79,939,024)Net increase/(decrease) in net assets from redeemable participating share transactions 244,985,306 11,273,484 (57,871,500) 184,934,328 Foreign exchange adjustments on aggregation 2 – – – –
Increase in net assets attributable to holders of redeemable participating shares from operations 1,230,821,434 4,937,712 2,679,760 21,782,557
Net assets attributable to holders of redeemable participating shares at the end of the year 7,039,329,627 36,859,823 98,313,488 335,128,989

Federated Hermes Investment Funds Public Limited Company
For the financial year ended 31 December 2020 (continued)
240
Statement of Changes in Net Assets Attributable to Holders of Redeemable Participating Shares
The accompanying notes form an integral part of these Financial Statements
Notes
Federated Hermes Europe ex-UK
Equity Fund
Federated Hermes US SMID Equity
Fund
Federated Hermes Asia ex-Japan
Equity Fund
Federated Hermes Global Equity ESG
Fund€ $ $ $
Net assets attributable to holders of redeemable participating shares at the beginning of the year 215,035,625 1,069,591,549 3,523,724,813 957,856,280
Redeemable participating share transactionsIssue of redeemable participating shares for the year 38,687,755 553,226,316 474,163,840 689,166,737Redemption of redeemable participating shares for the year (221,281,315) (758,021,805) (1,589,269,668) (287,065,917)Net (decrease)/increase in net assets from redeemable participating share transactions (182,593,560) (204,795,489) (1,115,105,828) 402,100,820 Foreign exchange adjustments on aggregation 2 – – – –
Increase/(Decrease) in net assets attributable to holders of redeemable participating shares from operations 2,557,787 (9,318,198) 63,876,759 259,443,458
Net assets attributable to holders of redeemable participating shares at the end of the year 34,999,852 855,477,862 2,472,495,744 1,619,400,558

Federated Hermes Investment Funds Public Limited Company
For the financial year ended 31 December 2020 (continued)
241
Statement of Changes in Net Assets Attributable to Holders of Redeemable Participating Shares
The accompanying notes form an integral part of these Financial Statements
Notes
Federated Hermes Multi-Strategy
Credit Fund
Federated Hermes Global Small Cap
Equity Fund
Federated Hermes Absolute Return
Credit Fund
Federated Hermes SDG Engagement
Equity Fund$ $ $ $
Net assets attributable to holders of redeemable participating shares at the beginning of the year 992,092,893 73,844,772 129,489,411 570,446,690
Redeemable participating share transactionsIssue of redeemable participating shares for the year 189,606,269 47,455,189 306,472,441 856,501,653Redemption of redeemable participating shares for the year (553,282,562) (11,359,896) (131,667,010) (267,793,896)Net (decrease)/increase in net assets from redeemable participating share transactions (363,676,293) 36,095,293 174,805,431 588,707,757 Foreign exchange adjustments on aggregation 2 – – – –
(Decrease)/Increase in net assets attributable to holders of redeemable participating shares from operations (3,783,235) 21,781,794 21,224,036 179,827,257
Net assets attributable to holders of redeemable participating shares at the end of the year 624,633,365 131,721,859 325,518,878 1,338,981,704

Federated Hermes Investment Funds Public Limited Company
For the financial year ended 31 December 2020 (continued)
242
Statement of Changes in Net Assets Attributable to Holders of Redeemable Participating Shares
The accompanying notes form an integral part of these Financial Statements
Notes
Federated Hermes Impact
Opportunities Equity Fund
Federated Hermes Unconstrained
Credit Fund
Federated Hermes Global Emerging
Markets SMID Equity Fund
Federated Hermes SDG Engagement High Yield Credit
Fund$ $ $ $
Net assets attributable to holders of redeemable participating shares at the beginning of the year 253,411,837 519,449,032 177,432,235 250,999,359
Redeemable participating share transactionsIssue of redeemable participating shares for the year 173,879,526 347,464,648 88,655,515 378,718,770Redemption of redeemable participating shares for the year (63,437,857) (132,430,381) (26,463,757) (53,105,724)Net increase in net assets from redeemable participating share transactions 110,441,669 215,034,267 62,191,758 325,613,046 Foreign exchange adjustments on aggregation 2 – – – –
Increase in net assets attributable to holders of redeemable participating shares from operations 86,244,005 89,264,690 49,096,392 65,744,898
Net assets attributable to holders of redeemable participating shares at the end of the year 450,097,511 823,747,989 288,720,385 642,357,303

Federated Hermes Investment Funds Public Limited Company
For the financial year ended 31 December 2020 (continued)
243
Statement of Changes in Net Assets Attributable to Holders of Redeemable Participating Shares
The accompanying notes form an integral part of these Financial Statements
Notes
Federated Hermes US High Yield Credit
Fund* Total$ £**
Net assets attributable to holders of redeemable participating shares at the beginning of the year – 11,066,504,138
Redeemable participating share transactionsIssue of redeemable participating shares for the year 6,908,699 5,373,837,295Redemption of redeemable participating shares for the year – (5,037,860,241)Net increase in net assets from redeemable participating share transactions 6,908,699 335,977,054 Foreign exchange adjustments on aggregation 2 – (425,789,339)
Increase in net assets attributable to holders of redeemable participating shares from operations 404,831 1,628,620,506
Net assets attributable to holders of redeemable participating shares at the end of the year 7,313,530 12,605,312,359
* Federated Hermes High Yield Credit Fund launched on 21 July 2020�** Euro and US Dollar denominated sub-funds are converted to Sterling in the company total column using the average exchange rates of 1�12529 and 1�28361 respectively�

244
Federated Hermes Investment Funds Public Limited Company
For the financial year ended 31 December 2019 Statement of Changes in Net Assets Attributable to Holders of Redeemable Participating Shares
The accompanying notes form an integral part of these Financial Statements
Notes
Federated Hermes Global Emerging
Markets Equity Fund
Federated Hermes Global Equity Fund
Federated Hermes European Alpha
Equity Fund
Federated Hermes Global High Yield
Credit Fund$ $ € €
Net assets attributable to holders of redeemable participating shares at the beginning of the year 3,603,662,672 54,961,237 365,723,090 190,847,988
Redeemable participating share transactionsIssue of redeemable participating shares for the year 2,665,907,070 20,474,403 60,793,427 205,239,899Redemption of redeemable participating shares for the year (1,683,458,332) (62,288,134) (353,928,781) (290,089,842)Net increase/(decrease) in net assets from redeemable participating share transactions 982,448,738 (41,813,731) (293,135,354) (84,849,943) Foreign exchange adjustments on aggregation 2 – – – –
Increase in net assets attributable to holders of redeemable participating shares from operations 977,411,477 7,501,121 80,917,492 22,414,059
Net assets attributable to holders of redeemable participating shares at the end of the year 5,563,522,887 20,648,627 153,505,228 128,412,104

Federated Hermes Investment Funds Public Limited Company
For the financial year ended 31 December 2019 (continued)
245
Statement of Changes in Net Assets Attributable to Holders of Redeemable Participating Shares
The accompanying notes form an integral part of these Financial Statements
Notes
Federated Hermes Europe ex-UK
Equity Fund
Federated Hermes US SMID Equity
Fund
Federated Hermes Asia ex-Japan
Equity Fund
Federated Hermes Global Equity ESG
Fund€ $ $ $
Net assets attributable to holders of redeemable participating shares at the beginning of the year 215,113,861 864,552,829 3,537,396,208 297,722,935
Redeemable participating share transactionsIssue of redeemable participating shares for the year 95,586,085 520,848,383 476,864,123 753,995,250Redemption of redeemable participating shares for the year (158,943,775) (566,441,232) (890,095,419) (196,162,199)Net (decrease)/increase in net assets from redeemable participating share transactions (63,357,690) (45,592,849) (413,231,296) 557,833,051 Foreign exchange adjustments on aggregation 2 – – – –
Increase in net assets attributable to holders of redeemable participating shares from operations 63,279,454 250,631,569 399,559,901 102,300,294
Net assets attributable to holders of redeemable participating shares at the end of the year 215,035,625 1,069,591,549 3,523,724,813 957,856,280

Federated Hermes Investment Funds Public Limited Company
For the financial year ended 31 December 2019 (continued)
246
Statement of Changes in Net Assets Attributable to Holders of Redeemable Participating Shares
The accompanying notes form an integral part of these Financial Statements
Notes
Federated Hermes Multi-Strategy
Credit Fund
Federated Hermes Global Small Cap
Equity Fund
Federated Hermes Absolute Return
Credit Fund
Federated Hermes SDG Engagement
Equity Fund$ $ $ $
Net assets attributable to holders of redeemable participating shares at the beginning of the year 1,090,662,338 55,030,969 165,729,307 298,057,806
Redeemable participating share transactionsIssue of redeemable participating shares for the year 149,602,250 11,547,514 77,141,199 445,713,606Redemption of redeemable participating shares for the year (361,292,057) (5,810,300) (122,423,550) (257,263,007)Net (decrease)/increase in net assets from redeemable participating share transactions (211,689,807) 5,737,214 (45,282,351) 188,450,599 Foreign exchange adjustments on aggregation 2 – – – –
Increase in net assets attributable to holders of redeemable participating shares from operations 113,120,362 13,076,589 9,042,455 83,938,285
Net assets attributable to holders of redeemable participating shares at the end of the year 992,092,893 73,844,772 129,489,411 570,446,690

Federated Hermes Investment Funds Public Limited Company
For the financial year ended 31 December 2019 (continued)
247
Statement of Changes in Net Assets Attributable to Holders of Redeemable Participating Shares
The accompanying notes form an integral part of these Financial Statements
Notes
Federated Hermes Impact
Opportunities Equity Fund
Federated Hermes Unconstrained
Credit Fund
Federated Hermes Global Emerging
Markets SMID Equity Fund
$ $ $Net assets attributable to holders of redeemable participating shares at the beginning of the year 180,873,771 359,868,913 49,606,087
Redeemable participating share transactionsIssue of redeemable participating shares for the year 123,016,905 132,893,098 117,533,546Redemption of redeemable participating shares for the year (110,982,580) (46,983,922) (11,067,770)Net increase in net assets from redeemable participating share transactions 12,034,325 85,909,176 106,465,776 Foreign exchange adjustments on aggregation 2 – – –
Increase in net assets attributable to holders of redeemable participating shares from operations 60,503,741 73,670,943 21,360,372
Net assets attributable to holders of redeemable participating shares at the end of the year 253,411,837 519,449,032 177,432,235

Federated Hermes Investment Funds Public Limited Company
For the financial year ended 31 December 2019 (continued)
248
Statement of Changes in Net Assets Attributable to Holders of Redeemable Participating Shares
The accompanying notes form an integral part of these Financial Statements
Notes
Federated Hermes SDG Engagement High Yield Credit
Fund* Total$ £**
Net assets attributable to holders of redeemable participating shares at the beginning of the year – 8,982,619,930
Redeemable participating share transactionsIssue of redeemable participating shares for the year 246,920,227 4,813,623,363Redemption of redeemable participating shares for the year (6,111,582) (4,086,942,433)Net increase in net assets from redeemable participating share transactions 240,808,645 726,680,930 Foreign exchange adjustments on aggregation 2 – (450,719,404)
Increase in net assets attributable to holders of redeemable participating shares from operations 10,190,714 1,807,922,682
Net assets attributable to holders of redeemable participating shares at the end of the year 250,999,359 11,066,504,138
* Federated Hermes SDG Engagement High Yield Credit Fund launched on 02 October 2019�** Euro and US Dollar denominated sub-funds are converted to Sterling in the company total column using the average exchange rates of 1�1408 and 1�2271 respectively�

249
Federated Hermes Investment Funds Public Limited Company
For the financial year ended 31 December 2020 Cash Flow Statement
The accompanying notes form an integral part of these Financial Statements
Federated Hermes Global Emerging
Markets Equity FundFederated Hermes
Global Equity Fund
Federated Hermes European Alpha
Equity Fund
Federated Hermes Global High Yield
Credit FundCash Flows from Operating Activities $ $ € €Dividends received 93,550,266 493,130 3,653,362 (119,913)Interest received 354,109 5,490 43,545 8,980,974Operating expenses paid (51,115,298) (143,369) (855,220) (1,353,512)Purchase of financial assets (2,720,108,857) (16,792,537) (31,494,164) (347,048,061)Proceeds from sales of financial assets 2,551,693,934 5,248,693 87,650,969 157,063,126Net Cash (outlow)/inflow from Operating Activities (125,625,846) (11,188,593) 58,998,492 (182,477,386)
– – – –Cash Flows from Financing Activities – – – –Subscriptions 2,390,842,303 14,127,930 23,595,697 264,960,142Redemptions (2,149,153,046) (2,854,446) (82,274,214) (79,796,197)Interest paid (51,436) (54) (11,225) (77,734)Distribution paid (8,021,779) (165,878) (139,630) (4,782,876)Income equalisation 512,828 17,013 (963,590) 2,708,667Net Cash inflow/(outflow) from Financing Activities 234,128,870 11,124,565 (59,792,962) 183,012,002
Increase/(Decrease) in cash and cash equivalents 108,503,024 (64,028) (794,470) 534,616Foreign exchange adjustment on aggregation (Note 2) – – – –Cash and cash equivalents at the beginning of the year 54,420,525 145,368 1,426,275 1,957,128Cash and cash equivalent at the end of the year 162,923,549 81,340 631,805 2,491,744
Cash and cash equivalents at the end of the year is comprised of:Cash 162,923,549 81,340 631,805 2,251,744Cash collateral on derivative positions (asset) – – – 2,780,000Cash collateral on derivative positions (liability) – – – (2,540,000)
162,923,549 81,340 631,805 2,491,744

Federated Hermes Investment Funds Public Limited Company
For the financial year ended 31 December 2020 (continued)
250
Cash Flow Statement
The accompanying notes form an integral part of these Financial Statements
Federated Hermes Europe ex-UK Equity
FundFederated Hermes
US SMID Equity Fund
Federated Hermes Asia ex-Japan Equity
Fund
Federated Hermes Global Equity ESG
FundCash Flows from Operating Activities € $ $ $Dividends received 1,388,864 6,764,741 67,801,000 14,807,383Interest received 9,710 79,731 142,079 51,289Operating expenses paid (670,972) (5,371,348) (20,893,806) (8,204,383)Purchase of financial assets (24,442,647) (395,854,159) (1,318,176,336) (609,738,197)Proceeds from sales of financial assets 205,016,827 604,403,653 2,391,715,514 205,538,212Net Cash inflow/(outflow) from Operating Activities 181,301,782 210,022,618 1,120,588,451 (397,545,696)
– – – –Cash Flows from Financing Activities – – – –Subscriptions 38,687,755 552,615,046 474,059,868 689,150,172Redemptions (221,297,323) (758,268,263) (1,589,065,152) (286,715,694)Interest paid (9,872) (2,091) (15,453) (7,374)Distribution paid (111,626) (329,726) (16,957,045) (82,313)Income equalisation (469,959) (208,003) (3,371,046) 1,205,364Net Cash (outlow)/inflow from Financing Activities (183,201,025) (206,193,037) (1,135,348,828) 403,550,155
(Decrease)/Increase in cash and cash equivalents (1,899,243) 3,829,581 (14,760,377) 6,004,459Foreign exchange adjustment on aggregation (Note 2) – – – –Cash and cash equivalents at the beginning of the year 2,095,442 31,469,038 27,545,311 18,421,920Cash and cash equivalent at the end of the year 196,199 35,298,619 12,784,934 24,426,379
Cash and cash equivalents at the end of the year is comprised of:Cash 196,199 35,298,619 12,784,934 24,426,379Cash collateral on derivative positions (asset) – – – –Cash collateral on derivative positions (liability) – – – –
196,199 35,298,619 12,784,934 24,426,379

Federated Hermes Investment Funds Public Limited Company
For the financial year ended 31 December 2020 (continued)
251
Cash Flow Statement
The accompanying notes form an integral part of these Financial Statements
Federated Hermes Multi-Strategy Credit
Fund
Federated Hermes Global Small Cap
Equity Fund
Federated Hermes Absolute Return
Credit Fund
Federated Hermes SDG Engagement
Equity FundCash Flows from Operating Activities $ $ $ $Dividends received – 1,029,730 (51,672) 10,779,926Interest received 10,602,569 5,801 (103,556) 42,152Operating expenses paid (5,381,000) (515,286) (899,840) (5,582,126)Purchase of financial assets (82,513,219) (61,976,519) (382,585,460) (724,469,502)Proceeds from sales of financial assets 403,385,372 25,577,117 214,551,694 139,371,272Net Cash inflow/(outflow) from Operating Activities 326,093,722 (35,879,157) (169,088,834) (579,858,278)
– – – –Cash Flows from Financing Activities – – – –Subscriptions 189,590,123 47,455,189 306,472,441 855,246,375Redemptions (553,277,665) (11,359,896) (131,667,010) (267,320,774)Interest paid (285,575) (975) (8,645) (11,613)Distribution paid (7,799,296) (80,752) (364,193) (96,387)Income equalisation (358,968) 180,298 (186,055) 1,729,218Net Cash (outlow)/inflow from Financing Activities (372,131,381) 36,193,864 174,246,538 589,546,819
(Decrease)/Increase in cash and cash equivalents (46,037,659) 314,707 5,157,704 9,688,541Foreign exchange adjustment on aggregation (Note 2) – – – –Cash and cash equivalents at the beginning of the year 78,406,746 2,209,148 8,883,854 22,240,813Cash and cash equivalent at the end of the year 32,369,087 2,523,855 14,041,558 31,929,354
Cash and cash equivalents at the end of the year is comprised of:Cash 21,839,087 2,523,855 8,587,475 31,929,354Cash collateral on derivative positions (asset) 17,240,922 – 7,886,142 –Cash collateral on derivative positions (liability) (6,710,922) – (2,432,059) –
32,369,087 2,523,855 14,041,558 31,929,354

Federated Hermes Investment Funds Public Limited Company
For the financial year ended 31 December 2020 (continued)
252
Cash Flow Statement
The accompanying notes form an integral part of these Financial Statements
Federated Hermes Impact Opportunities
Equity Fund
Federated Hermes Unconstrained Credit
Fund
Federated Hermes Global Emerging
Markets SMID Equity Fund
Federated Hermes SDG Engagement High Yield Credit
FundCash Flows from Operating Activities $ $ $ $Dividends received 2,117,184 (334,620) 3,153,477 (38,258)Interest received 19,544 23,784,673 11,808 13,225,598Operating expenses paid (1,015,974) (3,036,008) (1,045,930) (1,735,730)Purchase of financial assets (1,486,339,132) (463,227,885) (144,329,945) (505,301,157)Proceeds from sales of financial assets 1,381,059,760 252,364,588 86,282,405 163,329,686Net Cash outflow from Operating Activities (104,158,618) (190,449,252) (55,928,185) (330,519,861)
– – – –Cash Flows from Financing Activities – – – –Subscriptions 173,864,823 347,329,999 88,655,515 378,924,735Redemptions (63,437,857) (132,430,381) (26,463,757) (52,934,213)Interest paid (1,539) (291,564) (2,326) (26,098)Distribution paid (364) (3,143,500) (114,997) (405,987)Income equalisation 222,956 1,685,217 321,286 6,002,486Net Cash inflow from Financing Activities 110,648,019 213,149,771 62,395,721 331,560,923
Increase in cash and cash equivalents 6,489,401 22,700,519 6,467,536 1,041,062Foreign exchange adjustment on aggregation (Note 2) – – – –Cash and cash equivalents at the beginning of the year 2,794,539 6,229,088 2,897,881 8,621,791Cash and cash equivalent at the end of the year 9,283,940 28,929,607 9,365,417 9,662,853
Cash and cash equivalents at the end of the year is comprised of:Cash 9,283,940 8,403,068 9,365,417 7,202,853Cash collateral on derivative positions (asset) – 28,664,602 – 5,165,045Cash collateral on derivative positions (liability) – (8,138,063) – (2,705,045)
9,283,940 28,929,607 9,365,417 9,662,853

Federated Hermes Investment Funds Public Limited Company
For the financial year ended 31 December 2020 (continued)
253
Cash Flow Statement
The accompanying notes form an integral part of these Financial Statements
Federated Hermes US High Yield Credit
Fund* TotalCash Flows from Operating Activities $ £**Dividends received – 150,778,847Interest received 60,667 43,409,617Operating expenses paid (38,717) (79,380,124)Purchase of financial assets (8,390,731) (6,886,440,099)Proceeds from sales of financial assets 1,612,012 6,567,113,719Net Cash outflow from Operating Activities (6,756,769) (204,518,040)
– –Cash Flows from Financing Activities – –Subscriptions 6,908,699 5,059,467,680Redemptions – (4,751,004,529)Interest paid – (604,053)Distribution paid – (31,986,572)Income equalisation – 6,813,156Net Cash inflow from Financing Activities 6,908,699 282,685,682
Increase in cash and cash equivalents 151,930 78,167,642Foreign exchange adjustment on aggregation (Note 2) – (5,885,569)Cash and cash equivalents at the beginning of the year – 204,141,337Cash and cash equivalent at the end of the year 151,930 276,423,410
Cash and cash equivalents at the end of the year is comprised of:Cash 151,930 247,697,679Cash collateral on derivative positions (asset) – 45,621,108Cash collateral on derivative positions (liability) – (16,895,377)
151,930 276,423,410
* Federated Hermes High Yield Credit Fund launched on 21 July 2020�** Euro and US Dollar denominated sub-funds are converted to Sterling in the company total column using the year end exchange rates of 1�11720 and 1�36695 respectively�Please note that the figures for “Purchase of financial assets” and “Proceeds from sales of financial assets” on the Cash Flow Statement differ from the figures used in the Schedule of Significant Portfolio Movements, as the Cash Flow Statement is adjusted for any receivable or payable for financial assets at the year end.

254
Federated Hermes Investment Funds Public Limited Company
For the financial year ended 31 December 2019 Cash Flow Statement
The accompanying notes form an integral part of these Financial Statements
Federated Hermes Global Emerging
Markets Equity FundFederated Hermes
Global Equity Fund
Federated Hermes European Alpha
Equity Fund
Federated Hermes Global High Yield
Credit FundCash Flows from Operating Activities $ $ € €Dividends received 100,314,415 699,953 10,175,094 (69,637)Interest received 1,444,863 175,382 669,331 8,202,147Operating expenses paid (49,788,675) (392,370) (2,228,670) (1,112,926)Purchase of financial assets (2,224,562,606) (22,579,985) (79,125,504) (171,853,595)Proceeds from sales of financial assets 1,248,445,741 64,104,317 365,096,220 252,490,377Net Cash (outlow)/inflow from Operating Activities (924,146,262) 42,007,297 294,586,471 87,656,366
– – – –Cash Flows from Financing Activities – – – –Subscriptions 2,664,732,920 20,474,403 60,734,530 205,181,823Redemptions (1,683,890,999) (62,288,134) (353,856,380) (290,453,057)Interest paid (4,863) (236) (3,175) (28,949)Distribution paid (9,906,290) (14,210) (150,026) (442,401)Income equalisation 3,616,533 (117,736) (5,243,942) (2,287,118)Net Cash inflow/(outflow) from Financing Activities 974,547,301 (41,945,913) (298,518,993) (88,029,702)
Increase/(Decrease) in cash and cash equivalents 50,401,039 61,384 (3,932,522) (373,336)Foreign exchange adjustment on aggregation (Note 2) – – – –Cash and cash equivalents at the beginning of the year 4,019,486 83,984 5,358,797 2,330,464Cash and cash equivalent at the end of the year 54,420,525 145,368 1,426,275 1,957,128
Cash and cash equivalents at the end of the year is comprised of:Cash 54,420,525 145,368 1,426,275 1,477,128Cash collateral on derivative positions (asset) – – – 2,010,000Cash collateral on derivative positions (liability) – – – (1,530,000)
54,420,525 145,368 1,426,275 1,957,128

Federated Hermes Investment Funds Public Limited Company
For the financial year ended 31 December 2019 (continued)
255
Cash Flow Statement
The accompanying notes form an integral part of these Financial Statements
Federated Hermes Europe ex-UK Equity
FundFederated Hermes
US SMID Equity Fund
Federated Hermes Asia ex-Japan Equity
Fund
Federated Hermes Global Equity ESG
FundCash Flows from Operating Activities € $ $ $Dividends received 5,669,915 7,626,138 108,162,906 7,033,426Interest received 205,422 501,439 2,675,868 199,307Operating expenses paid (1,573,013) (6,824,093) (31,372,332) (3,537,144)Purchase of financial assets (67,823,825) (384,947,157) (1,694,561,196) (644,373,536)Proceeds from sales of financial assets 128,507,791 436,627,337 1,940,083,937 86,265,104Net Cash inflow/(outflow) from Operating Activities 64,986,290 52,983,664 324,989,183 (554,412,843)
– – – –Cash Flows from Financing Activities – – – –Subscriptions 95,586,085 520,937,070 476,914,341 753,415,022Redemptions (158,927,767) (568,350,398) (889,838,744) (196,226,305)Interest paid 1,045 (6,530) (4,811) (1,318)Distribution paid (283,509) (134,281) (18,538,922) (81,613)Income equalisation (1,073,297) (89,859) (5,374,016) 2,721,147Net Cash (outlow)/inflow from Financing Activities (64,697,443) (47,643,998) (436,842,152) 559,826,933
Increase/(Decrease) in cash and cash equivalents 288,847 5,339,666 (111,852,969) 5,414,090Foreign exchange adjustment on aggregation (Note 2) – – – –Cash and cash equivalents at the beginning of the year 1,806,595 26,129,372 139,398,280 13,007,830Cash and cash equivalent at the end of the year 2,095,442 31,469,038 27,545,311 18,421,920
Cash and cash equivalents at the end of the year is comprised of:Cash 2,095,442 31,469,038 27,545,311 18,421,920Cash collateral on derivative positions (asset) – – – –Cash collateral on derivative positions (liability) – – – –
2,095,442 31,469,038 27,545,311 18,421,920

Federated Hermes Investment Funds Public Limited Company
For the financial year ended 31 December 2019 (continued)
256
Cash Flow Statement
The accompanying notes form an integral part of these Financial Statements
Federated Hermes Multi-Strategy Credit
Fund
Federated Hermes Global Small Cap
Equity Fund
Federated Hermes Absolute Return
Credit Fund
Federated Hermes SDG Engagement
Equity FundCash Flows from Operating Activities $ $ $ $Dividends received – 995,412 (25,905) 4,898,481Interest received 37,319,132 32,661 4,416,463 109,155Operating expenses paid (7,463,988) (479,869) (854,642) (2,633,175)Purchase of financial assets (313,703,179) (19,040,733) (165,986,198) (425,649,557)Proceeds from sales of financial assets 589,845,430 14,218,809 215,738,230 248,723,460Net Cash inflow/(outflow) from Operating Activities 305,997,395 (4,273,720) 53,287,948 (174,551,636)
– – – –Cash Flows from Financing Activities – – – –Subscriptions 149,578,617 11,547,514 77,141,199 445,337,539Redemptions (361,292,057) (5,810,300) (122,423,550) (257,257,950)Interest paid 448,343 (173) 34,056 4,254Distribution paid (17,379,913) (161,419) (825,531) (79,781)Income equalisation (1,588,979) 22,629 (389,407) 2,033,928Net Cash (outlow)/inflow from Financing Activities (230,233,989) 5,598,251 (46,463,233) 190,037,990
Increase in cash and cash equivalents 75,763,406 1,324,531 6,824,715 15,486,354Foreign exchange adjustment on aggregation (Note 2) – – – –Cash and cash equivalents at the beginning of the year 2,643,340 884,617 2,059,139 6,754,459Cash and cash equivalent at the end of the year 78,406,746 2,209,148 8,883,854 22,240,813
Cash and cash equivalents at the end of the year is comprised of:Cash 54,105,244 2,209,148 5,442,715 22,240,813Cash collateral on derivative positions (asset) 31,957,945 – 5,211,147 –Cash collateral on derivative positions (liability) (7,656,443) – (1,770,008) –
78,406,746 2,209,148 8,883,854 22,240,813

Federated Hermes Investment Funds Public Limited Company
For the financial year ended 31 December 2019 (continued)
257
Cash Flow Statement
The accompanying notes form an integral part of these Financial Statements
Federated Hermes Impact Opportunities
Equity Fund
Federated Hermes Unconstrained Credit
Fund
Federated Hermes Global Emerging
Markets SMID Equity Fund
Cash Flows from Operating Activities $ $ $Dividends received 2,760,825 (218,076) 2,494,335Interest received 175,444 17,522,062 44,903Operating expenses paid (1,206,145) (2,532,386) (678,612)Purchase of financial assets (87,630,191) (502,228,189) (166,280,481)Proceeds from sales of financial assets 74,530,109 410,107,375 59,419,953Net Cash outflow from Operating Activities (11,369,958) (77,349,214) (104,999,902)
– – –Cash Flows from Financing Activities – – –Subscriptions 123,016,905 132,893,098 117,533,546Redemptions (110,982,580) (55,479,337) (11,067,770)Interest paid (47) 46,079 321Distribution paid (5) (3,690,375) (85,284)Income equalisation (50,040) 1,541,489 725,801Net Cash inflow from Financing Activities 11,984,233 75,310,954 107,106,614
Increase/(Decrease) in cash and cash equivalents 614,275 (2,038,260) 2,106,712Foreign exchange adjustment on aggregation (Note 2) – – –Cash and cash equivalents at the beginning of the year 2,180,264 8,267,348 791,169Cash and cash equivalent at the end of the year 2,794,539 6,229,088 2,897,881
Cash and cash equivalents at the end of the year is comprised of:Cash 2,794,539 (8,130,941) 2,897,881Cash collateral on derivative positions (asset) – 21,830,029 –Cash collateral on derivative positions (liability) – (7,470,000) –
2,794,539 6,229,088 2,897,881

Federated Hermes Investment Funds Public Limited Company
For the financial year ended 31 December 2019 (continued)
258
Cash Flow Statement
The accompanying notes form an integral part of these Financial Statements
Federated Hermes SDG Engagement High Yield Credit
Fund* TotalCash Flows from Operating Activities $ £**Dividends received – 190,564,226Interest received (1,090,888) 55,644,208Operating expenses paid (140,905) (85,616,959)Purchase of financial assets (268,504,670) (5,493,798,469)Proceeds from sales of financial assets 37,729,982 4,727,937,575Net Cash outflow from Operating Activities (232,006,481) (605,269,419)
– –Cash Flows from Financing Activities – –Subscriptions 246,162,279 4,638,970,067Redemptions (6,094,953) (3,949,907,964)Interest paid (69) 362,422Distribution paid – (39,162,790)Income equalisation 561,015 (4,563,794)Net Cash inflow from Financing Activities 240,628,272 645,697,941
Increase in cash and cash equivalents 8,621,791 40,428,522Foreign exchange adjustment on aggregation (Note 2) – (6,809,870)Cash and cash equivalents at the beginning of the year – 170,522,685Cash and cash equivalent at the end of the year 8,621,791 204,141,337
Cash and cash equivalents at the end of the year is comprised of:Cash 8,621,791 171,952,997Cash collateral on derivative positions (asset) 1,730,706 47,545,651Cash collateral on derivative positions (liability) (1,730,706) (15,357,311)
8,621,791 204,141,337
* Federated Hermes SDG Engagement High Yield Credit Fund launched on 02 October 2019�** Euro and US Dollar denominated sub-funds are converted to Sterling in the company total column using the year end exchange rates of 1�18018 and 1�32475 respectively�Please note that the figures for “Purchase of financial assets ” and “Proceeds from sales of financial assets ” on the Cash Flow Statement differ from the figures used in the Schedule of Significant Portfolio Movements, as the Cash Flow Statement is adjusted for any receivable or payable for financial assets at the year end.

259
Federated Hermes Investment Funds Public Limited CompanyNotes to the Financial Statements for the financial year ended 31 December 2020
1. Incorporation and Principal Activity
Federated Hermes Investment Funds Public Limited Company (the “Company”) was incorporated on 23 October 2008 under the laws of Ireland as an open-ended umbrella type investment company with variable capital and limited liability in which different sub-funds may be created from time to time� The Company was authorised as an Undertaking for Collective Investment in Transferable Securities on 24 November 2008 by the Central Bank of Ireland in accordance with the provisions of the European Communities (Undertakings for Collective Investment in Transferable Securities) Regulations, 2011 (“the UCITS Regulations”), as amended and the Central Bank (Supervision and Enforcement) Act 2013 (Section 48(1)) (Undertakings for Collective Investment in Transferable Securities) Regulations, 2019�
As at 31 December 2020 there were 17 sub-funds in existence with the following share classes:
Name of the sub-fund Share Class Launch dateFederated Hermes Global Emerging Markets Equity Fund R EUR Accumulating 12 October 2011Federated Hermes Global Emerging Markets Equity Fund T GBP Accumulating 24 October 2011Federated Hermes Global Emerging Markets Equity Fund F GBP Accumulating 9 November 2012Federated Hermes Global Emerging Markets Equity Fund F USD Accumulating 20 September 2013Federated Hermes Global Emerging Markets Equity Fund F GBP Accumulating Hedged 25 November 2013Federated Hermes Global Emerging Markets Equity Fund F EUR Accumulating 4 February 2014Federated Hermes Global Emerging Markets Equity Fund R2 USD Distributing 23 April 2015Federated Hermes Global Emerging Markets Equity Fund R2 EUR Distributing 23 April 2015Federated Hermes Global Emerging Markets Equity Fund F2 GBP Distributing 5 June 2015Federated Hermes Global Emerging Markets Equity Fund R2 EUR Distributing Hedged 24 June 2015Federated Hermes Global Emerging Markets Equity Fund R USD Accumulating 30 June 2015Federated Hermes Global Emerging Markets Equity Fund F EUR Accumulating Hedged 31 July 2015Federated Hermes Global Emerging Markets Equity Fund F2 USD Distributing 13 November 2015Federated Hermes Global Emerging Markets Equity Fund G USD Accumulating 16 December 2015Federated Hermes Global Emerging Markets Equity Fund F2 EUR Distributing 26 April 2016Federated Hermes Global Emerging Markets Equity Fund Z USD Accumulating 24 August 2016Federated Hermes Global Emerging Markets Equity Fund J GBP Accumulating 2 September 2016Federated Hermes Global Emerging Markets Equity Fund J2 GBP Distributing 2 September 2016Federated Hermes Global Emerging Markets Equity Fund J USD Accumulating 2 September 2016Federated Hermes Global Emerging Markets Equity Fund J2 USD Distributing 2 September 2016Federated Hermes Global Emerging Markets Equity Fund J EUR Accumulating 2 September 2016Federated Hermes Global Emerging Markets Equity Fund J2 EUR Distributing 2 September 2016Federated Hermes Global Emerging Markets Equity Fund J GBP Accumulating Hedged 23 September 2016Federated Hermes Global Emerging Markets Equity Fund J2 GBP Distributing Hedged 23 September 2016Federated Hermes Global Emerging Markets Equity Fund J EUR Accumulating Hedged 23 September 2016Federated Hermes Global Emerging Markets Equity Fund J2 EUR Distributing Hedged 23 September 2016Federated Hermes Global Emerging Markets Equity Fund F CHF Accumulating 13 October 2016Federated Hermes Global Emerging Markets Equity Fund F SGD Accumulating 24 October 2016Federated Hermes Global Emerging Markets Equity Fund R SGD Accumulating 24 October 2016Federated Hermes Global Emerging Markets Equity Fund F CHF Accumulating Hedged 16 May 2018Federated Hermes Global Emerging Markets Equity Fund K USD Accumulating 22 February 2019Federated Hermes Global Emerging Markets Equity Fund B USD Accumulating 22 February 2019Federated Hermes Global Emerging Markets Equity Fund J SGD Accumulating 17 May 2019 Federated Hermes Global Emerging Markets Equity Fund J CHF Accumulating Hedged 17 May 2019Federated Hermes Global Emerging Markets Equity Fund F2 GBP Distributing Hedged 17 June 2019Federated Hermes Global Emerging Markets Equity Fund A2 USD Distributing 18 October 2019Federated Hermes Global Emerging Markets Equity Fund F2 EUR Distributing Hedged 23 March 2020Federated Hermes Global Equity Fund R EUR Accumulating 12 October 2011Federated Hermes Global Equity Fund T GBP Accumulating 24 October 2011Federated Hermes Global Equity Fund F GBP Accumulating 9 November 2012Federated Hermes Global Equity Fund F USD Accumulating 6 November 2013Federated Hermes Global Equity Fund F2 GBP Distributing 30 December 2013Federated Hermes Global Equity Fund F EUR Accumulating 28 October 2014Federated Hermes Global Equity Fund R USD Accumulating 5 October 2015Federated Hermes Global Equity Fund A2 USD Distributing 22 February 2019Federated Hermes Global Equity Fund B2 USD Distributing 18 October 2019Federated Hermes European Alpha Equity Fund R EUR Accumulating 13 April 2011Federated Hermes European Alpha Equity Fund T GBP Accumulating 24 October 2011Federated Hermes European Alpha Equity Fund Z EUR Accumulating 16 November 2011Federated Hermes European Alpha Equity Fund F GBP Accumulating 9 November 2012Federated Hermes European Alpha Equity Fund F EUR Accumulating 13 November 2012

260
Federated Hermes Investment Funds Public Limited CompanyNotes to the Financial Statements for the financial year ended 31 December 2020 (continued)
Name of the sub-fund Share Class Launch dateFederated Hermes European Alpha Equity Fund F2 GBP Distributing 16 November 2012Federated Hermes European Alpha Equity Fund F2 EUR Distributing 14 May 2013Federated Hermes European Alpha Equity Fund S2 GBP Distributing 26 November 2013Federated Hermes European Alpha Equity Fund S2 USD Distributing 6 December 2013Federated Hermes European Alpha Equity Fund S USD Accumulating Hedged 9 December 2013Federated Hermes European Alpha Equity Fund S EUR Accumulating 17 December 2013Federated Hermes European Alpha Equity Fund S2 GBP Distributing Hedged 19 December 2013Federated Hermes European Alpha Equity Fund R USD Accumulating Hedged 10 January 2014Federated Hermes European Alpha Equity Fund S GBP Accumulating 14 January 2014Federated Hermes European Alpha Equity Fund R CHF Accumulating Hedged 4 February 2014Federated Hermes European Alpha Equity Fund S2 USD Distributing Hedged 4 February 2014Federated Hermes European Alpha Equity Fund S GBP Accumulating Hedged 10 February 2014Federated Hermes European Alpha Equity Fund S USD Accumulating 17 February 2014Federated Hermes European Alpha Equity Fund M2 EUR Distributing 31 March 2014Federated Hermes European Alpha Equity Fund M EUR Accumulating 31 March 2014Federated Hermes European Alpha Equity Fund R USD Accumulating 25 July 2014Federated Hermes European Alpha Equity Fund R2 EUR Distributing 13 November 2015Federated Hermes Global High Yield Credit Fund R EUR Accumulating 11 October 2011Federated Hermes Global High Yield Credit Fund F GBP Accumulating 8 November 2012Federated Hermes Global High Yield Credit Fund F EUR Accumulating 16 May 2013Federated Hermes Global High Yield Credit Fund F GBP Accumulating Hedged 4 February 2014Federated Hermes Global High Yield Credit Fund F2 GBP Distributing Hedged 2 December 2014Federated Hermes Global High Yield Credit Fund F2 USD Distributing Hedged 10 December 2014Federated Hermes Global High Yield Credit Fund F USD Accumulating Hedged 11 December 2014Federated Hermes Global High Yield Credit Fund T GBP Accumulating 16 June 2015Federated Hermes Global High Yield Credit Fund T GBP Accumulating Hedged 8 July 2015Federated Hermes Global High Yield Credit Fund R2 EUR Distributing 14 January 2016Federated Hermes Global High Yield Credit Fund R USD Accumulating Hedged 27 February 2017Federated Hermes Global High Yield Credit Fund F2 EUR Distributing 10 October 2017Federated Hermes Global High Yield Credit Fund F CHF Accumulating Hedged 29 November 2017Federated Hermes Global High Yield Credit Fund M USD Accumulating Hedged 24 May 2019Federated Hermes Global High Yield Credit Fund M2 GBP Distributing Hedged 24 May 2019Federated Hermes Global High Yield Credit Fund M GBP Accumulating Hedged 24 May 2019Federated Hermes Global High Yield Credit Fund M EUR Accumulating 23 March 2020Federated Hermes Global High Yield Credit Fund M2 EUR Distributing 23 March 2020Federated Hermes Global High Yield Credit Fund M3 EUR Distributing 23 March 2020Federated Hermes Global High Yield Credit Fund M4 EUR Distributing 23 March 2020Federated Hermes Global High Yield Credit Fund B USD Accumulating 25 September 2020Federated Hermes Global High Yield Credit Fund L3 AUD Distributing Hedged 3 October 2020Federated Hermes Global High Yield Credit Fund A2 USD Distributing Hedged 11 November 2020Federated Hermes Global High Yield Credit Fund B2 USD Distributing Hedged 11 November 2020Federated Hermes Europe ex-UK Equity Fund R EUR Accumulating 9 March 2012Federated Hermes Europe ex-UK Equity Fund R GBP Accumulating 13 June 2012Federated Hermes Europe ex-UK Equity Fund F GBP Accumulating 9 November 2012Federated Hermes Europe ex-UK Equity Fund F EUR Accumulating 1 July 2013Federated Hermes Europe ex-UK Equity Fund F2 GBP Distributing Hedged 29 January 2014Federated Hermes Europe ex-UK Equity Fund F2 EUR Distributing 8 May 2015Federated Hermes Europe ex-UK Equity Fund F2 GBP Distributing 4 May 2016Federated Hermes Europe ex-UK Equity Fund M GBP Accumulating 6 September 2016Federated Hermes Europe ex-UK Equity Fund M2 GBP Distributing 6 September 2016Federated Hermes Europe ex-UK Equity Fund M2 GBP Distributing Hedged 6 September 2016Federated Hermes Europe ex-UK Equity Fund M2 EUR Distributing 25 April 2017Federated Hermes US SMID Equity Fund Z GBP Accumulating 26 September 2012Federated Hermes US SMID Equity Fund F GBP Accumulating 8 November 2012Federated Hermes US SMID Equity Fund R EUR Accumulating 8 November 2012Federated Hermes US SMID Equity Fund F USD Accumulating 10 April 2013Federated Hermes US SMID Equity Fund T GBP Accumulating 8 May 2013Federated Hermes US SMID Equity Fund F2 GBP Distributing 10 May 2013Federated Hermes US SMID Equity Fund F2 USD Distributing 14 May 2013Federated Hermes US SMID Equity Fund F EUR Accumulating 15 May 2013Federated Hermes US SMID Equity Fund F2 EUR Distributing 16 May 2013Federated Hermes US SMID Equity Fund F EUR Accumulating Hedged 19 August 2013Federated Hermes US SMID Equity Fund F GBP Accumulating Hedged 21 November 2013
1. Incorporation and Principal Activity (continued)

261
Federated Hermes Investment Funds Public Limited CompanyNotes to the Financial Statements for the financial year ended 31 December 2020 (continued)
Name of the sub-fund Share Class Launch dateFederated Hermes US SMID Equity Fund F2 GBP Distributing Hedged 7 October 2014Federated Hermes US SMID Equity Fund R CHF Accumulating Hedged 10 December 2014Federated Hermes US SMID Equity Fund R USD Accumulating 11 December 2014Federated Hermes US SMID Equity Fund R EUR Accumulating Hedged 11 December 2014Federated Hermes US SMID Equity Fund F CHF Accumulating Hedged 30 July 2015Federated Hermes US SMID Equity Fund F2 CHF Distributing Hedged 9 August 2016Federated Hermes US SMID Equity Fund L2 GBP Distributing 1 October 2017Federated Hermes US SMID Equity Fund L2 GBP Distributing Hedged 1 October 2017Federated Hermes US SMID Equity Fund L USD Accumulating 1 October 2017Federated Hermes US SMID Equity Fund L GBP Accumulating 1 December 2017Federated Hermes US SMID Equity Fund L2 USD Distributing 23 February 2018Federated Hermes US SMID Equity Fund L EUR Accumulating Hedged 18 October 2019Federated Hermes US SMID Equity Fund A2 USD Distributing 18 October 2019Federated Hermes US SMID Equity Fund B2 USD Distributing 18 October 2019Federated Hermes US SMID Equity Fund L EUR Accumulating 18 October 2019Federated Hermes US SMID Equity Fund F2 EUR Distributing Hedged 24 October 2019Federated Hermes US SMID Equity Fund L GBP Accumulating Hedged 2 September 2020Federated Hermes US SMID Equity Fund B USD Accumulating 25 September 2020Federated Hermes US SMID Equity Fund X EUR Accumulating Hedged 23 November 2020Federated Hermes US SMID Equity Fund P USD Accumulating 23 November 2020Federated Hermes Asia ex-Japan Equity Fund F GBP Accumulating 6 December 2012Federated Hermes Asia ex-Japan Equity Fund R EUR Accumulating 6 December 2012Federated Hermes Asia ex-Japan Equity Fund T GBP Accumulating 8 May 2013Federated Hermes Asia ex-Japan Equity Fund F2 EUR Distributing 21 August 2013Federated Hermes Asia ex-Japan Equity Fund F EUR Accumulating 21 August 2013Federated Hermes Asia ex-Japan Equity Fund F2 GBP Distributing 28 August 2013Federated Hermes Asia ex-Japan Equity Fund F USD Accumulating 1 October 2013Federated Hermes Asia ex-Japan Equity Fund R USD Accumulating 1 October 2013Federated Hermes Asia ex-Japan Equity Fund F EUR Accumulating Hedged 21 October 2013Federated Hermes Asia ex-Japan Equity Fund F2 GBP Distributing Hedged 7 November 2013Federated Hermes Asia ex-Japan Equity Fund R EUR Accumulating Hedged 11 March 2014Federated Hermes Asia ex-Japan Equity Fund R CHF Accumulating Hedged 11 March 2014Federated Hermes Asia ex-Japan Equity Fund F GBP Accumulating Hedged 18 March 2014Federated Hermes Asia ex-Japan Equity Fund F2 USD Distributing 1 September 2014Federated Hermes Asia ex-Japan Equity Fund C USD Accumulating 4 November 2014Federated Hermes Asia ex-Japan Equity Fund RC USD Accumulating 4 November 2014Federated Hermes Asia ex-Japan Equity Fund C EUR Accumulating 9 February 2015Federated Hermes Asia ex-Japan Equity Fund C2 GBP Distributing 10 February 2015Federated Hermes Asia ex-Japan Equity Fund C GBP Accumulating 20 March 2015Federated Hermes Asia ex-Japan Equity Fund F2 EUR Distributing Hedged 7 March 2017Federated Hermes Asia ex-Japan Equity Fund F CHF Accumulating Hedged 24 January 2018Federated Hermes Asia ex-Japan Equity Fund F CHF Accumulating 30 January 2018Federated Hermes Asia ex-Japan Equity Fund A USD Accumulating 17 November 2020Federated Hermes Asia ex-Japan Equity Fund B USD Accumulating 17 November 2020Federated Hermes Global Equity ESG Fund F GBP Accumulating 7 May 2014Federated Hermes Global Equity ESG Fund F USD Accumulating 7 May 2014Federated Hermes Global Equity ESG Fund R EUR Accumulating 9 May 2014Federated Hermes Global Equity ESG Fund F EUR Accumulating 9 May 2014Federated Hermes Global Equity ESG Fund T GBP Accumulating 16 June 2015Federated Hermes Global Equity ESG Fund F NOK Accumulating 18 May 2016Federated Hermes Global Equity ESG Fund R NOK Accumulating 18 May 2016Federated Hermes Global Equity ESG Fund F EUR Accumulating Hedged 13 March 2017Federated Hermes Global Equity ESG Fund R EUR Accumulating Hedged 4 May 2017Federated Hermes Global Equity ESG Fund F CHF Accumulating Hedged 8 October 2017Federated Hermes Global Equity ESG Fund R USD Accumulating 8 October 2017Federated Hermes Global Equity ESG Fund R CHF Accumulating Hedged 8 October 2017Federated Hermes Global Equity ESG Fund F2 CHF Distributing Hedged 24 October 2017Federated Hermes Global Equity ESG Fund F USD Accumulating Portfolio Hedged 29 December 2017Federated Hermes Global Equity ESG Fund F EUR Accumulating Portfolio Hedged 29 December 2017Federated Hermes Global Equity ESG Fund F2 USD Distributing Portfolio Hedged 29 December 2017Federated Hermes Global Equity ESG Fund F CHF Accumulating Portfolio Hedged 29 December 2017Federated Hermes Global Equity ESG Fund F2 CHF Distributing Portfolio Hedged 29 December 2017Federated Hermes Global Equity ESG Fund F GBP Accumulating Portfolio Hedged 26 March 2018
1. Incorporation and Principal Activity (continued)

262
Federated Hermes Investment Funds Public Limited CompanyNotes to the Financial Statements for the financial year ended 31 December 2020 (continued)
Name of the sub-fund Share Class Launch dateFederated Hermes Global Equity ESG Fund F2 CHF Distributing 8 May 2019Federated Hermes Global Equity ESG Fund D NOK Accumulating 2 October 2019Federated Hermes Global Equity ESG Fund A2 USD Distributing 18 October 2019Federated Hermes Global Equity ESG Fund B2 USD Distributing 18 October 2019Federated Hermes Global Equity ESG Fund J2 USD Distributing Portfolio Hedged 2 October 2020Federated Hermes Global Equity ESG Fund J2 EUR Distributing Portfolio Hedged 2 October 2020Federated Hermes Global Equity ESG Fund J CHF Accumulating Portfolio Hedged 2 October 2020Federated Hermes Global Equity ESG Fund J2 CHF Distributing Portfolio Hedged 2 October 2020Federated Hermes Global Equity ESG Fund J2 CHF Distributing Hedged 2 October 2020Federated Hermes Global Equity ESG Fund J CHF Accumulating Hedged 2 October 2020Federated Hermes Global Equity ESG Fund J USD Accumulating 2 October 2020Federated Hermes Global Equity ESG Fund J EUR Accumulating Hedged 2 October 2020Federated Hermes Global Equity ESG Fund J EUR Accumulating 2 October 2020Federated Hermes Global Equity ESG Fund J GBP Accumulating 2 October 2020Federated Hermes Global Equity ESG Fund J2 CHF Distributing 2 October 2020Federated Hermes Global Equity ESG Fund J GBP Accumulating Portfolio Hedged 2 October 2020Federated Hermes Global Equity ESG Fund J USD Accumulating Portfolio Hedged 2 October 2020Federated Hermes Global Equity ESG Fund J EUR Accumulating Portfolio Hedged 2 October 2020Federated Hermes Multi-Strategy Credit Fund F2 GBP Distributing Hedged 7 May 2014Federated Hermes Multi-Strategy Credit Fund F GBP Accumulating Hedged 7 May 2014Federated Hermes Multi-Strategy Credit Fund F EUR Accumulating 7 May 2014Federated Hermes Multi-Strategy Credit Fund F USD Accumulating 7 May 2014Federated Hermes Multi-Strategy Credit Fund F EUR Accumulating Hedged 8 May 2014Federated Hermes Multi-Strategy Credit Fund R EUR Accumulating 6 June 2014Federated Hermes Multi-Strategy Credit Fund R EUR Accumulating Hedged 6 June 2014Federated Hermes Multi-Strategy Credit Fund F2 GBP Distributing 10 July 2014Federated Hermes Multi-Strategy Credit Fund F2 USD Distributing 10 July 2014Federated Hermes Multi-Strategy Credit Fund F GBP Accumulating 6 May 2015Federated Hermes Multi-Strategy Credit Fund T GBP Accumulating Hedged 9 July 2015Federated Hermes Multi-Strategy Credit Fund R USD Accumulating 22 October 2015Federated Hermes Multi-Strategy Credit Fund F2 EUR Distributing 9 December 2015Federated Hermes Multi-Strategy Credit Fund R2 EUR Distributing 9 December 2015Federated Hermes Multi-Strategy Credit Fund F2 EUR Distributing Hedged 14 January 2016Federated Hermes Multi-Strategy Credit Fund L2 GBP Distributing 16 June 2017Federated Hermes Multi-Strategy Credit Fund L2 GBP Distributing Hedged 16 June 2017Federated Hermes Multi-Strategy Credit Fund R CHF Accumulating Hedged 22 June 2017Federated Hermes Multi-Strategy Credit Fund F CHF Accumulating Hedged 18 September 2017Federated Hermes Multi-Strategy Credit Fund Z2 EUR Distributing Hedged 26 March 2018Federated Hermes Multi-Strategy Credit Fund A2 USD Distributing 18 October 2019Federated Hermes Multi-Strategy Credit Fund B2 USD Distributing 18 October 2019Federated Hermes Multi-Strategy Credit Fund L2 USD Distributing 3 March 2020Federated Hermes Multi-Strategy Credit Fund F NOK Accumulating Hedged 23 March 2020Federated Hermes Multi-Strategy Credit Fund B2 USD Accumulating 25 September 2020Federated Hermes Global Small Cap Equity Fund F USD Accumulating 15 May 2015Federated Hermes Global Small Cap Equity Fund F EUR Accumulating 15 May 2015Federated Hermes Global Small Cap Equity Fund F GBP Accumulating 15 May 2015Federated Hermes Global Small Cap Equity Fund T GBP Accumulating 16 June 2015Federated Hermes Global Small Cap Equity Fund F2 GBP Distributing 25 January 2016Federated Hermes Global Small Cap Equity Fund X EUR Accumulating 11 January 2018Federated Hermes Global Small Cap Equity Fund A2 USD Distributing 3 April 2020Federated Hermes Global Small Cap Equity Fund B2 USD Distributing 3 April 2020Federated Hermes Absolute Return Credit Fund F EUR Accumulating Hedged 29 May 2015Federated Hermes Absolute Return Credit Fund F GBP Accumulating 29 May 2015Federated Hermes Absolute Return Credit Fund F GBP Accumulating Hedged 29 May 2015Federated Hermes Absolute Return Credit Fund F USD Accumulating 29 May 2015Federated Hermes Absolute Return Credit Fund F2 GBP Distributing 25 September 2015Federated Hermes Absolute Return Credit Fund F2 GBP Distributing Hedged 25 September 2015Federated Hermes Absolute Return Credit Fund T GBP Accumulating 11 August 2016Federated Hermes Absolute Return Credit Fund M EUR Accumulating Hedged 30 September 2019Federated Hermes Absolute Return Credit Fund M GBP Accumulating Hedged 12 November 2019Federated Hermes Absolute Return Credit Fund M USD Accumulating 12 November 2019Federated Hermes Absolute Return Credit Fund A2 USD Distributing 3 April 2020
1. Incorporation and Principal Activity (continued)

263
Federated Hermes Investment Funds Public Limited CompanyNotes to the Financial Statements for the financial year ended 31 December 2020 (continued)
Name of the sub-fund Share Class Launch dateFederated Hermes Absolute Return Credit Fund B2 USD Distributing 3 April 2020Federated Hermes Absolute Return Credit Fund B USD Accumulating 25 September 2020Federated Hermes SDG Engagement Equity Fund F USD Accumulating 29 December 2017Federated Hermes SDG Engagement Equity Fund F GBP Accumulating 29 December 2017Federated Hermes SDG Engagement Equity Fund F EUR Accumulating 29 December 2017Federated Hermes SDG Engagement Equity Fund X USD Accumulating 29 December 2017Federated Hermes SDG Engagement Equity Fund X GBP Accumulating 29 December 2017Federated Hermes SDG Engagement Equity Fund X EUR Accumulating 29 December 2017Federated Hermes SDG Engagement Equity Fund X GBP Accumulating Portfolio Hedged 29 December 2017Federated Hermes SDG Engagement Equity Fund X2 GBP Distributing Portfolio Hedged 29 December 2017Federated Hermes SDG Engagement Equity Fund X EUR Accumulating Portfolio Hedged 29 December 2017Federated Hermes SDG Engagement Equity Fund X2 EUR Distributing Portfolio Hedged 29 December 2017Federated Hermes SDG Engagement Equity Fund X USD Accumulating Portfolio Hedged 29 December 2017Federated Hermes SDG Engagement Equity Fund X2 USD Distributing Portfolio Hedged 29 December 2017Federated Hermes SDG Engagement Equity Fund X CHF Accumulating Portfolio Hedged 29 December 2017Federated Hermes SDG Engagement Equity Fund X2 CHF Distributing Portfolio Hedged 29 December 2017Federated Hermes SDG Engagement Equity Fund W EUR Accumulating Portfolio Hedged 29 December 2017Federated Hermes SDG Engagement Equity Fund W2 EUR Distributing Portfolio Hedged 29 December 2017Federated Hermes SDG Engagement Equity Fund W USD Accumulating Portfolio Hedged 29 December 2017Federated Hermes SDG Engagement Equity Fund W2 USD Distributing Portfolio Hedged 29 December 2017Federated Hermes SDG Engagement Equity Fund W CHF Accumulating Portfolio Hedged 29 December 2017Federated Hermes SDG Engagement Equity Fund W2 CHF Distributing Portfolio Hedged 29 December 2017Federated Hermes SDG Engagement Equity Fund R USD Accumulating Portfolio Hedged 26 March 2018Federated Hermes SDG Engagement Equity Fund R2 USD Distributing Portfolio Hedged 26 March 2018Federated Hermes SDG Engagement Equity Fund R CHF Accumulating Portfolio Hedged 26 March 2018Federated Hermes SDG Engagement Equity Fund R2 CHF Distributing Portfolio Hedged 26 March 2018Federated Hermes SDG Engagement Equity Fund F GBP Accumulating Portfolio Hedged 26 March 2018Federated Hermes SDG Engagement Equity Fund F2 GBP Distributing Portfolio Hedged 26 March 2018Federated Hermes SDG Engagement Equity Fund F EUR Accumulating Portfolio Hedged 26 March 2018Federated Hermes SDG Engagement Equity Fund F2 EUR Distributing Portfolio Hedged 26 March 2018Federated Hermes SDG Engagement Equity Fund F USD Accumulating Portfolio Hedged 26 March 2018Federated Hermes SDG Engagement Equity Fund F2 USD Distributing Portfolio Hedged 26 March 2018Federated Hermes SDG Engagement Equity Fund F CHF Accumulating Portfolio Hedged 26 March 2018Federated Hermes SDG Engagement Equity Fund F2 CHF Distributing Portfolio Hedged 26 March 2018Federated Hermes SDG Engagement Equity Fund R EUR Accumulating Portfolio Hedged 26 March 2018Federated Hermes SDG Engagement Equity Fund R2 EUR Distributing Portfolio Hedged 26 March 2018Federated Hermes SDG Engagement Equity Fund T GBP Accumulating 8 October 2018Federated Hermes SDG Engagement Equity Fund X2 CHF Distributing 8 May 2019Federated Hermes SDG Engagement Equity Fund A2 USD Distributing 18 October 2019Federated Hermes SDG Engagement Equity Fund B USD Accumulating 18 October 2019Federated Hermes SDG Engagement Equity Fund S GBP Accumulating 8 November 2019Federated Hermes Impact Opportunities Equity Fund F USD Accumulating 21 December 2017Federated Hermes Impact Opportunities Equity Fund F GBP Accumulating 21 December 2017Federated Hermes Impact Opportunities Equity Fund F EUR Accumulating 21 December 2017Federated Hermes Impact Opportunities Equity Fund X USD Accumulating 21 December 2017Federated Hermes Impact Opportunities Equity Fund X GBP Accumulating 21 December 2017Federated Hermes Impact Opportunities Equity Fund X EUR Accumulating 21 December 2017Federated Hermes Impact Opportunities Equity Fund F2 EUR Distributing 29 June 2018Federated Hermes Impact Opportunities Equity Fund R EUR Accumulating 10 July 2018Federated Hermes Impact Opportunities Equity Fund R USD Accumulating 10 July 2018Federated Hermes Impact Opportunities Equity Fund T GBP Accumulating 8 October 2018Federated Hermes Impact Opportunities Equity Fund F GBP Accumulating Hedged 5 September 2019Federated Hermes Impact Opportunities Equity Fund X GBP Accumulating Hedged 5 September 2019Federated Hermes Impact Opportunities Equity Fund F EUR Accumulating Hedged 21 July 2020Federated Hermes Impact Opportunities Equity Fund A2 USD Distributing 27 October 2020Federated Hermes Impact Opportunities Equity Fund B2 USD Distributing 27 October 2020Federated Hermes Unconstrained Credit Fund F2 GBP Distributing Hedged 30 May 2018Federated Hermes Unconstrained Credit Fund F USD Accumulating 30 May 2018Federated Hermes Unconstrained Credit Fund X USD Accumulating 30 May 2018Federated Hermes Unconstrained Credit Fund F GBP Accumulating Hedged 30 May 2018Federated Hermes Unconstrained Credit Fund X GBP Accumulating Hedged 30 May 2018Federated Hermes Unconstrained Credit Fund F EUR Accumulating Hedged 30 May 2018Federated Hermes Unconstrained Credit Fund F2 USD Distributing 30 May 2018
1. Incorporation and Principal Activity (continued)

264
Federated Hermes Investment Funds Public Limited CompanyNotes to the Financial Statements for the financial year ended 31 December 2020 (continued)
Name of the sub-fund Share Class Launch dateFederated Hermes Unconstrained Credit Fund X2 USD Distributing 30 May 2018Federated Hermes Unconstrained Credit Fund X2 GBP Distributing Hedged 30 May 2018Federated Hermes Unconstrained Credit Fund R EUR Accumulating Hedged 30 May 2018Federated Hermes Unconstrained Credit Fund X EUR Accumulating Hedged 29 June 2018Federated Hermes Unconstrained Credit Fund R2 EUR Distributing Hedged 29 June 2018Federated Hermes Unconstrained Credit Fund X2 EUR Distributing 29 June 2018Federated Hermes Unconstrained Credit Fund F CHF Accumulating Hedged 29 June 2018Federated Hermes Unconstrained Credit Fund X2 CHF Distributing Hedged 29 June 2018Federated Hermes Unconstrained Credit Fund X2 EUR Distributing Hedged 29 June 2018Federated Hermes Unconstrained Credit Fund F2 EUR Distributing 29 June 2018Federated Hermes Unconstrained Credit Fund X2 CHF Distributing 16 July 2018Federated Hermes Unconstrained Credit Fund T GBP Accumulating 8 October 2018Federated Hermes Unconstrained Credit Fund F2 EUR Distributing Hedged 2 April 2019Federated Hermes Unconstrained Credit Fund A2 USD Distributing 18 October 2019Federated Hermes Unconstrained Credit Fund B2 USD Distributing 18 October 2019Federated Hermes Unconstrained Credit Fund L3 USD Distributing 21 July 2020Federated Hermes Unconstrained Credit Fund L3 EUR Distributing Hedged 21 July 2020Federated Hermes Unconstrained Credit Fund L3 GBP Distributing Hedged 21 July 2020Federated Hermes Unconstrained Credit Fund B USD Accumulating 25 September 2020Federated Hermes Unconstrained Credit Fund L EUR Accumulating Hedged 10 December 2020Federated Hermes Unconstrained Credit Fund R EUR Accumulating 15 December 2020Federated Hermes Global Emerging Markets SMID Equity Fund X USD Accumulating 8 October 2018Federated Hermes Global Emerging Markets SMID Equity Fund F USD Accumulating 8 October 2018Federated Hermes Global Emerging Markets SMID Equity Fund X EUR Accumulating 8 October 2018Federated Hermes Global Emerging Markets SMID Equity Fund X2 USD Distributing 8 October 2018Federated Hermes Global Emerging Markets SMID Equity Fund X GBP Accumulating 8 October 2018Federated Hermes Global Emerging Markets SMID Equity Fund F GBP Accumulating 8 October 2018Federated Hermes Global Emerging Markets SMID Equity Fund Z2 USD Distributing 17 December 2019Federated Hermes Global Emerging Markets SMID Equity Fund A2 USD Distributing 3 April 2020Federated Hermes Global Emerging Markets SMID Equity Fund B2 USD Distributing 3 April 2020Federated Hermes Global Emerging Markets SMID Equity Fund T GBP Accumulating 29 April 2020Federated Hermes Global Emerging Markets SMID Equity Fund B USD Accumulating 25 September 2020Federated Hermes SDG Engagement High Yield Credit Fund W USD Accumulating 2 October 2019Federated Hermes SDG Engagement High Yield Credit Fund Y CHF Accumulating Hedged 2 October 2019Federated Hermes SDG Engagement High Yield Credit Fund Y2 CHF Distributing Hedged 2 October 2019Federated Hermes SDG Engagement High Yield Credit Fund Y EUR Accumulating Hedged 2 October 2019Federated Hermes SDG Engagement High Yield Credit Fund Y GBP Accumulating Hedged 2 October 2019Federated Hermes SDG Engagement High Yield Credit Fund W EUR Accumulating Hedged 2 October 2019Federated Hermes SDG Engagement High Yield Credit Fund W CHF Accumulating Hedged 2 October 2019Federated Hermes SDG Engagement High Yield Credit Fund W GBP Accumulating Hedged 2 October 2019Federated Hermes SDG Engagement High Yield Credit Fund W2 CHF Distributing Hedged 2 October 2019Federated Hermes SDG Engagement High Yield Credit Fund F GBP Accumulating Hedged 2 October 2019Federated Hermes SDG Engagement High Yield Credit Fund F USD Accumulating 2 October 2019Federated Hermes SDG Engagement High Yield Credit Fund R USD Accumulating 2 October 2019Federated Hermes SDG Engagement High Yield Credit Fund R EUR Accumulating Hedged 2 October 2019Federated Hermes SDG Engagement High Yield Credit Fund Y USD Accumulating 3 October 2019Federated Hermes SDG Engagement High Yield Credit Fund W2 USD Distributing 3 December 2019Federated Hermes SDG Engagement High Yield Credit Fund Y2 USD Distributing 3 December 2019Federated Hermes SDG Engagement High Yield Credit Fund A2 USD Distributing 3 April 2020Federated Hermes SDG Engagement High Yield Credit Fund B2 USD Distributing 3 April 2020Federated Hermes SDG Engagement High Yield Credit Fund T GBP Accumulating 24 August 2020Federated Hermes SDG Engagement High Yield Credit Fund F EUR Accumulating Hedged 24 August 2020Federated Hermes SDG Engagement High Yield Credit Fund F CHF Accumulating 2 September 2020Federated Hermes SDG Engagement High Yield Credit Fund F CHF Accumulating Hedged 2 September 2020Federated Hermes SDG Engagement High Yield Credit Fund B USD Accumulating 25 September 2020Federated Hermes SDG Engagement High Yield Credit Fund F2 EUR Distributing Hedged 1 October 2020Federated Hermes SDG Engagement High Yield Credit Fund F2 USD Distributing 1 October 2020Federated Hermes SDG Engagement High Yield Credit Fund M USD Accumulating 3 November 2020Federated Hermes SDG Engagement High Yield Credit Fund M2 GBP Distributing Hedged 3 November 2020Federated Hermes SDG Engagement High Yield Credit Fund M EUR Accumulating 3 November 2020Federated Hermes US High Yield Credit Fund F USD Accumulating 22 July 2020Federated Hermes US High Yield Credit Fund F GBP Accumulating 22 July 2020Federated Hermes US High Yield Credit Fund F2 USD Distributing 22 July 2020
1. Incorporation and Principal Activity (continued)

265
Federated Hermes Investment Funds Public Limited CompanyNotes to the Financial Statements for the financial year ended 31 December 2020 (continued)
Name of the sub-fund Share Class Launch dateFederated Hermes US High Yield Credit Fund R USD Accumulating 22 July 2020Federated Hermes US High Yield Credit Fund X2 EUR Distributing 22 July 2020Federated Hermes US High Yield Credit Fund X2 GBP Distributing Hedged 22 July 2020Federated Hermes US High Yield Credit Fund Z USD Accumulating 22 July 2020Federated Hermes US High Yield Credit Fund A2 USD Distributing 11 November 2020Federated Hermes US High Yield Credit Fund B2 USD Distributing 11 November 2020
Investment Objective
Federated Hermes Global Emerging Markets Equity Fund - The investment objective of the sub-fund is to provide long-term capital appreciation by investing primarily in a diversified portfolio of equity securities and equity related securities of, or relating to companies in, or companies that derive a large proportion of their revenues from, global emerging markets� These companies will be listed on a Regulated Market worldwide, and the sub-fund will invest at least two-thirds of its assets in these securities� The Valuation Point of the sub-fund is twelve noon (Irish time) on each Dealing Day�
The comparator benchmark for this sub-fund is the MSCI Emerging Markets Index�
Federated Hermes Global Equity Fund - The investment objective of the sub-fund is to provide long-term capital appreciation by investing in a portfolio of equity securities quoted or traded on Regulated Markets worldwide and the sub-fund will invest at least two-thirds of its assets in these securities� In addition, the sub-fund will invest primarily in equity securities that are component securities of the MSCI World Index or equity securities of companies listed in the countries referenced in this index� The Valuation Point of the sub-fund is twelve noon (Irish time) on each Dealing Day�
The comparator benchmark for this sub-fund is the MSCI World Index�
Federated Hermes European Alpha Equity Fund - The investment objective of the sub-fund is to achieve long-term capital appreciation. The sub-fund will seek to achieve its objective by investing primarily in a diversified portfolio of equity securities and/or equity related securities of, or relating to, companies in, or companies that derive a large proportion of their revenues from, the developed and emerging European market region (including Russia and Turkey)� These companies will be listed and/or traded on a Regulated Market worldwide� The Valuation Point of the sub-fund is twelve noon (Irish time) on each Dealing Day�
The comparator benchmark for this sub-fund is the MCSI Europe Index�
Federated Hermes Global High Yield Credit Fund - The investment objective of the sub-fund is to generate a high level of income. The sub-fund will seek to achieve its objective by investing primarily in a diversified portfolio of debt securities� The sub-fund may take long positions and/or generate Synthetic Short Exposure through the use of financial derivative instruments. The securities in which the sub-fund may invest will be selected on a global basis� The Valuation Point of the sub-fund is close of business in the relevant market on each Dealing Day provided that if any of the relevant markets are not open on a Dealing Day, the value of the relevant investments at the close of business on the previous Dealing Day shall be used�
The comparator benchmark for this sub-fund is the Merrill Lynch Global Non-Financial High Yield Constrained Index�
Federated Hermes Europe ex-UK Equity Fund - The investment objective of the sub-fund is to achieve long term capital appreciation. The sub-fund will seek to achieve its objective by investing primarily in a diversified portfolio of equity securities and equity related securities of, or relating to, companies in, or companies that derive substantial revenues from, the developed and emerging European market region (including Russia and Turkey), but excluding the United Kingdom� These companies will be listed and/or or traded on a Regulated Market worldwide� The Valuation Point of the sub-fund is twelve noon (Irish time) on each Dealing Day�
The comparator benchmark for this sub-fund is the MSCI Europe ex-UK Index�
1. Incorporation and Principal Activity (continued)

266
Federated Hermes Investment Funds Public Limited CompanyNotes to the Financial Statements for the financial year ended 31 December 2020 (continued)
Federated Hermes US SMID Equity Fund - The investment objective of the sub-fund is to provide long term capital appreciation� The sub-fund will seek to achieve its objective by investing primarily in equity and/or equity related securities of, or relating, to small and mid-capitalisation companies domiciled in the US, or companies that derive a large proportion of their income from US activities, and that the Investment Manager has identified as being, in its view, undervalued� These companies will be listed or traded on a Regulated Market worldwide (primarily in the US or Canada)� The Valuation Point of the sub-fund is twelve noon (Irish time) on each Dealing Day�
The comparator benchmark for this sub-fund is the Russell 2500 Index�
Federated Hermes Asia ex-Japan Equity Fund - The investment objective of the sub-fund is to provide long term capital appreciation� The sub-fund will seek to achieve its objective by investing primarily in a portfolio of equity and equity related securities of, or relating to, companies in, or companies that derive a substantial proportion of their revenues from, the Asia ex-Japan region� These companies will be listed or traded on a Regulated Market worldwide� The Investment Manager will focus investment in (or exposure to) companies that derive revenue from developed and emerging market countries within the Asia ex-Japan region� The Valuation Point of the sub-fund is twelve noon (Irish time) on each Dealing Day�
The comparator benchmark for this sub-fund is the MSCI AC Asia ex Japan Index�
Federated Hermes Global Equity ESG Fund - The investment objective of the sub-fund is to achieve long term capital appreciation by investing in worldwide equity securities with favourable ESG characteristics� The sub-fund will seek to achieve its objective by investing in a portfolio of equity securities quoted or traded on Regulated Markets worldwide and the sub-fund will invest at least two-thirds of its assets in these securities� In addition, the sub-fund will invest primarily in equity securities which are component securities of the MSCI All Country World Index or equity securities of companies listed in the countries referenced in the MSCI All Country World Index� The Valuation Point of the sub-fund is twelve noon (Irish time) on each Dealing Day�
The comparator benchmark for this sub-fund is the MSCI All Country World Index�
Federated Hermes Multi-Strategy Credit Fund - The investment objective of the sub-fund is to generate a high level of income targeting a high proportion of high yield credit returns while exhibiting lower volatility relative to the global high yield market. The sub-fund will seek to achieve its objective primarily by investing in a diversified portfolio of debt securities� The sub-fund may take long positions and/or generate Synthetic Short Exposure through the use of financial derivative instruments. The securities in which the sub-fund may invest will be selected on a global basis� The Valuation Point of the sub-fund is close of business in the relevant market on each Dealing Day provided that if any of the relevant markets are not open on a Dealing Day, the value of the relevant investments at the close of business on the previous Dealing Day shall be used�
This sub-fund uses the Bank of America Merrill Lynch Global High Yield Index (Hedged USD) as a measure to monitor its performance but it is not benchmarked against an index�
Federated Hermes Global Small Cap Equity Fund - The investment objective of the sub-fund is to provide long-term capital appreciation� The sub-fund will seek to achieve its investment objective by primarily investing in equity and/or equity related securities of, or relating to, small market capitalisation companies domiciled in developed markets or which derive a large proportion of their income from developed markets� The Valuation Point of the sub-fund is twelve noon (Irish time) on each Dealing Day�
The comparator benchmark for this sub-fund is the MSCI World Small Cap index�
1. Incorporation and Principal Activity (continued)
Investment Objective (continued)

267
Federated Hermes Investment Funds Public Limited CompanyNotes to the Financial Statements for the financial year ended 31 December 2020 (continued)
Federated Hermes Absolute Return Credit Fund - The investment objective of the sub-fund is to target a positive investment return (absolute return) over a rolling 12 month period irrespective of market conditions, but there is no guarantee that this will be achieved and your capital is in fact at risk� The sub-fund will seek to achieve its objective primarily by investing in a diversified portfolio of debt securities and may take both long positions and/or (through the use of FDIs) generate Synthetic Short Exposure� The Valuation Point of the sub-fund is close of business in the relevant market on each Dealing Day provided that if any of the relevant markets are not open on a Dealing Day, the value of the relevant investments at the close of business on the previous Dealing Day shall be used�
This sub-fund uses 3M LIBOR +3% as a target but it is not benchmarked against an index�
Federated Hermes SDG Engagement Equity Fund - The investment objective of the sub-fund is to provide long-term capital appreciation alongside positive societal impact� The sub-fund will seek to achieve its investment objective by investing primarily in equity and/or equity-related securities of, or relating to, small and mid-capitalisation companies domiciled in, or that derive their income from, developed and emerging markets� These companies will be listed and/or traded on a Regulated Market worldwide� The Valuation Point of the sub-fund is twelve noon (Irish time) on each Dealing Day�
The comparator benchmark for this sub-fund is the MSCI ACWI SMID Net Index�
Federated Hermes Impact Opportunities Equity Fund - The investment objective of the sub-fund is to achieve long term capital appreciation by investing in companies which will benefit from meeting the world’s environmental and social challenges� The sub-fund will seek to achieve its investment objective by investing in a portfolio of equity securities quoted and/or traded on Regulated Markets worldwide, and the sub-fund will invest at least two-thirds of its assets in these securities� The Valuation Point of the sub-fund is twelve noon (Irish time) on each Dealing Day�
The comparator benchmark for this sub-fund is the MSCI ACWI IMI Net Index�
Federated Hermes Unconstrained Credit Fund - The investment objective of the sub-fund is to generate capital growth and a high level of income over the long term� The sub-fund will seek to achieve its objective primarily by investing in a diversified portfolio of debt securities. The sub-fund may take long positions and/or generate Synthetic Short Exposure through the use of financial derivative instruments. The securities in which the sub-fund may invest will be selected on a global basis� The Valuation Point of the sub-fund is close of business in the relevant market on each Dealing Day provided that if any of the relevant markets are not open on a Dealing Day, the value of the relevant investments at the close of business on the previous Dealing Day shall be used�
This sub-fund uses 3M LIBOR +5% as a target but it is not benchmarked against an index�
Federated Hermes Global Emerging Markets SMID Equity Fund - The investment objective of the sub-fund is to achieve long term capital appreciation� The sub-fund will seek to achieve its objective by investing primarily in a diversified portfolio of equity securities and equity related securities of, or relating to small and mid-capitalisation companies in, or companies that derive a large proportion of their revenues from, global emerging markets� These companies will be listed or traded on a Regulated Market worldwide and the sub-fund will invest at least two-thirds of its assets in these securities� The Valuation Point of the sub-fund is twelve noon (Irish time) on each Dealing Day�
The comparator benchmark for this sub-fund is the MSCI Emerging Markets SMID Net Total Return USD Index�
Federated Hermes SDG Engagement High Yield Credit Fund - The investment objective of the sub-fund is to provide total return, through a combination of income and capital growth over a rolling period of any five years, whilst delivering positive societal impact� The sub-fund will seek to achieve its objective by investing at least 80% in a diversified portfolio of Below Investment Grade debt securities on a global basis. The portfolio will be actively managed where all holdings within the sub-fund will have both an investment and an engagement thesis� The Valuation Point will be close of business in the relevant market on each Dealing Day provided that if any of the relevant markets are not open on a Dealing Day, the value of the relevant Investments at the close of business on the previous Dealing Day shall be used�
1. Incorporation and Principal Activity (continued)
Investment Objective (continued)

268
Federated Hermes Investment Funds Public Limited CompanyNotes to the Financial Statements for the financial year ended 31 December 2020 (continued)
This sub-fund uses the Bank of America Merrill Lynch Global High Yield Constrained Index as a measure to monitor its performance but it is not benchmarked against an index�
Federated Hermes US High Yield Credit Fund (launched 21 July 2020) - The investment objective of the sub-fund is to generate a high level of income� The sub-fund will seek to achieve its objective by investing in a diversified portfolio of debt securities, with at least 80% invested in Below Investment Grade securities.
This sub-fund uses the Bank of America Merrill Lynch US High Yield Constrained Index as a measure to monitor its performance but it is not benchmarked against an index�
2. Significant Accounting Policies
The significant accounting policies applied in the preparation of these Financial Statements are set out below.
Basis of Preparation
The Financial Statements have been prepared in accordance with the Companies Act 2014, International Financial Reporting Standards (“IFRS”) as adopted by the European Union and the European Communities (Undertakings for Collective Investment in Transferable Securities) Regulations, 2011, as amended and Central Bank (Supervision and Enforcement) Act 2013 (Section 48(1)) (Undertakings for Collective Investment in Transferable Securities) Regulations 2019�
These Financial Statements have been prepared on a going concern basis and under the historical cost convention, as modified by the revaluation of financial assets and liabilities held at fair value through profit or loss�
The preparation of Financial Statements in accordance with IFRS requires management to make estimates and assumptions that affect the reported amounts of assets and liabilities and the reported amounts of income and expenses during the year� Actual results could differ from those estimates� Estimates and underlying assumptions are reviewed on an ongoing basis� The main areas of estimation are discussed in this note under the heading “Financial assets and liabilities at fair value through profit or loss”.
(a) Standards and amendments to existing standards effective 1 January 2020
Amendments to IAS and IAS 8 relate to a revised definition of ‘material’ which is quoted as follows: ‘Information is material if omitting, misstating or obscuring it could reasonably be expected to influence decisions that the primary users of general purpose financial statements make on the basis of those financial statements, which provide financial information about a specific reporting entity.’
The revised Conceptual Framework is implemented to assist companies that use the Conceptual Framework to develop accounting policies when no IFRS Standard applies to a particular transaction� There has been no impact on the Fund�
(b) New standards, amendments and interpretations effective after 1 January 2021 and have not been early adopted
A number of new standards, amendments to standards and interpretations are effective for annual periods beginning after 1 January 2021, and have not been early adopted in preparing these Financial Statements� None of these are expected to have a material effect on the Financial Statements of the Company�
1. Incorporation and Principal Activity (continued)
Investment Objective (continued)

269
Federated Hermes Investment Funds Public Limited CompanyNotes to the Financial Statements for the financial year ended 31 December 2020 (continued)
Foreign exchange translation
(a) Functional and presentation currency
Items included in the Company’s Financial Statements are measured using the currency of the primary economic environment in which it operates (‘the functional currency’)� The functional currency of the Federated Hermes Global High Yield Credit Fund, the Federated Hermes European Alpha Equity Fund and the Federated Hermes Europe ex-UK Fund is Euro, which reflects the fact that a large number of the investments in their portfolios are denominated in Euro� The functional currency of the Federated Hermes Global Emerging Markets Equity Fund, the Federated Hermes Global Equity Fund, the Federated Hermes US SMID Equity Fund, the Federated Hermes Asia ex-Japan Equity Fund, the Federated Hermes Global Equity ESG Fund, the Federated Hermes Multi-Strategy Credit Fund, the Federated Hermes Global Small Cap Equity Fund, Federated Hermes Absolute Return Credit Fund, the Federated Hermes SDG Engagement Equity Fund, the Federated Hermes Impact Opportunities Equity Fund, the Federated Hermes Unconstrained Credit Fund, the Federated Hermes Global Emerging Markets SMID Equity Fund, the Federated Hermes SDG Engagement High Yield Credit Fund and the Federated Hermes US High Yield Credit Fund is US Dollar which reflects the fact that a large number of the investments in their portfolios are denominated in US Dollar� All sub-funds denominated in Euro and US Dollar have been converted to Sterling in the total columns� The presentation currency of the Company is Sterling�
(b) Transactions and balances
Foreign currency transactions are translated into the functional currency of each sub-fund using the exchange rates prevailing at the dates of the transactions� Assets and liabilities are translated into the functional currency of each sub-fund using exchange rates in effect at the Balance Sheet date�
Foreign exchange gains and losses resulting from the settlement of transactions and from the translation at year end exchange rates of monetary assets and liabilities denominated in foreign currencies are recognised in the Income Statement�
Translation differences on financial instruments held at fair value through profit or loss are reported as part of net gain/(loss) on financial assets and liabilities at fair value through profit or loss in the Income Statement.
(c) Foreign exchange adjustments on aggregation
For the purpose of aggregating the Financial Statements of the sub-funds, Euro and US Dollar denominated sub-funds in the Financial Statements have been translated to Sterling at the average rate of exchange for the financial year on the Income Statement and at the financial year end rate on the Balance Sheet. The exchange adjustment arising from the difference between the average rate and the year end rate, in addition to the notional exchange adjustment arising from the translation of the opening net assets are shown in the Statement of Changes in Net Assets� The method of translation has no effect on the Net Asset Value per share attributable to the individual sub-funds�
The notional adjustment translation of the Cash Flow movements at the average rate opposed to the financial year end rate is shown in the Cash Flow Statement�
2. Significant Accounting Policies (continued)

270
Federated Hermes Investment Funds Public Limited CompanyNotes to the Financial Statements for the financial year ended 31 December 2020 (continued)
Financial assets and liabilities at fair value through profit or loss
(a) Classification
(i) Assets
In accordance with IFRS 9, the Company classifies its investments based on both the Company’s business model for managing those financial assets and the contractual cash flow characteristics of the financial assets. The portfolio of financial assets is managed and performance is evaluated on a fair value basis. The Company is primarily focused on fair value information and uses that information to assess the assets’ performance and to make decisions� The Company has not taken the option to irrevocably designate any equity securities as fair value through other comprehensive income. The contractual cash flows of the Company’s debt securities are solely principal and interest, however, these securities are neither held for the purpose of collecting contractual cash flows nor held both for collecting contractual cash flows and for sale. The collection of contractual cash flows is only incidental to achieving the Company’s business model’s objective. Consequently, all investments are measured at fair value through profit or loss.
(ii) Liabilities
Derivative contracts that have a negative fair value are presented as liabilities at fair value through profit or loss.
As such, the Company classifies its entire investment portfolio as financial assets or liabilities at fair value through profit or loss.
(b) Recognition/derecognition
Purchases and sales of investments are recognised on the trade date – the date on which the Company commits to purchase or sell the investment� Investments are derecognised when the rights to receive cash flows from the investments have expired or the Company has transferred all risks and rewards of ownership. Gains and losses on the disposal of financial assets and liabilities are computed on a FIFO basis and are included in the Income Statement. Changes in unrealised gains and losses on financial assets and liabilities are recognised in the Income Statement�
(c) Measurement
Financial assets and financial liabilities at fair value through profit or loss are initially recognised at fair value. Subsequent to initial recognition, all financial assets and financial liabilities at fair value through profit or loss are measured at fair value. Gains and losses arising from changes in the fair value of the “financial assets or financial liabilities at fair value through profit or loss” category are presented in the Income Statement in the period in which they arise�
2. Significant Accounting Policies (continued)

271
Federated Hermes Investment Funds Public Limited CompanyNotes to the Financial Statements for the financial year ended 31 December 2020 (continued)
IFRS 13 Fair Value Measurement requires the sub-funds to classify fair value measurements using a fair value hierarchy that reflects the significance of the inputs used in making the measurements. The fair value hierarchy has the following levels:
• Level I – Unadjusted quoted prices in active markets that are accessible at the measurement date for identical, unrestricted assets or liabilities� The type of investments which would generally be included would include equities, american depositary receipts, REITS, warrants and derivatives listed on a securities exchange�
• Level II – Quoted prices in markets that are not considered to be active or financial instruments priced using inputs other than quoted prices and for which all significant inputs are observable, either directly or indirectly (including quoted prices for similar investments in active markets, interest rates and yield curves, credit risks, etc�)� The type of investments which would generally be included in this category would include corporate bonds, government bonds, P-Notes, bank debt and certain over-the-counter derivatives�
• Level III – Prices or valuations that require inputs that are both significant to the fair value measurement and unobservable (including the Investment Manager’s own assumptions and assumptions used by the Board of Directors about what market participants would use in determining the fair value of investments)� The type of investments which would generally be included in this category would include private or debt securities issued by private entities and investments priced by the Investment Manager� The inputs or methodology used for valuing securities are not necessarily an indication of the risks associated with investing in those securities�
(d) Fair value estimation
IFRS 13 defines fair value as the price that would be received to sell an asset or paid to transfer a liability in an orderly transaction between market participants at the measurement date. The fair value of financial instruments traded in active markets (such as publicly traded derivatives and trading securities, warrants, floating rate notes, P-Notes, REITS, american depositary receipts and bonds) is based on quoted market prices at the Balance Sheet date. The Company utilises the last traded market price for both financial assets and financial liabilities where the last traded price falls within the bid-ask spread� IFRS 13 allows the use of midmarket pricing or other pricing conventions (including last traded price) that are used by market participants as a practical expedient for the exit price� In circumstances where the last traded price is not within the bid-ask spread, management will determine the point within the bid-ask spread that is most representative of fair value� No investments have been valued in this way at year end�
Derivatives
Derivative contracts (“derivatives”) are either exchange-traded or over-the-counter (“OTC”) contracts� Exchange-traded derivatives are standard contracts traded on a regulated exchange� OTC contracts are private contracts negotiated with counterparties� Derivatives are comprised of futures, forward currency contracts, credit default swaps, swaptions and warrants�
Derivatives are recorded at fair value. The sub-fund values exchange-traded derivative contracts at their official settlement price on the exchange where they are primarily traded� OTC derivatives are valued using market transactions and other market evidence whenever possible, including market based inputs to model, model calibration to market-clearing transactions, brokers or dealers quotations, or alternative pricing sources with reasonable levels of transparency�
Futures
Futures contracts are valued at the last reported settlement or closing price as supplied by the exchange on which the contracts are traded and are recorded on a trade date basis� Cash balances held with Morgan Stanley are used as collateral for the futures contracts and are identified as variation margin receivable and payable in the Balance Sheet� Variation margin is valued at face value plus accrued interest which approximates fair value�
2. Significant Accounting Policies (continued)
Financial assets and liabilities at fair value through profit or loss (continued)
(c) Measurement (continued)

272
Federated Hermes Investment Funds Public Limited CompanyNotes to the Financial Statements for the financial year ended 31 December 2020 (continued)
Gains or losses from futures contracts are considered realised for accounting purposes on the trade date of the transaction closing or offsetting the open position�
Realised gains or losses are included in the Income Statement� Unrealised gains or losses, representing the difference between the future rate and contract rate of open futures positions, are included in the Balance Sheet and the movement in the financial year is included in the Income Statement.
Forward currency contracts
Forward currency contracts are valued at the forward rate and are marked to market on the valuation date� The change in value is included in net gain/(loss) on financial assets and liabilities at fair value through profit or loss in the Income Statement� When the contract is closed, the Company records a realised gain or loss equal to the difference between the value of the contract at the time it was opened and the value at the time it was closed�
Warrants
Warrants are securities providing a return generated by a specified underlying equity or basket of equities. Investments in warrants are valued at the last reported trade price of the underlying security as of close of business at the reporting date. The resulting unrealised gains and losses for the financial year are included in the Balance Sheet and Income Statement� Realised gains and losses are included in the Income Statement�
Credit Default Swaps
Credit default swaps are OTC contracts in which the sub-fund pays or receives an interest flow in return for the counterparty accepting all or part of the risk of default or failure to pay off a reference entity on which the swap return is written� Where the sub-fund has bought protection the maximum potential loss is the value of the interest flows the sub-fund is contracted to pay until maturity of the contract. Where the sub-fund has sold protection the maximum potential loss is the nominal value of the protection sold� The credit default swaps are marked to market at each valuation point by a third party vendor and the change, if any, is recorded as a movement in unrealised gain or loss� Payments received or made as a result of a credit event or termination of the contract are recognised, net of a proportional amount of the upfront payment, as realised gains or losses�
Swaptions
Swaptions combine the features of two other financial instruments, namely an option and a swap. A swaption involves writing/purchasing options to enter into a swap� When a sub-fund writes/purchases a swaption, a premium is received/paid by the sub-fund and the swaption is initially recognised at the amount of the premium�
The swaption is subsequently “marked to market” to reflect the fair value of the swaption, which is reported within the financial assets/liabilities at fair value through profit or loss on the Balance Sheet and Portfolio Statement� The difference between the premium and the fair value reported on the Balance Sheet gives rise to an unrealised gain/loss which is reported in the Income Statement�
Asset Backed Securities
An asset-backed security is a security that is primarily serviced by the cash flows of a discrete pool of receivables or other financial assets, either fixed or revolving, that by their terms convert into cash within a finite time period plus any rights or other assets designed to ensure the servicing or timely distribution of proceeds to the security holders� The investment characteristics of asset-backed securities are such that principal payments are made more frequently than traditional debt securities� The principal may be repaid at any time because the underlying asset loans or other assets generally may be repaid at any time� The sub-funds record these principal repayments as they arise and realise a gain or loss in the net gains/(losses) on financial assets/(liabilities) at fair value through profit or loss in the Income Statement in the period in which they occur. Asset Backed Securities are valued at fair value based on their quoted market price at the Balance Sheet date�
2. Significant Accounting Policies (continued)
Financial assets and liabilities at fair value through profit or loss (continued)
(d) Fair value estimation (continued)
Futures (continued)

273
Federated Hermes Investment Funds Public Limited CompanyNotes to the Financial Statements for the financial year ended 31 December 2020 (continued)
Income from investments
Bank and bond interest income and expense are recognised in the Income Statement using the effective interest rate method�
Dividends are credited to the Income Statement on the dates on which the relevant securities are listed as "ex-dividend"� Dividend income is shown gross of any withholding taxes, which is disclosed separately in the Income Statement, and net of any tax credits�
Cash and cash equivalents
Cash and cash equivalents are valued at their face value together with interest accrued, where applicable� Cash and cash equivalents comprise of cash balances and short term bank overdrafts and short-term highly liquid investments that are readily convertible to known amounts of cash�
Cash received as collateral for derivative positions
Broker cash received as collateral is recorded as an asset on the Balance Sheet as ‘Cash received as collateral for derivative positions’ and a related liability to repay the collateral is disclosed within liabilities as ‘Cash due to counterparties for derivative positions’� Cash received as collateral is valued at face value plus accrued interest which approximates fair value�
Cash pledged as collateral for derivative positions
Cash pledged as collateral to brokers for derivative positions on the initiation of derivative trades and additional collateral posted on these trades are identified in the Balance Sheet as ‘Cash pledged as collateral for derivative positions’� Cash pledged as collateral for derivative positions is not included as a component of cash and cash equivalents in the Balance Sheet and is not available to the sub-funds on demand� Cash pledged as collateral is valued at face value plus accrued interest which approximates fair value�
Net assets attributable to holders of redeemable participating shares
International Accounting Standard 32 “Financial Instruments: Presentation” ("IAS 32") requires entities that issue financial instruments to classify such instruments as liabilities or equity in accordance with the substance of the contractual arrangement and the definitions contained within IAS 32. In this regard, IAS 32 requires that financial instruments that give the holder the right to put the instrument back to the issuer for cash or another financial asset be classified as a liability of the issuer.
The redeemable participating shares issued by the Company provide the redeemable participating shareholders with the right to redeem their shares for cash equal to their proportionate share of the Net Asset Value of the Company� Within the context of IAS 32 and IFRS 7 ‘Financial Instruments: Disclosures’ (“IFRS 7”), the existence of the option for the redeemable participating shareholders to put the shares back to the Company in exchange for cash requires the Company to classify the redeemable participating shares as liabilities�
The liability to redeemable participating shareholders is presented on the Balance Sheet as “net assets attributable to holders of redeemable participating shares” and is determined based on the residual assets of the Company after deducting the Company’s other liabilities and management share capital�
Operating expenses
The Company is responsible for all normal operating expenses including audit fees, stamp and other duties and charges incurred on the acquisition and realisation of investments� Operating expenses are recognised on an accrual basis�
2. Significant Accounting Policies (continued)

274
Federated Hermes Investment Funds Public Limited CompanyNotes to the Financial Statements for the financial year ended 31 December 2020 (continued)
Income equalisation
Income equalisation is accrued income included in the price of shares purchased and redeemed during the accounting year� The subscription price of shares is deemed to include an equalisation payment calculated by reference to the accrued income of the relevant sub-fund and the distribution in respect of any share will include a payment of capital usually equal to the amount of such equalisation payment� The redemption price of each share will also include an equalisation payment in respect of the accrued income of the relevant sub-fund up to the date of redemption� As a result, equalisation may be positive or negative� Income equalisation is accounted for in the Income Statement�
Taxation
The sub-funds may incur withholding taxes imposed by certain countries on investment income and capital gains� Such income or gains are recorded gross of withholding taxes in the Statement of Comprehensive Income� Withholding taxes are shown as a separate item in the Statement of Comprehensive Income�
Dilution Adjustments
In the event of a sub-fund being in a Net Subscription or Net Redemption Position that exceeds a predetermined threshold on any Dealing Day, the Company may make a Dilution Adjustment to the Net Asset Value per Share of the relevant Share Classes to cover the Duties and Charges and Spreads, being the costs involved in rebalancing the Fund’s portfolio in respect of the net issue of Shares on that Dealing Day� For further details please refer to the Prospectus�
2. Significant Accounting Policies (continued)

275
Federated Hermes Investment Funds Public Limited CompanyNotes to the Financial Statements for the financial year ended 31 December 2020 (continued)
During the year ended 31 December 2020, swing pricing adjustments affected the net asset value per share of the following Sub – Funds, below shows the total adjustments applied for the year:
Sub-Fund Swing Pricing Impact on
DealingFederated Hermes Global Emerging Markets Equity FundRedemptions 327,078�23Federated Hermes Global Equity FundRedemptions 1,103�81Subscriptions 7,984�39Federated Hermes European Alpha Equity FundRedemptions 38,117�59Subscriptions 13,104�88Federated Hermes Global High Yield Credit FundRedemptions 48,451�34Subscriptions 659,171�57Federated Hermes Europe ex-UK Equity FundRedemptions 157,109�38Subscriptions 6,237�57Federated Hermes US SMID Equity FundRedemptions 63,067�47Federated Hermes Asia ex-Japan Equity FundRedemptions 812,999�52Federated Hermes Multi-Strategy Credit FundRedemptions 1,321,236�35Federated Hermes Global Small Cap Equity FundRedemptions 12,090�63Subscriptions 92,740�86Federated Hermes Absolute Return Credit FundRedemptions 259,860�90Subscription 1,043,008�40Federated Hermes SDG Engagement Equity FundSubscriptions 115,462�60Federated Hermes Impact Opportunities Equity FundRedemptions 21,587�85Subscriptions 86,029�78Federated Hermes Unconstrained Credit FundSubscriptions 236,210�79Federated Hermes Global Emerging Markets SMID Equity FundRedemptions 16,270�74Subscriptions 110,560�38Federated Hermes SDG Engagement High Yield Credit FundSubscriptions 167,629�37
These amounts are included within ‘Issue of redeemable participating shares for the year’ and ‘Redemption of redeemable participating shares for the year’ in the Statement of Changes in Net Assets Attributable to Holders of Redeemable Participating Shares�
Investment Management Rebate
Where applicable, the sub – funds accrue Investment management rebates on a daily basis in line with the investor rebate agreement� The rebate is calculated as a discount from the investment management fee which the investment manager receives from the fund in respect of its provision of Investment management services to the fund�
3. Cash and Cash Equivalents
Substantially all of the cash assets of the sub-funds are held with The Northern Trust Company (TNTC), which is a 100% indirect wholly owned subsidiary of Northern Trust Corporation which has a Standard & Poor’s credit rating of A+ and A2 from Moody’s�
2. Significant Accounting Policies (continued)
Dilution Adjustments (continued)

276
Federated Hermes Investment Funds Public Limited CompanyNotes to the Financial Statements for the financial year ended 31 December 2020 (continued)
Northern Trust Fiduciary Services (Ireland) Limited has appointed TNTC as its Global Sub-Custodian�
The cash held with TNTC at 31 December 2020 and 31 December 2019 is detailed in the table below:
31 Dec 2020 31 Dec 2019Federated Hermes Global Emerging Markets Equity Fund $162,923,549 $54,420,525Federated Hermes Global Equity Fund $81,340 $145,368Federated Hermes European Alpha Equity Fund €631,805 €1,426,275Federated Hermes Global High Yield Credit Fund €2,251,744 €1,477,128Federated Hermes Europe ex-UK Equity Fund €196,199 €2,095,442Federated Hermes US SMID Equity Fund $35,298,619 $31,469,038Federated Hermes Asia ex-Japan Equity Fund $12,784,934 $27,545,311Federated Hermes Global Equity ESG Fund $24,426,379 $18,421,920Federated Hermes Multi-Strategy Credit Fund $21,839,087 $54,105,244Federated Hermes Global Small Cap Equity Fund $2,523,855 $2,209,148Federated Hermes Absolute Return Credit Fund $8,587,475 $5,442,715Federated Hermes SDG Engagement Equity Fund $31,929,354 $22,240,813Federated Hermes Impact Opportunities Equity Fund $9,283,940 $2,794,539Federated Hermes Unconstrained Credit Fund $8,403,068 ($8,130,941)Federated Hermes Global Emerging Markets SMID Equity Fund $9,365,417 $2,897,881Federated Hermes SDG Engagement High Yield Credit Fund $7,202,853 $8,621,791Federated Hermes US High Yield Credit Fund* $151,930 -
£247,697,679 £171,952,997
*Fund launched on 21 July 2020
Please note that within the cash and cash equivalents balance there is a restricted cash amount of $6,463,162 that is applied pro rata to each fund by reference to its individual liability and is set aside for a potential IRS liability for underpaid US Withholding tax, whereby the treaty rate of 15% was being claimed by the Fund instead of the standard rate of 30%, covering a period from January 2013 to March 2018�The Fund has not recorded a liability in the financial statements, as it is not probable that the Fund will have to settle the liability, as per the advice from the Fund’s US tax advisors� The Fund has submitted a self-declaration and this is under consideration with the IRS at the date of this report It is uncertain as to when the IRS will opine on the self-declaration as no set timelines are provided� With the exception of Federated Hermes Global Equity Fund, the Fund retains the rights and ownership of the restricted cash held�
The Investment Manager has agreed to absorb any potential liability on Federated Hermes Global Equity Fund� If no liability is to be paid, Hermes Fund Managers Limited can claim the restricted cash balance attributable to Federated Hermes Global Equity Fund�
The Investment Manager has agreed to absorb any potential liability on Federated Hermes Global Equity Fund� If no liability is to be paid, Hermes Fund Managers Limited can claim the restricted cash balance attributable to Federated Hermes Global Equity Fund�
The standard US withholding rate of 30% has been applied since March 2018�
For a breakdown of the restricted cash by sub-fund, please refer to note 13�
4. Cash Collateral for Derivative Positions
Where derivatives are held on a sub-fund, the sub-funds may pledge/receive collateral as required with the derivative counterparty� The collateral pledged and received at 31 December 2020 and 31 December 2019 is detailed in the tables overleaf:
3. Cash and Cash Equivalents (continued)

277
Federated Hermes Investment Funds Public Limited CompanyNotes to the Financial Statements for the financial year ended 31 December 2020 (continued)
31 December 2020
Federated Hermes Global
High Yield Credit Fund
Federated Hermes Multi-
Strategy Credit Fund
Federated Hermes
Absolute Return Credit Fund
Federated Hermes
Unconstrained Credit Fund
€ $ $ $Barclays 90,000 1,460,000 - 430,000BNP Paribas - (1,650,000) - (190,000)Citi - - - (530,000)Credit Suisse - 1,020,000 (550,000) (350,000)Goldman Sachs (550,000) 3,430,000 1,380,000 (1,750,000)HSBC - - - 560,000JP Morgan (790,000) (4,950,000) (1,880,000) (2,750,000)Lloyds Bank 150,000 - - -Merrill Lynch (330,000) 2,190,000 780,000 (2,340,000)Morgan Stanley (4,069) 509,078 1,822,024 15,308,476Royal Bank of Canada (870,000) 450,000 410,000 1,290,000State Street (930,000) 1,360,000 1,060,000 2,710,000
(3,234,069) 3,819,078 3,022,024 12,388,476
Federated Hermes SDG Engagement
High Yield Credit Fund
Total
$ £Barclays - 1,463,198BNP Paribas (690,000) (1,850,834)Citi - (387,724)Credit Suisse (600,000) (351,146)Goldman Sachs (260,000) 1,556,052HSBC - 409,671JP Morgan (1,140,000) (8,549,395)Lloyds Bank - 134,264Merrill Lynch - 165,498Morgan Stanley (15,045) 12,889,673Royal Bank of Canada 910,000 1,459,826State Street 1,550,000 4,054,349
(245,045) 10,993,432
Collateral held with Morgan Stanley for the Federated Hermes Multi-Strategy Credit Fund as at 31 December 2020 of $509,078 is made up of a collateral asset of $620,000 and a collateral liability of $110,922 which are shown in cash collateral assets and cash collateral liabilities respectively on the Balance Sheet�
Collateral held with Morgan Stanley for the Federated Hermes Absolute Return Credit Fund as at 31 December 2020 of $1,822,024 is made up of a collateral asset of $1,824,083 and a collateral liability of $2,059 which are shown in cash collateral assets and cash collateral liabilities respectively on the Balance Sheet�
Collateral held with Morgan Stanley for the Federated Hermes Unconstrained Credit Fund as at 31 December 2020 of $15,308,476 is made up of a collateral asset of $15,536,539 and a collateral liability of $228,063 which are shown in cash collateral assets and cash collateral liabilities respectively on the Balance Sheet�
4. Cash Collateral for Derivative Positions (continued)

278
Federated Hermes Investment Funds Public Limited CompanyNotes to the Financial Statements for the financial year ended 31 December 2020 (continued)
31 December 2019
Federated Hermes Global
High Yield Credit Fund
Federated Hermes Multi-
Strategy Credit Fund
Federated Hermes
Absolute Return Credit Fund
Federated Hermes
Unconstrained Credit Fund
€ $ $ $Barclays 110,000 4,270,000 (260,000) -BNP Paribas - 610,000 - -Citi - 2,230,000 (120,000) (660,000)Credit Suisse - (3,280,000) (410,000) (140,000)Goldman Sachs (290,000) 6,010,000 870,000 (2,670,000)HSBC (300,000) - - -JP Morgan (260,000) 6,650,000 350,000 (330,000)Merrill Lynch (310,000) (370,000) (580,000) (1,250,000)Morgan Stanley - 4,505,059 2,221,131 14,280,029State Street - (1,430,000) - (730,000)Royal Bank of Canada - (2,550,000) (400,000) (1,610,000)
(1,050,000) 16,645,059 1,671,131 6,890,029
Federated Hermes SDG Engagement
High Yield Credit Fund
Total
$ £Barclays - 3,120,191 BNP Paribas (250,000) 271,749 Citi - 1,094,546Credit Suisse (630,000) (3,366,671) Goldman Sachs (280,000) 2,720,870 HSBC - (254,199)JP Morgan - 4,814,604 Merrill Lynch - (1,923,362)Morgan Stanley (706) 15,856,201State Street - (1,630,495) Royal Bank of Canada (570,000) (3,872,427)
(1,730,706) 16,831,007
Collateral held with Morgan Stanley for the Federated Hermes Multi-Strategy Credit Fund as at 31 December 2019 of $4,505,059 is made up of a collateral asset of $4,531,502 and a collateral liability of $26,443 which are shown in cash collateral assets and cash collateral liabilities respectively on the Balance Sheet�
Collateral held with Barclays for the Federated Hermes Global High Yield Credit Fund as at 31 December 2019 of $110,000 is made up of a collateral asset of $480,000 and a collateral liability of $370,000 which are shown in cash collateral assets and cash collateral liabilities respectively on the Balance Sheet�
4. Cash Collateral for Derivative Positions (continued)

279
Federated Hermes Investment Funds Public Limited CompanyNotes to the Financial Statements for the financial year ended 31 December 2020 (continued)
5. Fees and Other Expenses
(a) Investment Management Fees
The Investment Manager is entitled to annual fees based on a percentage of the Net Asset Value of each relevant share class� The rate applicable to each share class is detailed below:
Sub-Fund Class Z* Class T* Class F Class R Class XFederated Hermes Global Emerging Markets Equity Fund
Up to 3% Up to 1% Up to 1% Up to 1�50% N/A
Federated Hermes Global Equity Fund Up to 3% Up to 1% Up to 0�55% Up to 1�10% N/AFederated Hermes European Alpha Equity Fund Up to 3% Up to 1% Up to 0�75% Up to 1�50% N/AFederated Hermes Global High Yield Credit Fund Up to 3% Up to 1% Up to 0�65% Up to 1�25% N/AFederated Hermes Europe ex-UK Equity Fund Up to 3% Up to 1% Up to 0�75% Up to 1�50% N/AFederated Hermes US SMID Equity Fund Up to 3% Up to 1% Up to 0�75% Up to 1�50% N/AFederated Hermes Asia ex-Japan Equity Fund Up to 3% Up to 1% Up to 0�75% Up to 1�50% N/AFederated Hermes Global Equity ESG Fund Up to 3% Up to 1% Up to 0�55% Up to 1�10% N/AFederated Hermes Multi-Strategy Credit Fund Up to 3% Up to 1% Up to 0�65% Up to 1�30% N/AFederated Hermes Global Small Cap Equity Fund Up to 3% Up to 1% Up to 0�75% Up to 1�50% Up to 0�45%Federated Hermes Absolute Return Credit Fund Up to 3% Up to 1% Up to 0�40% Up to 0�80% N/AFederated Hermes SDG Engagement Equity Fund Up to 3% Up to 1% Up to 0�95% Up to 1�75% Up to 0�70%Federated Hermes Impact Opportunities Equity Fund** Up to 3% Up to 1% Up to 0�75% Up to 1�50% Up to 0�25%Federated Hermes Unconstrained Credit Fund Up to 3% Up to 1% Up to 0�65% Up to 1�30% Up to 0�40%Federated Hermes Global Emerging Markets SMID Equity Fund
Up to 3% Up to 1% Up to 1% Up to 1�50% Up to 0�45%
Federated Hermes SDG Engagement High Yield Credit Fund
Up to 3% Up to 1% Up to 0�65% Up to 1�30% N/A
Federated Hermes US High Yield Credit Fund Up to 3% Up to 1% Up to 0�65% Up to 1�30% Up to 0�50%
Sub-Fund Class A Class B Class M Class G Class JFederated Hermes Global Emerging Markets Equity Fund
Up to 1% Up to 1�75% N/A Up to 1�75% Up to 0�70%
Federated Hermes Global Equity Fund Up to 0�55% Up to 1�30% N/A N/A N/AFederated Hermes European Alpha Equity Fund N/A N/A Up to 0�45% N/A N/AFederated Hermes Global High Yield Credit Fund Up to 0�65% Up to 1�15% Up to 0�35% N/A N/AFederated Hermes Europe ex-UK Equity Fund N/A N/A Up to 0�45% N/A N/AFederated Hermes US SMID Equity Fund Up to 0�75% Up to 1�50% N/A N/A N/AFederated Hermes Asia ex-Japan Equity Fund Up to 0�75% Up to 1�50% N/A N/A N/AFederated Hermes Global Equity ESG Fund Up to 0�55% Up to 1�30% N/A N/A Up to 0�40%Federated Hermes Multi-Strategy Credit Fund Up to 0�65% Up to 1�15% N/A N/A N/AFederated Hermes Global Small Cap Equity Fund Up to 0�75% Up to 1�50% N/A N/A N/AFederated Hermes Absolute Return Credit Fund*** Up to 0�40% Up to 0�90% Up to 0�30% N/A N/AFederated Hermes SDG Engagement Equity Fund Up to 0�95% Up to 1�70% N/A N/A N/AFederated Hermes Impact Opportunities Equity Fund** Up to 0�75% Up to 1�50% N/A N/A N/AFederated Hermes Unconstrained Credit Fund Up to 0�65% Up to 1�15% N/A N/A N/AFederated Hermes Global Emerging Markets SMID Equity Fund
Up to 1% Up to 1�75% N/A N/A N/A
Federated Hermes SDG Engagement High Yield Credit Fund
Up to 0�65% Up to 1�15% 0�00% N/A N/A
Federated Hermes US High Yield Credit Fund Up to 0�65% Up to 1�15% N/A N/A N/A
31 December 2019
Federated Hermes Global
High Yield Credit Fund
Federated Hermes Multi-
Strategy Credit Fund
Federated Hermes
Absolute Return Credit Fund
Federated Hermes
Unconstrained Credit Fund
€ $ $ $Barclays 110,000 4,270,000 (260,000) -BNP Paribas - 610,000 - -Citi - 2,230,000 (120,000) (660,000)Credit Suisse - (3,280,000) (410,000) (140,000)Goldman Sachs (290,000) 6,010,000 870,000 (2,670,000)HSBC (300,000) - - -JP Morgan (260,000) 6,650,000 350,000 (330,000)Merrill Lynch (310,000) (370,000) (580,000) (1,250,000)Morgan Stanley - 4,505,059 2,221,131 14,280,029State Street - (1,430,000) - (730,000)Royal Bank of Canada - (2,550,000) (400,000) (1,610,000)
(1,050,000) 16,645,059 1,671,131 6,890,029
Federated Hermes SDG Engagement
High Yield Credit Fund
Total
$ £Barclays - 3,120,191 BNP Paribas (250,000) 271,749 Citi - 1,094,546Credit Suisse (630,000) (3,366,671) Goldman Sachs (280,000) 2,720,870 HSBC - (254,199)JP Morgan - 4,814,604 Merrill Lynch - (1,923,362)Morgan Stanley (706) 15,856,201State Street - (1,630,495) Royal Bank of Canada (570,000) (3,872,427)
(1,730,706) 16,831,007
Collateral held with Morgan Stanley for the Federated Hermes Multi-Strategy Credit Fund as at 31 December 2019 of $4,505,059 is made up of a collateral asset of $4,531,502 and a collateral liability of $26,443 which are shown in cash collateral assets and cash collateral liabilities respectively on the Balance Sheet�
Collateral held with Barclays for the Federated Hermes Global High Yield Credit Fund as at 31 December 2019 of $110,000 is made up of a collateral asset of $480,000 and a collateral liability of $370,000 which are shown in cash collateral assets and cash collateral liabilities respectively on the Balance Sheet�

280
Federated Hermes Investment Funds Public Limited CompanyNotes to the Financial Statements for the financial year ended 31 December 2020 (continued)
Sub-Fund Class W Class Y Class S Class L Class PFederated Hermes Global Emerging Markets Equity Fund
N/A N/A N/A N/A Up to 1�00%
Federated Hermes Global Equity Fund N/A N/A N/A N/A Up to 0�55%Federated Hermes European Alpha Equity Fund N/A N/A Up to 0�60% N/A Up to 0�75%Federated Hermes Global High Yield Credit Fund N/A N/A N/A 0�00% Up to 0�65%Federated Hermes Europe ex-UK Equity Fund N/A N/A N/A N/A Up to 0�75%Federated Hermes US SMID Equity Fund N/A N/A N/A Up to 0�65% Up to 0�75%Federated Hermes Asia ex-Japan Equity Fund N/A N/A N/A N/A N/AFederated Hermes Global Equity ESG Fund N/A N/A N/A N/A Up to 0�55%Federated Hermes Multi-Strategy Credit Fund N/A N/A N/A Up to 0�50% Up to 0�65%Federated Hermes Global Small Cap Equity Fund N/A N/A N/A N/A Up to 0�75%Federated Hermes Absolute Return Credit Fund*** N/A N/A N/A N/A Up to 0�40%Federated Hermes SDG Engagement Equity Fund Up to 1�25% N/A Up to 0�80% N/A Up to 0�95%Federated Hermes Impact Opportunities Equity Fund** N/A N/A N/A N/A Up to 0�75%Federated Hermes Unconstrained Credit Fund N/A N/A N/A Up to 0�50% Up to 0�65%Federated Hermes Global Emerging Markets SMID Equity Fund
N/A N/A N/A N/A Up to 1�00%
Federated Hermes SDG Engagement High Yield Credit Fund
Up to 1�05% Up to 0�40% N/A N/A Up to 0�65%
Federated Hermes US High Yield Credit Fund N/A N/A N/A N/A Up to 0�65%
Sub-Fund Class D Class K Class C Class RCFederated Hermes Global Emerging Markets Equity Fund
N/A Up to 0�70% N/A N/A
Federated Hermes Global Equity Fund N/A N/A N/A N/AFederated Hermes European Alpha Equity Fund N/A N/A N/A N/AFederated Hermes Global High Yield Credit Fund N/A N/A N/A N/AFederated Hermes Europe ex-UK Equity Fund N/A N/A N/A N/AFederated Hermes US SMID Equity Fund N/A N/A N/A N/AFederated Hermes Asia ex-Japan Equity Fund N/A N/A Up to 1�10% Up to 2�20%Federated Hermes Global Equity ESG Fund Up to 0�55% N/A N/A N/AFederated Hermes Multi-Strategy Credit Fund N/A N/A N/A N/AFederated Hermes Global Small Cap Equity Fund N/A N/A N/A N/AFederated Hermes Absolute Return Credit Fund*** N/A N/A N/A N/AFederated Hermes SDG Engagement Equity Fund N/A N/A N/A N/AFederated Hermes Impact Opportunities Equity Fund** N/A N/A N/A N/AFederated Hermes Unconstrained Credit Fund N/A N/A N/A N/AFederated Hermes Global Emerging Markets SMID Equity Fund
N/A N/A N/A N/A
Federated Hermes SDG Engagement High Yield Credit Fund
N/A N/A N/A N/A
Federated Hermes US High Yield Credit Fund N/A N/A N/A N/A
*Shareholders in these Classes will be subject to the above fees with regard to their investment in the sub-fund based on the Client Agreement between them and the Investment Manager� Per this agreement, these fees are charged outside of the sub-funds�
**The investment Manager fees on Federated Hermes Impact Opportunities Equity Fund were discounted by 50% for 8 months from 12 December 2019 to 31 August 2020�
***The Investment Manager fees on Federated Hermes Absolute Return Credit Fund were reduced on 26 June 2020� The prior fees were as follows:
Sub-Fund Class Z* Class T* Class F Class R Class MFederated Hermes Absolute Return Credit Fund*** Up to 3% Up to 1% Up to 0�55% Up to 1�10% Up to 0�30%Sub-Fund Class A Class BFederated Hermes Absolute Return Credit Fund*** Up to 0�55% Up to 1�05%
Investment Manager fees of £81,368,832 (2019: £78,309,111) were charged during the financial year and fees of £15,062,786 (2019: £7,245,356) were payable at year end�
5. Fees and Other Expenses (continued)
(a) Investment Management Fees (continued)

281
Federated Hermes Investment Funds Public Limited CompanyNotes to the Financial Statements for the financial year ended 31 December 2020 (continued)
5% of the Investment Management fee is retained by Hermes Fund Managers Ireland Limited�
(b) Advisory Fees (voting and engagement services)
The fee payable to the Advisor on all Share Classes is 0�008% per annum calculated on the value of the sub-fund at the Commencement Date and each quarter thereafter, payable quarterly in arrears commencing on the Commencement Date� VAT will be added where appropriate�
The fees for these services are paid by Hermes Investment Management Limited on the behalf of the Company� There were no Advisory fees charged during the year (2019: £Nil) and no fees (2019: £Nil) were payable at year end�
(c) Administration Fees
The Company has engaged the services of Northern Trust International Fund Administration Services (Ireland) Limited, an indirect wholly-owned subsidiary of Northern Trust Corporation, to provide administration services for a fee�
In respect of the Federated Hermes Global High Yield Credit Fund, the Federated Hermes Multi-Strategy Credit Fund, the Federated Hermes Absolute Return Credit Fund, the Federated Hermes Unconstrained Credit Fund, the Federated Hermes SDG Engagement High Yield Credit Fund and the Federated Hermes US High Yield Credit Fund the Administrator is entitled to an annual fee (plus any applicable value added tax) of:
• 0.05% of the Net Asset Value on each of the sub-fund(s) on the first £300,000,000;• 0�03% of the Net Asset Value on each of the sub-fund(s) on £300,000,000 to £700,000,000;• 0�0225% of the Net Asset Value of the relevant sub-fund for any amounts in excess of £700,000,000�
In respect of the Federated Hermes Global Emerging Markets Equity Fund, the Federated Hermes Global Equity ESG Fund, the Federated Hermes Global Equity Fund, the Federated Hermes European Alpha Equity Fund, the Federated Hermes Europe ex-UK Equity Fund, the Federated Hermes US SMID Equity Fund, the Federated Hermes Asia ex-Japan Equity Fund, the Federated Hermes Global Small Cap Equity Fund, the Hermes SDG Engagement Equity Fund, the Hermes Impact Opportunities Equity Fund and the Hermes Global Emerging Markets SMID Equity Fund the Administrator is entitled to an annual fee (plus any applicable value added tax) of:
• 0.04% of the Net Asset Value on each of the sub-fund(s) on the first £300,000,000;• 0�02% of the Net Asset Value on each of the sub-fund(s) on £300,000,000 to £500,000,000;• 0�0125% of the Net Asset Value of the relevant sub-fund(s) for any amounts in excess of £700,000,000�
Administration fees of £2,572,648 (2019: £2,373,784) were charged during the financial year and fees of £493,421 (2019: £422,361) were payable at year end�
(d) Depositary and Sub-Custodian Fees
Northern Trust Fiduciary Services (Ireland) Limited acts as a Depositary of the Company� The Depositary is a Private Limited Company incorporated in Ireland on 5 July 1990 and is an indirect wholly-owned subsidiary of Northern Trust Corporation�
The Depositary is entitled to an annual fee (plus any applicable value added tax) of:
• 0.0110% of the Net Asset Value of the relevant sub-fund on the first £500,000,000;• 0�0075% of the Net Asset Value of the relevant sub-fund on £500,000,000 to £700,000,000;• 0�0060% of the Net Asset Value of the relevant sub-fund for any amounts in excess of £700,000,000�
In addition, the Depositary and any relevant Sub-Custodian shall be entitled to recover safekeeping and transaction charges as set out in the Depositary Agreement�
Depositary fees of £879,451 (2019: £815,457) were charged during the financial year and fees of £166,910 (2019: £144,084) were payable at year end�
5. Fees and Other Expenses (continued)
(a) Investment Management Fees (continued)

282
Federated Hermes Investment Funds Public Limited CompanyNotes to the Financial Statements for the financial year ended 31 December 2020 (continued)
Sub-Custody fees of £2,945,607 (2019: £3,008,118) were charged during the financial year and fees of £467,169 (2019: £485,148) were payable at year end�
(e) Directors’ Fees
The Company shall pay to the Directors such annual fees for acting as Directors of the Company as the Directors may from time to time agree, provided however that the annual fees of each Director shall not exceed €50,000 without the approval of the Board of Directors� Directors’ fees will total not more than €110,000 on a per annum basis� No other remuneration will be payable by the Company to the Directors except for out-of-pocket expenses reasonably incurred by them� Joseph Kagan, Ian Kennedy, Carol Mahon and Gregory Dulski are not entitled to receive Director’s fees from the Company�
Directors fees of £68,619 (2019: £76,477) were charged during the financial year and fees of £Nil were payable at year end (2019: £Nil)�
(f) Director Support Services
Director Support Services fees of €Nil (2019: €11,052) were charged during the year and fees of €Nil were payable at year end (2019: €Nil)�
(g) Remuneration For Audit, Audit Related And Non Audit Work
Deloitte Ireland LLP, as statutory auditors, received €108,150 + VAT (2019: €91,100 + VAT) in relation to the audit of the Company’s Financial Statements� There were no other assurance, tax advisory or non audit services provided by the statutory auditors during 2020 or 2019�
(h) Other Fees and Expenses
In addition, each sub-fund will pay the costs and expenses incurred in its operation, including, without limitation, stamp duties, taxes, the fees and expenses of the auditors, listing fees, legal expenses, the costs of printing and distributing reports, accounts and any Prospectus, any costs incurred as a result of a change in law or the introduction of any new law (including any costs incurred as a result of compliance with any applicable code, whether or not having the force of law)�
All fees and expenses will be charged to the sub-fund in respect of which they were incurred, or where an expense is not considered by the Directors to be attributable to any one sub-fund, the expense will normally be allocated to classes of all sub-funds pro rata to the Net Asset Value of the relevant sub-funds� Details of each of the fees payable at the year end in respect of each sub-fund are disclosed in the Balance Sheet on pages 218 to 223� Details of each of the fees incurred at the year end in respect of each sub-fund are disclosed in the Income Statement on pages 229 to 233�
(i) Transaction Costs
Transaction costs are incremental costs that are directly attributable to the acquisition, issue or disposal of a financial asset or financial liability. An incremental cost is one that would not have been incurred if the entity had not acquired, issued or disposed of the financial instrument. Transaction costs for the year of £10,973,670 (2019: £10,771,242) are expensed in the Income Statement as part of the net fair value gain/loss on financial assets and liabilities at fair value through profit or loss. Only transaction costs which are separately identifiable are disclosed. These include identifiable brokerage charges and commissions, identifiable transaction related taxes and other market charges and separately identifiable transaction costs related to Financial Derivative Instruments�
6. Related Party Disclosures
Parties are considered to be related if one party has the ability to control the other party or exercise significant influence over the other party in making financial or operational decisions.
5. Fees and Other Expenses (continued)
(d) Depositary and Sub-Custodian Fees (continued)

283
Federated Hermes Investment Funds Public Limited CompanyNotes to the Financial Statements for the financial year ended 31 December 2020 (continued)
(a) Investment Management
The Company has appointed Hermes Fund Managers Ireland Limited as Manager� The Manager has delegated the investment management of the Company to Hermes Investment Management Limited who also acts as distributor of the Company� The Investment Manager is a wholly-owned subsidiary of Hermes Fund Managers Limited, which is 60% owned by Federated Hermes, Inc�
The Investment Manager was incorporated under the laws of England and Wales and was established on 1 February 1990� The investment management fee rates for each of the sub-funds are disclosed in note 5�
Two of the Directors of the Company who served during the financial year, Joseph Kagan and Ian Kennedy, are employees of Hermes Fund Managers Limited� Carol Mahon is an employee of Hermes Fund Managers Ireland Limited� Gregory Dulski is an employee of Federated Hermes, Inc�
At 31 December 2020, the Manager and its associates held the following shares in the Sub-Funds:
Sub-Fund SharesFederated Hermes Global Emerging Markets Equity Fund 403,669 Federated Hermes Global Equity Fund 70,056 Federated Hermes European Alpha Equity Fund 323,950 Federated Hermes Global High Yield Credit Fund 611,556 Federated Hermes Europe ex-UK Equity Fund 5,434 Federated Hermes US SMID Equity Fund 72,836 Federated Hermes Asia ex-Japan Equity Fund 2,654,215 Federated Hermes Global Equity ESG Fund 947,783 Federated Hermes Multi-Strategy Credit Fund 453,931 Federated Hermes Global Small Cap Equity Fund 737,096 Federated Hermes Absolute Return Credit Fund 7,473 Federated Hermes SDG Engagement Equity Fund 1,240,330 Federated Hermes Impact Opportunities Equity Fund 735,330 Federated Hermes Unconstrained Credit Fund 1,311,262 Federated Hermes Global Emerging Markets SMID Equity Fund 245,255 Federated Hermes SDG Engagement High Yield Credit Fund 16,506 Federated Hermes US High Yield Credit Fund 1,505,000
As at 31 December 2020, Federated Investors, Inc� held 1,950,000 shares in Federated Hermes US High Yield Credit Fund�
(b) Advisor
Hermes Fund Managers Limited has appointed EOS at Federated Hermes as Advisor to provide voting and engagement services� The Advisor is a wholly-owned subsidiary of Hermes Fund Managers Limited, which is 60% owned by Federated Hermes, Inc� The fees for these services are being paid by Hermes Investment Management Limited on the behalf of the Company�
The Advisory fees rate for each of the sub-funds is disclosed in note 5 (b)�
(c) Directors Fees
Please see note 5(e) above for details of the Directors fees, the amounts charged for the financial year and the amounts payable at the financial year end.
(d) Director Support Services
Please see note 5(f) above for details of the Director Support Services fees, the amounts charged for the financial year and the amounts payable at the financial year end.
6. Related Party Disclosures (continued)

284
Federated Hermes Investment Funds Public Limited CompanyNotes to the Financial Statements for the financial year ended 31 December 2020 (continued)
7. Share Capital
On incorporation the authorised share capital of the Company was £1,000,000 divided into 1,000,000 Subscriber Shares of a par value of £1 each and 500,000,000,000 shares of no par value initially designated as participating shares�
Each sub-fund may issue Class F, P, R, or Z Shares, each of them Distributing or Accumulating shares, in one of the following currencies: Sterling, Euro, US Dollars, Swiss Franc, Swedish Krona, Norwegian Krone, Danish Krone, Hong Kong Dollar and Singapore Dollar�
All sub-funds may issue Class F, R and Z Hedged Shares, each of them Distributing or Accumulating shares, in Sterling, Euro, US Dollar, Swiss Franc, Swedish Krona, Norwegian Krone, Danish Krone, Hong Kong Dollar and Singapore Dollar� A hedged share class removes almost all of the currency risk between the base currency of the sub-fund and the investor subscription currency�
Federated Hermes Global Equity ESG Fund and Federated Hermes SDG Engagement Equity Fund may issue Class F and R Portfolio Hedged Shares each of them Distributing or Accumulating shares in Sterling, Euro, US Dollar, Swiss Franc, Swedish Krona, Norwegian Krone, Danish Krone, Hong Kong Dollar and Singapore Dollar� Federated Hermes SDG Engagement Equity Fund may also issue Class Z Portfolio Hedged Shares in each of the above currencies�
All sub-funds may issue Class T Shares and Class T Hedged Shares, each of them Distributing or Accumulating shares, in Sterling, Euro and US Dollar�
Federated Hermes European Alpha Equity Fund, Federated Hermes Europe ex-UK Equity Fund and Federated Hermes Global High Yield Credit Fund may issue Class M Shares, each of them Distributing or Accumulating shares� Class M Shares are available in Sterling, Euro and US Dollars but hedged only in Sterling and US Dollar� In addition, Federated Hermes European Alpha Equity Fund may issue Class S Shares, each of them Distributing or Accumulating shares� Class S Shares are available in Sterling, Euro and US Dollars but hedged only in Sterling and US Dollar�
Federated Hermes Global Emerging Markets Equity Fund may issue Class F, Class G and Class J Shares, each of them Distributing or Accumulating shares� Class F Shares are available in Euro, US Dollar, Swiss Franc, Swedish Krona, Norwegian Krone, Danish Krone, Hong Kong Dollar and Singapore Dollar with hedged shares available in all the above currencies with the exception of US Dollar� Class G Shares are available in Euro, US Dollar, Swiss Franc, Swedish Krona, Norwegian Krone, Danish Krone, Hong Kong Dollar and Singapore Dollar with hedged shares available in all the above currencies with the exception of US Dollar� Class J Shares are available in Sterling, Euro, US Dollar, Swiss Franc, Swedish Krona and Singapore Dollars with hedged shares available in all the above currencies with the exception of US Dollar� Class K and B shares are available in US Dollar in Accumulating shares and Class A shares are available in US Dollar in Distributing shares�
Federated Hermes Global Equity Fund may issue Class A and Class B, each of them Distributing or Accumulating shares� Class A Shares are available in Sterling, Euro, US Dollar, Swiss Franc, Swedish Krona, Norwegian Krone, Danish Krone, Hong Kong Dollar and Singapore Dollar with hedged shares available in all the above currencies with the exception of US Dollar�
Federated Hermes Asia ex-Japan Equity Fund may issue Class C and Class RC Shares, each of them Distributing or Accumulating shares� Class C Shares are available in Sterling, Euro, US Dollar, Swiss Franc, Swedish Krona, Norwegian Krone, Danish Krone, Hong Kong Dollar and Singapore Dollar with hedged shares available in all the above currencies� Class RC Shares are available in Euro, US Dollar, Swiss Franc, Swedish Krona, Norwegian Krone, Danish Krone, Hong Kong Dollar and Singapore Dollar with hedged shares available in all the above currencies�
Federated Hermes Global Small Cap Equity Fund, Federated Hermes SDG Engagement Equity Fund, Federated Hermes Impact Opportunities Equity Fund, Federated Hermes Unconstrained Credit Fund and Federated Hermes Global Emerging Market SMID Equity Fund may issue Class X Shares, each of them Distributing or Accumulating shares� Class X Shares are available in Sterling, Euro, US Dollar, Swiss Franc, Swedish Krona, Norwegian Krone, Danish Krone, Hong Kong Dollar and Singapore Dollar with hedged shares available in all the above currencies with the exception of US Dollar� Federated Hermes SDG Engagement Equity Fund and Federated Hermes Impact Opportunities Equity Fund may also issue Class X Portfolio Hedged Shares in the above currencies�

285
Federated Hermes Investment Funds Public Limited CompanyNotes to the Financial Statements for the financial year ended 31 December 2020 (continued)
Federated Hermes Multi-Strategy Credit Fund and Federated Hermes US SMID Equity Fund may issue Class L Shares, each of them Distributing or Accumulating shares� Class L Shares are available in Sterling, Euro, US Dollar, Swiss Franc, Swedish Krona, Norwegian Krone, Danish Krone, Hong Kong Dollar and Singapore Dollar with hedged shares available in all the above currencies with the exception of US Dollar�
Federated Hermes SDG Engagement Equity Fund and Federated Hermes SDG Engagement High Yield Credit Fund may issue Class W Shares, each of them Distributing or Accumulating shares� Class W Shares are available in Euro, US Dollar, Swiss Franc, Swedish Krona, Norwegian Krone, Danish Krone, Hong Kong Dollar and Singapore Dollar with hedged shares available in all the above currencies with the exception of US Dollar� Portfolio Hedged Shares are available in all of the above currencies�
Federated Hermes SDG Engagement High Yield Credit Fund may issue Class Y Shares, each of them Distributing or Accumulating shares� Class W Shares are available in Euro, US Dollar, Swiss Franc, Swedish Krona, Norwegian Krone, Danish Krone, Hong Kong Dollar and Singapore Dollar with hedged shares available in all the above currencies with the exception of US Dollar�
Federated Hermes US High Yield Credit Fund may issue Class F Shares, each of them Distributing or Accumulating shares� Class R Shares, Class X Shares and Class Z are available in Euro, US Dollar, Swiss Franc, Swedish Krona, Norwegian Krone, Danish Krone, Hong Kong Dollar and Singapore Dollar with hedged shares available in all the above currencies with the exception of US Dollar�
Accumulating Share Classes are not intended to distribute dividends to Shareholders� The income and other profits will be accumulated and reinvested on behalf of Shareholders. Dividends, if paid, may be paid out of the net income of each sub-fund including interest and dividends earned by the sub-fund less expenses of the sub-fund�
Distributing Share Classes are intended to declare dividends on the Shares of the Distributing Classes of the sub-fund out of the net income of the sub-fund including interest and dividends earned by the sub-fund less expenses of the sub-fund� Dividends will be declared twice yearly and paid within two months of the date on which they have been declared�
The holders of Shares are entitled to one vote per whole Share and to such dividends as the Directors may from time to time declare�
In respect of Class Z Shares, the Minimum Subscription, Minimum Holding and Minimum Redemption will be as agreed in the Client Agreement� In respect of Class F Shares, the Minimum Subscription and Minimum Holding amounts are each £100,000 (or its foreign currency equivalent)� In respect of Class R shares, the Minimum Subscription and Minimum Holding amounts are each €1,000 (or its foreign currency equivalent)� In respect of Class T shares, the Minimum Subscription and Minimum Holding amounts are each £1,000 (or its foreign currency equivalent)�
In respect of Class M shares, the Minimum Subscription and Minimum Holding amounts are each €200,000,000 (or its foreign currency equivalent)� In respect of Class S shares, the Minimum Subscription and Minimum Holding amounts are each £50,000,000 (or its foreign currency equivalent)�
In respect of Class C shares, the Minimum Subscription and Minimum Holding amounts are each £100,000 (or its foreign currency equivalent)� In respect of Class RC shares, the Minimum Subscription and Minimum Holding amounts are each €1,000 (or its foreign currency equivalent)�
In respect of Class G shares, the Minimum Subscription and Minimum Holding amounts are each €1,000 (or its foreign currency equivalent)� In respect of Class J shares, the Minimum Subscription and Minimum Holding amounts are each £100,000,000 (or its foreign currency equivalent)�
In respect of Class X shares, the Minimum Subscription and Minimum Holding amounts are each £10,000,000 (or its foreign currency equivalent)�
In respect of Class L shares, the Minimum Subscription and Minimum Holding amounts are each £100,000,000 (or its foreign currency equivalent)� In respect of Class W shares, the Minimum Subscription and Minimum Holding amounts are each £10,000,000 (or its foreign currency equivalent)�
7. Share Capital (continued)

286
Federated Hermes Investment Funds Public Limited CompanyNotes to the Financial Statements for the financial year ended 31 December 2020 (continued)
In respect of Class B shares, the Minimum Subscription and Minimum Holding amounts are each €1,000 (or its foreign currency equivalent)� In respect of Class K shares, the Minimum Subscription and Minimum Holding amounts are each £100,000,000 (or its foreign currency equivalent)�
In respect of Class A shares, the Minimum Subscription and Minimum Holding amounts are each £100,000 (or its foreign currency equivalent)�
In respect of Class Y shares, the Minimum Subscription and Minimum Holding amounts are each £10,000,000 (or its foreign currency equivalent)�
In respect of Class P shares, the Minimum Subscription and Minimum Holding amounts are each €1,000 (or its foreign currency equivalent)�
The Company has the power to redeem the remaining holding of any Shareholder who redeems his Minimum Holding of Shares to below the Minimum Holding or its foreign currency equivalent�
Every Shareholder will have the right to require the Company to redeem his Shares in the sub-fund on any Dealing Day (save during any period when the calculation of the Net Asset Value is suspended in the circumstances set out in the Prospectus) on furnishing to the Administrator a redemption request� All redemption requests are dealt with on a forward pricing basis, i�e� by reference to the price for Shares calculated at the Valuation Point on the relevant Dealing Day� The request for redemption of Shares must be received before 9�30 am (Irish time) on the relevant Dealing Day�
All the Shares of the sub-fund may be redeemed at the discretion of the Directors if, after the first anniversary of the first issue of Shares of the sub-fund, the Net Asset Value of the sub-fund falls below £250,000,000 for any period of time�
7. Share Capital (continued)

287
Federated Hermes Investment Funds Public Limited CompanyNotes to the Financial Statements for the financial year ended 31 December 2020 (continued)
The movement in the number of redeemable participating shares during the financial year ended 31 December 2020 was as follows:
Federated Hermes Global Emerging Markets Equity Fund Class
Opening Shares Subscriptions Redemptions
Closing Shares
A2 USD Distributing 500 – – 500Z GBP Accumulating 290 – (290) –R EUR Accumulating 29,790,918 9,169,415 (10,008,989) 28,951,344T GBP Accumulating 1,094,360 351,409 (186,700) 1,259,069F GBP Accumulating 150,739,818 73,257,609 (92,636,038) 131,361,389F USD Accumulating 547,139,083 173,406,308 (243,350,846) 477,194,545K USD Accumulating 403,346 1,529,117 (477,289) 1,455,174B USD Accumulating 500 – – 500F GBP Accumulating Hedged 11,224,034 11,941,069 (7,623,831) 15,541,272J CHF Accumulating Hedged 807,870 2,662,639 (177,562) 3,292,947F EUR Accumulating 232,383,599 66,523,211 (112,704,993) 186,201,817R2 EUR Distributing 10,845,168 3,849,973 (4,123,406) 10,571,735R2 USD Distributing 2,055,731 983,848 (345,016) 2,694,563F2 GBP Distributing 57,509,131 38,983,692 (34,250,288) 62,242,535R2 EUR Distributing Hedged 852,299 1,482,612 (350,819) 1,984,092R USD Accumulating 37,708,175 28,406,382 (25,316,123) 40,798,434F EUR Accumulating Hedged 9,668,220 4,431,798 (5,597,911) 8,502,107F2 USD Distributing 20,927,663 4,867,990 (2,784,420) 23,011,233G USD Accumulating 62,450,620 18,368,023 (16,254,561) 64,564,082G EUR Accumulating 27,692 – (27,692) –F2 EUR Distributing 62,066,594 7,661,729 (6,680,003) 63,048,320Z USD Accumulating 18,332,037 2,844,130 (7,179,299) 13,996,868J EUR Accumulating 78,829,345 101,523,080 (37,686,594) 142,665,831J GBP Accumulating 85,971,259 62,552,381 (30,938,412) 117,585,228J USD Accumulating 68,220,937 40,567,033 (19,917,698) 88,870,272J2 EUR Distributing 25,160,540 11,687,580 (4,959,285) 31,888,835J2 GBP Distributing 179,259,365 107,714,851 (28,805,074) 258,169,142J2 USD Distributing 13,569,620 14,445,885 (3,684,750) 24,330,755J EUR Accumulating Hedged 3,839,436 5,587,055 (2,979,708) 6,446,783J GBP Accumulating Hedged 9,278,537 4,126,370 (3,257,853) 10,147,054J2 EUR Distributing Hedged 65,797 18,911 (50,050) 34,658J2 GBP Distributing Hedged 8,989,537 5,026,541 (973,907) 13,042,171F CHF Accumulating 5,082,953 3,313,537 (1,590,686) 6,805,804F SGD Accumulating 130,685 24,145 – 154,830F2 SGD Distributing 333 – (333) –R SGD Accumulating 324,477 334,344 (217,609) 441,212R2 SGD Distributing 333 – (333) –F CHF Accumulating Hedged 840,498 1,271,302 (500,846) 1,610,954J SGD Accumulating 333 191,636 (73,608) 118,361F2 GBP Distributing Hedged 22,500 740,638 (69,760) 693,378F2 EUR Distributing Hedged – 10,614 – 10,614
7. Share Capital (continued)

288
Federated Hermes Investment Funds Public Limited CompanyNotes to the Financial Statements for the financial year ended 31 December 2020 (continued)
Federated Hermes Global Equity Fund Class
Opening Shares Subscriptions Redemptions
Closing Shares
Z GBP Accumulating 999 – (999) –R EUR Accumulating 23,063 70,611 (4,324) 89,350T GBP Accumulating 765,391 49,984 (337,792) 477,583F GBP Accumulating 474,433 71,578 (78,787) 467,224F USD Accumulating 445,500 1 – 445,501F2 GBP Distributing 16,775 6,344 (2,553) 20,566F EUR Accumulating 2,566,250 232,700 (275,526) 2,523,424F2 EUR Distributing 500 – (500) –R USD Accumulating 3,665 – – 3,665R SGD Accumulating 323 – (323) –A2 USD Distributing 1,929,128 5,599,013 (97,985) 7,430,156B2 USD Distributing 500 – – 500
Federated Hermes European Alpha Equity Fund Class
Opening Shares Subscriptions Redemptions
Closing Shares
Z GBP Accumulating 441 – (441) –R EUR Accumulating 3,577,453 83,064 (910,993) 2,749,524T GBP Accumulating 464,051 133,307 (84,258) 513,100Z EUR Accumulating 6,450,764 1,113,975 (155,215) 7,409,524F GBP Accumulating 1,288,998 190,467 (1,207,219) 272,246F EUR Accumulating 861,326 101,065 (716,534) 245,857F2 GBP Distributing 23,196 2,844 (2,565) 23,475R GBP Accumulating 940 – (940) –F2 EUR Distributing 1,800,083 – (1,364,086) 435,997S2 EUR Distributing 504 – (504) –F2 USD Distributing 182,495 – (182,495) –S2 GBP Distributing 374,466 – (137,141) 237,325S2 USD Distributing 284,757 – – 284,757S USD Accumulating Hedged 965,467 – (451,153) 514,314S EUR Accumulating 2,826,379 1,006,486 (2,638,256) 1,194,609S2 GBP Distributing Hedged 696,980 – (181,771) 515,209R USD Accumulating Hedged 684,203 – (236,382) 447,821S GBP Accumulating 2,009,934 – (260,242) 1,749,692R CHF Accumulating Hedged 49,230 – (20,630) 28,600S2 USD Distributing Hedged 29,967 – – 29,967S GBP Accumulating Hedged 1,740,309 – (561,398) 1,178,911S USD Accumulating 41,655 – – 41,655M EUR Accumulating 27,125,350 6,268,188 (22,259,655) 11,133,883M2 EUR Distributing 189,225 – (7,566) 181,659R USD Accumulating 28,112 – – 28,112R CHF Accumulating 499 – (499) –R2 EUR Distributing 25,307 – – 25,307
7. Share Capital (continued)

289
Federated Hermes Investment Funds Public Limited CompanyNotes to the Financial Statements for the financial year ended 31 December 2020 (continued)
Federated Hermes Global High Yield Credit Fund Class
Opening Shares Subscriptions Redemptions
Closing Shares
Z GBP Accumulating 567 – (567) –R EUR Accumulating 12,070 5,088,109 (244,854) 4,855,325F GBP Accumulating 408,881 520,112 (327,489) 601,504F EUR Accumulating 10,402,678 25,476,646 (8,620,728) 27,258,596F GBP Accumulating Hedged 5,947,260 4,231,460 (4,848,274) 5,330,446F2 GBP Distributing Hedged 479,510 776,310 (542,895) 712,925F2 USD Distributing Hedged 28,150 3,038,708 – 3,066,858F USD Accumulating Hedged 488,764 2,124,171 (739,097) 1,873,838T GBP Accumulating 738 – – 738T GBP Accumulating Hedged 127,682 474,493 – 602,175R USD Accumulating 500 – (500) –R2 EUR Distributing 4,023,526 1,403,696 (682,710) 4,744,512R GBP Accumulating 1,000 – (1,000) –R USD Accumulating Hedged 500 69,843 – 70,343F2 EUR Distributing 143,051 29,285 (145,830) 26,506F CHF Accumulating Hedged 5,491,622 13,628,893 (5,599,390) 13,521,125M GBP Accumulating Hedged 13,880,458 8,188,479 (6,212,404) 15,856,533M USD Accumulating Hedged 258,927 290,638 (38,184) 511,381M2 GBP Distributing Hedged 39,015,996 95,180,869 (26,552,349) 107,644,516M EUR Accumulating – 500 – 500M2 EUR Distributing – 500 – 500M3 EUR Distributing – 500 – 500M4 EUR Distributing – 500 – 500B USD Accumulating – 500 – 500L3 AUD Distributing Hedged – 19,867,783 (228,865) 19,638,918A2 USD Distributing Hedged – 500 – 500B2 USD Distributing Hedged – 500 – 500
Federated Hermes Europe ex-UK Equity Fund Class
Opening Shares Subscriptions Redemptions
Closing Shares
Z GBP Accumulating 418 – (418) –R EUR Accumulating 88,364 8,603 (86,580) 10,387R GBP Accumulating 13,157 – – 13,157F GBP Accumulating 7,337,760 1,065,800 (7,081,834) 1,321,726F EUR Accumulating 86,243 1,696,039 (1,466,487) 315,795F2 GBP Distributing Hedged 635,844 282,319 (736,998) 181,165F2 USD Distributing Hedged 500 – (500) –F2 EUR Distributing 591,570 68,500 (659,570) 500F2 GBP Distributing 26,499 287,091 (1,081) 312,509M GBP Accumulating 99,864,160 3,489,234 (89,835,374) 13,518,020M GBP Accumulating Hedged 1,000 – (1,000) –M2 GBP Distributing 1,166,988 12,947,151 (13,285,234) 828,905M2 GBP Distributing Hedged 11,532,209 339,574 (11,834,649) 37,134M2 EUR Distributing 974,814 199,212 (1,173,526) 500M2 USD Distributing Hedged 500 – (500) –
7. Share Capital (continued)

290
Federated Hermes Investment Funds Public Limited CompanyNotes to the Financial Statements for the financial year ended 31 December 2020 (continued)
Federated Hermes US SMID Equity Fund Class
Opening Shares Subscriptions Redemptions
Closing Shares
Z GBP Accumulating 31,540,523 – – 31,540,523F GBP Accumulating 24,374,443 9,389,347 (23,164,301) 10,599,489R EUR Accumulating 3,642,548 12,532,967 (16,036,110) 139,405F USD Accumulating 61,246,407 6,834,679 (19,067,167) 49,013,919T GBP Accumulating 537,357 111,091 (245,908) 402,540F2 GBP Distributing 27,093,456 8,731,550 (16,921,198) 18,903,808F2 USD Distributing 6,217,603 489,954 (5,478,800) 1,228,757F EUR Accumulating 10,089,056 8,488,170 (10,010,706) 8,566,520F2 EUR Distributing 878,146 16,474,626 (16,889,496) 463,276F EUR Accumulating Hedged 621,781 5,414,677 (970,725) 5,065,733F GBP Accumulating Hedged 13,880,179 10,711,774 (15,963,391) 8,628,562F2 GBP Distributing Hedged 5,145,334 1,120,504 (5,503,203) 762,635R CHF Accumulating Hedged 112,662 3,000 (13,081) 102,581R EUR Accumulating Hedged 123,076 802,847 (86,811) 839,112R USD Accumulating 3,026,902 42,976,416 (42,722,164) 3,281,154F CHF Accumulating Hedged 1,145,798 86,349 (277,385) 954,762F2 CHF Distributing Hedged 12,162 – – 12,162F SGD Accumulating 333 – (333) –R SGD Accumulating 333 – (333) –L GBP Accumulating 68,648,763 18,400,503 (76,892,934) 10,156,332L USD Accumulating 21,074,141 1,423,379 (14,838,997) 7,658,523L2 GBP Distributing 42,651,961 27,276,752 (14,233,741) 55,694,972L2 GBP Distributing Hedged 10,289,959 2,074,522 (5,728,650) 6,635,831L2 USD Distributing 52,402,934 15,032,072 (19,680,591) 47,754,415R GBP Accumulating 1,000 – (1,000) –A2 USD Distributing 500 – – 500B2 USD Distributing 500 – – 500L EUR Accumulating 500 – – 500L EUR Accumulating Hedged 500 – – 500F2 EUR Distributing Hedged 500 218,661 – 219,161L GBP Accumulating Hedged – 4,875,252 (2,010) 4,873,242B USD Accumulating – 500 – 500P USD Accumulating – 500 – 500X EUR Accumulating Hedged – 70,906 – 70,906
Federated Hermes Asia ex-Japan Equity Fund Class
Opening Shares Subscriptions Redemptions
Closing Shares
Z GBP Accumulating 652 – (652) –F GBP Accumulating 160,283,479 26,258,857 (102,597,447) 83,944,889R EUR Accumulating 3,828,512 1,021,470 (3,335,066) 1,514,916T GBP Accumulating 1,817,308 1,363,931 (29,650) 3,151,589F EUR Accumulating 129,764,133 6,035,858 (37,612,093) 98,187,898F2 EUR Distributing 10,219,971 3,137,694 (6,006,276) 7,351,389F2 GBP Distributing 273,247,988 71,754,084 (152,998,166) 192,003,906F USD Accumulating 286,445,804 41,148,980 (165,063,432) 162,531,352R USD Accumulating 16,489,057 560,926 (5,760,422) 11,289,561F EUR Accumulating Hedged 6,984,545 544,383 (2,772,822) 4,756,106F2 GBP Distributing Hedged 13,046,147 1,263,148 (3,204,928) 11,104,367A USD Accumulating – 500 – 500R CHF Accumulating Hedged 2,690,944 57,348 (1,198,169) 1,550,123R EUR Accumulating Hedged 2,451,014 38,236 (449,925) 2,039,325F GBP Accumulating Hedged 8,880,315 765,014 (6,454,628) 3,190,701F2 USD Distributing 19,097,483 4,341,014 (12,957,043) 10,481,454C USD Accumulating 22,218,491 1,192,665 (22,585,510) 825,646RC USD Accumulating 260,699 – (201,707) 58,992B USD Accumulating – 500 – 500C EUR Accumulating 40,900,559 2,134,208 (3,646,590) 39,388,177C2 EUR Distributing 491 – (491) –C2 GBP Distributing 1,342,676 142,524 (1,128,805) 356,395
7. Share Capital (continued)

291
Federated Hermes Investment Funds Public Limited CompanyNotes to the Financial Statements for the financial year ended 31 December 2020 (continued)
Federated Hermes Asia ex-Japan Equity Fund Class
Opening Shares Subscriptions Redemptions
Closing Shares
C2 USD Distributing 495 – (495) –C GBP Accumulating 25,306,174 1,634,440 (10,573,416) 16,367,198RC EUR Accumulating 500 – (500) –C SGD Accumulating 333 – (333) –F2 EUR Distributing Hedged 802,042 165,708 (596,333) 371,417F CHF Accumulating Hedged 1,485,080 177,879 (679,012) 983,947F CHF Accumulating 117,617 27,306 – 144,923
Federated Hermes Global Equity ESG Fund Class
Opening Shares Subscriptions Redemptions
Closing Shares
Z USD Accumulating 406 – (406) –F GBP Accumulating 18,756,419 18,649,183 (9,597,833) 27,807,769F USD Accumulating 11,158,903 5,453,651 (4,858,464) 11,754,090F EUR Accumulating 7,010,388 740,471 (220,515) 7,530,344R EUR Accumulating 3,344,509 28,935,239 (31,247,000) 1,032,748T GBP Accumulating 570,853 394,890 – 965,743F NOK Accumulating 500 – – 500R NOK Accumulating 118,380,429 4,104,297 (4,403,307) 118,081,419F EUR Accumulating Hedged 287,296 1,028,494 (51,344) 1,264,446R EUR Accumulating Hedged 31,940 175,491 (7,300) 200,131F CHF Accumulating Hedged 470,316 88,081 (345,202) 213,195R CHF Accumulating Hedged 34,366 21,814 – 56,180R USD Accumulating 144,372 207,963 (47,129) 305,206F2 CHF Distributing Hedged 67,532 – (67,032) 500F CHF Accumulating Portfolio Hedged 53,075,300 49,843,507 (8,891,110) 94,027,697F EUR Accumulating Portfolio Hedged 46,546,931 64,359,231 (15,062,587) 95,843,575F USD Accumulating Portfolio Hedged 70,965,317 70,906,826 (18,897,152) 122,974,991F2 CHF Distributing Portfolio Hedged 2,916,500 736,500 (231,300) 3,421,700F2 EUR Distributing Portfolio Hedged 500 – (500) –F2 USD Distributing Portfolio Hedged 111,100 54,200 (1,000) 164,300F GBP Accumulating Portfolio Hedged 9,636,961 34,619,197 (8,676,098) 35,580,060F2 CHF Distributing 2,062,700 131,000 (183,200) 2,010,500D NOK Accumulating 4,384,433 59,691 (5,846) 4,438,278A2 USD Distributing 500 – – 500B2 USD Distributing 500 – – 500J CHF Accumulating Hedged – 157,474 – 157,474J CHF Accumulating Portfolio Hedged – 500 – 500J EUR Accumulating – 128,569 – 128,569J EUR Accumulating Hedged – 500 – 500J EUR Accumulating Portfolio Hedged – 500 – 500J GBP Accumulating – 949,228 – 949,228J GBP Accumulating Portfolio Hedged – 310,264 – 310,264J USD Accumulating – 94,113 – 94,113J USD Accumulating Portfolio Hedged – 500 – 500J2 CHF Distributing – 500 – 500J2 CHF Distributing Hedged – 25,572 – 25,572J2 CHF Distributing Portfolio Hedged – 500 – 500J2 EUR Distributing Portfolio Hedged – 500 – 500J2 USD Distributing Portfolio Hedged – 500 – 500
7. Share Capital (continued)

292
Federated Hermes Investment Funds Public Limited CompanyNotes to the Financial Statements for the financial year ended 31 December 2020 (continued)
Federated Hermes Multi-Strategy Credit Fund Class
Opening Shares Subscriptions Redemptions
Closing Shares
Z USD Accumulating 428 – (428) –F EUR Accumulating 203,530 143,421 (232,586) 114,365F GBP Accumulating Hedged 168,323,661 15,226,963 (65,885,335) 117,665,289F USD Accumulating 6,677,141 1,445,488 (4,685,893) 3,436,736F2 GBP Distributing Hedged 241,617,331 66,480,426 (168,458,492) 139,639,265F EUR Accumulating Hedged 56,164,362 15,877,015 (53,156,343) 18,885,034R EUR Accumulating 39,371 24,302 (52,897) 10,776R EUR Accumulating Hedged 218,260 – (57,509) 160,751F2 GBP Distributing 1,014,778 469,152 (726,310) 757,620F2 USD Distributing 2,932,161 540,040 (627,130) 2,845,071F GBP Accumulating 599,900 362,206 (477,674) 484,432T GBP Accumulating Hedged 209,356 236,041 – 445,397R USD Accumulating 163,181 22,200 (120,500) 64,881F2 EUR Distributing 377,731 183,734 (137,089) 424,376R2 EUR Distributing 161,795 19,575 (118,699) 62,671F2 EUR Distributing Hedged 10,595,673 5,785,981 (4,285,109) 12,096,545R2 EUR Distributing Hedged 500 – (500) –L GBP Accumulating 1,000 – (1,000) –L GBP Accumulating Hedged 1,000 – (1,000) –L2 GBP Distributing 4,413,449 433,057 (1,320,247) 3,526,259L2 GBP Distributing Hedged 89,880,064 9,849,822 (62,123,557) 37,606,329R CHF Accumulating Hedged 28,000 – (27,500) 500R2 SGD Distributing Hedged 333 – (333) –F CHF Accumulating Hedged 8,684,560 524,518 (9,019,056) 190,022Z2 EUR Distributing Hedged 14,981,773 – – 14,981,773A2 USD Distributing 500 – – 500B2 USD Distributing 500 – – 500L2 EUR Distributing Hedged – 500 (500) –L2 USD Distributing – 5,972,456 (500) 5,971,956F NOK Accumulating Hedged – 529,453 (288,962) 240,491B2 USD Accumulating – 500 – 500
Federated Hermes Global Small Cap Equity Fund Class
Opening Shares Subscriptions Redemptions
Closing Shares
F EUR Accumulating 20,500 500 (20,500) 500F GBP Accumulating 112,069 46,009 (71,590) 86,488F USD Accumulating 34,073 – – 34,073Z USD Accumulating 500 – (500) –T GBP Accumulating 314,543 418,762 – 733,305F2 GBP Distributing 13,180,637 103,895 (17,101) 13,267,431X USD Accumulating 500 – (500) –X EUR Accumulating 16,710,503 21,040,001 (4,400,000) 33,350,504R USD Accumulating 502 – (502) –A2 USD Distributing – 500 – 500B2 USD Distributing – 500 – 500
7. Share Capital (continued)

293
Federated Hermes Investment Funds Public Limited CompanyNotes to the Financial Statements for the financial year ended 31 December 2020 (continued)
Federated Hermes Absolute Return Credit Fund Class
Opening Shares Subscriptions Redemptions
Closing Shares
F CHF Accumulating Hedged 500 – (500) –F EUR Accumulating 174,500 – (174,500) –F EUR Accumulating Hedged 138,564 1,024,188 (308,219) 854,533F GBP Accumulating 431,520 124,797 (413,017) 143,300F GBP Accumulating Hedged 33,994,040 12,912,318 (36,053,334) 10,853,024F USD Accumulating 2,145,447 180,518 (2,086,077) 239,888F2 EUR Distributing Hedged 500 – (500) –F2 USD Distributing 500 – (500) –R EUR Accumulating Hedged 500 – (500) –Z USD Accumulating 500 – (500) –F2 GBP Distributing 2,852,572 7,087 (2,851,132) 8,527F2 GBP Distributing Hedged 18,145,896 2,922,797 (14,261,464) 6,807,229T GBP Accumulating 973 – – 973M EUR Accumulating Hedged 19,234,943 4,103,874 (23,338,317) 500M GBP Accumulating Hedged 542,124 213,822,608 (5,048,479) 209,316,253M USD Accumulating 500 2,019,925 (1,084,810) 935,615A2 USD Distributing – 500 – 500B2 USD Distributing – 500 – 500B USD Accumulating – 500 – 500
Federated Hermes SDG Engagement Equity Fund Class
Opening Shares Subscriptions Redemptions
Closing Shares
A2 USD Distributing 500 – – 500B USD Accumulating 500 – – 500F EUR Accumulating 18,609 7,328,921 (3,000) 7,344,530F GBP Accumulating 191,234 146,986 (15,998) 322,222F USD Accumulating 476,496 73,046 (475,996) 73,546W CHF Accumulating Portfolio Hedged 190,464 – (75,690) 114,774W EUR Accumulating Portfolio Hedged 596,580 – (206,123) 390,457W USD Accumulating Portfolio Hedged 408,861 – (248,171) 160,690W2 CHF Distributing Portfolio Hedged 25,836 – (15,367) 10,469W2 EUR Distributing Portfolio Hedged 500 – – 500W2 USD Distributing Portfolio Hedged 500 – – 500X CHF Accumulating Portfolio Hedged 77,020,032 107,121,278 (33,814,055) 150,327,255X EUR Accumulating 1,053,239 263,193 (133,760) 1,182,672X EUR Accumulating Portfolio Hedged 63,413,307 112,799,654 (32,020,247) 144,192,714X GBP Accumulating 673,132 155,680 (44,334) 784,478X GBP Accumulating Portfolio Hedged 12,825,304 47,463,985 (6,409,273) 53,880,016X USD Accumulating 1,428,326 1,026,249 (768,322) 1,686,253X USD Accumulating Portfolio Hedged 82,604,407 114,830,052 (21,933,281) 175,501,178X2 CHF Distributing Portfolio Hedged 4,385,176 1,889,783 (1,171,160) 5,103,799X2 EUR Distributing Portfolio Hedged 286,095 22,100 (27,500) 280,695X2 GBP Distributing Portfolio Hedged 449,618 1,995,747 (220,092) 2,225,273X2 USD Distributing Portfolio Hedged 376,945 162,152 (118,800) 420,297F CHF Accumulating Portfolio Hedged 500 – – 500F EUR Accumulating Portfolio Hedged 360,500 – – 360,500F GBP Accumulating Portfolio Hedged 1,000 – – 1,000F USD Accumulating Portfolio Hedged 3,001,895 28,564,402 (30,136,414) 1,429,883F2 CHF Distributing Portfolio Hedged 500 – – 500F2 EUR Distributing Portfolio Hedged 500 – – 500F2 GBP Distributing Portfolio Hedged 1,000 – – 1,000F2 USD Distributing Portfolio Hedged 500 – – 500R CHF Accumulating Portfolio Hedged 453,907 133,158 (269,156) 317,909R EUR Accumulating Portfolio Hedged 761,531 483,488 (400,381) 844,638R USD Accumulating Portfolio Hedged 724,425 361,300 (294,951) 790,774R2 CHF Distributing Portfolio Hedged 40,509 13,990 – 54,499R2 EUR Distributing Portfolio Hedged 47,500 – – 47,500R2 USD Distributing Portfolio Hedged 8,500 71,698 – 80,198T GBP Accumulating 490,712 728,164 – 1,218,876
7. Share Capital (continued)

294
Federated Hermes Investment Funds Public Limited CompanyNotes to the Financial Statements for the financial year ended 31 December 2020 (continued)
Federated Hermes SDG Engagement Equity Fund Class
Opening Shares Subscriptions Redemptions
Closing Shares
X2 CHF Distributing 2,410,900 686,200 (395,000) 2,702,100S GBP Accumulating 1,000 2,169,877 (1,824,889) 345,988
Federated Hermes Impact Opportunities Equity Fund Class
Opening Shares Subscriptions Redemptions
Closing Shares
F EUR Accumulating 8,178,998 11,970,966 (6,210,083) 13,939,881F GBP Accumulating 23,193,717 25,616,917 (17,264,804) 31,545,830F USD Accumulating 4,560,793 3,498,495 (1,816,031) 6,243,257X EUR Accumulating 52,149,258 12,254,706 (1,823,176) 62,580,788X GBP Accumulating 10,370,717 12,737,148 (2,438,900) 20,668,965X USD Accumulating 1,019,189 3,428 (4) 1,022,613F2 EUR Distributing 500 73,230 – 73,730R EUR Accumulating 471,666 1,684,660 (434,455) 1,721,871R USD Accumulating 840,178 3,709,997 (178,488) 4,371,687T GBP Accumulating 388,609 440,343 – 828,952X GBP Accumulating Hedged 1,000 – – 1,000F GBP Accumulating Hedged 1,000 – – 1,000F EUR Accumulating Hedged 500 353,793 (39,097) 315,196A2 USD Distributing – 500 – 500B2 USD Distributing – 500 – 500
Federated Hermes Unconstrained Credit Fund Class
Opening Shares Subscriptions Redemptions
Closing Shares
B2 USD Distributing 500 – – 500F EUR Accumulating Hedged 954,031 9,472,636 (2,665,930) 7,760,737F GBP Accumulating Hedged 52,023,098 25,380,031 (17,711,027) 59,692,102F USD Accumulating 83,500 1,724,725 (615,204) 1,193,021F2 GBP Distributing Hedged 5,523,432 16,128,731 (5,529,191) 16,122,972F2 USD Distributing 258,200 167,500 (35,000) 390,700R EUR Accumulating Hedged 500 51,000 – 51,500X GBP Accumulating Hedged 238,800,131 75,645,435 (41,878,210) 272,567,356X USD Accumulating 914 104,000 (414) 104,500X2 GBP Distributing Hedged 36,150,437 12,373,751 (10,628,596) 37,895,592X2 USD Distributing 5,343,475 2,469,779 (2,812,988) 5,000,266F CHF Accumulating Hedged 500 14,140 – 14,640F2 EUR Distributing 500 791,490 (6,990) 785,000R2 EUR Distributing Hedged 500 – – 500X CHF Accumulating Hedged 500 – (500) –X EUR Accumulating Hedged 1,577,344 1,255,000 (453,752) 2,378,592X2 CHF Distributing Hedged 500 – – 500X2 EUR Distributing 500 90,439 (45,500) 45,439X2 EUR Distributing Hedged 5,365,100 155,945 (3,599,265) 1,921,780X2 CHF Distributing 500 – – 500T GBP Accumulating 682,831 685,226 – 1,368,057F2 EUR Distributing Hedged 500 – – 500A2 USD Distributing 500 – – 500L3 EUR Distributing Hedged – 1,744,923 (66,645) 1,678,278L3 GBP Distributing Hedged – 84,324,924 (656,132) 83,668,792L3 USD Distributing – 1,081,961 – 1,081,961B USD Accumulating – 500 – 500L EUR Accumulating Hedged – 500 – 500R EUR Accumulating – 500 – 500
7. Share Capital (continued)

295
Federated Hermes Investment Funds Public Limited CompanyNotes to the Financial Statements for the financial year ended 31 December 2020 (continued)
Federated Hermes Global Emerging Markets SMID Equity Fund Class
Opening Shares Subscriptions Redemptions
Closing Shares
F EUR Accumulating 500 – (500) –F GBP Accumulating 844,502 1,351,652 (1,540,937) 655,217F USD Accumulating 500 500 – 1,000X EUR Accumulating 47,058,050 24,939,165 (5,400,140) 66,597,075X GBP Accumulating 15,580,164 6,593,490 (5,936,035) 16,237,619X USD Accumulating 4,753,701 90,300 (738,040) 4,105,961X2 USD Distributing 3,640,877 12,368 – 3,653,245Z2 USD Distributing 500 3,223,239 (450,089) 2,773,650A2 USD Distributing – 500 – 500B2 USD Distributing – 500 – 500T GBP Accumulating – 241,559 – 241,559B USD Accumulating – 500 – 500
Federated Hermes SDG Engagement High Yield Credit Fund Class
Opening Shares Subscriptions Redemptions
Closing Shares
F GBP Accumulating Hedged 1,000 – – 1,000F USD Accumulating 500 1,196,675 (1,119,582) 77,593R EUR Accumulating Hedged 500 – – 500R USD Accumulating 500 – – 500W CHF Accumulating Hedged 28,450 244,105 (177,931) 94,624W EUR Accumulating Hedged 757,890 3,087,451 (164,273) 3,681,068W GBP Accumulating Hedged 1,000 6,000 – 7,000W2 CHF Distributing Hedged 500 330,700 – 331,200W USD Accumulating 547,190 1,155,711 (3,750) 1,699,151Y GBP Accumulating Hedged 3,792,983 16,357,625 (2,887,347) 17,263,261Y CHF Accumulating Hedged 35,924,703 29,006,516 (5,413,698) 59,517,521Y EUR Accumulating Hedged 33,100,911 44,820,171 (8,427,036) 69,494,046Y2 CHF Distributing Hedged 5,003,032 1,810,782 (334,469) 6,479,345Y USD Accumulating 37,918,920 54,131,160 (6,769,439) 85,280,641W2 USD Distributing 500 1,020,996 (384,125) 637,371Y2 USD Distributing 20,560 2,088,702 (166,312) 1,942,950A2 USD Distributing – 500 – 500B2 USD Distributing – 500 – 500F EUR Accumulating Hedged – 11,397,299 (388,636) 11,008,663T GBP Accumulating – 2,002 – 2,002F CHF Accumulating – 500 – 500F CHF Accumulating Hedged – 102,500 – 102,500B USD Accumulating – 500 – 500M USD Accumulating – 13,013,680 – 13,013,680F2 EUR Distributing Hedged – 500 – 500F2 USD Distributing – 500 – 500M EUR Accumulating – 974,185 – 974,185M2 GBP Distributing Hedged – 1,000 – 1,000
Federated Hermes US High Yield Credit Fund Class
Opening Shares Subscriptions Redemptions
Closing Shares
F GBP Accumulating – 1,000 – 1,000F USD Accumulating – 500 – 500F2 USD Distributing – 500 – 500R USD Accumulating – 500 – 500X2 EUR Distributing – 500 – 500X2 GBP Distributing Hedged – 1,000 – 1,000Z USD Accumulating – 3,450,000 – 3,450,000A2 USD Distributing – 500 – 500B2 USD Distributing – 500 – 500
7. Share Capital (continued)

296
Federated Hermes Investment Funds Public Limited CompanyNotes to the Financial Statements for the financial year ended 31 December 2020 (continued)
The movement in the number of redeemable participating shares during the financial year ended 31 December 2019 was as follows:
Federated Hermes Global Emerging Markets Equity Fund Class
Opening Shares Subscriptions Redemptions
Closing Shares
A2 USD Distributing – 500 – 500Z GBP Accumulating 290 – – 290R EUR Accumulating 29,195,496 10,962,198 (10,366,776) 29,790,918T GBP Accumulating 933,549 284,236 (123,425) 1,094,360F GBP Accumulating 142,318,155 78,185,990 (69,764,327) 150,739,818F USD Accumulating 463,936,931 222,113,005 (138,910,853) 547,139,083K USD Accumulating – 431,479 (28,133) 403,346J CHF Accumulating Hedged – 807,870 – 807,870F EUR Accumulating 172,337,578 129,405,660 (69,359,639) 232,383,599R2 EUR Distributing 12,821,517 2,803,110 (4,779,459) 10,845,168R2 USD Distributing 2,053,175 461,365 (458,809) 2,055,731F2 GBP Distributing 86,131,204 70,292,481 (98,914,554) 57,509,131R2 EUR Distributing Hedged 1,442,869 457,391 (1,047,961) 852,299R USD Accumulating 20,507,510 34,529,708 (17,329,043) 37,708,175F EUR Accumulating Hedged 28,414,084 8,239,249 (26,985,113) 9,668,220F2 USD Distributing 23,518,121 11,467,514 (14,057,972) 20,927,663G USD Accumulating 71,130,002 33,064,465 (41,743,847) 62,450,620G EUR Accumulating 27,692 – – 27,692F2 EUR Distributing 51,587,060 17,031,020 (6,551,486) 62,066,594Z USD Accumulating 6,717,185 11,614,852 – 18,332,037J EUR Accumulating 37,747,389 59,035,774 (17,953,818) 78,829,345J GBP Accumulating 29,521,293 73,520,129 (17,070,163) 85,971,259J USD Accumulating 51,895,917 28,954,819 (12,629,799) 68,220,937J2 EUR Distributing 16,343,277 10,600,154 (1,782,891) 25,160,540J2 GBP Distributing 86,488,979 138,060,784 (45,290,398) 179,259,365J2 USD Distributing 1,388,847 14,934,037 (2,753,264) 13,569,620J EUR Accumulating Hedged 4,931,007 1,639,943 (2,731,514) 3,839,436J GBP Accumulating Hedged 5,337,853 5,642,808 (1,702,124) 9,278,537J2 EUR Distributing Hedged 55,550 10,247 – 65,797J2 GBP Distributing Hedged 7,741,188 3,064,124 (1,815,775) 8,989,537F CHF Accumulating 4,968,812 1,306,460 (1,192,319) 5,082,953F SGD Accumulating 333 130,352 – 130,685F2 SGD Distributing 333 – – 333R SGD Accumulating 158,971 385,125 (219,619) 324,477R2 SGD Distributing 333 – – 333F CHF Accumulating Hedged 698,738 185,995 (44,235) 840,498J SGD Accumulating – 333 – 333F2 GBP Distributing Hedged – 22,500 – 22,500
Federated Hermes Global Equity Fund Class
Opening Shares Subscriptions Redemptions
Closing Shares
Z GBP Accumulating 999 – – 999R EUR Accumulating 228,333 638,893 (844,163) 23,063T GBP Accumulating 845,533 113,505 (193,647) 765,391F GBP Accumulating 1,006,640 53,266 (585,473) 474,433F USD Accumulating 12,339,722 225,768 (12,119,990) 445,500F2 GBP Distributing 2,717 55,624 (41,566) 16,775F EUR Accumulating 5,321,703 3,422,650 (6,178,103) 2,566,250F2 EUR Distributing 500 – – 500R USD Accumulating 3,665 – – 3,665R SGD Accumulating 323 – – 323A2 USD Distributing – 1,929,130 (2) 1,929,128B2 USD Distributing – 500 – 500
7. Share Capital (continued)

297
Federated Hermes Investment Funds Public Limited CompanyNotes to the Financial Statements for the financial year ended 31 December 2020 (continued)
Federated Hermes European Alpha Equity Fund Class
Opening Shares Subscriptions Redemptions
Closing Shares
Z GBP Accumulating 441 – – 441R EUR Accumulating 4,648,436 61,699 (1,132,682) 3,577,453T GBP Accumulating 326,788 187,112 (49,849) 464,051Z EUR Accumulating 8,053,299 – (1,602,535) 6,450,764F GBP Accumulating 850,865 499,227 (61,094) 1,288,998F EUR Accumulating 3,518,794 66,815 (2,724,283) 861,326F2 GBP Distributing 23,089 204 (97) 23,196R GBP Accumulating 940 – – 940F2 EUR Distributing 447,001 1,867,566 (514,484) 1,800,083S2 EUR Distributing 4,961 – (4,457) 504F2 USD Distributing 182,495 – – 182,495S2 GBP Distributing 992,870 – (618,404) 374,466S2 USD Distributing 284,757 – – 284,757S USD Accumulating Hedged 1,150,719 – (185,252) 965,467S EUR Accumulating 7,952,063 669,095 (5,794,779) 2,826,379S2 GBP Distributing Hedged 1,362,232 – (665,252) 696,980R USD Accumulating Hedged 1,248,120 – (563,917) 684,203S GBP Accumulating 2,127,659 – (117,725) 2,009,934R CHF Accumulating Hedged 124,200 – (74,970) 49,230S2 USD Distributing Hedged 174,120 – (144,153) 29,967S GBP Accumulating Hedged 2,930,077 – (1,189,768) 1,740,309S USD Accumulating 41,655 – – 41,655M EUR Accumulating 127,022,915 20,843,063 (120,740,628) 27,125,350M2 EUR Distributing 189,225 – – 189,225R USD Accumulating 28,112 – – 28,112R CHF Accumulating 499 – – 499R2 EUR Distributing 500 24,807 – 25,307
Federated Hermes Global High Yield Credit Fund Class
Opening Shares Subscriptions Redemptions
Closing Shares
Z GBP Accumulating 25,003,912 – (25,003,345) 567R EUR Accumulating 500 12,070 (500) 12,070F GBP Accumulating 624,210 189,473 (404,802) 408,881F EUR Accumulating 32,105,731 29,066,343 (50,769,396) 10,402,678F GBP Accumulating Hedged 18,990,651 22,007,377 (35,050,768) 5,947,260F2 GBP Distributing Hedged 391,562 9,612,025 (9,524,077) 479,510F2 USD Distributing Hedged 500 27,650 – 28,150F USD Accumulating Hedged 5,572,847 1,166,111 (6,250,194) 488,764T GBP Accumulating 738 – – 738T GBP Accumulating Hedged 876 126,806 – 127,682R USD Accumulating 500 – – 500R2 EUR Distributing 3,839,950 499,530 (315,954) 4,023,526R GBP Accumulating 1,000 – – 1,000R USD Accumulating Hedged 500 – – 500F2 EUR Distributing 479,458 138,372 (474,779) 143,051F CHF Accumulating Hedged 11,637,163 5,545,454 (11,690,995) 5,491,622M GBP Accumulating Hedged – 13,969,125 (88,667) 13,880,458M USD Accumulating Hedged – 259,320 (393) 258,927M2 GBP Distributing Hedged – 51,016,961 (12,000,965) 39,015,996
7. Share Capital (continued)

298
Federated Hermes Investment Funds Public Limited CompanyNotes to the Financial Statements for the financial year ended 31 December 2020 (continued)
Federated Hermes Europe ex-UK Equity Fund Class
Opening Shares Subscriptions Redemptions
Closing Shares
Z GBP Accumulating 418 – – 418R EUR Accumulating 185,024 12,768 (109,428) 88,364R GBP Accumulating 713 12,444 – 13,157F GBP Accumulating 2,044,455 11,127,470 (5,834,165) 7,337,760F EUR Accumulating 1,779,033 21,065 (1,713,855) 86,243F2 GBP Distributing Hedged 1,567,423 182,889 (1,114,468) 635,844F2 USD Distributing Hedged 71,829 – (71,329) 500F2 EUR Distributing 500 601,070 (10,000) 591,570F2 GBP Distributing 5,124 30,205 (8,830) 26,499M GBP Accumulating 142,308,702 31,263,575 (73,708,117) 99,864,160M GBP Accumulating Hedged 1,000 – – 1,000M2 GBP Distributing 13,110,528 1,193,231 (13,136,771) 1,166,988M2 GBP Distributing Hedged 1,000 11,645,128 (113,919) 11,532,209M2 EUR Distributing 1,115,603 343,456 (484,245) 974,814M2 USD Distributing Hedged 69,691 – (69,191) 500
Federated Hermes US SMID Equity Fund Class
Opening Shares Subscriptions Redemptions
Closing Shares
Z GBP Accumulating 31,540,523 – – 31,540,523F GBP Accumulating 27,279,110 5,738,499 (8,643,166) 24,374,443R EUR Accumulating 1,795,632 15,135,971 (13,289,055) 3,642,548F USD Accumulating 81,913,023 7,005,885 (27,672,501) 61,246,407T GBP Accumulating 583,344 45,313 (91,300) 537,357F2 GBP Distributing 27,538,619 5,631,399 (6,076,562) 27,093,456F2 USD Distributing 34,835,638 2,894,591 (31,512,626) 6,217,603F EUR Accumulating 10,823,262 3,293,198 (4,027,404) 10,089,056F2 EUR Distributing 253,924 13,536,609 (12,912,387) 878,146F EUR Accumulating Hedged 1,785,253 13,857 (1,177,329) 621,781F GBP Accumulating Hedged 9,864,424 6,651,209 (2,635,454) 13,880,179F2 GBP Distributing Hedged 4,752,110 6,529,870 (6,136,646) 5,145,334R CHF Accumulating Hedged 142,004 – (29,342) 112,662R EUR Accumulating Hedged 264,132 – (141,056) 123,076R USD Accumulating 1,473,428 29,025,381 (27,471,907) 3,026,902F CHF Accumulating Hedged 1,428,571 14,180 (296,953) 1,145,798F2 CHF Distributing Hedged 12,162 – – 12,162F SGD Accumulating 333 – – 333R SGD Accumulating 333 – – 333L GBP Accumulating 64,645,118 5,850,385 (1,846,740) 68,648,763L USD Accumulating 13,122,562 18,454,326 (10,502,747) 21,074,141L2 GBP Distributing 59,597,943 4,279,909 (21,225,891) 42,651,961L2 GBP Distributing Hedged 3,613,229 7,912,961 (1,236,231) 10,289,959L2 USD Distributing 1,083,630 54,345,086 (3,025,782) 52,402,934R GBP Accumulating 1,000 – – 1,000A2 USD Distributing – 500 – 500B2 USD Distributing – 500 – 500L EUR Accumulating – 500 – 500L EUR Accumulating Hedged – 500 – 500F2 EUR Distributing Hedged – 500 – 500
7. Share Capital (continued)

299
Federated Hermes Investment Funds Public Limited CompanyNotes to the Financial Statements for the financial year ended 31 December 2020 (continued)
Federated Hermes Asia ex-Japan Equity Fund Class
Opening Shares Subscriptions Redemptions
Closing Shares
Z GBP Accumulating 652 – – 652F GBP Accumulating 210,486,526 38,166,869 (88,369,916) 160,283,479R EUR Accumulating 2,190,927 3,867,942 (2,230,357) 3,828,512T GBP Accumulating 461,247 1,387,003 (30,942) 1,817,308F EUR Accumulating 138,622,052 3,731,318 (12,589,237) 129,764,133F2 EUR Distributing 16,204,376 1,067,505 (7,051,910) 10,219,971F2 GBP Distributing 266,047,141 65,602,836 (58,401,989) 273,247,988F USD Accumulating 328,036,204 20,780,474 (62,370,874) 286,445,804R USD Accumulating 20,294,056 2,366,597 (6,171,596) 16,489,057F EUR Accumulating Hedged 7,969,010 1,003,244 (1,987,709) 6,984,545F2 GBP Distributing Hedged 13,030,117 1,894,681 (1,878,651) 13,046,147R CHF Accumulating Hedged 3,081,859 397,920 (788,835) 2,690,944R EUR Accumulating Hedged 3,111,576 305,009 (965,571) 2,451,014F GBP Accumulating Hedged 6,953,166 3,281,494 (1,354,345) 8,880,315F2 USD Distributing 17,152,888 6,014,023 (4,069,428) 19,097,483C USD Accumulating 31,105,727 6,301,260 (15,188,496) 22,218,491RC USD Accumulating 265,291 75,000 (79,592) 260,699C EUR Accumulating 46,158,791 956,025 (6,214,257) 40,900,559C2 EUR Distributing 491 – – 491C2 GBP Distributing 1,173,366 439,647 (270,337) 1,342,676C2 USD Distributing 495 – – 495C GBP Accumulating 47,802,622 1,883,571 (24,380,019) 25,306,174RC EUR Accumulating 500 – – 500C SGD Accumulating 333 – – 333F2 EUR Distributing Hedged 514,821 347,924 (60,703) 802,042F CHF Accumulating Hedged 1,060,394 623,011 (198,325) 1,485,080F CHF Accumulating 77,523 40,094 – 117,617
Federated Hermes Global Equity ESG Fund Class
Opening Shares Subscriptions Redemptions
Closing Shares
Z USD Accumulating 406 – – 406F GBP Accumulating 10,205,276 10,873,530 (2,322,387) 18,756,419F USD Accumulating 6,181,076 6,990,449 (2,012,622) 11,158,903F EUR Accumulating 7,126,830 168,875 (285,317) 7,010,388R EUR Accumulating 59,521 24,863,796 (21,578,808) 3,344,509T GBP Accumulating 675 570,178 – 570,853F NOK Accumulating 500 – – 500R NOK Accumulating 29,530,689 96,889,396 (8,039,656) 118,380,429F EUR Accumulating Hedged 3,300 320,513 (36,517) 287,296R EUR Accumulating Hedged 500 31,440 – 31,940F CHF Accumulating Hedged 296,450 208,006 (34,140) 470,316R CHF Accumulating Hedged 25,366 9,000 – 34,366R USD Accumulating 362,317 131,522 (349,467) 144,372F2 CHF Distributing Hedged 33,500 34,032 – 67,532F CHF Accumulating Portfolio Hedged 40,983,063 28,981,916 (16,889,679) 53,075,300F EUR Accumulating Portfolio Hedged 11,350,491 44,634,177 (9,437,737) 46,546,931F USD Accumulating Portfolio Hedged 29,293,547 52,642,762 (10,970,992) 70,965,317F2 CHF Distributing Portfolio Hedged 4,173,700 417,400 (1,674,600) 2,916,500F2 EUR Distributing Portfolio Hedged 500 – – 500F2 USD Distributing Portfolio Hedged 500 138,500 (27,900) 111,100F GBP Accumulating Portfolio Hedged 2,818,440 7,478,480 (659,959) 9,636,961F2 CHF Distributing – 2,359,644 (296,944) 2,062,700D NOK Accumulating – 4,384,433 – 4,384,433A2 USD Distributing – 500 – 500B2 USD Distributing – 500 – 500
7. Share Capital (continued)

300
Federated Hermes Investment Funds Public Limited CompanyNotes to the Financial Statements for the financial year ended 31 December 2020 (continued)
Federated Hermes Multi-Strategy Credit Fund Class
Opening Shares Subscriptions Redemptions
Closing Shares
Z USD Accumulating 68,111,250 – (68,110,822) 428F EUR Accumulating 500 203,030 – 203,530F GBP Accumulating Hedged 177,313,846 19,059,589 (28,049,775) 168,323,660F USD Accumulating 9,298,622 1,210,365 (3,831,846) 6,677,141F2 GBP Distributing Hedged 252,649,618 10,041,902 (21,074,189) 241,617,331F EUR Accumulating Hedged 66,937,826 22,524,915 (33,298,379) 56,164,362R EUR Accumulating 32,302 10,695 (3,626) 39,371R EUR Accumulating Hedged 225,244 – (6,984) 218,260F2 GBP Distributing 1,254,942 855,974 (1,096,138) 1,014,778F2 USD Distributing 2,455,366 1,987,388 (1,510,593) 2,932,161F GBP Accumulating 422,786 580,436 (403,322) 599,900T GBP Accumulating Hedged 901 208,454 – 209,355R USD Accumulating 22,681 140,500 – 163,181F2 EUR Distributing 365,631 26,053 (13,953) 377,731R2 EUR Distributing 3,632 161,247 (3,084) 161,795F2 EUR Distributing Hedged 10,499,397 3,196,052 (3,099,777) 10,595,672R2 EUR Distributing Hedged 500 – – 500L GBP Accumulating 1,000 – – 1,000L GBP Accumulating Hedged 1,000 – – 1,000L2 GBP Distributing 7,236,342 1,062,437 (3,885,330) 4,413,449L2 GBP Distributing Hedged 79,550,066 24,374,115 (14,044,117) 89,880,064R CHF Accumulating Hedged 500 27,500 – 28,000R2 SGD Distributing Hedged 333 – – 333F CHF Accumulating Hedged 7,736,809 1,159,776 (212,025) 8,684,560Z2 EUR Distributing Hedged 14,981,773 – – 14,981,773A2 USD Distributing – 500 – 500B2 USD Distributing – 500 – 500
Federated Hermes Global Small Cap Equity Fund Class
Opening Shares Subscriptions Redemptions
Closing Shares
F EUR Accumulating 38,179 – (17,679) 20,500F GBP Accumulating 139,120 54,321 (81,372) 112,069F USD Accumulating 42,576 – (8,503) 34,073Z USD Accumulating 500 – – 500T GBP Accumulating 614 313,929 – 314,543F2 GBP Distributing 10,856,414 2,343,550 (19,327) 13,180,637X USD Accumulating 500 – – 500X EUR Accumulating 16,900,503 2,270,000 (2,460,000) 16,710,503R USD Accumulating 4,824 – (4,322) 502
Federated Hermes Absolute Return Credit Fund Class
Opening Shares Subscriptions Redemptions
Closing Shares
F CHF Accumulating Hedged 500 – – 500F EUR Accumulating 174,500 – – 174,500F EUR Accumulating Hedged 5,172,404 14,064 (5,047,904) 138,564F GBP Accumulating 248,719 471,142 (288,341) 431,520F GBP Accumulating Hedged 63,835,180 18,126,646 (47,967,786) 33,994,040F USD Accumulating 395,561 2,121,625 (371,739) 2,145,447F2 EUR Distributing Hedged 500 – – 500F2 USD Distributing 500 – – 500R EUR Accumulating Hedged 500 – – 500Z USD Accumulating 17,939,625 – (17,939,125) 500F2 GBP Distributing 1,714,124 1,163,330 (24,882) 2,852,572F2 GBP Distributing Hedged 22,761,030 1,068,700 (5,683,834) 18,145,896T GBP Accumulating 973 – – 973M EUR Accumulating Hedged – 19,234,943 – 19,234,943M GBP Accumulating Hedged – 542,124 – 542,124M USD Accumulating – 500 – 500
7. Share Capital (continued)

301
Federated Hermes Investment Funds Public Limited CompanyNotes to the Financial Statements for the financial year ended 31 December 2020 (continued)
Federated Hermes SDG Engagement Equity Fund Class
Opening Shares Subscriptions Redemptions
Closing Shares
A2 USD Distributing – 500 – 500B USD Accumulating – 500 – 500F EUR Accumulating 15,109 3,500 – 18,609F GBP Accumulating 1,000 193,682 (3,448) 191,234F USD Accumulating 500 475,996 – 476,496W CHF Accumulating Portfolio Hedged 204,664 – (14,200) 190,464W EUR Accumulating Portfolio Hedged 666,271 – (69,691) 596,580W USD Accumulating Portfolio Hedged 433,902 – (25,041) 408,861W2 CHF Distributing Portfolio Hedged 25,886 – (50) 25,836W2 EUR Distributing Portfolio Hedged 500 – – 500W2 USD Distributing Portfolio Hedged 200,500 – (200,000) 500X CHF Accumulating Portfolio Hedged 73,365,831 50,741,837 (47,087,636) 77,020,032X EUR Accumulating 649,668 525,246 (121,675) 1,053,239X EUR Accumulating Portfolio Hedged 22,231,885 61,645,747 (20,464,325) 63,413,307X GBP Accumulating 372,821 300,311 – 673,132X GBP Accumulating Portfolio Hedged 5,479,475 14,113,169 (6,767,340) 12,825,304X USD Accumulating 619,045 1,427,737 (618,456) 1,428,326X USD Accumulating Portfolio Hedged 55,147,083 65,302,542 (37,845,218) 82,604,407X2 CHF Distributing Portfolio Hedged 7,476,492 1,311,342 (4,402,658) 4,385,176X2 EUR Distributing Portfolio Hedged 73,500 275,595 (63,000) 286,095X2 GBP Distributing Portfolio Hedged 182,064 267,554 – 449,618X2 USD Distributing Portfolio Hedged 217,300 196,645 (37,000) 376,945F CHF Accumulating Portfolio Hedged 500 – – 500F EUR Accumulating Portfolio Hedged 500 360,000 – 360,500F GBP Accumulating Portfolio Hedged 1,000 – – 1,000F USD Accumulating Portfolio Hedged 996 14,246,229 (11,245,330) 3,001,895F2 CHF Distributing Portfolio Hedged 500 – – 500F2 EUR Distributing Portfolio Hedged 500 – – 500F2 GBP Distributing Portfolio Hedged 1,000 – – 1,000F2 USD Distributing Portfolio Hedged 500 – – 500R CHF Accumulating Portfolio Hedged 149,731 304,576 (400) 453,907R EUR Accumulating Portfolio Hedged 320,367 560,027 (118,863) 761,531R USD Accumulating Portfolio Hedged 835,594 549,722 (660,891) 724,425R2 CHF Distributing Portfolio Hedged 35,419 5,090 – 40,509R2 EUR Distributing Portfolio Hedged 37,500 10,000 – 47,500R2 USD Distributing Portfolio Hedged 8,500 – – 8,500T GBP Accumulating 1,000 489,712 – 490,712X2 CHF Distributing – 2,560,574 (149,674) 2,410,900S GBP Accumulating – 1,000 – 1,000
Federated Hermes Impact Opportunities Equity Fund Class
Opening Shares Subscriptions Redemptions
Closing Shares
F EUR Accumulating 1,373,789 9,847,188 (3,041,979) 8,178,998F GBP Accumulating 3,200,782 22,294,489 (2,301,554) 23,193,717F USD Accumulating 122,331 20,547,849 (16,109,388) 4,560,792X EUR Accumulating 69,465,621 571,422 (17,887,785) 52,149,258X GBP Accumulating 5,144,424 6,952,563 (1,726,271) 10,370,716X USD Accumulating 882,537 136,652 – 1,019,189F2 EUR Distributing 500 – – 500R EUR Accumulating 3,060,675 1,070,454 (3,659,463) 471,666R USD Accumulating 500 839,678 – 840,178T GBP Accumulating 1,000 387,609 – 388,609X GBP Accumulating Hedged – 1,000 – 1,000F GBP Accumulating Hedged – 1,000 – 1,000
7. Share Capital (continued)

302
Federated Hermes Investment Funds Public Limited CompanyNotes to the Financial Statements for the financial year ended 31 December 2020 (continued)
Federated Hermes Unconstrained Credit Fund Class
Opening Shares Subscriptions Redemptions
Closing Shares
B2 USD Distributing – 500 – 500F EUR Accumulating Hedged 500 1,020,817 (67,286) 954,031F GBP Accumulating Hedged 38,913,169 22,384,551 (9,274,622) 52,023,098F USD Accumulating 500 83,000 – 83,500F2 GBP Distributing Hedged 1,780,543 4,494,106 (751,217) 5,523,432F2 USD Distributing 23,500 234,700 – 258,200R EUR Accumulating Hedged 500 – – 500X GBP Accumulating Hedged 193,275,773 52,176,834 (6,652,476) 238,800,131X USD Accumulating 914 – – 914X2 GBP Distributing Hedged 26,880,948 13,670,904 (4,401,415) 36,150,437X2 USD Distributing 6,464,224 895,176 (2,015,925) 5,343,475F CHF Accumulating Hedged 500 – – 500F2 EUR Distributing 500 – – 500R2 EUR Distributing Hedged 500 – – 500X CHF Accumulating Hedged 500 – – 500X EUR Accumulating Hedged 905,403 951,941 (280,000) 1,577,344X2 CHF Distributing Hedged 500 – – 500X2 EUR Distributing 500 – – 500X2 EUR Distributing Hedged 10,382,417 1,197,341 (6,214,658) 5,365,100X2 CHF Distributing 500 – – 500T GBP Accumulating 1,000 681,831 – 682,831F2 EUR Distributing Hedged – 500 – 500A2 USD Distributing – 500 – 500
Federated Hermes Global Emerging Markets SMID Equity Fund Class
Opening Shares Subscriptions Redemptions
Closing Shares
F EUR Accumulating 500 – – 500F GBP Accumulating 1,000 919,577 (76,075) 844,502F USD Accumulating 500 – – 500X EUR Accumulating 14,295,240 33,308,540 (545,730) 47,058,050X GBP Accumulating 1,000 16,106,036 (526,872) 15,580,164X USD Accumulating 3,519,010 1,566,200 (331,509) 4,753,701X2 USD Distributing 5,058,307 2,238,998 (3,656,428) 3,640,877Z2 USD Distributing – 500 – 500
Federated Hermes SDG Engagement High Yield Credit Fund Class
Opening Shares Subscriptions Redemptions
Closing Shares
F GBP Accumulating Hedged – 1,000 – 1,000F USD Accumulating – 500 – 500R EUR Accumulating Hedged – 500 – 500R USD Accumulating – 500 – 500W CHF Accumulating Hedged – 28,450 – 28,450W EUR Accumulating Hedged – 757,890 – 757,890W GBP Accumulating Hedged – 1,000 – 1,000W2 CHF Distributing Hedged – 500 – 500W USD Accumulating – 547,190 – 547,190Y GBP Accumulating Hedged – 3,803,095 (10,112) 3,792,983Y CHF Accumulating Hedged – 36,369,003 (444,300) 35,924,703Y EUR Accumulating Hedged – 33,755,452 (654,541) 33,100,911Y2 CHF Distributing Hedged – 5,004,732 (1,700) 5,003,032Y USD Accumulating – 39,731,306 (1,812,386) 37,918,920W2 USD Distributing – 500 – 500Y2 USD Distributing – 20,560 – 20,560
7. Share Capital (continued)

303
Federated Hermes Investment Funds Public Limited CompanyNotes to the Financial Statements for the financial year ended 31 December 2020 (continued)
8. Financial Risk Management
Strategy in Using Financial Instruments
The sub-funds are exposed to a variety of financial risks in pursuing their stated investment objectives and policies. These risks are defined in IFRS 7 as including credit risk, liquidity risk and market risk (which in turn includes currency risk, interest rate risk and other price risk)� The sub-funds take exposure to certain of these risks to generate investment returns on their portfolios, although these risks can also potentially result in a reduction in the sub-fund’s net assets�
The Investment Manager will use its best endeavours to minimise the potentially adverse effects of these risks on the sub-funds’ performance where it can do so while still managing the investments of the sub-funds in ways that are consistent with each sub-fund’s investment objectives and policies�
The risks, and the measures adopted by the Company for managing these risks, are detailed below�
Market Price Risk
Market price risk is defined in IFRS 7 as the risk that the fair value of a financial instrument or its future cash flows will fluctuate because of changes in market prices.
The sub-funds’ assets consist principally of bonds, equities, P-notes, american depositary receipts, REITS, floating rate notes, futures, forward currency contracts, credit default swaps, swaptions, asset backed securities and warrants�
The values of these instruments are determined by market forces and there is accordingly a risk that market prices can change in a way that is adverse to a sub-funds’ performance�
The Company has adopted a number of investment restrictions which are set out in the individual sub-funds’ Supplements to the Company’s Prospectus and which limit the exposure of the sub-funds to adverse changes in the price of any individual financial asset.
In accordance with Company’s policy, the Investment Manager monitors the sub-funds’ positions on a regular basis and reports regularly to the Board of Directors� The Board reviews the information on each sub-funds’ overall market exposure provided by the Investment Manager at its periodic meetings�
In addition, the Investment Manager manages the exposure of the portfolios to the risk of adverse changes in the general level of market prices through adhering to its formal risk management process, which includes the use of systems and technology to monitor overall market and position risk on a regular basis�
The maximum risk arising from an investment in a financial instrument is determined by the fair value of the financial instruments, or in the case of certain derivatives the nominal value of the underlying assets, except for short positions in derivatives and securities where the loss may potentially be unlimited�
As at 31 December 2020 and 31 December 2019 the overall market exposure for each sub-fund is as shown in the Portfolio Statements, other than for derivatives where the exposure could be greater�
At 31 December 2020 and 31 December 2019, market price risks defined by IFRS 7 applying to each sub-fund are affected by two main components: changes in market prices and currency exchange rates� The sub-funds which hold bonds will be affected by a third component, bond interest rates� IFRS 7 requires a sensitivity analysis showing how the Net Asset Values of the sub-funds would be affected by changes in each of these factors�
Market price and currency exchange rate movements primarily affect the fair values of equity securities and related instruments held on account for each sub-fund�
For details of market price risk sensitivity analysis please refer to market price and sensitivity analysis on pages 331 to 330�

304
Federated Hermes Investment Funds Public Limited CompanyNotes to the Financial Statements for the financial year ended 31 December 2020 (continued)
Currency Risk
Currency risk is defined in IFRS 7 as the risk that the fair value or future cash flows of a financial instrument will fluctuate because of changes in foreign exchange rates. The sub-funds are exposed to currency risk as the assets and liabilities of the sub-funds may be denominated in a currency other than the functional currency of the relevant sub-funds�
The fluctuations in the rate of exchange between the currency in which the asset or liability is denominated and the functional currency could result in an appreciation or depreciation in the fair value of that asset� The Investment Manager may attempt to mitigate these risks through the use of financial derivative instruments.
In accordance with Company policy, the Investment Manager monitors the sub-funds’ currency exposure on a regular basis and reports regularly to the Board of Directors�
At 31 December 2020 each sub-fund’s currency exposure was as follows:
Federated Hermes Global Emerging Markets Equity FundNon-monetary Assets
$'000Monetary Assets
$'000Hedging
$'000Total $'000
Brazilian Real 328,711 – – 328,711British Pound 70,068 3,793 87,640 161,501Egyptian Pound 23,259 – – 23,259Euro (1) 9,160 59,013 68,172Hong Kong Dollar 1,461,465 – – 1,461,465Hungarian Forint 64,589 – – 64,589Indian Rupee 858,417 1,284 – 859,701Indonesian Rupiah 247,958 – – 247,958Korean Won 979,187 – – 979,187Mexican Peso 272,516 – – 272,516Singapore Dollar – 8 (8) –Swedish Krona 120,840 – – 120,840South African Rand 80,805 – – 80,805Swiss Franc – 59 14,623 14,682Taiwan Dollar 563,639 – – 563,639Turkish Lira 46,503 – – 46,503US Dollar 1,287,946 148,619 (158,181) 1,278,384Yuan Offshore 457,825 – – 457,825Yuan Renminbi – 9,593 – 9,593
6,873,320 162,923 3,087 7,039,330
Federated Hermes Global Equity FundNon-monetary Assets
$'000Monetary Assets
$'000Hedging
$'000Total $'000
Australian Dollar 605 – – 605British Pound 1,270 9 (2) 1,277Canadian Dollar 695 – – 695Danish Krone 415 (1) – 414Euro 3,709 6 – 3,715Hong Kong Dollar 489 – – 489Japanese Yen 2,867 – – 2,867Norwegian Krone 708 – – 708Singapore Dollar 237 – – 237Swedish Krona 725 – – 725Swiss Franc 1,317 – – 1,317US Dollar 23,743 66 2 23,811
36,780 80 – 36,860
8. Financial Risk Management (continued)

305
Federated Hermes Investment Funds Public Limited CompanyNotes to the Financial Statements for the financial year ended 31 December 2020 (continued)
Federated Hermes European Alpha Equity FundNon-monetary Assets
€'000Monetary Assets
€'000Hedging
€'000Total €'000
British Pound 11,660 – 2,840 14,500Danish Krone 7,374 – – 7,374Euro 59,905 632 (5,494) 55,043Norwegian Krone 3,581 – – 3,581Swedish Krona 6,025 – – 6,025Swiss Franc 9,104 – 76 9,180US Dollar – – 2,610 2,610
97,649 632 32 98,313
Federated Hermes Global High Yield Credit FundNon-monetary Assets
€'000Monetary Assets
€'000Hedging
€'000Total €'000
Australian Dollar – 85 39,373 39,458British Pound 33,850 630 118,891 153,371Danish Krone – 1 – 1Euro 101,396 6,842 (4,305) 103,933Norwegian Krone – 1 – 1Singapore Dollar – 1 – 1Swiss Franc – 254 26,735 26,989US Dollar 189,372 (2,090) (175,907) 11,375
324,618 5,724 4,787 335,129
Federated Hermes Europe ex-UK Equity FundNon-monetary Assets
€'000Monetary Assets
€'000Hedging
€'000Total €'000
British Pound – (4) 433 429Danish Krone 2,942 – – 2,942Euro 26,523 200 (425) 26,298Norwegian Krone 851 – – 851Swiss Franc 4,479 1 – 4,480
34,795 197 8 35,000
Federated Hermes US SMID Equity FundNon-monetary Assets
$'000Monetary Assets
$'000Hedging
$'000Total $'000
British Pound – (864) 40,806 39,942Euro – 10,120 15,014 25,134Swiss Franc – 28 3,295 3,323US Dollar 822,747 22,150 (57,818) 787,079
822,747 31,434 1,297 855,478
8. Financial Risk Management (continued)
Currency Risk (continued)

306
Federated Hermes Investment Funds Public Limited CompanyNotes to the Financial Statements for the financial year ended 31 December 2020 (continued)
Federated Hermes Asia ex-Japan Equity FundNon-monetary Assets
$'000Monetary Assets
$'000Hedging
$'000Total $'000
British Pound (1) (1,855) 32,226 30,370Euro – 150 27,242 27,392Hong Kong Dollar 742,870 – 1,288 744,158Indian Rupee 114,423 – – 114,423Japanese Yen 106,599 – – 106,599Korean Won 556,252 – – 556,252South African Rand 65,368 – – 65,368Swiss Franc – – 7,028 7,028Taiwan Dollar 488,476 1,823 – 490,299Thai Baht 83,711 – – 83,711US Dollar 168,227 11,781 (66,673) 113,335Vietnamese Dong 10,409 838 – 11,247Yuan Offshore 122,314 – – 122,314
2,458,648 12,737 1,111 2,472,496
Federated Hermes Global Equity ESG FundNon-monetary Assets
$'000Monetary Assets
$'000Hedging
$'000Total $'000
Australian Dollar 20,754 – (12,016) 8,738Brazilian Real 16,395 – – 16,395British Pound 37,494 3,205 35,955 76,654Danish Krone 26,064 – (14,964) 11,100Euro 131,250 5,575 212,129 348,954Hong Kong Dollar 73,403 – (42,050) 31,353Hungarian Forint 12,248 – (7,039) 5,209Indian Rupee 6,625 – – 6,625Indonesian Rupiah 9,531 – – 9,531Japanese Yen 90,401 – (51,830) 38,571Korean Won 62,878 – – 62,878Norwegian Krone 33,064 722 (20,001) 13,785Swedish Krona 42,806 – (24,605) 18,201Swiss Franc 63,082 737 229,347 293,166Taiwan Dollar 43,051 507 – 43,558US Dollar 923,682 13,319 (302,318) 634,683
1,592,728 24,065 2,608 1,619,401
Federated Hermes Multi-Strategy Credit FundNon-monetary Assets
$'000Monetary Assets
$'000Hedging
$'000Total $'000
Australian Dollar – 8 – 8British Pound 59,683 469 394,042 454,194Canadian Dollar – 42 – 42Danish Krone – 1 – 1Euro 92,461 2,903 28,802 124,166Norwegian Krone – 15 715 730Singapore Dollar – 3 – 3Swiss Franc – 63 455 518US Dollar 434,022 25,045 (414,096) 44,971
586,166 28,549 9,918 624,633
8. Financial Risk Management (continued)
Currency Risk (continued)

307
Federated Hermes Investment Funds Public Limited CompanyNotes to the Financial Statements for the financial year ended 31 December 2020 (continued)
Federated Hermes Global Small Cap Equity FundNon-monetary Assets
$'000Monetary Assets
$'000Hedging
$'000Total $'000
Australian Dollar 2,775 – – 2,775British Pound 11,911 – 1 11,912Canadian Dollar 4,493 – – 4,493Euro 21,243 – – 21,243Japanese Yen 15,691 – – 15,691Swedish Krona 4,877 – – 4,877Swiss Franc 2,408 – – 2,408US Dollar 65,906 2,417 – 68,323
129,304 2,417 1 131,722
Federated Hermes Absolute Return Credit FundNon-monetary Assets
$'000Monetary Assets
$'000Hedging
$'000Total $'000
Australian Dollar – 4 – 4British Pound 42,296 224 276,525 319,045Danish Krone – 1 – 1Euro 84,610 1,628 (79,893) 6,345Swiss Franc – 6 – 6US Dollar 180,847 9,156 (189,885) 118
307,753 11,019 6,747 325,519
Federated Hermes SDG Engagement Equity FundNon-monetary Assets
$'000Monetary Assets
$'000Hedging
$'000Total $'000
British Pound 52,981 3,312 27,717 84,010Euro 189,657 7,393 209,093 406,143Hong Kong Dollar 87,042 – (81,340) 5,702Indian Rupee 6,653 – – 6,653Japanese Yen 177,225 – (170,217) 7,008Singapore Dollar 27,410 – (26,489) 921Swedish Krona 27,595 – (26,639) 956Swiss Franc 28,932 1,345 358,857 389,134Taiwan Dollar 25,471 238 – 25,709US Dollar 680,585 19,636 (287,476) 412,746
1,303,551 31,924 3,506 1,338,982
Federated Hermes Impact Opportunities Equity FundNon-monetary Assets
$'000Monetary Assets
$'000Hedging
$'000Total $'000
Australian Dollar 27,241 – – 27,241British Pound 24,695 521 (516) 24,700Danish Krone 47,787 – 1,076 48,863Euro 106,085 501 396 106,982Indonesian Rupiah 8,643 – – 8,643Norwegian Krone 13,714 – – 13,714Swiss Franc 29,390 – 1 29,391US Dollar 183,255 8,260 (951) 190,564
440,810 9,282 6 450,098
8. Financial Risk Management (continued)
Currency Risk (continued)

308
Federated Hermes Investment Funds Public Limited CompanyNotes to the Financial Statements for the financial year ended 31 December 2020 (continued)
Federated Hermes Unconstrained Credit FundNon-monetary Assets
$'000Monetary Assets
$'000Hedging
$'000Total $'000
Australian Dollar – 8 – 8British Pound 93,120 (347) 665,173 757,946Euro 289,078 (3,005) (246,182) 39,891Norwegian Krone – 1 – 1Singapore Dollar – 6 – 6Swiss Franc – 5 40 45US Dollar 409,070 19,874 (403,093) 25,851
791,268 16,542 15,938 823,748
Federated Hermes Global Emerging Markets SMID Equity FundNon-monetary Assets
$'000Monetary Assets
$'000Hedging
$'000Total $'000
Brazilian Real 19,789 – – 19,789British Pound 2,908 693 (692) 2,909Chilean Peso 3,429 – 144 3,573Egyptian Pound 2,315 39 – 2,354Hong Kong Dollar 44,649 – – 44,649Hungarian Forint 3,011 – – 3,011Indian Rupee 45,680 577 – 46,257Korean Won 32,532 – – 32,532Mexican Peso 11,124 – 716 11,840Polish Zloty 1,037 – 144 1,181South African Rand 6,863 – 439 7,302Taiwan Dollar 63,291 423 – 63,714Turkish Lira 5,273 – 557 5,830US Dollar 24,881 7,634 (1,317) 31,198Yuan Offshore 12,581 – – 12,581
279,363 9,366 (9) 288,720
Federated Hermes SDG Engagement High Yield Credit FundNon-monetary Assets
$'000Monetary Assets
$'000Hedging
$'000Total $'000
Australian Dollar – 8 – 8British Pound 44,261 1,454 (20,703) 25,012Euro 205,686 5,202 9,047 219,935Swiss Franc – 420 159,113 159,533US Dollar 382,858 2,823 (147,812) 237,869
632,805 9,907 (355) 642,357
Federated Hermes US High Yield Credit FundNon-monetary Assets
$'000Monetary Assets
$'000Hedging
$'000Total $'000
British Pound – – 2 2US Dollar 7,161 152 (1) 7,312
7,161 152 1 7,314
Monetary Assets are cash and time deposits and Non-Monetary Assets are all other assets�
8. Financial Risk Management (continued)
Currency Risk (continued)

309
Federated Hermes Investment Funds Public Limited CompanyNotes to the Financial Statements for the financial year ended 31 December 2020 (continued)
As at 31 December 2019 the sub-funds’ currency exposure was as follows:
Federated Hermes Global Emerging Markets Equity FundNon-monetary Assets
$'000Monetary Assets
$'000Hedging
$'000Total $'000
Brazilian Real 488,663 – – 488,663British Pound 119,132 2,167 53,485 174,784Egyptian Pound 83,853 – – 83,853Euro – 1,040 42,922 43,962Hong Kong Dollar 1,063,959 – 2,265 1,066,224Hungarian Forint 105,256 – – 105,256Indian Rupee 721,276 39 – 721,315Indonesian Rupiah 166,000 – – 166,000Korean Won 626,299 – 1,929 628,228Mexican Peso 80,827 – – 80,827South African Rand 120,972 – – 120,972Swiss Franc – 73 3,559 3,632Taiwan Dollar 432,420 – – 432,420Turkish Lira 68,668 – – 68,668US Dollar 1,202,192 51,111 (103,339) 1,149,964Yuan Offshore 228,755 – – 228,755
5,508,272 54,430 821 5,563,523
Federated Hermes Global Equity FundNon-monetary Assets
$'000Monetary Assets
$'000Hedging
$'000Total $'000
Australian Dollar 372 – – 372British Pound 926 7 1 934Canadian Dollar 504 – – 504Danish Krone 251 – – 251Euro 2,115 5 4 2,124Hong Kong Dollar 329 – – 329Japanese Yen 1,492 – – 1,492Norwegian Krone 191 – – 191Singapore Dollar 150 – – 150Swedish Krona 325 – – 325Swiss Franc 969 – – 969US Dollar 12,879 133 (4) 13,008
20,503 145 1 20,649
Federated Hermes European Alpha Equity FundNon-monetary Assets
€'000Monetary Assets
€'000Hedging
€'000Total €'000
British Pound 21,519 – 4,010 25,529Danish Krone 7,829 – – 7,829Euro 95,447 1,429 (8,561) 88,315Norwegian Krone 6,458 – – 6,458Swedish Krona 6,896 – – 6,896Swiss Franc 10,856 – 122 10,978US Dollar 3,108 (2) 4,394 7,500
152,113 1,427 (35) 153,505
8. Financial Risk Management (continued)
Currency Risk (continued)

310
Federated Hermes Investment Funds Public Limited CompanyNotes to the Financial Statements for the financial year ended 31 December 2020 (continued)
Federated Hermes Global High Yield Credit FundNon-monetary Assets
€'000Monetary Assets
€'000Hedging
€'000Total €'000
British Pound 10,081 3,511 64,962 78,554Danish Krone – 1 – 1Euro 21,037 2,333 13,128 36,498Singapore Dollar – 2 – 2Swiss Franc – 334 10,473 10,807US Dollar 93,108 (3,173) (87,385) 2,550
124,226 3,008 1,178 128,412
Federated Hermes Europe ex-UK Equity FundNon-monetary Assets
€'000Monetary Assets
€'000Hedging
€'000Total €'000
British Pound – 132 19,339 19,471Canadian Dollar 4,789 – – 4,789Danish Krone 17,269 – – 17,269Euro 157,253 1,964 (19,341) 139,876Norwegian Krone 10,789 – – 10,789Swedish Krona 7,747 – – 7,747Swiss Franc 15,092 – – 15,092US Dollar – – 2 2
212,939 2,096 – 215,035
Federated Hermes US SMID Equity FundNon-monetary Assets
$'000Monetary Assets
$'000Hedging
$'000Total $'000
British Pound – 603 54,835 55,438Canadian Dollar 28,994 – – 28,994Euro – 243 2,388 2,631Swiss Franc – – 3,467 3,467US Dollar 1,012,475 26,759 (60,172) 979,062
1,041,469 27,605 518 1,069,592
Federated Hermes Asia ex-Japan Equity FundNon-monetary Assets
$'000Monetary Assets
$'000Hedging
$'000Total $'000
British Pound – 1,039 41,832 42,871Euro – (210) 34,023 33,813Hong Kong Dollar 1,059,288 – (2,286) 1,057,002Indian Rupee 66,561 – – 66,561Japanese Yen 91,528 – – 91,528Korean Won 527,857 – – 527,857Swiss Franc – (231) 10,343 10,112Taiwan Dollar 891,233 1,709 – 892,942Thai Baht 114,591 – – 114,591US Dollar 527,480 25,192 (83,152) 469,520Yuan Offshore 216,928 – – 216,928
3,495,466 27,499 760 3,523,725
8. Financial Risk Management (continued)
Currency Risk (continued)

311
Federated Hermes Investment Funds Public Limited CompanyNotes to the Financial Statements for the financial year ended 31 December 2020 (continued)
Federated Hermes Global Equity ESG FundNon-monetary Assets
$'000Monetary Assets
$'000Hedging
$'000Total $'000
Australian Dollar 13,997 – (6,014) 7,983Brazilian Real 6,284 – – 6,284British Pound 21,138 499 5,291 26,928Canadian Dollar 1,572 – (658) 914Danish Krone 17,485 – (7,460) 10,025Euro 96,956 793 70,960 168,709Hong Kong Dollar 40,263 – (17,121) 23,142Hungarian Forint 7,600 – (3,186) 4,414Indonesian Rupiah 4,165 – 684 4,849Japanese Yen 57,103 – (24,217) 32,886Korean Won 23,490 – 3,084 26,574Norwegian Krone 4,048 (79) (1,624) 2,345Swedish Krona 25,280 – (10,817) 14,463Swiss Franc 47,206 (81) 104,790 151,915Taiwan Dollar 19,940 526 – 20,466US Dollar 551,854 16,402 (112,297) 455,959
938,381 18,060 1,415 957,856
Federated Hermes Multi-Strategy Credit FundNon-monetary Assets
$'000Monetary Assets
$'000Hedging
$'000Total $'000
British Pound 146,369 4,987 577,627 728,983Canadian Dollar – 157 – 157Danish Krone – 1 – 1Euro 70,053 12,680 125,393 208,126Norwegian Krone – 1 – 1Singapore Dollar – 3 1 4Swiss Franc – 47 18,512 18,559US Dollar 699,689 43,884 (707,311) 36,262
916,111 61,760 14,222 992,093
Federated Hermes Global Small Cap Equity FundNon-monetary Assets
$'000Monetary Assets
$'000Hedging
$'000Total $'000
Australian Dollar 923 – – 923British Pound 6,477 – – 6,477Canadian Dollar 2,213 4 – 2,217Euro 10,296 – 33 10,329Japanese Yen 11,142 – 41 11,183Swedish Krona 2,269 – – 2,269Swiss Franc 1,227 – – 1,227US Dollar 37,196 2,098 (74) 39,220
71,743 2,102 – 73,845
Federated Hermes Absolute Return Credit FundNon-monetary Assets
$'000Monetary Assets
$'000Hedging
$'000Total $'000
British Pound 20,449 828 51,847 73,124Danish Krone – 1 – 1Euro 19,160 2,261 22,683 44,104Singapore Dollar – 1 – 1Swiss Franc – 5 1 6US Dollar 81,114 4,116 (72,977) 12,253
120,723 7,212 1,554 129,489
8. Financial Risk Management (continued)
Currency Risk (continued)

312
Federated Hermes Investment Funds Public Limited CompanyNotes to the Financial Statements for the financial year ended 31 December 2020 (continued)
Federated Hermes SDG Engagement Equity FundNon-monetary Assets
$'000Monetary Assets
$'000Hedging
$'000Total $'000
Brazilian Real 7,509 – – 7,509British Pound 36,503 302 (16,748) 20,057Euro 59,424 1,023 96,662 157,109Hong Kong Dollar 36,490 – (35,343) 1,147Japanese Yen 64,309 – (63,422) 887Singapore Dollar 9,868 – (9,583) 285Swedish Krona 9,117 – (9,266) (149)Swiss Franc 9,323 157 169,219 178,699Taiwan Dollar 11,072 223 – 11,295US Dollar 302,400 20,531 (129,323) 193,608
546,015 22,236 2,196 570,447
Federated Hermes Impact Opportunities Equity FundNon-monetary Assets
$'000Monetary Assets
$'000Hedging
$'000Total $'000
Australian Dollar 19,405 – – 19,405Brazilian Real 6,057 – – 6,057British Pound 12,870 44 (40) 12,874Danish Krone 20,878 – – 20,878Euro 70,967 78 (73) 70,972Indonesian Rupiah 11,470 – – 11,470Japanese Yen 9,470 – – 9,470Norwegian Krone 8,754 – – 8,754South African Rand 1,392 – – 1,392Swiss Franc 9,527 – – 9,527US Dollar 79,831 2,670 112 82,613
250,621 2,792 (1) 253,412
Federated Hermes Unconstrained Credit FundNon-monetary Assets
$'000Monetary Assets
$'000Hedging
$'000Total $'000
British Pound 77,267 336 409,562 487,165Euro 97,484 (226) (76,433) 20,825Norwegian Krone – 1 – 1Singapore Dollar – 6 – 6Swiss Franc – 5 3 8US Dollar 337,413 (784) (325,185) 11,444
512,164 (662) 7,947 519,449
8. Financial Risk Management (continued)
Currency Risk (continued)

313
Federated Hermes Investment Funds Public Limited CompanyNotes to the Financial Statements for the financial year ended 31 December 2020 (continued)
Federated Hermes Global Emerging Markets SMID Equity FundNon-monetary Assets
$'000Monetary Assets
$'000Hedging
$'000Total $'000
Brazilian Real 23,184 – – 23,184British Pound 4,570 (66) 66 4,570Egyptian Pound 5,512 – – 5,512Euro – 340 (337) 3Hong Kong Dollar 33,356 – 358 33,714Hungarian Forint 5,338 – – 5,338Indian Rupee 23,808 137 – 23,945Korean Won 3,445 – – 3,445Mexican Peso 2,736 – – 2,736South African Rand 7,118 – – 7,118Taiwan Dollar 30,488 260 – 30,748Turkish Lira 7,129 – – 7,129US Dollar 19,005 2,226 (89) 21,142Yuan Offshore 8,848 – – 8,848
174,537 2,897 (2) 177,432
Federated Hermes SDG Engagement High Yield Credit FundNon-monetary Assets
$'000Monetary Assets
$'000Hedging
$'000Total $'000
British Pound 25,084 257 (19,411) 5,930Euro 36,578 1,843 40,619 79,040Norwegian Krone – 1 – 1Singapore Dollar – 1 – 1Swiss Franc 1 128 87,166 87,295US Dollar 177,393 8,125 (106,786) 78,732
239,056 10,355 1,588 250,999
Monetary Assets are cash and time deposits and Non-Monetary Assets are all other assets�
Interest Rate Risk
Interest rate risk is defined in IFRS 7 as the risk that the fair value or future cash flows of a financial instrument will fluctuate because of changes in market interest rates.
The majority of the sub-funds’ financial assets and liabilities are non-interest bearing and any excess cash and cash equivalents are invested at short term market interest rates� As a result, most of the sub-funds are not subject to significant amounts of risk due to fluctuations in the prevailing level of market interest rates.
The Federated Hermes Global High Yield Credit Fund, the Federated Hermes Multi-Strategy Credit Fund, the Federated Hermes Absolute Return Credit Fund, the Federated Hermes Unconstrained Credit Fund, the Federated Hermes SDG Engagement High Yield Credit Fund and the Federated Hermes US High Yield Credit Fund have/had interest-bearing financial assets and liabilities. As a result, the sub-funds are/were subject to the risk of potentially adverse movements in the prevailing levels of market interest rates� The Investment Manager may from time to time enter into contracts on behalf of the funds that seek to mitigate the effects of these movements�
In accordance with the sub-fund’s policy, the Investment Manager monitors the sub-funds interest rate exposures on a regular basis and reports regularly to the Board of Directors, which reviews the information provided by the Investment Manager on significant exposures at its periodic meetings.
8. Financial Risk Management (continued)
Currency Risk (continued)

314
Federated Hermes Investment Funds Public Limited CompanyNotes to the Financial Statements for the financial year ended 31 December 2020 (continued)
As at 31 December 2020 the sub-funds’ interest rate exposures based on the maturity date were as follows:
Federated Hermes Global High Yield Credit Fund
Up to 1 year
€
1-5 years
€
Over 5 years
€ Non Total
€AssetsFinancial assets 30,491,817 49,317,013 247,661,501 5,379,413 332,849,744Cash 2,251,744 - - - 2,251,744Cash pledged as collateral for derivative positions 240,000 - - - 240,000Cash received as collateral for derivative positions 2,540,000 - - - 2,540,000Interest Receivable - - - 3,494,025 3,494,025Securities sold receivable - - - 7,119 7,119Subscriptions Receivable - - - 56,651 56,651Sundry debtors - - - 687 687
Total Assets 35,523,561 49,317,013 247,661,501 8,937,895 341,439,970
LiabilitiesFinancial liabilities - 2,605,081 - 542,276 3,147,357Cash due to counterparties for derivative positions 2,540,000 - - - 2,540,000Securities purchased payable - - - 250 250Redemptions payable - - - 142,827 142,827Accrued expenses - - - 480,547 480,547
Total Liabilities 2,540,000 2,605,081 - 1,165,900 6,310,981
Net Assets 32,983,561 46,711,932 247,661,501 7,771,995 335,128,989
Federated Hermes Multi-Strategy Credit Fund
Up to 1 year
$
1-5 years
$
Over 5 years
$
Non interest bearing
$Total
$AssetsFinancial assets 80,928,359 93,938,539 435,200,629 11,689,999 621,757,526Cash 21,839,087 - - - 21,839,087Cash pledged as collateral for derivative positions 10,530,000 - - - 10,530,000Cash received as collateral for derivative positions 6,710,922 - - - 6,710,922Interest Receivable - - - 5,418,983 5,418,983Subscriptions Receivable - - - 39,779 39,779Sundry debtors - - - 5,049 5,049
Total Assets 120,008,368 93,938,539 435,200,629 17,153,810 666,301,346
LiabilitiesFinancial liabilities - 32,085,545 - 1,702,559 33,788,104Cash due to counterparties for derivative positions 6,710,922 - - - 6,710,922Redemptions payable - - - 4,897 4,897Accrued expenses - - - 1,164,058 1,164,058
Total Liabilities 6,710,922 32,085,545 - 2,871,514 41,667,981
Net Assets 113,297,446 61,852,994 435,200,629 14,282,296 624,633,365
8. Financial Risk Management (continued)
Interest Rate Risk (continued)

315
Federated Hermes Investment Funds Public Limited CompanyNotes to the Financial Statements for the financial year ended 31 December 2020 (continued)
Federated Hermes Absolute Return Credit Fund
Up to 1 year
$
1-5 years
$
Over 5 years
$
Non interest bearing
$Total
$AssetsFinancial assets 52,475,888 121,235,875 141,942,940 7,984,067 323,638,770Cash 8,587,475 - - - 8,587,475Cash pledged as collateral for derivative positions 5,454,083 - - - 5,454,083Cash received as collateral for derivative positions 2,432,059 - - - 2,432,059Interest Receivable - - - 3,043,375 3,043,375Sundry debtors - - - 30,284 30,284
Total Assets 68,949,505 121,235,875 141,942,940 11,057,726 343,186,046
LiabilitiesFinancial liabilities - 13,588,253 - 1,267,815 14,856,068Cash due to counterparties for derivative positions 2,432,059 - - - 2,432,059Accrued expenses - - - 379,041 379,041
Total Liabilities 2,432,059 13,588,253 - 1,646,856 17,667,168
Net Assets 66,517,446 107,647,622 141,942,940 9,410,870 325,518,878
Federated Hermes Unconstrained Credit Fund
Up to 1 year
$
1-5 years
$
Over 5 years
$
Non interest bearing
$Total
$AssetsFinancial assets 56,050,290 135,390,527 609,827,997 19,039,343 820,308,157Cash 8,403,068 - - - 8,403,068Cash pledged as collateral for derivative positions 20,526,539 - - - 20,526,539Cash received as collateral for derivative positions 8,138,063 - - - 8,138,063Interest Receivable - - - 7,404,092 7,404,092Securities sold receivable - - - 1,627 1,627Subscriptions Receivable - - - 134,649 134,649Sundry debtors - - - 11,515 11,515
Total Assets 93,117,960 135,390,527 609,827,997 26,591,226 864,927,710
LiabilitiesFinancial liabilities - 28,722,693 - 3,058,508 31,781,201Cash due to counterparties for derivative positions 8,138,063 - - - 8,138,063Securities purchased payable - - - 125,658 125,658Accrued expenses - - - 1,134,799 1,134,799
Total Liabilities 8,138,063 28,722,693 - 4,318,965 41,179,721
Net Assets 84,979,897 106,667,834 609,827,997 22,272,261 823,747,989
8. Financial Risk Management (continued)
Interest Rate Risk (continued)

316
Federated Hermes Investment Funds Public Limited CompanyNotes to the Financial Statements for the financial year ended 31 December 2020 (continued)
Federated Hermes SDG Engagement High Yield Credit Fund
Up to 1 year
$
1-5 years
$
Over 5 years
$
Non interest bearing
$Total
$AssetsFinancial assets 86,492,971 55,660,538 489,477,063 1,456,076 633,086,648Cash 7,202,853 - - - 7,202,853Cash pledged as collateral for derivative positions 2,460,000 - - - 2,460,000Cash received as collateral for derivative positions 2,705,045 - - - 2,705,045Interest Receivable - - - 6,159,228 6,159,228Subscriptions Receivable - - - 551,983 551,983Sundry debtors - - - 145,019 145,019
Total Assets 98,860,869 55,660,538 489,477,063 8,312,306 652,310,776
LiabilitiesFinancial liabilities - 2,570,835 - 1,720,235 4,291,070Cash due to counterparties for derivative positions 2,705,045 - - - 2,705,045Securities purchased payable - - - 2,084,528 2,084,528Redemptions payable - - - 188,140 188,140Accrued expenses - - - 684,690 684,690
Total Liabilities 2,705,045 2,570,835 - 4,677,593 9,953,473
Net Assets 96,155,824 53,089,703 489,477,063 3,634,713 642,357,303
Federated Hermes US High Yield Credit Fund
Up to 1 year
$
1-5 years
$
Over 5 years
$
Non interest bearing
$Total
$AssetsFinancial assets - 1,469,877 5,602,344 35 7,072,256Cash 151,930 - - - 151,930Interest Receivable - - - 103,459 103,459Sundry debtors - - - 67,001 67,001
Total Assets 151,930 1,469,877 5,602,344 170,495 7,394,646
Securities purchased payable - - - 50,000 50,000Accrued expenses - - - 31,116 31,116
Total Liabilities - - - 81,116 81,116
Net Assets 151,930 1,469,877 5,602,344 89,379 7,313,530
8. Financial Risk Management (continued)
Interest Rate Risk (continued)

317
Federated Hermes Investment Funds Public Limited CompanyNotes to the Financial Statements for the financial year ended 31 December 2020 (continued)
As at 31 December 2019 the sub-funds’ interest rate exposure was as follows:
Federated Hermes Global High Yield Credit Fund
Up to 1 year
€
1-5 years
€
Over 5 years
€
Non interest bearing
€Total
€AssetsFinancial assets 4,486,530 8,958,947 111,002,376 1,889,267 126,337,120Cash 1,477,128 - - - 1,477,128Cash pledged as collateral for derivative positions 480,000 - - - 480,000Cash received as collateral for derivative positions 1,530,000 - - - 1,530,000Interest Receivable - - - 1,487,408 1,487,408Subscriptions Receivable - - - 143,441 143,441Sundry debtors - - - 342 342
Total Assets 7,973,658 8,958,947 111,002,376 3,520,458 131,455,439
LiabilitiesFinancial liabilities - 24,816 - 262,359 287,175Cash due to counterparties for derivative positions 1,530,000 - - - 1,530,000Securities purchased payable - - - 614,000 614,000Accrued expenses - - - 612,161 612,160
Total Liabilities 1,530,000 24,816 - 1,488,520 3,043,335
Net Assets 6,443,658 8,934,131 111,002,376 2,031,938 128,412,104
Federated Hermes Multi-Strategy Credit Fund
Up to 1 year
$
1-5 years
$
Over 5 years
$
Non interest bearing
$Total
$AssetsFinancial assets 18,195,347 178,155,831 765,603,903 18,000,670 979,955,751Cash 54,105,244 - - - 54,105,244Cash pledged as collateral for derivative positions 24,301,502 - - - 24,301,502Cash received as collateral for derivative positions 7,656,443 - - - 7,656,443Interest Receivable - - - 10,230,796 10,230,796Securities sold receivable - - - 3,255,835 3,255,836Subscriptions Receivable - - - 23,633 23,633Sundry debtors - - - 69,900 69,900
Total Assets 104,258,536 178,155,831 765,603,903 31,580,834 1,079,599,105
LiabilitiesFinancial liabilities 144,723 57,367,906 - 426,750 57,939,379Cash due to counterparties for derivative positions 7,656,443 - - - 7,656,443Securities purchased payable - - - 17,223,252 17,223,252Accrued expenses - - - 4,687,138 4,687,138
Total Liabilities 7,801,166 57,367,906 - 22,337,140 87,506,212
Net Assets 96,457,370 120,787,925 765,603,903 9,243,694 992,092,893
8. Financial Risk Management (continued)
Interest Rate Risk (continued)

318
Federated Hermes Investment Funds Public Limited CompanyNotes to the Financial Statements for the financial year ended 31 December 2020 (continued)
Federated Hermes Absolute Return Credit Fund
Up to 1 year
$
1-5 years
$
Over 5 years
$
Non interest bearing
$Total
$AssetsFinancial assets 12,831,860 56,153,166 57,743,904 1,917,142 128,646,072Cash 5,442,715 - - - 5,442,715Cash pledged as collateral for derivative positions 3,441,139 - - - 3,441,139Cash received as collateral for derivative positions 1,770,008 - - - 1,770,008Interest Receivable - - - 1,214,341 1,214,341Securities sold receivable - - - 303,940 303,940Sundry debtors - - - 12,040 12,040
Total Assets 23,485,722 56,153,166 57,743,904 3,447,463 140,830,255
LiabilitiesFinancial liabilities 5,561 6,667,318 - 141,435 6,814,314Cash due to counterparties for derivative positions 1,770,008 - - - 1,770,008Securities purchased payable - - - 2,361,179 2,361,179Accrued expenses - - - 395,343 395,343
Total Liabilities 1,775,569 6,667,318 - 2,897,957 11,340,844
Net Assets 21,710,153 49,485,848 57,743,904 549,506 129,489,411
Federated Hermes Unconstrained Credit Fund
Up to 1 year
$
1-5 years
$
Over 5 years
$
Non interest bearing
$Total
$AssetsFinancial assets 26,554,974 48,953,178 443,495,953 9,789,874 528,793,979Cash pledged as collateral for derivative positions 14,360,029 - - - 14,360,029Cash received as collateral for derivative positions 7,470,000 - - - 7,470,000Interest Receivable - - - 5,516,637 5,516,637Sundry debtors - - - 54,876 54,876
Total Assets 48,385,003 48,953,178 443,495,953 15,361,387 556,195,521
LiabilitiesFinancial liabilities 78,818 14,321,083 - 504,342 14,904,243Bank overdraft 8,130,941 - - - 8,130,941Cash due to counterparties for derivative positions 7,470,000 - - - 7,470,000Securities purchased payable - - - 4,402,656 4,402,656Accrued expenses - - - 1,838,649 1,838,649
Total Liabilities 15,679,759 14,321,083 - 6,745,647 36,746,489
Net Assets 32,705,244 34,632,095 443,495,953 8,615,740 519,449,032
8. Financial Risk Management (continued)
Interest Rate Risk (continued)

319
Federated Hermes Investment Funds Public Limited CompanyNotes to the Financial Statements for the financial year ended 31 December 2020 (continued)
Federated Hermes SDG Engagement High Yield Credit Fund
Up to 1 year
$
1-5 years
$
Over 5 years
$
Non interest bearing
$Total
$AssetsFinancial assets 24,951,531 9,896,805 210,221,139 2,274,671 247,344,146Cash 8,621,791 - - - 8,621,791Cash received as collateral for derivative positions 1,730,706 - - - 1,730,706Interest Receivable - - - 2,563,691 2,563,691Subscriptions Receivable - - - 757,948 757,948Sundry debtors - - - 27,228 27,228
Total Assets 35,304,028 9,896,805 210,221,139 5,623,538 261,045,510
LiabilitiesFinancial liabilities - 1,070,671 - 195,918 1,266,589Cash due to counterparties for derivative positions 1,730,706 - - - 1,730,706Securities purchased payable - - - 6,398,454 6,398,454Redemptions payable - - - 16,629 16,629Accrued expenses - - - 633,773 633,773
Total Liabilities 1,730,706 1,070,671 - 7,244,774 10,046,151
Net Assets 33,573,322 8,826,134 210,221,139 (1,621,236) 250,999,359
Credit Risk
Credit risk is defined in IFRS 7 as the risk that one party to a financial instrument will cause a financial loss for the other party by failing to discharge an obligation�
Transactions in securities are generally settled or paid for on delivery, or cleared through the appropriate clearing system for the market on which the securities are traded� The risk of default is not considered to be material, as delivery of securities sold is only made once the Depositary has received confirmation of payment. Payment is also only made on a purchase once confirmation of delivery of the securities has been received by the Depositary. The trade will fail if either party fails to deliver the required confirmations.
At 31 December 2020 and 2019 none of the sub-funds’ financial assets were past due or impaired.
Northern Trust Fiduciary Services (Ireland) Limited (“NTFSIL”) is the appointed Depositary of the Fund, responsible for the safe-keeping of assets� NTFSIL has appointed The Northern Trust Company (“TNTC”) as its global sub-custodian� Both NTFSIL and TNTC are wholly owned subsidiaries of Northern Trust Corporation (“NTC”)� As at year-end date 31 December 2020, NTC had a long term credit rating from Standard & Poor’s of (A+)�
TNTC (as global sub-custodian of NTFSIL) does not appoint external sub-custodians within the U�S�, the U�K�, Ireland, Canada, Belgium, France, Germany, Netherlands and Saudi Arabia� However, in all other markets, TNTC appoints local external sub-custodians�
NTFSIL, in the discharge of its depositary duties, verifies the Fund’s ownership of Other Assets, (as defined under Other Assets in Art 22(5) of UCITS V Directive 2014/91/EU), by assessing whether the Fund holds the ownership based on information or documents provided by the Fund or where available, on external evidence�
8. Financial Risk Management (continued)
Interest Rate Risk (continued)

320
Federated Hermes Investment Funds Public Limited CompanyNotes to the Financial Statements for the financial year ended 31 December 2020 (continued)
TNTC, in the discharge of its delegated depositary duties, holds in custody (i) all financial instruments that may be registered in a financial instruments account opened on the books of TNTC and (ii) all financial instruments that can be physically delivered to TNTC. TNTC ensures all financial instruments (held in a financial instruments account on the books of TNTC) are held in segregated accounts in the name of the Fund, clearly identifiable as belonging to the Fund, and distinct and separately from the proprietary assets of TNTC, NTFSIL and NTC�
In addition TNTC, as banker, holds cash of the Fund on deposit� Such cash is held on the Statement of Financial Position of TNTC� In the event of insolvency of TNTC, in accordance with standard banking practice, the Fund will rank as an unsecured creditor of TNTC in respect of any cash deposits�
Insolvency of NTFSIL and or one of its agents or affiliates may cause the Fund’s rights with respect to its assets to be delayed�
The Investment Manager (or its delegate) manages risk by monitoring the credit quality and financial position of the Depositary and such risk is further managed by the Depositary monitoring the credit quality and financial positions of sub-custodian appointments�
To mitigate the risks the sub-funds are exposed to from the use of the counterparties, the Investment Manager employs appropriate procedures to ensure that the counterparties are reputable institutions and that the credit risk is acceptable to the Investment Manager� The sub-funds only transact with counterparties that are regulated entities subject to prudential supervision, or with credit-ratings assigned by international credit-rating agencies� In addition, the sub-funds’ securities are maintained by the sub-custodian in segregated accounts� Cash is also held with the following brokers/counterparties: Barclays (S&P: A), BNP Paribas (S&P: A+), Citi (S&P: A+), Credit Suisse (S&P: A+), Goldman Sachs (S&P: A+), HSBC (S&P: A+), JP Morgan (S&P: A+), Lloyds Bank (S&P: A+), Merrill Lynch (S&P: A+), Morgan Stanley (S&P: A+), Royal Bank of Canada (S&P: AA-), State Street (S&P: AA-) and The Northern Trust Company (S&P: A+) (see note 4)�
Cash held with brokers/counterparties may be subject to counterparty risk and may not be recoverable in the event of an insolvency of the broker/counterparty�
The Investment Manager monitors the credit quality and financial position of the Depositary and reviews the SOC 1 of the Custodian� The Company is additionally exposed to credit risk arising from the counterparties used in OTC derivatives� This risk is mitigated by the Company only engaging with counterparties which meet the Central Bank’s UCITS regulatory requirements and are approved by the Investment Manager and are continually monitored�
The Company has credit risk exposure to issuers of debt securities and P-Notes held as part of the Company’s investment portfolio� The Company limits its exposure to individual issuers of debt securities and P-Notes in accordance with the investment restrictions set out in the Company’s Prospectus� Impairment provisions are provided for any losses that have been incurred by the balance sheet date� There were no impairment provisions required as at 31 December 2020 (2019: None)�
The Federated Hermes Global Emerging Markets Equity Fund, the Federated Hermes Global High Yield Credit Fund, the Federated Hermes Multi-Strategy Credit Fund, the Federated Hermes Absolute Return Credit Fund, the Federated Hermes Unconstrained Credit Fund, the Federated Hermes SDG Engagement High Yield Credit Fund and the Federated Hermes US High Yield Credit Fund invest in debt securities and P-Notes at the financial year end date� As at 31 December 2020 and 31 December 2019, the exposure to credit risk on the Portfolio Statements to debt securities and P-Notes using ratings from S&P are shown on the following page:
Federated Hermes Global Emerging Markets Equity Fund*Portfolio by rating category Rating 31 December 2020 31 December 2019NR 100�00% 100�00%
100.00% 100.00%
*The ratings disclosed for this sub-fund are the ratings of the P-Note counterparty as the Notes themselves are not rated�
8. Financial Risk Management (continued)
Credit Risk (continued)

321
Federated Hermes Investment Funds Public Limited CompanyNotes to the Financial Statements for the financial year ended 31 December 2020 (continued)
Federated Hermes Global High Yield Credit FundPortfolio by rating category Rating 31 December 2020 31 December 2019AA+ 8�54% 3�60%A 1�05% 1�52%A- 0�77% 0�83%BBB+ 1�78% 1�26%BBB 7�42% 9�16%BBB- 18�21% 24�54%BB+ 24�05% 17�24%BB 13�71% 15�82%BB- 12�63% 10�95%B+ 5�78% 7�99%B 2�98% 2�80%B- 0�99% 0�64%CCC+ 0�58% 0�15%CCC 0�05% 0�22%CC –% 0�16%NR 1�46% 3�12%
100.00% 100.00%
Federated Hermes Multi-Strategy Credit FundPortfolio by rating category Rating 31 December 2020 31 December 2019AAA 1�43% –%AA+ 13�31% 1�05%AA- –% 0�83%A 1�10% –%A- 0�86% –%BBB+ 5�94% 5�39%BBB 8�14% 13�61%BBB- 21�96% 28�58%BB+ 16�55% 14�44%BB 8�24% 12�80%BB- 13�90% 9�31%B+ 5�08% 7�27%B 1�99% 2�47%B- 0�59% 0�58%CCC+ 0�14% 0�11%NR 0�77% 3�56%
100.00% 100.00%
8. Financial Risk Management (continued)
Credit Risk (continued)

322
Federated Hermes Investment Funds Public Limited CompanyNotes to the Financial Statements for the financial year ended 31 December 2020 (continued)
Federated Hermes Absolute Return Credit FundPortfolio by rating category Rating 31 December 2020 31 December 2019AAA 4�31% 3�21%AA+ 12�33% 3�39%AA –% 0�41%AA- 0�32% 2�03%A+ 0�19% 0�99%A 0�55% 0�31%A- 1�20% 2�54%BBB+ 8�06% 6�92%BBB 11�59% 16�90%BBB- 21�00% 26�33%BB+ 19�06% 13�05%BB 7�71% 7�51%BB- 6�94% 5�29%B+ 3�22% 4�96%B 1�40% 1�74%B- 0�37% 0�54%CCC+ 0�40% –%CCC 0�02% 0�16%CC –% 0�04%NR 1�33% 3�68%
100.00% 100.00%
Federated Hermes Unconstrained Credit FundPortfolio by rating category Rating 31 December 2020 31 December 2019AAA 1�85% 0�43%AA+ 6�90% 4�86%AA 1�13% 1�53%AA- 1�08% 0�76%A+ 0�26% 1�97%A 1�28% 1�88%A- 0�68% 0�76%BBB+ 5�62% 4�73%BBB 8�78% 11�69%BBB- 19�50% 26�26%BB+ 20�12% 13�91%BB 13�36% 12�39%BB- 9�21% 5�71%B+ 5�68% 6�81%B 2�14% 2�57%B- 0�79% 0�66%CCC+ 0�45% –%CCC 0�08% –%CC –% 0�05%NR 1�09% 3�03%
100.00% 100.00%
8. Financial Risk Management (continued)
Credit Risk (continued)

323
Federated Hermes Investment Funds Public Limited CompanyNotes to the Financial Statements for the financial year ended 31 December 2020 (continued)
Federated Hermes SDG Engagement High Yield Credit FundPortfolio by rating category Rating 31 December 2020 31 December 2019AA+ 13�61% 10�24%A 0�69% –%BBB+ 0�58% 0�83%BBB 3�32% 2�37%BBB- 13�38% 13�54%BB+ 27�30% 27�10%BB 15�96% 19�22%BB- 12�27% 9�24%B+ 5�82% 8�42%B 4�72% 7�20%B- 1�38% 0�42%CCC+ 0�13% –%CCC 0�06% –%NR 0�78% 1�42%
100.00% 100.00%
Federated Hermes US High Yield Credit Fund**Portfolio by rating category Rating 31 December 2020 31 December 2019BBB- 2�58% N/ABB+ 8�53% N/ABB 17�03% N/ABB- 16�43% N/AB+ 13�36% N/AB 14�00% N/AB- 11�69% N/ACCC+ 12�79% N/ACCC 3�34% N/ACCC- 0�25% N/A
100.00% N/A
**Federated Hermes US High Yield Credit Fund launched on 21 July 2020�
Cash, P-Notes and all asset derivatives (credit default swaps, swaptions, futures, forward currency contracts and warrants) are also exposed to credit risk� The value of cash, P-Notes and derivative assets exposed to credit risk as at 31 December 2020 and 31 December 2019 amounted to:
Sub-fund31 December 2020
$31 December 2019
$Federated Hermes Global Emerging Markets Equity Fund 181,241,817 54,420,525Federated Hermes Global Equity Fund 81,340 145,368Federated Hermes US SMID Equity Fund 36,590,744 31,469,038Federated Hermes Asia ex-Japan Equity Fund 13,896,009 27,545,311Federated Hermes Global Equity ESG Fund 29,100,359 18,421,920Federated Hermes Multi-Strategy Credit Fund 63,893,854 86,063,189Federated Hermes Global Small Cap Equity Fund 2,523,855 2,209,148Federated Hermes Absolute Return Credit Fund 31,142,978 10,653,862Federated Hermes SDG Engagement Equity Fund 38,025,476 22,240,813Federated Hermes Impact Opportunities Equity Fund 9,291,547 2,794,539Federated Hermes Unconstrained Credit Fund 69,561,418 21,830,029Federated Hermes Global Emerging Markets SMID Equity Fund 9,365,417 2,897,881Federated Hermes US High Yield Credit Fund 151,965 -Federated Hermes SDG Engagement High Yield Credit Fund 16,808,628 10,352,497
*Federated Hermes US High Yield Credit Fund launched on 21 July 2020�
8. Financial Risk Management (continued)
Credit Risk (continued)

324
Federated Hermes Investment Funds Public Limited CompanyNotes to the Financial Statements for the financial year ended 31 December 2020 (continued)
Sub-fund31 December 2020
€31 December 2019
€Federated Hermes European Alpha Equity Fund 684,115 1,427,059Federated Hermes Global High Yield Credit Fund 12,512,115 4,303,877Federated Hermes Europe ex-UK Equity Fund 204,366 2,096,844
Liquidity Risk
Liquidity risk is defined in IFRS 7 specifically as the risk that an entity will encounter difficulty in meeting obligations associated with financial liabilities that are settled by delivering cash or another financial asset.
The sub-funds are exposed to daily cash redemptions of redeemable participating shares� The sub-funds invest the majority of their assets in securities and other instruments that are traded on an active market and which are considered to be liquid, as under normal market conditions they can be readily disposed of in the event that cash needs to be raised to meet redemptions or to pay expenses�
In accordance with Company policy, the Investment Manager monitors the sub-funds’ liquidity on a regular basis and reports regularly to the Board of Directors�
The maturities of the relevant financial assets and liabilities at fair value through profit or loss are set out in the individual sub-fund portfolio statements� All the sub-funds’ other liabilities had maturities of up to one month after year end�
Fair value measurement
The following tables set out the fair value measurements using IFRS 13 fair value hierarchies as discussed in note 2�
Financial assets and liabilities at fair value through profit or loss 1
Fund NameLevel I
$Level II
$Level III
$Total
$Federated Hermes Global Emerging Markets Equity Fund 1
Equities 6,054,647,472 - - 6,054,647,472American Depositary Receipts 828,551,304 - - 828,551,304P-Notes - 15,212,816 - 15,212,816Forward currency contracts (asset) - 3,105,452 - 3,105,452Forward currency contracts (liability) - (7,545) - (7,545)
6,883,198,776 18,310,723 - 6,901,509,499
The following table presents the movement in Level III instruments for the financial year ended 31 December 2020� There were no Level III investments held at 31 December 2019�
Level III MovementFederated Hermes Global Emerging Markets Equity Fund
Opening balance - Purchases - Sales - Transfers into Level III 161,952,037 Loss recognised in profit and loss (161,952,037)Closing balance -
8. Financial Risk Management (continued)
Credit Risk (continued)

325
Federated Hermes Investment Funds Public Limited CompanyNotes to the Financial Statements for the financial year ended 31 December 2020 (continued)
Financial assets and liabilities at fair value through profit or loss 1
Fund NameLevel I
$Level II
$Level III
$Total
$Federated Hermes Global Equity Fund 1
Equities 36,076,433 - - 36,076,433REITS 687,765 - - 687,765
36,764,198 - - 36,764,198
Federated Hermes US SMID Equity Fund 1
Equities 819,229,742 - - 819,229,742Forward currency contracts (asset) - 1,292,125 - 1,292,125Forward currency contracts (liability) - (2,930) - (2,930)
819,229,742 1,289,195 - 820,518,937
Federated Hermes Asia ex-Japan Equity Fund 1
Equities 2,334,861,463 - - 2,334,861,463American Depositary Receipts 108,645,559 - - 108,645,559Forward currency contracts (asset) - 1,111,075 - 1,111,075Forward currency contracts (liability) - (7,440) - (7,440)
2,443,507,022 1,103,635 - 2,444,610,657
Federated Hermes Global Equity ESG Fund 1
Equities 1,553,345,756 - - 1,553,345,756REITS 41,793,218 - - 41,793,218Forward currency contracts (asset) - 4,673,980 - 4,673,980Forward currency contracts (liability) - (2,043,788) - (2,043,788)
1,595,138,974 2,630,192 - 1,597,769,166
Federated Hermes Multi-Strategy Credit Fund 1
Corporate Bonds - 310,391,301 - 310,391,301Government Bonds - 79,473,743 - 79,473,743Floating Rate Notes - 203,525,447 - 203,525,447Asset Backed Securities - 3,553,190 - 3,553,190Credit Default Swaps (asset) - 12,905,523 - 12,905,523Credit Default Swaps (liability) - (32,085,545) - (32,085,545)Open Purchased Swaptions (asset) - 218,323 - 218,323Forward currency contracts (asset) - 11,558,613 - 11,558,613Forward currency contracts (liability) - (1,639,809) - (1,639,809)Futures (asset) 131,386 - - 131,386Futures (liability) (62,750) - - (62,750)
68,636 587,900,786 - 587,969,422
Federated Hermes Global Small Cap Equity Fund 1
Equities 125,231,986 - - 125,231,986REITS 4,087,338 - - 4,087,338
129,319,324 - - 129,319,324
8. Financial Risk Management (continued)
Fair value measurement (continued)

326
Federated Hermes Investment Funds Public Limited CompanyNotes to the Financial Statements for the financial year ended 31 December 2020 (continued)
Financial assets and liabilities at fair value through profit or loss 1
Fund NameLevel I
$Level II
$Level III
$Total
$Federated Hermes Absolute Return Credit Fund 1
Corporate Bonds - 193,258,704 - 193,258,704Government Bonds - 39,960,959 - 39,960,959Floating Rate Notes - 61,349,940 - 61,349,940Asset Backed Securities - 14,399,806 - 14,399,806Credit Default Swaps (asset) - 6,499,675 - 6,499,675Credit Default Swaps (liability) - (13,588,253) - (13,588,253)Open Purchased Swaptions (asset) - 185,619 - 185,619Forward currency contracts (asset) - 7,975,224 - 7,975,224Forward currency contracts (liability) - (1,229,556) - (1,229,556)Futures (asset) 8,843 - - 8,843Futures (liability) (38,259) - - (38,259)
(29,416) 308,812,118 - 308,782,702
Federated Hermes SDG Engagement Equity Fund 1
Equities 1,244,558,935 - - 1,244,558,935REITS 64,219,825 - - 64,219,825Forward currency contracts (asset) - 6,096,122 - 6,096,122Forward currency contracts (liability) - (2,568,603) - (2,568,603)
1,308,778,760 3,527,519 - 1,312,306,279
Federated Hermes Impact Opportunities Equity Fund 1
Equities 442,180,459 - - 442,180,459Forward currency contracts (asset) - 7,607 - 7,607Forward currency contracts (liability) - (113) - (113)
442,180,459 7,494 - 442,187,953
Federated Hermes Unconstrained Credit Fund 1
Corporate Bonds - 441,897,961 - 441,897,961Government Bonds - 57,909,226 - 57,909,226Floating Rate Notes - 210,212,933 - 210,212,933Asset Backed Securities - 77,794,289 - 77,794,289Credit Default Swaps (asset) - 12,347,265 - 12,347,265Credit Default Swaps (liability) - (28,722,693) - (28,722,693)Open Purchased Swaptions (asset) - 1,107,140 - 1,107,140Forward currency contracts (asset) - 18,969,860 - 18,969,860Forward currency contracts (liability) - (3,030,258) - (3,030,258)Futures (asset) 69,483 - - 69,483Futures (liability) (28,250) - - (28,250)
41,233 788,485,723 - 788,526,956
Financial assets and liabilities at fair value through profit or loss 1
Fund NameLevel I
$Level II
$Level III
$Total
$Federated Hermes Global Emerging Markets SMID Equity Fund 1
American Depositary Receipts 10,517,214 - - 10,517,214Equities 273,711,270 - - 273,711,270
284,228,484 - - 284,228,484
8. Financial Risk Management (continued)
Fair value measurement (continued)

327
Federated Hermes Investment Funds Public Limited CompanyNotes to the Financial Statements for the financial year ended 31 December 2020 (continued)
The following table presents the movement in Level III instruments for the financial year ended 31 December 2020� There were no Level III investments held at 31 December 2019�
Level III MovementFederated Hermes Global Emerging Markets SMID Equity Fund
Opening balance - Purchases - Sales - Transfers into Level III 6,475,672 Loss recognised in profit and loss (6,475,672)Closing balance -
Financial assets and liabilities at fair value through profit or loss 1
Fund NameLevel I
$Level II
$Level III
$Total
$Federated Hermes US High Yield Credit Fund 1
Corporate Bonds - 7,072,221 - 7,072,221Forward currency contracts (asset) - 35 - 35
- 7,072,256 - 7,072,256
Federated Hermes SDG Engagement High Yield Credit Fund 1
Corporate Bonds - 406,973,439 - 406,973,439Government Bonds - 85,825,287 - 85,825,287Floating Rate Notes - 135,847,192 - 135,847,192Credit Default Swaps (asset) - 2,984,654 - 2,984,654Credit Default Swaps (liability) - (2,570,835) - (2,570,835)Forward currency contracts (asset) - 1,351,220 - 1,351,220Forward currency contracts (liability) - (1,700,360) - (1,700,360)Futures (asset) 104,856 - - 104,856Futures (liability) (19,875) - - (19,875)
84,981 628,710,597 - 628,795,578
8. Financial Risk Management (continued)
Fair value measurement (continued)

328
Federated Hermes Investment Funds Public Limited CompanyNotes to the Financial Statements for the financial year ended 31 December 2020 (continued)
Financial assets and liabilities at fair value through profit or loss 1
Fund NameLevel I
€Level II
€Level III
€Total
€Federated Hermes European Alpha Equity Fund 1
Equities 97,781,964 - - 97,781,964Forward currency contracts (asset) - 52,310 - 52,310Forward currency contracts (liability) - (21,046) - (21,046)
97,781,964 31,264 - 97,813,228
Federated Hermes Global High Yield Credit Fund 1
Corporate Bonds - 215,057,098 - 215,057,098Government Bonds - 28,030,261 - 28,030,261Floating Rate Notes - 82,282,014 - 82,282,014Credit Default Swaps (asset) - 2,100,958 - 2,100,958Credit Default Swaps (liability) - (2,605,081) - (2,605,081)Forward currency contracts (asset) - 5,325,034 - 5,325,034Forward currency contracts (liability) - (535,725) - (535,725)Futures (asset) 54,379 - - 54,379Futures (liability) (6,551) - - (6,551)
47,828 329,654,559 - 329,702,387
Federated Hermes Europe ex-UK Equity Fund 1
Equities 34,847,645 - - 34,847,645Forward currency contracts (asset) - 8,167 - 8,167Forward currency contracts (liability) - (7) - (7)
34,847,645 8,160 - 34,855,805
8. Financial Risk Management (continued)
Fair value measurement (continued)

329
Federated Hermes Investment Funds Public Limited CompanyNotes to the Financial Statements for the financial year ended 31 December 2020 (continued)
The following is a summary of the inputs used to value each sub-funds assets and liabilities carried at fair value as at 31 December 2019, as discussed in note 2�
e.
Financial assets and liabilities at fair value through profit or loss 1
Fund NameLevel I
$Level II
$Level III
$Total
$Federated Hermes Global Emerging Markets Equity Fund 1
American Depositary Receipts 991,277,339 - - 991,277,339Equities 4,507,121,106 - - 4,507,121,106P-Notes - 15,049,212 - 15,049,212Forward currency contracts (asset) - 861,755 - 861,755Forward currency contracts (liability) - (6,198) - (6,198)
5,498,398,445 15,904,769 - 5,514,303,214
Federated Hermes Global Equity Fund 1
Equities 19,960,727 - - 19,960,727REITS 493,998 - - 493,998
20,454,725 - - 20,454,725
Federated Hermes US SMID Equity Fund 1
Equities 1,008,571,526 - - 1,008,571,526REITS 30,054,079 - - 30,054,079Forward currency contracts (asset) - 533,106 - 533,106Forward currency contracts (liability) - (2,320) - (2,320)
1,038,625,605 530,786 - 1,039,156,391
Federated Hermes Asia ex-Japan Equity Fund 1
American Depositary Receipts 395,939,186 - - 395,939,186Equities 3,053,008,268 - - 3,053,008,268P-Notes - 37,428,141 - 37,428,141Forward currency contracts (asset) - 770,327 - 770,327Forward currency contracts (liability) - (5,021) - (5,021)
3,448,947,454 38,193,447 - 3,487,140,901
Federated Hermes Global Equity ESG Fund 1
Equities 914,740,715 - - 914,740,715REITS 25,578,447 - - 25,578,447Forward currency contracts (asset) - 2,121,419 - 2,121,419Forward currency contracts (liability) - (709,794) - (709,794)
940,319,162 1,411,625 - 941,730,787
Federated Hermes Multi-Strategy Credit Fund 1
Corporate Bonds - 615,711,558 - 615,711,558Government Bonds - 9,980,612 - 9,980,612Floating Rate Notes - 321,411,513 - 321,411,513Credit Default Swaps (asset) - 14,851,398 - 14,851,398Credit Default Swaps (liability) - (57,512,629) - (57,512,629)Forward currency contracts (asset) - 14,657,338 - 14,657,338Forward currency contracts (liability) - (426,750) - (426,750)Futures (asset) 3,343,332 - - 3,343,332
3,343,332 918,673,040 - 922,016,372
Federated Hermes Global Small Cap Equity Fund 1
Equities 69,454,028 - - 69,454,028REITS 2,291,461 - - 2,291,461
71,745,489 - - 71,745,489
8. Financial Risk Management (continued)
Fair value measurement (continued)

330
Federated Hermes Investment Funds Public Limited CompanyNotes to the Financial Statements for the financial year ended 31 December 2020 (continued)
Financial assets and liabilities at fair value through profit or loss 1
Fund NameLevel I
$Level II
$Level III
$Total
$Federated Hermes Absolute Return Credit Fund 1
Corporate Bonds - 81,989,379 - 81,989,379Government Bonds - 8,335,938 - 8,335,938Floating Rate Notes - 28,190,149 - 28,190,149Asset Backed Securities - 5,298,946 - 5,298,946Credit Default Swaps (asset) - 2,914,518 - 2,914,518Credit Default Swaps (liability) - (6,672,879) - (6,672,879)Forward currency contracts (asset) - 1,704,710 - 1,704,710Forward currency contracts (liability) - (141,435) - (141,435)Futures (asset) 212,432 - - 212,432
212,432 121,619,326 - 121,831,758
Federated Hermes SDG Engagement Equity Fund 1
Equities 519,540,906 - - 519,540,906REITS 22,808,915 - - 22,808,915Forward currency contracts (asset) - 2,805,301 - 2,805,301Forward currency contracts (liability) - (615,912) - (615,912)
542,349,821 2,189,389 - 544,539,210
Federated Hermes Impact Opportunities Equity Fund 1
American Depositary Receipts 1,013,240 - - 1,013,240Equities 249,576,128 - - 249,576,128Forward currency contracts (asset) - 35 - 35
250,589,368 35 - 250,589,403
Federated Hermes Unconstrained Credit Fund 1
Corporate Bonds - 290,904,459 - 290,904,459Government Bonds - 33,547,650 - 33,547,650Floating Rate Notes - 152,500,633 - 152,500,633Asset Backed Securities - 36,198,716 - 36,198,716Credit Default Swaps (asset) - 5,214,992 - 5,214,992Credit Default Swaps (liability) - (14,321,083) - (14,321,083)Open Purchased Swaptions (asset) - 637,655 - 637,655Open Written Swaptions (liability) - (78,818) - (78,818)Forward currency contracts (asset) - 8,457,601 - 8,457,601Forward currency contracts (liability) - (504,342) - (504,342)Futures (asset) 1,332,273 - - 1,332,273
1,332,273 512,557,463 - 513,889,736
Federated Hermes Global Emerging Markets SMID Equity Fund 1
American Depositary Receipts 8,895,482 - - 8,895,482Equities 166,400,788 - - 166,400,788
175,296,270 - - 175,296,270
Federated Hermes SDG Engagement High Yield Credit Fund 1
Corporate Bonds - 177,578,491 - 177,578,491Government Bonds 24,951,531 - - 24,951,531Floating Rate Notes - 41,161,144 - 41,161,144Credit Default Swaps (asset) - 1,378,309 - 1,378,309Credit Default Swaps (liability) - (1,070,671) - (1,070,671)Forward currency contracts (asset) - 1,784,122 - 1,784,122Forward currency contracts (liability) - (195,918) - (195,918)Futures (asset) 490,549 - - 490,549
25,442,080 220,635,477 - 246,077,557
L
8. Financial Risk Management (continued)
Fair value measurement (continued)

331
Federated Hermes Investment Funds Public Limited CompanyNotes to the Financial Statements for the financial year ended 31 December 2020 (continued)
Financial assets and liabilities at fair value through profit or loss 1
Fund NameLevel I
€Level II
€Level III
€Total
€Federated Hermes European Alpha Equity Fund 1
Equities 153,057,553 - - 153,057,553Forward currency contracts (asset) - 784 - 784Forward currency contracts (liability) - (36,127) - (36,127)
153,057,553 (35,343) - 153,022,210
Federated Hermes Global High Yield Credit Fund 1
Corporate Bonds - 84,261,432 - 84,261,432Government Bonds - 4,445,707 - 4,445,707Floating Rate Notes - 34,803,232 - 34,803,232Credit Default Swaps (asset) - 937,482 - 937,482Credit Default Swaps (liability) - (24,816) - (24,816)Forward currency contracts (asset) - 1,441,154 - 1,441,154Forward currency contracts (liability) - (262,359) - (262,359)Futures (asset) 448,113 - - 448,113
448,113 125,601,832 - 126,049,945
Federated Hermes Europe ex-UK Equity Fund 1
Equities 213,091,673 - - 213,091,673Forward currency contracts (asset) - 1,402 - 1,402Forward currency contracts (liability) - (177) - (177)
213,091,673 1,225 - 213,092,898
There were no Level III investments as at 31 December 2019�
Transfers between levels are deemed to occur at the beginning of the year�
No investments were transferred from Level I to Level II during the year ended 31 December 2020 (2019: Nil)� The valuation techniques used by the Company are explained in the accounting policies note on pages 268 to 273. There were no changes in valuation technique during the financial year.
Sensitivity analysis
Some limitations of sensitivity analysis are:
• markets and levels of market liquidity in conditions of market stress may bear no relation to historical patterns;
• the market price risk information is a relative estimate of risk rather than a precise and accurate number; the market price information represents a hypothetical outcome and is not intended to be predictive; and
• future market conditions could vary significantly from those experienced in the past.
8. Financial Risk Management (continued)
Fair value measurement (continued)

332
Federated Hermes Investment Funds Public Limited CompanyNotes to the Financial Statements for the financial year ended 31 December 2020 (continued)
The portfolios as at 31 December 2020 were stress tested using a risk based model by applying a 20% movement to their benchmark (100bps for interest rate risk) to determine the percentage change disclosed below:
Change (%)
Net Asset Value resulting from stress
testPer Share
Federated Hermes Global Emerging Markets Equity FundMarket Price test: Change MSCI Emerging Markets Bmk by 20% (18�70%) $5,723,227,727 $3�11Currency test: Change GBP/USD FX rate by 20% (0�13%) $7,029,954,544 $3�82
Federated Hermes Global Equity FundMarket Price test: Decrease MSCI World Bmk by 20% (20�57%) $29,277,036 $2�56Currency test: Change GBP/USD FX rate by 20% 0�23% $36,944,042 $3�22
Federated Hermes European Alpha Equity Fund Market Price test: Decrease FTSE All-World Europe Bmk by 20% (20�98%) €77,688,158 €2�66Currency test: Change GBP/EUR FX rate by 20% 4�18% €102,420,574 €3�50
Federated Hermes Global High Yield Credit FundEquities down 10% (1�25%) €330,931,794 €1�60Lehman Default (3�34%) €323,934,304 €1�57Interest Rates +100bps (2�82%) €325,688,560 €1�58
Federated Hermes Europe ex-UK Equity FundMarket Price test: Decrease FTSE World Europe ex UK Bmk by 20% (18�52%) €28,519,455 €1�72Currency test: Change GBP/EUR FX rate by 20% (0�97%) €34,661,279 €2�10
Federated Hermes US SMID Equity FundMarket Price test: Decrease Russell 2500 Bmk by 20% (17�24%) $708,022,903 $2�59Currency test: Change GBP/USD FX rate by 20% 3�27% $883,459,630 $3�23
Federated Hermes Asia ex-Japan Equity FundMarket Price test: Decrease MSCI AC Asia ex Japan IMI Bmk by 20% (19�61%) $1,987,566,677 $3�05Currency test: Change GBP/USD FX rate by 20% (0�16%) $2,468,629,807 $3�79
Federated Hermes Global Equity ESG FundMarket Price test: Decrease MSCI AC World Bmk by 20% (20�27%) $1,291,131,064 $2�44Currency test: Change GBP/USD FX rate up by 20% (0�57%) $1,610,172,385 $3�04
Federated Hermes Multi-Strategy Credit FundEquities down 10% (1�08%) $607,129,271 $1�69Lehman Default (1�80%) $595,506,099 $1�66Interest Rates +100bps (0�06%) $623,729,011 $1�73
Federated Hermes Global Small Cap Equity FundMarket Price test: Decrease MSCI World Small Cap by 20% (16�76%) $109,651,792 $2�31Currency test: Change GBP/USD FX rate by 20% 3�98% $136,968,026 $2�89
Federated Hermes Absolute Return Credit FundEquities down 10% (0�53%) $323,780,383 $1�41Lehman Default (1�17%) $321,712,357 $1�40Interest Rates +100bps (0�21%) $324,834,043 $1�42
Federated Hermes SDG Engagement Equity FundMarket Price test: Decrease MSCI AC World SMID Cap by 20% (12�58%) $1,170,600,613 $2�12Currency test: Change GBP/USD FX rate by 20% 3�96% $1,391,976,616 $2�52
8. Financial Risk Management (continued)
Sensitivity analysis (continued)

333
Federated Hermes Investment Funds Public Limited CompanyNotes to the Financial Statements for the financial year ended 31 December 2020 (continued)
Change (%)
Net Asset Value resulting from stress
testPer Share
Federated Hermes Impact Opportunities Equity FundMarket Price test: Decrease MSCI AC World IMI by 20% (17�38%) $371,848,852 $2�59Currency test: Change GBP/USD FX rate by 20% (1�67%) $442,565,452 $3�09
Federated Hermes Unconstrained Credit FundEquities down 10% (1�00%) $815,551,133 $1�65Lehman Default (2�23%) $805,365,325 $1�63Interest Rates +100bps (1�61%) $810,513,785 $1�64
Federated Hermes Global Emerging Markets SMID Equity FundMarket Price test: Decrease MSCI AC World IMI by 20% (17�81%) $237,292,376 $2�52Currency test: Change GBP/USD FX rate by 20% 1�10% $291,896,946 $3�10
Federated Hermes SDG Engagement High Yield Credit FundEquities down 10% (1�32%) $633,909,026 $2�33Lehman Default (3�17%) $621,965,190 $2�29Interest Rates +100bps (2�96%) $623,346,355 $2�29
Federated Hermes US High Yield Credit FundEquities down 10% (0�89%) $636,644,293 $2�34Lehman Default (3�35%) $620,850,263 $2�29Interest Rates +100bps (0�39%) $639,848,125 $2�36
8. Financial Risk Management (continued)
Sensitivity analysis (continued)

334
Federated Hermes Investment Funds Public Limited CompanyNotes to the Financial Statements for the financial year ended 31 December 2020 (continued)
As at 31 December 2019, the results of the stress tests were as follows:
Change (%)
Net Asset Value resulting from stress
testPer Share
Federated Hermes Global Emerging Markets Equity FundMarket Price test: Change MSCI Emerging Markets Bmk by 20% (18�76%) $4,519,753,188 $2�60Currency test: Change GBP/USD FX rate by 20% (10�38%) $4,986,029,211 $2�87
Federated Hermes Global Equity FundMarket Price test: Decrease MSCI World Bmk by 20% (13�00%) $17,964,583 $2�89Currency test: Change GBP/USD FX rate by 20% (11�49%) $18,276,625 $2�94
Federated Hermes European Alpha Equity Fund Market Price test: Decrease FTSE All-World Europe Bmk by 20% (14�04%) €131,959,926 €2�55Currency test: Change GBP/EUR FX rate by 20% (9�45%) €138,993,669 €2�69
Federated Hermes Global High Yield Credit FundEquities down 10% (2�44%) €125,278,849 €1�55Lehman Default (9�55%) €116,148,748 €1�44Interest Rates +100bps 1�59% €130,453,856 €1�62
Federated Hermes Europe ex-UK Equity FundMarket Price test: Decrease FTSE World Europe ex UK Bmk by 20% (15�41%) €181,890,852 €1�49Currency test: Change GBP/EUR FX rate by 20% (11�00%) €191,387,687 €1�56
Federated Hermes US SMID Equity FundMarket Price test: Decrease Russell 2500 Bmk by 20% (13�75%) $922,541,886 $2�40Currency test: Change GBP/USD FX rate by 20% (11�56%) $945,923,250 $2�46
Federated Hermes Asia ex-Japan Equity FundMarket Price test: Decrease MSCI AC Asia ex Japan IMI Bmk by 20% (20�13%) $2,814,418,403 $2�74Currency test: Change GBP/USD FX rate by 20% (8�67%) $3,218,226,161 $3�13
Federated Hermes Global Equity ESG FundMarket Price test: Decrease MSCI AC World Bmk by 20% (13�76%) $826,099,176 $2�36Currency test: Change GBP/USD FX rate up by 20% (11�42%) $848,471,179 $2�42
Federated Hermes Multi-Strategy Credit FundEquities down 10% (1�99%) $973,031,553 $1�60Lehman Default (10�36%) $892,858,982 $1�47Interest Rates +100bps 0�91% $1,000,809,385 $1�65
Federated Hermes Global Small Cap Equity FundMarket Price test: Decrease MSCI World Small Cap by 20% (13�43%) $63,924,547 $2�10Currency test: Change GBP/USD FX rate by 20% (9�19%) $67,056,014 $2�21
Federated Hermes Absolute Return Credit FundEquities down 10% (1�37%) $127,715,406 $1�64Lehman Default (6�40%) $121,202,089 $1�56Interest Rates +100bps 0�56% $130,214,552 $1�68
Federated Hermes SDG Engagement Equity FundMarket Price test: Decrease MSCI AC World SMID Cap by 20% (13�77%) $491,894,657 $1�93Currency test: Change GBP/USD FX rate by 20% (9�93%) $513,804,920 $2�02
8. Financial Risk Management (continued)
Sensitivity analysis (continued)

335
Federated Hermes Investment Funds Public Limited CompanyNotes to the Financial Statements for the financial year ended 31 December 2020 (continued)
Change (%)
Net Asset Value resulting from stress
testPer Share
Federated Hermes Impact Opportunities Equity FundMarket Price test: Decrease MSCI AC World IMI by 20% (14�33%) $217,102,294 $2�15Currency test: Change GBP/USD FX rate by 20% (8�83%) $231,024,367 $2�28
Federated Hermes Unconstrained Credit FundEquities down 10% (2�69%) $505,475,853 $1�46Lehman Default (12�58%) $454,102,344 $1�31Interest Rates +100bps 1�68% $528,175,776 $1�52
Federated Hermes Global Emerging Markets SMID Equity FundMarket Price test: Decrease MSCI AC World IMI by 20% (17�42%) $146,522,610 $2�04Currency test: Change GBP/USD FX rate by 20% (9�40%) $160,748,844 $2�24
Federated Hermes SDG Engagement High Yield Credit FundEquities down 10% (2�51%) $244,699,275 $2�09Lehman Default (12�70%) $219,122,440 $1�87Interest Rates +100bps 1�08% $253,710,152 $2�17
Methodology for Calculating Global Exposure and Leverage
The sub-funds are required by the Prospectus to calculate their exposure to derivatives on a daily basis using one of two alternate methods, the Commitment Approach or Value at Risk (VaR)� The table below details the approach each sub-fund takes�
Sub-Fund Name ApproachFederated Hermes Global Emerging Markets Equity Fund Commitment ApproachFederated Hermes Global Equity Fund Commitment ApproachFederated Hermes European Alpha Equity Fund Commitment ApproachFederated Hermes Global High Yield Credit Fund Commitment ApproachFederated Hermes Europe ex-UK Equity Fund Commitment ApproachFederated Hermes US SMID Equity Fund Commitment ApproachFederated Hermes Asia ex-Japan Equity Fund Commitment ApproachFederated Hermes Global Equity ESG Fund Commitment ApproachFederated Hermes Multi-Strategy Credit Fund VaRFederated Hermes Global Small Cap Equity Fund Commitment ApproachFederated Hermes Absolute Return Credit Fund VaRFederated Hermes SDG Engagement Equity Fund Commitment ApproachFederated Hermes Impact Opportunities Equity Fund Commitment ApproachFederated Hermes Unconstrained Credit Fund VaRFederated Hermes Global Emerging Markets SMID Equity Fund
Commitment Approach
Federated Hermes SDG Engagement High Yield Credit Fund Commitment ApproachFederated Hermes US High Yield Credit Fund Commitment Approach
The commitment conversion methodology for standard derivatives is the market value of the equivalent position in the underlying asset� This may be replaced by the notional value or the price of the futures contract where this is more conservative� Please refer to the relevant portfolio statements for the notional value of the futures contracts�
VaR is a method of estimating potential loss due to market risk, rather than a statement of leverage, using a given confidence level, or probability, over a specific time period and assuming normal market conditions. The VaR is calculated using a Historical Simulation model carried out in accordance with regulatory guidelines�
8. Financial Risk Management (continued)
Sensitivity analysis (continued)

336
Federated Hermes Investment Funds Public Limited CompanyNotes to the Financial Statements for the financial year ended 31 December 2020 (continued)
Value at Risk (VaR)
The table below provides an analysis of the VaR measures and leverage levels* for the Federated Hermes Absolute Return Credit Fund, the Federated Hermes Unconstrained Credit Fund and the Federated Hermes Multi-Strategy Credit Fund which are the only sub-funds to use the VaR approach�
Federated Hermes Absolute Return
Credit Fund
Federated Hermes Unconstrained
Credit Fund
Federated Hermes Multi-Strategy Credit Fund***
Fund Risk Characteristics 2020 2019 2020 2019 2020 2019VaR as at the year end 1�05% 1�51% 1�45% 3�15% 1�27% N/ALowest leverage level employed during the year 158�40% 159�09% 133�10% 136�11% 178�80% N/AHighest leverage level employed during the year 246�60% 234�87% 229�40% 159�06% 220�80% N/AAverage leverage level employed during the year 189�50% 202�06% 204�38% 147�83% 193�13% N/ALowest VaR utilised during the year** 0�86% 1�48% 1�24% 2�69% 1�19% N/AHighest VaR utilised during the year** 4�28% 3�36% 18�92% 6�44% 1�75% N/AAverage VaR utilised during the year** 1�80% 2�52% 4�27% 4�71% 1�43% N/A
VaR Parameters ValueVaR approach AbsoluteSimulation Monte CarloConfidence 99%Reporting time 1 monthHistorical window 250 daysFund type Absolute Return
Some limitations of this VaR analysis are listed below:
• The models are based on historical data and cannot take account of the fact that the future market price movements, correlation between markets and levels of market liquidity in conditions of market stress may bear no relation to historical patterns;
• The market price information is a relative estimate of risk rather than a precise and accurate number;• The market price information represents a hypothetical outcome and is not intended to be predictive (in the
case of the probability-based methods, such as VaR, profits and losses are almost certain to exceed the reported amount with a frequency depending on the confidence interval chosen); and
• Future market conditions could vary significantly from those experienced in the past.
* The leverage has been calculated using the sum of the notionals of the derivatives used�
** The VaR utilised during the year is based on the 20% absolute VaR limit�
*** As Federated Hermes Multi-Strategy Credit Fund changed from Commitment to VaR on 1 October 2020, data above only covers Q4�
Offsetting Financial Assets and Liabilities
The sub-funds enter into derivative transactions under International Swaps and Derivatives Association (ISDA) master agreements�
In general, under ISDA master agreements the amounts owed by each counterparty on a single day in respect of a single transaction outstanding in the same currency are aggregated into a single net amount that is payable by one party to the other� In certain circumstances – e�g� when a credit event such as a default occurs, all outstanding transactions (or certain transactions, specified as “Affected Transactions”) under the agreement are terminated, the termination value is assessed and only a single net amount is payable in settlement of such transactions�
ISDA master agreements can be amended to allow for multi-transactional, cross currency or cross product netting�
8. Financial Risk Management (continued)

337
Federated Hermes Investment Funds Public Limited CompanyNotes to the Financial Statements for the financial year ended 31 December 2020 (continued)
The above agreements do not meet the criteria for offsetting in the Balance Sheet� This is because the Company does not have any currently legally enforceable right to offset recognised amounts, because the right to offset is enforceable only on the occurrence of future events such as a default of the counterparty or other credit events�
The carrying amounts of recognised financial instruments that are subject to the above agreements as at 31 December 2020 on Federated Hermes Global Emerging Markets Equity Fund, Federated Hermes European Alpha Equity Fund, Federated Hermes Europe ex-UK Equity Fund, Federated Hermes US SMID Equity Fund, Federated Hermes Asia ex-Japan Equity Fund, Federated Hermes Global Equity ESG Fund, Federated Hermes SDG Engagement Equity Fund and Federated Hermes Impact Opportunities Equity Fund are as follows:
Gross Amounts of Recognised
Gross Amounts of Recognised
Financial Liabilities off-
set in the
Net Amounts of Financial
Assets presented in
Gross Amounts not offset in the Balance Sheet
Financial Assets
Balance Sheet
the Balance Sheet
Financial Instruments
Cash Collateral Net Amount
Derivatives $ $ $ $ $ $Federated Hermes Global Emerging Markets Equity Fund 3,105,452 – 3,105,452 7,545 – 3,097,907Federated Hermes US SMID Equity Fund 1,292,125 – 1,292,125 2,930 – 1,289,195Federated Hermes Asia ex-Japan Equity Fund 1,111,075 – 1,111,075 7,440 – 1,103,635Federated Hermes Global Equity ESG Fund 4,673,980 – 4,673,980 2,043,788 – 2,630,192Federated Hermes SDG Engagement Equity Fund 6,096,122 – 6,096,122 2,568,603 – 3,527,519Federated Hermes Impact Opportunities Equity Fund 7,607 – 7,607 113 – 7,494
Derivatives € € € € € €Federated Hermes European Alpha Equity Fund 52,310 – 52,310 21,046 – 31,264Federated Hermes Europe ex-UK Equity Fund 8,167 – 8,167 7 – 8,160
8. Financial Risk Management (continued)
Offsetting Financial Assets and Liabilities (continued)

338
Federated Hermes Investment Funds Public Limited CompanyNotes to the Financial Statements for the financial year ended 31 December 2020 (continued)
Gross Amounts of Recognised
Gross Amounts of Recognised
Financial Assets off-set
in the
Net Amounts of Financial
Liabilities presented in
Gross Amounts not offset in the Balance Sheet
Financial Liabilities
Balance Sheet
the Balance Sheet
Financial Instruments
Cash Collateral Net Amount
Derivatives $ $ $ $ $ $Federated Hermes Global Emerging Markets Equity Fund 7,545 – 7,545 7,545 – –Federated Hermes US SMID Equity Fund 2,930 – 2,930 2,930 – –Federated Hermes Asia ex-Japan Equity Fund 7,440 – 7,440 7,440 – –Federated Hermes Global Equity ESG Fund 2,043,788 – 2,043,788 2,043,788 – –Federated Hermes SDG Engagement Equity Fund 2,568,603 – 2,568,603 2,568,603 – –Federated Hermes Impact Opportunities Equity Fund 113 – 113 113 – –
–Derivatives € € € € € €Federated Hermes European Alpha Equity Fund 21,046 – 21,046 21,046 – –Federated Hermes Europe ex-UK Equity Fund 7 – 7 7 – –
8. Financial Risk Management (continued)
Offsetting Financial Assets and Liabilities (continued)

339
Federated Hermes Investment Funds Public Limited CompanyNotes to the Financial Statements for the financial year ended 31 December 2020 (continued)
The carrying amounts of recognised financial instruments that are subject to the above agreements as at 31 December 2019 on Federated Hermes Global Emerging Markets Equity Fund, Federated Hermes European Alpha Equity Fund, Federated Hermes Europe ex-UK Equity Fund, Federated Hermes US SMID Equity Fund, Federated Hermes Asia ex-Japan Fund, Federated Hermes Global Equity ESG Fund, Federated Hermes SDG Engagement Equity Fund and Federated Hermes Impact Opportunities Equity Fund are as follows:
Gross Amounts of Recognised
Gross Amounts of Recognised
Financial Liabilities off-
set in the
Net Amounts of Financial
Assets presented in
Gross Amounts not offset in the Balance Sheet
Financial Assets
Balance Sheet
the Balance Sheet
Financial Instruments
Cash Collateral Net Amount
Derivatives $ $ $ $ $ $Federated Hermes Global Emerging Markets Equity Fund 861,755 – 861,755 6,198 – 855,557Federated Hermes US SMID Equity Fund 533,106 – 533,106 2,320 – 530,786Federated Hermes Asia ex-Japan Equity Fund 770,327 – 770,327 5,021 – 765,306Federated Hermes Global Equity ESG Fund 2,121,419 – 2,121,419 709,794 – 1,411,625Federated Hermes SDG Engagement Equity Fund 2,805,301 – 2,805,301 615,912 – 2,189,389Federated Hermes Impact Opportunities Equity Fund 35 – 35 – – 35
Derivatives € € € € € €Federated Hermes European Alpha Equity Fund 784 – 784 784 – –Federated Hermes Europe ex-UK Equity Fund 1,402 – 1,402 177 – 1,225
8. Financial Risk Management (continued)
Offsetting Financial Assets and Liabilities (continued)

340
Federated Hermes Investment Funds Public Limited CompanyNotes to the Financial Statements for the financial year ended 31 December 2020 (continued)
Gross Amounts of Recognised
Gross Amounts of Recognised
Financial Assets off-set
in the
Net Amounts of Financial
Liabilities presented in
Gross Amounts not offset in the Balance Sheet
Financial Liabilities
Balance Sheet
the Balance Sheet
Financial Instruments
Cash Collateral Net Amount
Derivatives $ $ $ $ $ $Federated Hermes Global Emerging Markets Equity Fund 6,198 – 6,198 6,198 – –Federated Hermes US SMID Equity Fund 2,320 – 2,320 2,320 – –Federated Hermes Asia ex-Japan Equity Fund 5,021 – 5,021 5,021 – –Federated Hermes Global Equity ESG Fund 709,794 – 709,794 709,794 – –Federated Hermes SDG Engagement Equity Fund 615,902 – 615,902 615,902 – –Federated Hermes Impact Opportunities Equity Fund – – – – – –
Derivatives € € € € € €Federated Hermes European Alpha Equity Fund 36,127 – 36,127 784 – 35,343Federated Hermes Europe ex-UK Equity Fund 177 – 177 177 – –
8. Financial Risk Management (continued)
Offsetting Financial Assets and Liabilities (continued)

341
Federated Hermes Investment Funds Public Limited CompanyNotes to the Financial Statements for the financial year ended 31 December 2020 (continued)
The carrying amounts of recognised financial instruments that are subject to the ISDA master agreements as at 31 December 2020 on the Federated Hermes Global High Yield Credit Fund were as follows:
Federated Hermes Global High Yield Credit Fund
Gross Amounts of Recognised
Financial Assets
Gross Amounts of Recognised
Financial Liabilities set-off
in the Balance Sheet
Net Amounts of Financial Assets presented in the
Balance Sheet
Description € € €Derivatives 7,480,371 - 7,480,371
Total 7,480,371 - 7,480,371
Net Amounts of Financial Assets
Gross Amounts not off-set in the Balance Sheet
presented in the Balance Sheet
Financial Instruments
Cash Collateral Net Amount
Counterparty € € € €BNP Paribas 210,973 9,467 - 201,506Credit Suisse 127,244 45,585 - 81,659Goldman Sachs 594,755 91,562 503,193 -JP Morgan 857,414 26,558 790,000 40,856Merrill Lynch 329,072 - 329,072 -Morgan Stanley 54,379 54,379 - -Northern Trust 4,456,290 12,606 - 4,443,684Royal Bank of Canada 424,474 4,170 420,304 -State Street 425,770 - 425,770 -
Total 7,480,371 244,327 2,468,339 4,767,705
8. Financial Risk Management (continued)
Offsetting Financial Assets and Liabilities (continued)

342
Federated Hermes Investment Funds Public Limited CompanyNotes to the Financial Statements for the financial year ended 31 December 2020 (continued)
Gross Amounts
of Recognised Financial Liabilities
Gross Amounts of Recognised
Financial Assets set-off in the
Balance Sheet
Net Amounts of Financial
Liabilities presented in the
Balance SheetDescription € € €Derivatives 3,147,357 - 3,147,357
Total 3,147,357 - 3,147,357
Net Amounts of Financial
LiabilitiesGross Amounts not off-set in the
Balance Sheetpresented in the
Balance SheetFinancial
InstrumentsCash Collateral Net Amount
Counterparty € € € €Barclays Bank 61,550 - 61,550 -BNP Paribas 9,467 9,467 - -Credit Suisse 45,585 45,585 - -Goldman Sachs 91,562 91,562 - -JP Morgan 26,558 26,558 - -Lloyds Bank 518,949 - 150,000 368,949Morgan Stanley 2,376,910 54,379 - 2,322,531Northern Trust 12,606 12,606 - -Royal Bank of Canada 4,170 4,170 - -
Total 3,147,357 244,327 211,550 2,691,480
The carrying amounts of recognised financial instruments that are subject to the ISDA master agreements as at 31 December 2019 on the Federated Hermes Global High Yield Credit Fund were as follows:
Federated Hermes Global High Yield Credit Fund
Gross Amounts of Recognised
Financial Assets
Gross Amounts of Recognised
Financial Liabilities set-off
in the Balance Sheet
Net Amounts of Financial Assets presented in the
Balance Sheet
Description € € €Derivatives 2,826,749 - 2,826,749
Total 2,826,749 - 2,826,749
8. Financial Risk Management (continued)
Offsetting Financial Assets and Liabilities (continued)
Federated Hermes Global High Yield Credit Fund (continued)

343
Federated Hermes Investment Funds Public Limited CompanyNotes to the Financial Statements for the financial year ended 31 December 2020 (continued)
Net Amounts of Financial Assets
Gross Amounts not off-set in the Balance Sheet
presented in the Balance Sheet
Financial Instruments
Cash Collateral Net Amount
Counterparty € € € €Barclays Bank 589,001 - - 589,001Citigroup 1,130 - - 1,130Credit Suisse 67,752 4,481 - 63,271Goldman Sachs 180,698 8,263 172,435 -HSBC Bank 159,630 - 159,630 -JP Morgan 174,960 - 174,960 -Merrill Lynch 451,870 12,072 310,000 129,798Morgan Stanley 448,113 - - 448,113Northern Trust 746,020 195,217 - 550,803State Street 7,575 7,575 - -
Total 2,826,749 227,608 817,025 1,782,116
Gross Amounts of Recognised
Financial Liabilities
Gross Amounts of Recognised
Financial Assets set-off in the
Balance Sheet
Net Amounts of Financial
Liabilities presented in the
Balance SheetDescription € € €Derivatives 287,175 - 287,175
Total 287,175 - 287,175
Net Amounts of Financial
LiabilitiesGross Amounts not off-set in the
Balance Sheetpresented in the
Balance SheetFinancial
InstrumentsCash Collateral Net Amount
Counterparty € € € €Credit Suisse 4,481 4,481 - -Goldman Sachs 8,263 8,263 - -Merrill Lynch 12,072 12,072 - -Morgan Stanley - - - -Northern Trust 195,217 195,217 - -State Street 67,142 7,575 - 59,567
Total 287,175 227,608 - 59,567
8. Financial Risk Management (continued)
Offsetting Financial Assets and Liabilities (continued)
Federated Hermes Global High Yield Credit Fund (continued)

344
Federated Hermes Investment Funds Public Limited CompanyNotes to the Financial Statements for the financial year ended 31 December 2020 (continued)
The carrying amounts of recognised financial instruments that are subject to ISDA master agreements as at 31 December 2020 on Federated Hermes Multi Strategy Credit Fund were as follows:
Federated Hermes Multi Strategy Credit Fund
Gross Amounts of Recognised
Financial Assets
Gross Amounts of Recognised
Financial Liabilities set-off
in the Balance Sheet
Net Amounts of Financial Assets presented in the
Balance Sheet
Description $ $ $Derivatives 24,813,845 - 24,813,845
Total 24,813,845 - 24,813,845
Net Amounts of Financial Assets
Gross Amounts not off-set in the
Balance Sheetpresented in the
Balance SheetFinancial
InstrumentsCash Collateral Net Amount
Counterparty $ $ $ $BNP Paribas 1,563,475 – 1,563,475 –Credit Suisse 330,771 330,771 – –Goldman Sachs 3,865,089 3,865,089 – –JP Morgan 5,004,775 315,256 4,689,519 –Merrill Lynch 129,364 129,364 – –Morgan Stanley 2,361,758 2,361,758 – –Northern Trust 11,558,613 38,836 – 11,519,777
Total 24,813,845 7,041,074 6,252,994 11,519,777
Gross Amounts of Recognised
Financial Liabilities
Gross Amounts of Recognised
Financial Assets set-off in the
Balance Sheet
Net Amounts of Financial
Liabilities presented in the
Balance SheetDescription $ $ $Derivatives 33,788,104 - 33,788,104
Total 33,788,104 - 33,788,104
8. Financial Risk Management (continued)
Offsetting Financial Assets and Liabilities (continued)

345
Federated Hermes Investment Funds Public Limited CompanyNotes to the Financial Statements for the financial year ended 31 December 2020 (continued)
Net Amounts of Financial
Liabilities Gross Amounts not off-set in the
Balance Sheetpresented in the
Balance SheetFinancial
InstrumentsCash Collateral Net Amount
Counterparty $ $ $ $Barclays Bank 1,441,968 – 1,441,968 –Credit Suisse 1,200,926 330,771 870,155 –Goldman Sachs 7,315,142 3,865,089 3,430,000 20,053JP Morgan 315,256 315,256 – –Merrill Lynch 2,335,789 129,364 2,190,000 16,425Morgan Stanley 19,539,213 2,361,758 509,078 16,668,377Northern Trust 38,836 38,836 – –Royal Bank of Canada 214,774 – 214,774 –State Street 1,386,200 – 1,360,000 26,200
Total 33,788,104 7,041,074 10,015,975 16,731,055
The carrying amounts of recognised financial instruments that are subject to ISDA master agreements as at 31 December 2019 on Federated Hermes Multi Strategy Credit Fund were as follows:
Federated Hermes Multi Strategy Credit Fund
Gross Amounts of Recognised
Financial Assets
Gross Amounts of Recognised
Financial Liabilities set-off
in the Balance Sheet
Net Amounts of Financial Assets presented in the
Balance Sheet
Description $ $ $Derivatives 32,852,068 - 32,852,068
Total 32,852,068 - 32,852,068
Net Amounts of Financial Assets
Gross Amounts not off-set in the
Balance Sheetpresented in the
Balance SheetFinancial
InstrumentsCash Collateral Net Amount
Counterparty $ $ $ $Citigroup 17,652 17,652 – –Credit Suisse 3,396,924 240,125 3,156,799 –Goldman Sachs 9,689,922 9,689,922 – –JP Morgan 1,204,593 1,204,593 – –Merrill Lynch 461,183 – 370,000 91,183Morgan Stanley 3,424,456 3,424,456 – –Northern Trust 13,488,032 13,040 13,474,992 –Royal Bank of Canada 584,268 399,380 184,888 –State Street 585,038 14,330 570,708 –
Total 32,852,068 15,003,498 17,757,387 91,183
8. Financial Risk Management (continued)
Offsetting Financial Assets and Liabilities (continued)
Federated Hermes Multi Strategy Credit Fund (continued)

346
Federated Hermes Investment Funds Public Limited CompanyNotes to the Financial Statements for the financial year ended 31 December 2020 (continued)
Gross Amounts of Recognised
Financial Liabilities
Gross Amounts of Recognised
Financial Assets set-off in the
Balance Sheet
Net Amounts of Financial
Liabilities presented in the
Balance SheetDescription $ $ $Derivatives 57,939,379 - 57,939,379
Total 57,939,379 - 57,939,379
Net Amounts of Financial
Liabilities Gross Amounts not off-set in the
Balance Sheetpresented in the
Balance SheetFinancial
InstrumentsCash Collateral Net Amount
Counterparty $ $ $ $Barclays Bank 3,236,511 – 3,236,511 –BNP Paribas 1,634,686 – 610,000 1,024,686Citigroup 2,214,992 17,652 2,107,340 –Credit Suisse 240,125 240,125 – –Goldman Sachs 15,615,152 9,689,922 5,925,230 –JP Morgan 7,875,766 1,204,593 6,650,000 21,173Morgan Stanley 26,785,397 3,424,456 4,505,059 18,855,882Northern Trust 13,040 13,040 – –Royal Bank of Canada 399,380 399,380 – –State Street 14,330 14,330 – –
Total 57,939,379 15,003,498 23,034,140 19,901,741
The carrying amounts of recognised financial instruments that are subject to ISDA master agreements as at 31 December 2020 on Federated Hermes Absolute Return Credit Fund were as follows:
Federated Hermes Absolute Return Credit Fund
Gross Amounts of Recognised
Financial Assets
Gross Amounts of Recognised
Financial Liabilities set-off
in the Balance Sheet
Net Amounts of Financial Assets presented in the
Balance Sheet
Description $ $ $Derivatives 14,669,361 - 14,669,361
Total 14,669,361 - 14,669,361
8. Financial Risk Management (continued)
Offsetting Financial Assets and Liabilities (continued)
Federated Hermes Multi Strategy Credit Fund (continued)

347
Federated Hermes Investment Funds Public Limited CompanyNotes to the Financial Statements for the financial year ended 31 December 2020 (continued)
Net Amounts of Financial Assets
Gross Amounts not off-set in the Balance Sheet
presented in the Balance Sheet
Financial Instruments
Cash Collateral Net Amount
Counterparty $ $ $ $BNP Paribas 250,064 6,605 – 243,459Credit Suisse 760,287 231,844 528,443 –Goldman Sachs 852,534 852,534 – –JP Morgan 1,936,100 125,975 1,810,125 –Merrill Lynch 447,255 447,255 – –Morgan Stanley 2,447,897 2,447,897 – –Northern Trust 7,975,224 25,031 – 7,950,193
Total 14,669,361 4,137,141 2,338,568 8,193,652
Gross Amounts of Recognised
Financial Liabilities
Gross Amounts of Recognised
Financial Assets set-off in the
Balance Sheet
Net Amounts of Financial
Liabilities presented in the
Balance SheetDescription $ $ $Derivatives 14,856,068 - 14,856,068
Total 14,856,068 - 14,856,068
Net Amounts of Financial
Liabilities Gross Amounts not off-set in the
Balance Sheetpresented in the
Balance SheetFinancial
InstrumentsCash Collateral Net Amount
Counterparty $ $ $ $Barclays Bank 38,057 – – 38,057BNP Paribas 6,605 6,605 – –Credit Suisse 231,844 231,844 – –Goldman Sachs 2,278,242 852,534 1,380,000 45,708JP Morgan 125,975 125,975 – –Merrill Lynch 1,213,398 447,255 766,143 –Morgan Stanley 9,732,391 2,447,897 1,822,024 5,462,470Northern Trust 25,031 25,031 – –Royal Bank of Canada 195,673 – 195,673 –State Street 1,008,852 – 1,008,852 –
Total 14,856,068 4,137,141 5,172,692 5,546,235
8. Financial Risk Management (continued)
Offsetting Financial Assets and Liabilities (continued)
Federated Hermes Absolute Return Credit Fund (continued)

348
Federated Hermes Investment Funds Public Limited CompanyNotes to the Financial Statements for the financial year ended 31 December 2020 (continued)
The carrying amounts of recognised financial instruments that are subject to ISDA master agreements as at 31 December 2019 on Federated Hermes Absolute Return Credit Fund were as follows:
Federated Hermes Absolute Return Credit Fund
Gross Amounts of Recognised
Financial Assets
Gross Amounts of Recognised
Financial Liabilities set-off
in the Balance Sheet
Net Amounts of Financial Assets presented in the
Balance Sheet
Description $ $ $Derivatives 4,831,660 - 4,831,660
Total 4,831,660 - 4,831,660
Net Amounts of Financial Assets
Gross Amounts not off-set in the Balance Sheet
presented in the Balance Sheet
Financial Instruments
Cash Collateral Net Amount
Counterparty $ $ $ $Barclays Bank 526,741 234,280 260,000 32,461BNP Paribas 45,553 45,553 – –Citigroup 10,612 10,612 – –Credit Suisse 436,584 25,761 410,000 823Goldman Sachs 954,061 954,061 – –JP Morgan 124,567 124,567 – –Merrill Lynch 368,659 – 368,659 –Morgan Stanley 372,507 372,507 – –Northern Trust 1,553,130 – – 1,553,130Royal Bank of Canada 75,740 75,740 – –State Bank of India 287,666 – – 287,666State Street 75,840 31,461 – 44,379
Total 4,831,660 1,874,542 1038,659 1,918,459
Gross Amounts of Recognised
Financial Liabilities
Gross Amounts of Recognised
Financial Assets set-off in the
Balance Sheet
Net Amounts of Financial
Liabilities presented in the
Balance SheetDescription $ $ $Derivatives 6,814,314 - 6,814,314
Total 6,814,314 - 6,814,314
8. Financial Risk Management (continued)
Offsetting Financial Assets and Liabilities (continued)

349
Federated Hermes Investment Funds Public Limited CompanyNotes to the Financial Statements for the financial year ended 31 December 2020 (continued)
Net Amounts of Financial
Liabilities Gross Amounts not off-set in the
Balance Sheetpresented in the
Balance SheetFinancial
InstrumentsCash Collateral Net Amount
Counterparty $ $ $ $Barclays 234,280 234,280 – –BNP Paribas 67,239 45,553 – 21,686Citigroup 200,184 10,612 – 189,572Credit Suisse 25,761 25,761 – –Goldman Sachs 1,769,415 954,061 815,354 –JP Morgan 539,644 124,567 350,000 65,077Merrill Lynch 3,836,356 372,507 2,221,131 1,242,718Royal Bank of Canada 109,974 75,740 – 34,234State Street 31,461 31,461 – –
Total 6,814,314 1,874,542 3,386,485 1,553,287
The carrying amounts of recognised financial instruments that are subject to ISDA master agreements as at 31 December 2020 on Federated Hermes Unconstrained Credit Fund were as follows:
Federated Hermes Unconstrained Credit Fund
Gross Amounts of Recognised
Financial Assets
Gross Amounts of Recognised
Financial Liabilities set-off
in the Balance Sheet
Net Amounts of Financial Assets presented in the
Balance Sheet
Description $ $ $Derivatives 32,493,748 - 32,493,748
Total 32,493,748 - 32,493,748
Net Amounts of Financial Assets
Gross Amounts not off-set in the Balance Sheet
presented in the Balance Sheet
Financial Instruments
Cash Collateral presented in the Balance
SheetCounterparty $ $ $ $BNP Paribas 25,964 2,231 23,733 –Citigroup 480,162 – 480,162 –Credit Suisse 389,772 50,227 339,545 –Goldman Sachs 2,100,088 290,168 1,750,000 59,920JP Morgan 2,711,744 20,565 2,691,179 –Lloyds Bank 7,183 – – 7,183Merrill Lynch 2,291,446 5,792 2,285,654 –Morgan Stanley 5,524,712 5,524,712 – –Northern Trust 18,962,677 20,251 – 18,942,426
Total 32,493,748 5,913,946 7,570,273 19,009,529
8. Financial Risk Management (continued)
Offsetting Financial Assets and Liabilities (continued)
Federated Hermes Absolute Return Credit Fund (continued)

350
Federated Hermes Investment Funds Public Limited CompanyNotes to the Financial Statements for the financial year ended 31 December 2020 (continued)
Gross Amounts of Recognised
Financial Liabilities
Gross Amounts of Recognised
Financial Assets set-off in the
Balance Sheet
Net Amounts of Financial
Liabilities presented in the
Balance SheetDescription $ $ $Derivatives 31,781,201 - 31,781,201
Total 31,781,201 - 31,781,201
Net Amounts of Financial
Liabilities Gross Amounts not off-set in the
Balance Sheetpresented in the
Balance SheetFinancial
InstrumentsCash Collateral Net Amount
Counterparty $ $ $ $Barclays Bank 377,140 – 377,140 –BNP Paribas 2,231 2,231 – –Credit Suisse 50,227 50,227 – –Goldman Sachs 290,168 290,168 – –JP Morgan 20,565 20,565 – –Merrill Lynch 5,792 5,792 – –Morgan Stanley 28,004,820 5,524,712 15,308,476 7,171,632Northern Trust 20,251 20,251 – –Royal Bank of Canada 627,486 – 627,486 –State Street 2,382,521 – 2,382,521 –
Total 31,781,201 5,913,946 18,695,623 7,171,632
The carrying amounts of recognised financial instruments that are subject to ISDA master agreements as at 31 December 2019 on Federated Hermes Unconstrained Credit Fund were as follows:
Federated Hermes Unconstrained Credit Fund
Gross Amounts of Recognised
Financial Assets
Gross Amounts of Recognised
Financial Liabilities set-off
in the Balance Sheet
Net Amounts of Financial Assets presented in the
Balance Sheet
Description $ $ $Derivatives 15,642,521 - 15,642,521
Total 15,642,521 - 15,642,521
8. Financial Risk Management (continued)
Offsetting Financial Assets and Liabilities (continued)
Federated Hermes Unconstrained Credit Fund (continued)

351
Federated Hermes Investment Funds Public Limited CompanyNotes to the Financial Statements for the financial year ended 31 December 2020 (continued)
Net Amounts of Financial Assets
Gross Amounts not off-set in the Balance Sheet
presented in the Balance Sheet
Financial Instruments
Cash Collateral Net Amount
Counterparty $ $ $ $Barclays Bank 5,578 – – 5,578Citigroup 467,369 – 467,369 –Credit Suisse 154,439 95,167 59,272 –Goldman Sachs 2,725,796 23,188 2,670,000 32,608JP Morgan 186,250 76,968 109,282 –Merrill Lynch 1,529,429 37,640 1,250,000 241,789Morgan Stanley 2,116,059 2,116,059 – –Northern Trust 7,862,318 3,864 – 7,858,454Royal Bank of Canada 297,446 297,446 – –State Street 297,837 – 297,837 –
Total 15,642,521 2,650,332 4,853,760 8,138,429
Gross Amounts of Recognised
Financial Liabilities
Gross Amounts of Recognised
Financial Assets set-off in the
Balance Sheet
Net Amounts of Financial
Liabilities presented in the
Balance SheetDescription $ $ $Derivatives 14,904,243 - 14,904,243
Total 14,904,243 - 14,904,243
Net Amounts of Financial
Liabilities Gross Amounts not off-set in the
Balance Sheetpresented in the
Balance SheetFinancial
InstrumentsCash Collateral Net Amount
Counterparty $ $ $ $Credit Suisse 95,167 95,167 – –Goldman Sachs 23,188 23,188 – –JP Morgan 76,968 76,968 – –Merrill Lynch 37,640 37,640 – –Morgan Stanley 14,187,002 2,116,059 12,070,943 –Northern Trust 3,864 3,864 – –Royal Bank of Canada 480,414 297,446 – 182,968
Total 14,904,243 2,650,332 12,070,943 182,968
8. Financial Risk Management (continued)
Offsetting Financial Assets and Liabilities (continued)
Federated Hermes Unconstrained Credit Fund (continued)

352
Federated Hermes Investment Funds Public Limited CompanyNotes to the Financial Statements for the financial year ended 31 December 2020 (continued)
The carrying amounts of recognised financial instruments that are subject to ISDA master agreements as at 31 December 2020 on Federated Hermes SDG Engagement High Yield Credit Fund were as follows:
Federated Hermes SDG Engagement High Yield Credit Fund
Gross Amounts of Recognised
Financial Assets
Gross Amounts of Recognised
Financial Liabilities set-off
in the Balance Sheet
Net Amounts of Financial Assets presented in the
Balance Sheet
Description $ $ $Derivatives 4,440,730 - 4,440,730
Total 4,440,730 - 4,440,730
Net Amounts of Financial Assets
Gross Amounts not off-set in the Balance Sheet
presented in the Balance Sheet
Financial Instruments
Cash Collateral Net Amount
Counterparty $ $ $ $BNP Paribas 706,783 – 690,000 16,783Citigroup 159,680 – – 159,680Credit Suisse 697,329 44,019 600,000 53,310Goldman Sachs 289,272 5,792 260,000 23,480JP Morgan 1,024,887 – 1,024,887 –Merrill Lynch 106,703 22,009 – 84,694Morgan Stanley 104,856 104,856 – –Northern Trust 1,335,302 14,279 – 1,321,023Royal Bank of Canada 15,918 15,918 – –
Total 4,440,730 206,873 2,574,887 1,658,970
Gross Amounts of Recognised
Financial Liabilities
Gross Amounts of Recognised
Financial Assets set-off in the
Balance Sheet
Net Amounts of Financial
Liabilities presented in the
Balance SheetDescription $ $ $Derivatives 4,291,070 - 4,291,070
Total 4,291,070 - 4,291,070
8. Financial Risk Management (continued)
Offsetting Financial Assets and Liabilities (continued)

353
Federated Hermes Investment Funds Public Limited CompanyNotes to the Financial Statements for the financial year ended 31 December 2020 (continued)
Net Amounts of Financial
Liabilities Gross Amounts not off-set in the
Balance Sheetpresented in the
Balance SheetFinancial
InstrumentsCash Collateral Net Amount
Counterparty $ $ $ $Credit Suisse 44,019 44,019 – –Goldman Sachs 5,792 5,792 – –Merrill Lynch 22,009 22,009 – –Morgan Stanley 2,518,890 104,856 – 2,414,034Northern Trust 14,279 14,279 – –Royal Bank of Canada 439,818 15,918 423,900 –State Street 1,246,263 – 1,246,263 –
Total 4,291,070 206,873 1,670,163 2,414,034
The carrying amounts of recognised financial instruments that are subject to ISDA master agreements as at 31 December 2019 on Federated Hermes SDG Engagement High Yield Credit Fund were as follows:
Federated Hermes SDG Engagement High Yield Credit Fund
Gross Amounts of Recognised
Financial Assets
Gross Amounts of Recognised
Financial Liabilities set-off
in the Balance Sheet
Net Amounts of Financial Assets presented in the
Balance Sheet
Description $ $ $Derivatives 3,652,980 - 3,652,980
Total 3,652,980 - 3,652,980
Net Amounts of Financial Assets
Gross Amounts not off-set in the Balance Sheet
presented in the Balance Sheet
Financial Instruments
Cash Collateral Net Amount
Counterparty $ $ $ $BNP Paribas 371,617 – 250,000 121,617Citigroup 85,716 – – 85,716Credit Suisse 593,907 – 593,907 –Goldman Sachs 242,994 – 242,994 –JP Morgan 84,075 – – 84,075Morgan Stanley 490,549 490,549 – –Northern Trust 1,587,466 913 – 1,586,553Royal Bank of Canada 98,263 98,263 – –State Street 98,393 6,891 – 98,393
Total 3,652,980 596,616 1,086,901 1,976,354
8. Financial Risk Management (continued)
Offsetting Financial Assets and Liabilities (continued)
Federated Hermes SDG Engagement High Yield Credit Fund (continued)

354
Federated Hermes Investment Funds Public Limited CompanyNotes to the Financial Statements for the financial year ended 31 December 2020 (continued)
Gross Amounts of Recognised
Financial Liabilities
Gross Amounts of Recognised
Financial Assets set-off in the
Balance Sheet
Net Amounts of Financial
Liabilities presented in the
Balance SheetDescription $ $ $Derivatives 1,266,589 - 1,266,589
Total 1,266,589 - 1,266,589
Net Amounts of Financial
Liabilities Gross Amounts not off-set in the
Balance Sheetpresented in the
Balance SheetFinancial
InstrumentsCash Collateral Net Amount
Counterparty $ $ $ $Morgan Stanley 1,070,671 490,549 – 580,122Northern Trust 913 913 – –Royal Bank of Canada 188,114 98,263 – 89,851State Street 6,891 6,891 – –
Total 1,266,589 596,616 – 669,973
9. Exchange Rates
The 31 December 2020 and 31 December 2019 year end exchange rates were as follows:
Exchange rate from US$31 December 2020 31 December 2019
Australian Dollar 1�2959 1�4226Brazilian Real 5�1942 4�0227Canadian Dollar 1�2740 1�2968Czech Koruna 21�4638 22�6406Danish Krone 6�0835 6�6570Egyptian Pound 15�7300 16�0500Euro 0�8173 0�8909Hong Kong Dollar 7�7539 7�7918Hungarian Forint 296�4203 294�6192Indian Rupee 73�0675 71�3782Indonesian Rupiah 14,050�0000 13,882�5000Japanese Yen 103�2450 108�6750Korean Won 1,086�3000 1,156�4500Mexican Peso 19�9255 18�8840Norwegian Krone 8�5620 8�7873Philippine Peso 48�0235 50�6450Pound Sterling 0�7316 0�7549Russian Ruble 73�9644 62�1113Singapore Dollar 1�3217 1�3447South African Rand 14�6888 13�9835Swedish Krona 8�2126 9�3611Swiss Franc 0�8840 0�9684Taiwan Dollar 28�0980 29�9770Thai Baht 29�9600 29�9538Turkish Lira 7�4325 5�9510UAE Dirham 3�6732 3�6732Yuan Offshore 6�4967 6�9652
8. Financial Risk Management (continued)
Offsetting Financial Assets and Liabilities (continued)
Federated Hermes SDG Engagement High Yield Credit Fund (continued)

355
Federated Hermes Investment Funds Public Limited CompanyNotes to the Financial Statements for the financial year ended 31 December 2020 (continued)
Exchange rate from €31 December 2020 31 December 2019
Danish Krone 7�4435 7�4725Norwegian Krone 10�4760 9�8637Pound Sterling 0�8951 0�8473Swedish Krona 10�0485 10�5078Swiss Franc 1�0816 1�0870US Dollar 1�2236 1�1225
Exchange rate from £31 December 2020 31 December 2019
Euro 1�1172 1�1802Hong Kong Dollar 10�5991 10�3222Japanese Yen 141�1309 143�9672New Zealand Dollar 1�8985 1�9636US Dollar 1�3670 1�3248Yuan Offshore 8�8806 9�2271
10. Soft Commission Arrangements
There were no soft commission arrangements affecting the Company during the financial year ended 31 December 2020 or 31 December 2019�
11. Taxation
Under current law and practice the Company qualifies as an investment undertaking as defined in Section 739B of the Taxes Consolidation Act, 1997, as amended� On that basis, it is not chargeable to Irish tax on its income or gains�
However, Irish tax may arise on the happening of a "chargeable event"� A chargeable event includes any distribution payments to shareholders or any encashment, redemption, cancellation or transfer of redeemable participating shares�
No Irish tax will arise on the Company in respect of chargeable events in respect of:
(a) a shareholder who is neither Irish resident nor ordinarily resident in Ireland for tax purposes, at the time of the chargeable event, provided appropriate valid declarations in accordance with the provisions of the Taxes Consolidation Act, 1997, as amended, are held by the Company; and
(b) certain exempted Irish tax resident shareholders who have provided the Company with the necessary signed statutory declarations�
Dividends, interest and capital gains (if any) received on investments made by the Company may be subject to withholding taxes imposed by the country from which the investment income/gains are received and such taxes may not be recoverable by the Company or its shareholders�
12. Net Asset Value Per Redeemable Participating Share
The Net Asset Value per redeemable participating share of each sub-fund of the Company is determined by dividing the value of the net assets of the sub-fund by the total number of redeemable participating shares in issue�
9. Exchange Rates (continued)

356
Federated Hermes Investment Funds Public Limited CompanyNotes to the Financial Statements for the financial year ended 31 December 2020 (continued)
13. Contingent liabilities and outstanding commitments
Contingent liabilities at the balance sheet date related to restricted cash held to settle any potential US Withholding tax liability per sub-fund� These were as follows:
WHT as at 31 Dec 2020
Federated Hermes Global Equity Fund (2,075,404�54)Federated Hermes US SMID Equity Fund (3,864,510�76)Federated Hermes Asia ex-Japan Equity Fund (46,922�42)Federated Hermes Global Equity ESG Fund (361,273�61)Federated Hermes Multi-Strategy Credit Fund (1,096�89)Federated Hermes Global Small Cap Equity Fund (106,637�91)Federated Hermes SDG Engagement Equity Fund (4,772�58)Federated Hermes Impact Opportunities Equity Fund (2,542�85)
(6,463,161.56)
WHT as at 31 Dec 2019
Federated Hermes Global Equity Fund (2,075,404�54)Federated Hermes US SMID Equity Fund (3,864,510�76)Federated Hermes Asia ex-Japan Equity Fund (46,922�42)Federated Hermes Global Equity ESG Fund (361,273�61)Federated Hermes Multi-Strategy Credit Fund (1,096�89)Federated Hermes Global Small Cap Equity Fund (106,637�91)Federated Hermes SDG Engagement Equity Fund (4,772�58)Federated Hermes Impact Opportunities Equity Fund (2,542�85)
(6,463,161.56)

357
Federated Hermes Investment Funds Public Limited CompanyNotes to the Financial Statements for the financial year ended 31 December 2020 (continued)
14. Distributions
The following distributions were declared during the financial year ended 31 December 2020:
Federated Hermes Global Emerging Markets Equity FundDistributing Distribution Date AmountClass per unit Declared Ex-date Record Date Date paid $ Relevant periodClass F2 GBP 0�006172 31/12/2019 02/01/2020 31/12/2019 03/02/2020 469,046 01/07/2019 - 31/12/2019Class F2 EUR 0�011808 31/12/2019 02/01/2020 31/12/2019 03/02/2020 822,844 01/07/2019 - 31/12/2019Class F2 USD 0�012078 31/12/2019 02/01/2020 31/12/2019 03/02/2020 252,802 01/07/2019 - 31/12/2019Class F2 GBP Hedged
0�004040 31/12/2019 02/01/2020 31/12/2019 03/02/2020 120 01/07/2019 - 31/12/2019
Class R2 USD 0�003988 31/12/2019 02/01/2020 31/12/2019 03/02/2020 8,198 01/07/2019 - 31/12/2019Class R2 EUR 0�003818 31/12/2019 02/01/2020 31/12/2019 03/02/2020 46,447 01/07/2019 - 31/12/2019Class R2 EUR Hedged
0�003415 31/12/2019 02/01/2020 31/12/2019 03/02/2020 3,657 01/07/2019 - 31/12/2019
Class J2 GBP 0�007647 31/12/2019 02/01/2020 31/12/2019 03/02/2020 1,811,914 01/07/2019 - 31/12/2019Class J2 USD 0�015317 31/12/2019 02/01/2020 31/12/2019 03/02/2020 207,846 01/07/2019 - 31/12/2019Class J2 EUR 0�015153 31/12/2019 02/01/2020 31/12/2019 03/02/2020 428,116 01/07/2019 - 31/12/2019Class J2 GBP Hedged
0�006464 31/12/2019 02/01/2020 31/12/2019 03/02/2020 76,755 01/07/2019 - 31/12/2019
Class J2 EUR Hedged
0�013140 31/12/2019 02/01/2020 31/12/2019 03/02/2020 971 01/07/2019 - 31/12/2019
Class F2 SGD 0�014640 31/12/2019 02/01/2020 31/12/2019 03/02/2020 4 01/07/2019 - 31/12/2019Class R2 SGD 0�005220 31/12/2019 02/01/2020 31/12/2019 03/02/2020 1 01/07/2019 - 31/12/2019Class A2 USD 0�001520 31/12/2019 02/01/2020 31/12/2019 03/02/2020 1 01/07/2019 - 31/12/2019Class F2 GBP 0�005393 30/06/2020 01/07/2020 30/06/2020 22/07/2020 287,892 01/01/2020 - 30/06/2020Class F2 EUR 0�009641 30/06/2020 01/07/2020 30/06/2020 22/07/2020 695,096 01/01/2020 - 30/06/2020Class F2 USD 0�009881 30/06/2020 01/07/2020 30/06/2020 22/07/2020 224,513 01/01/2020 - 30/06/2020Class F2 GBP Hedged
0�003488 30/06/2020 01/07/2020 30/06/2020 22/07/2020 955 01/01/2020 - 30/06/2020
Class F2 EUR Hedged
0�006394 30/06/2020 01/07/2020 30/06/2020 22/07/2020 76 01/01/2020 - 30/06/2020
Class R2 USD 0�002518 30/06/2020 01/07/2020 30/06/2020 22/07/2020 6,781 01/01/2020 - 30/06/2020Class R2 EUR 0�002392 30/06/2020 01/07/2020 30/06/2020 22/07/2020 28,617 01/01/2020 - 30/06/2020Class R2 EUR Hedged
0�001890 30/06/2020 01/07/2020 30/06/2020 22/07/2020 4,018 01/01/2020 - 30/06/2020
Class J2 GBP 0�006970 30/06/2020 01/07/2020 30/06/2020 22/07/2020 1,951,957 01/01/2020 - 30/06/2020Class J2 USD 0�012905 30/06/2020 01/07/2020 30/06/2020 22/07/2020 220,202 01/01/2020 - 30/06/2020Class J2 EUR 0�012879 30/06/2020 01/07/2020 30/06/2020 22/07/2020 398,888 01/01/2020 - 30/06/2020Class J2 GBP Hedged
0�005716 30/06/2020 01/07/2020 30/06/2020 22/07/2020 73,125 01/01/2020 - 30/06/2020
Class J2 EUR Hedged
0�010686 30/06/2020 01/07/2020 30/06/2020 22/07/2020 933 01/01/2020 - 30/06/2020
Class A2 USD 0�007000 30/06/2020 01/07/2020 30/06/2020 22/07/2020 4 01/01/2020 - 30/06/20208,021,779

358
Federated Hermes Investment Funds Public Limited CompanyNotes to the Financial Statements for the financial year ended 31 December 2020 (continued)
Federated Hermes Global Equity FundDistributing Distribution Date AmountClass per unit Declared Ex-date Record Date Date paid $ Relevant periodClass F2 GBP 0�025513 31/12/2019 02/01/2020 31/12/2019 03/02/2020 597 01/07/2019 - 31/12/2019Class F2 EUR 0�039520 31/12/2019 02/01/2020 31/12/2019 03/02/2020 22 01/07/2019 - 31/12/2019Class A2 USD 0�033285 31/12/2019 02/01/2020 31/12/2019 03/02/2020 64,211 01/07/2019 - 31/12/2019Class B2 USD 0�022860 31/12/2019 02/01/2020 31/12/2019 03/02/2020 11 01/07/2019 - 31/12/2019Class F2 GBP 0�017265 30/06/2020 01/07/2020 30/06/2020 22/07/2020 457 01/01/2020 - 30/06/2020Class A2 USD 0�020787 30/06/2020 01/07/2020 30/06/2020 22/07/2020 100,574 01/01/2020 - 30/06/2020Class B2 USD 0�012220 30/06/2020 01/07/2020 30/06/2020 22/07/2020 6 01/01/2020 - 30/06/2020
165,878
Federated Hermes European Alpha Equity FundDistributing Distribution Date AmountClass per unit Declared Ex-date Record Date Date paid € Relevant periodClass F2 GBP 0�014848 31/12/2019 02/01/2020 31/12/2019 03/02/2020 405 01/07/2019 - 31/12/2019Class F2 EUR 0�024874 31/12/2019 02/01/2020 31/12/2019 03/02/2020 44,776 01/07/2019 - 31/12/2019Class F2 USD 0�020068 31/12/2019 02/01/2020 31/12/2019 03/02/2020 3,262 01/07/2019 - 31/12/2019Class S2 GBP 0�012779 31/12/2019 02/01/2020 31/12/2019 03/02/2020 5,630 01/07/2019 - 31/12/2019Class S2 EUR 0�027586 31/12/2019 02/01/2020 31/12/2019 03/02/2020 14 01/07/2019 - 31/12/2019Class S2 GBP Hedged
0�012359 31/12/2019 02/01/2020 31/12/2019 03/02/2020 10,134 01/07/2019 - 31/12/2019
Class S2 USD 0�021150 31/12/2019 02/01/2020 31/12/2019 03/02/2020 5,364 01/07/2019 - 31/12/2019Class S2 USD Hedged
0�026646 31/12/2019 02/01/2020 31/12/2019 03/02/2020 711 01/07/2019 - 31/12/2019
Class M2 EUR 0�026748 31/12/2019 02/01/2020 31/12/2019 03/02/2020 5,061 01/07/2019 - 31/12/2019Class R2 EUR 0�011576 31/12/2019 02/01/2020 31/12/2019 03/02/2020 293 01/07/2019 - 31/12/2019Class F2 GBP 0�029262 30/06/2020 01/07/2020 30/06/2020 22/07/2020 742 01/01/2020 - 30/06/2020Class F2 EUR 0�045499 30/06/2020 01/07/2020 30/06/2020 22/07/2020 21,008 01/01/2020 - 30/06/2020Class S2 GBP 0�024275 30/06/2020 01/07/2020 30/06/2020 22/07/2020 6,655 01/01/2020 - 30/06/2020Class S2 GBP Hedged
0�023439 30/06/2020 01/07/2020 30/06/2020 22/07/2020 15,793 01/01/2020 - 30/06/2020
Class S2 USD 0�037192 30/06/2020 01/07/2020 30/06/2020 22/07/2020 9,448 01/01/2020 - 30/06/2020Class S2 USD Hedged
0�050119 30/06/2020 01/07/2020 30/06/2020 22/07/2020 1,340 01/01/2020 - 30/06/2020
Class M2 EUR 0�045573 30/06/2020 01/07/2020 30/06/2020 22/07/2020 8,279 01/01/2020 - 30/06/2020Class R2 EUR 0�028252 30/06/2020 01/07/2020 30/06/2020 22/07/2020 715 01/01/2020 - 30/06/2020
139,630
14. Distributions (continued)

359
Federated Hermes Investment Funds Public Limited CompanyNotes to the Financial Statements for the financial year ended 31 December 2020 (continued)
Federated Hermes Global High Yield Credit FundDistributing Distribution Date AmountClass per unit Declared Ex-date Record Date Date paid € Relevant periodClass F2 EUR 0�038457 31/12/2019 02/01/2020 31/12/2019 03/02/2020 5,500 01/07/2019 - 31/12/2019Class F2 GBP Hedged
0�018881 31/12/2019 02/01/2020 31/12/2019 03/02/2020 10,694 01/07/2019 - 31/12/2019
Class F2 USD Hedged
0�042632 31/12/2019 02/01/2020 31/12/2019 03/02/2020 1,069 01/07/2019 - 31/12/2019
Class R2 EUR 0�035990 31/12/2019 02/01/2020 31/12/2019 03/02/2020 144,807 01/07/2019 - 31/12/2019Class M2 GBP Hedged
0�021131 31/12/2019 02/01/2020 31/12/2019 03/02/2020 974,476 01/07/2019 - 31/12/2019
Class M4 EUR 0�014360 30/04/2020 01/05/2020 30/04/2020 25/05/2020 7 01/04/2020 - 30/04/2020Class M4 EUR 0�014060 29/05/2020 02/06/2020 29/05/2020 23/06/2020 7 01/05/2020 - 31/05/2020Class F2 EUR 0�045121 30/06/2020 01/07/2020 30/06/2020 22/07/2020 1,201 01/01/2020 - 30/06/2020Class F2 GBP Hedged
0�024002 30/06/2020 01/07/2020 30/06/2020 22/07/2020 16,680 01/01/2020 - 30/06/2020
Class F2 USD Hedged
0�050855 30/06/2020 01/07/2020 30/06/2020 22/07/2020 1,275 01/01/2020 - 30/06/2020
Class R2 EUR 0�043995 30/06/2020 01/07/2020 30/06/2020 22/07/2020 202,344 01/01/2020 - 30/06/2020Class M2 GBP Hedged
0�026489 30/06/2020 01/07/2020 30/06/2020 22/07/2020 3,424,741 01/01/2020 - 30/06/2020
Class M2 EUR 0�038320 30/06/2020 01/07/2020 30/06/2020 22/07/2020 19 01/01/2020 - 30/06/2020Class M3 EUR 0�038320 30/06/2020 01/07/2020 30/06/2020 22/07/2020 19 01/01/2020 - 30/06/2020Class M4 EUR 0�009760 30/06/2020 01/07/2020 30/06/2020 22/07/2020 5 01/01/2020 - 30/06/2020Class M4 EUR 0�007660 31/07/2020 04/08/2020 31/07/2020 25/08/2020 4 01/07/2020 - 31/07/2020Class M4 EUR 0�007860 28/08/2020 01/09/2020 28/08/2020 22/09/2020 4 01/08/2020 - 28/08/2020Class M3 EUR 0�024640 30/09/2020 01/10/2020 30/09/2020 22/10/2020 12 01/09/2020 - 30/09/2020Class M4 EUR 0�008960 30/09/2020 01/10/2020 30/09/2020 22/10/2020 5 01/09/2020 - 30/09/2020Class M4 EUR 0�008700 30/10/2020 02/11/2020 30/10/2020 23/11/2020 4 01/10/2020 - 30/10/2020Class M4 EUR 0�006260 30/11/2020 01/12/2020 30/11/2020 22/12/2020 3 01/11/2020 - 30/11/2020
4,782,876
14. Distributions (continued)

360
Federated Hermes Investment Funds Public Limited CompanyNotes to the Financial Statements for the financial year ended 31 December 2020 (continued)
Federated Hermes Europe ex-UK Equity FundDistributing Distribution Date AmountClass per unit Declared Ex-date Record Date Date paid € Relevant periodClass F2 GBP 0�003600 31/12/2019 02/01/2020 31/12/2019 03/02/2020 112 01/07/2019 - 31/12/2019Class F2 EUR 0�006499 31/12/2019 02/01/2020 31/12/2019 03/02/2020 3,845 01/07/2019 - 31/12/2019Class F2 USD Hedged
0�007660 31/12/2019 02/01/2020 31/12/2019 03/02/2020 3 01/07/2019 - 31/12/2019
Class F2 GBP Hedged
0�003239 31/12/2019 02/01/2020 31/12/2019 03/02/2020 2,423 01/07/2019 - 31/12/2019
Class M2 GBP 0�005125 31/12/2019 02/01/2020 31/12/2019 03/02/2020 7,036 01/07/2019 - 31/12/2019Class M2 GBP Hedged
0�004813 31/12/2019 02/01/2020 31/12/2019 03/02/2020 65,332 01/07/2019 - 31/12/2019
Class M2 EUR 0�008934 31/12/2019 02/01/2020 31/12/2019 03/02/2020 8,709 01/07/2019 - 31/12/2019Class F2 GBP 0�014831 30/06/2020 01/07/2020 30/06/2020 22/07/2020 628 01/01/2020 - 30/06/2020Class F2 EUR 0�023944 30/06/2020 01/07/2020 30/06/2020 22/07/2020 335 01/01/2020 - 30/06/2020Class F2 GBP Hedged
0�014457 30/06/2020 01/07/2020 30/06/2020 22/07/2020 3,190 01/01/2020 - 30/06/2020
Class M2 GBP 0�015057 30/06/2020 01/07/2020 30/06/2020 22/07/2020 17,392 01/01/2020 - 30/06/2020Class M2 GBP Hedged
0�014271 30/06/2020 01/07/2020 30/06/2020 22/07/2020 901 01/01/2020 - 30/06/2020
Class M2 EUR 0�024224 30/06/2020 01/07/2020 30/06/2020 22/07/2020 1,720 01/01/2020 - 30/06/2020111,626
Federated Hermes US SMID Equity FundDistributing Distribution Date AmountClass per unit Declared Ex-date Record Date Date paid $ Relevant periodClass F2 EUR Hedged
0�000100 31/12/2019 02/01/2020 31/12/2019 03/02/2020 - 01/07/2019 - 31/12/2019
Class L2 GBP 0�000398 31/12/2019 02/01/2020 31/12/2019 03/02/2020 22,406 01/07/2019 - 31/12/2019Class L2 GBP Hedged
0�000211 31/12/2019 02/01/2020 31/12/2019 03/02/2020 2,867 01/07/2019 - 31/12/2019
Class L2 USD 0�000871 31/12/2019 02/01/2020 31/12/2019 03/02/2020 45,639 01/07/2019 - 31/12/2019Class F2 GBP 0�001618 30/06/2020 01/07/2020 30/06/2020 22/07/2020 51,944 01/01/2020 - 30/06/2020Class F2 EUR 0�005180 30/06/2020 01/07/2020 30/06/2020 22/07/2020 7,013 01/01/2020 - 30/06/2020Class F2 USD 0�002558 30/06/2020 01/07/2020 30/06/2020 22/07/2020 11,930 01/01/2020 - 30/06/2020Class F2 EUR Hedged
0�001600 30/06/2020 01/07/2020 30/06/2020 22/07/2020 1 01/01/2020 - 30/06/2020
Class F2 CHF Hedged
0�001317 30/06/2020 01/07/2020 30/06/2020 22/07/2020 17 01/01/2020 - 30/06/2020
Class F2 GBP Hedged
0�000918 30/06/2020 01/07/2020 30/06/2020 22/07/2020 4,538 01/01/2020 - 30/06/2020
Class L2 GBP 0�001459 30/06/2020 01/07/2020 30/06/2020 22/07/2020 70,342 01/01/2020 - 30/06/2020Class L2 GBP Hedged
0�001186 30/06/2020 01/07/2020 30/06/2020 22/07/2020 9,082 01/01/2020 - 30/06/2020
Class L2 USD 0�002541 30/06/2020 01/07/2020 30/06/2020 22/07/2020 103,946 01/01/2020 - 30/06/2020Class A2 USD 0�001080 30/06/2020 01/07/2020 30/06/2020 22/07/2020 1 01/01/2020 - 30/06/2020
329,726
14. Distributions (continued)

361
Federated Hermes Investment Funds Public Limited CompanyNotes to the Financial Statements for the financial year ended 31 December 2020 (continued)
Federated Hermes Asia ex-Japan Equity FundDistributing Distribution Date AmountClass per unit Declared Ex-date Record Date Date paid $ Relevant periodClass F2 GBP 0�023317 31/12/2019 02/01/2020 31/12/2019 03/02/2020 8,416,842 01/07/2019 - 31/12/2019Class F2 EUR 0�046602 31/12/2019 02/01/2020 31/12/2019 03/02/2020 534,733 01/07/2019 - 31/12/2019Class F2 EUR Hedged
0�024631 31/12/2019 02/01/2020 31/12/2019 03/02/2020 22,180 01/07/2019 - 31/12/2019
Class F2 USD 0�030194 31/12/2019 02/01/2020 31/12/2019 03/02/2020 576,629 01/07/2019 - 31/12/2019Class F2 GBP Hedged
0�015407 31/12/2019 02/01/2020 31/12/2019 03/02/2020 267,137 01/07/2019 - 31/12/2019
Class C2 EUR 0�026798 31/12/2019 02/01/2020 31/12/2019 03/02/2020 15 01/07/2019 - 31/12/2019Class C2 GBP 0�015081 31/12/2019 02/01/2020 31/12/2019 03/02/2020 26,747 01/07/2019 - 31/12/2019Class C2 USD 0�025645 31/12/2019 02/01/2020 31/12/2019 03/02/2020 13 01/07/2019 - 31/12/2019Class F2 GBP 0�023550 30/06/2020 01/07/2020 30/06/2020 22/07/2020 6,263,630 01/01/2020 - 30/06/2020Class F2 EUR 0�043869 30/06/2020 01/07/2020 30/06/2020 22/07/2020 331,321 01/01/2020 - 30/06/2020Class F2 EUR Hedged
0�022612 30/06/2020 01/07/2020 30/06/2020 22/07/2020 12,879 01/01/2020 - 30/06/2020
Class F2 USD 0�028292 30/06/2020 01/07/2020 30/06/2020 22/07/2020 269,941 01/01/2020 - 30/06/2020Class F2 GBP Hedged
0�015011 30/06/2020 01/07/2020 30/06/2020 22/07/2020 212,267 01/01/2020 - 30/06/2020
Class C2 GBP 0�015320 30/06/2020 01/07/2020 30/06/2020 22/07/2020 22,711 01/01/2020 - 30/06/202016,957,045
Federated Hermes Global Equity ESG FundDistributing Distribution Date AmountClass per unit Declared Ex-date Record Date Date paid $ Relevant periodClass F2 CHF Hedged
0�004879 31/12/2019 02/01/2020 31/12/2019 03/02/2020 341 01/07/2019 - 31/12/2019
Class F2 CHF 0�005272 31/12/2019 02/01/2020 31/12/2019 03/02/2020 11,247 01/07/2019 - 31/12/2019Class F2 CHF Portfolio Hedged
0�004894 31/12/2019 02/01/2020 31/12/2019 03/02/2020 14,763 01/07/2019 - 31/12/2019
Class F2 EUR Portfolio Hedged
0�004560 31/12/2019 02/01/2020 31/12/2019 03/02/2020 2 01/07/2019 - 31/12/2019
Class F2 USD Portfolio Hedged
0�005318 31/12/2019 02/01/2020 31/12/2019 03/02/2020 591 01/07/2019 - 31/12/2019
Class A2 USD 0�001620 31/12/2019 02/01/2020 31/12/2019 03/02/2020 1 01/07/2019 - 31/12/2019Class F2 CHF Hedged
0�008958 30/06/2020 01/07/2020 30/06/2020 22/07/2020 316 01/01/2020 - 30/06/2020
Class F2 CHF 0�009377 30/06/2020 01/07/2020 30/06/2020 22/07/2020 21,421 01/01/2020 - 30/06/2020Class F2 CHF Portfolio Hedged
0�009072 30/06/2020 01/07/2020 30/06/2020 22/07/2020 31,980 01/01/2020 - 30/06/2020
Class F2 USD Portfolio Hedged
0�009949 30/06/2020 01/07/2020 30/06/2020 22/07/2020 1,645 01/01/2020 - 30/06/2020
Class A2 USD 0�009880 30/06/2020 01/07/2020 30/06/2020 22/07/2020 5 01/01/2020 - 30/06/2020Class B2 USD 0�002460 30/06/2020 01/07/2020 30/06/2020 22/07/2020 1 01/01/2020 - 30/06/2020
82,313
14. Distributions (continued)

362
Federated Hermes Investment Funds Public Limited CompanyNotes to the Financial Statements for the financial year ended 31 December 2020 (continued)
Federated Hermes Multi-Strategy Credit FundDistributing Distribution Date AmountClass per unit Declared Ex-date Record Date Date paid $ Relevant periodClass F2 GBP 0�018096 31/12/2019 02/01/2020 31/12/2019 03/02/2020 24,327 01/07/2019 - 31/12/2019Class F2 GBP Hedged
0�012856 31/12/2019 02/01/2020 31/12/2019 03/02/2020 4,114,978 01/07/2019 - 31/12/2019
Class F2 EUR 0�028613 31/12/2019 02/01/2020 31/12/2019 03/02/2020 12,132 01/07/2019 - 31/12/2019Class F2 EUR Hedged
0�026919 31/12/2019 02/01/2020 31/12/2019 03/02/2020 320,846 01/07/2019 - 31/12/2019
Class F2 USD 0�027757 31/12/2019 02/01/2020 31/12/2019 03/02/2020 81,388 01/07/2019 - 31/12/2019Class R2 EUR 0�021678 31/12/2019 02/01/2020 31/12/2019 03/02/2020 3,937 01/07/2019 - 31/12/2019Class R2 EUR Hedged
0�020720 31/12/2019 02/01/2020 31/12/2019 03/02/2020 12 01/07/2019 - 31/12/2019
Class L2 GBP 0�014165 31/12/2019 02/01/2020 31/12/2019 03/02/2020 82,819 01/07/2019 - 31/12/2019Class L2 GBP Hedged
0�013151 31/12/2019 02/01/2020 31/12/2019 03/02/2020 1,565,871 01/07/2019 - 31/12/2019
Class R2 SGD Hedged
0�029850 31/12/2019 02/01/2020 31/12/2019 03/02/2020 7 01/07/2019 - 31/12/2019
Class Z2 EUR 0�032774 31/12/2019 02/01/2020 31/12/2019 03/02/2020 551,162 01/07/2019 - 31/12/2019Class A2 USD 0�006980 31/12/2019 02/01/2020 31/12/2019 03/02/2020 3 01/07/2019 - 31/12/2019Class B2 USD 0�005000 31/12/2019 02/01/2020 31/12/2019 03/02/2020 3 01/07/2019 - 31/12/2019Class F2 GBP 0�003639 30/06/2020 01/07/2020 30/06/2020 22/07/2020 3,593 01/01/2020 - 30/06/2020Class F2 GBP Hedged
0�002413 30/06/2020 01/07/2020 30/06/2020 22/07/2020 412,918 01/01/2020 - 30/06/2020
Class F2 EUR 0�005411 30/06/2020 01/07/2020 30/06/2020 22/07/2020 1,972 01/01/2020 - 30/06/2020Class F2 EUR Hedged
0�004673 30/06/2020 01/07/2020 30/06/2020 22/07/2020 63,505 01/01/2020 - 30/06/2020
Class F2 USD 0�005261 30/06/2020 01/07/2020 30/06/2020 22/07/2020 16,735 01/01/2020 - 30/06/2020Class L2 GBP 0�003495 30/06/2020 01/07/2020 30/06/2020 22/07/2020 19,941 01/01/2020 - 30/06/2020Class L2 GBP Hedged
0�003084 30/06/2020 01/07/2020 30/06/2020 22/07/2020 315,562 01/01/2020 - 30/06/2020
Class Z2 EUR 0�010586 30/06/2020 01/07/2020 30/06/2020 22/07/2020 178,128 01/01/2020 - 30/06/2020Class A2 USD 0�005140 30/06/2020 01/07/2020 30/06/2020 22/07/2020 3 01/01/2020 - 30/06/2020Class B2 USD 0�000680 30/06/2020 01/07/2020 30/06/2020 22/07/2020 - 01/01/2020 - 30/06/2020Class L2 USD 0�004932 30/06/2020 01/07/2020 30/06/2020 22/07/2020 29,454 01/01/2020 - 30/06/2020
7,799,296
Federated Hermes Global Small Cap Equity FundDistributing Distribution Date AmountClass per unit Declared Ex-date Record Date Date paid $ Relevant periodClass F2 GBP 0�001545 31/12/2019 02/01/2020 31/12/2019 03/02/2020 26,899 01/07/2019 - 31/12/2019Class F2 GBP 0�003321 30/06/2020 01/07/2020 30/06/2020 22/07/2020 53,853 01/01/2020 - 30/06/2020
80,752
14. Distributions (continued)

363
Federated Hermes Investment Funds Public Limited CompanyNotes to the Financial Statements for the financial year ended 31 December 2020 (continued)
Federated Hermes Absolute Return Credit FundDistributing Distribution Date AmountClass per unit Declared Ex-date Record Date Date paid $ Relevant periodClass F2 EUR Hedged
0�024420 31/12/2019 02/01/2020 31/12/2019 03/02/2020 14 01/07/2019 - 31/12/2019
Class F2 USD 0�027200 31/12/2019 02/01/2020 31/12/2019 03/02/2020 14 01/07/2019 - 31/12/2019Class F2 GBP 0�016381 31/12/2019 02/01/2020 31/12/2019 03/02/2020 61,903 01/07/2019 - 31/12/2019Class F2 GBP Hedged
0�012574 31/12/2019 02/01/2020 31/12/2019 03/02/2020 302,262 01/07/2019 - 31/12/2019
364,193
14. Distributions (continued)

364
Federated Hermes Investment Funds Public Limited CompanyNotes to the Financial Statements for the financial year ended 31 December 2020 (continued)
Federated Hermes SDG Engagement Equity FundDistributing Distribution Date AmountClass per unit Declared Ex-date Record Date Date paid $ Relevant periodClass X2 GBP 0�000591 31/12/2019 02/01/2020 31/12/2019 03/02/2020 351 01/07/2019 - 31/12/2019Class X2 EUR 0�001275 31/12/2019 02/01/2020 31/12/2019 03/02/2020 409 01/07/2019 - 31/12/2019Class X2 USD 0�001320 31/12/2019 02/01/2020 31/12/2019 03/02/2020 498 01/07/2019 - 31/12/2019Class X2 CHF Portfolio Hedged
0�001216 31/12/2019 02/01/2020 31/12/2019 03/02/2020 5,515 01/07/2019 - 31/12/2019
Class X2 CHF 0�001494 31/12/2019 02/01/2020 31/12/2019 03/02/2020 3,725 01/07/2019 - 31/12/2019Class X2 GBP Portfolio Hedged
0�004333 30/06/2020 01/07/2020 30/06/2020 22/07/2020 3,828 01/01/2020 - 30/06/2020
Class X2 EUR Portfolio Hedged
0�008375 30/06/2020 01/07/2020 30/06/2020 22/07/2020 2,635 01/01/2020 - 30/06/2020
Class X2 USD Portfolio Hedged
0�009228 30/06/2020 01/07/2020 30/06/2020 22/07/2020 3,878 01/01/2020 - 30/06/2020
Class X2 CHF Portfolio Hedged
0�008390 30/06/2020 01/07/2020 30/06/2020 22/07/2020 48,605 01/01/2020 - 30/06/2020
Class W2 EUR Portfolio Hedged
0�004120 30/06/2020 01/07/2020 30/06/2020 22/07/2020 2 01/01/2020 - 30/06/2020
Class W2 USD Portfolio Hedged
0�004440 30/06/2020 01/07/2020 30/06/2020 22/07/2020 2 01/01/2020 - 30/06/2020
Class W2 CHF Portfolio Hedged
0�003397 30/06/2020 01/07/2020 30/06/2020 22/07/2020 37 01/01/2020 - 30/06/2020
Class F2 GBP Portfolio Hedged
0�003170 30/06/2020 01/07/2020 30/06/2020 22/07/2020 4 01/01/2020 - 30/06/2020
Class F2 EUR Portfolio Hedged
0�006600 30/06/2020 01/07/2020 30/06/2020 22/07/2020 4 01/01/2020 - 30/06/2020
Class F2 USD Portfolio Hedged
0�007980 30/06/2020 01/07/2020 30/06/2020 22/07/2020 4 01/01/2020 - 30/06/2020
Class F2 CHF Portfolio Hedged
0�007040 30/06/2020 01/07/2020 30/06/2020 22/07/2020 4 01/01/2020 - 30/06/2020
Class X2 CHF 0�008485 30/06/2020 01/07/2020 30/06/2020 22/07/2020 26,882 01/01/2020 - 30/06/2020Class A2 USD 0�007100 30/06/2020 01/07/2020 30/06/2020 22/07/2020 4 01/01/2020 - 30/06/2020Class B2 USD 0�000200 30/06/2020 01/07/2020 30/06/2020 22/07/2020 - 01/01/2020 - 30/06/2020
96,387
Federated Hermes Impact Opportunities Equity FundDistributing Distribution Date AmountClass per unit Declared Ex-date Record Date Date paid $ Relevant periodClass F2 EUR 0�000280 31/12/2019 02/01/2020 31/12/2019 03/02/2020 - 01/07/2019 - 31/12/2019Class F2 EUR 0�006242 30/06/2020 01/07/2020 30/06/2020 22/07/2020 364 01/01/2020 - 30/06/2020
364
14. Distributions (continued)

365
Federated Hermes Investment Funds Public Limited CompanyNotes to the Financial Statements for the financial year ended 31 December 2020 (continued)
Federated Hermes Unconstrained Credit FundDistributing Distribution Date AmountClass per unit Declared Ex-date Record Date Date paid $ Relevant periodClass F2 GBP Hedged
0�015596 31/12/2019 02/01/2020 31/12/2019 03/02/2020 114,965 01/07/2019 - 31/12/2019
Class F2 EUR Hedged
0�033220 31/12/2019 02/01/2020 31/12/2019 03/02/2020 19 01/07/2019 - 31/12/2019
Class R2 EUR Hedged
0�026380 31/12/2019 02/01/2020 31/12/2019 03/02/2020 15 01/07/2019 - 31/12/2019
Class F2 USD 0�034003 31/12/2019 02/01/2020 31/12/2019 03/02/2020 8,779 01/07/2019 - 31/12/2019Class X2 USD 0�036696 31/12/2019 02/01/2020 31/12/2019 03/02/2020 196,084 01/07/2019 - 31/12/2019Class X2 GBP Hedged
0�016822 31/12/2019 02/01/2020 31/12/2019 03/02/2020 805,472 01/07/2019 - 31/12/2019
Class X2 EUR 0�040060 31/12/2019 02/01/2020 31/12/2019 03/02/2020 22 01/07/2019 - 31/12/2019Class X2 CHF Hedged
0�035560 31/12/2019 02/01/2020 31/12/2019 03/02/2020 18 01/07/2019 - 31/12/2019
Class X2 EUR Hedged
0�035103 31/12/2019 02/01/2020 31/12/2019 03/02/2020 211,402 01/07/2019 - 31/12/2019
Class F2 EUR Hedged
0�036740 31/12/2019 02/01/2020 31/12/2019 03/02/2020 21 01/07/2019 - 31/12/2019
Class X2 CHF 0�036540 31/12/2019 02/01/2020 31/12/2019 03/02/2020 19 01/07/2019 - 31/12/2019Class A2 USD 0�011740 31/12/2019 02/01/2020 31/12/2019 03/02/2020 6 01/07/2019 - 31/12/2019Class B2 USD 0�009800 31/12/2019 02/01/2020 31/12/2019 03/02/2020 5 01/07/2019 - 31/12/2019Class F2 GBP Hedged
0�022407 30/06/2020 01/07/2020 30/06/2020 22/07/2020 254,126 01/01/2020 - 30/06/2020
Class F2 EUR Hedged
0�043780 30/06/2020 01/07/2020 30/06/2020 22/07/2020 25 01/01/2020 - 30/06/2020
Class R2 EUR Hedged
0�037280 30/06/2020 01/07/2020 30/06/2020 22/07/2020 21 01/01/2020 - 30/06/2020
Class F2 USD 0�046474 30/06/2020 01/07/2020 30/06/2020 22/07/2020 15,508 01/01/2020 - 30/06/2020Class X2 USD 0�049115 30/06/2020 01/07/2020 30/06/2020 22/07/2020 257,517 01/01/2020 - 30/06/2020Class X2 GBP Hedged
0�023681 30/06/2020 01/07/2020 30/06/2020 22/07/2020 998,723 01/01/2020 - 30/06/2020
Class X2 EUR 0�052363 30/06/2020 01/07/2020 30/06/2020 22/07/2020 5,293 01/01/2020 - 30/06/2020Class X2 CHF Hedged
0�046600 30/06/2020 01/07/2020 30/06/2020 22/07/2020 25 01/01/2020 - 30/06/2020
Class X2 EUR Hedged
0�045816 30/06/2020 01/07/2020 30/06/2020 22/07/2020 171,039 01/01/2020 - 30/06/2020
Class F2 EUR 0�049086 30/06/2020 01/07/2020 30/06/2020 22/07/2020 1,185 01/01/2020 - 30/06/2020Class X2 CHF 0�047100 30/06/2020 01/07/2020 30/06/2020 22/07/2020 25 01/01/2020 - 30/06/2020Class A2 USD 0�044160 30/06/2020 01/07/2020 30/06/2020 22/07/2020 22 01/01/2020 - 30/06/2020Class B2 USD 0�039620 30/06/2020 01/07/2020 30/06/2020 22/07/2020 20 01/01/2020 - 30/06/2020Class L3 GBP Hedged
0�006844 30/09/2020 01/10/2020 30/09/2020 22/10/2020 103,129 01/09/2020 - 30/09/2020
Class L3 EUR Hedged
0�013380 30/09/2020 01/10/2020 30/09/2020 22/10/2020 8 01/09/2020 - 30/09/2020
Class L3 USD 0�013980 30/09/2020 01/10/2020 30/09/2020 22/10/2020 7 01/09/2020 - 30/09/20203,143,500
14. Distributions (continued)

366
Federated Hermes Investment Funds Public Limited CompanyNotes to the Financial Statements for the financial year ended 31 December 2020 (continued)
Federated Hermes Global Emerging Markets SMID Equity FundDistributing Distribution Date AmountClass per unit Declared Ex-date Record Date Date paid $ Relevant periodClass X2 USD 0�018069 31/12/2019 02/01/2020 31/12/2019 03/02/2020 65,787 01/07/2019 - 31/12/2019Class X2 USD 0�002160 31/12/2019 02/01/2020 31/12/2019 03/02/2020 1 01/07/2019 - 31/12/2019Class X2 USD 0�013514 30/06/2020 01/07/2020 30/06/2020 22/07/2020 49,203 01/01/2020 - 30/06/2020Class B2 USD 0�004760 30/06/2020 01/07/2020 30/06/2020 22/07/2020 2 01/01/2020 - 30/06/2020Class A2 USD 0�008940 30/06/2020 01/07/2020 30/06/2020 22/07/2020 4 01/01/2020 - 30/06/2020
114,997
Federated Hermes SDG Engagement High Yield Credit FundDistributing Distribution Date AmountClass per unit Declared Ex-date Record Date Date paid $ Relevant periodClass Y2 CHF Hedged
0�014226 31/12/2019 02/01/2020 31/12/2019 03/02/2020 73,499 02/10/2019 - 31/12/2019
Class W2 CHF Hedged
0�010900 31/12/2019 02/01/2020 31/12/2019 03/02/2020 6 02/10/2019 - 31/12/2019
Class Y2 USD 0�003950 31/12/2019 02/01/2020 31/12/2019 03/02/2020 81 02/10/2019 - 31/12/2019Class W2 USD 0�002820 31/12/2019 02/01/2020 31/12/2019 03/02/2020 2 02/10/2019 - 31/12/2019Class Y2 CHF Hedged
0�042966 30/06/2020 01/07/2020 30/06/2020 22/07/2020 265,942 01/01/2020 - 30/06/2020
Class W2 CHF Hedged
0�036992 30/06/2020 01/07/2020 30/06/2020 22/07/2020 2,184 01/01/2020 - 30/06/2020
Class Y2 USD 0�044173 30/06/2020 01/07/2020 30/06/2020 22/07/2020 35,670 01/01/2020 - 30/06/2020Class W2 USD 0�038023 30/06/2020 01/07/2020 30/06/2020 22/07/2020 28,574 01/01/2020 - 30/06/2020Class B2 USD 0�027780 30/06/2020 01/07/2020 30/06/2020 22/07/2020 14 01/01/2020 - 30/06/2020Class A2 USD 0�030380 30/06/2020 01/07/2020 30/06/2020 22/07/2020 15 01/01/2020 - 30/06/2020
405,987
The following distributions were declared on 31 December 2020 and paid after the financial year end date in accordance with IAS 10 “Events After the Reporting Period” have not been included in liabilities at the financial year end date:
Federated Hermes Global Emerging Markets Equity FundDistributing Distribution Date AmountClass per unit Declared Ex-date Record Date Date paid $ Relevant periodClass F2 GBP 0�004101 31/12/2020 04/01/2021 31/12/2020 01/02/2021 348,671 01/07/2020 - 31/12/2020Class F2 EUR 0�007388 31/12/2020 04/01/2021 31/12/2020 01/02/2021 571,697 01/07/2020 - 31/12/2020Class F2 USD 0�008288 31/12/2020 04/01/2021 31/12/2020 01/02/2021 190,717 01/07/2020 - 31/12/2020Class F2 GBP Hedged
0�002662 31/12/2020 04/01/2021 31/12/2020 01/02/2021 2,519 01/07/2020 - 31/12/2020
Class J2 GBP 0�005985 31/12/2020 04/01/2021 31/12/2020 01/02/2021 2,103,414 01/07/2020 - 31/12/2020Class J2 USD 0�012334 31/12/2020 04/01/2021 31/12/2020 01/02/2021 300,096 01/07/2020 - 31/12/2020Class J2 EUR 0�011236 31/12/2020 04/01/2021 31/12/2020 01/02/2021 440,057 01/07/2020 - 31/12/2020Class J2 GBP Hedged
0�005060 31/12/2020 04/01/2021 31/12/2020 01/02/2021 90,120 01/07/2020 - 31/12/2020
Class J2 EUR Hedged
0�009849 31/12/2020 04/01/2021 31/12/2020 01/02/2021 419 01/07/2020 - 31/12/2020
Class F2 EUR Hedged
0�006404 31/12/2020 04/01/2021 31/12/2020 01/02/2021 84 01/07/2020 - 31/12/2020
Class A2 USD 0�006120 31/12/2020 04/01/2021 31/12/2020 01/02/2021 3 01/07/2020 - 31/12/2020 4,047,797
14. Distributions (continued)

367
Federated Hermes Investment Funds Public Limited CompanyNotes to the Financial Statements for the financial year ended 31 December 2020 (continued)
Federated Hermes Global Equity FundDistributing Distribution Date AmountClass per unit Declared Ex-date Record Date Date paid $ Relevant periodClass F2 GBP 0�004271 31/12/2020 04/01/2021 31/12/2020 01/02/2021 120 01/07/2020 - 31/12/2020Class A2 USD 0�005705 31/12/2020 04/01/2021 31/12/2020 01/02/2021 42,389 01/07/2020 - 31/12/2020
42,509
Federated Hermes European Alpha Equity FundDistributing Distribution Date AmountClass per unit Declared Ex-date Record Date Date paid € Relevant periodClass F2 GBP 0�001558 31/12/2020 04/01/2021 31/12/2020 01/02/2021 41 01/07/2020 - 31/12/2020Class F2 EUR 0�002467 31/12/2020 04/01/2021 31/12/2020 01/02/2021 1,076 01/07/2020 - 31/12/2020Class S2 GBP 0�002271 31/12/2020 04/01/2021 31/12/2020 01/02/2021 599 01/07/2020 - 31/12/2020Class S2 GBP Hedged
0�001973 31/12/2020 04/01/2021 31/12/2020 01/02/2021 1,130 01/07/2020 - 31/12/2020
Class S2 USD 0�003870 31/12/2020 04/01/2021 31/12/2020 01/02/2021 898 01/07/2020 - 31/12/2020Class S2 USD Hedged
0�004346 31/12/2020 04/01/2021 31/12/2020 01/02/2021 106 01/07/2020 - 31/12/2020
Class M2 EUR 0�006043 31/12/2020 04/01/2021 31/12/2020 01/02/2021 1,098 01/07/2020 - 31/12/2020 4,948
Federated Hermes Global High Yield Credit FundDistributing Distribution Date AmountClass per unit Declared Ex-date Record Date Date paid € Relevant periodClass F2 EUR 0�030880 31/12/2020 04/01/2021 31/12/2020 01/02/2021 819 01/07/2020 - 31/12/2020Class F2 GBP Hedged
0�015570 31/12/2020 04/01/2021 31/12/2020 01/02/2021 12,408 01/07/2020 - 31/12/2020
Class F2 USD Hedged
0�035530 31/12/2020 04/01/2021 31/12/2020 01/02/2021 89,062 01/07/2020 - 31/12/2020
Class R2 EUR 0�027900 31/12/2020 04/01/2021 31/12/2020 01/02/2021 132,410 01/07/2020 - 31/12/2020Class M2 GBP Hedged
0�017640 31/12/2020 04/01/2021 31/12/2020 01/02/2021 2,122,601 01/07/2020 - 31/12/2020
Class A2 USD Hedged
0�007260 31/12/2020 04/01/2021 31/12/2020 01/02/2021 3 01/07/2020 - 31/12/2020
Class M2 EUR 0�046320 31/12/2020 04/01/2021 31/12/2020 01/02/2021 23 01/07/2020 - 31/12/2020Class M3 EUR 0�021480 31/12/2020 04/01/2021 31/12/2020 01/02/2021 11 01/07/2020 - 31/12/2020Class M4 EUR 0�006500 31/12/2020 04/01/2021 31/12/2020 01/02/2021 3 01/07/2020 - 31/12/2020Class L3 AUD Hedged
0�023150 31/12/2020 04/01/2021 31/12/2020 01/02/2021 286,788 01/07/2020 - 31/12/2020
Class B2 USD Hedged
0�005620 31/12/2020 04/01/2021 31/12/2020 01/02/2021 2 01/07/2020 - 31/12/2020
2,644,130
Federated Hermes Europe ex-UK Equity FundDistributing Distribution Date AmountClass per unit Declared Ex-date Record Date Date paid € Relevant periodClass M2 GBP 0�000085 31/12/2020 04/01/2021 31/12/2020 01/02/2021 78 01/07/2020 - 31/12/2020
78
14. Distributions (continued)

368
Federated Hermes Investment Funds Public Limited CompanyNotes to the Financial Statements for the financial year ended 31 December 2020 (continued)
Federated Hermes Asia ex-Japan Equity FundDistributing Distribution Date AmountClass per unit Declared Ex-date Record Date Date paid $ Relevant periodClass F2 GBP 0�016235 31/12/2020 04/01/2021 31/12/2020 01/02/2021 4,254,116 01/07/2020 - 31/12/2020Class F2 EUR 0�030750 31/12/2020 04/01/2021 31/12/2020 01/02/2021 277,449 01/07/2020 - 31/12/2020Class F2 EUR Hedged
0�016733 31/12/2020 04/01/2021 31/12/2020 01/02/2021 7,628 01/07/2020 - 31/12/2020
Class F2 USD 0�021744 31/12/2020 04/01/2021 31/12/2020 01/02/2021 227,648 01/07/2020 - 31/12/2020Class F2 GBP Hedged
0�011015 31/12/2020 04/01/2021 31/12/2020 01/02/2021 166,935 01/07/2020 - 31/12/2020
Class C2 GBP 0�009647 31/12/2020 04/01/2021 31/12/2020 01/02/2021 4,692 01/07/2020 - 31/12/2020 4,938,468
Federated Hermes Global Equity ESG FundDistributing Distribution Date AmountClass per unit Declared Ex-date Record Date Date paid $ Relevant periodClass F2 CHF Hedged
0�002720 31/12/2020 04/01/2021 31/12/2020 01/02/2021 1 01/07/2020 - 31/12/2020
Class F2 CHF 0�003016 31/12/2020 04/01/2021 31/12/2020 01/02/2021 6,883 01/07/2020 - 31/12/2020Class F2 CHF Portfolio Hedged
0�002819 31/12/2020 04/01/2021 31/12/2020 01/02/2021 10,950 01/07/2020 - 31/12/2020
Class F2 USD Portfolio Hedged
0�003139 31/12/2020 04/01/2021 31/12/2020 01/02/2021 516 01/07/2020 - 31/12/2020
Class A2 USD 0�003100 31/12/2020 04/01/2021 31/12/2020 01/02/2021 2 01/07/2020 - 31/12/2020Class J2 USD Portfolio Hedged
0�000780 31/12/2020 04/01/2021 31/12/2020 01/02/2021 - 01/07/2020 - 31/12/2020
Class J2 EUR Portfolio Hedged
0�003100 31/12/2020 04/01/2021 31/12/2020 01/02/2021 2 01/07/2020 - 31/12/2020
Class J2 CHF Portfolio Hedged
0�003020 31/12/2020 04/01/2021 31/12/2020 01/02/2021 2 01/07/2020 - 31/12/2020
Class J2 CHF Hedged
0�002992 31/12/2020 04/01/2021 31/12/2020 01/02/2021 87 01/07/2020 - 31/12/2020
Class J2 CHF 0�002920 31/12/2020 04/01/2021 31/12/2020 01/02/2021 2 01/07/2020 - 31/12/2020 18,445
Federated Hermes Multi-Strategy Credit FundDistributing Distribution Date AmountClass per unit Declared Ex-date Record Date Date paid $ Relevant periodClass L2 GBP 0�000410 31/12/2020 04/01/2021 31/12/2020 01/02/2021 1,996 01/07/2020 - 31/12/2020Class L2 GBP Hedged
0�000150 31/12/2020 04/01/2021 31/12/2020 01/02/2021 8,071 01/07/2020 - 31/12/2020
Class Z2 EUR Hedged
0�005260 31/12/2020 04/01/2021 31/12/2020 01/02/2021 96,567 01/07/2020 - 31/12/2020
Class L2 USD 0�000860 31/12/2020 04/01/2021 31/12/2020 01/02/2021 5,142 01/07/2020 - 31/12/2020 111,776
14. Distributions (continued)

369
Federated Hermes Investment Funds Public Limited CompanyNotes to the Financial Statements for the financial year ended 31 December 2020 (continued)
Federated Hermes Global Small Cap Equity FundDistributing Distribution Date AmountClass per unit Declared Ex-date Record Date Date paid $ Relevant periodClass F2 GBP 0�002278 31/12/2020 04/01/2021 31/12/2020 01/02/2021 41,249 01/07/2020 - 31/12/2020Class A2 USD 0�002280 31/12/2020 04/01/2021 31/12/2020 01/02/2021 1 01/07/2020 - 31/12/2020
41,250
Federated Hermes SDG Engagement Equity FundDistributing Distribution Date AmountClass per unit Declared Ex-date Record Date Date paid $ Relevant periodClass X2 GBP Portfolio Hedged
0�000828 31/12/2020 04/01/2021 31/12/2020 01/02/2021 2,622 01/07/2020 - 31/12/2020
Class X2 EUR Portfolio Hedged
0�001510 31/12/2020 04/01/2021 31/12/2020 01/02/2021 520 01/07/2020 - 31/12/2020
Class X2 USD Portfolio Hedged
0�001769 31/12/2020 04/01/2021 31/12/2020 01/02/2021 744 01/07/2020 - 31/12/2020
Class X2 CHF Portfolio Hedged
0�001509 31/12/2020 04/01/2021 31/12/2020 01/02/2021 8,743 01/07/2020 - 31/12/2020
Class X2 CHF 0�001734 31/12/2020 04/01/2021 31/12/2020 01/02/2021 5,319 01/07/2020 - 31/12/2020 17,948
Federated Hermes Unconstrained Credit FundDistributing Distribution Date AmountClass per unit Declared Ex-date Record Date Date paid $ Relevant periodClass F2 GBP Hedged
0�014600 31/12/2020 04/01/2021 31/12/2020 01/02/2021 322,564 01/07/2020 - 31/12/2020
Class F2 EUR Hedged
0�030520 31/12/2020 04/01/2021 31/12/2020 01/02/2021 19 01/07/2020 - 31/12/2020
Class R2 EUR Hedged
0�023580 31/12/2020 04/01/2021 31/12/2020 01/02/2021 14 01/07/2020 - 31/12/2020
Class F2 USD 0�032450 31/12/2020 04/01/2021 31/12/2020 01/02/2021 12,681 01/07/2020 - 31/12/2020Class X2 USD 0�035280 31/12/2020 04/01/2021 31/12/2020 01/02/2021 176,459 01/07/2020 - 31/12/2020Class X2 GBP Hedged
0�015870 31/12/2020 04/01/2021 31/12/2020 01/02/2021 822,554 01/07/2020 - 31/12/2020
Class X2 EUR 0�034130 31/12/2020 04/01/2021 31/12/2020 01/02/2021 1,898 01/07/2020 - 31/12/2020Class X2 CHF Hedged
0�032600 31/12/2020 04/01/2021 31/12/2020 01/02/2021 18 01/07/2020 - 31/12/2020
Class X2 EUR Hedged
0�031940 31/12/2020 04/01/2021 31/12/2020 01/02/2021 75,118 01/07/2020 - 31/12/2020
Class F2 EUR 0�031450 31/12/2020 04/01/2021 31/12/2020 01/02/2021 30,214 01/07/2020 - 31/12/2020Class X2 CHF 0�032020 31/12/2020 04/01/2021 31/12/2020 01/02/2021 18 01/07/2020 - 31/12/2020Class A2 USD 0�031060 31/12/2020 04/01/2021 31/12/2020 01/02/2021 16 01/07/2020 - 31/12/2020Class B2 USD 0�026760 31/12/2020 04/01/2021 31/12/2020 01/02/2021 13 01/07/2020 - 31/12/2020Class L3 GBP Hedged
0�005390 31/12/2020 04/01/2021 31/12/2020 01/02/2021 619,164 01/07/2020 - 31/12/2020
Class L3 EUR Hedged
0�010970 31/12/2020 04/01/2021 31/12/2020 01/02/2021 22,533 01/07/2020 - 31/12/2020
Class L3 USD 0�011620 31/12/2020 04/01/2021 31/12/2020 01/02/2021 12,580 01/07/2020 - 31/12/2020 2,095,863
14. Distributions (continued)

370
Federated Hermes Investment Funds Public Limited CompanyNotes to the Financial Statements for the financial year ended 31 December 2020 (continued)
Federated Hermes Global Emerging Markets SMID Equity FundDistributing Distribution Date AmountClass per unit Declared Ex-date Record Date Date paid $ Relevant periodClass X2 USD 0�006055 31/12/2020 04/01/2021 31/12/2020 01/02/2021 22,120 01/07/2020 - 31/12/2020
22,120
Federated Hermes SDG Engagement High Yield Credit FundDistributing Distribution Date AmountClass per unit Declared Ex-date Record Date Date paid $ Relevant periodClass Y2 CHF Hedged
0�032750 31/12/2020 04/01/2021 31/12/2020 01/02/2021 240,123 02/10/2020 - 31/12/2020
Class W2 CHF Hedged
0�026370 31/12/2020 04/01/2021 31/12/2020 01/02/2021 9,881 02/10/2020 - 31/12/2020
Class Y2 USD 0�034540 31/12/2020 04/01/2021 31/12/2020 01/02/2021 67,113 02/10/2020 - 31/12/2020Class W2 USD 0�027750 31/12/2020 04/01/2021 31/12/2020 01/02/2021 17,692 02/10/2020 - 31/12/2020Class A2 USD 0�038620 31/12/2020 04/01/2021 31/12/2020 01/02/2021 19 02/10/2020 - 31/12/2020Class B2 USD 0�031780 31/12/2020 04/01/2021 31/12/2020 01/02/2021 16 02/10/2020 - 31/12/2020Class F2 EUR Hedged
0�014600 31/12/2020 04/01/2021 31/12/2020 01/02/2021 9 02/10/2020 - 31/12/2020
Class F2 USD 0�014700 31/12/2020 04/01/2021 31/12/2020 01/02/2021 7 02/10/2020 - 31/12/2020Class M2 GBP Hedged
0�004750 31/12/2020 04/01/2021 31/12/2020 01/02/2021 7 02/10/2020 - 31/12/2020
334,867
Federated Hermes US High Yield Credit FundDistributing Distribution Date AmountClass per unit Declared Ex-date Record Date Date paid $ Relevant periodClass F2 USD 0�037400 31/12/2020 04/01/2021 31/12/2020 01/02/2021 19 02/10/2020 - 31/12/2020Class X2 EUR 0�037000 31/12/2020 04/01/2021 31/12/2020 01/02/2021 22 02/10/2020 - 31/12/2020Class X2 GBP Hedged
0�019170 31/12/2020 04/01/2021 31/12/2020 01/02/2021 26 02/10/2020 - 31/12/2020
Class A2 USD 0�013480 31/12/2020 04/01/2021 31/12/2020 01/02/2021 7 02/10/2020 - 31/12/2020Class B2 USD 0�012260 31/12/2020 04/01/2021 31/12/2020 01/02/2021 6 02/10/2020 - 31/12/2020
80
14. Distributions (continued)

371
Federated Hermes Investment Funds Public Limited CompanyNotes to the Financial Statements for the financial year ended 31 December 2020 (continued)
The following distributions were paid during the financial year ended 31 December 2019:
Federated Hermes Global Emerging Markets Equity FundDistributing Distribution Date AmountClass per unit Declared Ex-date Record Date Date paid $ Relevant periodClass F2 GBP 0�008560 31/12/2018 02/01/2019 31/12/2018 01/02/2019 943,128 01/07/2018 - 31/12/2018Class F2 EUR 0�015560 31/12/2018 02/01/2019 31/12/2018 01/02/2019 919,166 01/07/2018 - 31/12/2018Class F2 USD 0�016280 31/12/2018 02/01/2019 31/12/2018 01/02/2019 382,875 01/07/2018 - 31/12/2018Class R2 USD 0�008046 31/12/2018 02/01/2019 31/12/2018 01/02/2019 16,520 01/07/2018 - 31/12/2018Class R2 EUR 0�007624 31/12/2018 02/01/2019 31/12/2018 01/02/2019 111,935 01/07/2018 - 31/12/2018Class R2 EUR Hedged
0�007007 31/12/2018 02/01/2019 31/12/2018 01/02/2019 11,577 01/07/2018 - 31/12/2018
Class J2 GBP 0�009711 31/12/2018 02/01/2019 31/12/2018 01/02/2019 1,072,925 01/07/2018 - 31/12/2018Class J2 USD 0�018702 31/12/2018 02/01/2019 31/12/2018 01/02/2019 25,974 01/07/2018 - 31/12/2018Class J2 EUR 0�018316 31/12/2018 02/01/2019 31/12/2018 01/02/2019 342,778 01/07/2018 - 31/12/2018Class J2 GBP Hedged
0�008614 31/12/2018 02/01/2019 31/12/2018 01/02/2019 85,140 01/07/2018 - 31/12/2018
Class J2 EUR Hedged
0�016593 31/12/2018 02/01/2019 31/12/2018 01/02/2019 1,055 01/07/2018 - 31/12/2018
Class F2 SGD 0�022710 31/12/2018 02/01/2019 31/12/2018 01/02/2019 6 01/07/2018 - 31/12/2018Class R2 SGD 0�012450 31/12/2018 02/01/2019 31/12/2018 01/02/2019 3 01/07/2018 - 31/12/2018Class F2 GBP 0�010106 30/06/2019 01/07/2019 30/06/2019 01/08/2019 1,720,436 01/01/2019 - 30/06/2019Class F2 EUR 0�019434 30/06/2019 01/07/2019 30/06/2019 01/08/2019 1,296,688 01/01/2019 - 30/06/2019Class F2 USD 0�019103 30/06/2019 01/07/2019 30/06/2019 01/08/2019 626,017 01/01/2019 - 30/06/2019Class F2 GBP Hedged
0�002154 30/06/2019 01/07/2019 30/06/2019 01/08/2019 46 01/01/2019 - 30/06/2019
Class R2 USD 0�010369 30/06/2019 01/07/2019 30/06/2019 01/08/2019 22,788 01/01/2019 - 30/06/2019Class R2 EUR 0�009813 30/06/2019 01/07/2019 30/06/2019 01/08/2019 134,910 01/01/2019 - 30/06/2019Class R2 EUR Hedged
0�009047 30/06/2019 01/07/2019 30/06/2019 01/08/2019 7,201 01/01/2019 - 30/06/2019
Class J2 GBP 0�011134 30/06/2019 01/07/2019 30/06/2019 01/08/2019 1,523,917 01/01/2019 - 30/06/2019Class J2 USD 0�02129 30/06/2019 01/07/2019 30/06/2019 01/08/2019 30,791 01/01/2019 - 30/06/2019Class J2 EUR 0�020964 30/06/2019 01/07/2019 30/06/2019 01/08/2019 538,867 01/01/2019 - 30/06/2019Class J2 GBP Hedged
0�009754 30/06/2019 01/07/2019 30/06/2019 01/08/2019 90,243 01/01/2019 - 30/06/2019
Class J2 EUR Hedged
0�018679 30/06/2019 01/07/2019 30/06/2019 01/08/2019 1,294 01/01/2019 - 30/06/2019
Class F2 SGD 0�02556 30/06/2019 01/07/2019 30/06/2019 01/08/2019 6 01/01/2019 - 30/06/2019Class F2 GBP 0�014700 30/06/2019 01/07/2019 30/06/2019 01/08/2019 4 01/01/2019 - 30/06/2019
9,906,290
Federated Hermes Global Equity FundDistributing Distribution Date AmountClass per unit Declared Ex-date Record Date Date paid $ Relevant periodClass F2 GBP 0�005593 31/12/2018 02/01/2019 31/12/2018 01/02/2019 19 01/07/2018 - 31/12/2018Class F2 EUR 0�009060 31/12/2018 02/01/2019 31/12/2018 01/02/2019 5 01/07/2018 - 31/12/2018Class F2 GBP 0�015647 30/06/2019 01/07/2019 30/06/2019 01/08/2019 617 01/01/2019 - 30/06/2019Class F2 EUR 0�022780 30/06/2019 01/07/2019 30/06/2019 01/08/2019 13 01/01/2019 - 30/06/2019Class A2 USD 0�018592 30/06/2019 01/07/2019 30/06/2019 01/08/2019 13,556 01/01/2019 - 30/06/2019
14,210
14. Distributions (continued)

372
Federated Hermes Investment Funds Public Limited CompanyNotes to the Financial Statements for the financial year ended 31 December 2020 (continued)
Federated Hermes European Alpha Equity FundDistributing Distribution Date AmountClass per unit Declared Ex-date Record Date Date paid € Relevant periodClass F2 GBP 0�000580 31/12/2018 02/01/2019 31/12/2018 01/02/2019 15 01/07/2018 - 31/12/2018Class F2 EUR 0�000972 31/12/2018 02/01/2019 31/12/2018 01/02/2019 435 01/07/2018 - 31/12/2018Class F2 USD 0�000824 31/12/2018 02/01/2019 31/12/2018 01/02/2019 131 01/07/2018 - 31/12/2018Class S2 GBP 0�001469 31/12/2018 02/01/2019 31/12/2018 01/02/2019 1,626 01/07/2018 - 31/12/2018Class S2 EUR 0�002869 31/12/2018 02/01/2019 31/12/2018 01/02/2019 14 01/07/2018 - 31/12/2018Class S2 GBP Hedged
0�000881 31/12/2018 02/01/2019 31/12/2018 01/02/2019 1,338 01/07/2018 - 31/12/2018
Class S2 USD 0�002340 31/12/2018 02/01/2019 31/12/2018 01/02/2019 582 01/07/2018 - 31/12/2018Class S2 USD Hedged
0�001865 31/12/2018 02/01/2019 31/12/2018 01/02/2019 283 01/07/2018 - 31/12/2018
Class M2 EUR 0�004500 31/12/2018 02/01/2019 31/12/2018 01/02/2019 852 01/07/2018 - 31/12/2018Class F2 GBP 0�023054 30/06/2019 01/07/2019 30/06/2019 01/08/2019 596 01/01/2019 - 30/06/2019Class F2 EUR 0�036672 30/06/2019 01/07/2019 30/06/2019 01/08/2019 84,860 01/01/2019 - 30/06/2019Class F2 USD 0�029940 30/06/2019 01/07/2019 30/06/2019 01/08/2019 4,800 01/01/2019 - 30/06/2019Class S2 GBP 0�019343 30/06/2019 01/07/2019 30/06/2019 01/08/2019 19,974 01/01/2019 - 30/06/2019Class S2 EUR 0�038851 30/06/2019 01/07/2019 30/06/2019 01/08/2019 20 01/01/2019 - 30/06/2019Class S2 GBP Hedged
0�018934 30/06/2019 01/07/2019 30/06/2019 01/08/2019 15,367 01/01/2019 - 30/06/2019
Class S2 USD 0�030632 30/06/2019 01/07/2019 30/06/2019 01/08/2019 7,663 01/01/2019 - 30/06/2019Class S2 USD Hedged
0�039495 30/06/2019 01/07/2019 30/06/2019 01/08/2019 3,875 01/01/2019 - 30/06/2019
Class M2 EUR 0�037222 30/06/2019 01/07/2019 30/06/2019 01/08/2019 7,043 01/01/2019 - 30/06/2019Class R2 EUR 0�021809 30/06/2019 01/07/2019 30/06/2019 01/08/2019 552 01/01/2019 - 30/06/2019
150,026
Federated Hermes Global High Yield Credit FundDistributing Distribution Date AmountClass per unit Declared Ex-date Record Date Date paid € Relevant periodClass F2 EUR Hedged
0�044915 31/12/2018 02/01/2019 31/12/2018 01/02/2019 21,515 01/07/2018 - 31/12/2018
Class F2 GBP Hedged
0�022680 31/12/2018 02/01/2019 31/12/2018 01/02/2019 9,894 01/07/2018 - 31/12/2018
Class F2 USD Hedged
0�045240 31/12/2018 02/01/2019 31/12/2018 01/02/2019 20 01/07/2018 - 31/12/2018
Class R2 EUR 0�043232 31/12/2018 02/01/2019 31/12/2018 01/02/2019 167,046 01/07/2018 - 31/12/2018Class F2 EUR 0�043943 30/06/2019 01/07/2019 30/06/2019 01/08/2019 22,386 01/01/2019 - 30/06/2019Class F2 GBP Hedged
0�022813 30/06/2019 01/07/2019 30/06/2019 01/08/2019 10,226 01/01/2019 - 30/06/2019
Class F2 USD Hedged
0�046780 30/06/2019 01/07/2019 30/06/2019 01/08/2019 21 01/01/2019 - 30/06/2019
Class M2 GBP Hedged
0�003775 30/06/2019 01/07/2019 30/06/2019 01/08/2019 50,624 01/01/2019 - 30/06/2019
Class R2 EUR 0�042339 30/06/2019 01/07/2019 30/06/2019 01/08/2019 160,669 01/01/2019 - 30/06/2019442,401
14. Distributions (continued)

373
Federated Hermes Investment Funds Public Limited CompanyNotes to the Financial Statements for the financial year ended 31 December 2020 (continued)
Federated Hermes Europe ex-UK Equity FundDistributing Distribution Date AmountClass per unit Declared Ex-date Record Date Date paid € Relevant periodClass F2 EUR 0�000380 31/12/2018 02/01/2019 31/12/2018 01/02/2019 - 01/07/2018 - 31/12/2018Class M2 GBP 0�001821 31/12/2018 02/01/2019 31/12/2018 01/02/2019 26,641 01/07/2018 - 31/12/2018Class M2 GBP Hedged
0�001440 31/12/2018 02/01/2019 31/12/2018 01/02/2019 2 01/07/2018 - 31/12/2018
Class M2 EUR 0�003009 31/12/2018 02/01/2019 31/12/2018 01/02/2019 3,357 01/07/2018 - 31/12/2018Class M2 USD Hedged
0�002222 31/12/2018 02/01/2019 31/12/2018 01/02/2019 135 01/07/2018 - 31/12/2018
Class F2 GBP 0�015755 30/06/2019 01/07/2019 30/06/2019 01/08/2019 203 01/01/2019 - 30/06/2019Class F2 EUR 0�02704 30/06/2019 01/07/2019 30/06/2019 01/08/2019 14 01/01/2019 - 30/06/2019Class F2 USD Hedged
0�02722 30/06/2019 01/07/2019 30/06/2019 01/08/2019 12 01/01/2019 - 30/06/2019
Class F2 GBP Hedged
0�015971 30/06/2019 01/07/2019 30/06/2019 01/08/2019 11,344 01/01/2019 - 30/06/2019
Class M2 GBP 0�015850 30/06/2019 01/07/2019 30/06/2019 01/08/2019 214,710 01/01/2019 - 30/06/2019Class M2 GBP Hedged
0�015769 30/06/2019 01/07/2019 30/06/2019 01/08/2019 810 01/01/2019 - 30/06/2019
Class M2 EUR 0�026139 30/06/2019 01/07/2019 30/06/2019 01/08/2019 24,593 01/01/2019 - 30/06/2019Class M2 USD Hedged
0�027569 30/06/2019 01/07/2019 30/06/2019 01/08/2019 1,688 01/01/2019 - 30/06/2019
283,509
Federated Hermes US SMID Equity FundDistributing Distribution Date AmountClass per unit Declared Ex-date Record Date Date paid $ Relevant periodClass L2 GBP 0�002222 31/12/2018 02/01/2019 31/12/2018 01/02/2019 16,827 01/07/2018 - 31/12/2018Class F2 CHF Hedged
0�000378 30/06/2019 01/07/2019 30/06/2019 01/08/2019 5 01/01/2019 - 30/06/2019
Class F2 EUR 0�000651 30/06/2019 01/07/2019 30/06/2019 01/08/2019 885 01/01/2019 - 30/06/2019Class F2 GBP 0�000635 30/06/2019 01/07/2019 30/06/2019 01/08/2019 22,422 01/01/2019 - 30/06/2019Class F2 GBP Hedged
0�000241 30/06/2019 01/07/2019 30/06/2019 01/08/2019 1,618 01/01/2019 - 30/06/2019
Class F2 USD 0�001076 30/06/2019 01/07/2019 30/06/2019 01/08/2019 37,110 01/01/2019 - 30/06/2019Class L2 GBP 0�000905 30/06/2019 01/07/2019 30/06/2019 01/08/2019 50,806 01/01/2019 - 30/06/2019Class L2 GBP Hedged
0�000703 30/06/2019 01/07/2019 30/06/2019 01/08/2019 2,857 01/01/2019 - 30/06/2019
Class L2 USD 0�001647 30/06/2019 01/07/2019 30/06/2019 01/08/2019 1,751 01/01/2019 - 30/06/2019134,281
14. Distributions (continued)

374
Federated Hermes Investment Funds Public Limited CompanyNotes to the Financial Statements for the financial year ended 31 December 2020 (continued)
Federated Hermes Asia ex-Japan Equity FundDistributing Distribution Date AmountClass per unit Declared Ex-date Record Date Date paid $ Relevant periodClass F2 GBP 0�024799 31/12/2018 02/01/2019 31/12/2018 01/02/2019 8,424,016 01/07/2018 - 31/12/2018Class F2 EUR 0�047052 31/12/2018 02/01/2019 31/12/2018 01/02/2019 873,726 01/07/2018 - 31/12/2018Class F2 EUR Hedged
0�026092 31/12/2018 02/01/2019 31/12/2018 01/02/2019 15,382 01/07/2018 - 31/12/2018
Class F2 USD 0�031027 31/12/2018 02/01/2019 31/12/2018 01/02/2019 529,048 01/07/2018 - 31/12/2018Class F2 GBP Hedged
0�017344 31/12/2018 02/01/2019 31/12/2018 01/02/2019 288,549 01/07/2018 - 31/12/2018
Class C2 EUR 0�026859 31/12/2018 02/01/2019 31/12/2018 01/02/2019 15 01/07/2018 - 31/12/2018Class C2 GBP 0�015998 31/12/2018 02/01/2019 31/12/2018 01/02/2019 24,032 01/07/2018 - 31/12/2018Class C2 USD 0�026675 31/12/2018 02/01/2019 31/12/2018 01/02/2019 13 01/07/2018 - 31/12/2018Class F2 GBP 0�019934 30/06/2019 01/07/2019 30/06/2019 01/08/2019 7,206,839 01/01/2019 - 30/06/2019Class F2 EUR 0�027899 30/06/2019 01/07/2019 30/06/2019 01/08/2019 473,921 01/01/2019 - 30/06/2019Class F2 EUR Hedged
0�020127 30/06/2019 01/07/2019 30/06/2019 01/08/2019 10,778 01/01/2019 - 30/06/2019
Class F2 USD 0�024778 30/06/2019 01/07/2019 30/06/2019 01/08/2019 438,917 01/01/2019 - 30/06/2019Class F2 GBP Hedged
0�01343 30/06/2019 01/07/2019 30/06/2019 01/08/2019 232,962 01/01/2019 - 30/06/2019
Class C2 EUR 0�020958 30/06/2019 01/07/2019 30/06/2019 01/08/2019 12 01/01/2019 - 30/06/2019Class C2 GBP 0�012426 30/06/2019 01/07/2019 30/06/2019 01/08/2019 20,702 01/01/2019 - 30/06/2019Class C2 USD 0�020254 30/06/2019 01/07/2019 30/06/2019 01/08/2019 10 01/01/2019 - 30/06/2019
18,538,922
Federated Hermes Global Equity ESG FundDistributing Distribution Date AmountClass per unit Declared Ex-date Record Date Date paid $ Relevant periodClass F2 CHF Hedged
0�004621 31/12/2018 02/01/2019 31/12/2018 01/02/2019 158 01/07/2018 - 31/12/2018
Class F2 CHF Portfolio Hedged
0�004645 31/12/2018 02/01/2019 31/12/2018 01/02/2019 19,705 01/07/2018 - 31/12/2018
Class F2 EUR Portfolio Hedged
0�003860 31/12/2018 02/01/2019 31/12/2018 01/02/2019 2 01/07/2018 - 31/12/2018
Class F2 USD Portfolio Hedged
0�004600 31/12/2018 02/01/2019 31/12/2018 01/02/2019 2 01/07/2018 - 31/12/2018
Class F2 CHF Hedged
0�013528 30/06/2019 01/07/2019 30/06/2019 01/08/2019 937 01/01/2019 - 30/06/2019
Class F2 CHF 0�00625 30/06/2019 01/07/2019 30/06/2019 01/08/2019 14,920 01/01/2019 - 30/06/2019Class F2 CHF Portfolio Hedged
0�013439 30/06/2019 01/07/2019 30/06/2019 01/08/2019 45,085 01/01/2019 - 30/06/2019
Class F2 EUR Portfolio Hedged
0�01388 30/06/2019 01/07/2019 30/06/2019 01/08/2019 8 01/01/2019 - 30/06/2019
Class F2 USD Portfolio Hedged
0�015256 30/06/2019 01/07/2019 30/06/2019 01/08/2019 796 01/01/2019 - 30/06/2019
81,613
14. Distributions (continued)

375
Federated Hermes Investment Funds Public Limited CompanyNotes to the Financial Statements for the financial year ended 31 December 2020 (continued)
Federated Hermes Multi-Strategy Credit FundDistributing Distribution Date AmountClass per unit Declared Ex-date Record Date Date paid $ Relevant periodClass F2 GBP 0�024606 31/12/2018 02/01/2019 31/12/2018 01/02/2019 39,328 01/07/2018 - 31/12/2018Class F2 GBP Hedged
0�018484 31/12/2018 02/01/2019 31/12/2018 01/02/2019 5,947,804 01/07/2018 - 31/12/2018
Class F2 EUR 0�036723 31/12/2018 02/01/2019 31/12/2018 01/02/2019 15,121 01/07/2018 - 31/12/2018Class F2 EUR Hedged
0�036876 31/12/2018 02/01/2019 31/12/2018 01/02/2019 442,597 01/07/2018 - 31/12/2018
Class F2 USD 0�036286 31/12/2018 02/01/2019 31/12/2018 01/02/2019 89,095 01/07/2018 - 31/12/2018Class R2 EUR 0�030116 31/12/2018 02/01/2019 31/12/2018 01/02/2019 125 01/07/2018 - 31/12/2018Class R2 EUR Hedged
0�030860 31/12/2018 02/01/2019 31/12/2018 01/02/2019 18 01/07/2018 - 31/12/2018
Class L2 GBP 0�018985 31/12/2018 02/01/2019 31/12/2018 01/02/2019 175,192 01/07/2018 - 31/12/2018Class L2 GBP Hedged
0�018602 31/12/2018 02/01/2019 31/12/2018 01/02/2019 1,884,668 01/07/2018 - 31/12/2018
Class R2 SGD Hedged
0�035520 31/12/2018 02/01/2019 31/12/2018 01/02/2019 9 01/07/2018 - 31/12/2018
Class Z2 EUR Hedged
0�042506 31/12/2018 02/01/2019 31/12/2018 01/02/2019 727,975 01/07/2018 - 31/12/2018
Class F2 GBP 0�021355 30/06/2019 01/07/2019 30/06/2019 01/08/2019 28,806 01/01/2019 - 30/06/2019Class F2 GBP Hedged
0�015861 30/06/2019 01/07/2019 30/06/2019 01/08/2019 5,158,797 01/01/2019 - 30/06/2019
Class F2 EUR 0�031977 30/06/2019 01/07/2019 30/06/2019 01/08/2019 13,338 01/01/2019 - 30/06/2019Class F2 EUR Hedged
0�031016 30/06/2019 01/07/2019 30/06/2019 01/08/2019 316,228 01/01/2019 - 30/06/2019
Class F2 USD 0�031513 30/06/2019 01/07/2019 30/06/2019 01/08/2019 120,625 01/01/2019 - 30/06/2019Class R2 EUR 0�02566 30/06/2019 01/07/2019 30/06/2019 01/08/2019 999 01/01/2019 - 30/06/2019Class R2 EUR Hedged
0�02516 30/06/2019 01/07/2019 30/06/2019 01/08/2019 14 01/01/2019 - 30/06/2019
Class L2 GBP 0�016553 30/06/2019 01/07/2019 30/06/2019 01/08/2019 108,995 01/01/2019 - 30/06/2019Class L2 GBP Hedged
0�016055 30/06/2019 01/07/2019 30/06/2019 01/08/2019 1,688,714 01/01/2019 - 30/06/2019
Class R2 SGD Hedged
0�03561 30/06/2019 01/07/2019 30/06/2019 01/08/2019 9 01/01/2019 - 30/06/2019
Class Z2 EUR Hedged
0�036425 30/06/2019 01/07/2019 30/06/2019 01/08/2019 621,456 01/01/2019 - 30/06/2019
17,379,913
Federated Hermes Global Small Cap Equity FundDistributing Distribution Date AmountClass per unit Declared Ex-date Record Date Date paid $ Relevant periodClass F2 GBP 0�000962 31/12/2018 02/01/2019 31/12/2018 01/02/2019 13,335 01/07/2018 - 31/12/2018Class F2 GBP 0�010754 30/06/2019 01/07/2019 30/06/2019 01/08/2019 148,084 01/01/2019 - 30/06/2019
161,419
14. Distributions (continued)

376
Federated Hermes Investment Funds Public Limited CompanyNotes to the Financial Statements for the financial year ended 31 December 2020 (continued)
Federated Hermes Absolute Return Credit FundDistributing Distribution Date AmountClass per unit Declared Ex-date Record Date Date paid $ Relevant periodClass F2 EUR Hedged
0�026900 31/12/2018 02/01/2019 31/12/2018 01/02/2019 15 01/07/2018 - 31/12/2018
Class F2 USD 0�028680 31/12/2018 02/01/2019 31/12/2018 01/02/2019 14 01/07/2018 - 31/12/2018Class F2 GBP 0�017261 31/12/2018 02/01/2019 31/12/2018 01/02/2019 37,683 01/07/2018 - 31/12/2018Class F2 GBP Hedged
0�013969 31/12/2018 02/01/2019 31/12/2018 01/02/2019 404,940 01/07/2018 - 31/12/2018
Class F2 EUR Hedged
0�02484 30/06/2019 01/07/2019 30/06/2019 01/08/2019 14 01/01/2019 - 30/06/2019
Class F2 USD 0�02734 30/06/2019 01/07/2019 30/06/2019 01/08/2019 14 01/01/2019 - 30/06/2019Class F2 GBP 0�016667 30/06/2019 01/07/2019 30/06/2019 01/08/2019 55,608 01/01/2019 - 30/06/2019Class F2 GBP Hedged
0�013281 30/06/2019 01/07/2019 30/06/2019 01/08/2019 327,243 01/01/2019 - 30/06/2019
825,531
14. Distributions (continued)

377
Federated Hermes Investment Funds Public Limited CompanyNotes to the Financial Statements for the financial year ended 31 December 2020 (continued)
Federated Hermes SDG Engagement Equity FundDistributing Distribution Date AmountClass per unit Declared Ex-date Record Date Date paid $ Relevant periodClass X2 GBP Portfolio Hedged
0�007708 30/06/2019 01/07/2019 30/06/2019 01/08/2019 2,132 01/01/2019 - 30/06/2019
Class X2 EUR Portfolio Hedged
0�014672 30/06/2019 01/07/2019 30/06/2019 01/08/2019 1,524 01/01/2019 - 30/06/2019
Class X2 USD Portfolio Hedged
0�015464 30/06/2019 01/07/2019 30/06/2019 01/08/2019 3,735 01/01/2019 - 30/06/2019
Class X2 CHF Portfolio Hedged
0�014335 30/06/2019 01/07/2019 30/06/2019 01/08/2019 53,443 01/01/2019 - 30/06/2019
Class W2 EUR Portfolio Hedged
0�008980 30/06/2019 01/07/2019 30/06/2019 01/08/2019 5 01/01/2019 - 30/06/2019
Class W2 USD Portfolio Hedged
0�010042 30/06/2019 01/07/2019 30/06/2019 01/08/2019 2,014 01/01/2019 - 30/06/2019
Class W2 CHF Portfolio Hedged
0�009276 30/06/2019 01/07/2019 30/06/2019 01/08/2019 246 01/01/2019 - 30/06/2019
Class F2 GBP Portfolio Hedged
0�006820 30/06/2019 01/07/2019 30/06/2019 01/08/2019 9 01/01/2019 - 30/06/2019
Class F2 EUR Portfolio Hedged
0�012660 30/06/2019 01/07/2019 30/06/2019 01/08/2019 7 01/01/2019 - 30/06/2019
Class F2 USD Portfolio Hedged
0�013280 30/06/2019 01/07/2019 30/06/2019 01/08/2019 7 01/01/2019 - 30/06/2019
Class F2 CHF Portfolio Hedged
0�012360 30/06/2019 01/07/2019 30/06/2019 01/08/2019 6 01/01/2019 - 30/06/2019
Class R2 EUR Portfolio Hedged
0�005138 30/06/2019 01/07/2019 30/06/2019 01/08/2019 278 01/01/2019 - 30/06/2019
Class R2 USD Portfolio Hedged
0�005416 30/06/2019 01/07/2019 30/06/2019 01/08/2019 46 01/01/2019 - 30/06/2019
Class R2 CHF Portfolio Hedged
0�004996 30/06/2019 01/07/2019 30/06/2019 01/08/2019 208 01/01/2019 - 30/06/2019
Class X2 CHF 0�006901 30/06/2019 01/07/2019 30/06/2019 01/08/2019 16,122 01/01/2019 - 30/06/201979,782
Federated Hermes Impact Opportunities Equity FundDistributing Distribution Date AmountClass per unit Declared Ex-date Record Date Date paid $ Relevant periodClass F2 EUR 0�000760 31/12/2018 02/01/2019 31/12/2018 01/02/2019 1 01/07/2018 - 31/12/2018Class F2 EUR 0�007520 30/06/2019 01/07/2019 30/06/2019 01/08/2019 4 01/01/2019 - 30/06/2019
5
14. Distributions (continued)

378
Federated Hermes Investment Funds Public Limited CompanyNotes to the Financial Statements for the financial year ended 31 December 2020 (continued)
Federated Hermes Unconstrained Credit FundDistributing Distribution Date AmountClass per unit Declared Ex-date Record Date Date paid $ Relevant periodClass F2 GBP Hedged
0�026760 31/12/2018 02/01/2019 31/12/2018 01/02/2019 60,628 01/07/2018 - 31/12/2018
Class R2 EUR Hedged
0�048960 31/12/2018 02/01/2019 31/12/2018 01/02/2019 28 01/07/2018 - 31/12/2018
Class F2 USD 0�054846 31/12/2018 02/01/2019 31/12/2018 01/02/2019 1,289 01/07/2018 - 31/12/2018Class X2 USD 0�057586 31/12/2018 02/01/2019 31/12/2018 01/02/2019 372,249 01/07/2018 - 31/12/2018Class X2 GBP Hedged
0�028887 31/12/2018 02/01/2019 31/12/2018 01/02/2019 988,963 01/07/2018 - 31/12/2018
Class X2 EUR 0�060180 31/12/2018 02/01/2019 31/12/2018 01/02/2019 35 01/07/2018 - 31/12/2018Class X2 CHF Hedged
0�057860 31/12/2018 02/01/2019 31/12/2018 01/02/2019 29 01/07/2018 - 31/12/2018
Class X2 EUR Hedged
0�058099 31/12/2018 02/01/2019 31/12/2018 01/02/2019 689,557 01/07/2018 - 31/12/2018
Class F2 EUR 0�057520 31/12/2018 02/01/2019 31/12/2018 01/02/2019 33 01/07/2018 - 31/12/2018Class X2 CHF 0�052640 31/12/2018 02/01/2019 31/12/2018 01/02/2019 27 01/07/2018 - 31/12/2018Class F2 GBP Hedged
0�019276 30/06/2019 01/07/2019 30/06/2019 01/08/2019 48,127 01/01/2019 - 30/06/2019
Class F2 EUR Hedged
0�01702 30/06/2019 01/07/2019 30/06/2019 01/08/2019 10 01/01/2019 - 30/06/2019
Class R2 EUR Hedged
0�0324 30/06/2019 01/07/2019 30/06/2019 01/08/2019 19 01/01/2019 - 30/06/2019
Class F2 USD 0�038977 30/06/2019 01/07/2019 30/06/2019 01/08/2019 9,089 01/01/2019 - 30/06/2019Class X2 USD 0�041351 30/06/2019 01/07/2019 30/06/2019 01/08/2019 281,518 01/01/2019 - 30/06/2019Class X2 GBP Hedged
0�020522 30/06/2019 01/07/2019 30/06/2019 01/08/2019 808,009 01/01/2019 - 30/06/2019
Class X2 EUR 0�04406 30/06/2019 01/07/2019 30/06/2019 01/08/2019 25 01/01/2019 - 30/06/2019Class X2 CHF Hedged
0�04046 30/06/2019 01/07/2019 30/06/2019 01/08/2019 21 01/01/2019 - 30/06/2019
Class X2 EUR Hedged
0�040381 30/06/2019 01/07/2019 30/06/2019 01/08/2019 430,675 01/01/2019 - 30/06/2019
Class F2 EUR 0�04118 30/06/2019 01/07/2019 30/06/2019 01/08/2019 23 01/01/2019 - 30/06/2019Class X2 CHF 0�0413 30/06/2019 01/07/2019 30/06/2019 01/08/2019 21 01/01/2019 - 30/06/2019
3,690,375
Hermes Global Emerging Markets SMID Equity FundDistributing Distribution Date AmountClass per unit Declared Ex-date Record Date Date paid $ Relevant periodClass X2 USD 0�003814 31/12/2018 02/01/2019 31/12/2018 01/02/2019 19,292 01/07/2018 – 31/12/2018Class X2 USD 0�011087 30/06/2019 01/07/2019 30/06/2019 01/08/2019 65,992 01/01/2019 – 30/06/2019
85,284
14. Distributions (continued)

379
Federated Hermes Investment Funds Public Limited CompanyNotes to the Financial Statements for the financial year ended 31 December 2020 (continued)
15. Comparative Net Asset Values
Federated Hermes Global Emerging Markets Equity Fund Share Class
31 December 2020
31 December 2019
31 December 2018
0 $ $ $Net Asset Value A2 USD Distributing 1,349 1,090 –Net Asset Value per share A2 USD Distributing 2�6989 2�1808 –
0 £ £ £Net Asset Value Z GBP Accumulating – 1,282 1,057Net Asset Value per share Z GBP Accumulating – 4�4202 3�6438
0 € € €Net Asset Value R EUR Accumulating 153,088,710 139,274,247 108,294,801Net Asset Value per share R EUR Accumulating 5�2878 4�6751 3�7093
0 £ £ £Net Asset Value T GBP Accumulating 3,972,014 2,842,056 1,999,471Net Asset Value per share T GBP Accumulating 3�1547 2�5970 2�1418
0 £ £ £Net Asset Value F GBP Accumulating 346,373,782 330,494,382 259,918,564Net Asset Value per share F GBP Accumulating 2�6368 2�1925 1�8263
0 $ $ $Net Asset Value F USD Accumulating 1,949,184,726 1,798,516,179 1,227,919,130Net Asset Value per share F USD Accumulating 4�0847 3�2871 2�6467
0 $ $ $Net Asset Value K USD Accumulating 4,137,862 920,200 –Net Asset Value per share K USD Accumulating 2�8436 2�2814 –
0 CHF CHF CHFNet Asset Value J CHF Accumulating Hedged 9,208,379 1,851,775 –Net Asset Value per share J CHF Accumulating Hedged 2�7964 2�2922 –
0 € € €Net Asset Value F EUR Accumulating 900,696,761 988,881,628 578,962,560Net Asset Value per share F EUR Accumulating 4�8372 4�2554 3�3595
0 € € €Net Asset Value R2 EUR Distributing 31,164,474 28,335,638 26,788,337Net Asset Value per share R2 EUR Distributing 2�9479 2�6127 2�0893
0 $ $ $Net Asset Value R2 USD Distributing 9,036,984 5,589,857 4,553,218Net Asset Value per share R2 USD Distributing 3�3538 2�7192 2�2176
0 £ £ £Net Asset Value F2 GBP Distributing 120,381,999 93,151,722 117,714,980Net Asset Value per share F2 GBP Distributing 1�9341 1�6198 1�3667
0 € € €Net Asset Value R2 EUR Distributing Hedged 5,919,594 2,105,306 2,993,390Net Asset Value per share R2 EUR Distributing Hedged 2�9835 2�4701 2�0746
0 $ $ $Net Asset Value R USD Accumulating 146,507,992 109,517,203 48,195,446Net Asset Value per share R USD Accumulating 3�5910 2�9043 2�3501
0 € € €Net Asset Value F EUR Accumulating Hedged 29,164,467 27,281,547 66,541,459Net Asset Value per share F EUR Accumulating Hedged 3�4303 2�8218 2�3418

380
Federated Hermes Investment Funds Public Limited CompanyNotes to the Financial Statements for the financial year ended 31 December 2020 (continued)
Federated Hermes Global Emerging Markets Equity Fund (continued) Share Class
31 December 2020
31 December 2019
31 December 2018
0 $ $ $Net Asset Value F2 USD Distributing 90,429,121 66,660,533 61,097,856Net Asset Value per share F2 USD Distributing 3�9298 3�1853 2�5979
0 $ $ $Net Asset Value G USD Accumulating 265,579,642 208,281,689 192,450,601Net Asset Value per share G USD Accumulating 4�1134 3�3351 2�7056
0 € € €Net Asset Value G EUR Accumulating – 88,488 70,384Net Asset Value per share G EUR Accumulating – 3�1955 2�5417
0 € € €Net Asset Value F2 EUR Distributing 221,057,839 192,823,612 128,160,135Net Asset Value per share F2 EUR Distributing 3�5062 3�1067 2�4843
0 $ $ $Net Asset Value Z USD Accumulating 55,429,308 57,840,081 16,895,181Net Asset Value per share Z USD Accumulating 3�9601 3�1551 2�5152
0 € € €Net Asset Value J EUR Accumulating 491,744,842 238,309,195 89,817,897Net Asset Value per share J EUR Accumulating 3�4468 3�0231 2�3794
0 £ £ £Net Asset Value J GBP Accumulating 215,962,849 130,895,286 37,327,791Net Asset Value per share J GBP Accumulating 1�8366 1�5225 1�2644
0 $ $ $Net Asset Value J USD Accumulating 336,085,965 206,995,345 126,406,133Net Asset Value per share J USD Accumulating 3�7818 3�0342 2�4358
0 € € €Net Asset Value J2 EUR Distributing 105,044,589 73,426,189 38,141,138Net Asset Value per share J2 EUR Distributing 3�2941 2�9183 2�3338
0 £ £ £Net Asset Value J2 GBP Distributing 452,920,940 263,339,413 107,204,355Net Asset Value per share J2 GBP Distributing 1�7544 1�4690 1�2395
0 $ $ $Net Asset Value J2 USD Distributing 87,889,705 39,726,125 3,316,043Net Asset Value per share J2 USD Distributing 3�6123 2�9276 2�3876
0 € € €Net Asset Value J EUR Accumulating Hedged 21,008,141 10,272,245 10,920,204Net Asset Value per share J EUR Accumulating Hedged 3�2587 2�6755 2�2146
0 £ £ £Net Asset Value J GBP Accumulating Hedged 17,069,737 12,816,590 6,043,269Net Asset Value per share J GBP Accumulating Hedged 1�6822 1�3813 1�1322
0 € € €Net Asset Value J2 EUR Distributing Hedged 108,526 170,564 120,925Net Asset Value per share J2 EUR Distributing Hedged 3�1313 2�5923 2�1769
0 £ £ £Net Asset Value J2 GBP Distributing Hedged 21,017,882 12,010,383 8,612,721Net Asset Value per share J2 GBP Distributing Hedged 1�6115 1�3360 1�1126
0 CHF CHF CHFNet Asset Value F CHF Accumulating 22,363,096 14,751,945 11,815,402Net Asset Value per share F CHF Accumulating 3�2859 2�9022 2�3779
15. Comparative Net Asset Values (continued)

381
Federated Hermes Investment Funds Public Limited CompanyNotes to the Financial Statements for the financial year ended 31 December 2020 (continued)
Federated Hermes Global Emerging Markets Equity Fund (continued) Share Class
31 December 2020
31 December 2019
31 December 2018
0 S$ S$ S$Net Asset Value F SGD Accumulating 798,097 551,926 1,147Net Asset Value per share F SGD Accumulating 5�1547 4�2233 3�4416
0 S$ S$ S$Net Asset Value F2 SGD Distributing – 1,369 1,131Net Asset Value per share F2 SGD Distributing – 4�1075 3�3943
0 S$ S$ S$Net Asset Value R SGD Accumulating 2,227,008 1,348,575 541,085Net Asset Value per share R SGD Accumulating 5�0475 4�1561 3�4037
0 S$ S$ S$Net Asset Value R2 SGD Distributing – 1,364 1,127Net Asset Value per share R2 SGD Distributing – 4�0928 3�3797
0 CHF CHF CHFNet Asset Value F CHF Accumulating Hedged 3,948,292 1,694,343 1,172,323Net Asset Value per share F CHF Accumulating Hedged 2�4509 2�0159 1�6778
0 S$ S$ S$Net Asset Value J SGD Accumulating 496,335 1,142 –Net Asset Value per share J SGD Accumulating 4�1934 3�4257 –
0 £ £ £Net Asset Value F2 GBP Distributing Hedged 962,890 25,921 –Net Asset Value per share F2 GBP Distributing Hedged 1�3887 1�1520 –
0 € € €Net Asset Value F2 EUR Distributing Hedged 35,733 – –Net Asset Value per share F2 EUR Distributing Hedged 3�3665 – –
15. Comparative Net Asset Values (continued)

382
Federated Hermes Investment Funds Public Limited CompanyNotes to the Financial Statements for the financial year ended 31 December 2020 (continued)
Federated Hermes Global Equity Fund Share Class
31 December 2020
31 December 2019
31 December 2018
0 £ £ £Net Asset Value Z GBP Accumulating – 1,243 1,017Net Asset Value per share Z GBP Accumulating – 1�2441 1�0182
0 € € €Net Asset Value R EUR Accumulating 533,055 129,925 1,008,834Net Asset Value per share R EUR Accumulating 5�9659 5�6334 4�4183
0 £ £ £Net Asset Value T GBP Accumulating 1,644,011 2,325,917 2,103,207Net Asset Value per share T GBP Accumulating 3�4424 3�0389 2�4874
0 £ £ £Net Asset Value F GBP Accumulating 1,345,989 1,213,190 2,118,641Net Asset Value per share F GBP Accumulating 2�8808 2�5571 2�1047
0 $ $ $Net Asset Value F USD Accumulating 1,685,340 1,447,859 31,904,832Net Asset Value per share F USD Accumulating 3�7830 3�2500 2�5855
0 £ £ £Net Asset Value F2 GBP Distributing 39,075 28,999 3,918Net Asset Value per share F2 GBP Distributing 1�9000 1�7287 1�4418
0 € € €Net Asset Value F EUR Accumulating 9,323,157 8,904,260 14,403,533Net Asset Value per share F EUR Accumulating 3�6946 3�4698 2�7066
0 € € €Net Asset Value F2 EUR Distributing – 1,328 1,050Net Asset Value per share F2 EUR Distributing – 2�6557 2�0999
0 $ $ $Net Asset Value R USD Accumulating 12,846 11,097 8,877Net Asset Value per share R USD Accumulating 3�5049 3�0277 2�4220
0 S$ S$ S$Net Asset Value R SGD Accumulating – 1,457 1,180Net Asset Value per share R SGD Accumulating – 4�5163 3�6575
0 $ $ $Net Asset Value A2 USD Distributing 18,929,308 4,328,135 –Net Asset Value per share A2 USD Distributing 2�5476 2�2436 –
0 $ $ $Net Asset Value B2 USD Distributing 1,225 1,078 –Net Asset Value per share B2 USD Distributing 2�4497 2�1568 –
Federated Hermes European Alpha Equity Fund Share Class
31 December 2020
31 December 2019
31 December 2018
0 £ £ £Net Asset Value Z GBP Accumulating – 1,079 877Net Asset Value per share Z GBP Accumulating – 2�4454 1�9886
0 € € €Net Asset Value R EUR Accumulating 10,749,313 13,238,991 13,464,938Net Asset Value per share R EUR Accumulating 3�9095 3�7007 2�8967
0 £ £ £Net Asset Value T GBP Accumulating 1,298,816 1,035,284 593,156Net Asset Value per share T GBP Accumulating 2�5313 2�2310 1�8151
15. Comparative Net Asset Values (continued)

383
Federated Hermes Investment Funds Public Limited CompanyNotes to the Financial Statements for the financial year ended 31 December 2020 (continued)
Federated Hermes European Alpha Equity Fund (continued) Share Class
31 December 2020
31 December 2019
31 December 2018
0 € € €Net Asset Value Z EUR Accumulating 35,556,231 28,864,971 27,786,527Net Asset Value per share Z EUR Accumulating 4�7987 4�4747 3�4503
0 £ £ £Net Asset Value F GBP Accumulating 561,521 2,361,070 1,277,543Net Asset Value per share F GBP Accumulating 2�0625 1�8317 1�5015
0 € € €Net Asset Value F EUR Accumulating 844,836 2,780,831 8,826,148Net Asset Value per share F EUR Accumulating 3�4363 3�2285 2�5083
0 £ £ £Net Asset Value F2 GBP Distributing 43,375 39,082 32,346Net Asset Value per share F2 GBP Distributing 1�8477 1�6848 1�4009
0 £ £ £Net Asset Value R GBP Accumulating – 1,445 1,193Net Asset Value per share R GBP Accumulating – 1�5376 1�2696
0 € € €Net Asset Value F2 EUR Distributing 1,273,731 5,073,494 992,864Net Asset Value per share F2 EUR Distributing 2�9214 2�8185 2�2212
0 € € €Net Asset Value S2 EUR Distributing – 1,408 10,917Net Asset Value per share S2 EUR Distributing – 2�7927 2�2006
0 $ $ $Net Asset Value F2 USD Distributing – 414,741 333,353Net Asset Value per share F2 USD Distributing – 2�2726 1�8266
0 £ £ £Net Asset Value S2 GBP Distributing 349,661 503,067 1,109,244Net Asset Value per share S2 GBP Distributing 1�4733 1�3434 1�1172
0 $ $ $Net Asset Value S2 USD Distributing 714,663 630,707 506,971Net Asset Value per share S2 USD Distributing 2�5097 2�2149 1�7804
0 $ $ $Net Asset Value S USD Accumulating Hedged 1,752,819 3,034,597 2,725,808Net Asset Value per share S USD Accumulating Hedged 3�4081 3�1431 2�3688
0 € € €Net Asset Value S EUR Accumulating 3,782,694 8,395,400 18,323,428Net Asset Value per share S EUR Accumulating 3�1665 2�9704 2�3042
0 £ £ £Net Asset Value S2 GBP Distributing Hedged 723,454 948,372 1,447,390Net Asset Value per share S2 GBP Distributing Hedged 1�4042 1�3607 1�0625
0 $ $ $Net Asset Value R USD Accumulating Hedged 1,367,211 1,945,601 2,698,439Net Asset Value per share R USD Accumulating Hedged 3�0530 2�8436 2�1620
0 £ £ £Net Asset Value S GBP Accumulating 2,847,068 2,899,837 2,512,503Net Asset Value per share S GBP Accumulating 1�6272 1�4428 1�1809
0 CHF CHF CHFNet Asset Value R CHF Accumulating Hedged 82,199 134,224 265,936Net Asset Value per share R CHF Accumulating Hedged 2�8741 2�7265 2�1412
15. Comparative Net Asset Values (continued)

384
Federated Hermes Investment Funds Public Limited CompanyNotes to the Financial Statements for the financial year ended 31 December 2020 (continued)
Federated Hermes European Alpha Equity Fund (continued) Share Class
31 December 2020
31 December 2019
31 December 2018
0 $ $ $Net Asset Value S2 USD Distributing Hedged 92,952 88,154 392,214Net Asset Value per share S2 USD Distributing Hedged 3�1018 2�9417 2�2526
0 £ £ £Net Asset Value S GBP Accumulating Hedged 1,831,873 2,553,578 3,305,640Net Asset Value per share S GBP Accumulating Hedged 1�5539 1�4673 1�1282
0 $ $ $Net Asset Value S USD Accumulating 112,137 96,228 76,132Net Asset Value per share S USD Accumulating 2�6920 2�3101 1�8277
0 € € €Net Asset Value M EUR Accumulating 33,619,087 76,721,871 278,306,737Net Asset Value per share M EUR Accumulating 3�0195 2�8284 2�1910
0 € € €Net Asset Value M2 EUR Distributing 490,547 492,947 388,534Net Asset Value per share M2 EUR Distributing 2�7004 2�6051 2�0533
0 $ $ $Net Asset Value R USD Accumulating 71,602 62,000 49,494Net Asset Value per share R USD Accumulating 2�5470 2�2055 1�7606
0 CHF CHF CHFNet Asset Value R CHF Accumulating – 1,229 998Net Asset Value per share R CHF Accumulating – 2�4628 1�9994
0 € € €Net Asset Value R2 EUR Distributing 58,083 56,046 876Net Asset Value per share R2 EUR Distributing 2�2951 2�2146 1�7515
Federated Hermes Global High Yield Credit Fund Share Class
31 December 2020
31 December 2019
31 December 2018
0 £ £ £Net Asset Value Z GBP Accumulating – 1,112 44,801,094Net Asset Value per share Z GBP Accumulating – 1�9599 1�7918
0 € € €Net Asset Value R EUR Accumulating 16,703,864 41,261 1,493Net Asset Value per share R EUR Accumulating 3�4403 3�4185 2�9866
0 £ £ £Net Asset Value F GBP Accumulating 1,002,398 637,195 895,109Net Asset Value per share F GBP Accumulating 1�6665 1�5584 1�4340
0 € € €Net Asset Value F EUR Accumulating 74,717,988 28,166,372 75,510,368Net Asset Value per share F EUR Accumulating 2�7411 2�7076 2�3519
0 £ £ £Net Asset Value F GBP Accumulating Hedged 7,324,584 8,076,557 22,178,146Net Asset Value per share F GBP Accumulating Hedged 1�3741 1�3580 1�1678
0 £ £ £Net Asset Value F2 GBP Distributing Hedged 716,318 496,948 366,088Net Asset Value per share F2 GBP Distributing Hedged 1�0048 1�0364 0�9349
0 $ $ $Net Asset Value F2 USD Distributing Hedged 6,701,382 62,296 977Net Asset Value per share F2 USD Distributing Hedged 2�1851 2�2130 1�9538
15. Comparative Net Asset Values (continued)

385
Federated Hermes Investment Funds Public Limited CompanyNotes to the Financial Statements for the financial year ended 31 December 2020 (continued)
Federated Hermes Global High Yield Credit Fund (continued) Share Class
31 December 2020
31 December 2019
31 December 2018
0 $ $ $Net Asset Value F USD Accumulating Hedged 5,321,547 1,344,386 12,946,204Net Asset Value per share F USD Accumulating Hedged 2�8399 2�7506 2�3231
0 £ £ £Net Asset Value T GBP Accumulating 1,164 1,081 988Net Asset Value per share T GBP Accumulating 1�5775 1�4651 1�3392
0 £ £ £Net Asset Value T GBP Accumulating Hedged 801,135 166,758 978Net Asset Value per share T GBP Accumulating Hedged 1�3304 1�3060 1�1159
0 $ $ $Net Asset Value R USD Accumulating – 1,231 1,095Net Asset Value per share R USD Accumulating – 2�4615 2�1904
0 € € €Net Asset Value R2 EUR Distributing 10,196,343 8,930,772 7,762,260Net Asset Value per share R2 EUR Distributing 2�1491 2�2196 2�0214
0 £ £ £Net Asset Value R GBP Accumulating – 1,117 1,034Net Asset Value per share R GBP Accumulating – 1�1172 1�0336
0 $ $ $Net Asset Value R USD Accumulating Hedged 173,315 1,200 1,018Net Asset Value per share R USD Accumulating Hedged 2�4639 2�3994 2�0356
0 € € €Net Asset Value F2 EUR Distributing 51,671 288,030 879,329Net Asset Value per share F2 EUR Distributing 1�9494 2�0135 1�8340
0 CHF CHF CHFNet Asset Value F CHF Accumulating Hedged 29,261,039 11,783,792 21,789,850Net Asset Value per share F CHF Accumulating Hedged 2�1641 2�1458 1�8724
0 £ £ £Net Asset Value M GBP Accumulating Hedged 17,402,196 15,008,450 –Net Asset Value per share M GBP Accumulating Hedged 1�0975 1�0813 –
0 $ $ $Net Asset Value M USD Accumulating Hedged 1,156,636 565,913 –Net Asset Value per share M USD Accumulating Hedged 2�2618 2�1856 –
0 £ £ £Net Asset Value M2 GBP Distributing Hedged 112,306,544 42,028,942 –Net Asset Value per share M2 GBP Distributing Hedged 1�0433 1�0772 –
0 € € €Net Asset Value M EUR Accumulating 1,327 – –Net Asset Value per share M EUR Accumulating 2�6543 – –
0 € € €Net Asset Value M2 EUR Distributing 1,306 – –Net Asset Value per share M2 EUR Distributing 2�6119 – –
0 € € €Net Asset Value M3 EUR Distributing 1,293 – –Net Asset Value per share M3 EUR Distributing 2�5858 – –
0 € € €Net Asset Value M4 EUR Distributing 1,285 – –Net Asset Value per share M4 EUR Distributing 2�5696 – –
15. Comparative Net Asset Values (continued)

386
Federated Hermes Investment Funds Public Limited CompanyNotes to the Financial Statements for the financial year ended 31 December 2020 (continued)
Federated Hermes Global High Yield Credit Fund (continued) Share Class
31 December 2020
31 December 2019
31 December 2018
0 $ $ $Net Asset Value B USD Accumulating 1,071 – –Net Asset Value per share B USD Accumulating 2�1423 – –
0 AUS $ AUS $ AUS $Net Asset Value L3 AUD Distributing Hedged 62,748,811 – –Net Asset Value per share L3 AUD Distributing Hedged 3�1951 – –
0 $ $ $Net Asset Value A2 USD Distributing Hedged 1,031 – –Net Asset Value per share A2 USD Distributing Hedged 2�0614 – –
0 $ $ $Net Asset Value B2 USD Distributing Hedged 1,030 – –Net Asset Value per share B2 USD Distributing Hedged 2�0597 – –
Federated Hermes Europe ex-UK Equity Fund Share Class
31 December 2020
31 December 2019
31 December 2018
0 £ £ £Net Asset Value Z GBP Accumulating – 1,198 963Net Asset Value per share Z GBP Accumulating – 2�8685 2�3045
0 € € €Net Asset Value R EUR Accumulating 53,376 392,311 635,338Net Asset Value per share R EUR Accumulating 5�1386 4�4397 3�4338
0 £ £ £Net Asset Value R GBP Accumulating 39,379 32,157 1,422Net Asset Value per share R GBP Accumulating 2�9931 2�4442 1�9947
0 £ £ £Net Asset Value F GBP Accumulating 3,691,971 16,613,568 3,748,885Net Asset Value per share F GBP Accumulating 2�7933 2�2641 1�8337
0 € € €Net Asset Value F EUR Accumulating 1,416,206 331,654 5,250,460Net Asset Value per share F EUR Accumulating 4�4846 3�8456 2�9513
0 £ £ £Net Asset Value F2 GBP Distributing Hedged 339,454 1,038,701 1,966,515Net Asset Value per share F2 GBP Distributing Hedged 1�8737 1�6336 1�2546
0 $ $ $Net Asset Value F2 USD Distributing Hedged – 1,398 151,223Net Asset Value per share F2 USD Distributing Hedged – 2�7965 2�1053
0 € € €Net Asset Value F2 EUR Distributing 1,562 1,603,234 1,051Net Asset Value per share F2 EUR Distributing 3�1242 2�7101 2�1018
0 £ £ £Net Asset Value F2 GBP Distributing 594,768 41,342 6,541Net Asset Value per share F2 GBP Distributing 1�9032 1�5601 1�2767
0 £ £ £Net Asset Value M GBP Accumulating 24,039,752 143,509,294 165,136,985Net Asset Value per share M GBP Accumulating 1�7783 1�4370 1�1604
0 £ £ £Net Asset Value M GBP Accumulating Hedged – 1,454 1,101Net Asset Value per share M GBP Accumulating Hedged – 1�4536 1�1006
15. Comparative Net Asset Values (continued)

387
Federated Hermes Investment Funds Public Limited CompanyNotes to the Financial Statements for the financial year ended 31 December 2020 (continued)
Federated Hermes Europe ex-UK Equity Fund (continued) Share Class
31 December 2020
31 December 2019
31 December 2018
0 £ £ £Net Asset Value M2 GBP Distributing 1,386,379 1,599,752 14,705,378Net Asset Value per share M2 GBP Distributing 1�6725 1�3708 1�1216
0 £ £ £Net Asset Value M2 GBP Distributing Hedged 59,062 15,981,385 1,064Net Asset Value per share M2 GBP Distributing Hedged 1�5905 1�3858 1�0636
0 € € €Net Asset Value M2 EUR Distributing 1,377 2,328,097 2,066,264Net Asset Value per share M2 EUR Distributing 2�7541 2�3882 1�8522
0 $ $ $Net Asset Value M2 USD Distributing Hedged – 1,279 134,253Net Asset Value per share M2 USD Distributing Hedged – 2�5581 1�9264
Federated Hermes US SMID Equity Fund Share Class
31 December 2020
31 December 2019
31 December 2018
0 £ £ £Net Asset Value Z GBP Accumulating 102,035,325 95,989,526 75,566,275Net Asset Value per share Z GBP Accumulating 3�2351 3�0434 2�3958
0 £ £ £Net Asset Value F GBP Accumulating 31,446,605 68,544,088 60,844,862Net Asset Value per share F GBP Accumulating 2�9668 2�8121 2�2305
0 € € €Net Asset Value R EUR Accumulating 691,970 18,268,488 6,820,872Net Asset Value per share R EUR Accumulating 4�9637 5�0153 3�7986
0 $ $ $Net Asset Value F USD Accumulating 214,868,743 246,303,745 252,556,059Net Asset Value per share F USD Accumulating 4�3838 4�0215 3�0832
0 £ £ £Net Asset Value T GBP Accumulating 1,025,087 1,287,316 1,100,148Net Asset Value per share T GBP Accumulating 2�5465 2�3956 1�8859
0 £ £ £Net Asset Value F2 GBP Distributing 45,006,240 61,187,866 49,343,106Net Asset Value per share F2 GBP Distributing 2�3808 2�2584 1�7918
0 $ $ $Net Asset Value F2 USD Distributing 5,192,453 24,122,372 103,655,003Net Asset Value per share F2 USD Distributing 4�2258 3�8797 2�9755
0 € € €Net Asset Value F EUR Accumulating 37,652,177 44,469,355 35,860,779Net Asset Value per share F EUR Accumulating 4�3953 4�4077 3�3133
0 € € €Net Asset Value F2 EUR Distributing 2,018,022 3,837,759 834,325Net Asset Value per share F2 EUR Distributing 4�3560 4�3703 3�2857
0 € € €Net Asset Value F EUR Accumulating Hedged 17,810,100 2,054,225 4,650,901Net Asset Value per share F EUR Accumulating Hedged 3�5158 3�3038 2�6052
0 £ £ £Net Asset Value F GBP Accumulating Hedged 14,790,225 22,614,193 12,524,299Net Asset Value per share F GBP Accumulating Hedged 1�7141 1�6292 1�2696
15. Comparative Net Asset Values (continued)

388
Federated Hermes Investment Funds Public Limited CompanyNotes to the Financial Statements for the financial year ended 31 December 2020 (continued)
Federated Hermes US SMID Equity Fund (continued) Share Class
31 December 2020
31 December 2019
31 December 2018
0 £ £ £Net Asset Value F2 GBP Distributing Hedged 1,286,605 8,256,733 5,948,159Net Asset Value per share F2 GBP Distributing Hedged 1�6871 1�6047 1�2517
0 CHF CHF CHFNet Asset Value R CHF Accumulating Hedged 293,442 305,875 307,473Net Asset Value per share R CHF Accumulating Hedged 2�8606 2�7150 2�1652
0 € € €Net Asset Value R EUR Accumulating Hedged 2,441,975 339,120 578,055Net Asset Value per share R EUR Accumulating Hedged 2�9102 2�7554 2�1885
0 $ $ $Net Asset Value R USD Accumulating 10,793,095 9,202,454 3,460,280Net Asset Value per share R USD Accumulating 3�2894 3�0402 2�3485
0 CHF CHF CHFNet Asset Value F CHF Accumulating Hedged 2,677,172 3,025,672 2,985,834Net Asset Value per share F CHF Accumulating Hedged 2�8040 2�6407 2�0901
0 CHF CHF CHFNet Asset Value F2 CHF Distributing Hedged 32,254 30,386 24,067Net Asset Value per share F2 CHF Distributing Hedged 2�6519 2�4984 1�9788
0 S$ S$ S$Net Asset Value F SGD Accumulating – 1,225 951Net Asset Value per share F SGD Accumulating – 3�6755 2�8543
0 S$ S$ S$Net Asset Value R SGD Accumulating – 1,203 940Net Asset Value per share R SGD Accumulating – 3�6094 2�8210
0 £ £ £Net Asset Value L GBP Accumulating 12,680,363 81,162,585 60,559,364Net Asset Value per share L GBP Accumulating 1�2485 1�1823 0�9368
0 $ $ $Net Asset Value L USD Accumulating 20,591,543 51,928,385 24,765,239Net Asset Value per share L USD Accumulating 2�6887 2�4641 1�8872
0 £ £ £Net Asset Value L2 GBP Distributing 73,200,870 53,165,748 58,921,300Net Asset Value per share L2 GBP Distributing 1�3143 1�2465 0�9886
0 £ £ £Net Asset Value L2 GBP Distributing Hedged 8,268,174 12,190,893 3,337,448Net Asset Value per share L2 GBP Distributing Hedged 1�2460 1�1847 0�9237
0 $ $ $Net Asset Value L2 USD Distributing 122,050,900 122,942,881 1,948,562Net Asset Value per share L2 USD Distributing 2�5558 2�3461 1�7982
0 £ £ £Net Asset Value R GBP Accumulating – 1,121 896Net Asset Value per share R GBP Accumulating – 1�1211 0�8960
0 $ $ $Net Asset Value A2 USD Distributing 1,165 1,069 –Net Asset Value per share A2 USD Distributing 2�3292 2�1375 –
0 $ $ $Net Asset Value B2 USD Distributing 1,155 1,067 –Net Asset Value per share B2 USD Distributing 2�3100 2�1343 –
15. Comparative Net Asset Values (continued)

389
Federated Hermes Investment Funds Public Limited CompanyNotes to the Financial Statements for the financial year ended 31 December 2020 (continued)
Federated Hermes US SMID Equity Fund (continued) Share Class
31 December 2020
31 December 2019
31 December 2018
0 € € €Net Asset Value L EUR Accumulating 1,058 1,060 –Net Asset Value per share L EUR Accumulating 2�1163 2�1199 –
0 € € €Net Asset Value L EUR Accumulating Hedged 1,133 1,064 –Net Asset Value per share L EUR Accumulating Hedged 2�2669 2�1273 –
0 € € €Net Asset Value F2 EUR Distributing Hedged 493,576 1,058 –Net Asset Value per share F2 EUR Distributing Hedged 2�2521 2�1167 –
0 £ £ £Net Asset Value L GBP Accumulating Hedged 5,818,403 – –Net Asset Value per share L GBP Accumulating Hedged 1�1939 – –
0 $ $ $Net Asset Value B USD Accumulating 1,270 – –Net Asset Value per share B USD Accumulating 2�5404 – –
0 $ $ $Net Asset Value P USD Accumulating 1,075 – –Net Asset Value per share P USD Accumulating 2�1498 – –
0 € € €Net Asset Value X EUR Accumulating Hedged 152,166 – –Net Asset Value per share X EUR Accumulating Hedged 2�1460 – –
Federated Hermes Asia ex-Japan Equity Fund Share Class
31 December 2020
31 December 2019
31 December 2018
0 £ £ £Net Asset Value Z GBP Accumulating – 1,844 1,670Net Asset Value per share Z GBP Accumulating – 2�8264 2�5593
0 £ £ £Net Asset Value F GBP Accumulating 238,939,147 426,455,065 511,089,000Net Asset Value per share F GBP Accumulating 2�8464 2�6606 2�4281
0 € € €Net Asset Value R EUR Accumulating 7,328,691 18,455,274 9,203,042Net Asset Value per share R EUR Accumulating 4�8377 4�8205 4�2005
0 £ £ £Net Asset Value T GBP Accumulating 8,325,103 4,453,644 1,023,890Net Asset Value per share T GBP Accumulating 2�6416 2�4507 2�2198
0 € € €Net Asset Value F EUR Accumulating 452,674,755 591,637,556 546,651,513Net Asset Value per share F EUR Accumulating 4�6103 4�5593 3�9435
0 € € €Net Asset Value F2 EUR Distributing 30,703,523 43,206,175 60,607,010Net Asset Value per share F2 EUR Distributing 4�1766 4�2276 3�7402
0 £ £ £Net Asset Value F2 GBP Distributing 423,691,813 576,896,590 524,313,576Net Asset Value per share F2 GBP Distributing 2�2067 2�1113 1�9708
0 $ $ $Net Asset Value F USD Accumulating 629,187,293 1,003,177,742 1,013,434,063Net Asset Value per share F USD Accumulating 3�8712 3�5022 3�0894
15. Comparative Net Asset Values (continued)

390
Federated Hermes Investment Funds Public Limited CompanyNotes to the Financial Statements for the financial year ended 31 December 2020 (continued)
Federated Hermes Asia ex-Japan Equity Fund (continued) Share Class
31 December 2020
31 December 2019
31 December 2018
0 $ $ $Net Asset Value R USD Accumulating 41,396,570 55,110,640 60,284,567Net Asset Value per share R USD Accumulating 3�6668 3�3423 2�9706
0 € € €Net Asset Value F EUR Accumulating Hedged 15,840,972 21,434,144 22,219,530Net Asset Value per share F EUR Accumulating Hedged 3�3307 3�0688 2�7882
0 £ £ £Net Asset Value F2 GBP Distributing Hedged 17,545,924 19,507,421 17,918,823Net Asset Value per share F2 GBP Distributing Hedged 1�5801 1�4953 1�3752
0 € € €Net Asset Value A USD Accumulating 1,051 – –Net Asset Value per share A USD Accumulating 2�1021 – –
0 CHF CHF CHFNet Asset Value R CHF Accumulating Hedged 4,575,569 7,389,779 7,770,269Net Asset Value per share R CHF Accumulating Hedged 2�9517 2�7462 2�5213
0 € € €Net Asset Value R EUR Accumulating Hedged 6,239,036 6,962,575 8,087,927Net Asset Value per share R EUR Accumulating Hedged 3�0594 2�8407 2�5993
0 £ £ £Net Asset Value F GBP Accumulating Hedged 5,404,673 13,920,009 9,789,730Net Asset Value per share F GBP Accumulating Hedged 1�6939 1�5675 1�4080
0 $ $ $Net Asset Value F2 USD Distributing 30,938,764 52,198,480 42,301,979Net Asset Value per share F2 USD Distributing 2�9518 2�7333 2�4662
0 $ $ $Net Asset Value C USD Accumulating 2,748,606 67,150,500 83,222,468Net Asset Value per share C USD Accumulating 3�3290 3�0223 2�6755
0 $ $ $Net Asset Value RC USD Accumulating 183,629 744,911 678,492Net Asset Value per share RC USD Accumulating 3�1127 2�8574 2�5575
0 € € €Net Asset Value B USD Accumulating 1,050 – –Net Asset Value per share B USD Accumulating 2�1002 – –
0 € € €Net Asset Value C EUR Accumulating 117,451,995 121,035,905 118,559,804Net Asset Value per share C EUR Accumulating 2�9819 2�9593 2�5685
0 € € €Net Asset Value C2 EUR Distributing – 1,378 1,219Net Asset Value per share C2 EUR Distributing – 2�8046 2�4808
0 £ £ £Net Asset Value C2 GBP Distributing 597,079 2,152,403 1,755,455Net Asset Value per share C2 GBP Distributing 1�6753 1�6031 1�4961
0 $ $ $Net Asset Value C2 USD Distributing – 1,366 1,233Net Asset Value per share C2 USD Distributing – 2�7588 2�4898
0 £ £ £Net Asset Value C GBP Accumulating 27,856,100 40,400,335 69,891,487Net Asset Value per share C GBP Accumulating 1�7019 1�5965 1�4621
15. Comparative Net Asset Values (continued)

391
Federated Hermes Investment Funds Public Limited CompanyNotes to the Financial Statements for the financial year ended 31 December 2020 (continued)
Federated Hermes Asia ex-Japan Equity Fund (continued) Share Class
31 December 2020
31 December 2019
31 December 2018
0 € € €Net Asset Value RC EUR Accumulating – 1,280 1,124Net Asset Value per share RC EUR Accumulating – 2�5603 2�2472
0 S$ S$ S$Net Asset Value C SGD Accumulating – 1,339 1,200Net Asset Value per share C SGD Accumulating – 4�0165 3�6011
0 € € €Net Asset Value F2 EUR Distributing Hedged 887,928 1,807,322 1,078,319Net Asset Value per share F2 EUR Distributing Hedged 2�3907 2�2534 2�0946
0 CHF CHF CHFNet Asset Value F CHF Accumulating Hedged 1,800,128 2,509,002 1,631,169Net Asset Value per share F CHF Accumulating Hedged 1�8295 1�6895 1�5383
0 CHF CHF CHFNet Asset Value F CHF Accumulating 273,635 220,504 130,462Net Asset Value per share F CHF Accumulating 1�8881 1�8748 1�6829
Federated Hermes Global Equity ESG Fund Share Class
31 December 2020
31 December 2019
31 December 2018
0 $ $ $Net Asset Value Z USD Accumulating – 1,225 970Net Asset Value per share Z USD Accumulating – 3�0171 2�3902
0 £ £ £Net Asset Value F GBP Accumulating 60,854,275 35,549,600 15,946,437Net Asset Value per share F GBP Accumulating 2�1884 1�8953 1�5626
0 $ $ $Net Asset Value F USD Accumulating 41,421,456 32,962,577 14,550,209Net Asset Value per share F USD Accumulating 3�5240 2�9539 2�3540
0 € € €Net Asset Value F EUR Accumulating 29,799,792 25,420,815 20,192,834Net Asset Value per share F EUR Accumulating 3�9573 3�6262 2�8334
0 € € €Net Asset Value R EUR Accumulating 3,940,610 11,756,665 164,381Net Asset Value per share R EUR Accumulating 3�8157 3�5152 2�7617
0 £ £ £Net Asset Value T GBP Accumulating 1,816,733 924,969 897Net Asset Value per share T GBP Accumulating 1�8812 1�6203 1�3286
0 NOK NOK NOKNet Asset Value F NOK Accumulating 18,054 15,603 12,285Net Asset Value per share F NOK Accumulating 36�1075 31�2067 24�5697
0 NOK NOK NOKNet Asset Value R NOK Accumulating 4,156,176,727 3,621,806,607 715,124,298Net Asset Value per share R NOK Accumulating 35�1976 30�5946 24�2163
0 € € €Net Asset Value F EUR Accumulating Hedged 3,530,179 687,346 6,473Net Asset Value per share F EUR Accumulating Hedged 2�7919 2�3925 1�9614
0 € € €Net Asset Value R EUR Accumulating Hedged 523,536 71,968 929Net Asset Value per share R EUR Accumulating Hedged 2�6160 2�2532 1�8580
15. Comparative Net Asset Values (continued)

392
Federated Hermes Investment Funds Public Limited CompanyNotes to the Financial Statements for the financial year ended 31 December 2020 (continued)
Federated Hermes Global Equity ESG Fund (continued) Share Class
31 December 2020
31 December 2019
31 December 2018
0 CHF CHF CHFNet Asset Value F CHF Accumulating Hedged 525,820 995,777 516,460Net Asset Value per share F CHF Accumulating Hedged 2�4664 2�1173 1�7421
0 CHF CHF CHFNet Asset Value R CHF Accumulating Hedged 136,221 71,877 43,896Net Asset Value per share R CHF Accumulating Hedged 2�4247 2�0915 1�7305
0 $ $ $Net Asset Value R USD Accumulating 812,791 324,050 651,648Net Asset Value per share R USD Accumulating 2�6631 2�2446 1�7986
0 CHF CHF CHFNet Asset Value F2 CHF Distributing Hedged 1,188 139,089 57,318Net Asset Value per share F2 CHF Distributing Hedged 2�3751 2�0596 1�7110
0 CHF CHF CHF
Net Asset ValueF CHF Accumulating Portfolio Hedged 225,931,158 111,388,414 70,103,556
Net Asset Value per shareF CHF Accumulating Portfolio Hedged 2�4028 2�0987 1�7105
0 € € €
Net Asset ValueF EUR Accumulating Portfolio Hedged 232,478,847 98,460,817 19,514,686
Net Asset Value per shareF EUR Accumulating Portfolio Hedged 2�4256 2�1153 1�7193
0 $ $ $
Net Asset ValueF USD Accumulating Portfolio Hedged 322,432,081 158,878,210 51,776,165
Net Asset Value per shareF USD Accumulating Portfolio Hedged 2�6219 2�2388 1�7675
0 CHF CHF CHF
Net Asset ValueF2 CHF Distributing Portfolio Hedged 8,035,392 6,018,538 7,087,927
Net Asset Value per shareF2 CHF Distributing Portfolio Hedged 2�3484 2�0636 1�6982
0 € € €
Net Asset ValueF2 EUR Distributing Portfolio Hedged – 1,040 853
Net Asset Value per shareF2 EUR Distributing Portfolio Hedged – 2�0798 1�7055
0 $ $ $
Net Asset ValueF2 USD Distributing Portfolio Hedged 421,677 245,213 880
Net Asset Value per shareF2 USD Distributing Portfolio Hedged 2�5665 2�2071 1�7595
0 £ £ £
Net Asset ValueF GBP Accumulating Portfolio Hedged 45,549,633 10,824,323 2,538,926
Net Asset Value per shareF GBP Accumulating Portfolio Hedged 1�2802 1�1232 0�9008
0 CHF CHF CHFNet Asset Value F2 CHF Distributing 4,498,680 4,277,773 –Net Asset Value per share F2 CHF Distributing 2�2376 2�0739 –
15. Comparative Net Asset Values (continued)

393
Federated Hermes Investment Funds Public Limited CompanyNotes to the Financial Statements for the financial year ended 31 December 2020 (continued)
Federated Hermes Global Equity ESG Fund (continued) Share Class
31 December 2020
31 December 2019
31 December 2018
0 NOK NOK NOKNet Asset Value D NOK Accumulating 108,521,590 92,674,453 –Net Asset Value per share D NOK Accumulating 24�4513 21�1372 –
0 $ $ $Net Asset Value A2 USD Distributing 1,274 1,074 –Net Asset Value per share A2 USD Distributing 2�5472 2�1471 –
0 $ $ $Net Asset Value B2 USD Distributing 1,268 1,072 –Net Asset Value per share B2 USD Distributing 2�5360 2�1441 –
0 CHF CHF CHFNet Asset Value J CHF Accumulating Hedged 358,322 – –Net Asset Value per share J CHF Accumulating Hedged 2�2754 – –
0 CHF CHF CHF
Net Asset ValueJ CHF Accumulating Portfolio Hedged 1,124 – –
Net Asset Value per shareJ CHF Accumulating Portfolio Hedged 2�2481 – –
0 € € €Net Asset Value J EUR Accumulating 281,099 – –Net Asset Value per share J EUR Accumulating 2�1864 – –
0 € € €Net Asset Value J EUR Accumulating Hedged 1,137 – –Net Asset Value per share J EUR Accumulating Hedged 2�2747 – –
0 € € €
Net Asset ValueJ EUR Accumulating Portfolio Hedged 1,125 – –
Net Asset Value per shareJ EUR Accumulating Portfolio Hedged 2�2493 – –
0 £ £ £Net Asset Value J GBP Accumulating 1,019,924 – –Net Asset Value per share J GBP Accumulating 1�0745 – –
0 £ £ £
Net Asset ValueJ GBP Accumulating Portfolio Hedged 348,304 – –
Net Asset Value per shareJ GBP Accumulating Portfolio Hedged 1�1226 – –
0 $ $ $Net Asset Value J USD Accumulating 215,051 – –Net Asset Value per share J USD Accumulating 2�2850 – –
0 $ $ $
Net Asset ValueJ USD Accumulating Portfolio Hedged 1,128 – –
Net Asset Value per shareJ USD Accumulating Portfolio Hedged 2�2566 – –
0 CHF CHF CHFNet Asset Value J2 CHF Distributing 1,096 – –Net Asset Value per share J2 CHF Distributing 2�1925 – –
15. Comparative Net Asset Values (continued)

394
Federated Hermes Investment Funds Public Limited CompanyNotes to the Financial Statements for the financial year ended 31 December 2020 (continued)
Federated Hermes Global Equity ESG Fund (continued) Share Class
31 December 2020
31 December 2019
31 December 2018
0 CHF CHF CHFNet Asset Value J2 CHF Distributing Hedged 58,170 – –Net Asset Value per share J2 CHF Distributing Hedged 2�2748 – –
0 CHF CHF CHF
Net Asset ValueJ2 CHF Distributing Portfolio Hedged 1,124 – –
Net Asset Value per shareJ2 CHF Distributing Portfolio Hedged 2�2481 – –
0 € € €
Net Asset ValueJ2 EUR Distributing Portfolio Hedged 1,125 – –
Net Asset Value per shareJ2 EUR Distributing Portfolio Hedged 2�2493 – –
0 $ $ $
Net Asset ValueJ2 USD Distributing Portfolio Hedged 1,127 – –
Net Asset Value per shareJ2 USD Distributing Portfolio Hedged 2�2541 – –
Federated Hermes Multi-Strategy Credit Fund Share Class
31 December 2020
31 December 2019
31 December 2018
0 $ $ $Net Asset Value Z USD Accumulating – 1,151 160,050,065Net Asset Value per share Z USD Accumulating – 2�6869 2�3498
0 € € €Net Asset Value F EUR Accumulating 352,128 652,293 1,385Net Asset Value per share F EUR Accumulating 3�0790 3�2049 2�7699
0 £ £ £Net Asset Value F GBP Accumulating Hedged 149,279,204 207,072,061 195,491,213Net Asset Value per share F GBP Accumulating Hedged 1�2687 1�2302 1�1025
0 $ $ $Net Asset Value F USD Accumulating 9,296,561 17,248,088 21,146,326Net Asset Value per share F USD Accumulating 2�7051 2�5832 2�2741
0 £ £ £Net Asset Value F2 GBP Distributing Hedged 148,648,434 253,191,451 245,878,295Net Asset Value per share F2 GBP Distributing Hedged 1�0645 1�0479 0�9732
0 € € €Net Asset Value F EUR Accumulating Hedged 45,626,192 131,892,289 142,537,124Net Asset Value per share F EUR Accumulating Hedged 2�4160 2�3483 2�1294
0 € € €Net Asset Value R EUR Accumulating 30,572 117,026 83,541Net Asset Value per share R EUR Accumulating 2�8371 2�9724 2�5863
0 € € €Net Asset Value R EUR Accumulating Hedged 364,530 484,602 456,342Net Asset Value per share R EUR Accumulating Hedged 2�2677 2�2203 2�0260
0 £ £ £Net Asset Value F2 GBP Distributing 1,045,412 1,401,670 1,642,992Net Asset Value per share F2 GBP Distributing 1�3799 1�3813 1�3092
15. Comparative Net Asset Values (continued)

395
Federated Hermes Investment Funds Public Limited CompanyNotes to the Financial Statements for the financial year ended 31 December 2020 (continued)
Federated Hermes Multi-Strategy Credit Fund (continued) Share Class
31 December 2020
31 December 2019
31 December 2018
0 $ $ $Net Asset Value F2 USD Distributing 6,211,002 6,209,788 4,738,523Net Asset Value per share F2 USD Distributing 2�1831 2�1178 1�9299
0 £ £ £Net Asset Value F GBP Accumulating 701,719 856,271 552,609Net Asset Value per share F GBP Accumulating 1�4485 1�4274 1�3071
0 £ £ £Net Asset Value T GBP Accumulating Hedged 565,146 255,965 981Net Asset Value per share T GBP Accumulating Hedged 1�2689 1�2226 1�0885
0 $ $ $Net Asset Value R USD Accumulating 165,672 400,486 49,323Net Asset Value per share R USD Accumulating 2�5535 2�4542 2�1746
0 € € €Net Asset Value F2 EUR Distributing 876,058 824,549 714,158Net Asset Value per share F2 EUR Distributing 2�0643 2�1829 1�9532
0 € € €Net Asset Value R2 EUR Distributing 128,862 352,059 7,072Net Asset Value per share R2 EUR Distributing 2�0562 2�1760 1�9469
0 € € €Net Asset Value F2 EUR Distributing Hedged 25,507,381 22,077,185 20,549,714Net Asset Value per share F2 EUR Distributing Hedged 2�1087 2�0836 1�9572
0 € € €Net Asset Value R2 EUR Distributing Hedged – 1,038 974Net Asset Value per share R2 EUR Distributing Hedged – 2�0761 1�9484
0 £ £ £Net Asset Value L GBP Accumulating – 1,096 1,002Net Asset Value per share L GBP Accumulating – 1�0963 1�0023
0 £ £ £Net Asset Value L GBP Accumulating Hedged – 1,084 970Net Asset Value per share L GBP Accumulating Hedged – 1�0843 0�9705
0 £ £ £Net Asset Value L2 GBP Distributing 3,605,038 4,516,517 7,019,055Net Asset Value per share L2 GBP Distributing 1�0223 1�0234 0�9700
0 £ £ £Net Asset Value L2 GBP Distributing Hedged 38,720,034 91,111,508 74,866,527Net Asset Value per share L2 GBP Distributing Hedged 1�0296 1�0137 0�9411
0 CHF CHF CHFNet Asset Value R CHF Accumulating Hedged 1,049 57,680 942Net Asset Value per share R CHF Accumulating Hedged 2�0989 2�0600 1�8849
0 S$ S$ S$Net Asset Value R2 SGD Distributing Hedged – 1,040 951Net Asset Value per share R2 SGD Distributing Hedged – 3�1190 2�8523
0 CHF CHF CHFNet Asset Value F CHF Accumulating Hedged 404,368 18,023,173 14,611,715Net Asset Value per share F CHF Accumulating Hedged 2�1280 2�0753 1�8886
0 € € €Net Asset Value Z2 EUR Distributing Hedged 30,874,186 30,510,507 28,657,097Net Asset Value per share Z2 EUR Distributing Hedged 2�0608 2�0365 1�9128
15. Comparative Net Asset Values (continued)

396
Federated Hermes Investment Funds Public Limited CompanyNotes to the Financial Statements for the financial year ended 31 December 2020 (continued)
Federated Hermes Multi-Strategy Credit Fund (continued) Share Class
31 December 2020
31 December 2019
31 December 2018
0 $ $ $Net Asset Value A2 USD Distributing 1,066 1,024 –Net Asset Value per share A2 USD Distributing 2�1319 2�0485 –
0 $ $ $Net Asset Value B2 USD Distributing 1,064 1,023 –Net Asset Value per share B2 USD Distributing 2�1270 2�0466 –
0 $ $ $Net Asset Value L2 USD Distributing 12,557,202 – –Net Asset Value per share L2 USD Distributing 2�1027 – –
0 NOK NOK NOKNet Asset Value F NOK Accumulating Hedged 6,133,999 – –Net Asset Value per share F NOK Accumulating Hedged 25�5062 – –
0 $ $ $Net Asset Value B2 USD Accumulating 1,048 – –Net Asset Value per share B2 USD Accumulating 2�0950 – –
Federated Hermes Global Small Cap Equity Fund Share Class
31 December 2020
31 December 2019
31 December 2018
0 € € €Net Asset Value F EUR Accumulating 1,181 58,668 86,060Net Asset Value per share F EUR Accumulating 2�3620 2�8618 2�2541
0 £ £ £Net Asset Value F GBP Accumulating 157,780 188,378 194,346Net Asset Value per share F GBP Accumulating 1�8243 1�6809 1�3970
0 $ $ $Net Asset Value F USD Accumulating 107,821 96,151 96,518Net Asset Value per share F USD Accumulating 3�1644 2�8219 2�2669
0 $ $ $Net Asset Value Z USD Accumulating – 1,461 1,165Net Asset Value per share Z USD Accumulating – 2�9214 2�3303
0 £ £ £Net Asset Value T GBP Accumulating 1,371,669 538,059 867Net Asset Value per share T GBP Accumulating 1�8705 1�7106 1�4114
0 £ £ £Net Asset Value F2 GBP Distributing 24,838,039 22,803,357 15,719,352Net Asset Value per share F2 GBP Distributing 1�8721 1�7301 1�4479
0 $ $ $Net Asset Value X USD Accumulating – 1,243 996Net Asset Value per share X USD Accumulating – 2�4863 1�9917
0 € € €Net Asset Value X EUR Accumulating 77,910,149 37,941,223 30,133,619Net Asset Value per share X EUR Accumulating 2�3361 2�2705 1�7830
0 $ $ $Net Asset Value R USD Accumulating – 1,030 8,015Net Asset Value per share R USD Accumulating – 2�0528 1�6617
0 $ $ $Net Asset Value A2 USD Distributing 1,611 – –Net Asset Value per share A2 USD Distributing 3�2219 – –
15. Comparative Net Asset Values (continued)

397
Federated Hermes Investment Funds Public Limited CompanyNotes to the Financial Statements for the financial year ended 31 December 2020 (continued)
Federated Hermes Global Small Cap Equity Fund (continued) Share Class
31 December 2020
31 December 2019
31 December 2018
0 $ $ $Net Asset Value B2 USD Distributing 1,602 – –Net Asset Value per share B2 USD Distributing 3�2043 – –
Federated Hermes Absolute Return Credit Fund Share Class
31 December 2020
31 December 2019
31 December 2018
0 CHF CHF CHFNet Asset Value F CHF Accumulating Hedged – 1,025 969Net Asset Value per share F CHF Accumulating Hedged – 2�0499 1�9384
0 € € €Net Asset Value F EUR Accumulating – 398,198 357,670Net Asset Value per share F EUR Accumulating – 2�2819 2�0497
0 € € €Net Asset Value F EUR Accumulating Hedged 1,813,162 290,183 10,204,962Net Asset Value per share F EUR Accumulating Hedged 2�1218 2�0942 1�9730
0 £ £ £Net Asset Value F GBP Accumulating 190,283 573,345 314,424Net Asset Value per share F GBP Accumulating 1�3279 1�3287 1�2642
0 £ £ £Net Asset Value F GBP Accumulating Hedged 12,101,032 37,267,874 65,162,192Net Asset Value per share F GBP Accumulating Hedged 1�1150 1�0963 1�0208
0 $ $ $Net Asset Value F USD Accumulating 569,092 4,936,126 832,465Net Asset Value per share F USD Accumulating 2�3723 2�3007 2�1045
0 € € €Net Asset Value F2 EUR Distributing Hedged – 961 932Net Asset Value per share F2 EUR Distributing Hedged – 1�9219 1�8633
0 $ $ $Net Asset Value F2 USD Distributing – 1,056 994Net Asset Value per share F2 USD Distributing – 2�1126 1�9883
0 € € €Net Asset Value R EUR Accumulating Hedged – 1,020 965Net Asset Value per share R EUR Accumulating Hedged – 2�0401 1�9309
0 $ $ $Net Asset Value Z USD Accumulating – 1,187 38,736,069Net Asset Value per share Z USD Accumulating – 2�3734 2�1592
0 £ £ £Net Asset Value F2 GBP Distributing 10,326 3,504,276 2,060,296Net Asset Value per share F2 GBP Distributing 1�2109 1�2285 1�2020
0 £ £ £Net Asset Value F2 GBP Distributing Hedged 6,910,228 18,328,367 22,036,432Net Asset Value per share F2 GBP Distributing Hedged 1�0151 1�0101 0�9682
0 £ £ £Net Asset Value T GBP Accumulating 1,109 1,104 1,045Net Asset Value per share T GBP Accumulating 1�1393 1�1347 1�0740
0 € € €Net Asset Value M EUR Accumulating Hedged 1,035 39,193,533 –Net Asset Value per share M EUR Accumulating Hedged 2�0693 2�0376 –
15. Comparative Net Asset Values (continued)

398
Federated Hermes Investment Funds Public Limited CompanyNotes to the Financial Statements for the financial year ended 31 December 2020 (continued)
Federated Hermes Absolute Return Credit Fund (continued) Share Class
31 December 2020
31 December 2019
31 December 2018
0 £ £ £Net Asset Value M GBP Accumulating Hedged 215,449,475 547,185 –Net Asset Value per share M GBP Accumulating Hedged 1�0293 1�0093 –
0 $ $ $Net Asset Value M USD Accumulating 1,954,896 1,011 –Net Asset Value per share M USD Accumulating 2�0894 2�0227 –
0 $ $ $Net Asset Value A2 USD Distributing 1,123 – –Net Asset Value per share A2 USD Distributing 2�2470 – –
0 $ $ $Net Asset Value B2 USD Distributing 1,119 – –Net Asset Value per share B2 USD Distributing 2�2383 – –
0 $ $ $Net Asset Value B USD Accumulating 1,023 – –Net Asset Value per share B USD Accumulating 2�0456 – –
Federated Hermes SDG Engagement Equity Fund Share Class
31 December 2020
31 December 2019
31 December 2018
0 $ $ $Net Asset Value A2 USD Distributing 1,140 1,064 –Net Asset Value per share A2 USD Distributing 2�2800 2�1280 –
0 $ $ $Net Asset Value B USD Accumulating 1,134 1,062 –Net Asset Value per share B USD Accumulating 2�2682 2�1249 –
0 € € €Net Asset Value F EUR Accumulating 17,056,299 43,933 27,571Net Asset Value per share F EUR Accumulating 2�3223 2�3608 1�8248
0 £ £ £Net Asset Value F GBP Accumulating 379,304 216,311 922Net Asset Value per share F GBP Accumulating 1�1772 1�1311 0�9224
0 $ $ $Net Asset Value F USD Accumulating 175,166 1,055,448 872Net Asset Value per share F USD Accumulating 2�3817 2�2150 1�7450
0 CHF CHF CHF
Net Asset ValueW CHF Accumulating Portfolio Hedged 248,442 402,778 351,005
Net Asset Value per shareW CHF Accumulating Portfolio Hedged 2�1646 2�1147 1�7150
0 € € €
Net Asset ValueW EUR Accumulating Portfolio Hedged 852,522 1,269,182 1,144,617
Net Asset Value per shareW EUR Accumulating Portfolio Hedged 2�1834 2�1274 1�7179
0 $ $ $
Net Asset ValueW USD Accumulating Portfolio Hedged 379,773 919,323 766,037
Net Asset Value per shareW USD Accumulating Portfolio Hedged 2�3634 2�2485 1�7655
15. Comparative Net Asset Values (continued)

399
Federated Hermes Investment Funds Public Limited CompanyNotes to the Financial Statements for the financial year ended 31 December 2020 (continued)
Federated Hermes SDG Engagement Equity Fund (continued) Share Class
31 December 2020
31 December 2019
31 December 2018
0 CHF CHF CHF
Net Asset ValueW2 CHF Distributing Portfolio Hedged 22,322 53,876 43,982
Net Asset Value per shareW2 CHF Distributing Portfolio Hedged 2�1322 2�0853 1�6990
0 € € €
Net Asset ValueW2 EUR Distributing Portfolio Hedged 1,078 1,053 854
Net Asset Value per shareW2 EUR Distributing Portfolio Hedged 2�1555 2�1055 1�7086
0 $ $ $
Net Asset ValueW2 USD Distributing Portfolio Hedged 1,172 1,117 353,390
Net Asset Value per shareW2 USD Distributing Portfolio Hedged 2�3435 2�2333 1�7625
0 CHF CHF CHF
Net Asset ValueX CHF Accumulating Portfolio Hedged 329,495,312 163,866,434 125,969,107
Net Asset Value per shareX CHF Accumulating Portfolio Hedged 2�1919 2�1276 1�7170
0 € € €Net Asset Value X EUR Accumulating 2,768,457 2,500,298 1,189,097Net Asset Value per share X EUR Accumulating 2�3408 2�3739 1�8303
0 € € €
Net Asset ValueX EUR Accumulating Portfolio Hedged 319,573,804 136,183,424 38,370,355
Net Asset Value per shareX EUR Accumulating Portfolio Hedged 2�2163 2�1476 1�7259
0 £ £ £Net Asset Value X GBP Accumulating 930,387 765,221 344,779Net Asset Value per share X GBP Accumulating 1�1860 1�1368 0�9248
0 £ £ £
Net Asset ValueX GBP Accumulating Portfolio Hedged 60,422,899 14,061,902 4,771,536
Net Asset Value per shareX GBP Accumulating Portfolio Hedged 1�1214 1�0964 0�8708
0 $ $ $Net Asset Value X USD Accumulating 4,041,132 3,175,492 1,082,243Net Asset Value per share X USD Accumulating 2�3965 2�2232 1�7482
0 $ $ $
Net Asset ValueX USD Accumulating Portfolio Hedged 421,756,277 187,829,769 97,891,532
Net Asset Value per shareX USD Accumulating Portfolio Hedged 2�4032 2�2738 1�7751
0 CHF CHF CHF
Net Asset ValueX2 CHF Distributing Portfolio Hedged 11,000,362 9,223,265 12,767,112
Net Asset Value per shareX2 CHF Distributing Portfolio Hedged 2�1553 2�1033 1�7076
15. Comparative Net Asset Values (continued)

400
Federated Hermes Investment Funds Public Limited CompanyNotes to the Financial Statements for the financial year ended 31 December 2020 (continued)
Federated Hermes SDG Engagement Equity Fund (continued) Share Class
31 December 2020
31 December 2019
31 December 2018
0 € € €
Net Asset ValueX2 EUR Distributing Portfolio Hedged 610,579 606,688 126,102
Net Asset Value per shareX2 EUR Distributing Portfolio Hedged 2�1752 2�1206 1�7157
0 £ £ £
Net Asset ValueX2 GBP Distributing Portfolio Hedged 2,456,806 487,925 157,899
Net Asset Value per shareX2 GBP Distributing Portfolio Hedged 1�1040 1�0852 0�8673
0 $ $ $
Net Asset ValueX2 USD Distributing Portfolio Hedged 991,760 845,971 383,619
Net Asset Value per shareX2 USD Distributing Portfolio Hedged 2�3597 2�2443 1�7654
0 CHF CHF CHF
Net Asset ValueF CHF Accumulating Portfolio Hedged 1,147 1,116 902
Net Asset Value per shareF CHF Accumulating Portfolio Hedged 2�2934 2�2313 1�8037
0 € € €
Net Asset ValueF EUR Accumulating Portfolio Hedged 833,898 809,951 904
Net Asset Value per shareF EUR Accumulating Portfolio Hedged 2�3132 2�2467 1�8088
0 £ £ £
Net Asset ValueF GBP Accumulating Portfolio Hedged 1,175 1,150 915
Net Asset Value per shareF GBP Accumulating Portfolio Hedged 1�1746 1�1503 0�9147
0 $ $ $
Net Asset ValueF USD Accumulating Portfolio Hedged 3,637,582 7,110,766 1,848
Net Asset Value per shareF USD Accumulating Portfolio Hedged 2�5440 2�3688 1�8557
0 CHF CHF CHF
Net Asset ValueF2 CHF Distributing Portfolio Hedged 1,131 1,105 898
Net Asset Value per shareF2 CHF Distributing Portfolio Hedged 2�2619 2�2092 1�7966
0 € € €
Net Asset ValueF2 EUR Distributing Portfolio Hedged 1,142 1,113 901
Net Asset Value per shareF2 EUR Distributing Portfolio Hedged 2�2836 2�2252 1�8020
0 £ £ £
Net Asset ValueF2 GBP Distributing Portfolio Hedged 1,158 1,138 911
Net Asset Value per shareF2 GBP Distributing Portfolio Hedged 1�1578 1�1384 0�9109
15. Comparative Net Asset Values (continued)

401
Federated Hermes Investment Funds Public Limited CompanyNotes to the Financial Statements for the financial year ended 31 December 2020 (continued)
Federated Hermes SDG Engagement Equity Fund (continued) Share Class
31 December 2020
31 December 2019
31 December 2018
0 $ $ $
Net Asset ValueF2 USD Distributing Portfolio Hedged 1,234 1,174 925
Net Asset Value per shareF2 USD Distributing Portfolio Hedged 2�4684 2�3489 1�8491
0 CHF CHF CHF
Net Asset ValueR CHF Accumulating Portfolio Hedged 713,905 1,000,002 268,707
Net Asset Value per shareR CHF Accumulating Portfolio Hedged 2�2456 2�2031 1�7946
0 € € €
Net Asset ValueR EUR Accumulating Portfolio Hedged 1,913,225 1,688,836 576,856
Net Asset Value per shareR EUR Accumulating Portfolio Hedged 2�2651 2�2177 1�8006
0 $ $ $
Net Asset ValueR USD Accumulating Portfolio Hedged 1,933,712 1,693,846 1,541,446
Net Asset Value per shareR USD Accumulating Portfolio Hedged 2�4453 2�3382 1�8447
0 CHF CHF CHF
Net Asset ValueR2 CHF Distributing Portfolio Hedged 121,793 88,840 63,461
Net Asset Value per shareR2 CHF Distributing Portfolio Hedged 2�2348 2�1931 1�7917
0 € € €
Net Asset ValueR2 EUR Distributing Portfolio Hedged 107,076 104,869 67,377
Net Asset Value per shareR2 EUR Distributing Portfolio Hedged 2�2542 2�2078 1�7967
0 $ $ $
Net Asset ValueR2 USD Distributing Portfolio Hedged 195,244 19,786 15,651
Net Asset Value per shareR2 USD Distributing Portfolio Hedged 2�4345 2�3278 1�8413
0 £ £ £Net Asset Value T GBP Accumulating 1,423,824 545,616 898Net Asset Value per share T GBP Accumulating 1�1681 1�1119 0�8983
0 CHF CHF CHFNet Asset Value X2 CHF Distributing 5,437,414 4,967,694 –Net Asset Value per share X2 CHF Distributing 2�0123 2�0605 –
0 £ £ £Net Asset Value S GBP Accumulating 358,347 994 –Net Asset Value per share S GBP Accumulating 1�0357 0�9936 –
15. Comparative Net Asset Values (continued)

402
Federated Hermes Investment Funds Public Limited CompanyNotes to the Financial Statements for the financial year ended 31 December 2020 (continued)
Federated Hermes Impact Opportunities Equity Fund Share Class
31 December 2020
31 December 2019
31 December 2018
0 € € €Net Asset Value F EUR Accumulating 43,037,575 21,509,955 2,726,326Net Asset Value per share F EUR Accumulating 3�0874 2�6299 1�9845
0 £ £ £Net Asset Value F GBP Accumulating 49,332,364 29,203,748 3,208,754Net Asset Value per share F GBP Accumulating 1�5638 1�2591 1�0025
0 $ $ $Net Asset Value F USD Accumulating 19,932,427 11,346,618 234,212Net Asset Value per share F USD Accumulating 3�1926 2�4879 1�9146
0 € € €Net Asset Value X EUR Accumulating 195,804,312 138,531,892 138,580,501Net Asset Value per share X EUR Accumulating 3�1288 2�6564 1�9950
0 £ £ £Net Asset Value X GBP Accumulating 32,751,223 13,187,124 5,183,361Net Asset Value per share X GBP Accumulating 1�5846 1�2716 1�0076
0 $ $ $Net Asset Value X USD Accumulating 3,308,705 2,561,158 1,698,643Net Asset Value per share X USD Accumulating 3�2355 2�5129 1�9247
0 € € €Net Asset Value F2 EUR Distributing 216,943 1,256 952Net Asset Value per share F2 EUR Distributing 2�9424 2�5127 1�9037
0 € € €Net Asset Value R EUR Accumulating 4,840,530 1,135,139 5,598,819Net Asset Value per share R EUR Accumulating 2�8112 2�4067 1�8293
0 $ $ $Net Asset Value R USD Accumulating 12,901,427 1,941,758 895Net Asset Value per share R USD Accumulating 2�9511 2�3111 1�7904
0 £ £ £Net Asset Value T GBP Accumulating 1,211,713 455,084 926Net Asset Value per share T GBP Accumulating 1�4617 1�1711 0�9257
0 £ £ £Net Asset Value X GBP Accumulating Hedged 1,393 1,109 –Net Asset Value per share X GBP Accumulating Hedged 1�3931 1�1094 –
0 £ £ £Net Asset Value F GBP Accumulating Hedged 1,385 1,107 –Net Asset Value per share F GBP Accumulating Hedged 1�3846 1�1069 –
0 € € €Net Asset Value F EUR Accumulating Hedged 747,651 1,131 897Net Asset Value per share F EUR Accumulating Hedged 2�3720 2�2618 1�7938
0 $ $ $Net Asset Value A2 USD Distributing 1,105 – –Net Asset Value per share A2 USD Distributing 2�2106 – –
0 $ $ $Net Asset Value B2 USD Distributing 1,104 – –Net Asset Value per share B2 USD Distributing 2�2077 – –
15. Comparative Net Asset Values (continued)

403
Federated Hermes Investment Funds Public Limited CompanyNotes to the Financial Statements for the financial year ended 31 December 2020 (continued)
Federated Hermes Unconstrained Credit Fund Share Class
31 December 2020
31 December 2019
31 December 2018
0 $ $ $Net Asset Value B2 USD Distributing 1,112 1,024 –Net Asset Value per share B2 USD Distributing 2�2234 2�0482 –
0 € € €Net Asset Value F EUR Accumulating Hedged 18,541,321 2,081,434 963Net Asset Value per share F EUR Accumulating Hedged 2�3891 2�1817 1�9260
0 £ £ £Net Asset Value F GBP Accumulating Hedged 72,938,985 57,728,915 37,721,237Net Asset Value per share F GBP Accumulating Hedged 1�2219 1�1097 0�9694
0 $ $ $Net Asset Value F USD Accumulating 3,044,126 190,854 980Net Asset Value per share F USD Accumulating 2�5516 2�2857 1�9591
0 £ £ £Net Asset Value F2 GBP Distributing Hedged 17,961,824 5,800,247 1,711,385Net Asset Value per share F2 GBP Distributing Hedged 1�1141 1�0501 0�9612
0 $ $ $Net Asset Value F2 USD Distributing 909,334 558,697 45,704Net Asset Value per share F2 USD Distributing 2�3274 2�1638 1�9449
0 € € €Net Asset Value R EUR Accumulating Hedged 121,188 1,081 959Net Asset Value per share R EUR Accumulating Hedged 2�3532 2�1610 1�9189
0 £ £ £Net Asset Value X GBP Accumulating Hedged 335,444,935 266,247,307 187,586,862Net Asset Value per share X GBP Accumulating Hedged 1�2307 1�1149 0�9706
0 $ $ $Net Asset Value X USD Accumulating 268,389 2,098 1,795Net Asset Value per share X USD Accumulating 2�5683 2�2950 1�9629
0 £ £ £Net Asset Value X2 GBP Distributing Hedged 42,232,955 37,993,459 25,891,698Net Asset Value per share X2 GBP Distributing Hedged 1�1145 1�0510 0�9632
0 $ $ $Net Asset Value X2 USD Distributing 11,653,528 11,577,301 12,589,480Net Asset Value per share X2 USD Distributing 2�3306 2�1666 1�9476
0 CHF CHF CHFNet Asset Value F CHF Accumulating Hedged 35,000 1,093 969Net Asset Value per share F CHF Accumulating Hedged 2�3907 2�1869 1�9382
0 € € €Net Asset Value F2 EUR Distributing 1,768,470 1,142 1,008Net Asset Value per share F2 EUR Distributing 2�2528 2�2837 2�0154
0 € € €Net Asset Value R2 EUR Distributing Hedged 1,104 1,045 969Net Asset Value per share R2 EUR Distributing Hedged 2�2071 2�0909 1�9375
0 CHF CHF CHFNet Asset Value X CHF Accumulating Hedged – 1,099 971Net Asset Value per share X CHF Accumulating Hedged – 2�1972 1�9414
0 € € €Net Asset Value X EUR Accumulating Hedged 5,770,149 3,483,775 1,761,151Net Asset Value per share X EUR Accumulating Hedged 2�4259 2�2086 1�9452
15. Comparative Net Asset Values (continued)

404
Federated Hermes Investment Funds Public Limited CompanyNotes to the Financial Statements for the financial year ended 31 December 2020 (continued)
Federated Hermes Unconstrained Credit Fund (continued) Share Class
31 December 2020
31 December 2019
31 December 2018
0 CHF CHF CHFNet Asset Value X2 CHF Distributing Hedged 1,099 1,044 971Net Asset Value per share X2 CHF Distributing Hedged 2�1979 2�0872 1�9414
0 € € €Net Asset Value X2 EUR Distributing 102,496 1,144 1,009Net Asset Value per share X2 EUR Distributing 2�2557 2�2871 2�0180
0 € € €Net Asset Value X2 EUR Distributing Hedged 4,259,540 11,263,313 20,206,598Net Asset Value per share X2 EUR Distributing Hedged 2�2165 2�0994 1�9462
0 CHF CHF CHFNet Asset Value X2 CHF Distributing 1,039 1,058 966Net Asset Value per share X2 CHF Distributing 2�0780 2�1166 1�9315
0 £ £ £Net Asset Value T GBP Accumulating 1,670,276 765,605 993Net Asset Value per share T GBP Accumulating 1�2209 1�1212 0�9934
0 € € €Net Asset Value F2 EUR Distributing Hedged 1,108 1,050 –Net Asset Value per share F2 EUR Distributing Hedged 2�2167 2�0991 –
0 $ $ $Net Asset Value A2 USD Distributing 1,114 1,025 –Net Asset Value per share A2 USD Distributing 2�2276 2�0501 –
0 € € €Net Asset Value L3 EUR Distributing Hedged 3,542,937 – –Net Asset Value per share L3 EUR Distributing Hedged 2�1111 – –
0 £ £ £Net Asset Value L3 GBP Distributing Hedged 88,510,550 – –Net Asset Value per share L3 GBP Distributing Hedged 1�0579 – –
0 $ $ $Net Asset Value L3 USD Distributing 2,295,263 – –Net Asset Value per share L3 USD Distributing 2�1214 – –
0 $ $ $Net Asset Value B USD Accumulating 1,048 – –Net Asset Value per share B USD Accumulating 2�0956 – –
0 € € €Net Asset Value L EUR Accumulating Hedged 1,004 – –Net Asset Value per share L EUR Accumulating Hedged 2�0084 – –
0 € € €Net Asset Value R EUR Accumulating 994 – –Net Asset Value per share R EUR Accumulating 1�9884 – –
Federated Hermes Global Emerging Markets SMID Equity Fund Share Class
31 December 2020
31 December 2019
31 December 2018
0 € € €Net Asset Value F EUR Accumulating – 1,232 994Net Asset Value per share F EUR Accumulating – 2�4641 1�9872
15. Comparative Net Asset Values (continued)

405
Federated Hermes Investment Funds Public Limited CompanyNotes to the Financial Statements for the financial year ended 31 December 2020 (continued)
Federated Hermes Global Emerging Markets SMID Equity Fund (continued) Share Class
31 December 2020
31 December 2019
31 December 2018
0 £ £ £Net Asset Value F GBP Accumulating 914,260 1,005,173 1,012Net Asset Value per share F GBP Accumulating 1�3954 1�1903 1�0120
0 $ $ $Net Asset Value F USD Accumulating 2,921 1,206 991Net Asset Value per share F USD Accumulating 2�9209 2�4123 1�9829
0 € € €Net Asset Value X EUR Accumulating 184,184,531 116,808,939 28,442,151Net Asset Value per share X EUR Accumulating 2�7657 2�4822 1�9896
0 £ £ £Net Asset Value X GBP Accumulating 22,926,736 18,661,613 1,013Net Asset Value per share X GBP Accumulating 1�4120 1�1978 1�0133
0 $ $ $Net Asset Value X USD Accumulating 12,147,210 11,546,604 6,987,804Net Asset Value per share X USD Accumulating 2�9584 2�4290 1�9857
0 $ $ $Net Asset Value X2 USD Distributing 10,556,774 8,756,918 10,044,457Net Asset Value per share X2 USD Distributing 2�8897 2�4052 1�9857
0 $ $ $Net Asset Value Z2 USD Distributing 6,935,656 1,023 –Net Asset Value per share Z2 USD Distributing 2�5006 2�0462 –
0 $ $ $Net Asset Value A2 USD Distributing 1,701 – –Net Asset Value per share A2 USD Distributing 3�4022 – –
0 $ $ $Net Asset Value B2 USD Distributing 1,694 – –Net Asset Value per share B2 USD Distributing 3�3886 – –
0 £ £ £Net Asset Value T GBP Accumulating 348,844 – –Net Asset Value per share T GBP Accumulating 1�4441 – –
0 $ $ $Net Asset Value B USD Accumulating 1,244 – –Net Asset Value per share B USD Accumulating 2�4888 – –
Federated Hermes SDG Engagement High Yield Credit Fund Share Class
31 December 2020
31 December 2019
31 December 2018
0 £ £ £Net Asset Value F GBP Accumulating Hedged 1,092 1,035 –Net Asset Value per share F GBP Accumulating Hedged 1�0916 1�0347 –
0 $ $ $Net Asset Value F USD Accumulating 173,157 1,039 –Net Asset Value per share F USD Accumulating 2�2316 2�0778 –
0 € € €Net Asset Value R EUR Accumulating Hedged 1,079 1,030 –Net Asset Value per share R EUR Accumulating Hedged 2�1582 2�0607 –
15. Comparative Net Asset Values (continued)

406
Federated Hermes Investment Funds Public Limited CompanyNotes to the Financial Statements for the financial year ended 31 December 2020 (continued)
Federated Hermes SDG Engagement High Yield Credit Fund (continued) Share Class
31 December 2020
31 December 2019
31 December 2018
0 $ $ $Net Asset Value R USD Accumulating 1,107 1,037 –Net Asset Value per share R USD Accumulating 2�2144 2�0742 –
0 CHF CHF CHFNet Asset Value W CHF Accumulating Hedged 203,870 58,656 –Net Asset Value per share W CHF Accumulating Hedged 2�1545 2�0617 –
0 € € €Net Asset Value W EUR Accumulating Hedged 7,955,929 1,562,952 –Net Asset Value per share W EUR Accumulating Hedged 2�1613 2�0622 –
0 £ £ £Net Asset Value W GBP Accumulating Hedged 7,600 1,034 –Net Asset Value per share W GBP Accumulating Hedged 1�0857 1�0336 –
0 CHF CHF CHFNet Asset Value W2 CHF Distributing Hedged 696,405 1,030 –Net Asset Value per share W2 CHF Distributing Hedged 2�1027 2�0604 –
0 $ $ $Net Asset Value W USD Accumulating 3,773,112 1,135,994 –Net Asset Value per share W USD Accumulating 2�2206 2�0761 –
0 £ £ £Net Asset Value Y GBP Accumulating Hedged 18,875,231 3,925,854 –Net Asset Value per share Y GBP Accumulating Hedged 1�0934 1�0350 –
0 CHF CHF CHFNet Asset Value Y CHF Accumulating Hedged 129,243,679 74,136,190 –Net Asset Value per share Y CHF Accumulating Hedged 2�1715 2�0637 –
0 € € €Net Asset Value Y EUR Accumulating Hedged 151,446,975 68,353,490 –Net Asset Value per share Y EUR Accumulating Hedged 2�1793 2�0650 –
0 CHF CHF CHFNet Asset Value Y2 CHF Distributing Hedged 13,668,401 10,323,929 –Net Asset Value per share Y2 CHF Distributing Hedged 2�1095 2�0635 –
0 $ $ $Net Asset Value Y USD Accumulating 190,908,761 78,850,198 –Net Asset Value per share Y USD Accumulating 2�2386 2�0794 –
0 $ $ $Net Asset Value W2 USD Distributing 1,359,751 1,018 –Net Asset Value per share W2 USD Distributing 2�1334 2�0366 –
0 $ $ $Net Asset Value Y2 USD Distributing 4,159,198 41,897 –Net Asset Value per share Y2 USD Distributing 2�1407 2�0378 –
0 $ $ $Net Asset Value A2 USD Distributing 1,247 – –Net Asset Value per share A2 USD Distributing 2�4936 – –
0 $ $ $Net Asset Value B2 USD Distributing 1,243 – –Net Asset Value per share B2 USD Distributing 2�4864 – –
0 € € €Net Asset Value F EUR Accumulating Hedged 23,104,622 – –Net Asset Value per share F EUR Accumulating Hedged 2�0988 – –
15. Comparative Net Asset Values (continued)

407
Federated Hermes Investment Funds Public Limited CompanyNotes to the Financial Statements for the financial year ended 31 December 2020 (continued)
Federated Hermes SDG Engagement High Yield Credit Fund (continued) Share Class
31 December 2020
31 December 2019
31 December 2018
0 £ £ £Net Asset Value T GBP Accumulating 2,022 – –Net Asset Value per share T GBP Accumulating 1�0102 – –
0 CHF CHF CHFNet Asset Value F CHF Accumulating 1,019 – –Net Asset Value per share F CHF Accumulating 2�0385 – –
0 CHF CHF CHFNet Asset Value F CHF Accumulating Hedged 213,279 – –Net Asset Value per share F CHF Accumulating Hedged 2�0808 – –
0 $ $ $Net Asset Value B USD Accumulating 1,063 – –Net Asset Value per share B USD Accumulating 2�1265 – –
0 $ $ $Net Asset Value M USD Accumulating 27,411,136 – –Net Asset Value per share M USD Accumulating 2�1063 – –
0 € € €Net Asset Value F2 EUR Distributing Hedged 1,057 – –Net Asset Value per share F2 EUR Distributing Hedged 2�1142 – –
0 $ $ $Net Asset Value F2 USD Distributing 1,060 – –Net Asset Value per share F2 USD Distributing 2�1209 – –
0 € € €Net Asset Value M EUR Accumulating 2,046,409 – –Net Asset Value per share M EUR Accumulating 2�1006 – –
0 £ £ £Net Asset Value M2 GBP Distributing Hedged 1,052 – –Net Asset Value per share M2 GBP Distributing Hedged 1�0518 – –
Federated Hermes US High Yield Credit Fund* Share Class
31 December 2020
0 £Net Asset Value F GBP Accumulating 985Net Asset Value per share F GBP Accumulating 0�9846
0 $Net Asset Value F USD Accumulating 1,057Net Asset Value per share F USD Accumulating 2�1141
0 $Net Asset Value F2 USD Distributing 1,055Net Asset Value per share F2 USD Distributing 2�1097
0 $Net Asset Value R USD Accumulating 1,052Net Asset Value per share R USD Accumulating 2�1030
0 €Net Asset Value X2 EUR Distributing 991Net Asset Value per share X2 EUR Distributing 1�9828
0 £Net Asset Value X2 GBP Distributing Hedged 1,053Net Asset Value per share X2 GBP Distributing Hedged 1�0527
15. Comparative Net Asset Values (continued)

408
Federated Hermes Investment Funds Public Limited CompanyNotes to the Financial Statements for the financial year ended 31 December 2020 (continued)
Federated Hermes US High Yield Credit Fund (continued)Share Class
31 December 2020
0 $Net Asset Value Z USD Accumulating 7,304,326Net Asset Value per share Z USD Accumulating 2�1172
0 $Net Asset Value A2 USD Distributing 1,022Net Asset Value per share A2 USD Distributing 2�0435
0 $Net Asset Value B2 USD Distributing 1,021Net Asset Value per share B2 USD Distributing 2�0423
Federated Hermes US High Yield Credit Fund launched on 21 July 2020�
16. Efficient Portfolio Management
The Company may, on behalf of each sub-fund, employ (subject to the conditions and within the limits laid down by the Central Bank) techniques and instruments relating to transferable securities and money market instruments, provided that such techniques and instruments are used for efficient portfolio management purposes� Such techniques and instruments may also, on behalf of each sub-fund, include foreign exchange transactions which alter the currency characteristics of transferable securities held by the Company� The Company may also, on behalf of each sub-fund, employ (subject to the conditions and within the limits laid down by the Central Bank) techniques and instruments intended to provide protection against exchange risks in the context of the management of its assets and liabilities�
The actual techniques employed by the relevant sub-funds are as follows:
• Northern Trust hedging across all portfolios • Currency Hedging within the credit portfolios • Rates hedging within the credit portfolios • Market exposure management within the credit portfolios (Options on Index and Index positions)
Realised gains and losses on financial instruments used for efficient portfolio management are included in the Income Statement�
17. Significant Events During The Year
On 1 January 2020 the Federated Hermes Europe ex-UK Equity Fund benchmark changed from FTSE World Europe Ex UK Index to MSCI Europe Ex UK Index and the Federated Hermes European Alpha Equity Fund benchmark changed from FTSE All World Europe Index to MSCI Europe Index�
On 20 January 2020 the Central Bank of Ireland withdrew approval for the Hermes US All Cap Equity Fund and Hermes Multi-Asset Inflation Fund following an application by the Company.
On 23 June 2016, the United Kingdom held a referendum and voted to leave the European Union� At 11pm (GMT) on 31 January 2020, the United Kingdom formally left the European Union and entered into a transition period that lasted until 11pm (GMT) on 31 December 2020, creating a period of uncertainty� Leaving the European Union is likely to result in significant changes to law and regulation in the United Kingdom. It is not currently possible to assess the effect of these changes on the Company�
On 3 February 2020 Federated Investors, Inc� and Hermes Investment Management combined their names to become Federated Hermes, Inc�
On 17 February 2020 the Prospectus and Supplements of the Company were updated� A key update is the introduction of new monthly, quarterly and annual distribution options with clarification regarding the method, calculation and frequency for payment of dividends�
15. Comparative Net Asset Values (continued)

409
Federated Hermes Investment Funds Public Limited CompanyNotes to the Financial Statements for the financial year ended 31 December 2020 (continued)
On 27 February 2020 the board of NMC Health PLC announced that the FCA has agreed to its request under Chapter 5 of the Listing Rules for the temporary suspension of its shares to ensure the smooth operation of the market� A temporary suspension was issued by the FCA and therefore the Hermes Liquidity & Valuation Committee has endorsed valuing this security at nil� There is a material impact to the net asset value of the sub-funds holding this security� NMC Health is held by the Federated Hermes Global Emerging Markets Equity Fund and Federated Hermes Global Emerging Markets SMID Equity Fund and was 1�19% and 1�43% of the respective sub - fund’s net asset value on the 27 February 2020�
On 6 May 2020 there was an addendum made to the Prospectus to include South Korea (The Korea Stock Exchange (Stock Market) Korean Exchange (KOSDAQ)) and Vietnam (Ho Chi Minh Stock Exchange (HSX or HOSE) and Hanoi Stock Exchange (HNX)) under the Appendix 1 headed “Stock Exchanges and Regulated Markets”�
On 26 June 2020 Hermes Investment Funds plc rebranded and changed the company name to Federated Hermes Investment Funds plc as well as individual Sub-Fund names also�
The company prospectus was updated to include the new investment policies that explain how ESG is integrated into the investment process and updates to the share class descriptions were made to make it clearer how they are differentiated�
On 2 July 2020 Gregory Dulski was appointed as a director of Federated Hermes Investment Funds Public Limited Company�
The Federated Hermes US High Yield Credit Fund launched on 21 July 2020� The Investment Manager for this sub-fund is Federated Investment Counseling�
On 16 December 2020 Denise Kinsella resigned as a director of Federated Hermes Investment Funds Public Limited Company�
On 31 December 2020 Paul McNaughton resigned as a director and Chairman of Federated Hermes Investment Funds Public Limited Company�
On 31 December 2020 Ian Kennedy resigned as a director of Federated Hermes Investment Funds Public Limited Company�
Since 31 December 2019 some of the sub – funds have experienced significant net outflows as a result of the market disruption� Please note that all sub-funds listed are expected to remain open and are regularly reviewed by the Management Company to assess the risk of their ability to continue to operate. If any risk is identified, a recommendation will be made to the Federated Hermes Investment Funds Plc Board to change a sub – fund or close it entirely� Currently, no recommendations have been made to change or close any of these funds�
The below table shows sub-funds that have had net outflows exceeding 10% of their net asset value between 1 January 2020 and 31 December 2020�
Net Outflow in Fund’s base
currency
NAV – 31 December 2019
Net Outflow as
% of NAVFederated Hermes European Alpha Fund €57,871,503 153,505,228 (37�70%)Federated Hermes Europe Ex-UK Equity Fund €182,593,559 215,035,625 (84�91%)Federated Hermes US SMID Equity Fund $204,795,490 1,069,591,549 (19�15%)Federated Hermes Asia Ex-Japan Equity Fund $1,115,105,829 3,523,724,813 (31�65%)Federated Hermes Multi Strategy Credit Fund $363,676,294 992,092,893 (36�66%)
18. Subsequent Events
On 1 January 2021 Ronan Walsh was appointed as a director and Chairman of Federated Hermes Investment Funds Public Limited Company�
On 1 January 2021 Peter Germain and Michael Boyce were appointed as directors of Federated Hermes Investment Funds Public Limited Company�
17. Significant Events During The Year (continued)

410
Federated Hermes Investment Funds Public Limited CompanyNotes to the Financial Statements for the financial year ended 31 December 2020 (continued)
On 20 January 2021 there was a large redemption from the Federated Hermes Europe ex-UK Equity Fund of approximately 72% of the fund’s value� On 19 April 2021, the Fund’s NAV was $7,975,079�
On 22 January 2021 Federated Hermes Sustainable Global Equity Fund was launched�
On 1 March 2021, the Annual Management Charge of the Federated Hermes SDG Engagement High Yield Credit Fund W class was reduced from 1�05% to 0�80%�
Up to the date of approval of these Financial Statements there have been no other events affecting the Company subsequent to the year end, which would impact on the Financial Statements for the financial year ended 31 December 2020�
19. COVID-19 Statement
Hermes Fund Managers Ireland Limited (“HFMIL”) successfully transitioned to a ‘working from home’ environment in March 2020 in line with Irish Government recommendations� Since then internal policies and procedures, Government guidelines and guidance received at a Group Level have been followed to ensure continuity of operations� There is regular contact with the Central Bank of Ireland to communicate any points of concern regarding Covid-19 during this period�
HFMIL employees continue to work successfully outside the normal office location. The IT and other equipment to facilitate this transition was available immediately and employees were able to continue all processes and controls within normal timeframes and in compliance of all policies and procedures� In particular response to Covid-19 HFMIL increased communication and engagement with regard to; Outsourced Service Providers, Delegate Investment Managers, Group Functions, Branch Network and Senior Management� To date, all partners have been able to maintain their resiliency and the Company continues to monitor their provision of services� Given the travel restrictions forced by Covid-19 third party monitoring program has been performed online during this period. The Company has not identified an error or breach directly related to the change in working environments�
The impact on operations and the Company itself is continually being monitored�
20. Approval Of Financial Statements
The Financial Statements were approved by the Board of Directors on 21 April 2021�
18. Subsequent Events (continued)

411
Federated Hermes Investment Funds Public Limited CompanyUnaudited Schedule of Significant Portfolio MovementsFor the financial year ended 31 December 2020
Federated Hermes Global Emerging Markets Equity FundTotal purchases in year $2,289,151,343Major Purchases Nominal
Holdings Cost $LG Household & Health Care 95,680 109,305,073Grupo Financiero Banorte SAB de CV 29,687,645 103,816,694Tencent 1,856,200 97,736,254Epiroc 6,595,716 97,188,380Alibaba ADR 426,668 86,343,070Gree Electric Appliances 9,224,208 80,118,570Unilever Indonesia 143,043,000 78,380,075Bank Central Asia 39,323,600 75,701,456Credicorp 479,159 72,901,993Polymetal International 3,028,926 72,096,389Prosus 969,222 66,067,023Hangzhou Tigermed Consulting 5,745,199 64,241,112Bajaj Finance 1,509,966 63,556,140AIA 6,325,297 63,383,252WEG 6,053,600 63,133,132Baozun ADR 1,637,725 56,465,942Alibaba Health Information Technology 22,436,000 53,217,061Samsung Electronics 1,064,028 53,175,387KB Financial 1,478,840 52,651,822Sberbank of Russia ADR 3,912,673 49,769,442BB Seguridade Participacoes 9,643,800 48,995,651ICICI Bank 8,066,582 41,232,868China Communications Services 59,312,000 39,047,025NARI Technology 12,950,020 37,205,834Shenzhen International 20,706,000 36,060,003Wal-Mart de Mexico SAB de CV 14,299,992 35,928,727Duratex 12,184,400 34,224,306China Merchants Bank 5,468,500 33,949,246China Mengniu Dairy 6,871,000 31,787,697Accton Technology 3,925,000 30,113,862Hapvida Participacoes e Investimentos 2,239,592 29,024,350NCSoft 43,996 27,572,740Autohome ADR 310,221 26,961,046Bharat Forge 4,772,895 26,139,372SBI Life Insurance 2,466,767 25,335,163HDFC Bank 1,844,128 24,740,686
The above represents aggregate purchases of a security exceeding 1 per cent of the total value of purchases for the year� If there were fewer than 20 purchases that exceed 1 per cent during the year the largest 20 purchases are disclosed�

412
Federated Hermes Investment Funds Public Limited CompanyUnaudited Schedule of Significant Portfolio Movements For the financial year ended 31 December 2020 (continued)
Federated Hermes Global Emerging Markets Fund (continued) Total sales in year $2,111,283,889Major Sales Nominal
Holdings Proceeds $Tencent 3,718,500 209,059,152Alibaba ADR 635,491 162,408,558NCSoft 121,064 84,826,623Galaxy Entertainment 11,053,000 84,426,021Taiwan Semiconductor Manufacturing ADR 1,200,670 77,924,994Bank Rakyat Indonesia Persero 307,514,592 74,484,461Techtronic Industries 5,590,500 59,441,973Accton Technology 8,887,000 59,073,747Richter Gedeon 2,712,977 56,112,748Shoprite 9,070,903 55,481,949Foschini 5,709,477 53,436,017Power Grid of India 22,001,040 52,578,704NARI Technology 17,826,315 51,234,716Notre Dame Intermedica Participacoes 4,108,952 50,470,100BIM Birlesik Magazalar 6,412,604 50,334,521Itau Unibanco - Preferred 12,175,409 49,952,454AIA 5,334,774 49,918,042Yandex 1,053,072 49,618,957Aier Eye Hospital 7,000,228 48,401,966Delta Electronics 8,962,000 46,766,400KB Financial 1,613,717 46,716,978Samsung Electronics 1,047,887 46,568,743HCL Technologies 4,746,880 43,593,356Commercial International Bank Egypt 10,512,425 43,146,727Mail�Ru Group GDR 1,510,594 36,301,351IRB Brasil Resseguros 7,594,600 36,215,959Duratex 12,536,200 32,415,503Hero MotoCorp 854,134 29,031,172Hangzhou Tigermed Consulting 1,757,436 27,624,830Autohome ADR 315,305 26,238,158China Mengniu Dairy 6,382,000 25,096,918Prosus 230,934 21,707,038
The above represents aggregate sales of a security exceeding 1 per cent of the total value of sales for the year� If there were fewer than 20 sales that exceed 1 per cent during the year the largest 20 sales are disclosed�

413
Federated Hermes Investment Funds Public Limited CompanyUnaudited Schedule of Significant Portfolio Movements For the financial year ended 31 December 2020 (continued)
Federated Hermes Global Equity FundTotal purchases in year $16,757,818Major Purchases Nominal
Holdings Cost $Apple 2,324 453,567Microsoft 2,301 422,907NVIDIA 669 330,608Alphabet Class A 214 314,333Amazon�com 126 312,875Capital One Financial 3,548 309,008Tate & Lyle 35,455 306,239Legrand 3,377 278,019Walt Disney 2,045 277,588Aker BP 11,414 258,842FedEx 987 252,011ING Groep 27,728 241,352Volvo 12,121 240,291Atkore International 7,535 239,542Delta Air Lines 6,463 232,908Nike 1,767 224,821CVS Health 3,536 221,870Citigroup 3,953 220,571Sony Corporation 3,000 220,126Fortune Brands Home & Security 2,517 214,644ASML Holding 643 209,039Elkem 78,207 204,088JPMorgan Chase 1,820 203,488Procter & Gamble 1,567 200,733Activision Blizzard 2,549 189,790Keysight Technologies 1,504 184,167ORIX 12,700 183,992American Tower REITS 769 181,751Husqvarna Group 15,969 175,374Pulte 4,149 170,631
The above represents aggregate purchases of a security exceeding 1 per cent of the total value of purchases for the year� If there were fewer than 20 purchases that exceed 1 per cent during the year the largest 20 purchases are disclosed�

414
Federated Hermes Investment Funds Public Limited CompanyUnaudited Schedule of Significant Portfolio Movements For the financial year ended 31 December 2020 (continued)
Federated Hermes Global Equity Fund (continued)Total sales in year $5,225,439Major Sales Nominal
Holdings Proceeds $Nokia 54,347 219,391American Water Works 1,392 192,070AstraZeneca 1,613 173,633Aena 1,266 172,390Microsoft 809 164,384Micron Technology 3,312 161,665Pfizer 4,427 160,730Lonza Group 294 156,779Daifuku 1,500 156,263American Tower REITS 675 155,747Adidas 429 136,673Biogen 469 127,878Barrick Gold 5,136 127,133Zurich Insurance Group 298 115,135ASML Holding 247 102,165Travelers 787 100,647Koninklijke Ahold Delhaize 3,312 97,099Pets At Home Group 33,931 96,912HSBC 21,348 95,567Essity AB 2,984 95,233TJX 1,667 94,416Pulte 2,173 92,425Sysco 1,449 92,143Cognex 1,332 83,373Ford Motor 9,573 77,046Nestle 676 76,457Zoetis 469 73,705Gaztransport Et Technigaz 763 71,130Nippon Telegraph & Telephone 3,209 68,709Duke Energy 747 67,720Procter & Gamble 527 66,549Roche 191 65,848Amgen 300 61,785Delta Air Lines 2,066 61,024West Pharmaceutical Services 225 54,776Vonovia 934 54,064
The above represents aggregate sales of a security exceeding 1 per cent of the total value of sales for the year� If there were fewer than 20 sales that exceed 1 per cent during the year the largest 20 sales are disclosed�

415
Federated Hermes Investment Funds Public Limited CompanyUnaudited Schedule of Significant Portfolio Movements For the financial year ended 31 December 2020 (continued)
Federated Hermes European Alpha Equity Fund Total purchases in year €31,189,609Major Purchases Nominal
Holdings Cost €Schneider Electric 37,001 3,692,805Grifols 104,950 2,190,473Idorsia 88,031 2,119,863Soitec 19,771 2,035,335Experian 65,594 1,984,986Epiroc 130,393 1,940,222Relx 101,090 1,850,777Aena 12,351 1,405,353Reckitt Benckiser 13,772 1,089,502Adidas 5,065 975,323Bayer 17,771 950,431SAP 7,360 832,786Sodexo 11,755 780,086Edenred 17,356 747,976ING Groep 106,326 658,696Barratt Developments 149,221 643,201Inditex 28,326 612,986ASML Holding 2,033 524,786Lundin Petroleum 25,027 482,209Lonza Group 1,216 475,765Novo Nordisk 8,254 454,092Deutsche Boerse 3,323 444,685Wolters Kluwer 5,995 376,909Prudential 28,933 347,095Merck 3,258 322,866Siemens Gamesa Renewable Energy 23,342 316,669ConvaTec 143,895 316,630
The above represents aggregate purchases of a security exceeding 1 per cent of the total value of purchases for the year� If there were fewer than 20 purchases that exceed 1 per cent during the year the largest 20 purchases are disclosed�

416
Federated Hermes Investment Funds Public Limited CompanyUnaudited Schedule of Significant Portfolio Movements For the financial year ended 31 December 2020 (continued)
Federated Hermes European Alpha Equity Fund (continued)Total sales in year €88,101,842Major Sales Nominal
Holdings Proceeds €Lonza Group 14,050 6,396,714Siemens Gamesa Renewable Energy 236,285 5,307,594Qiagen 126,587 4,522,086ASML Holding 13,249 4,241,941Adidas 14,558 3,927,811Fidelity National Information Services 25,180 3,367,231Deutsche Boerse 22,324 3,121,052Wolters Kluwer 40,317 2,884,554Novo Nordisk 47,703 2,818,895Wirecard 45,255 2,419,756Merck 18,828 2,375,113Sika 11,418 2,358,567DS Smith 656,784 2,328,808SAP 20,883 2,299,456Relx 101,090 1,953,755Bayer 40,417 1,900,061Inditex 78,460 1,876,960Legrand 27,651 1,864,453Amadeus IT 37,785 1,825,106Edenred 43,635 1,803,017Aena 14,339 1,771,017ConvaTec 831,560 1,757,879Pandora 27,355 1,747,946Prudential 136,328 1,664,941Nokia 489,854 1,583,153Grifols 104,950 1,476,080Fresenius 41,276 1,465,618Schneider Electric 13,105 1,457,138Reckitt Benckiser 18,079 1,384,072Johnson Matthey 40,656 1,286,710Sodexo 20,015 1,247,411Swedbank 90,005 1,235,815Valeo 47,021 1,205,435Barratt Developments 200,067 1,197,504ASOS 49,193 1,178,639DNB 94,718 1,176,841ING Groep 181,870 1,173,920Lundin Petroleum 62,131 1,144,337Soitec 7,018 912,601Equinor 74,193 892,803
The above represents aggregate sales of a security exceeding 1 per cent of the total value of sales for the year� If there were fewer than 20 sales that exceed 1 per cent during the year the largest 20 sales are disclosed�

417
Federated Hermes Investment Funds Public Limited CompanyUnaudited Schedule of Significant Portfolio Movements For the financial year ended 31 December 2020 (continued)
Federated Hermes Global High Yield Credit Fund Total purchases in year €334,833,683Major Purchases Nominal
Holdings Cost €United States Treasury Bill 0�000% 24/12/2020 57,900,000 49,056,202United States Treasury Bill 0�000% 17/06/2021 34,000,000 27,754,637United States Treasury Bill 0�000% 16/07/2020 30,700,000 27,728,291United States Treasury Bill 0�000% 16/04/2020 12,700,000 11,629,669BHP Billiton Finance 22/10/2077 4,750,000 5,731,411Berry Global 1�500% 15/01/2027 3,906,000 3,696,036Smurfit Kappa 1.500% 15/09/2027 3,705,000 3,574,655CSC 3�375% 15/02/2031 4,150,000 3,390,063Crown European 2�875% 01/02/2026 3,400,000 3,380,338Ashland Services 2�000% 30/01/2028 3,421,000 3,187,750Catalent Pharma Solutions 2�375% 01/03/2028 3,195,000 3,053,055NXP 3�875% 01/09/2022 3,200,000 3,038,176Grifols 2�250% 15/11/2027 3,000,000 2,963,195MPT Operating Partnership 3�692% 05/06/2028 2,527,000 2,950,386Enbridge 5�500% 15/07/2077 3,686,000 2,921,422Gaz Capital 4�250% 06/04/2024 2,506,000 2,918,943Ball Corporation 0�875% 15/03/2024 2,876,000 2,875,040Ardagh Packaging Finance 4�750% 15/07/2027 2,700,000 2,856,848Ball 1�500% 15/03/2027 2,900,000 2,793,300Air Lease 3�625% 01/12/2027 3,550,000 2,789,774
Total sales in year €141,041,358Major Sales Nominal
Holdings Proceeds €United States Treasury Bill 0�000% 24/12/2020 57,900,000 48,359,581United States Treasury Bill 0�000% 16/07/2020 30,700,000 27,834,656United States Treasury Bill 0�000% 16/04/2020 12,700,000 11,634,864United States Treasury Bill 0�000% 18/02/2020 5,000,000 4,500,242AbbVie 4�550% 15/03/2035 3,817,000 4,052,491Hess 4�300% 01/04/2027 3,440,000 3,151,818Gaz Capital 4�250% 06/04/2024 2,506,000 2,907,595L Brands 7�500% 15/06/2029 2,837,000 2,631,427Bank of Ireland 31/12/2049 2,300,000 2,300,000NXP 3�875% 01/09/2022 2,000,000 1,791,493Virgin Media Secured Finance 15/01/2025 1,300,000 1,540,800Range Resources 4�875% 15/05/2025 1,767,000 1,362,304HCA 4�125% 15/06/2029 1,550,000 1,315,443PGH Capital 31/12/2049 984,000 1,286,873Commerzbank 31/12/2049 1,400,000 1,250,405Crown European 2�875% 01/02/2026 1,264,000 1,105,265Petrobras Global Finance 4�750% 14/01/2025 950,000 1,059,298Avis Budget Car Rental/ Avis Budget Finance 5�750% 15/07/2027 1,069,000 1,019,613VTR Finance 6�875% 15/01/2024 1,118,000 1,018,502MPLX 5�200% 01/03/2047 1,025,000 1,003,903
The above represents aggregate purchases and sales of a security exceeding 1 per cent of the total value of purchases and aggregate sales of a security exceeding 1 per cent of sales for the year� If there were fewer than 20 purchases/sales that exceed 1 per cent during the year the largest 20 purchases/sales are disclosed�

418
Federated Hermes Investment Funds Public Limited CompanyUnaudited Schedule of Significant Portfolio Movements For the financial year ended 31 December 2020 (continued)
Federated Hermes Europe ex-UK Equity Fund Total purchases in year €24,209,259Major Purchases Nominal
Holdings Cost €SAP 37,500 3,495,981Wolters Kluwer 37,183 2,595,641Grifols 114,211 2,417,209Schneider Electric 16,544 1,663,752Fresenius 33,295 1,445,379ING Groep 174,092 1,381,531Edenred 28,544 1,297,482Straumann 1,916 1,295,257Alcon 20,872 1,069,627Adyen 746 885,639Idorsia 32,406 779,908Adidas 3,430 743,604Ubisoft Entertainment 8,287 571,809Soitec 2,821 418,575Hella 8,161 343,482ASML Holding 995 328,518Duerr 11,705 306,227Amadeus IT 5,912 268,912Novo Nordisk 4,520 262,424Orsted 1,650 202,030
The above represents aggregate purchases of a security exceeding 1 per cent of the total value of purchases for the year� If there were fewer than 20 purchases that exceed 1 per cent during the year the largest 20 purchases are disclosed�

419
Federated Hermes Investment Funds Public Limited CompanyUnaudited Schedule of Significant Portfolio Movements For the financial year ended 31 December 2020 (continued)
Federated Hermes Europe ex-UK Equity Fund (continued) Total sales in year €204,724,521Major Sales Nominal
Holdings Proceeds €ASML Holding 35,982 10,280,633Novo Nordisk 181,987 10,106,720Lonza Group 21,697 8,452,928ASM International 66,630 7,203,847Sartorius - Preferred 28,671 7,155,633Umicore 163,893 6,755,975Adidas 24,598 6,655,468Sika 39,190 6,602,405Orsted 66,230 6,502,700Lundin Petroleum 255,846 6,394,961Siemens Gamesa Renewable Energy 392,616 6,228,858KION 101,684 5,991,988Merck 52,087 5,837,034Wirecard 48,424 5,770,586Gaztransport Et Technigaz 67,356 5,608,803Tomra Systems 189,770 5,498,133Qiagen 159,817 5,474,576Hella 131,315 5,350,586Euronext 65,932 5,227,088Barrick Gold 288,132 5,225,736Amadeus IT 83,671 5,159,205Deutsche Boerse 35,545 5,055,469ING Groep 585,041 4,807,743TKH 113,095 4,773,833Cerved Information Solutions 624,271 4,738,107CIE Automotive 233,147 4,579,659Valeo 160,223 4,380,133Equinor 278,421 3,924,290Fresenius 87,515 3,729,182Freenet 179,213 3,648,996Bankinter 737,841 3,605,866Duerr 122,890 3,262,225SAP 28,141 3,262,050Edenred 68,787 2,954,098Allied Irish Bank 1,030,181 2,870,269Ubisoft Entertainment 41,795 2,802,575AMG Advanced Metallurgical Group 121,981 2,582,875
The above represents aggregate sales of a security exceeding 1 per cent of the total value of sales for the year� If there were fewer than 20 sales that exceed 1 per cent during the year the largest 20 sales are disclosed�

420
Federated Hermes Investment Funds Public Limited CompanyUnaudited Schedule of Significant Portfolio Movements For the financial year ended 31 December 2020 (continued)
Federated Hermes US SMID Equity Fund Total purchases in year $395,763,383Major Purchases Nominal
Holdings Cost $PTC 313,181 26,077,534Palomar Holdings 247,639 20,189,074Teradyne 296,376 17,804,309NVR 5,197 17,018,551Power Integrations 194,253 16,817,277Cargurus 660,976 16,586,927Chart Industries 166,776 12,764,113Altair Engineering 269,721 12,085,981Silicon Laboratories 114,739 11,916,760Cubic 214,543 11,542,462Axon Enterprise 89,912 11,294,482Maximus 155,646 11,171,906PerkinElmer 107,492 10,974,104CAE 724,350 10,108,329Skechers USA 298,541 9,225,539Alleghany 12,552 7,638,209WEX 49,866 7,576,523Ingredion 82,006 7,331,395Fairfax Financial 16,589 7,251,040Wabtec 94,356 7,237,129Abiomed 41,735 7,236,317Wintrust Financial 155,331 7,023,198Reinsurance of America 61,045 6,892,516Eagle Materials 96,490 6,834,644ServiceMaster Global 185,227 6,825,743Brunswick 151,179 6,807,963Woodward 81,669 6,345,162AptarGroup 45,838 5,889,050AMN Healthcare Services 110,291 5,844,379Sterling Bancorp 410,106 5,409,076Lazard 176,911 5,309,279National Instruments 134,785 4,920,639TCF Financial 159,115 4,902,969
The above represents aggregate purchases of a security exceeding 1 per cent of the total value of purchases for the year� If there were fewer than 20 purchases that exceed 1 per cent during the year the largest 20 purchases are disclosed�

421
Federated Hermes Investment Funds Public Limited CompanyUnaudited Schedule of Significant Portfolio Movements For the financial year ended 31 December 2020 (continued)
Federated Hermes US SMID Equity Fund (continued)Total sales in year $604,791,358Major Sales Nominal
Holdings Proceeds $Teradyne 332,442 23,110,903Alliant Energy 393,377 20,054,707West Pharmaceutical Services 90,789 17,702,326SEI Investments 333,141 17,694,614MDU Resources 765,975 17,692,910Wabtec 275,607 16,832,703John Wiley & Sons 395,785 15,794,485ANSYS 58,312 15,399,764Alimentation Couche-Tard 509,699 15,350,767Fairfax Financial 45,899 14,927,196Abiomed 68,136 14,854,796Cooper Cos 45,453 14,504,145Community Bank System 238,818 14,488,575Timken 287,962 13,116,028Cubic 272,570 13,034,840Brown & Brown 305,007 12,584,767Jack Henry & Associates 76,462 12,451,692AMN Healthcare Services 200,752 12,234,461ICU Medical 58,124 11,616,854Simpson Manufacturing 149,027 11,529,151Brunswick 224,031 11,157,380CAE 724,350 11,148,943Weingarten Realty Investors REITS 443,442 10,641,146Bio-Rad Laboratories 25,499 10,628,750Ingredion 132,624 10,587,821Cognex 190,169 10,423,849RPM International 150,238 10,225,574Retail Opportunity Investments REITS 999,009 8,847,396Wintrust Financial 215,162 8,738,941Snap-on 76,214 8,726,707Silicon Laboratories 93,575 8,696,564Reinsurance of America 80,915 7,978,613PTC 111,916 7,947,440Fortune Brands Home & Security 140,068 7,927,874AO Smith 181,124 7,892,244Brooks Automation 192,487 7,439,830STERIS 47,335 7,216,683Gartner 59,980 6,973,984White Mountains Insurance 7,041 6,345,514ServiceMaster Global 202,638 6,237,859AptarGroup 57,713 6,190,500Power Integrations 72,284 6,180,783WEX 47,023 6,156,175Eagle Materials 91,991 6,102,159
The above represents aggregate sales of a security exceeding 1 per cent of the total value of sales for the year� If there were fewer than 20 sales that exceed 1 per cent during the year the largest 20 sales are disclosed�

422
Federated Hermes Investment Funds Public Limited CompanyUnaudited Schedule of Significant Portfolio Movements For the financial year ended 31 December 2020 (continued)
Federated Hermes Asia ex-Japan Equity Fund Total purchases in year $1,319,582,905Major Purchases Nominal
Holdings Cost $Samsung Electronics 2,362,588 113,466,741Yunnan Baiyao 6,022,406 79,371,854Baidu 588,950 72,289,765JD�com 1,820,700 69,607,932Alibaba 1,895,864 60,431,411Naspers 317,707 60,395,759Kumho Petrochemical 572,699 51,680,796Jd�Com 901,996 49,847,608China Overseas Land & Investment 16,272,000 49,353,567Honda Motor 1,848,450 48,977,991Alibaba 223,535 47,992,840Nexon 2,584,300 46,770,444Adani Ports & Special Economic Zone 9,679,860 46,331,486Asustek Computer 5,132,000 40,952,502Sinopharm 13,540,000 38,462,549China Mobile 5,839,000 37,863,009Trip�com Group 1,247,569 37,199,637CK Hutchison 4,647,500 29,265,136Weibo 664,892 28,642,487Haier Smart Home 10,842,555 28,388,896AAC Technologies 5,053,000 27,677,140Kunlun Energy 34,254,000 26,116,273Acc 1,041,208 23,313,987Hyundai Steel 813,104 19,705,860Taiwan Semiconductor Manufacturing 1,641,000 18,223,688Tencent 303,700 16,767,729China Oilfield Services 16,982,000 13,758,981
The above represents aggregate purchases of a security exceeding 1 per cent of the total value of purchases for the year� If there were fewer than 20 purchases that exceed 1 per cent during the year the largest 20 purchases are disclosed�

423
Federated Hermes Investment Funds Public Limited CompanyUnaudited Schedule of Significant Portfolio Movements For the financial year ended 31 December 2020 (continued)
Federated Hermes Asia ex-Japan Equity Fund (continued)Total sales in year $2,400,432,735Major Sales Nominal
Holdings Proceeds $Alibaba 1,249,812 293,085,723Samsung Electronics 3,452,683 161,880,649MediaTek 7,291,000 122,201,100Taiwan Semiconductor Manufacturing 9,027,000 105,930,294ASE Technology 34,462,000 80,461,772Hon Hai Precision Industry 28,332,121 79,478,825Trip�com Group 2,393,411 70,296,636Wuliangye Yibin 3,782,549 66,121,007Haier Smart Home 23,734,183 65,589,616Baidu 562,731 64,939,532Jd�Com 901,996 60,788,878CK Hutchison 8,146,000 57,400,538PetroChina 148,464,000 51,716,826Taiwan Fertilizer 29,285,000 50,016,423Beijing Capital International Airport 72,903,119 49,961,310Applied Materials 745,307 45,802,963KLA 290,052 45,471,659Kunlun Energy 59,292,000 41,225,434KB Financial 1,348,440 40,185,943Honda Motor 1,829,700 40,005,698China Mobile 4,373,500 36,897,929Shenergy 47,997,952 35,759,227Power Grid of India 14,637,428 35,546,277Sinopharm 12,639,600 34,465,415Lite-On Technology 21,420,000 33,059,948Powertech Technology 9,614,000 32,359,292Simplo Technology 3,093,000 32,337,563Rohm 481,600 31,760,555Chow Tai Fook Jewellery Group 27,590,400 31,109,761China Oilfield Services 36,948,000 30,522,608Tingyi Cayman Islands 16,583,637 30,163,023Weibo 768,733 28,600,756COSCO Shipping Ports 38,794,102 26,724,405Beijing Enterprises 7,727,000 26,264,685Nexon 1,010,900 25,461,117Yunnan Baiyao 1,534,323 24,729,823China South Publishing & Media 15,553,632 24,021,292
The above represents aggregate sales of a security exceeding 1 per cent of the total value of sales for the year� If there were fewer than 20 sales that exceed 1 per cent during the year the largest 20 sales are disclosed�

424
Federated Hermes Investment Funds Public Limited CompanyUnaudited Schedule of Significant Portfolio Movements For the financial year ended 31 December 2020 (continued)
Federated Hermes Global Equity ESG Fund Total purchases in year $606,400,696Major Purchases Nominal
Holdings Cost $Samsung Electronics 358,537 19,420,093AIA 1,741,833 18,577,882NVIDIA 35,641 17,721,043Apple 90,118 15,585,673Aker BP 636,486 15,267,365Alibaba Group 528,560 15,154,923Citigroup 225,963 13,119,705Norsk Hydro 2,945,636 13,110,323Capital One Financial 142,375 12,337,241Tate & Lyle 1,415,387 12,225,627Microsoft 62,716 12,141,639FedEx 48,290 12,037,820Amazon�com 4,195 11,484,705Keysight Technologies 93,289 11,416,933Fortune Brands Home & Security 122,079 10,646,442Sony Corporation 148,000 10,554,441Paypal 56,648 9,981,491Prysmian Group 341,257 9,871,197Walt Disney 72,116 9,615,159Bank of America 373,158 9,449,380Delta Air Lines 260,513 8,634,214SK Hynix 77,000 8,312,293Alphabet Class A 5,214 8,229,528Lonza Group 14,892 7,911,722ORIX 546,100 7,852,913Activision Blizzard 105,410 7,840,268Thermo Fisher Scientific 18,683 7,660,330Copart 79,988 7,569,150ASML Holding 20,285 7,452,603Best Buy 69,432 7,421,324UniCredit 635,600 6,864,251Husqvarna Group 626,040 6,848,866Veeva Systems 24,812 6,722,547MSCI 18,430 6,571,321China Mengniu Dairy 1,609,000 6,495,409Taiwan Semiconductor Manufacturing 441,000 6,473,492M&G 2,596,514 6,463,220Discovery 245,157 6,359,760Telekomunikasi Indonesia Persero 23,498,700 6,319,133Abbott Laboratories 63,763 6,213,354
The above represents aggregate purchases of a security exceeding 1 per cent of the total value of purchases for the year� If there were fewer than 20 purchases that exceed 1 per cent during the year the largest 20 purchases are disclosed�

425
Federated Hermes Investment Funds Public Limited CompanyUnaudited Schedule of Significant Portfolio Movements For the financial year ended 31 December 2020 (continued)
Federated Hermes Global Equity ESG Fund (continued) Total sales in year $187,083,830Major Sales Nominal
Holdings Proceeds $Nokia 2,845,691 11,419,933Nippon Telegraph & Telephone 422,440 9,361,751Micron Technology 171,913 8,397,234Daifuku 77,600 8,184,089Aena 55,493 7,722,088Lonza Group 13,983 7,279,105ASML Holding 17,076 7,189,393Sysco 109,095 6,937,393China Mobile 1,182,774 6,796,338Koninklijke Ahold Delhaize 214,960 6,371,030China Resources Gas 1,156,000 5,993,179Baxter International 65,887 5,284,404Alibaba Group 154,926 5,089,586Hyundai Engineering & Construction 148,405 5,002,445Biogen 17,908 4,881,849Hyundai Marine & Fire Insurance 220,817 4,662,539Pets At Home Group 1,630,480 4,656,065Ford Motor 660,581 4,443,275American Water Works 31,255 4,194,176Cognex 66,509 4,162,958Roche 12,031 4,101,913Essity AB 112,366 3,634,318Delta Air Lines 114,517 3,431,916Verizon Communications 54,831 3,362,029ZOZO 175,800 3,189,606Ams 208,946 3,175,398Nestle 25,233 2,922,907Microsoft 13,206 2,826,443Vonovia 49,583 2,801,838Eagle Materials 31,015 2,711,487Gaztransport Et Technigaz 24,117 2,339,107Swire Pacific 245,702 2,285,858Travelers 16,962 2,274,885Stora Enso 117,845 1,997,267
The above represents aggregate sales of a security exceeding 1 per cent of the total value of sales for the year� If there were fewer than 20 sales that exceed 1 per cent during the year the largest 20 sales are disclosed�

426
Federated Hermes Investment Funds Public Limited CompanyUnaudited Schedule of Significant Portfolio Movements For the financial year ended 31 December 2020 (continued)
Federated Hermes Multi-Strategy Credit Fund Total purchases in year $478,861,800Major Purchases Nominal
Holdings Cost $United States Treasury Bill 0�000% 24/12/2020 87,500,000 87,480,007United States Treasury Bill 0�000% 17/06/2021 79,500,000 79,466,225Fiat Chrysler Automobiles 5�250% 15/04/2023 11,350,000 12,194,307United States Treasury Bills 0�000% 16/04/2020 10,000,000 9,964,076Catalent Pharma Solutions 2�375% 01/03/2028 7,788,000 8,422,396Lennar 4�125% 15/01/2022 7,150,000 7,336,640United States Treasury Bills 0�000% 16/07/2020 7,000,000 6,998,973Cleveland-Cliffs 5�875% 01/06/2027 7,000,000 6,510,000Ball 1�500% 15/03/2027 6,000,000 6,354,326Credit Suisse 31/12/2049 7,000,000 6,265,000Lvmh Moet Henness 1�125% 11-02-27 4,800,000 6,184,303Intesa Sanpaolo 31/12/2049 5,435,000 5,848,650Ashland Services 2�000% 30/01/2028 5,226,000 5,699,923United Group 3�625% 15/02/2028 5,028,000 5,553,678ABN AMRO Bank 31/12/2049 5,300,000 5,496,305HCA 4�750% 01/05/2023 5,160,000 5,471,200Danske Bank 2�250% 14/01/2028 4,000,000 5,231,669Castell 15/07/2052 3,716,295 4,979,233Aker BP 3�750% 15/01/2030 4,844,000 4,834,409Deutsche Bank 2�625% 16/12/2024 3,700,000 4,808,546
Total sales in year $821,672,729Major Sales Nominal
Holdings Proceeds $United States Treasury Bill 0�000% 24/12/2020 87,500,000 87,498,809Dell 4�420% 15/06/2021 20,500,000 21,182,030Phoenix Group 31/12/2049 10,761,000 15,473,723Hess 4�300% 01/04/2027 14,950,000 15,249,593Bank of Ireland 31/12/2049 13,759,000 15,194,173Anglo American Capital 4�125% 15/04/2021 14,200,000 14,532,658BHP Billiton Finance 22/10/2077 10,750,000 14,339,017Dresdner Funding Trust I 8�151% 30/06/2031 9,308,000 13,075,214Virgin Media Secured Finance 15/01/2025 8,669,550 11,883,591Crown European 2�875% 01/02/2026 11,534,000 11,129,887Petroleos Mexicanos 2�750% 21/04/2027 11,250,000 11,077,470Reynolds 05/02/2023 10,907,578 10,907,578Air Lease 3�625% 01/12/2027 11,872,000 10,500,640Range Resources 4�875% 15/05/2025 13,553,000 10,485,196Charter Communications Operating 4�908% 23/07/2025 10,183,000 10,169,474United States Treasury Bill 0�000% 18/02/2020 10,000,000 9,988,739United States Treasury Bills 0�000% 16/04/2020 10,000,000 9,985,181Vale Overseas 6�250% 10/08/2026 8,152,000 9,573,987Fiat Chrysler Automobiles 5�250% 15/04/2023 9,400,000 9,480,135NXP 3�875% 01/09/2022 9,100,000 9,462,162Clearway Energy 5�000% 15/09/2026 8,759,000 9,098,411Ardagh Packaging Finance 4�750% 15/07/2027 6,898,000 8,891,088Electricite de France 31/12/2049 6,600,000 8,639,625Intesa Sanpaolo 5�017% 26/06/2024 8,150,000 8,522,154DNB Bank 1�375% 12/06/2023 6,555,000 8,483,291Enbridge 5�500% 15/07/2077 9,000,000 8,307,448
The above represents aggregate purchases and sales of a security exceeding 1 per cent of the total value of purchases and aggregate sales of a security exceeding 1 per cent of sales for the year� If there were fewer than 20 purchases/sales that exceed 1 per cent during the year the largest 20 purchases/sales are disclosed�

427
Federated Hermes Investment Funds Public Limited CompanyUnaudited Schedule of Significant Portfolio Movements For the financial year ended 31 December 2020 (continued)
Federated Hermes Global Small Cap Equity Fund Total purchases in year $61,905,825Major Purchases Nominal
Holdings Cost $Cargurus 75,930 1,896,404Breedon Aggregates 1,492,538 1,516,846TCF Financial 50,711 1,446,283Merlin Properties REITS 128,431 1,379,076IMCD 13,418 1,323,510RPM International 18,110 1,319,720Power Integrations 12,227 1,315,610Columbia Sportswear 18,489 1,313,953Aalberts 37,747 1,251,649Ansell 44,936 1,243,376West Pharmaceutical Services 5,330 1,206,261Altair Engineering 27,298 1,177,086Yaoko 17,399 1,149,406Dechra Pharmaceuticals 27,605 1,076,072Brooks Automation 23,181 1,050,439Brown & Brown 25,558 1,039,024Silicon Laboratories 10,156 1,024,235SCSK 20,065 1,022,100Diversified Gas & Oil 830,441 1,016,944ServiceMaster 34,315 1,013,123SOITEC 7,338 1,006,123Palomar 14,251 1,001,502Brunswick 17,572 964,330WD-40 5,171 963,930STERIS 6,033 942,025Community Bank System 15,028 931,434AptarGroup 8,144 925,307Glanbia 87,044 897,839AMN Healthcare Services 17,044 885,627Cargojet 7,136 880,643Nifco 38,700 879,035CACI International 3,669 870,099Horiba 16,139 870,045Open House 31,238 859,298Huhtamaki 20,117 853,678Bio-Rad Laboratories 1,778 845,091Jack Henry & Associates 4,936 834,408Hulic Reit 680 821,440WEX 5,710 819,341Evolution Mining 221,820 818,975Jungheinrich - Preferred 31,759 818,011Wintrust Financial 18,222 812,271CLS 320,295 812,142Central Asia Metals 407,089 774,793Trelleborg 51,562 772,766National Instruments 20,392 766,242Parsley Energy 97,979 765,611Reinsurance of America 6,991 734,054Retail Opportunity Investments REITS 68,972 728,391Burckhardt Compression 3,127 704,344Thule 28,001 677,598John Wiley & Sons 18,481 670,895Technogym 79,315 656,692Hitachi Capital 29,722 638,690MARR 43,067 637,850
The above represents aggregate purchases of a security exceeding 1 per cent of the total value of purchases for the year� If there were fewer than 20 purchases that exceed 1 per cent during the year the largest 20 purchases are disclosed�

428
Federated Hermes Investment Funds Public Limited CompanyUnaudited Schedule of Significant Portfolio Movements For the financial year ended 31 December 2020 (continued)
Federated Hermes Global Small Cap Equity Fund (continued) Total sales in year $25,600,896Major Sales Nominal
Holdings Proceeds $Teradyne 23,394 1,852,724Hitachi Capital 72,280 1,703,203West Pharmaceutical Services 6,018 1,396,587Relo Group 62,583 1,202,086Brown & Brown 25,696 1,187,032SCSK 18,637 1,047,185Parsley Energy 97,979 933,659Bio-Rad Laboratories 2,004 861,454Abiomed 2,875 786,214Tadano 90,022 735,084Evolution Mining 162,936 610,306Cargojet 4,227 590,694AMN Healthcare Services 7,932 530,854IMCD 5,157 528,093Washtec 11,097 525,640STERIS 3,395 522,627Reinsurance of America 4,014 510,674Brooks Automation 9,331 505,652RPM International 6,434 488,823CACI International 1,934 432,717Jungheinrich - Preferred 14,643 407,556Jack Henry & Associates 2,561 400,350Weingarten Realty Investors 21,430 357,169Amerisur Resources 1,394,413 349,861WEX 1,266 281,934Wintrust Financial 4,040 262,882Yaoko 5,085 262,175
The above represents aggregate sales of a security exceeding 1 per cent of the total value of sales for the year� If there were fewer than 20 sales that exceed 1 per cent during the year the largest 20 sales are disclosed�

429
Federated Hermes Investment Funds Public Limited CompanyUnaudited Schedule of Significant Portfolio Movements For the financial year ended 31 December 2020 (continued)
Federated Hermes Absolute Return Credit Fund Total purchases in year $492,487,702Major Purchases Nominal
Holdings Cost $United States Treasury Bill 0�000% 24/12/2020 69,600,000 69,553,517United States Treasury Bill 0�000% 11/02/2021 46,500,000 46,476,640United States Treasury Bill 0�000% 17/06/2021 37,000,000 36,984,180United States Treasury Bill 0�000% 16/07/2020 35,000,000 34,994,075United States Treasury Bill 0�000% 03/09/2020 27,000,000 26,990,454BHP Billiton Finance 22/10/2077 4,000,000 5,617,676NXP 3�875% 01/09/2022 4,975,000 5,244,056HCA 4�750% 01/05/2023 4,553,000 4,947,974Lennar 4�125% 15/01/2022 4,475,000 4,585,115MPT Operating Partnership 2�550% 05/12/2023 2,347,000 3,114,247Dell International LLC/EMC 5�450% 15/06/2023 2,430,000 2,676,281Ripon Mortgages 20/08/2056 2,034,740 2,617,234CIT 5�000% 01/08/2023 2,250,000 2,397,473Veolia Environnement 20/01/2029 2,000,000 2,351,900Credit Suisse 3�000% 27/05/2022 1,750,000 2,340,315Charter Communications Operating 4�464% 23/07/2022 2,200,000 2,337,420Telecom Italia1�125% 26/03/2022 2,000,000 2,309,237Virgin Media Secured Finance 6�000% 15/01/2025 1,730,939 2,303,590Crown European 0�750% 15/02/2023 2,059,000 2,254,645Ball 0�875% 15/3/2024 2,000,000 2,228,882
Total sales in year $312,992,184Major Sales Nominal
Holdings Proceeds $United States Treasury Bill 0�000% 24/12/2020 69,600,000 69,569,256United States Treasury Bill 0�000% 11/02/2021 46,500,000 46,493,729United States Treasury Bill 0�000% 16/07/2020 35,000,000 34,995,051United States Treasury Bill 0�000% 03/09/2020 27,000,000 26,992,290United States Treasury Bill 0�000% 18/02/2020 4,200,000 4,195,032FCE Bank 3�250% 19/11/2020 2,900,000 3,761,327Dell 4�420% 15/06/2021 3,000,000 3,040,284Virgin Media Secured Finance 6�000% 15/01/2025 1,980,939 2,753,206Sprint Spectrum 3�360% 20/03/2023 2,590,625 2,602,250HCA 4�750% 01/05/2023 2,334,000 2,398,779BHP Billiton Finance 6�500% 22/10/2077 1,750,000 2,275,311DNB Bank 1�375% 12/06/2023 1,890,000 2,190,126Lennar 4�125% 15/01/2022 2,000,000 2,012,845Delamare Cards MTN Issuer 19/11/2025 1,750,000 1,745,275ANZ Bank 25/11/2035 1,669,000 1,677,927MPT Operating Partnership 2�550% 05/12/2023 1,450,000 1,664,259MMC Finance 4�100% 11/04/2023 1,585,000 1,638,240NXP 3�875% 01/09/2022 1,500,000 1,547,295Veon 3�950% 16/06/2021 1,504,000 1,497,336Glencore Canada Financial 7�375% 27/05/2020 1,230,000 1,453,614
The above represents aggregate purchases and sales of a security exceeding 1 per cent of the total value of purchases and aggregate sales of a security exceeding 1 per cent of sales for the year� If there were fewer than 20 purchases/sales that exceed 1 per cent during the year the largest 20 purchases/sales are disclosed�

430
Federated Hermes Investment Funds Public Limited CompanyUnaudited Schedule of Significant Portfolio Movements For the financial year ended 31 December 2020 (continued)
Federated Hermes SDG Engagement Equity Fund Total purchases in year $726,450,566
Major Purchases Nominal Holdings Cost $
IMCD 226,521 21,935,380AMN Healthcare Services 378,882 21,260,267AptarGroup 184,609 21,181,978Alliant Energy 399,833 21,015,132Cooper Cos 63,513 20,282,958Simpson Manufacturing 221,680 18,585,242Silicon Laboratories 180,447 18,533,564Huhtamaki 420,452 18,053,643WEX 109,100 17,799,745Aalberts 476,858 17,268,334Wintrust Financial 354,441 17,251,426Nissan Chemical 353,000 17,140,736RPM International 227,708 17,104,366Fortune Brands Home & Security 234,051 16,958,089STERIS 108,577 16,902,673Brunswick 290,626 16,541,986Mapletree Industrial Trust REITS 7,938,700 16,446,249Open House 530,281 16,136,948TCF Financial 501,128 15,995,033Nifco 587,977 15,525,768Techtronic Industries 1,614,000 15,446,770Merlin Properties REITS 1,443,014 15,316,843Horiba 272,840 15,038,582Yaoko 232,480 14,976,058Woodward 166,738 14,849,114Samsonite 11,505,047 14,846,787Clean Harbors 227,430 14,828,112Eagle Materials 187,964 14,742,491West Pharmaceutical Services 76,050 14,528,411Shenzhen International 8,047,000 14,384,909Burckhardt Compression 52,178 13,596,356Credicorp 93,258 13,545,232Retail Opportunity Investments REITS 1,120,969 13,346,456Reinsurance of America 122,115 13,160,724Trelleborg 782,405 12,922,788John Wiley & Sons 318,717 12,106,155DCC 154,180 11,662,811SSP 2,667,151 11,575,782SOITEC 79,607 11,357,048Glanbia 992,085 11,233,061Kirby 215,747 11,232,240Technogym 1,182,966 11,073,585Relo Group 388,030 9,099,654Land Mark Optoelectronics 973,000 9,050,122MARR 584,492 8,963,105National Instruments 237,198 8,876,217
The above represents aggregate purchases of a security exceeding 1 per cent of the total value of purchases for the year� If there were fewer than 20 purchases that exceed 1 per cent during the year the largest 20 purchases are disclosed�

431
Federated Hermes Investment Funds Public Limited CompanyUnaudited Schedule of Significant Portfolio Movements For the financial year ended 31 December 2020 (continued)
Federated Hermes SDG Engagement Equity Fund (continued) Total sales in year $107,232,010
Major Sales Nominal Holdings Proceeds $
West Pharmaceutical Services 85,719 19,547,778IMCD 97,695 9,901,352Fortune Brands Home & Security 102,476 8,352,784Techtronic Industries 774,000 7,561,593Movida Participacoes 2,431,100 5,454,416Snap-on 36,038 4,909,255AMN Healthcare Services 73,266 4,300,040Middleby 57,380 3,718,282Amerisur Resources 13,249,688 3,324,371STERIS 17,199 2,903,005Brunswick 38,510 2,557,543Yaoko 30,554 1,897,311Cineworld Group 4,451,659 1,508,471RPM International 18,390 1,385,292AptarGroup 11,639 1,316,603Huhtamaki 29,626 1,216,629Cooper Cos 3,902 1,203,485Alliant Energy 24,563 1,195,427Silicon Laboratories 10,933 1,120,009Simpson Manufacturing 13,554 1,091,691
The above represents aggregate sales of a security exceeding 1 per cent of the total value of sales for the year� If there were fewer than 20 sales that exceed 1 per cent during the year the largest 20 sales are disclosed�

432
Federated Hermes Investment Funds Public Limited CompanyUnaudited Schedule of Significant Portfolio Movements For the financial year ended 31 December 2020 (continued)
Federated Hermes Impact Opportunities Equity Fund Total purchases in year $181,815,695Major Purchases Nominal
Holdings Cost $DexCom 54,650 17,476,828Kingspan Group 190,000 13,091,130Planet Fitness 142,219 8,264,430Straumann 9,660 8,212,495Vestas Wind Systems 40,000 7,109,082Ecolab 33,100 6,728,710Qiagen 133,759 6,393,843Strategic Education 69,300 6,230,131Novo Nordisk 89,179 6,219,297Itron 88,752 6,156,363Blackbaud 110,000 5,918,045Xylem 74,928 5,669,662Ballard Power Systems 330,000 5,652,279Lonza Group 9,000 5,583,722Hella 141,000 5,386,324Illumina 14,700 5,143,478CSL 24,400 5,143,145Brambles 660,000 5,132,589Syncona 1,518,929 5,121,853Umicore 97,930 4,442,687Abcam 250,581 4,283,733Agilent Technologies 44,626 4,250,377Emergent BioSolutions 45,830 4,023,975Livanova 64,491 3,880,398Hannon Armstrong Sustainable Infrastructure Capital 90,516 3,583,646Sartorius - Preferred 8,468 3,555,775ANSYS 10,684 3,428,089Orsted 22,626 3,420,229Carl Zeiss Meditec 24,873 3,137,438Tomra Systems 70,949 2,910,906Siemens Gamesa Renewable Energy 115,828 2,850,776
The above represents aggregate purchases of a security exceeding 1 per cent of the total value of purchases for the year� If there were fewer than 20 purchases that exceed 1 per cent during the year the largest 20 purchases are disclosed�

433
Federated Hermes Investment Funds Public Limited CompanyUnaudited Schedule of Significant Portfolio Movements For the financial year ended 31 December 2020 (continued)
Federated Hermes Impact Opportunities Equity Fund (continued)Total sales in year $75,431,951Major Sales Nominal
Holdings Proceeds $Emergent BioSolutions 119,530 8,195,023Horiba 147,908 7,484,090Duerr 175,101 5,295,915Valeo 234,523 4,356,013Siemens Gamesa Renewable Energy 146,490 4,342,542Sartorius - Preferred 15,740 4,315,571Hella 105,148 4,226,169Hannon Armstrong Sustainable Infrastructure Capital 79,956 3,679,679Lonza Group 7,078 2,907,870Umicore 70,697 2,810,604Bank Rakyat Indonesia Persero 12,689,381 2,798,022Xylem 31,216 2,467,193Novo Nordisk 38,293 2,229,417Tomra Systems 70,754 2,227,894Cogna Educacao 2,559,310 2,032,924CSL 11,027 1,950,796DexCom 4,650 1,883,847Brambles 238,238 1,857,904Livanova 22,511 1,509,992ANSYS 6,941 1,491,968Agilent Technologies 18,758 1,471,620Abcam 55,155 1,061,626Orsted 8,576 999,952Ecolab 4,775 911,270
The above represents aggregate sales of a security exceeding 1 per cent of the total value of sales for the year� If there were fewer than 20 sales that exceed 1 per cent during the year the largest 20 sales are disclosed�

434
Federated Hermes Investment Funds Public Limited CompanyUnaudited Schedule of Significant Portfolio Movements For the financial year ended 31 December 2020 (continued)
Federated Hermes Unconstrained Credit Fund Total purchases in year $692,367,559Major Purchases Nominal
Holdings Cost $United States Treasury Bill 0�000% 24/12/2020 83,500,000 83,478,650United States Treasury Bill 0�000% 17/06/2021 51,700,000 51,678,061United States Treasury Bill 0�000% 16/04/2020 20,000,000 19,928,151Fiat Chrysler Automobiles 5�250% 15/04/2023 9,250,000 9,781,381Ardagh Packaging Finance 2�125% 15/08/2026 7,583,000 8,943,577Berry Global 1�500% 15/01/2027 7,350,000 8,199,849Ball 0�875% 15/3/2024 6,265,000 7,620,860Ashland Services 2�000% 30/01/2028 5,823,000 6,386,140Grifols 2�250% 15/11/2027 5,557,000 6,305,952Csc Hldgs� 3�375% 15/2/2031 6,400,000 6,244,852Intesa Sanpaolo 5�017% 26/06/2024 5,650,000 6,011,482Hayfin Emerald 17/11/2032 5,000,000 5,875,751Catalent Pharma Solutions 2�375% 01/03/2028 4,973,000 5,584,577Providus CLO II DAC 15/07/2031 5,000,000 5,551,169Virgin Media Secured Finance 15/01/2025 4,001,226 5,403,428BNP Paribas 5,386,000 5,214,125Veolia Environnement Veolia Environnement F2v Perp 4,400,000 5,174,181Energias de Portugal 20/07/2080 4,700,000 5,160,717MPT Operating Partnership 3�692% 05/06/2028 3,700,000 5,020,785IQVIA 2�250% 15/01/2028 4,150,000 4,807,259
Total sales in year $438,993,387Major Sales Nominal
Holdings Proceeds $United States Treasury Bill 0�000% 24/12/2020 83,500,000 83,493,828United States Treasury Bill 0�000% 18/02/2020 25,000,000 24,971,856United States Treasury Bill 0�000% 16/04/2020 20,000,000 19,962,226Calpine 2�500% 12/08/2026 7,000,000 7,000,000L Brands 7�500% 15/06/2029 5,842,000 6,298,857Dresdner Funding Trust I 8�151% 30/06/2031 4,311,000 6,257,105Virgin Media Secured Finance 15/01/2025 4,001,226 5,548,929Suzano Austria 7�000% 16/03/2047 3,861,000 5,023,780Hess 5�800% 1/4/2047 3,625,000 4,375,750United States Treasury Bill 0�000% 16/07/2020 4,000,000 3,999,628MPT Operating Partnership 3�325% 24/03/2025 3,200,000 3,923,204MPLX 4�125% 01/03/2027 3,450,000 3,803,584ANZ Bank 25/11/2035 3,716,000 3,735,876CMF 2020-1 PLC 16/01/2057 3,120,000 3,708,970Range Resources 4�875% 15/5/2025 4,061,000 3,705,682Phoenix Group 31/12/2049 2,551,000 3,684,056HCA 4�500% 15/02/2027 3,730,000 3,563,232Aircastle 4�125% 1/5/2024 3,393,000 3,384,980Charter Communications Operating 4�908% 23/07/2025 3,550,000 3,368,702Avis Budget Car Rental/ Avis Budget Finance 5�750% 15/07/2027 3,165,000 3,354,900
The above represents aggregate purchases and sales of a security exceeding 1 per cent of the total value of purchases and aggregate sales of a security exceeding 1 per cent of sales for the year� If there were fewer than 20 purchases/sales that exceed 1 per cent during the year the largest 20 purchases/sales are disclosed�

435
Federated Hermes Investment Funds Public Limited CompanyUnaudited Schedule of Significant Portfolio Movements For the financial year ended 31 December 2020 (continued)
Federated Hermes Global Emerging Markets SMID Equity Fund Total purchases in year $134,429,541Major Purchases Nominal
Holdings Cost $Sunny Friend Environmental Technology 618,000 5,360,734Genomma Lab Internacional SAB de CV 5,143,593 5,143,870Win Semiconductors 378,000 4,470,007Eugene Technology 244,138 4,395,689Grupo Aeroportuario del Centro Norte 886,708 4,226,176Koh Young Technology 57,600 4,165,423Shenzhen International 2,339,000 4,075,007NICE Information Service 242,490 3,979,728Enel Chile 55,728,259 3,973,197Bajaj Finserv 44,013 3,942,526Tokai Carbon Korea 47,186 3,795,197KB Financial Group 103,264 3,353,171Credicorp 24,292 3,269,398China Communications Services 4,762,000 3,226,053SBI Life Insurance 303,204 3,214,565VA Tech Wabag 1,158,078 3,150,171Polymetal International 125,708 3,025,229Hapvida Participacoes e Investimentos 230,523 2,933,465Integrated Diagnostics Holdings 681,504 2,888,522Land Mark Optoelectronics 303,000 2,725,273BB Seguridade Participacoes 474,000 2,714,043Delta Electronics 545,000 2,602,652Transaction Capital 2,092,392 2,555,164Cleopatra Hospital 7,285,100 2,397,969Weimob 2,618,000 2,131,587Samsonite 1,826,335 2,104,477Notre Dame Intermedica Participacoes 141,923 2,069,331ICICI Lombard General Insurance 117,916 2,044,580Duratex 523,200 2,032,623SITC International Holdings 1,806,000 2,029,155NCSoft 3,538 1,994,448Yandex 45,606 1,934,901Autohome ADR 21,757 1,796,610AvivaSA Emeklilik ve Hayat 847,538 1,744,769Hangzhou Tigermed Consulting 151,206 1,639,295Shoprite 199,818 1,635,404Richter Gedeon 71,492 1,620,049Accton Technology 210,000 1,567,595Sinbon Electronics 265,000 1,487,893Baozun ADR 41,594 1,460,606Bharat Forge 221,765 1,404,552IRB Brasil Resseguros 166,700 1,375,082
The above represents aggregate purchases of a security exceeding 1 per cent of the total value of purchases for the year� If there were fewer than 20 purchases that exceed 1 per cent during the year the largest 20 purchases are disclosed�

436
Federated Hermes Investment Funds Public Limited CompanyUnaudited Schedule of Significant Portfolio Movements For the financial year ended 31 December 2020 (continued)
Federated Hermes Global Emerging Markets SMID Equity Fund (continued)Total sales in year $73,274,767Major Sales Nominal
Holdings Proceeds $Techtronic Industries 384,000 4,715,077NARI Technology 1,421,080 4,460,090Richter Gedeon 196,347 4,025,724Yandex 64,150 3,723,101Mail�Ru Group GDR 132,517 3,420,412China Communications Services 5,695,131 3,298,609Foschini 351,063 3,285,661Commercial International Bank Egypt 829,374 3,278,536IRB Brasil Resseguros 548,600 3,131,663China Mengniu Dairy 645,000 2,973,354Delta Electronics 428,000 2,646,842Weimob 2,157,000 2,402,384Notre Dame Intermedica Participacoes 178,840 2,331,777Mavi Giyim Sanayi Ve Ticaret 245,020 2,290,122NCSoft 3,177 2,132,459SITC International Holdings 1,021,000 1,969,718AvivaSA Emeklilik ve Hayat 784,158 1,755,653Shoprite 274,441 1,639,368Eugene Technology 61,377 1,622,685Accton Technology 221,000 1,578,973Autohome ADR 18,682 1,562,669Duratex 487,000 1,519,568Integrated Diagnostics Holdings 347,228 1,119,654BIM Birlesik Magazalar 140,723 1,105,079Genomma Lab Internacional SAB de CV 1,510,847 1,060,410Aier Eye Hospital 155,003 986,656Hapvida Participacoes e Investimentos 85,677 918,057BB Seguridade Participacoes 157,400 914,698Cleopatra Hospital 2,944,513 889,787SBI Life Insurance 69,820 889,428Baozun ADR 24,142 873,326Sinbon Electronics 153,000 758,112
The above represents aggregate sales of a security exceeding 1 per cent of the total value of sales for the year� If there were fewer than 20 sales that exceed 1 per cent during the year the largest 20 sales are disclosed�

437
Federated Hermes Investment Funds Public Limited CompanyUnaudited Schedule of Significant Portfolio Movements For the financial year ended 31 December 2020 (continued)
Federated Hermes SDG Engagement High Yield Credit Fund Total purchases in year $539,551,556Major Purchases Nominal
Holdings Cost $United States Treasury Bill 0�000% 17/06/2021 85,600,000 85,563,732United States Treasury Bill 0�000% 24/12/2020 70,000,000 69,972,483United States Treasury Bill 0�000% 16/04/2020 22,000,000 21,921,272United States Treasury Bill 0�000% 16/07/2020 15,000,000 14,991,950CSC 3�375% 15/2/2031 7,310,000 7,226,472Ashland Services 2�000% 30/01/2028 6,655,000 7,212,955BNP Paribas 25/02/2030 7,024,000 7,007,850Veolia Environnement 20/01/2029 5,900,000 6,962,911Infrastrutture Wireless Italiane 1�625% 21/10/2028 5,281,000 6,197,957Ziggo 3�375% 28/02/2030 5,461,000 6,046,512Credit Suisse 31/12/2049 5,950,000 5,792,138Commerzbank 6�125% 31/12/2049 4,800,000 5,736,477Energias de Portugal 1�700% 20/07/2080 5,200,000 5,736,253Samhallsbygg 14/12/2025 4,700,000 5,690,496Post 4�625% 15/04/2030 5,421,000 5,478,794Unipolsai Assicurazioni 27/04/2030 4,464,000 5,313,188Aker BP 3�750% 15/01/2030 4,994,000 5,006,636Enterprise Products Operating 5�375% 15/02/2078 5,325,000 4,941,112Catalent Pharma Solutions 2�375% 01/03/2028 4,260,000 4,665,983Cooperatieve Rabobank 29/12/2026 3,800,000 4,641,801
Federated Hermes SDG Engagement High Yield Credit Fund (continued)Total sales in year $188,863,564Major Sales Nominal
Holdings Proceeds $United States Treasury Bill 0�000% 24/12/2020 70,000,000 69,998,443United States Treasury Bill 0�000% 18/02/2020 25,000,000 24,969,096United States Treasury Bill 0�000% 16/04/2020 22,000,000 21,998,494United States Treasury Bill 0�000% 16/07/2020 15,000,000 14,998,781CSC 5�750% 15/01/2030 3,810,000 4,186,238Commerzbank 31/12/2049 3,600,000 3,646,800Avis Budget Car Rental/ Avis Budget Finance 5�750% 15/07/2027 3,300,000 3,498,000Ziggo 2�875% 15/01/2030 3,030,000 3,446,757Credit Suisse 31/12/2049 3,025,000 3,338,844Ashland Services 2�000% 30/01/2028 2,355,000 2,653,405SoftBank 31/12/2049 2,225,000 2,289,525Cleveland-Cliffs 5�875% 01/06/2027 2,532,000 2,268,744HCA 4�125% 15/06/2029 1,400,000 1,564,150Post 5�500% 15/12/2029 1,340,000 1,422,075Neptune Energy Bo 6�625% 15/05/2025 2,128,000 1,352,140Aker 5�875% 31/03/2025 1,250,000 1,319,375MMC Finance 4�100% 11/04/2023 1,200,000 1,246,500Enel Finance International 1�000% 20/10/2027 946,000 1,235,126Allianz 30/10/2030 1,000,000 1,184,586L Brands 7�5000% 15/06/2029 1,030,000 1,100,169
The above represents aggregate purchases and sales of a security exceeding 1 per cent of the total value of purchases and aggregate sales of a security exceeding 1 per cent of sales for the year� If there were fewer than 20 purchases/sales that exceed 1 per cent during the year the largest 20 purchases/sales are disclosed�

438
Federated Hermes Investment Funds Public Limited CompanyUnaudited Schedule of Significant Portfolio Movements For the financial year ended 31 December 2020 (continued)
Federated Hermes US High Yield Credit Fund Total purchases in year $8,260,107Major Purchases Nominal
Holdings Cost $CSC 4�125% 01/12/2030 200,000 208,102Ardagh Packaging Finance 5�250% 15/08/2027 200,000 206,000Ford Motor Credit LLC 4�271% 09/01/2027 200,000 200,250Centene Corporation 5�375% 01/06/2026 125,000 133,125CCO 4�250% 01/02/2031 125,000 127,500HUB International Limited 7�000% 01/05/2026 100,000 105,250T-Mobile 6�375% 01/03/2025 100,000 102,625Bausch Health 5�000% 30/01/2028 100,000 100,030Sirius XM Radio 5�500% 01/07/2029 75,000 82,521Sprint Nextel Corporation 6�000% 15/11/2022 75,000 81,094Post 5�625% 15/01/2028 75,000 80,741Nexstar Escrow 5�625% 15/07/2027 75,000 78,585Dell International 7�125% 15/06/2024 75,000 77,963Bausch Health 6�125% 15/04/2025 75,000 77,530Targa Resources Partner 5�375% 01/02/2027 75,000 77,527Flex Acquisition 7�875% 15/07/2026 75,000 77,4381011778 BC ULC 5�000% 15/10/2025 75,000 77,156EQM Midstream Partners 5�500% 15/07/2028 75,000 76,875HCA 3�500% 01/09/2030 75,000 76,125Berry Plastics 6�00% 15/10/2022 75,000 75,375
The above represents aggregate purchases of a security exceeding 1 per cent of the total value of purchases for the year� If there were fewer than 20 purchases that exceed 1 per cent during the year the largest 20 purchases are disclosed�

439
Federated Hermes Investment Funds Public Limited CompanyUnaudited Schedule of Significant Portfolio Movements For the financial year ended 31 December 2020 (continued)
Federated Hermes US High Yield Credit Fund (continued)Total sales in year $1,324,848Major Sales Nominal
Holdings Proceeds $T-Mobile 6�375% 01/03/2025 100,000 102,1251011778 BC ULC 5�000% 15/10/2025 75,000 76,875Berry Plastics 6�000% 15/10/2022 75,000 75,000Energizer 6�375% 15/07/2026 50,000 53,725Rattler Midstream 5�625% 15/7/2025 50,000 53,059Avantor 6�000% 01/10/2024 50,000 52,250NFP 8�00% 15/07/2025 50,000 52,000Standard Industries 6�000% 15/10/2025 50,000 51,826Albertsons 6�625% 15/06/2024 50,000 51,657Quicken Loans 5�750% 01/05/2025 50,000 51,438United Rentals 5�500% 15/07/2025 50,000 51,375Kfc Hldg� Co/Pizza 5�000% 01/06/2024 50,000 51,250Polaris Interme 8�500% Pik 01/12/2022 50,000 51,000Nielsen Finance 5�000% 15/04/2022 32,000 32,000EQT 7�000% 01/02/2030 25,000 31,637Sirius XM Radio 5�500% 01/07/2029 25,000 27,527Western Midstream Operating 5�050% 01/02/2030 25,000 27,255Navient 7�250% 25/09/2023 25,000 27,250Endeavor Energy 5�750% 30/01/2028 25,000 27,075SS&C Technologies 5�500% 30/09/2027 25,000 26,821Edgewell Personal Care 5�500% 1/6/2028 25,000 26,313Seaworld Parks & Entertainment 9�500% 01/08/2025 25,000 26,188United Rentals North America 3�875% 15/02/2031 25,000 26,177Element Solutions 5�875% 01/12/2025 25,000 26,049Mph Acquisition 7�125% 01/06/2024 25,000 25,891Hess Midstream Operations 5�625% 15/02/2026 25,000 25,751Emergent BioSolutions 3�875% 15/8/2028 25,000 25,594Holly Energy Partner 5�000% 01/02/2028 25,000 25,118Bausch Health 5�000% 30/01/2028 25,000 25,032Air Medical Merger 6�375% 15/5/2023 25,000 25,000Mauser Packaging Solutions 7�250% 15/04/2025 25,000 24,969Ascent Resources Utica 10�000% 01/04/2022 25,000 24,750Summit Midstream 5�500% 15/8/2022 25,000 22,688Antero Midstream Partners 5�750% 15/01/2028 25,000 22,188
The above represents aggregate sales of a security exceeding 1 per cent of the total value of sales for the year� If there were fewer than 20 sales that exceed 1 per cent during the year the largest 20 sales are disclosed�

440
Federated Hermes Investment Funds Public Limited CompanyUnaudited Investment Manager Remuneration Disclosure
Hermes Fund Managers Ireland Limited (“HFMIL”) is the appointed management company of Federated Hermes Investment Funds Plc (the “Company”) and has established a remuneration policy (the “Remuneration Policy”) in such capacity in accordance with the UCITS V Directive (“UCITS V”) and related guidance, including, in particular, the European Securities and Markets Authority (“ESMA”) Guidelines on sound remuneration policies under UCITS V Directive (ESMA/2016/575) (the “ UCITS ESMA Guidelines”)�
Remuneration
The Remuneration Committee of HFMIL has established a Remuneration Philosophy and policy, the purpose of which is to ensure that the remuneration arrangements of the “Identified Staff” (Board of Directors, Designated Persons and control functions and risk takers), are
(i) consistent with and promote sound and effective risk management and do not encourage risk-taking which is inconsistent with the risk profile, rules or instruments of incorporation of the UCITS managers or the Company; and
(ii) consistent with the UCITS manager business strategy, objectives, values and interests and includes measures to avoid conflicts of interest.
HFMIL complies with the UCITS remuneration principles in a way and to the extent that is appropriate to the size, internal organisation and nature and scope and complexity of the Company’s activities�
HFMIL has appointed Hermes Investment Managers Limited as the delegate to carry out the investment management (the “Investment Manager”)� The Investment Manager, and any delegate appointed by the Investment Manager, is an investment firm, under the Markets in Financial Instruments Directive (“MiFID”), and complies with the UCITS ESMA Guidelines, which the Company has determined are equally as effective as those applicable under UCITS V�
Employee remuneration disclosure
The table below provides an overview of the following:
• Aggregate total remuneration paid by Hermes Fund Managers Limited and HFMIL to all employees that support the Company; and
• Aggregate total remuneration paid by Hermes Fund Managers Limited and HFMIL to all HFMIL Remuneration Code Staff�
The remuneration figures have been prorated against HFMIL Assets Under Management (AUM) relative to Hermes Fund Managers Limited AUM (excluding Hermes GPE LLP)� ‘Fixed remuneration’ includes 2020 Leavers�
Headcount Total Remuneration (£’000s)
Employees that also cover the Company 397 17,904of which Fixed remuneration 11,888 Variable remuneration 6,016Code Staff employees that also cover HFMIL 33 7,696of which Senior Management 9 2,677 Other Code Staff 24 5,019
Number of Funds AUM (USD)As at 31 Dec 2020 % of AUM
The Company 24 19,136,844,634 100of which Alternative investment funds - - - UCITS funds 17 17,219,482,850 90% Other funds 7 1,917,361,784 10%

441
Federated Hermes Investment Funds Public Limited CompanyUnaudited Securities Financing Transaction Regulation Disclosures
The Securities Financing Transaction Regulation (Regulation (EU) 2015/2365) (“SFTR”) came into effect on 12 January 2016. The aim of the SFTR is to improve the transparency of securities financing transactions (“SFTs”) in the shadow banking sector, giving regulators access to detailed information to enable them to monitor risks in that sector on an ongoing basis�
The SFTR divides SFTs into four categories:
- Repurchase transactions;- Securities or commodities lending or borrowing transactions;- Buy-sell back or sell-buy back transactions; and- Margin lending transactions, which is defined broadly to capture any extension of credit ‘in connection with the purchase, sale, carrying or trading of securities’�
For the avoidance of doubt, the Company does not currently employ repurchase/reverse repurchase agreements and securities lending for the purposes of efficient portfolio management.
No sub-fund employed SFTs at the year end date of 31 December 2020�