Feature-Based Detection of Landmines in Infrared Images
12
Preprint Proc. SPIE Vol. 4742, Det. and Rem. Techn. for Mine and Minelike Targets VII, Orlando FL, USA, Apr. 2002 1 Feature-based detection of landmines in infrared images Wilhelmus A. C. M. Messelink ab Klamer Schutte b , Albert M. Vossepoel a Frank Cremer bac , John G. M. Schavemaker b , Eric den Breejen b a Pattern Recognition Group, Delft University of Technology, Delft, The Netherlands b TNO Physics and Electronics Laboratory, P.O. Box 96864, 2509 JG, The Hague, The Netherlands c Section of Applied Geophysics, Delft University of Technology, Delft, The Netherlands ABSTRACT High detection performance is required for an operational system for the detection of landmines. Humanitarian de-mining scenarios, combined with inherent difficulties of detecting landmines on an operational (vibration, motion, atmosphere) as well as a scenario level (clutter, soil type, terrain), result in high levels of false alarms for most sensors. To distinguish a landmine from background clutter one or more discriminating object features have to be found. The research described here focuses on finding and evaluating one or more features to distinguish disk-shaped landmines from background clutter in infrared images. These images were taken under controlled conditions, with homogenous soil types. Two methods are considered to acquire shape-based features in the infrared imagery. The first method uses a variation of the Hough transformation to find circular shaped objects. The second method uses the tophat filter with a disk-shaped structuring element. Furthermore, Mahalanobis and Fisher based classifiers are used to combine these features. Keywords: landmine detection, infrared, Hough transform, tophat filter, feature selection 1. INTRODUCTION Thermal infrared cameras often are used to detect landmines. 1–3 In this paper we applied the Hough transform and the tophat filter to the IR images of surface laid and buried anti-personnel landmines. Both methods have been optimized with regard to three different cost functions, resulting in optimal working point selection. In addition a feature-based detection of the landmines is introduced. As features we used the results of the Hough transform and tophat filter as optimized for the three working points. The feature combination methods used are based on the Manahalobis distance and the Fisher mapping. Exhaustive search was applied to find the optimal feature combinations. In the next section the theoretical foundation is given for the various parts of the infrared landmine detection algorithms. Section 3 gives the experimental results obtained on the LOTUS data sets. Finally, conclusions and a discussion will be given. 2. THEORY Using thermal infrared images to detect landmines is based on the assumption that landmines have different thermal properties than their surrounding soil. 4 When an area is heated due to solar radiation, the landmines will warm up quicker than the soil. When a landmine is buried, the soil above it warms up quicker, because of the thermal properties of the landmine. The influence of the landmine on the temperature of the soil at surface level relates to the burial depth. This situation, where landmines give relatively warm spots at the surface, is called a situation with positive contrast. When an area is cooled (for instance some time after sunset) the situation is reversed. Landmines will cause cold spots at the surface and this situation is called to have negative contrast. As follows from the previous, the contrast of a particular moment in time is determined by meteorological factors and can therefore be predicted at the time of measurement with an appropriate thermal model. 5,6 So an indication for the presence of landmines is difference in local thermal contrast. However, there is a natural variation of thermal contrast due to inhomogeneities in the background (soil type variations, variations in soil height, other objects, etc.) The variations not caused by the presence of landmines are called clutter. To reduce the false alarms caused by clutter, Further author information: (Send correspondence to Klamer Schutte) Klamer Schutte: E-mail: [email protected] Phone: +31 70 374 0469 Fax: +31 70 374 0654
-
Upload
independent -
Category
Documents
-
view
1 -
download
0
Transcript of Feature-Based Detection of Landmines in Infrared Images

PreprintProc. SPIE Vol. 4742, Det. and Rem. Techn. for Mine and Minelike Targets VII, Orlando FL, USA, Apr. 2002 1
Feature-based detection of landmines in infrared images
Wilhelmus A. C. M. Messelinkab Klamer Schutteb, Albert M. Vossepoela
Frank Cremerbac, John G. M. Schavemakerb, Eric den Breejenb
aPattern Recognition Group, Delft University of Technology, Delft, The NetherlandsbTNO Physics and Electronics Laboratory, P.O. Box 96864, 2509 JG, The Hague, The Netherlands
cSection of Applied Geophysics, Delft University of Technology, Delft, The Netherlands
ABSTRACT
High detection performance is required for an operational system for the detection of landmines. Humanitarian de-miningscenarios, combined with inherent difficulties of detecting landmines on an operational (vibration, motion, atmosphere) as wellas a scenario level (clutter, soil type, terrain), result in high levels of false alarms for most sensors. To distinguish a landminefrom background clutter one or more discriminating object features have to be found.
The research described here focuses on finding and evaluating one or more features to distinguish disk-shaped landminesfrom background clutter in infrared images. These images were taken under controlled conditions, with homogenous soil types.
Two methods are considered to acquire shape-based features in the infrared imagery. The first method uses a variation of theHough transformation to find circular shaped objects. The second method uses the tophat filter with a disk-shaped structuringelement. Furthermore, Mahalanobis and Fisher based classifiers are used to combine these features.
Keywords: landmine detection, infrared, Hough transform, tophat filter, feature selection
1. INTRODUCTION
Thermal infrared cameras often are used to detect landmines.1–3 In this paper we applied the Hough transform and thetophat filter to the IR images of surface laid and buried anti-personnel landmines. Both methods have been optimized withregard to three different cost functions, resulting in optimal working point selection. In addition a feature-based detection ofthe landmines is introduced. As features we used the results of the Hough transform and tophat filter as optimized for thethree working points. The feature combination methods used are based on the Manahalobis distance and the Fisher mapping.Exhaustive search was applied to find the optimal feature combinations.
In the next section the theoretical foundation is given for the various parts of the infrared landmine detection algorithms.Section 3 gives the experimental results obtained on the LOTUS data sets. Finally, conclusions and a discussion will be given.
2. THEORY
Using thermal infrared images to detect landmines is based on the assumption that landmines have different thermal propertiesthan their surrounding soil.4 When an area is heated due to solar radiation, the landmines will warm up quicker than the soil.When a landmine is buried, the soil above it warms up quicker, because of the thermal properties of the landmine. The influenceof the landmine on the temperature of the soil at surface level relates to the burial depth. This situation, where landmines giverelatively warm spots at the surface, is called a situation with positive contrast.
When an area is cooled (for instance some time after sunset) the situation is reversed. Landmines will cause cold spots at thesurface and this situation is called to have negative contrast. As follows from the previous, the contrast of a particular momentin time is determined by meteorological factors and can therefore be predicted at the time of measurement with an appropriatethermal model.5,6
So an indication for the presence of landmines is difference in local thermal contrast. However, there is a natural variationof thermal contrast due to inhomogeneities in the background (soil type variations, variations in soil height, other objects,etc.) The variations not caused by the presence of landmines are called clutter. To reduce the false alarms caused by clutter,
Further author information: (Send correspondence to Klamer Schutte)Klamer Schutte: E-mail: [email protected] Phone: +31 70 374 0469 Fax: +31 70 374 0654

PreprintProc. SPIE Vol. 4742, Det. and Rem. Techn. for Mine and Minelike Targets VII, Orlando FL, USA, Apr. 2002 2
f f B
B
WTH(f)
Figure 1. An example of the Hough transform (a) and the tophat filter (b) and (c). For the Hough transform, the three arrowsdepict the orientation of the gradient of three points that have a magnitude of the gradient that is greater than the threshold level.If the gradients are oriented perpendicular to the circle through the points the lines drawn coincide in the center of the circle.For an 1D signal as shown in (b) the morphological opening is depicted by the gray area. The resulting white tophat filter isgiven in (c).
more information needs to be taken into account. The focus for this paper is be on shape features. The image features underinvestigation here are modified versions of the Hough transform and the tophat filter. These methods are implemented such thatthey result in confidence values. A confidence value is a monotonic increasing function of the probability of a landmine presentat it’s defined location. These confidence values are computed for both methods on a predefined spatial grid over the area underinvestigation.
The confidence levels are used to classify (landmine or background) the data by assigning grid cells with confidence valuesabove the detection-threshold,t, to the landmine class (D = M), and values below to the background (D = M̄ ). Increasing thethreshold reduces the number of false alarms, but also leads to a lower detection rate. The confidence values are subsequentlyused as input for a feature selection process
2.1. Hough transform
The Hough transform is a method to find shapes in images.7 The first step is to find the edges in the images. To find the edgesin the images, we use a Gaussian gradient filter.8 The Hough transform uses voting: each edge pixel gives a vote to each shapeit can be a part of. Each possible shape is represented by a bin in accumulator space, of which each dimension represents aparameter of the shape under investigation. When a bin in accumulator space acquires relatively many votes, the original imagecontains a shape with the corresponding parameters.
Since we are looking for disk-shaped landmines and have a vertical imaging geometry, the shape template used is a circle.For a disk-shaped landmine with positive contrast the gradient on its edge points towards the center of the landmine andsimultaneous the magnitude of this gradient is higher than the average magnitude of the gradient in the background.
We use this information to obtain the edge by thresholding the magnitude of the gradient. Next, in accumulator space weadd lines in the direction of the gradient (or in the opposite direction for negative contrast landmines). Where lines coincide thevalues are added.
The lines start at a certain distance from the edge points and have a finite length. These properties are determined by theminimum and maximum expected radii of the landmines. Furthermore, the value of the line is normalized as landmines withbigger radii are expected to have larger amounts of edge pixels. An example of this procedure is given in Figure 1(a).
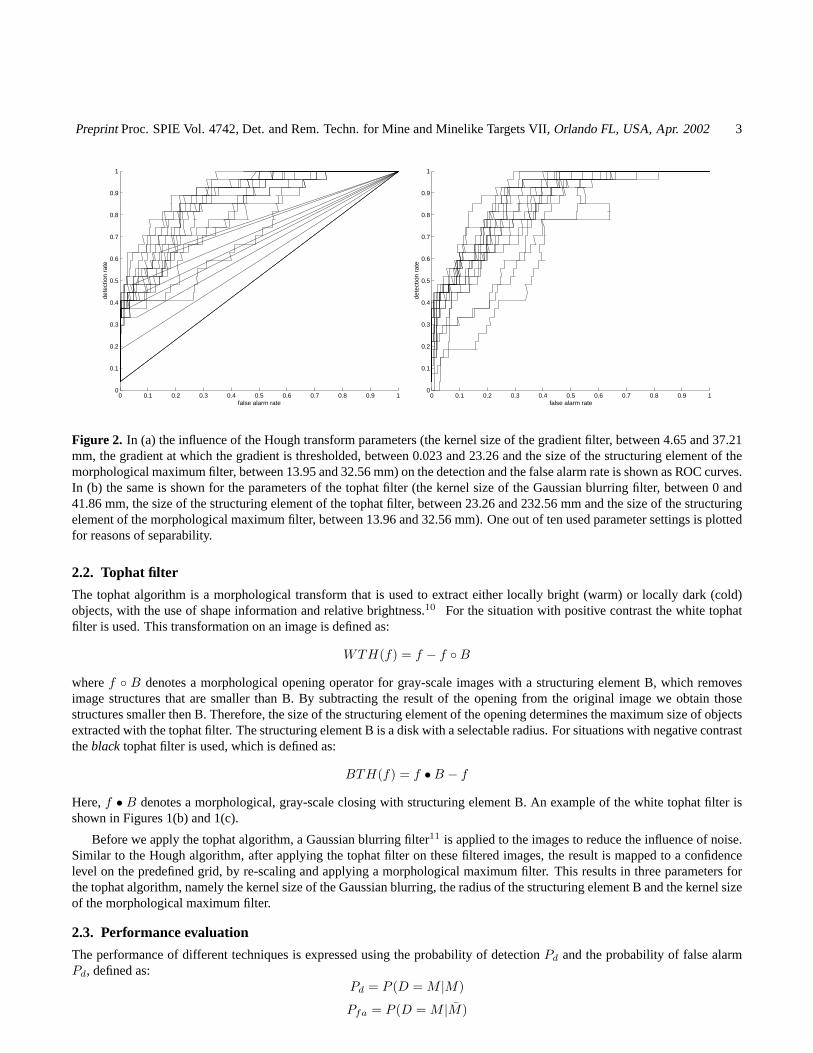
The resulting accumulator space is mapped to a confidence value on the desired grid. This is performed by spatially re-scaling the image while preserving local maximum, followed by a morphological maximum filter with a square structuringelement. The size of this filter is a parameter of this method. Other tunable parameters are the kernel size of the gradientfilter and the magnitude at which the gradient is thresholded. The detection threshold value is the final parameter needed toconvert confidence data into a detection decision. Each setting of those four parameters provides a certain number of detectedlandmines and false alarms. ROC curves, where the detection rate is plotted versus the false alarm rate,9 are shown in Figure 2where each point on each curve corresponds with a unique parameter setting. It can be seen that there exists no ROC curvewhich provides best performance for all points.
PreprintProc. SPIE Vol. 4742, Det. and Rem. Techn. for Mine and Minelike Targets VII, Orlando FL, USA, Apr. 2002 3
0 0.1 0.2 0.3 0.4 0.5 0.6 0.7 0.8 0.9 10
0.1
0.2
0.3
0.4
0.5
0.6
0.7
0.8
0.9
1
false alarm rate
dete
ctio
n ra
te
0 0.1 0.2 0.3 0.4 0.5 0.6 0.7 0.8 0.9 10
0.1
0.2
0.3
0.4
0.5
0.6
0.7
0.8
0.9
1
false alarm rate
dete
ctio
n ra
te
Figure 2. In (a) the influence of the Hough transform parameters (the kernel size of the gradient filter, between 4.65 and 37.21mm, the gradient at which the gradient is thresholded, between 0.023 and 23.26 and the size of the structuring element of themorphological maximum filter, between 13.95 and 32.56 mm) on the detection and the false alarm rate is shown as ROC curves.In (b) the same is shown for the parameters of the tophat filter (the kernel size of the Gaussian blurring filter, between 0 and41.86 mm, the size of the structuring element of the tophat filter, between 23.26 and 232.56 mm and the size of the structuringelement of the morphological maximum filter, between 13.96 and 32.56 mm). One out of ten used parameter settings is plottedfor reasons of separability.
2.2. Tophat filter
The tophat algorithm is a morphological transform that is used to extract either locally bright (warm) or locally dark (cold)objects, with the use of shape information and relative brightness.10 For the situation with positive contrast the white tophatfilter is used. This transformation on an image is defined as:
WTH(f) = f − f ◦B
wheref ◦ B denotes a morphological opening operator for gray-scale images with a structuring element B, which removesimage structures that are smaller than B. By subtracting the result of the opening from the original image we obtain thosestructures smaller then B. Therefore, the size of the structuring element of the opening determines the maximum size of objectsextracted with the tophat filter. The structuring element B is a disk with a selectable radius. For situations with negative contrasttheblack tophat filter is used, which is defined as:
BTH(f) = f •B − f
Here,f • B denotes a morphological, gray-scale closing with structuring element B. An example of the white tophat filter isshown in Figures 1(b) and 1(c).
Before we apply the tophat algorithm, a Gaussian blurring filter11 is applied to the images to reduce the influence of noise.Similar to the Hough algorithm, after applying the tophat filter on these filtered images, the result is mapped to a confidencelevel on the predefined grid, by re-scaling and applying a morphological maximum filter. This results in three parameters forthe tophat algorithm, namely the kernel size of the Gaussian blurring, the radius of the structuring element B and the kernel sizeof the morphological maximum filter.
2.3. Performance evaluation
The performance of different techniques is expressed using the probability of detectionPd and the probability of false alarmPd, defined as:
Pd = P (D = M |M)
Pfa = P (D = M |M̄)
PreprintProc. SPIE Vol. 4742, Det. and Rem. Techn. for Mine and Minelike Targets VII, Orlando FL, USA, Apr. 2002 4
CountSCOOPs
CountSCOOPs
LabelledGroundTruth
Confidencemap
Threshold Clustering
Detection
Plus
Detectedmines
Falsealarms
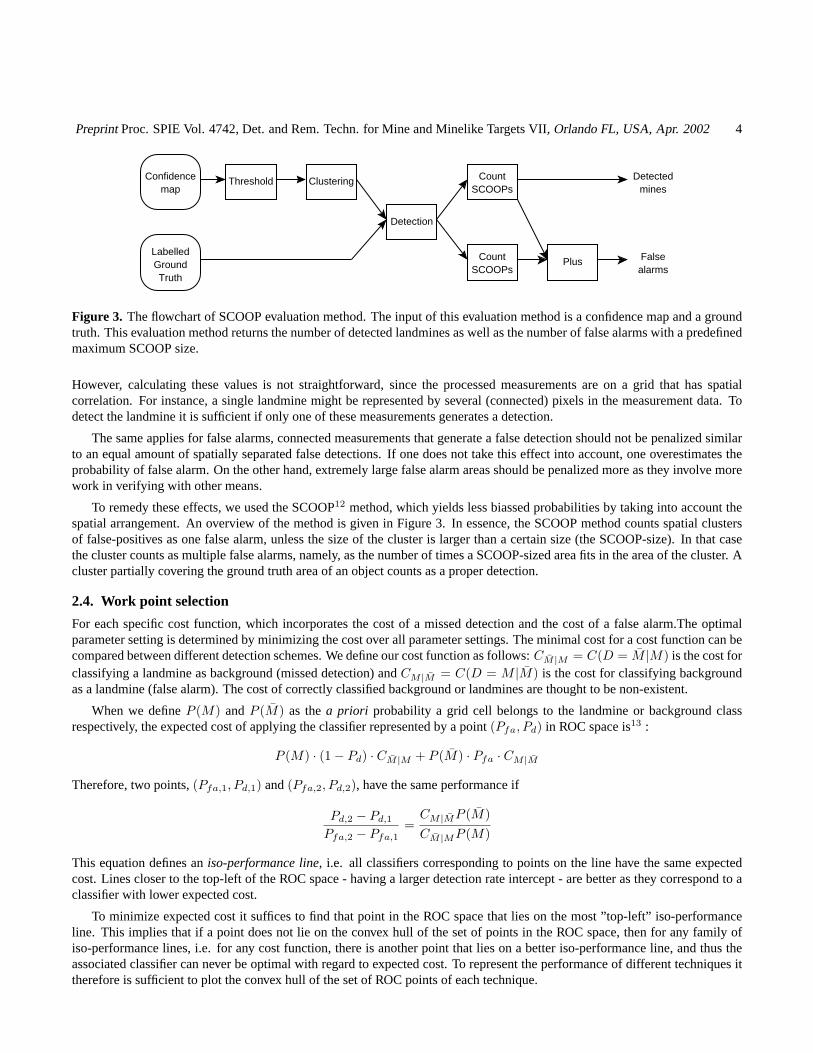
Figure 3. The flowchart of SCOOP evaluation method. The input of this evaluation method is a confidence map and a groundtruth. This evaluation method returns the number of detected landmines as well as the number of false alarms with a predefinedmaximum SCOOP size.
However, calculating these values is not straightforward, since the processed measurements are on a grid that has spatialcorrelation. For instance, a single landmine might be represented by several (connected) pixels in the measurement data. Todetect the landmine it is sufficient if only one of these measurements generates a detection.
The same applies for false alarms, connected measurements that generate a false detection should not be penalized similarto an equal amount of spatially separated false detections. If one does not take this effect into account, one overestimates theprobability of false alarm. On the other hand, extremely large false alarm areas should be penalized more as they involve morework in verifying with other means.
To remedy these effects, we used the SCOOP12 method, which yields less biassed probabilities by taking into account thespatial arrangement. An overview of the method is given in Figure 3. In essence, the SCOOP method counts spatial clustersof false-positives as one false alarm, unless the size of the cluster is larger than a certain size (the SCOOP-size). In that casethe cluster counts as multiple false alarms, namely, as the number of times a SCOOP-sized area fits in the area of the cluster. Acluster partially covering the ground truth area of an object counts as a proper detection.
2.4. Work point selection
For each specific cost function, which incorporates the cost of a missed detection and the cost of a false alarm.The optimalparameter setting is determined by minimizing the cost over all parameter settings. The minimal cost for a cost function can becompared between different detection schemes. We define our cost function as follows:CM̄ |M = C(D = M̄ |M) is the cost forclassifying a landmine as background (missed detection) andCM |M̄ = C(D = M |M̄) is the cost for classifying backgroundas a landmine (false alarm). The cost of correctly classified background or landmines are thought to be non-existent.
When we defineP (M) andP (M̄) as thea priori probability a grid cell belongs to the landmine or background classrespectively, the expected cost of applying the classifier represented by a point(Pfa, Pd) in ROC space is13 :
P (M) · (1− Pd) · CM̄ |M + P (M̄) · Pfa · CM |M̄
Therefore, two points,(Pfa,1, Pd,1) and(Pfa,2, Pd,2), have the same performance if
Pd,2 − Pd,1
Pfa,2 − Pfa,1=
CM |M̄P (M̄)CM̄ |MP (M)
This equation defines aniso-performance line, i.e. all classifiers corresponding to points on the line have the same expectedcost. Lines closer to the top-left of the ROC space - having a larger detection rate intercept - are better as they correspond to aclassifier with lower expected cost.
To minimize expected cost it suffices to find that point in the ROC space that lies on the most ”top-left” iso-performanceline. This implies that if a point does not lie on the convex hull of the set of points in the ROC space, then for any family ofiso-performance lines, i.e. for any cost function, there is another point that lies on a better iso-performance line, and thus theassociated classifier can never be optimal with regard to expected cost. To represent the performance of different techniques ittherefore is sufficient to plot the convex hull of the set of ROC points of each technique.
PreprintProc. SPIE Vol. 4742, Det. and Rem. Techn. for Mine and Minelike Targets VII, Orlando FL, USA, Apr. 2002 5
Feature selectionCost functions
Training data
Parameters
TophatHough
Feature 6Feature 5Feature 4
Parameters
Feature 3Feature 2Feature 1
Cost functions Cost functions
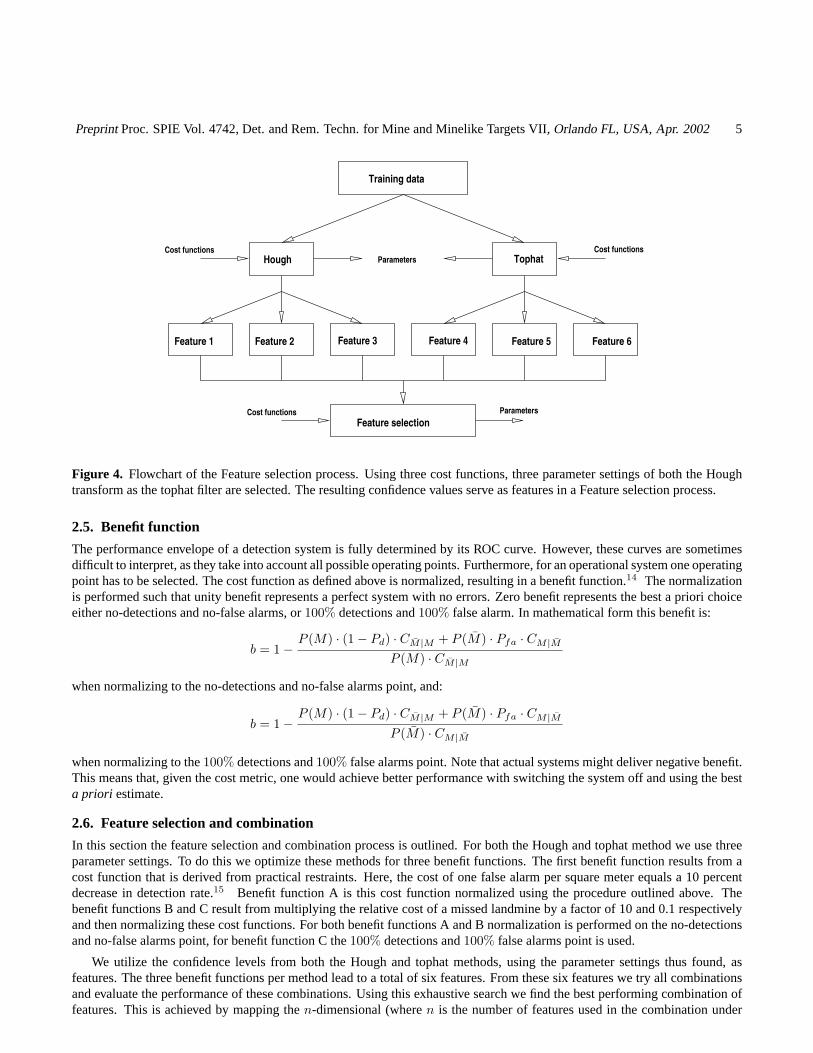
Figure 4. Flowchart of the Feature selection process. Using three cost functions, three parameter settings of both the Houghtransform as the tophat filter are selected. The resulting confidence values serve as features in a Feature selection process.
2.5. Benefit function
The performance envelope of a detection system is fully determined by its ROC curve. However, these curves are sometimesdifficult to interpret, as they take into account all possible operating points. Furthermore, for an operational system one operatingpoint has to be selected. The cost function as defined above is normalized, resulting in a benefit function.14 The normalizationis performed such that unity benefit represents a perfect system with no errors. Zero benefit represents the best a priori choiceeither no-detections and no-false alarms, or100% detections and100% false alarm. In mathematical form this benefit is:
b = 1− P (M) · (1− Pd) · CM̄ |M + P (M̄) · Pfa · CM |M̄P (M) · CM̄ |M
when normalizing to the no-detections and no-false alarms point, and:
b = 1− P (M) · (1− Pd) · CM̄ |M + P (M̄) · Pfa · CM |M̄P (M̄) · CM |M̄
when normalizing to the100% detections and100% false alarms point. Note that actual systems might deliver negative benefit.This means that, given the cost metric, one would achieve better performance with switching the system off and using the besta priori estimate.
2.6. Feature selection and combination
In this section the feature selection and combination process is outlined. For both the Hough and tophat method we use threeparameter settings. To do this we optimize these methods for three benefit functions. The first benefit function results from acost function that is derived from practical restraints. Here, the cost of one false alarm per square meter equals a 10 percentdecrease in detection rate.15 Benefit function A is this cost function normalized using the procedure outlined above. Thebenefit functions B and C result from multiplying the relative cost of a missed landmine by a factor of 10 and 0.1 respectivelyand then normalizing these cost functions. For both benefit functions A and B normalization is performed on the no-detectionsand no-false alarms point, for benefit function C the100% detections and100% false alarms point is used.
We utilize the confidence levels from both the Hough and tophat methods, using the parameter settings thus found, asfeatures. The three benefit functions per method lead to a total of six features. From these six features we try all combinationsand evaluate the performance of these combinations. Using this exhaustive search we find the best performing combination offeatures. This is achieved by mapping then-dimensional (wheren is the number of features used in the combination under

PreprintProc. SPIE Vol. 4742, Det. and Rem. Techn. for Mine and Minelike Targets VII, Orlando FL, USA, Apr. 2002 6
Select Mine Representatives
Select Combination
Mahalanobis Distances
Class Properties
(a)
Select Combination
Fisher Probability
Fisher Mapping
Select Mine Representatives
(b)
Figure 5. Flowcharts of the Mahalanobis (a) and Fisher (b) combination methods
investigation) feature space onto an one dimensional confidence level, comparable to that of the Hough and tophat methods.An overview is shown in Figure 4. Two mapping methods are considered, Mahalanobis distances and Fisher probabilities.
Because there is a small uncertainty in the position of the landmines in the training data, the ground truth for each landmineencompasses a larger area then the actual area of the landmines. This means that in the ground truth some grid cells areincorrectly labelled as landmine. This leads to an error in the estimated parameters of the distribution of the landmine class,used by both the Mahanalobis and Fisher classifiers. To improve the estimates of the parameters of the landmine class wecondense the training data for each landmine to one point, namely that grid cell providing the highest confidence level. Usingthis reduced set of training data, the parameters of this distribution of the landmine class are recalculated, leading to newconfidence levels. With these new confidence values, again a new representing point for each landmine is computed, leading toan iterative process in which an optimal estimation of the parameters of the distribution of the landmine class are obtained. Anoverview of this method is shown in Figure 5(a) and 5(b).
2.6.1. Mahalanobis distances
Using labelled data, the two classes (background and landmines) are modelled as normally distributed and the parameters (meanand covariance) are estimated. Using these parameters the Mahalanobis16 distances to each class mean can be computed foreach point in the feature space. We define the resulting confidence level for a grid cell as the distance to the background classdivided by the distance to the landmine class.
2.6.2. Fisher mapping
The second mapping under consideration is the based on the Fisher mapping.16 Using Fisher mapping a linear classifieris produced utilizing the training data. This classifier gives us an estimation of the probability that a grid cell belongs tothe landmine class. These probabilities are the output confidence levels of the mapping. One of the difference between theMahalanobis distance and the Fisher mapping is that the latter can use a single feature values as it’s resulting confidence values.
3. EXPERIMENTAL RESULTS
3.1. Description of the data used
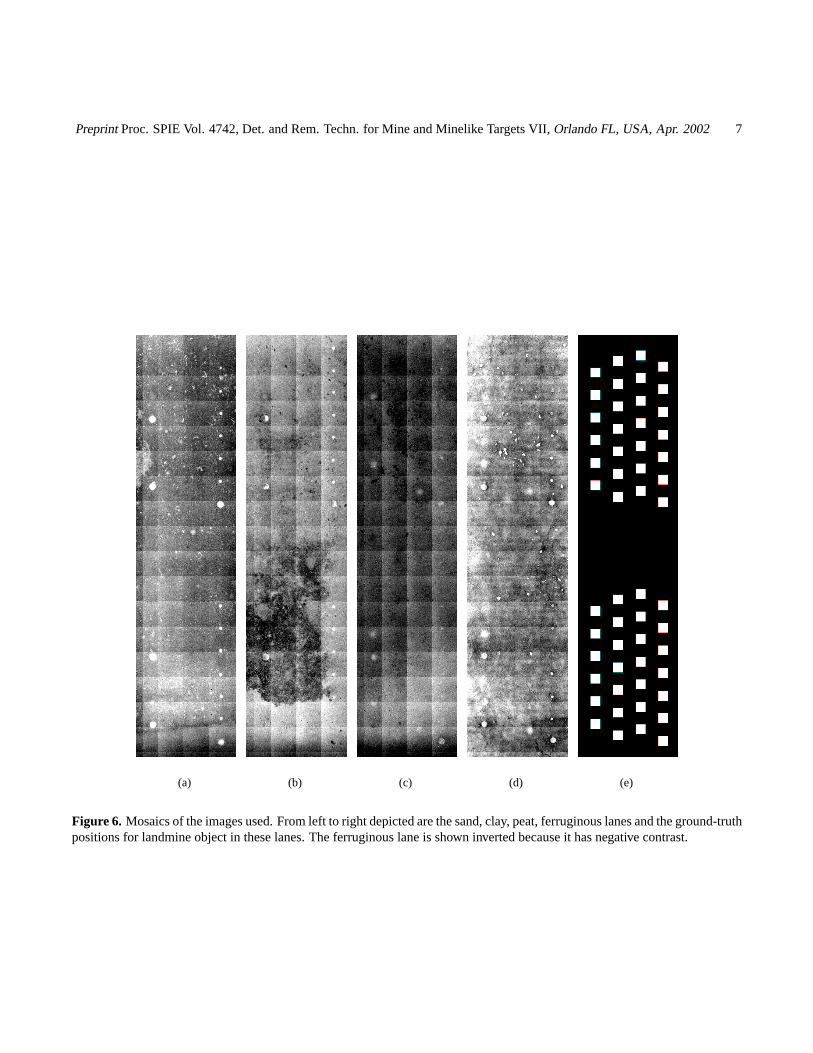
The test facility1 used in the experiments is located outdoors and consist of multiple lanes, measuring3 × 10 m2, with each adifferent soil type. We used data recorded on four of the six lanes: the sand, clay, peat and ferruginous ones, shown in Figure 6.The use of the TNO-FEL test lanes ensure constant soil type and ground water level within each of these lanes. The data usedin this experiment was recorded in January 2001 with an Radiance HS camera. This camera operates in the midwave infraredband (MWIR) and has a focal plane array of256× 256 pixels2. The imaging geometry used resulted in pixels of4.65 mm2 onthe ground. For the for surface laid landmines, the meteorological conditions and time of day during image capture resulted in
PreprintProc. SPIE Vol. 4742, Det. and Rem. Techn. for Mine and Minelike Targets VII, Orlando FL, USA, Apr. 2002 7
(a) (b) (c) (d) (e)
Figure 6. Mosaics of the images used. From left to right depicted are the sand, clay, peat, ferruginous lanes and the ground-truthpositions for landmine object in these lanes. The ferruginous lane is shown inverted because it has negative contrast.
PreprintProc. SPIE Vol. 4742, Det. and Rem. Techn. for Mine and Minelike Targets VII, Orlando FL, USA, Apr. 2002 8
(a) (b) (c) (d) (e)
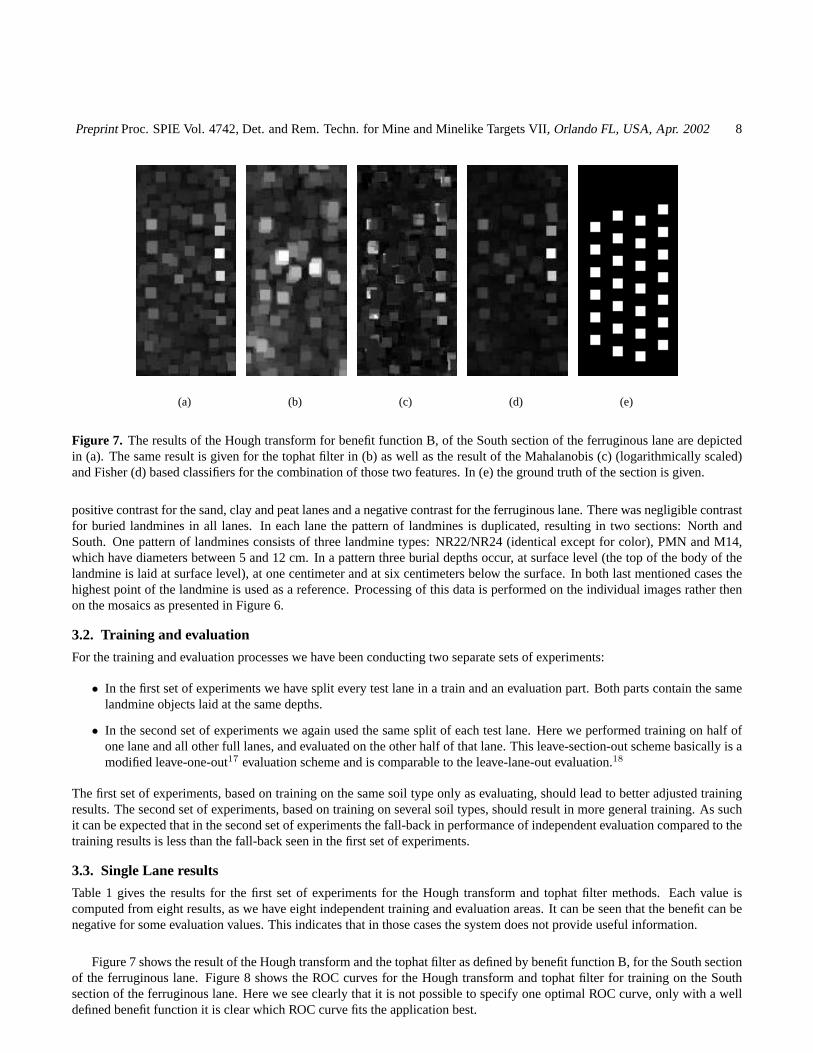
Figure 7. The results of the Hough transform for benefit function B, of the South section of the ferruginous lane are depictedin (a). The same result is given for the tophat filter in (b) as well as the result of the Mahalanobis (c) (logarithmically scaled)and Fisher (d) based classifiers for the combination of those two features. In (e) the ground truth of the section is given.
positive contrast for the sand, clay and peat lanes and a negative contrast for the ferruginous lane. There was negligible contrastfor buried landmines in all lanes. In each lane the pattern of landmines is duplicated, resulting in two sections: North andSouth. One pattern of landmines consists of three landmine types: NR22/NR24 (identical except for color), PMN and M14,which have diameters between 5 and 12 cm. In a pattern three burial depths occur, at surface level (the top of the body of thelandmine is laid at surface level), at one centimeter and at six centimeters below the surface. In both last mentioned cases thehighest point of the landmine is used as a reference. Processing of this data is performed on the individual images rather thenon the mosaics as presented in Figure 6.
3.2. Training and evaluation
For the training and evaluation processes we have been conducting two separate sets of experiments:
• In the first set of experiments we have split every test lane in a train and an evaluation part. Both parts contain the samelandmine objects laid at the same depths.
• In the second set of experiments we again used the same split of each test lane. Here we performed training on half ofone lane and all other full lanes, and evaluated on the other half of that lane. This leave-section-out scheme basically is amodified leave-one-out17 evaluation scheme and is comparable to the leave-lane-out evaluation.18
The first set of experiments, based on training on the same soil type only as evaluating, should lead to better adjusted trainingresults. The second set of experiments, based on training on several soil types, should result in more general training. As suchit can be expected that in the second set of experiments the fall-back in performance of independent evaluation compared to thetraining results is less than the fall-back seen in the first set of experiments.
3.3. Single Lane results
Table 1 gives the results for the first set of experiments for the Hough transform and tophat filter methods. Each value iscomputed from eight results, as we have eight independent training and evaluation areas. It can be seen that the benefit can benegative for some evaluation values. This indicates that in those cases the system does not provide useful information.
Figure 7 shows the result of the Hough transform and the tophat filter as defined by benefit function B, for the South sectionof the ferruginous lane. Figure 8 shows the ROC curves for the Hough transform and tophat filter for training on the Southsection of the ferruginous lane. Here we see clearly that it is not possible to specify one optimal ROC curve, only with a welldefined benefit function it is clear which ROC curve fits the application best.

PreprintProc. SPIE Vol. 4742, Det. and Rem. Techn. for Mine and Minelike Targets VII, Orlando FL, USA, Apr. 2002 9
0 0.05 0.1 0.15 0.2 0.25 0.3 0.35 0.4 0.45 0.50
0.1
0.2
0.3
0.4
0.5
0.6
0.7
0.8
0.9
1
false alarm rate
dete
ctio
n ra
te
A B
C
0 0.05 0.1 0.15 0.2 0.25 0.3 0.35 0.4 0.45 0.50
0.1
0.2
0.3
0.4
0.5
0.6
0.7
0.8
0.9
1
false alarm rate
dete
ctio
n ra
te
A
B
C
Figure 8. The optimal ROC curves of the Hough (a) transform and tophat (b) filter for the South section of the ferruginouslane. Also plotted are the iso-benefit lines for benefit functions A, B, and C touching at the optimal working point.
Table 1 also shows the results for the first set of experiments for the Mahalanobis feature selection method. It can beseen that the Mahalanobis feature selection method leads to less performance compared to the single feature performances.We believe this is the result of the fact that the Mahalanobis distance metric models the probability density function as aGaussian function. The confidence values as produced by our Hough transform and tophat filter do not have a median valuewhich represents maximum confidence for a landmine object, but instead increasing higher values represent increasing higherconfidence. This means that scarce very high confidence value is erroneously considered ’background’ by the Mahalanobisclassifier while correctly be considered ’foreground’ by the single feature threshold-based classifiers.
Also in Table 1 the results are given for the Fisher feature selection method. In contrast to the Mahalanobis method theFisher method equals for all classifiers at least the single feature performances. In Table 1 also the number of features used forthe optimal classifiers based on the Fisher metrics are shown. Here it can be seen that for many classifiers the Fisher metricselects only a single feature. Also, for those cases where multiple features are selected at least one of the selected featuresrepresents either the Hough transform or the tophat filter result for that same benefit function. In Figure 9 shows a scatter plotfor the confidence levels as produced by the optimal Hough transform and tophat filter for benefit function B and their detectionthresholds for the South section of the ferruginous lane. Also in this figure the results of the Mahalanobis and Fisher basedclassifiers are given.
3.4. Leave-section-out results
The Table 2 gives the performance in terms of benefit numbers for the second training and evaluation method. We see that theperformance for the training sections is less than for the first set of experiments. This is logical as training has to be performedover a more diverse data set, leading to algorithms trained for generic object features rather than specifics of individual trainingobjects. This is verified by the evaluation results: even though the training has been performed on soil types including othersthan the evaluation soil type, the fall-back in performance between training and evaluation is significant less compared to thefirst set of experiments. Especially for some classifiers we saw a huge performance decrease for the first set of experiments wenow see only a moderate performance decreases. In Table 2 the number of features that are used for the optimal classifiers forthe second experiments set based on the Fisher criterion are also shown.
4. CONCLUSIONS AND DISCUSSION
A large performance decrease can be observed between detection results as achieved on the training sets and those achieved onthe independent evaluation sets. This indicates that the size of the training set is not sufficiently large to be representative of thefull statistics of the phenomena encountered in the out-door test lanes. Considering the dimensions of the training set one canquestion the feasibility of a generalized classification system.

PreprintProc. SPIE Vol. 4742, Det. and Rem. Techn. for Mine and Minelike Targets VII, Orlando FL, USA, Apr. 2002 10
0.4 0.6 0.8 1 1.2 1.4 1.6 1.8 2 2.2 2.40
1
2
3
4
5
6
7
8
9
10
0.4 0.6 0.8 1 1.2 1.4 1.6 1.8 2 2.2 2.41
2
3
4
5
6
7
8
9
10
0.4 0.6 0.8 1 1.2 1.4 1.6 1.8 2 2.2 2.41
2
3
4
5
6
7
8
9
10
Figure 9. A scatter plot of the confidence values for the South section of the ferruginous lane as produced by the optimalHough transform and tophat filter for benefit function B is given in (a), including the threshold values as found for the individualfeatures. In (b) the ellipses representing the covariances of the Mahalanobis classifier using these two features is overlaid on thescatter plot of the background and selected landmine representations for the Mahalanobis distance. In (c) is plotted the decisionline for the Fisher discriminant for these features overlaid on the scatter plot of background and Fisher landmine representations.
It also means that, although we only train with four free parameters for both the Hough transform and the tophat filter, wehave too much free parameters in our algorithms, leading to training to specifics of the objects in the data set rather then trainingto the generics of the image forming process of the objects and backgrounds under study.
The classifier based on the Mahalanobis distance often performs less than classification using the confidence levels of eitherthe Hough transform or the tophat filter. We expect this to be related to the erroneous assumption within the Mahalanobisdistance that the confidence levels are Gaussian distributed for both foreground and background class.
The Fisher linear discriminant equals or outperform the individual detectors on the training sets. This is not surprisingas using a single of the decision levels thresholded by the individual detectors can be used as the only input to Fisher lineardiscriminant, which on a single input feature also acts as a threshold. As such the Fisher linear discriminant is a superset of theindividual detectors.
In the comparison between the first and the second set of experiments it can be seen that, although the benefit values for theevaluation are lower than those in the first set of experiments, the fall-back in performance for the second set of experimentsis much lower. Where in the first set of experiments the benefit for the evaluation result often was negative (indicating thatthe method does not add value), the second set of experiments in majority shows positive evaluation benefits. This means thatextending the training set with less representative training data did result in more robust evaluation results.
For the benefit function B, and to a lesser extend for benefit functions A and C, the performance of the leave-section-outmethod is lower. This is explained by the fact that the parameterization used is not normalized for each lane.
For both the Hough transform and the tophat filter, there is not one parameter setting that has optimal benefit for all benefitfunctions.
5. RECOMMENDATIONS
This fall-back in performance observed between training and evaluation probably is related to the optimization method utilized.In these experiments we selected those parameters having the optimal performance on the training set. Instead a scheme couldbe followed where the complete data set is separated into a training, selection and evaluation set. Then training can be done onthe training set, selection of best parameters on the selection set, and independent evaluation of the result on the evaluation set.We expect that this will lead to more robust parameter settings.
The methodology used in this paper to condense the grid cells labelled foreground in the ground truth to true object repre-sentatives isad hocand does not necessarily lead to optimal trained classifiers.
To improve the performance of the leave-section-out method it is suggested to use a parameterization that is normalized forsoil type and meteorological conditions.

PreprintProc. SPIE Vol. 4742, Det. and Rem. Techn. for Mine and Minelike Targets VII, Orlando FL, USA, Apr. 2002 11
Benefit function A Benefit function B Benefit function Ctraining evaluation training evaluation training evaluation
Hough Average 0.65030 0.32507 0.43320 -0.36376 0.77508 -0.31595St. Dev. 0.05026 0.21676 0.05710 0.87761 0.04794 0.88877
Tophat Average 0.66501 0.41601 0.39153 -0.97553 0.75732 0.00978St. Dev. 0.02978 0.09855 0.10182 1.91764 0.04664 0.63708
Mahalanobis Average 0.65493 0.33383 0.38690 -1.09821 0.75383 -0.06293St. Dev. 0.06518 0.16687 0.07991 1.96847 0.06685 0.86961
Avg. Feat. 138 23
4 218
Fisher Average 0.68684 0.40526 0.47685 -0.87533 0.80445 -0.30161St. Dev. 0.04126 0.09639 0.06982 1.95314 0.03288 0.90281
Avg. Feat. 118 13
8 114
Table 1. Results for the different methods, for training and evaluation on a single lane. Shown are the average and standarddeviation of the benefit over the eight training and evaluation sets. For the two feature selection methods the average numberof features used in the combination with the most benefit is also shown.
Benefit function A Benefit function B Benefit function Ctraining evaluation training evaluation training evaluation
Hough Average 0.46495 0.37483 0.25761 0.15509 0.48615 0.27768St. Dev. 0.01420 0.09420 0.01521 0.17705 0.01110 0.29053
Tophat Average 0.43497 0.35847 0.18164 0.00661 0.49360 0.36769St. Dev. 0.01514 0.16692 0.02916 0.19513 0.02147 0.37464
Mahalanobis Average 0.45682 0.33003 0.02414 -0.03538 0.51860 0.41201St. Dev. 0.02215 0.11920 0.01279 0.13108 0.01834 0.12422
Avg. Feat. 178 41
4 2Fisher Average 0.46946 0.35880 0.25997 0.02943 0.51480 0.26531
St. Dev. 0.01673 0.11202 0.01753 0.34273 0.03370 0.15397Avg. Feat. 11
8 118 15
8
Table 2. Results for the different methods, for training on seven sections and evaluation on the left out section. Shown are theaverage and standard deviation of the benefit over the eight training and evaluation sets. For the two feature selection methodsthe average number of features used in the combination with the most benefit is also shown.
ACKNOWLEDGMENTS
This paper describes work partly funded by the European Commission as ESPRIT project LOTUS, number 29812.
We gratefully acknowledge the discussions in Task Group NATO RTO SET-035/RTG19 ”Systems Level Fusion for LandSurveillance” on usefull system evaluation methodologies.
REFERENCES
1. W. de Jong, H. A. Lensen, and Y. H. L. Janssen. Sophisticated test facility to detect land mines. In A. C. Dubey and J. F.Harvey, editors,Proc. SPIE Vol. 3710, Detection and Remediation Technologies for Mines and Minelike Targets IV, pages1409–1418, Orlando (FL), USA, Apr. 1999.
2. J. G. M. Schavemaker, F. Cremer, K. Schutte, and E. den Breejen. Infrared processing and sensor fusion for anti-personnelland-mine detection. InProceedings of IEEE Student Branch Eindhoven: Symposium Imaging, pages 61–71, Eindhoven,the Netherlands, May 2000.
3. J. G. M. Schavemaker, E. den Breejen, F. Cremer, K. Schutte, and K. W. Benoist. Depth fusion for anti-personnellandmine detection. In A. C. Dubey, J. F. Harvey, J. T. Broach, and V. George, editors,Proc. SPIE Vol. 4394, Detectionand Remediation Technologies for Mines and Minelike Targets VI, pages 1071–1081, Orlando (FL), USA, Apr. 2001.
4. Y. H. L. Janssen, A. N. de Jong, H. Winkel, and F. J. M. van Putten. Detection of surface laid and buried mines with IRand CCD cameras, an evalutation based on measurements. In A. C. Dubey, R. L. Barnard, and C. J. Lowe, editors,Proc.SPIE Vol. 2765, Detection and Remediation Technologies for Mines and Minelike Targets, pages 448–459, Orlando (FL),USA, Apr. 1996.

PreprintProc. SPIE Vol. 4742, Det. and Rem. Techn. for Mine and Minelike Targets VII, Orlando FL, USA, Apr. 2002 12
5. F. Cremer, W. de Jong, K. Schutte, J. T. Johnson, and B. A. Baertlein. Surface mine signature modeling for passive po-larimetric IR. In J. T. Broach, R. S. Harmon, and G. J. Dobeck, editors,Proc. SPIE Vol. 4742, Detection and RemediationTechnologies for Mines and Minelike Targets VII, Orlando (FL), USA, Apr. 2002.
6. S.-H. Hong, T. Miller, B. Borchers, J. M. H. Hendrickx, J. Simunek, H. A. Lensen, P. B. W. Schwering, and B. A.Baertlein. Landmine detection in bare soils using thermal infrared sensors. In J. T. Broach, R. S. Harmon, and G. J.Dobeck, editors,Proc. SPIE Vol. 4742, Detection and Remediation Technologies for Mines and Minelike Targets VII,Orlando (FL), USA, Apr. 2002.
7. V. Leavers.Shape Detection in Computer Vision Using the Hough Transform. Springer-Verlag, 1992.8. P. Verbeek and L. van Vliet. Estimators of 2D edge length and position, 3D surface area and position in sampeled grey-
valued images.BioImaging, 1(1):47–61, 1993.9. J. Egan.Signal Detection Theory and ROC analysis. Series in Cognition and Perception. Academic Press, 1975.
10. P. Soille.Morphologische Bildverarbeitung, Grundlagen, Methoden, Anwendungen. Springer, 1998.11. J. Damon. Properties of ridges and cores for 2-D images.Journal of Mathematical Imaging and Vision, 10(2):163–174,
1999.12. E. den Breejen, K. Schutte, and F. Cremer. Sensor fusion for anti personnel landmine detection, a case study. In A. C.
Dubey and J. F. Harvey, editors,Proc. SPIE Vol. 3710, Detection and Remediation Technologies for Mines and MinelikeTargets IV, pages 1235–1245, Orlando (FL), USA, Apr. 1999.
13. F. Provost and T. Fawcett. Robust classification systems for imprecise environments. pages 706–713, Madison (WI),USA, July 1998.
14. Final Report of NATO RTO SET-035/RTG19 ”Systems Level Fusion for Land Surveillance”. A method for evaluatingthe relative military benefit of sensor fusion. Technical report, NATO RTO, To be published 2002.
15. F. Cremer, K. Schutte, J. G. M. Schavemaker, and E. den Breejen. A comparision of decision-level sensor-fusion methodsfor anti-personnel landmine detection.Information Fusion, 2(3):187–208, Sept. 2001.
16. K. Fukunaga.Introduction to statistical pattern recognition. Academic press, Inc., Boston, USA, 2 edition, 1990.17. K. Fukunaga and D. Hummels. Estimation of classifier performance.IEEE, 11(10):1087–1101, 1989.18. F. Cremer, J. G. M. Schavemaker, E. den Breejen, and K. Schutte. Towards an operational sensor fusion system for
anti-personnel landmine detection. In A. C. Dubey, J. F. Harvey, J. T. Broach, and R. E. Dugan, editors,Proc. SPIE Vol.4038, Detection and Remediation Technologies for Mines and Minelike Targets V, pages 792–803, Orlando (FL), USA,Apr. 2000.