Feasibility Study and Impact of Daylight on Illumination ... - MDPI
22
sustainability Article Feasibility Study and Impact of Daylight on Illumination Control for Energy-Saving Lighting Systems Sulee Bunjongjit 1 and Atthapol Ngaopitakkul 2, * 1 Faculty of Engineering, Rajamangala University of Technology Rattanakosin, Nakhon Pathom 73170, Thailand; [email protected] 2 Faculty of Engineering, King Mongkut’s Institute of Technology Ladkrabang, Bangkok 10520, Thailand * Correspondence: [email protected]; Tel.: +66-(0)2-329-8330 Received: 31 August 2018; Accepted: 31 October 2018; Published: 7 November 2018 Abstract: The main goal of energy conservation should be reducing the consumption of energy resources. Due to energy and environmental concerns in recent years, to reduce energy consumption in a lighting system, which has been one of the prime targets of energy saving, daylighting has been investigated and has become one of the energy-efficiency techniques widely applied in buildings. This paper presents an analysis of T5 fluorescent luminaire lighting control using daylight in a building. The study is conducted in two parts; simulation of a lecture room using the daylighting function of the DIALux program is performed to estimate the effect of daylighting on a task area (workplane). Another part is an experimental setup to evaluate the performance of a lighting control unit that is installed for a T5 fluorescent luminaire with a dimmable electronic ballast. The efficiency of the lighting control in term of illumination on the task area and energy consumption are also evaluated and compared with the standard case. The simulation results show that daylighting increases illuminance on a task area, especially on the window side, so the lighting system can significantly reduce its power consumption compared with a standard case (without lighting control). The experimental result shows that upon installing the lighting control with daylighting, both the average illuminance and the energy consumption in each time period are decreased compared with in the standard case. Lighting control with daylighting tries to set the average illuminance on a task area to less than 500 lux, corresponding to the amount of daylight passing through window shutters. The obtained results are useful for the design of a T5 fluorescent luminaire with lighting control using daylighting in a building lighting system for energy efficiency and reducing energy consumption, including the average illuminance on the task area, according to a relevant standard. Keywords: energy savings; fluorescent lamp; daylight; illuminance; lighting system 1. Introduction In past decade, energy has become an important issue in many countries due to the rapid increase of population and economic growth. Considering a developing country, Thailand is changing from an agrarian country to an industrial country with a large industrial sector. Industrial countries need steady supplies of energy to support their industrial sector and ensure economic growth. Energy statistics of Thailand from the Energy Policy and Planning Office (EPPO) under Thailand’s Ministry of Energy [1,2], show that the energy demand has continuously increased. According to a study on the future energy consumption in Thailand over the next 20 years [3] under a business-as-usual (BAU) scenario, the Gross Domestic Product (GDP) will grow at annual average rate of 4.2% and the population will grow at an annual average rate of 0.3%; the energy demand during this period Sustainability 2018, 10, 4075; doi:10.3390/su10114075 www.mdpi.com/journal/sustainability
-
Upload
khangminh22 -
Category
Documents
-
view
0 -
download
0
Transcript of Feasibility Study and Impact of Daylight on Illumination ... - MDPI

sustainability
Article
Feasibility Study and Impact of Daylight onIllumination Control for Energy-SavingLighting Systems
Sulee Bunjongjit 1 and Atthapol Ngaopitakkul 2,*1 Faculty of Engineering, Rajamangala University of Technology Rattanakosin,
Nakhon Pathom 73170, Thailand; [email protected] Faculty of Engineering, King Mongkut’s Institute of Technology Ladkrabang, Bangkok 10520, Thailand* Correspondence: [email protected]; Tel.: +66-(0)2-329-8330
Received: 31 August 2018; Accepted: 31 October 2018; Published: 7 November 2018�����������������
Abstract: The main goal of energy conservation should be reducing the consumption of energyresources. Due to energy and environmental concerns in recent years, to reduce energy consumptionin a lighting system, which has been one of the prime targets of energy saving, daylighting has beeninvestigated and has become one of the energy-efficiency techniques widely applied in buildings.This paper presents an analysis of T5 fluorescent luminaire lighting control using daylight in abuilding. The study is conducted in two parts; simulation of a lecture room using the daylightingfunction of the DIALux program is performed to estimate the effect of daylighting on a task area(workplane). Another part is an experimental setup to evaluate the performance of a lighting controlunit that is installed for a T5 fluorescent luminaire with a dimmable electronic ballast. The efficiencyof the lighting control in term of illumination on the task area and energy consumption are alsoevaluated and compared with the standard case. The simulation results show that daylightingincreases illuminance on a task area, especially on the window side, so the lighting system cansignificantly reduce its power consumption compared with a standard case (without lighting control).The experimental result shows that upon installing the lighting control with daylighting, both theaverage illuminance and the energy consumption in each time period are decreased compared within the standard case. Lighting control with daylighting tries to set the average illuminance on a taskarea to less than 500 lux, corresponding to the amount of daylight passing through window shutters.The obtained results are useful for the design of a T5 fluorescent luminaire with lighting control usingdaylighting in a building lighting system for energy efficiency and reducing energy consumption,including the average illuminance on the task area, according to a relevant standard.
Keywords: energy savings; fluorescent lamp; daylight; illuminance; lighting system
1. Introduction
In past decade, energy has become an important issue in many countries due to the rapid increaseof population and economic growth. Considering a developing country, Thailand is changing froman agrarian country to an industrial country with a large industrial sector. Industrial countries needsteady supplies of energy to support their industrial sector and ensure economic growth. Energystatistics of Thailand from the Energy Policy and Planning Office (EPPO) under Thailand’s Ministryof Energy [1,2], show that the energy demand has continuously increased. According to a studyon the future energy consumption in Thailand over the next 20 years [3] under a business-as-usual(BAU) scenario, the Gross Domestic Product (GDP) will grow at annual average rate of 4.2% andthe population will grow at an annual average rate of 0.3%; the energy demand during this period
Sustainability 2018, 10, 4075; doi:10.3390/su10114075 www.mdpi.com/journal/sustainability

Sustainability 2018, 10, 4075 2 of 22
is forecasted to increase annually by an average of 3.9%. The energy consumption in the year 2030will rise to 151,000 ktoe, or 2.1 times the current. Hence, greenhouse gas emissions from the energysector will tend to increase accordingly. However, based on historical energy data [1] and a statisticalreview [2] as shown in Table 1, the growth of energy consumption in the business and residentialsectors considerably surpassed the economic growth. The increasing usage of energy in various sectorsdiscussed above will cause energy shortages in the near future due to the depletion of fossil fuel.To prevent energy shortages and increase the energy efficiency of the country, the government has setan objective to reduce energy usage by decreasing the energy intensity (EI) by 30% in the next 30 yearsaccording to the Energy Efficiency Plan (EEP 2015) [3].
Table 1. Electricity consumption for the whole country (classified by sector) [1].
Year Residential(GWh)
SmallGeneralService(GWh)
Business(GWh)
Industrial(GWh)
Governmentand
Non-Profit(GWh)
Agriculture(GWh)
Other(GWh)
Total(GWh)
Free ofCharge(GWh)
GrandTotal
(GWh)
2015 41,286 42,466 83,984 179 387 3789 172,090 2743 174,833 41,2862016 43,932 44,639 86,878 201 267 3967 179,885 2963 182,847 43,9322017 44,374 45,100 87,772 198 298 4247 181,989 3135 185,124 44,374
Growth Rate (%)
2016 6.41 5.12 3.45 12.40 −30.87 4.70 4.53 7.99 4.58 6.412017 1.01 1.03 1.03 −1.66 11.56 7.07 1.17 5.81 1.25 1.01
In Thailand, lighting accounts for approximately 24% of the commercial sector’s electricity use,8% of the residential sector use and 10% of the industrial sector use. Of this lighting energy use,approximately 70–80% is from fluorescent lighting. Fluorescent tubes have been used in Thailandfor many decades, particularly in the residential sector, due to the price of energy, financial andenvironmental concerns of the local population and the acceptability of the light output. In addition,Government also support replacement of T8 fluorescent luminaire to T5 fluorescent luminaire withhigher efficiency. The reason for LED tube types luminaire are not widely used in Thailand especiallyin residential sector due to price of LED tube is higher than fluorescent, this have a significant impacton customer choice. Another reason is T5 and LED provide similar lumen output and occupancy inresident sector are accustomed to feeling provide by fluorescent luminaire. Currently, Thailand isstill not able to achieve its energy conservation goals for the economical and efficient production anduse of energy and the production of highly efficient machinery and equipment and the materials forenergy conservation within the country. Thus, the Department of Alternative Energy Developmentand Efficiency has issued a draft of an Energy Conservation law to identify measurements to supervise,promote and assist in minimizing energy usage.
To reduce energy usage in building lighting systems, many methods can be implemented, such asreplacing older and inefficient equipment, implementing energy management technology and takingmeasurements to change the energy consumption behavior of occupants. One of such methodologyis lighting control. Lighting controls are an integral part of a lighting system. Lighting controlequipment is divided into two broad categories, on/off and dimming. Each category is subdividedinto two additional categories, manual and automatic. On/off controls simply turn lights on or off,while dimming controls permit the adjustment of lighting levels over a range. Daylighting is the useof natural light to illuminate a work area instead of using artificial light that consumes electricity.Some luminaires located in a daylight area can be dimmed or closed to reduce energy consumption.This control strategy results in significant reduction of energy usage in lighting system while maintainlighting quality from natural light.
This paper proposes the design and analysis of T5 fluorescent lighting control using daylight andits performance in term of energy consumption and illuminance. The research has been divided intotwo parts; simulation and experiment. A lecture room with T5 fluorescent luminaires and windowsthat allow daylight to pass through has been investigated and simulated using the daylighting function

Sustainability 2018, 10, 4075 3 of 22
in the DIALux program. This program was used to calculate the effect of daylighting on the workplanein terms of illuminance and energy consumption when using a T5 fluorescent luminaire withoutdaylight (as a base case) compared with cases of various periods of time. The performance of thelighting control unit has been evaluated using an experimental setup. The system voltage, currentand real power have been measured to indicate the power consumption of a T5 fluorescent luminaireand the performance of the lighting control unit. The average illuminance on the workplane hasalso been measured; this value is needed for a lighting control unit to set the light output accordingto standards [4]. The result from the experimental setup will be useful for designing and installinga daylighting system in a building to fully harvest natural light and increase the energy efficiencyin a lighting system. The paper is organized as follows: The literature review of the past researchin related field is presented in Section 2. Section 3 presents the simulation and illuminance results.Section 4 presents the experimental setup with the design of the test unit and result from actual fieldtest. The discussion of result and finding are presented in Section 5. Finally, the conclusions are givenin Section 6.
2. Literature Review
Literature review from past research and various case studies in related field to lighting systemand daylight control has been presented in this section. The energy consumption in the householdsector and buildings is reviewed, consisting of studies that aim to evaluate the energy consumptionand the potential to increase the energy efficiency through various technologies. Several researcharticles [5–37] proposes energy efficiency improvements that have been applied in various countries.The result is that the implementation of technology and novel methodologies in both the retrofitting ofexisting building and new construction projects can improve energy efficiency, save energy and lowerthe environmental impact. A survey study on households’ choices of lighting fuels has been performedin Kenya to evaluate the factors influencing the adoption of less carbon-intensive energy sources [6].In Reference [8], a study on energy performance and carbon emissions is reported for an urban districtin the city of Macau. The result suggests that there is a great potential for solar energy production,which would reduce carbon emissions by approximately 10%. The opportunities and challenges ofenergy efficiency in India are discussed in Reference [10]. This paper also suggests several key stepsthat the government can take to achieve energy efficiency. Another study in India has identified theproblem of energy regulation at the local level [12]. The study found that climate, building envelope,building materials, daylighting and HVAC are important factors to improving energy efficiencyin buildings. Energy efficiency measurement concepts are proposed for incorporation into India’sbuilding regulations for designing energy efficient residential buildings. Ref. [14] discusses the role ofconventional and renewable energy technologies that can be implemented in a green energy systemin Turkey. The residential building performance in different climate zones of Turkey is discussed inReference [15]. This research evaluated life cycle energy consumption and CO2 emissions using thelife cycle assessment (LCA) and life cycle cost (LCC) methods. The approach in this research can beapplied to both new designs and existing buildings. Energy-saving policies in both Japan and China forexisting buildings are discussed in Reference [17]. Both countries are facing several obstacles such ashigh transaction cost and a lack of innovation and awareness, which are very critical to reducing CO2
emissions in the building sector. Ref. [18] has proposed the retrofitting of existing buildings to achieveenergy efficiency by using conventional technologies such as improving insulation and retrofittingHVAC systems. The proper use of conventional technologies can achieve green building certificationwith less energy consumption and improved occupant satisfaction. The energy performance of theresidential sector in Spain has been investigated, as presented in Reference [20]. The results can be usedto prioritize energy conservation and help the government plan future policy. Ref. [21] investigatedthe effectiveness of energy efficiency measurements for different occupancy patterns. Less expensivemeasurements could generate similar savings to conservation devices, with the savings varying withthe occupancy pattern. Ref. [23] discusses the design, development and application of a model to

Sustainability 2018, 10, 4075 4 of 22
calculate energy consumption for lighting systems in the residential sector. Research in modellingenergy consumption in buildings is presented in Reference [24]. This method uses an agent-basedmodel, with important elements taken into account, and the results of the simulation can be usedfor building energy management. In Reference [25], a model is simulated to quantify residentialpeak demand. The model has been used to evaluate energy demand reduction using energy savingsmeasurements. The results from the simulation indicate that the most effective countermeasureis turning off lights. A model that estimates the energy demand in the residential sector usingartificial neural network is proposed in Reference [26]. Uncertainties in building energy consumptionintroduced by building operations and weather were addressed using a simulation approach for acommercial office building [27]. The models include all energy-consuming activities such as heating,cooling, lighting and other appliances inside the residential units. A feasibility study on renewableenergy options in buildings is presented in Reference [28]. The results from the study indicate thatthe use of solar thermal power for hot water and space heating is the most cost-effective, while solarPV is suitable for demand-side management. One renewable energy application in buildings isbuilding-integrated photovoltaics (BIPVs), which is proposed in Reference [29]. Research in HongKong also applied a BIPV system in a building, as described in Reference [30]. The results indicatethat BIPVs could meet the energy demand but there are some issues between the government and theutility company. Ref. [31] proposes a novel scheme to increase the efficiency of the PV-converter batteryin a BIPV system. The results from simulations and experiments show an increased energy efficiencyunder normal conditions. Ref. [32] discusses renewable energy in buildings in China. The researchaims to forecast the growth rate of renewable energy in buildings (REIB) using a prediction model ofgrey theory and scenario analysis. Countermeasures to reduce energy consumption in buildings arediscussed in many studies. Energy savings can be achieved by both implementing new technologyand changing the behavior of building occupants. Ref. [33,34] propose basic actions to improve energyefficiency that have been tested in several buildings. A joint solution to increase energy efficiencyusing a real case study on a university campus is proposed in Reference [35]. The effects of an energymanagement system on energy savings in buildings are investigated in Reference [36]. Ref. [31]also evaluated the energy performance of an intelligent energy management system, indicating itspotential for energy saving due to its high energy performance in terms of payback and return factor.The behavior, attitudes and opinions of employees of a large commercial company are presented andanalyzed in Reference [37]. As a result, it is internationally accepted that energy conservation andenergy efficiency improvement are important approaches to address the aforementioned challenges,so some of these strategies may be implemented immediately.
Thailand became the first country in Asia to implement a comprehensive, national demand-sidemanagement (DSM) program in 1993. Demand-side management (DSM) was implemented to reduceenergy consumption and CO2 emissions in the residential sector [16,19]. The calculation methodto estimate the energy-savings was proposed in Reference [22]. This method was adopted fromthe British Standards Institution (BSI) to reflect Thailand’s residential sector. Another approach forsolar PV is presented in Reference [38]. This research proposed an efficient solar-powered Homegridmodel based on load characteristics represented by static ZIP models. The simulation model has beenvalidated by implementation on a solar PV test bed in Thailand. The result showed an improvementin efficiency and a reduction in harmonics. [39], proposed a design model of a renewable energyair-conditioning system using solar and biomass as renewable energy sources. The life cycle assessmentof a chilling system in Thailand is presented in Reference [40], comparing the environmental impactsof a conventional system and a solar-assisted system. The energy savings potential in the residentialand building sectors are presented in Reference [41], using business as usual (BAU) as a referencecase and the AIM/EndUse model. The results indicate that the implementation of new styles ofbuildings can achieve energy savings of up to 42.7% compared to the BAU scenario. From researchon energy consumption in buildings, the efficient use of lighting is essential, as the energy usagein lighting systems is the second largest component after heating, ventilating and air conditioning

Sustainability 2018, 10, 4075 5 of 22
(HVAC). The reduction of energy consumption in these areas can significantly impact the overallenergy usage in buildings. Many countries have begun to increase the stringency of their lightingminimum energy performance standards (MEPS), with the intent of phasing out the least efficientlight source technologies, while researchers aim to develop techniques and technologies to increasethe energy efficiency and reduce the energy consumption in lighting systems.
To reduce energy consumption by lighting systems, there are several techniques that have beendeveloped for energy efficiency improvement and energy conservation [42–55]. Criteria for efficientlighting energy are presented in Reference [42]. The approach in research has taken account oflighting comfort requirements and maximum allowable lighting loads to set criteria for designinglighting systems. A stochastic model for energy consumption in lighting systems is proposed inReference [43]. The research has developed a model to simulate a lighting consumption profile inthe residential sector. It also performs a study on the impact of LED technology and evaluates theeconomic cost when energy saving actions are implemented. Another stochastic model is presentedin Reference [44]. In this research, statistical analysis was used to evaluate the lighting energy usagein 15 office buildings in China and Hong Kong. Ref. [45] presents survey results from an office inKorea, evaluating the behavior of occupants and lighting use patterns. The results indicate that alighting control strategy must be implemented to reduce energy usage in lighting systems. Lightingscheduling for energy saving is presented in Reference [46]. The paper proposes the active use of lifelog data based on a decision-making method to minimize the waste of lighting energy by controllingthe real-time operation of luminaires. A cost-benefit analysis of high-intensity luminaire replacement isprovided in Reference [47]. For compact fluorescent lamps (CFLs), a new high-power-factor dimmableelectronic ballast control scheme is proposed in Reference [48]. According to experimental resultsstudying various dimming levels and operating conditions, they verified the good performance andeffectiveness of the proposed dimmable ballast. A fuzzy logic controller and dimmable electronicballasts were used to obtain artificial lighting at targeted levels. During the functioning of the system,approximately 30% savings were achieved by the proposed controller implementation. [49] proposesenergy saving in T5 fluorescent lamps with an electronic ballast and harmonic reduction using a filtercircuit. The results indicate that the energy consumption of a T5 fluorescent lamp can be reducedthrough the design of an appropriate filter and it can also reduce the harmonic values within theinternational standard. A high-power-factor electronic ballast with different dimming mechanismsand interfaces for T5 fluorescent lamps is developed in Reference [50]. The life cycle assessment oflight-emitting diode (LED) and compact fluorescent (CFL) luminaires is presented in Reference [51].The environmental impact of these two technologies has been evaluated. The results indicate thatLEDs can reduce greenhouse gas emissions by at least 41%. The effect of LED lighting on cooling andheating in building is presented in Reference [52]. It also proposes a heat control strategy to achieveenergy-efficient of LED lighting. In Finland, research on an LED lighting system and its potential toreduce energy usage and CO2 emissions was conducted [53]. The lighting control strategy is presentedin Reference [54,55], proposing a control algorithm and control system components required to achieveenergy efficiency in a lighting system with daylight harvesting and optimal space cooling. An adaptivelighting control system is proposed in Reference [56]. The system is an automated lighting controlunder varying conditions of occupancy, weather, seasons and other influences. Ref. [57] proposesa lighting control technique based on a fractional-order (FO) adaptive minimum energy cognitivecontrol strategy. Ref. [58] proposes a high-efficiency lighting system using real-time integrated lightingfor energy savings. The experimental results demonstrate the effectiveness and applicability of theproposed method. Researcher in the lighting industry focuses on improving the light output andlifetime, lighting systems combined with advanced wireless control systems, personal and workstationcontrols and daylighting to manage the lighting needs of work spaces energy efficiently.
Research on lighting control systems using daylight has been reviewed. To evaluate the potentialof daylighting, the adaptation of daylighting modelling has been performed and is presented inReference [59]. The paper investigated whether kriging modelling can be used to profile illuminance.

Sustainability 2018, 10, 4075 6 of 22
The results show that the proposed modelling was in the approximate range of measurement data.A hybrid lighting system (HLS) with electric lighting and daylight delivered into the building wasdeveloped in Reference [60,61]. The energy performance of an office building with daylight integrationis discussed in Reference [62]. The research has investigated the energy savings in a lighting systembased on both daylighting and artificial light, while taking visual comfort into consideration. It canbe observed from the result that in all cases, visual comfort can be achieved with automatic interiorshading controls. Ref. [63] proposes design recommendations for daylight harvesting systems (DHS).It suggests that technical robustness, architectural integration and human acceptance are the mainaspects that need attention. A practical case of using daylight harvesting is proposed in Reference [64].The control strategy is to detect illuminance in the area below and adjusting the modulation ofthe luminous flux to maintain the illuminance required by the standard. A new concept of usingdaylighting for a factory is proposed in Reference [65]. The methodology is based on a multidisciplinaryapproach that is a combination of logistics, building physics and structural engineering to achieveboth indoor environmental quality (IEQ) and energy savings. An algorithm for daylight harvestingis presented in Reference [66]. The proposed algorithm is based on machine learning and radiositytheory to calculate the total illuminance. A controller designed for an artificial lighting system ina room illuminated with daylight using light pipes is presented in Reference [67]. The model wastested in a five-level building and it was shown that all five levels of the building can achieve anaverage illuminance of 70 lux at a low sun elevation. Ref. [68] has developed an optimal daylight-basedcontroller. Sensor-integrated luminaires with daylight and occupancy in consideration are proposed inReference [69]. The centralized lighting control was based on solving a power minimization problemwith illumination constraints. The results demonstrate better uniformity with similar energy savingsto other control strategies. Ref. [70,71] present the application of artificial intelligence to predict theavailability of daylighting and use this algorithm to calculate the final energy requirements of abuilding. The calculation of daylight availability and its impact on energy savings are presented inReference [72–74]. Factors that have an impact on daylight performance such as weather, architectureand location of the building are presented in Reference [75–77]. A simulation result [78] using differentweather data has revealed that weather has a significant effect on the illuminance value through thecondition of the sky. A review of the effects of daylight on building occupants in term of psychologyand physiology also showed that daylight not only benefits a building through energy savings but alsoprovides health, productivity and safety benefits to the building occupants [79]. From the literaturereview above, it can be seen that daylight contributes benefits to many aspects of buildings andlighting control using daylight has attracted much attention from many researchers. The majorityof the research has only used simulations to evaluate the performance of control strategies and thepotential of daylighting, so experimental work is needed to evaluate the impact of some factors thatwere omitted in the simulation stage.
3. Simulation
The fluorescent T5 tube lamp was simulated using the DIALux program to study the impactof daylight and artificial light in terms of average illuminance, including the energy consumption,for a university building. A lecture room with dimensions of 12 m × 8 m × 2.7 m (room area of96 m2) was considered as the case study room, with a layout as shown in Figure 1. As shown inFigure 1a,c, this room contains two windows (with dimensions of 1.5 m × 3.4 m) and a woodendoor (with dimensions of 1 m × 2 m). The height of the task area (or workplane) was set as 0.75 m,corresponding to the height of a table (approximately as 0.75–0.85 m above the floor level), as shownin Figure 1c. As shown in Figure 1d, 15 sets of 2 × 28 W T5 fluorescent luminaires are installed in thelecture room. The luminous intensity of the T5 fluorescent luminaire is recorded on a polar plot shownin Figure 2 and its data are shown in Table 2.

Sustainability 2018, 10, 4075 7 of 22Sustainability 2017, 9, x FOR PEER REVIEW 7 of 22
(a)
(b)
(c)
(d)
Figure 1. Detail of Lecture room using in simulation: (a) Lecture room drawn in the DIALux program; (b) Lecture room layout for fluorescent luminaire fixtures in the DIALux program; (c) Floor plan of lecture room; (d) Detail of luminaire layout in lecture room.
12.00 m0.00
8.00 m
0.00
1
1
1
1
1
1
1
1
1
1
1
1
1
1
1
12.00 m0.00 1.20 3.60 6.00 8.40 10.80
8.00 m
0.00
1.33
4.00
6.67
Figure 1. Detail of Lecture room using in simulation: (a) Lecture room drawn in the DIALux program;(b) Lecture room layout for fluorescent luminaire fixtures in the DIALux program; (c) Floor plan oflecture room; (d) Detail of luminaire layout in lecture room.

Sustainability 2018, 10, 4075 8 of 22Sustainability 2017, 9, x FOR PEER REVIEW 8 of 22
C0 - C180C90 - C 270
Figure 2. Polar curve of the T5 luminaire used in Simulation.
Table 2. Data for T5 fluorescent lamp.
Type of Luminaire
Luminous Flux (Lumen per Luminaires)
Total Luminous Flux (Lumen)
Luminaire Wattage (Watt per Luminaires)
Total Wattage (Watt)
Fluorescent T5 4516 67,737 56 840
Table 3. Obtained illuminance on workplane using DIALux in various time period.
Time Surface Reflectance Coefficient
(%)
Average Illuminance
(lux)
Minimum Illuminance
(lux)
Maximum Illuminance
(lux)
Uniformity of
Illuminance
Energy Consumption
Index (Watt per Square Meter)
Without Daylight
Workplane - 536 136 694 0.253
8.75 Floor 20 273 42 595 0.155 Ceiling 70 138 48 189 0.347 Walls 52 215 17 432 -
8 a.m.
Workplane - 739 339 1736 0.458
8.75 Floor 20 361 83 780 0.230
Ceiling 70 186 70 267 0.377 Walls 52 290 26 738 -
10 a.m.
Workplane - 901 369 3171 0.409
8.75 Floor 20 440 98 1362 0.223
Ceiling 70 222 89 351 0.403 Walls 52 340 36 1023 -
12 a.m.
Workplane - 724 335 2236 0.463
8.75 Floor 20 367 95 1096 0.258
Ceiling 70 179 71 254 0.399 Walls 52 271 29 596 -
2 p.m.
Workplane - 822 348 2787 0.424
8.75 Floor 20 402 106 1235 0.263
Ceiling 70 203 79 316 0.388 Walls 52 312 35 1000 -
4 p.m.
Workplane - 615 309 1031 0.503
8.75 Floor 20 309 66 624 0.214
Ceiling 70 156 49 215 0.318 Walls 52 239 14 501 -
The obtained results are presented in Table 3 and the illuminance distribution (as an isolux diagram) and a false color rendering are illustrated in Figure 3. Generally, according to the CIE standard, the average illuminance on a task area of a general room must be more than 300 lux but should not exceed 750 lux (recommended by the EN 12464-1 and CIE S 008/E:2001 standard as 500 lux [80,81]). By considering the illuminance in Table 3, in the case of a lecture room with daylight, the average illuminance is more than that of the base case (without daylight); this indicates that the daylight is beneficial to the overall illuminance on the task area. However, the variation of the maximum illuminance within each time period is significantly larger than that in the base case and the variation of the minimum illuminance is also slightly larger. This indicates a slight mismatch between the maximum and minimum illuminances in each period of time. Although the uniformity
Figure 2. Polar curve of the T5 luminaire used in Simulation.
Table 2. Data for T5 fluorescent lamp.
Type ofLuminaire
Luminous Flux (Lumenper Luminaires)
Total LuminousFlux (Lumen)
Luminaire Wattage(Watt per Luminaires)
Total Wattage(Watt)
Fluorescent T5 4516 67,737 56 840
As previously mentioned, to study the impact on illuminance and energy consumption of daylightin each time period, the illuminance was calculated at 8 a.m., 10 a.m., 12 p.m., 2 p.m. and 4 p.m.,in addition to without daylight (as base case) by considering only the T5 luminaires, as shown inTable 3 and Figure 3.
Table 3. Obtained illuminance on workplane using DIALux in various time period.
Time SurfaceReflectanceCoefficient
(%)
AverageIlluminance
(lux)
MinimumIlluminance
(lux)
MaximumIlluminance
(lux)
Uniformityof
Illuminance
Energy ConsumptionIndex (Watt perSquare Meter)
WithoutDaylight
Workplane - 536 136 694 0.253
8.75Floor 20 273 42 595 0.155
Ceiling 70 138 48 189 0.347Walls 52 215 17 432 -
8 a.m.
Workplane - 739 339 1736 0.458
8.75Floor 20 361 83 780 0.230
Ceiling 70 186 70 267 0.377Walls 52 290 26 738 -
10 a.m.
Workplane - 901 369 3171 0.409
8.75Floor 20 440 98 1362 0.223
Ceiling 70 222 89 351 0.403Walls 52 340 36 1023 -
12 a.m.
Workplane - 724 335 2236 0.463
8.75Floor 20 367 95 1096 0.258
Ceiling 70 179 71 254 0.399Walls 52 271 29 596 -
2 p.m.
Workplane - 822 348 2787 0.424
8.75Floor 20 402 106 1235 0.263
Ceiling 70 203 79 316 0.388Walls 52 312 35 1000 -
4 p.m.
Workplane - 615 309 1031 0.503
8.75Floor 20 309 66 624 0.214
Ceiling 70 156 49 215 0.318Walls 52 239 14 501 -
The obtained results are presented in Table 3 and the illuminance distribution (as an isoluxdiagram) and a false color rendering are illustrated in Figure 3. Generally, according to the CIEstandard, the average illuminance on a task area of a general room must be more than 300 lux butshould not exceed 750 lux (recommended by the EN 12464-1 and CIE S 008/E:2001 standard as

Sustainability 2018, 10, 4075 9 of 22
500 lux [80,81]). By considering the illuminance in Table 3, in the case of a lecture room with daylight,the average illuminance is more than that of the base case (without daylight); this indicates thatthe daylight is beneficial to the overall illuminance on the task area. However, the variation of themaximum illuminance within each time period is significantly larger than that in the base case andthe variation of the minimum illuminance is also slightly larger. This indicates a slight mismatchbetween the maximum and minimum illuminances in each period of time. Although the uniformityof the illuminance in the cases of daylight is greater than that of the base case, as shown in Table 3,the difference between the maximum and minimum illuminances can be clearly seen in the isoluxdiagrams shown in Figure 3; this indicates that the daylight could increase the average illuminance butthe uniformity of the illuminance should be improved, as the illuminance of the task area section nearthe window side was higher than that of the other section of task area in the lecture room. ConsideringFigure 3, the illuminance on the task areas near the window side is more than 1000 lux, while the othertask areas of this room have illuminance values of 400–600 lux.
Sustainability 2017, 9, x FOR PEER REVIEW 9 of 22
of the illuminance in the cases of daylight is greater than that of the base case, as shown in Table 3, the difference between the maximum and minimum illuminances can be clearly seen in the isolux diagrams shown in Figure 3; this indicates that the daylight could increase the average illuminance but the uniformity of the illuminance should be improved, as the illuminance of the task area section near the window side was higher than that of the other section of task area in the lecture room. Considering Figure 3, the illuminance on the task areas near the window side is more than 1000 lux, while the other task areas of this room have illuminance values of 400–600 lux.
Based on a further analysis of Figure 3, it is noteworthy that, for the daylight at 10 a.m., the illuminance on the task area is much higher than that of the other time periods because of location of the building and the direction of the sunlight passing through the window while, for the daylight at 4 p.m., the average illuminance on the task area is lower than during the other periods of time because it is the sunset period. The energy consumption index (in watts per square meter) does not change with the time period, as shown in Table 3. This emphasizes that luminaires in the window area affected by daylight can be dimmed or turned off to reduce energy consumption and maintain the uniformity of the illuminance in the daytime, so that artificial light with dimming ability must be applied to control the illuminance of the task area at the desired values for each time period.
. (a)
(b)
(c)
360
360360
480
480
480
480480
480 600
600
600
600
600
600
600
600
600
600
600
12.00 m0.00 1.00 2.28 4.87 5.85 6.59 8.21 9.78
8.00 m
0.00
0.611.031.41
1.942.36
3.153.573.95
4.474.89
5.696.116.49
7.027.44
600
600 600
600
1200
12001200
1200
1200
1800 1800 18001800
18002400 24003000 3000 3000
12.00 m0.00 1.00 2.28 4.87 5.85 6.59 8.21 9.78
8.00 m
0.00
0.611.031.41
1.942.36
3.153.573.95
4.474.89
5.696.116.49
7.027.44
Figure 3. Cont.

Sustainability 2018, 10, 4075 10 of 22Sustainability 2017, 9, x FOR PEER REVIEW 10 of 22
(d)
(e)
(f)
Figure 3. Isolux diagram and false color rendering on the task area of the lecturer room with fluorescent T5 and daylight at various times: (a) without daylight; (b) 8 a.m.; (c) 10 a.m.; (d) 12 a.m.; (e) 2 p.m.; (f) 4 p.m.
Based on a further analysis of Figure 3, it is noteworthy that, for the daylight at 10 a.m., the illuminance on the task area is much higher than that of the other time periods because of location of the building and the direction of the sunlight passing through the window while, for the daylight at 4 p.m., the average illuminance on the task area is lower than during the other periods of time because it is the sunset period. The energy consumption index (in watts per square meter) does not change with the time period, as shown in Table 3. This emphasizes that luminaires in the window area affected by daylight can be dimmed or turned off to reduce energy consumption and maintain the uniformity of the illuminance in the daytime, so that artificial light with dimming ability must be applied to control the illuminance of the task area at the desired values for each time period.
4. Experimental Setup and Results
As described in the previous section, daylighting may provide a sufficient quantity of illumination (illuminance and uniformity of illuminance) to reduce the artificial lighting level needed but it can result in false energy consumption. To maintain an appropriate average illuminance level
800
800
800
800800
8001200
12001200 1200 1200
1600 16001600
2000 2000
12.00 m0.00 1.00 2.28 4.87 5.85 6.59 8.21 9.78
8.00 m
0.00
0.611.031.41
1.942.36
3.153.573.95
4.474.89
5.696.116.49
7.027.44
1000
1000
1000 1000
1000
1000
15001500 1500 1500
20002500 2500 2500 2500
12.00 m0.00 1.00 2.28 4.87 5.85 6.59 8.21 9.78
8.00 m
0.00
0.611.031.41
1.942.36
3.153.573.95
4.474.89
5.696.116.49
7.027.44
450
450
600 600
600
600
600600
600
600
600
750 750
750 750
750
750
750
750
750750900
900900
12.00 m0.00 1.00 2.28 4.87 5.85 6.59 8.21 9.78
8.00
0.00
0.611.031.41
1.942.36
3.153.573.95
4.474.89
5.696.116.49
7.027.44
Figure 3. Isolux diagram and false color rendering on the task area of the lecturer room with fluorescentT5 and daylight at various times: (a) without daylight; (b) 8 a.m.; (c) 10 a.m.; (d) 12 a.m.; (e) 2 p.m.;(f) 4 p.m.
Based on a further analysis of Figure 3, it is noteworthy that, for the daylight at 10 a.m.,the illuminance on the task area is much higher than that of the other time periods because of locationof the building and the direction of the sunlight passing through the window while, for the daylightat 4 p.m., the average illuminance on the task area is lower than during the other periods of timebecause it is the sunset period. The energy consumption index (in watts per square meter) does notchange with the time period, as shown in Table 3. This emphasizes that luminaires in the windowarea affected by daylight can be dimmed or turned off to reduce energy consumption and maintainthe uniformity of the illuminance in the daytime, so that artificial light with dimming ability must beapplied to control the illuminance of the task area at the desired values for each time period.
4. Experimental Setup and Results
As described in the previous section, daylighting may provide a sufficient quantity of illumination(illuminance and uniformity of illuminance) to reduce the artificial lighting level needed but it canresult in false energy consumption. To maintain an appropriate average illuminance level and reduce

Sustainability 2018, 10, 4075 11 of 22
the energy consumption, the lighting control must be properly adjusted with the daylight level.By considering the isolux of Figure 3, the daylight from the window has an effect on only 1/3 of thetask area, so that this task area section should be subjected to lighting control to adjust the illuminanceonly in a specific area. In this section, an experimental setup unit has been designed and built, as shownin Figure 4. Figure 4a shows that the experimental setup unit (1.35 m × 1.4 m × 1.9 m) has beendesigned as an enclosed area with a black interior surface to prevent light reflection, as depictedin Figure 4b. The louver system on the window of experimental setup can be adjusted into 4 level;0, 15, 30 and 45 degree using vertical line as a reference. when 0 degree mean that the louver isclose and 45 degree mean that louver is open at 45 degree with vertical reference line. The distancebetween the luminaire and task area (measured point on floor of experimental setup) is 1.8 m becausethis distance is generally 1.75 m–1.95 m, depending on the objective of room. Considering the sideview of the experimental setup unit shown in Figure 4c, two window shutters (0.485 m × 0.615 m)have been installed to admit daylight into the experimental setup unit and there are two luminairesinstalled on the ceiling of the experimental setup unit each (2.95 m × 11.95 m × 0.65 m) consistingof 28 W T5 fluorescent lamps connected with a dimmable electronic ballast, as shown in Figure 4b.The illuminance control unit is installed on the ceiling of the experimental setup, as shown in Figure 4d.Measuring instruments such as a lux meter, power meter and lighting control switch (on/off control)have been installed to measure the illuminance, voltage, current and real power, as shown in Figure 5.
A diagram of the experimental setup is shown in Figure 5. The single-phase power supply ofthe experimental setup was determined in the laboratory to have a voltage level of 230 V (number1 in Figure 5), while a fuse with 5 A is used to protect the experimental setup unit. For measurement,an energy meter (Fluke 435-II) (number 2 in Figure 5) is used to measure the power quality includingharmonics and electrical parameters, both for the power supply and the experimental setup unit,while, as previously mentioned, the illuminance and real power of the experimental setup unitare measured using a lux meter (number 7 in Figure 5) and power meter (number 3 in Figure 5),respectively. The measurement of illuminance using lux meter has been done on two points underboth T5 luminaires. As previously mentioned, a luminaire a T5 fluorescent lamp with a dimmableelectronic ballast (number 8 and number 4 in Figure 5, respectively) was installed on the ceiling of theexperimental setup, as were a light detector (number 6 in Figure 5) and the illuminance control unit(number 5 in Figure 5), as shown in Figure 4d. The algorithm used to control the illuminance withdaylighting is shown in Figure 6.
Considering Figure 6, in the case of lighting control with daylighting, the light detector (number6 in Figure 5) measures the daylight (light from the window shutters) and artificial light (light fromT5 fluorescent luminaires) in the form of a voltage signal (analogue input) and then converts thisvoltage signal to a digital signal. The digital signal is used for comparison with the illuminance valuesetting in the program. The illuminance value on the workplane (or task area) is measured by two luxmeters that are installed under the two luminaires, as shown in Figure 4b. These values were usedto calculate the average illuminance on the workplane. If the illuminance measured from the lightdetector device is more than the setting value, the illuminance control circuit will decrease the lightoutput by 0.25 units. Contrarily, if the illuminance is less than the setting value, the illuminance controlcircuit will increase the light output by 0.25 units. For the computation of the illuminance control unit,a Pulse-width modulation (PWM) signal was generated using the obtained digital signal. The outputof the PWM signal has a duty cycle of 1–100% to adjust the illuminance using the dimmable electronicballast (number 4 in Figure 5). This dimmable electronic ballast controls the input current of the T5fluorescent lamp (number 8 in Figure 5) so that the obtained illuminance from the luminaire can beadjusted. The minimum illuminance set in this program is one unit, when the fluorescent luminairehas a 1% light output, while the maximum illuminance setting is 255 units, when the fluorescentluminaire has a 100% light output.
After building the experimental setup unit, two case studies were considered to verify the lightingcontrol unit capability and study the performance of the daylight control T5 fluorescent luminaire.

Sustainability 2018, 10, 4075 12 of 22
Two T5 luminaire using in experimental setup will be refer as luminaire 1 and Luminaire 2 (Installedlocation is referring in Figure 4b). The overall average illuminance on the task area was also measuredand controlled to less than 500 lux according to EN 12464-1 and CIE S 008/E:2001 standard [80,81],while the energy consumption should be reduced by decreasing the average illuminance. In thefirst study, a comparison in terms of illuminance and energy consumption between the fluorescentluminaire without and with the lighting control unit was considered. In the next case study, variousaperture angles of the window shutters (open louver at different angle) were compared in terms of theilluminance and energy consumption. The obtained results from the comparison between before andafter the installation of the lighting control unit are shown in Tables 4 and 5 and Figure 7.
Sustainability 2017, 9, x FOR PEER REVIEW 11 of 22
and reduce the energy consumption, the lighting control must be properly adjusted with the daylight level. By considering the isolux of Figure 3, the daylight from the window has an effect on only 1/3 of the task area, so that this task area section should be subjected to lighting control to adjust the illuminance only in a specific area. In this section, an experimental setup unit has been designed and built, as shown in Figure 4. Figure 4a shows that the experimental setup unit (1.35 m × 1.4 m × 1.9 m) has been designed as an enclosed area with a black interior surface to prevent light reflection, as depicted in Figure 4b. The louver system on the window of experimental setup can be adjusted into 4 level; 0, 15, 30 and 45 degree using vertical line as a reference. when 0 degree mean that the louver is close and 45 degree mean that louver is open at 45 degree with vertical reference line. The distance between the luminaire and task area (measured point on floor of experimental setup) is 1.8 m because this distance is generally 1.75 m–1.95 m, depending on the objective of room. Considering the side view of the experimental setup unit shown in Figure 4c, two window shutters (0.485 m × 0.615 m) have been installed to admit daylight into the experimental setup unit and there are two luminaires installed on the ceiling of the experimental setup unit each (2.95 m × 11.95 m × 0.65 m) consisting of 28 W T5 fluorescent lamps connected with a dimmable electronic ballast, as shown in Figure 4b. The illuminance control unit is installed on the ceiling of the experimental setup, as shown in Figure 4d. Measuring instruments such as a lux meter, power meter and lighting control switch (on/off control) have been installed to measure the illuminance, voltage, current and real power, as shown in Figure 5.
0 Degree
45o
45 Degree
30o
30 Degree
0.61
5 m
1 m
0.7
m0.
2 m
0.485 m 0.485 m0.145 m0.145 m 0.140 m
1.4 m
1.35
m
0.61
5 m
1.16 m
0.5
m
0.15
m
1.35 m
(a) (b) Sustainability 2017, 9, x FOR PEER REVIEW 12 of 22
(c) (d)
Figure 4. Panel of experimental setup unit: (a) details of experimental setup; (b) interior of experimental setup; (c) side view of experimental setup; and (d) illuminance control unit of experimental setup.
Figure 5. Diagram of T5 fluorescent daylight control experimental setup unit.
A diagram of the experimental setup is shown in Figure 5. The single-phase power supply of the experimental setup was determined in the laboratory to have a voltage level of 230 V (number 1 in Figure 5), while a fuse with 5 A is used to protect the experimental setup unit. For measurement, an energy meter (Fluke 435-II) (number 2 in Figure 5) is used to measure the power quality including harmonics and electrical parameters, both for the power supply and the experimental setup unit, while, as previously mentioned, the illuminance and real power of the experimental setup unit are measured using a lux meter (number 7 in Figure 5) and power meter (number 3 in Figure 5), respectively. The measurement of illuminance using lux meter has been done on two points under both T5 luminaires. As previously mentioned, a luminaire a T5 fluorescent lamp with a dimmable electronic ballast (number 8 and number 4 in Figure 5, respectively) was installed on the ceiling of the experimental setup, as were a light detector (number 6 in Figure 5) and the illuminance control unit (number 5 in Figure 5), as shown in Figure 4d. The algorithm used to control the illuminance with daylighting is shown in Figure 6.
Figure 4. Panel of experimental setup unit: (a) details of experimental setup; (b) interior of experimentalsetup; (c) side view of experimental setup; and (d) illuminance control unit of experimental setup.

Sustainability 2018, 10, 4075 13 of 22
Sustainability 2017, 9, x FOR PEER REVIEW 12 of 22
(c) (d)
Figure 4. Panel of experimental setup unit: (a) details of experimental setup; (b) interior of experimental setup; (c) side view of experimental setup; and (d) illuminance control unit of experimental setup.
Figure 5. Diagram of T5 fluorescent daylight control experimental setup unit.
A diagram of the experimental setup is shown in Figure 5. The single-phase power supply of the experimental setup was determined in the laboratory to have a voltage level of 230 V (number 1 in Figure 5), while a fuse with 5 A is used to protect the experimental setup unit. For measurement, an energy meter (Fluke 435-II) (number 2 in Figure 5) is used to measure the power quality including harmonics and electrical parameters, both for the power supply and the experimental setup unit, while, as previously mentioned, the illuminance and real power of the experimental setup unit are measured using a lux meter (number 7 in Figure 5) and power meter (number 3 in Figure 5), respectively. The measurement of illuminance using lux meter has been done on two points under both T5 luminaires. As previously mentioned, a luminaire a T5 fluorescent lamp with a dimmable electronic ballast (number 8 and number 4 in Figure 5, respectively) was installed on the ceiling of the experimental setup, as were a light detector (number 6 in Figure 5) and the illuminance control unit (number 5 in Figure 5), as shown in Figure 4d. The algorithm used to control the illuminance with daylighting is shown in Figure 6.
Figure 5. Diagram of T5 fluorescent daylight control experimental setup unit.
Table 4. Results from the experimental setup before and after installing the daylight control in T5fluorescent at 3.00 p.m.
Angle(Degree)
Before Installation of Daylight Control (without Lighting Control)
Voltage (V) Current (A) Real Power (W)Illuminance (Lux)
Luminaire 1 Luminaire 2 Average
0◦ 226.1 0.576 118 1082 1026 1054.015◦ 226.2 0.535 119 1107 1103 1105.030◦ 226.5 0.538 120 1106 1109 1107.545◦ 226.3 0.537 119 1132 1128 1130.0
Angle(Degree)
After Installation of Daylight Control (with Lighting Control)
Voltage (V) Current (A) Real Power (W)Illuminance (Lux)
Luminaire 1 Luminaire 2 Average
0◦ 226.8 0.306 62 365 455 410.015◦ 226.9 0.297 60 335 460 397.530◦ 226.8 0.289 59 380 448 414.045◦ 226.6 0.265 53 394 414 404.0
Table 5. Results from the experimental test set before and after installing daylight control in the T5fluorescent at 12.00 p.m.
Angle(Degree)
Before Installation of Daylight Control (without Lighting Control)
Voltage (V) Current (A) Real Power (W)Illuminance (Lux)
Luminaire 1 Luminaire 2 Average
0◦ 224.1 0.548 119 1141 1091 111615◦ 223.1 0.536 119 1310 1186 124830◦ 224 0.532 117 1110 1428 126945◦ 223.9 0.538 118 1085 1558 1321.5
Angle(Degree)
After Installation of Daylight Control (with Lighting Control)
Voltage (V) Current (A) Real Power (W)Illuminance (Lux)
Luminaire 1 Luminaire 2 Average
0◦ 224.2 0.281 57 462 440 45115◦ 223.8 0.246 48 590 477 533.530◦ 224 0.193 35 209 610 409.545◦ 224 0.147 22 60 590 325
Sustainability 2018, 10, 4075 14 of 22Sustainability 2017, 9, x FOR PEER REVIEW 13 of 22
Start
Receive illuminance value
from Light Detector Device
Illuminance less than setting value
Increase illuminance
End
Yes
No
YesIlluminance more than setting value
Decrease illuminance
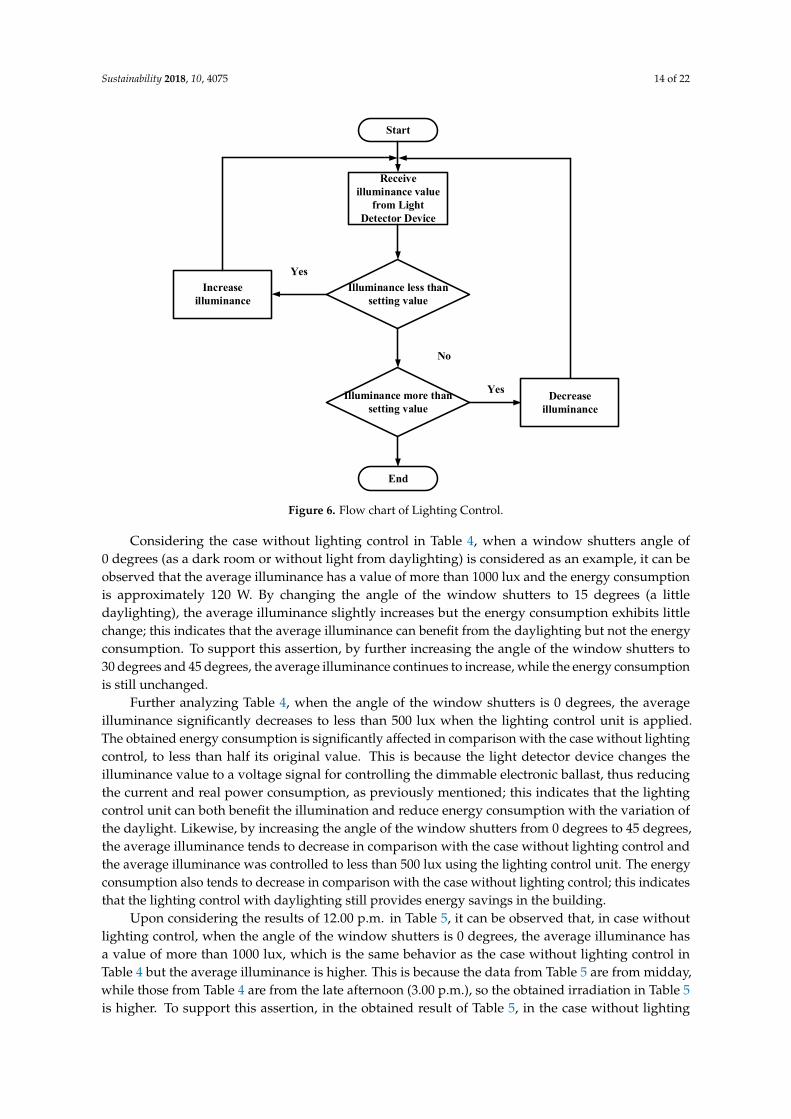
Figure 6. Flow chart of Lighting Control.
Considering Figure 6, in the case of lighting control with daylighting, the light detector (number 6 in Figure 5) measures the daylight (light from the window shutters) and artificial light (light from T5 fluorescent luminaires) in the form of a voltage signal (analogue input) and then converts this voltage signal to a digital signal. The digital signal is used for comparison with the illuminance value setting in the program. The illuminance value on the workplane (or task area) is measured by two lux meters that are installed under the two luminaires, as shown in Figure 4b. These values were used to calculate the average illuminance on the workplane. If the illuminance measured from the light detector device is more than the setting value, the illuminance control circuit will decrease the light output by 0.25 units. Contrarily, if the illuminance is less than the setting value, the illuminance control circuit will increase the light output by 0.25 units. For the computation of the illuminance control unit, a Pulse-width modulation (PWM) signal was generated using the obtained digital signal. The output of the PWM signal has a duty cycle of 1–100% to adjust the illuminance using the dimmable electronic ballast (number 4 in Figure 5). This dimmable electronic ballast controls the input current of the T5 fluorescent lamp (number 8 in Figure 5) so that the obtained illuminance from the luminaire can be adjusted. The minimum illuminance set in this program is one unit, when the fluorescent luminaire has a 1% light output, while the maximum illuminance setting is 255 units, when the fluorescent luminaire has a 100% light output.
After building the experimental setup unit, two case studies were considered to verify the lighting control unit capability and study the performance of the daylight control T5 fluorescent luminaire. Two T5 luminaire using in experimental setup will be refer as luminaire 1 and Luminaire 2 (Installed location is referring in Figure 4b). The overall average illuminance on the task area was also measured and controlled to less than 500 lux according to EN 12464-1 and CIE S 008/E:2001 standard [80,81], while the energy consumption should be reduced by decreasing the average illuminance. In the first study, a comparison in terms of illuminance and energy consumption between the fluorescent luminaire without and with the lighting control unit was considered. In the next case study, various aperture angles of the window shutters (open louver at different angle) were compared in terms of the illuminance and energy consumption. The obtained results from the comparison between before and after the installation of the lighting control unit are shown in Tables 4 and 5 and Figure 7.
Figure 6. Flow chart of Lighting Control.
Considering the case without lighting control in Table 4, when a window shutters angle of0 degrees (as a dark room or without light from daylighting) is considered as an example, it can beobserved that the average illuminance has a value of more than 1000 lux and the energy consumptionis approximately 120 W. By changing the angle of the window shutters to 15 degrees (a littledaylighting), the average illuminance slightly increases but the energy consumption exhibits littlechange; this indicates that the average illuminance can benefit from the daylighting but not the energyconsumption. To support this assertion, by further increasing the angle of the window shutters to30 degrees and 45 degrees, the average illuminance continues to increase, while the energy consumptionis still unchanged.
Further analyzing Table 4, when the angle of the window shutters is 0 degrees, the averageilluminance significantly decreases to less than 500 lux when the lighting control unit is applied.The obtained energy consumption is significantly affected in comparison with the case without lightingcontrol, to less than half its original value. This is because the light detector device changes theilluminance value to a voltage signal for controlling the dimmable electronic ballast, thus reducingthe current and real power consumption, as previously mentioned; this indicates that the lightingcontrol unit can both benefit the illumination and reduce energy consumption with the variation ofthe daylight. Likewise, by increasing the angle of the window shutters from 0 degrees to 45 degrees,the average illuminance tends to decrease in comparison with the case without lighting control andthe average illuminance was controlled to less than 500 lux using the lighting control unit. The energyconsumption also tends to decrease in comparison with the case without lighting control; this indicatesthat the lighting control with daylighting still provides energy savings in the building.
Upon considering the results of 12.00 p.m. in Table 5, it can be observed that, in case withoutlighting control, when the angle of the window shutters is 0 degrees, the average illuminance hasa value of more than 1000 lux, which is the same behavior as the case without lighting control inTable 4 but the average illuminance is higher. This is because the data from Table 5 are from midday,while those from Table 4 are from the late afternoon (3.00 p.m.), so the obtained irradiation in Table 5is higher. To support this assertion, in the obtained result of Table 5, in the case without lighting

Sustainability 2018, 10, 4075 15 of 22
control, the average illuminance at midday (12 p.m.) has the same behavior as the data during thelate afternoon (3.00 p.m.) from Table 4 but the average illuminance for all the angles of the windowshutters have slightly higher values. By considering the energy consumption in the case withoutlighting control, the obtained energy consumption has a similar value to the case without lightingcontrol in Table 4.
Similarly, for the case with lighting control of Table 5, when the angle of the window shutters is0 degrees, it can be clearly seen that the average illuminance was controlled to less than 500 lux usingthe lighting control unit. Likewise, the obtained energy consumption significantly decreases to lessthan in the case of without lighting control in Table 4; this emphasizes that the lighting control withdaylighting can significantly benefit energy savings in the building. The illumination and electricalparameters (such as voltage, current and real power) were additionally measured every 10 min (andmanually monitored every 1 min) to understand the variation with time so that the illuminanceand electrical parameters could be logged every 30 min with a Fluke 435-II power quality meter.The obtained results of various periods of time are shown in Figure 7.
Figure 7 shows the relation between the electrical parameters of the experimental setup unit,including the voltage, current, real power and average illuminance and the time from 8.00 a.m. to4.00 p.m. A comparison between the fluorescent luminaire without and with the lighting control unitwas also performed with various aperture angles of the window shutters. First, considering Figure 7a,it can be clearly seen that the voltage fluctuates in a narrow range throughout the day because thedaylight does not cause a significant voltage change. Based on a further analysis of Figure 7a, it can beobserved that when the angle of the window shutters is 45 degrees, the level of voltage was highestand more than in the case without lighting control.
Considering Figure 7b, it can clearly be seen that when the aperture angle of the window shutterswas varied with the control unit, the obtained current is significantly decreased in comparison with thecase without the lighting control, by a factor of two. It can be further observed that when the apertureangle of the window shutters is increased, the current tends to decrease. This is because decreasing theT5 fluorescent luminaire light output requires that the dimmable electronic ballast reduce the outputcurrent corresponding to the amount of daylight passing through the window shutters.
Considering Figure 7c, it can clearly be seen that the trend of real power is similar to that of thecurrent level according to the amount of daylight that passes through the window shutters. Hence,when the aperture angle of the window shutters is increased, the obtained current tends to decrease,as previously mentioned. Moreover, when the aperture angle of the window shutters is varied with thelighting control, as shown in Figure 7c, the real power tends to significantly decrease in comparisonto the case without the lighting control to values 2–4 times smaller; this emphasizes that the lightingcontrol unit can reduce energy consumption as a result of the variation of daylight.
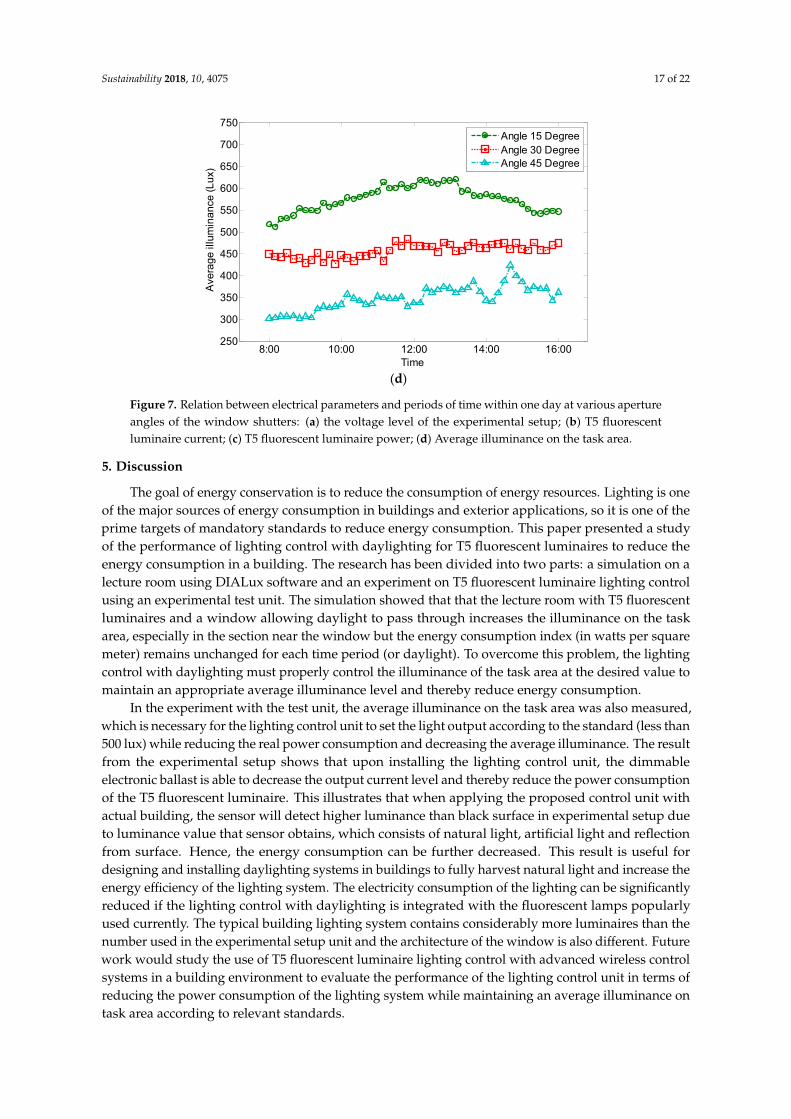
Finally, from Figure 7d, it can be clearly seen that when as the aperture angle of the windowshutters is varied with the lighting control, the average illuminance steadily increases in the morningand peaks around midday before steadily decreasing in the late afternoon. It can be further observedthat the average illuminance without the lighting control is more than 1000 lux, as shown in Tables 4and 5, so the obtained average illuminance without the lighting control unit is ignored from Figure 7d.This result shows that installing the lighting control with daylighting, both the average illuminanceand energy consumption for each time period decreases compared to the case without the lightingcontrol unit, as the lighting control unit tries to set the average illuminance on the task area to lessthan 500 lux, corresponding with the amount of daylight that passes through the window shutters.This confirms the effectiveness of the proposed lighting control unit with daylighting.

Sustainability 2018, 10, 4075 16 of 22
Sustainability 2017, 9, x FOR PEER REVIEW 16 of 22
the lighting control unit, as the lighting control unit tries to set the average illuminance on the task area to less than 500 lux, corresponding with the amount of daylight that passes through the window shutters. This confirms the effectiveness of the proposed lighting control unit with daylighting.
(a)
(b)
(c)
8:00 10:00 12:00 14:00 16:00224
225
226
227
228
229
230
231
232
233
234
Time
Vo
ltag
e (
V)
Without Lighting ControlAngle 15 DegreeAngle 30 DegreeAngle 45 Degree
8:00 10:00 12:00 14:00 16:000.1
0.2
0.3
0.4
0.5
0.6
0.7
0.8
Time
Cu
rre
nt (
A)
Without Lighting ControlAngle 15 DegreeAngle 30 DegreeAngle 45 Degree
8:00 10:00 12:00 14:00 16:0020
40
60
80
100
120
140
160
Time
Po
we
r (W
)
Without Lighting ControlAngle 15 DegreeAngle 30 DegreeAngle 45 Degree
Figure 7. Cont.
Sustainability 2018, 10, 4075 17 of 22Sustainability 2017, 9, x FOR PEER REVIEW 17 of 22
(d)
Figure 7. Relation between electrical parameters and periods of time within one day at various aperture angles of the window shutters: (a) the voltage level of the experimental setup; (b) T5 fluorescent luminaire current; (c) T5 fluorescent luminaire power; (d) Average illuminance on the task area.
5. Discussion
The goal of energy conservation is to reduce the consumption of energy resources. Lighting is one of the major sources of energy consumption in buildings and exterior applications, so it is one of the prime targets of mandatory standards to reduce energy consumption. This paper presented a study of the performance of lighting control with daylighting for T5 fluorescent luminaires to reduce the energy consumption in a building. The research has been divided into two parts: a simulation on a lecture room using DIALux software and an experiment on T5 fluorescent luminaire lighting control using an experimental test unit. The simulation showed that that the lecture room with T5 fluorescent luminaires and a window allowing daylight to pass through increases the illuminance on the task area, especially in the section near the window but the energy consumption index (in watts per square meter) remains unchanged for each time period (or daylight). To overcome this problem, the lighting control with daylighting must properly control the illuminance of the task area at the desired value to maintain an appropriate average illuminance level and thereby reduce energy consumption.
In the experiment with the test unit, the average illuminance on the task area was also measured, which is necessary for the lighting control unit to set the light output according to the standard (less than 500 lux) while reducing the real power consumption and decreasing the average illuminance. The result from the experimental setup shows that upon installing the lighting control unit, the dimmable electronic ballast is able to decrease the output current level and thereby reduce the power consumption of the T5 fluorescent luminaire. This illustrates that when applying the proposed control unit with actual building, the sensor will detect higher luminance than black surface in experimental setup due to luminance value that sensor obtains, which consists of natural light, artificial light and reflection from surface. Hence, the energy consumption can be further decreased. This result is useful for designing and installing daylighting systems in buildings to fully harvest natural light and increase the energy efficiency of the lighting system. The electricity consumption of the lighting can be significantly reduced if the lighting control with daylighting is integrated with the fluorescent lamps popularly used currently. The typical building lighting system contains considerably more luminaires than the number used in the experimental setup unit and the architecture of the window is also different. Future work would study the use of T5 fluorescent luminaire lighting control with advanced wireless control systems in a building environment to evaluate the performance of the lighting control unit in terms of reducing the power consumption of
8:00 10:00 12:00 14:00 16:00250
300
350
400
450
500
550
600
650
700
750
Time
Ave
rag
e il
lum
ina
nce
(Lu
x)
Angle 15 DegreeAngle 30 DegreeAngle 45 Degree
Figure 7. Relation between electrical parameters and periods of time within one day at various apertureangles of the window shutters: (a) the voltage level of the experimental setup; (b) T5 fluorescentluminaire current; (c) T5 fluorescent luminaire power; (d) Average illuminance on the task area.
5. Discussion
The goal of energy conservation is to reduce the consumption of energy resources. Lighting is oneof the major sources of energy consumption in buildings and exterior applications, so it is one of theprime targets of mandatory standards to reduce energy consumption. This paper presented a studyof the performance of lighting control with daylighting for T5 fluorescent luminaires to reduce theenergy consumption in a building. The research has been divided into two parts: a simulation on alecture room using DIALux software and an experiment on T5 fluorescent luminaire lighting controlusing an experimental test unit. The simulation showed that that the lecture room with T5 fluorescentluminaires and a window allowing daylight to pass through increases the illuminance on the taskarea, especially in the section near the window but the energy consumption index (in watts per squaremeter) remains unchanged for each time period (or daylight). To overcome this problem, the lightingcontrol with daylighting must properly control the illuminance of the task area at the desired value tomaintain an appropriate average illuminance level and thereby reduce energy consumption.
In the experiment with the test unit, the average illuminance on the task area was also measured,which is necessary for the lighting control unit to set the light output according to the standard (less than500 lux) while reducing the real power consumption and decreasing the average illuminance. The resultfrom the experimental setup shows that upon installing the lighting control unit, the dimmableelectronic ballast is able to decrease the output current level and thereby reduce the power consumptionof the T5 fluorescent luminaire. This illustrates that when applying the proposed control unit withactual building, the sensor will detect higher luminance than black surface in experimental setup dueto luminance value that sensor obtains, which consists of natural light, artificial light and reflectionfrom surface. Hence, the energy consumption can be further decreased. This result is useful fordesigning and installing daylighting systems in buildings to fully harvest natural light and increase theenergy efficiency of the lighting system. The electricity consumption of the lighting can be significantlyreduced if the lighting control with daylighting is integrated with the fluorescent lamps popularlyused currently. The typical building lighting system contains considerably more luminaires than thenumber used in the experimental setup unit and the architecture of the window is also different. Futurework would study the use of T5 fluorescent luminaire lighting control with advanced wireless controlsystems in a building environment to evaluate the performance of the lighting control unit in terms ofreducing the power consumption of the lighting system while maintaining an average illuminance ontask area according to relevant standards.

Sustainability 2018, 10, 4075 18 of 22
6. Conclusions
This research has presented the T5 luminaire daylighting control unit that reduce energyconsumption while maintain illuminance on workplane. The prototype has been tested its performanceon actual field test by built an experimental setup. The methodology and result compare to previousresearch from literature review, it can be seen that many researches mainly focus on control strategy,application or case studies. While this research focus on various perspective from the impact ofdaylight on workplane on different period of time; the control strategy to reduce energy consumptionand maintain illuminance on workplane, performance of prototypes on actual field test with variouslevel of daylight inlet into workplane via louver system and the electrical parameter over the periodthat control unit working.
Result from simulation has shown that daylighting has positive impact on illuminance onworkplane by increase it significantly. While the result from experimental setup shown that proposedcontrol unit can adjust illuminance on workplane within standard value. The power measurementfrom power meter shown that energy consumption has been reduce significantly proportionate tolight output from luminaire. The proposed of prototypes unit are small enough to installed withinluminaire. So, it can be installed to building lighting system that has potential daylight throughwindow. The result showed that the proposed lighting control could achieve significant energy savingin lighting system while maintain lighting quality in term of illuminance on workplane within standardvalue; the real power tends to significantly decrease in comparison to the case without the lightingcontrol to 2 times smaller value. The energy consumption that can be reduce from installed proposeddaylight control unit can indirectly benefit environmental issue from improve energy efficiency inbuilding and with large scale installation it can further reduce fossil fuel usage to generate electricity.
Author Contributions: S.B. conceived, designed the experiments and analyzed the data. A.N. conduct theexperiment and wrote the paper.
Funding: The research is funding (No. 2558A11802136) by the National Research Council of Thailand and theKing Mongkut’s Institute of Technology Ladkrabang Research Fund.
Acknowledgments: The work presented in this paper is part of a research project sponsored (No. 2558A11802136)by the National Research Council of Thailand and the King Mongkut’s Institute of Technology LadkrabangResearch Fund. The authors would like to thank them for their financial support.
Conflicts of Interest: The authors declare no conflict of interest.
References
1. Energy Policy and Planning Office (EPPO), Ministry of Energy. Energy Statistics of Thailand 2017; EPPO:Bangkok, Thailand, 2017.
2. Energy Policy and Planning Office (EPPO), Ministry of Energy. Energy Efficiency Plan 2015; EPPO: Bangkok,Thailand, 2015.
3. Energy Policy and Planning Office (EPPO), Ministry of Energy. Thailand 20 Year Energy Efficiency DevelopmentPlan (EEDP); EPPO: Bangkok, Thailand, 2015.
4. Lombard, C.; Mathews, E.H.; Kleingeld, M. Demand-Side Management through thermal efficiency in SouthAfrican houses. Energy Build. 1999, 29, 229–239. [CrossRef]
5. Lay, J.; Ondraczek, J.; Stoever, J. Renewables in the energy transition: Evidence on solar home systems andlighting fuel choice in Kenya. Energy Econ. 2013, 40, 350–359. [CrossRef]
6. Chan, A.T.; Yeung, V.C.H. Implementing building energy codes in Hong Kong: Energy savings,environmental impacts and cost. Energy Build. 2005, 37, 631–642. [CrossRef]
7. Li, Z.; Quan, S.J.; Yang, P.P.J. Energy performance simulation for planning a low carbon neighborhood urbandistrict: A case study in the city of Macau. Habitat Int. 2016, 53, 206–214. [CrossRef]
8. Krarti, M. Evaluation of large scale building energy efficiency retrofit program in Kuwait. Renew. Sustain.Energy Rev. 2015, 50, 1069–1080. [CrossRef]
9. Sahoo, S.K.; Varma, P.; Lall, K.P.; Talwar, C.K. Energy efficiency in India: Achievements, challenges andlegality. Energy Policy 2016, 88, 495–503. [CrossRef]

Sustainability 2018, 10, 4075 19 of 22
10. Lopes, L.; Hokoi, S.; Miura, H.; Shuhei, K. Energy efficiency and energy savings in Japanese residentialbuildings—Research methodology and surveyed results. Energy Build. 2005, 37, 698–706. [CrossRef]
11. Chandel, S.S.; Sharma, A.; Marwaha, B.M. Review of energy efficiency initiatives and regulations forresidential buildings in India. Renew. Sustain. Energy Rev. 2016, 54, 1443–1458. [CrossRef]
12. Jaber, S.; Ajib, S. Optimum, technical and energy efficiency design of residential building in Mediterraneanregion. Energy Build. 2011, 43, 1829–1834. [CrossRef]
13. Ozturk, M.; Yuksel, Y.E. Energy structure of Turkey for sustainable development. Renew. Sustain. Energy Rev.2016, 53, 1259–1272. [CrossRef]
14. Mangan, S.D.; Oral, G.K. Assessment of residential building performances for the different climate zones ofTurkey in terms of life cycle energy and cost efficiency. Energy Build. 2016, 110, 362–376. [CrossRef]
15. Kusumadewi, T.V.; Limmeechokchai, B. Energy Efficiency Improvement and CO2 Mitigation in ResidentialSector: Comparison between Indonesia and Thailand. Energy Procedia 2015, 79, 994–1000. [CrossRef]
16. Huang, B.; Mauerhofer, V.; Geng, Y. Analysis of existing building energy saving policies in Japan and China.J. Clean. Prod. 2016, 112, 1510–1518. [CrossRef]
17. Zhou, Z.; Zhang, S.; Wang, C.; Zuo, J.; He, Q.; Rameezdeen, R. Achieving energy efficient buildings viaretrofitting of existing buildings: A case study. J. Clean. Prod. 2016, 112, 3605–3615. [CrossRef]
18. Foran, T.; Pont, P.T.D.; Parinya, P.; Phumaraphand, N. Securing energy efficiency as a high priority: Scenariosfor common appliance electricity consumption in Thailand. Energy Effic. 2010, 3, 347–364. [CrossRef]
19. Gangolells, M.; Casals, M.; Forcada, N.; Macarulla, M.; Cuerva, E. Energy mapping of existing building stockin Spain. J. Clean. Prod. 2016, 112, 3895–3904. [CrossRef]
20. Marshall, E.; Steinberger, J.K.; Dupont, V.J.; Foxon, T.J. Combining energy efficiency measure approachesand occupancy patterns in building modelling in the UK residential context. Energy Build. 2016, 111, 98–108.[CrossRef]
21. Tiangket, A.; Chullabodhi, B.; Pas, K.E.O.; Watechagit, S. The Energy Saving Calculation for a ResidentialSector in Thailand with Top-Down Methodology. Energy Procedia 2015, 79, 415–422. [CrossRef]
22. Gago, E.J.; Garcia, J.O.; Estrella, A.E. Development of an energy model for the residential sector: Electricityconsumption in Andalusia, Spain. Energy Build. 2011, 43, 1315–1321. [CrossRef]
23. Zhang, T.; Siebers, P.O.; Aickelin, U. Modelling electricity consumption in office buildings: An agent basedapproach. Energy Build. 2011, 43, 2882–2892. [CrossRef]
24. Taniguchi, A.; Inoue, T.; Otsuki, M.; Yamaguchi, Y.; Shimoda, Y.; Takami, A.; Hanaoka, K. Estimation of thecontribution of the residential sector to summer peak demand reduction in Japan using an energy end-usesimulation model. Energy Build. 2016, 112, 80–92. [CrossRef]
25. Kialashaki, A.; Reisel, J.R. Modeling of the energy demand of the residential sector in the United States usingregression models and artificial neural networks. Appl. Energy 2013, 108, 271–280. [CrossRef]
26. Wang, L.; Mathew, P.; Pang, X. Uncertainties in energy consumption introduced by building operations andweather for a medium-size office building. Energy Build. 2012, 53, 152–158. [CrossRef]
27. Rezaie, B.; Esmailzadeh, E.; Dincer, I. Renewable energy options for buildings: Case studies. Energy Build.2011, 43, 56–65. [CrossRef]
28. Kumar, P.S.; Biswas, S.; Kumari, S. Building integrated photovoltaic generation system. In Proceedingsof the 2014 1st International Conference on Non Conventional Energy (ICONCE), Kalyani, India,16–17 January 2014; pp. 80–83.
29. Hongxing, Y.; Yuyan, F. Building-integrated photovoltaic application—Its practice in Hong Kong.In Proceedings of the 3rd World Conference on Photovoltaic Energy Conversion, Osaka, Japan,11–17 May 2003; pp. 2490–2493.
30. Fathabadi, H. Increasing energy efficiency of PV-converter-battery section of standalone building integratedphotovoltaic systems. Energy Build. 2015, 101, 1–11. [CrossRef]
31. Zhang, W.; Liu, S.; Li, N.; Xie, H.; Li, X. Development forecast and technology roadmap analysis of renewableenergy in buildings in China. Renew. Sustain. Energy Rev. 2015, 49, 395–402. [CrossRef]
32. Escriva, G.E. Basic actions to improve energy efficiency in commercial buildings in operation. Energy Build.2011, 43, 3106–3111. [CrossRef]
33. Danny Harvey, L.D. Reducing energy use in the building sector: Measures, costs, and examples. Energy Effic.2009, 2, 139–163. [CrossRef]

Sustainability 2018, 10, 4075 20 of 22
34. Tan, B.; Yavuz, Y.; Otay, E.N.; Çamlıbel, E. Optimal selection of energy efficiency measures for energysustainability of existing buildings. Comput. Oper. Res. 2016, 66, 258–271. [CrossRef]
35. Lee, D.; Cheng, C.C. Energy savings by energy management systems: A review. Renew. Sustain. Energy Rev.2016, 56, 760–777. [CrossRef]
36. Nisiforou, O.A.; Poullis, S.; Charalambides, A.G. Behaviour, attitudes and opinion of large enterpriseemployees with regard to their energy usage habits and adoption of energy saving measures. Energy Build.2012, 55, 299–311. [CrossRef]
37. Sasidharan, N.; Madhu, M.N.; Singh, J.G.; Ongsakul, W. An approach for an efficient hybrid AC/DCsolar powered Homegrid system based on the load characteristics of home appliances. Energy Build. 2015,108, 23–35. [CrossRef]
38. Prasartkaew, B.; Kumar, S. Design of a renewable energy based air-conditioning system. Energy Build. 2014,68, 156–164. [CrossRef]
39. Bukoski, J.; Gheewala, S.H.; Mui, A.; Smead, M.; Chirarattananon, S. The life cycle assessment of asolar-assisted absorption chilling system in Bangkok, Thailand. Energy Build. 2014, 72, 150–156. [CrossRef]
40. Promjiraprawat, K.; Winyuchakrit, P.; Limmeechokchai, B.; Masui, T.; Hanaoka, T.; Matsuoka, Y. CO2
mitigation potential and marginal abatement costs in Thai residential and building sectors. Energy Build.2014, 80, 631–639. [CrossRef]
41. Ryckaert, W.R.; Lootens, C.; Geldof, J.; Hanselaer, P. Criteria for energy efficient lighting in buildings.Energy Build. 2010, 42, 341–347. [CrossRef]
42. Garcia, E.J.P.; Chen, A.; Santiago, I.; Outeiriño, F.J.B.; Arias, J.M.F.; Munoz, A.M. Stochastic model forlighting’s electricity consumption in the residential sector. Impact of energy saving actions. Energy Build.2015, 89, 245–259. [CrossRef]
43. Yang, H.; Lee, Y. Lighting Scheduling for Energy Saving in Smart House Based on Life Log Data.Procedia Environ. Sci. 2014, 22, 403–413. [CrossRef]
44. Yun, G.Y.; Kim, H.; Kim, J.T. Effects of occupancy and lighting use patterns on lighting energy consumption.Energy Build. 2012, 46, 152–158. [CrossRef]
45. Zhou, X.; Yan, D.; Hong, T.; Ren, X. Data analysis and stochastic modeling of lighting energy use in largeoffice buildings in China. Energy Build. 2015, 86, 275–287. [CrossRef]
46. Preston, D.J.; Woodbury, K.A. Cost-benefit analysis of retrofit of high-intensity discharge factor lighting withenergy-saving alternatives. Energy Effic. 2013, 6, 255–269. [CrossRef]
47. Lam, J.C.W.; Hui, J.C.Y.; Jain, P.K. A Dimmable High Power Factor Single-Switch Electronic Ballast forCompact Fluorescent Lamps With Incandescent Phase-Cut Dimmers. IEEE Trans. Ind. Electron. 2012,59, 1879–1888. [CrossRef]
48. Chiradeja, P.; Ngaopitakkul, A.; Jettanasen, C. Energy savings analysis and harmonics reduction for theelectronic ballast of T5 fluorescent lamp in a building’s lighting system. Energy Build. 2015, 97, 107–117.[CrossRef]
49. Wang, S.C.; Chen, Y.L.; Lin, H.B.; Shen, K.Y.; Huang, K.C. Realization of a High-Efficiency T5 Ballast withMulti-dimming Mechanisms Based on Lamp Arc Modeling. In Proceedings of the 8th IEEE Conference onIndustrial Electronics and Applications (ICIEA), Melbourne, Australia, 19–21 June 2013; pp. 1077–1082.
50. Principi, P.; Fioretti, R. A comparative life cycle assessment of luminaires for general lighting for theoffice—Compact fluorescent (CFL) vs Light Emitting Diode (LED)—A case study. J. Clean. Prod. 2014,83, 96–107. [CrossRef]
51. Ahn, B.L.; Jang, C.Y.; Leigh, S.B.; Yoo, S.; Jeong, H. Effect of LED lighting on the cooling and heating loads inoffice buildings. Appl. Energy 2014, 113, 1484–1489. [CrossRef]
52. Tetri, E.; Sarvaranta, A.; Syri, S. Potential of new lighting technologies in reducing household lighting energyuse and CO2 emissions in Finland. Energy Effic. 2014, 7, 559–570. [CrossRef]
53. Carrillo, C.; Dorado, E.D.; Cidras, J.; Pregal, A.B.; Falcon, P.; Fernandez, A.; Sanchez, A.A. Lighting controlsystem based on digital camera for energy saving in shop windows. Energy Build. 2013, 59, 143–151.[CrossRef]
54. Soori, P.K.; Vishwas, M. Lighting control strategy for energy efficient office lighting system design.Energy Build. 2013, 66, 329–337. [CrossRef]

Sustainability 2018, 10, 4075 21 of 22
55. Wang, Y.; Dasgupta, P. Designing an adaptive lighting control system for smart buildings and homes.In Proceedings of the IEEE 12th International Conference on Networking, Sensing and Control (ICNSC),Taipei, Taiwan, 9–11 April 2015; pp. 450–455.
56. Yin, C.; Stark, B.; Chen, Y.Q.; Zhong, S.M.; Lau, E. Fractional-order adaptive minimum energy cognitivelighting control strategy for the hybrid lighting system. Energy Build. 2015, 87, 176–184. [CrossRef]
57. Manganelli, M.; Consalvi, R. Design and energy performance assessment of high-efficiency lighting systems.In Proceedings of the IEEE 15th International Conference on Environment and Electrical Engineering (EEEIC),Rome, Italy, 10–13 June 2015; pp. 1035–1040.
58. Yi, Y.K. Adaptation of Kriging in daylight modeling for energy simulation. Energy Build. 2016, 111, 479–496.[CrossRef]
59. Tsuei, C.H.; Sun, W.S. Simulating the Illuminance and Efficiency of Sunlight/LED Hybrid IlluminatingSystem Used in Indoor Lighting Design. In Proceedings of the 2009 Symposium on Photonics andOptoelectronics, Wuhan, China, 14–16 August 2009; pp. 1–4.
60. Mayhoub, M.; Carter, D. A feasibility study for hybrid lighting systems. Energy Build. 2012, 53, 83–94.[CrossRef]
61. Fasi, M.A.; Budaiwi, I.M. Energy performance of windows in office buildings considering daylight integrationand visual comfort in hot climates. Energy Build. 2015, 108, 307–316. [CrossRef]
62. Gentile, N.; Dubois, M.C.T.; Laike, T. Daylight harvesting control systems design recommendations based ona literature review. In Proceedings of the IEEE 15th International Conference on Environment and ElectricalEngineering (EEEIC), Rome, Italy, 10–13 June 2015; pp. 632–637.
63. Parise, L.; Lamonaca, F.; Carnì, D.L. Interior lighting control system: A practical case using daylightharvesting control strategy. In Proceedings of the 2015 IEEE 15th International Conference on Environmentand Electrical Engineering (EEEIC), Rome, Italy, 10–13 June 2015; pp. 719–724.
64. Verso, V.R.M.L.; Invernizzi, S.; Carlin, A.; Polato, A. Towards the factory of the future: A new concept basedon optimized daylighting for comfort and energy saving. In Proceedings of the 2015 IEEE 15th InternationalConference on Environment and Electrical Engineering (EEEIC), Rome, Italy, 10–13 June 2015; pp. 701–706.
65. Kumar, R. New algorithms for daylight harvesting in a private office. In Proceedings of the 2015 18thInternational Conference on Information Fusion (Fusion), Washington, DC, USA, 6–9 July 2015; pp. 383–392.
66. Hansen, V.G.; Edmonds, I. Methods for the illumination of multilevel buildings with vertical light pipes.Sol. Energy 2015, 117, 74–88. [CrossRef]
67. Seo, D.; Park, L.; Ihm, P.; Krarti, M. Optimal electrical circuiting layout and desk location for daylightingcontrolled spaces. Energy Build. 2012, 51, 122–130. [CrossRef]
68. Caicedo, D.; Pandharipande, A. Sensor-Driven Lighting Control with Illumination and Dimming Constraints.IEEE Sens. J. 2015, 15, 5169–5176. [CrossRef]
69. Fonseca, R.W.D.; Didone, E.L.; Pereira, F.O.R. Using artificial neural networks to predict the impact ofdaylighting on building final electric energy requirements. Energy Build. 2013, 61, 31–38. [CrossRef]
70. Gorgulu, S.; Ekren, N. Energy saving in lighting system with fuzzy logic controller which uses light-pipeand dimmable ballast. Energy Build. 2013, 61, 172–176. [CrossRef]
71. Bellia, L.; Fragliasso, F.; Pedace, A. Evaluation of Daylight Availability for Energy Savings. J. Daylighting2015, 2, 12–20. [CrossRef]
72. Parise, G.; Martirano, L. Daylight Impact on Energy Performance of Internal Lighting. IEEE Trans. Ind. Appl.2013, 49, 242–249. [CrossRef]
73. Li, D.H.W. A review of daylight illuminance determinations and energy implications. Appl. Energy 2010,87, 2109–2118. [CrossRef]
74. Kyle, K.; Lee, E.S. Measured daylighting potential of a static optical louver system under real sun and skyconditions. Build. Environ. 2015, 92, 347–359.
75. Acosta, I.; Munoz, C.; Campano, M.A.; Navarro, J. Analysis of daylight factors and energy saving allowedby windows under overcast sky conditions. Renew. Energy 2015, 77, 194–207. [CrossRef]
76. Sudan, M.; Tiwari, G.N.; Helal, I.M.A. A daylight factor model under clear sky conditions for building:An experimental validation. Sol. Energy 2015, 115, 379–389. [CrossRef]
77. Bellia, L.; Pedace, A.; Fragliasso, F. Dynamic daylight simulations: Impact of weather file’s choice. Sol. Energy2015, 117, 224–235. [CrossRef]

Sustainability 2018, 10, 4075 22 of 22
78. Edwards, L.; Torcellini, P. A Literature Review of the Effects of Natural Light on Building Occupants; NationalRenewable Energy Laboratory: Golden, CO, USA, 2002.
79. Konis, K.S. Effective Daylighting: Evaluating Daylighting Performance in the San Francisco Federal Buildingfrom the Perspective of Building Occupants. Ph.D. Thesis, University of California, Berkeley, CA, USA, 2011.
80. Comité Européen de Normalisation (CEN). EN 12464-1: Light and Lighting—Lighting of Work Places, Part 1:Indoor Work Places; CEN: Brussels, Belgium, 2002.
81. International Commission on Illumination (CIE). CIE S 008/E: 2001: Lighting of Work Places—Part 1: Indoor;CIE: Vienna, Austria, 2001.
© 2018 by the authors. Licensee MDPI, Basel, Switzerland. This article is an open accessarticle distributed under the terms and conditions of the Creative Commons Attribution(CC BY) license (http://creativecommons.org/licenses/by/4.0/).