Robust Control Toolbox (Control Robusto), Model Predictive Control Toolbox (Control Predictivo
Upload
independentCategory
view
4download
0
International Journal of Greenhouse Gas Control 4 (2010) 351–366
Feasibility of storing CO2 in the Utsira formation as part of a long termDutch CCS strategyAn evaluation based on a GIS/MARKAL toolbox
Machteld van den Broek a,*, Andrea Ramırez a, Heleen Groenenberg b, Filip Neele c,Peter Viebahn d, Wim Turkenburg a, Andre Faaij a
a Group Science, Technology and Society, Copernicus, Institute for Sustainable Development and Innovation, Utrecht, University, Heidelberglaan 2, 3584 CS Utrecht, the Netherlandsb ECN, Westerduinweg 3, Petten, the Netherlandsc TNO Built Environment and Geosciences, Princetonlaan 6, 3508 TA Utrecht, the Netherlandsd Wuppertal institute for Climate, Environment, and Energy, Doppersberg 19, 42103 Wuppertal, Germany
A R T I C L E I N F O
Article history:
Received 21 April 2009
Received in revised form 31 August 2009
Accepted 1 September 2009
Available online 26 September 2009
Keywords:
CO2 capture transport and storage
Linear optimisation
GIS
MARKAL
Energy systems model
A B S T R A C T
This study provides insight into the feasibility of a CO2 trunkline from the Netherlands to the Utsira
formation in the Norwegian part of the North Sea, which is a large geological storage reservoir for CO2.
The feasibility is investigated in competition with CO2 storage in onshore and near-offshore sinks in the
Netherlands. Least-cost modelling with a MARKAL model in combination with ArcGIS was used to assess
the cost-effectiveness of the trunkline as part of a Dutch greenhouse gas emission reduction strategy for
the Dutch electricity sector and CO2 intensive industry. The results show that under the condition that a
CO2 permit price increases from s25 per tCO2 in 2010 to s60 per tCO2 in 2030, and remains at this level
up to 2050, CO2 emissions in the Netherlands could reduce with 67% in 2050 compared to 1990, and
investment in the Utsira trunkline may be cost-effective from 2020–2030 provided that Belgian and
German CO2 is transported and stored via the Netherlands as well. In this case, by 2050 more than 2.1
GtCO2 would have been transported from the Netherlands to the Utsira formation. However, if the Utsira
trunkline is not used for transportation of CO2 from Belgium and Germany, it may become cost-effective
10 years later, and less than 1.3 GtCO2 from the Netherlands would have been stored in the Utsira
formation by 2050. On the short term, CO2 storage in Dutch fields appears more cost-effective than in the
Utsira formation, but as yet there are major uncertainties related to the timing and effective exploitation
of the Dutch offshore storage opportunities.
� 2009 Elsevier Ltd. All rights reserved.
Contents lists available at ScienceDirect
International Journal of Greenhouse Gas Control
journa l homepage: www.e lsev ier .com/ locate / i jggc
1. Introduction
1.1. Overview
CO2 capture and storage (CCS) is increasingly considered acrucial technology for mitigating climate change (IPCC, 2007). Animportant precondition for the implementation of CCS, however,will be the realisation of a CO2 transport and storage infrastructure.In North West Europe part of this infrastructure may beconstructed in the North Sea because of the large CO2 storagepotentials that have been identified there. For example, in theNorwegian part of the North Sea, storage capacity has beenestimated to be 148 GtCO2 in aquifers, 4.4 GtCO2 in gas fields, and4.8 GtCO2 in oil fields (BERR, 2007; Bøe et al., 2002). In the part ofthe North Sea that belongs to the United Kingdom (UK), the storage
* Corresponding author. Tel.: +31 30 2532216.
E-mail address: [email protected] (M. van den Broek).
1750-5836/$ – see front matter � 2009 Elsevier Ltd. All rights reserved.
doi:10.1016/j.ijggc.2009.09.002
potential has been estimated to be 14.5 GtCO2 in aquifers, 6.0GtCO2 in gas fields, and 4.2 GtCO2 in oil fields (BERR, 2007).
The geological reservoirs under the North Sea with very largeCO2 storage potentials (e.g. large reservoirs in the BunterSandstone formation in the UK part of the North Sea, or the Utsiraformation in the Norwegian part of the North Sea) may beindispensable when large amounts of CO2 need to be stored(Damen et al., 2009). A North Sea pipeline network could connectCO2 sources in countries around the North Sea to such a geologicalstorage reservoir. So far most studies of trans-boundary transportcrossing the North Sea have concentrated on the use of CO2 forenhanced oil recovery (EOR). For example, Markussen et al. (2002)looked at the use of large volumes of CO2 from the UK, Denmark,and Norway for EOR on the North Sea continental shelf. Accordingto them it is cost-effective to sequester around 680 MtCO2 in theNorth Sea while at the same time producing an additional amountof two billion barrels of oil. More recently, a study in the UK (BERR,2007), which examined a CO2 infrastructure for storing CO2 fromUK and Norwegian sources in the North Sea, found that only for the
2 Pulverised coal-fired power plants with oxyfuel combustion and CO2 removal
were not included, because they are not clearly different from PC power plants with
M. van den Broek et al. / International Journal of Greenhouse Gas Control 4 (2010) 351–366352
purpose of EOR, it would be worthwhile to transport CO2 from theUK to Norway.1 Also in the Netherlands, a study of the RotterdamClimate Initiative to reduce CO2 emissions in the Rotterdam region,considered CO2 transport to Norway only for EOR purposes (Hoog,2008). Furthermore, the authors of the IEA GHG study, whichcalculated cost curves of CO2 transport and storage for Europe (IEAGHG, 2005a), did not include the aquifers with large CO2 storagepotentials such as the Utsira formation in their analysis. However,recent broader analyses (Broek et al., 2008, 2009; Damen et al.,2009) showed that CO2 storage in very large geological storagereservoirs, can make CO2 trans-boundary transport for the merepurpose of CO2 storage an interesting option as well. Yet, a decisionto invest in a major trunkline across the North Sea to such areservoir, requires additional insights into its feasibility withrespect to costs and organisation.
In this paper, we, therefore, aim to assess the cost-effectivenessof CCS and CO2 storage in a very large formation under the NorthSea in competition with CCS and CO2 storage in smaller nearbyformations or in competition with other CO2 mitigation options.We also try to identify the boundary conditions that makeinvestments in a major CO2 pipeline across the North Seaworthwhile, and to assess suitable routings for this pipeline.Finally, we will make a first inventory of organisational issuesrelated to its construction.
We will investigate these issues by investigating the specific caseof a CO2 trunkline from the Netherlands to the Utsira formation. Thisformation has already been used for CO2 injection from 1996 in theSleipner project, the first commercial project to store CO2 in a salineaquifer (Gale et al., 2001; Hermanrud et al., 2009; Torp and Gale,2004). This formation consisting of sand and sandstone, is locatedeast of Norway from ca 588N to 628N and covers an area of up to470 km in North-South direction and up to 100 km in East-Westdirection, the thickness is probably not more than 250 m, and islocated at a depth of 500–1500 m below the sea floor (Bøe et al.,2002) and a water depth of 80–100 m (Torp and Brown, 2004). Theformation is of special interest due to its enormous theoretical CO2
storage potential (42 GtCO2) and its high permeability (Bøe et al.,2002). The permeability is in the order of 3500 mD, and the porosityranges from 27% to 42% (Torp and Gale, 2004). By using a generalstorage efficiency of 6% for open aquifers, the pore volume that canbe used for CO2 storage is estimated to be 55 km3 (Bøe et al., 2002).Furthermore, it is overlain by the Nordland shale (Bøe et al., 2002)consisting of fine-grained clays or silty clays, through which it isunlikely that CO2 will leak (Kemp et al., 2002).
The structure of this paper is as follows. Details about theadopted methodology and input data can be found in Section 2.Results are presented and discussed in Sections 3 and 4. In Section5 we discuss a few organisational issues, and finally in Section 6conclusions are drawn with respect to the feasibility of a CO2
trunkline from the Netherlands to the Utsira formation. It shouldbe noted that the scope of the study is limited to sources that emitmore than 100 ktCO2 in the industrial, electricity and cogenerationsector in which CO2 capture can be applied. In this paper, adiscount rate of 7% is used, and all costs are in s2007.
2. Methodology
2.1. Overview
To evaluate the techno-economic feasibility of a CO2 trunklinefrom the Netherlands to the Utsira formation, temporal and spatial
1 For the purpose of CO2 storage only, they found that sufficient storage capacity
is available for the UK on its own territory. Most of the UK sources which are in the
region of East Midlands and South Yorkshire, are even close to the sinks (gas fields
as well as saline aquifers) on the UK territory in the Southern part of the North Sea.
dimensions need to be taken into account explicitly. Therefore weuse a toolbox integrating ArcGIS, a geographical informationsystem (GIS) with elaborated spatial and routing functions, and theMARKAL (an acronym for MARKet ALlocation) tool, which cangenerate energy bottom-up models to calculate energy technologyconfigurations over time (Loulou et al., 2004). More specifically, weapply the MARKAL implementation of the Dutch electricity andcogeneration sector, MARKAL-NL-UU, that was used earlier toassess possible CCS deployment trajectories in the Netherlands(Broek et al., 2008). In MARKAL-NL-UU, technologies that convertprimary energy carriers (e.g. coal, gas, uranium) or renewables (e.g.wind, biomass, and solar) into final energy carriers (electricity andheat), are modelled. Furthermore, MARKAL-NL-UU includes CO2
transport and sink technologies, and industrial technologies thatproduce other types of products (e.g. steel, hydrogen). The modelcan determine the deployment of CCS and other CO2 mitigationmeasures like photovoltaic cells, wind turbines, or biomass co-firing by minimising the net present value of all system costs.Furthermore, it assesses which sources, sinks, and transportoptions will be used over time and to what extent. The period ofanalysis is 2010–2050, and a time step of 5 years is used.
The application of this toolbox provides blueprints of thedevelopment of a CO2 infrastructure in the Netherlands takinginto account CO2 emission sources in Germany and Belgium.Insights can be obtained into possible CO2 pipelines routings andtheir associated costs, and the amounts of CO2 that can becaptured in different Dutch regions and stored in Dutch sinks(onshore or near-offshore) or in the Norwegian Utsira formation.The methodology, which is described in detail by Broek et al.(2009), can be summarized in four main steps related toprocessing data for CO2 sources, CO2 sinks, and pipelines. Thefourth step concerns the specification and running of MARKAL-NL-UU (see Fig. 1).
In the rest of this section, we describe the individual steps inmore detail with a focus on relevant issues for assessing thespecific case of an Utsira trunkline from the Netherlands.
2.2. Inventory of sources
2.2.1. CO2 from inside the Netherlands
Under the condition of a strict climate policy, CO2 emissions canbe reduced by capturing them at large scale fossil-fuelled powerplants, industrial processes generating small quantities of pure CO2
(e.g. hydrogen, ammonia, or ethylene oxide production units) orlarge quantities at a single site (e.g. steel industry, refineries, orethylene production units) (Damen et al., 2009). Therefore, theinventory of potential sites for CO2 capture in the Netherlands inthe period 2010–2050 includes the sites of the 24 large scale powerplants, 15 industrial plants, and 4 probable locations for newpower plants (43 sources in total). The capture units at powerplants can be post-combustion units at natural gas combined cyclepower plants (NGCC) or pulverised coal-fired power plants withpossibly biomass co-firing (PC), post-combustion retrofit units forPCs, or pre-combustion units at integrated coal (with possiblybiomass) gasification combined cycle power plants (IGCC).2 Fig. 2shows the 43 locations where CO2 may be captured in the future,and how they are clustered into seven source regions as describedin (Broek et al., 2009). Per region it is known when the existingpower plants will be decommissioned.3 Consequently, MARKAL-
a post-combustion CO2 capture unit with respect to cost-effectiveness (Damen
et al., 2006).3 Based on the age of existing power plants, plans of energy companies and/or a
life time of 40 years for NGCC and IGCC, and 50 years for PC. For more details on the
vintage structure of the electricity sector see Damen et al. (2006).

Fig. 1. Schematic representation of the methodological approach in this analysis.
Fig. 2. Clustering of potential CO2 source locations into source regions (a) and potential CO2 sinks into sink regions (b). The names of the regions are specified in the maps. Note
that some sources are almost at the same location, and thus cannot be distinguished from each other on the map. The Utsira formation offshore Norway is not shown.
M. van den Broek et al. / International Journal of Greenhouse Gas Control 4 (2010) 351–366 353
NL-UU can calculate when in the Netherlands new power plants(see Section 2.5 for more details) are needed to meet the futureelectricity demand, selects the types of power plants, and selectsthe source regions where these new power plants will beconstructed. For the industrial units, it is assumed that theindustrial production continues at today’s level, and the costs for
necessary replacement of these units are not included in MARKAL-NL-UU.
2.2.2. CO2 from outside the Netherlands
In the Belgian part close to the Zeeland region, the German partclose to the Eemsmond region, and the North Rhein-Westfalian
8 The Slochteren field in the province Groningen has an estimated CO2 storage
capacity of about 7 GtCO2. This gas producing field is considered unavailable for
storage before 2050 and therefore it is not considered in this project (NLOG, 2007).9 NOGEPA (2008) recently published a study with slightly different storage
potentials due to different techno-economic thresholds. They estimated Dutch
M. van den Broek et al. / International Journal of Greenhouse Gas Control 4 (2010) 351–366354
(NRW) part of Germany (close to the Limburg and Maas and Waalregion), many large point sources of CO2 exist, but nearby storagesites for these sources are limited. While the total storage potentialfor Germany was first estimated to be in the order of 10–40 GtCO2
(May et al., 2005), the most recent assessment (EU Geocapacity,2009) results in 17 GtCO2 storage capacity (mainly in aquifers)which would be sufficient for 37 years of emissions from theexisting large point sources in Germany. Unfortunately, althoughthe large stationary sources in the Ruhr area in NRW emit nearly50% of the German CO2, NRW has only one aquifer with a storagecapacity of some more than 100 MtCO2 (with a 90% probability)and in total, a capacity of 348 MtCO2 in aquifers could exist there(GD and BGR, 2005).4 Therefore, an enormous pipeline infra-structure would be required to store the CO2 from NRW sources inthe German sinks, which are mainly located in the North ofGermany. For Belgium, the recent CO2 storage assessment (EUGeocapacity, 2009) yields a storage capacity of only 199 MtCO2
compared to 58 Mt of annual CO2 emissions from large Belgiansources. For these reasons, storage outside the German and Belgianterritories should be taken into consideration. Possible optionswould be to transport the CO2 to Dutch sinks or via the Netherlandsto the Utsira formation.
Data on the CO2 capture potentials from CO2 sources in NRW,were derived from recent studies of a CCS infrastructure in NRW(Viebahn et al., 2009a,b) (Fig. 3). Although NRW plans to replacemost old power plants by highly efficient new ones before 2020,this is not sufficient to reach an 80%5 reduction of greenhouse gasemissions compared to the 1990 level by 2050 in Germany. A partof the solution could be the application of CCS. In the mentionedNRW studies, the infrastructural requirements necessary to realisesuch a scenario, were assessed. The maximum CO2 flows werecalculated that can be captured under the condition that the CO2
permit price is high enough. It was investigated which powerplants could be retrofitted with post-combustion CO2 capture orreplaced as thermal or IGCC power plants with CCS from 2020 inNRW. For economic reasons, only power plants were consideredfor retrofit with a CO2 capture unit that will not be older than 12years in 2020.6 Furthermore, the CO2 capture potential at bigindustrial emitters was assessed.
Data on CO2 capture potentials from sources in Belgium close toZeeland and in Germany close to Eemsmond are derived from theGESTCO project (Hendriks and Egberts, 2003).7 It is assumed that inBelgium a pure CO2 emission stream of 1 MtCO2/yr can be storedfrom 2015, and CO2 from the other Belgian sources after 2020.Furthermore, it is assumed that a new coal-fired power plantaccording to E.ON’s plan (E.ON, 2007) will be built and can beequipped with a CO2 capture unit (6 MtCO2/yr) before 2020.Table 1 presents the resulting CO2 capture potentials from thedifferent foreign regions.
4 In the NRW area, also a maximum of 160 MtCO2 may be stored in coal seams
with enhanced coal-bed methane recovery (ECBM). However, the application of
ECBM is restricted due to the low permeabilities and large depth of the coal deposits
(Kronimus et al., 2008).5 To reach a greenhouse gas concentration below 500 ppm CO2-equivalent,
which is needed to keep global mean surface air temperature increase around 2.0–
2.4 8C, worldwide CO2 emissions need to reduce by 50–85% compared to 2000 levels
and CO2 emissions should peak before 2015 (IPCC, 2007). Furthermore, the CO2
emission reduction in developed countries need to be substantially more than in
developing countries (IEA, 2008), up to 80% compared to 1990 level (EU Council
Environment, 2005).6 According to McKinsey (2008), only power plants not older than 12 years will be
retrofitted from 2020, because they estimated total CCS costs to be at least 30%
higher for older (same scale) plants, and possibly much more, depending on the
specific case.7 Sources are considered with pure CO2 streams or emissions of more than 2
MtCO2/yr. Furthermore, Belgian sources are included which are located at latitude
>518N and longitude <4.68E, and German sources (close to Eemsmond) that are
located at latitude >538N and at longitude <8.88E.
2.3. Inventory of sinks
In this study 172 Dutch sinks are considered for CO2
storage. Only hydrocarbon fields are considered with astorage capacity >4 MtCO2, and aquifers with a storagecapacity >2 MtCO2. Together these sinks are assumed to havean effective capacity potential of 1.8 GtCO2 (81 sinks) onshoreand 1.3 GtCO2 (87 sinks) offshore.8,9 From these fields 35 areaquifers, 131 are gas fields, 5 are oil fields and 1 field containsboth oil and gas. The storage potential of aquifers amount to0.25 GtCO2 onshore, and 0.15 GtCO2 offshore. Apart from theDutch fields, the large aquifer in the Utsira formation in theNorwegian part of the North Sea with an estimated capacity of42 GtCO2 (Bøe et al., 2002) is investigated. Clustering the sinksinto sink regions (Broek et al., 2009) resulted in three onshoreregions in the North East of the Netherlands, two onshoreregions in the West of the Netherlands, two offshore regions inthe Dutch part of the North Sea, and the Utsira formationoffshore Norway (see Fig. 2). In this paper we will refer to theDutch offshore fields as near-offshore fields because they arelocated between 20 and 200 km away from the Dutch coastwhile the Utsira formation is more than 750 km away. Finally,CO2 storage in German or Belgian sinks is not considered as anoption in this paper.
Per sink, investment, and operating, maintenance, andmonitoring (O&M&M) costs are specified on the basis of depth,thickness, CO2 storage capacity, and injectivity per well. Adistinction is made between storage in onshore fields and near-offshore fields, and between hydrocarbon fields (gas and oil) andaquifers. Specific cost data are used for storage in the NorwegianUtsira formation. It is assumed that aquifers are available fromthe start, and gas fields become available when gas productionhas ceased. These dates are based on the production reports ofthe oil and gas exploration companies and are sometimebetween 2005 and 2025.10 Near-offshore CO2 injection facilitiescan be installed on existing platforms, thus limiting expendi-tures to the costs of conversion of the platform and wellworkovers. However, the period in which a platform may be re-used, the window-of-opportunity, is limited. Once most of theresources within reach of a platform have been produced, it isoften not economic to continue the production activities at thisplatform because of its high operating costs.11 Then, whenproduction activities cease, the platform needs to be removed as
offshore storage capacity to be around 0.9 Gt. The study did not include any storage
in offshore aquifers (0.14 GtCO2). Furthermore, the NOGEPA study only included
fields with more than 2.5 MtCO2 storage capacity that were still producing, fields
with temporarily ceased production, or with a Field Development Plan. Abandoned
fields were left out. In addition, to ensure a reasonable injectivity, only fields, for
which the product of permeability and thickness was higher than a chosen
threshold value of 0.25 Darcy meter, were considered. NOGEPA, which is the
association of companies holding licences to explore for, develop and produce
hydrocarbons on- and off-shore in the Netherlands, has access to confidential
production data to make such injectivity estimations per field.10 The year in which gas field are released, however, shifts ahead, because gas
production continues longer due to higher revenues and new production
technologies (TNO, 2007). Because it is not known beforehand how much longer
production will continue in specific fields, we did not take this shift into our
analysis.11 For example, in Ireland, it is estimated that after 30 years of production 95% of
the ultimate recoverable gas reserves has been produced from the Kinsale Head gas
field, and that it approaches the end of its economic lifetime. The overhead costs of
the platform are considered too high to produce small amounts of gas (CSA Group,
2008). Consequently, without any other purpose for the infrastructure in the near
future, the platform needs to be decommissioned.
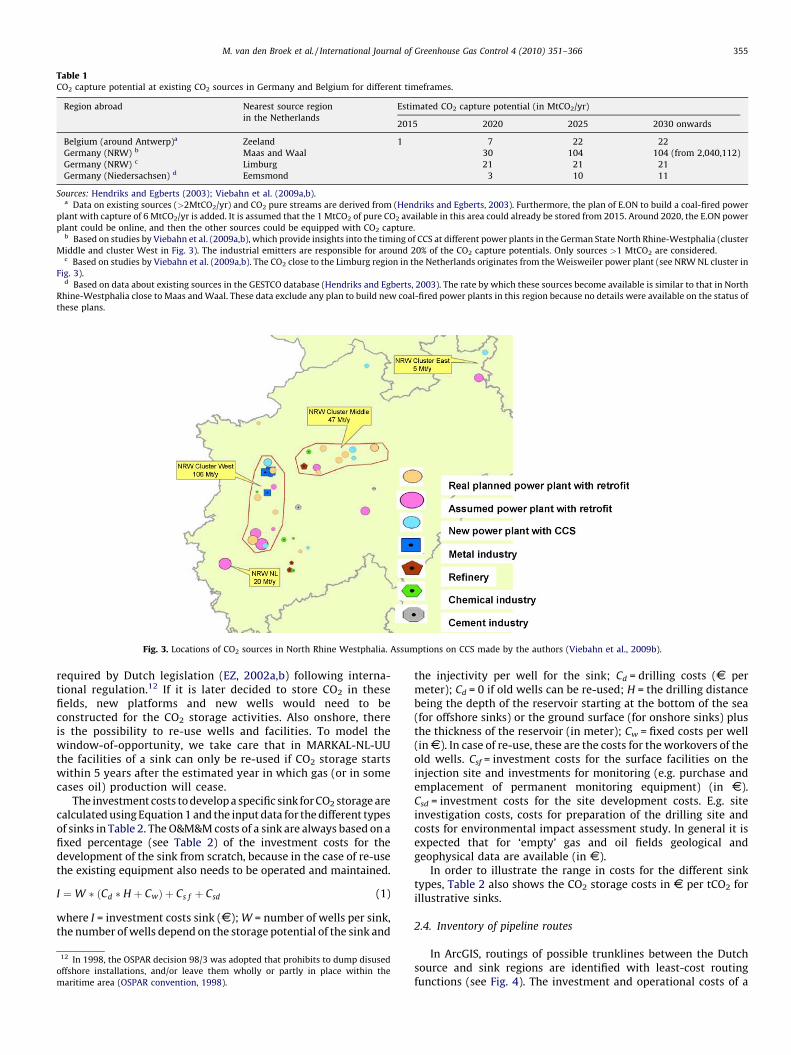
Table 1CO2 capture potential at existing CO2 sources in Germany and Belgium for different timeframes.
Region abroad Nearest source region
in the Netherlands
Estimated CO2 capture potential (in MtCO2/yr)
2015 2020 2025 2030 onwards
Belgium (around Antwerp)a Zeeland 1 7 22 22
Germany (NRW) b Maas and Waal 30 104 104 (from 2,040,112)
Germany (NRW) c Limburg 21 21 21
Germany (Niedersachsen) d Eemsmond 3 10 11
Sources: Hendriks and Egberts (2003); Viebahn et al. (2009a,b).a Data on existing sources (>2MtCO2/yr) and CO2 pure streams are derived from (Hendriks and Egberts, 2003). Furthermore, the plan of E.ON to build a coal-fired power
plant with capture of 6 MtCO2/yr is added. It is assumed that the 1 MtCO2 of pure CO2 available in this area could already be stored from 2015. Around 2020, the E.ON power
plant could be online, and then the other sources could be equipped with CO2 capture.b Based on studies by Viebahn et al. (2009a,b), which provide insights into the timing of CCS at different power plants in the German State North Rhine-Westphalia (cluster
Middle and cluster West in Fig. 3). The industrial emitters are responsible for around 20% of the CO2 capture potentials. Only sources >1 MtCO2 are considered.c Based on studies by Viebahn et al. (2009a,b). The CO2 close to the Limburg region in the Netherlands originates from the Weisweiler power plant (see NRW NL cluster in
Fig. 3).d Based on data about existing sources in the GESTCO database (Hendriks and Egberts, 2003). The rate by which these sources become available is similar to that in North
Rhine-Westphalia close to Maas and Waal. These data exclude any plan to build new coal-fired power plants in this region because no details were available on the status of
these plans.
Fig. 3. Locations of CO2 sources in North Rhine Westphalia. Assumptions on CCS made by the authors (Viebahn et al., 2009b).
M. van den Broek et al. / International Journal of Greenhouse Gas Control 4 (2010) 351–366 355
required by Dutch legislation (EZ, 2002a,b) following interna-tional regulation.12 If it is later decided to store CO2 in thesefields, new platforms and new wells would need to beconstructed for the CO2 storage activities. Also onshore, thereis the possibility to re-use wells and facilities. To model thewindow-of-opportunity, we take care that in MARKAL-NL-UUthe facilities of a sink can only be re-used if CO2 storage startswithin 5 years after the estimated year in which gas (or in somecases oil) production will cease.
The investment costs to develop a specific sink for CO2 storage arecalculated using Equation 1 and the input data for the different typesof sinks in Table 2. The O&M&M costs of a sink are always based on afixed percentage (see Table 2) of the investment costs for thedevelopment of the sink from scratch, because in the case of re-usethe existing equipment also needs to be operated and maintained.
I ¼W � ðCd � H þ CwÞ þ Cs f þ Csd (1)
where I = investment costs sink (s); W = number of wells per sink,the number of wells depend on the storage potential of the sink and
12 In 1998, the OSPAR decision 98/3 was adopted that prohibits to dump disused
offshore installations, and/or leave them wholly or partly in place within the
maritime area (OSPAR convention, 1998).
the injectivity per well for the sink; Cd = drilling costs (s permeter); Cd = 0 if old wells can be re-used; H = the drilling distancebeing the depth of the reservoir starting at the bottom of the sea(for offshore sinks) or the ground surface (for onshore sinks) plusthe thickness of the reservoir (in meter); Cw = fixed costs per well(in s). In case of re-use, these are the costs for the workovers of theold wells. Csf = investment costs for the surface facilities on theinjection site and investments for monitoring (e.g. purchase andemplacement of permanent monitoring equipment) (in s).Csd = investment costs for the site development costs. E.g. siteinvestigation costs, costs for preparation of the drilling site andcosts for environmental impact assessment study. In general it isexpected that for ‘empty’ gas and oil fields geological andgeophysical data are available (in s).
In order to illustrate the range in costs for the different sinktypes, Table 2 also shows the CO2 storage costs in s per tCO2 forillustrative sinks.
2.4. Inventory of pipeline routes
In ArcGIS, routings of possible trunklines between the Dutchsource and sink regions are identified with least-cost routingfunctions (see Fig. 4). The investment and operational costs of a
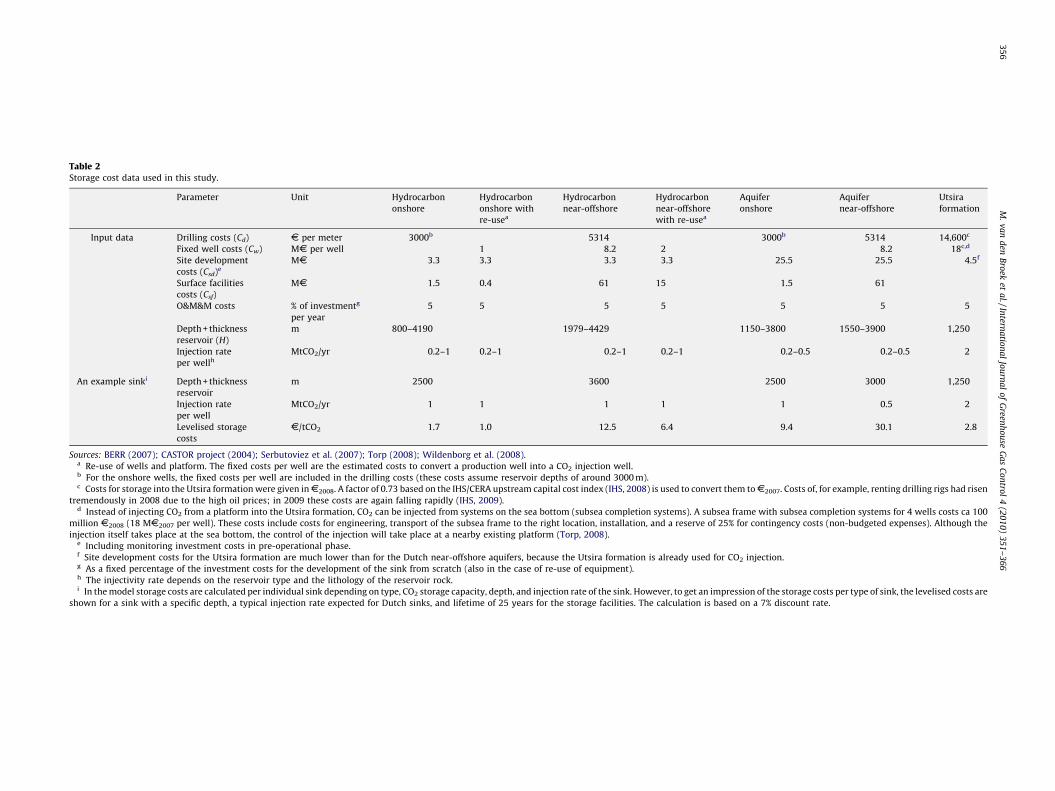
Table 2Storage cost data used in this study.
Parameter Unit Hydrocarbon
onshore
Hydrocarbon
onshore with
re-usea
Hydrocarbon
near-offshore
Hydrocarbon
near-offshore
with re-usea
Aquifer
onshore
Aquifer
near-offshore
Utsira
formation
Input data Drilling costs (Cd) s per meter 3000b 5314 3000b 5314 14,600c
Fixed well costs (Cw) Ms per well 1 8.2 2 8.2 18c,d
Site development
costs (Csd)e
Ms 3.3 3.3 3.3 3.3 25.5 25.5 4.5f
Surface facilities
costs (Csf)
Ms 1.5 0.4 61 15 1.5 61
O&M&M costs % of investmentg
per year
5 5 5 5 5 5 5
Depth + thickness
reservoir (H)
m 800–4190 1979–4429 1150–3800 1550–3900 1,250
Injection rate
per wellh
MtCO2/yr 0.2–1 0.2–1 0.2–1 0.2–1 0.2–0.5 0.2–0.5 2
An example sinki Depth + thickness
reservoir
m 2500 3600 2500 3000 1,250
Injection rate
per well
MtCO2/yr 1 1 1 1 1 0.5 2
Levelised storage
costs
s/tCO2 1.7 1.0 12.5 6.4 9.4 30.1 2.8
Sources: BERR (2007); CASTOR project (2004); Serbutoviez et al. (2007); Torp (2008); Wildenborg et al. (2008).a Re-use of wells and platform. The fixed costs per well are the estimated costs to convert a production well into a CO2 injection well.b For the onshore wells, the fixed costs per well are included in the drilling costs (these costs assume reservoir depths of around 3000 m).c Costs for storage into the Utsira formation were given in s2008. A factor of 0.73 based on the IHS/CERA upstream capital cost index (IHS, 2008) is used to convert them to s2007. Costs of, for example, renting drilling rigs had risen
tremendously in 2008 due to the high oil prices; in 2009 these costs are again falling rapidly (IHS, 2009).d Instead of injecting CO2 from a platform into the Utsira formation, CO2 can be injected from systems on the sea bottom (subsea completion systems). A subsea frame with subsea completion systems for 4 wells costs ca 100
million s2008 (18 Ms2007 per well). These costs include costs for engineering, transport of the subsea frame to the right location, installation, and a reserve of 25% for contingency costs (non-budgeted expenses). Although the
injection itself takes place at the sea bottom, the control of the injection will take place at a nearby existing platform (Torp, 2008).e Including monitoring investment costs in pre-operational phase.f Site development costs for the Utsira formation are much lower than for the Dutch near-offshore aquifers, because the Utsira formation is already used for CO2 injection.g As a fixed percentage of the investment costs for the development of the sink from scratch (also in the case of re-use of equipment).h The injectivity rate depends on the reservoir type and the lithology of the reservoir rock.i In the model storage costs are calculated per individual sink depending on type, CO2 storage capacity, depth, and injection rate of the sink. However, to get an impression of the storage costs per type of sink, the levelised costs are
shown for a sink with a specific depth, a typical injection rate expected for Dutch sinks, and lifetime of 25 years for the storage facilities. The calculation is based on a 7% discount rate.
M.
va
nd
enB
roek
eta
l./Intern
atio
na
lJo
urn
al
of
Green
ho
use
Ga
sC
on
trol
4(2
01
0)
35
1–
36
63
56
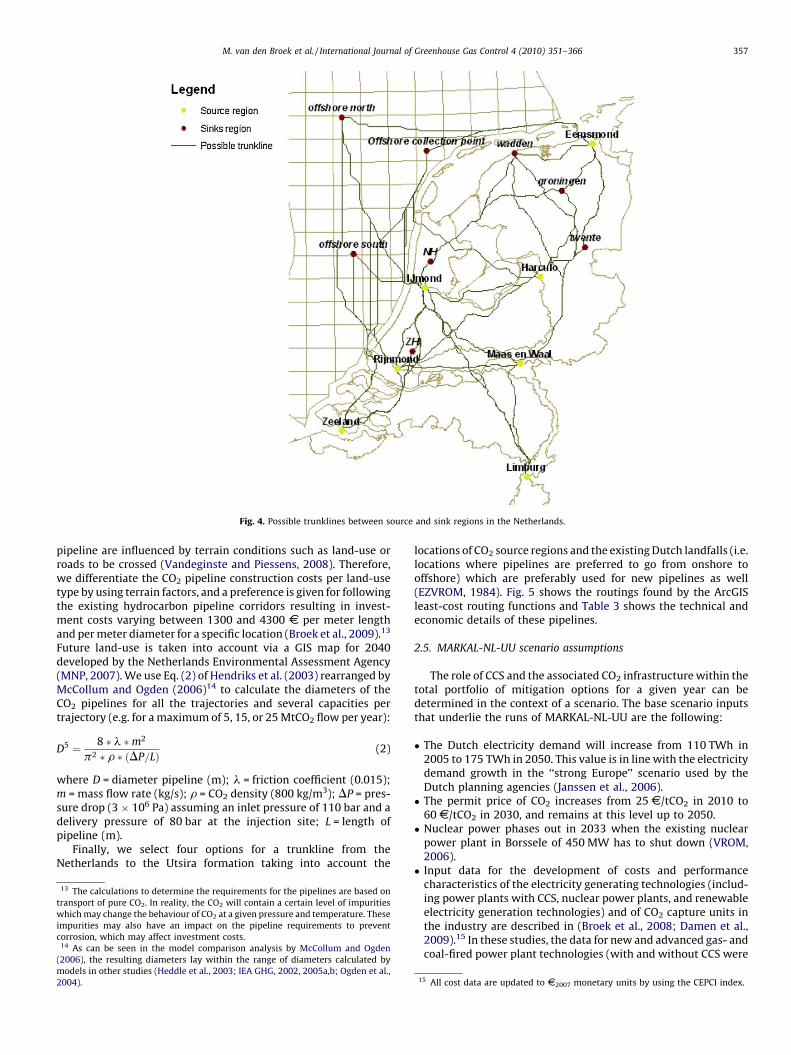
Fig. 4. Possible trunklines between source and sink regions in the Netherlands.
M. van den Broek et al. / International Journal of Greenhouse Gas Control 4 (2010) 351–366 357
pipeline are influenced by terrain conditions such as land-use orroads to be crossed (Vandeginste and Piessens, 2008). Therefore,we differentiate the CO2 pipeline construction costs per land-usetype by using terrain factors, and a preference is given for followingthe existing hydrocarbon pipeline corridors resulting in invest-ment costs varying between 1300 and 4300 s per meter lengthand per meter diameter for a specific location (Broek et al., 2009).13
Future land-use is taken into account via a GIS map for 2040developed by the Netherlands Environmental Assessment Agency(MNP, 2007). We use Eq. (2) of Hendriks et al. (2003) rearranged byMcCollum and Ogden (2006)14 to calculate the diameters of theCO2 pipelines for all the trajectories and several capacities pertrajectory (e.g. for a maximum of 5, 15, or 25 MtCO2 flow per year):
D5 ¼ 8 � l �m2
p2 � r � ðDP=LÞ(2)
where D = diameter pipeline (m); l = friction coefficient (0.015);m = mass flow rate (kg/s); r = CO2 density (800 kg/m3); DP = pres-sure drop (3 � 106 Pa) assuming an inlet pressure of 110 bar and adelivery pressure of 80 bar at the injection site; L = length ofpipeline (m).
Finally, we select four options for a trunkline from theNetherlands to the Utsira formation taking into account the
13 The calculations to determine the requirements for the pipelines are based on
transport of pure CO2. In reality, the CO2 will contain a certain level of impurities
which may change the behaviour of CO2 at a given pressure and temperature. These
impurities may also have an impact on the pipeline requirements to prevent
corrosion, which may affect investment costs.14 As can be seen in the model comparison analysis by McCollum and Ogden
(2006), the resulting diameters lay within the range of diameters calculated by
models in other studies (Heddle et al., 2003; IEA GHG, 2002, 2005a,b; Ogden et al.,
2004).
locations of CO2 source regions and the existing Dutch landfalls (i.e.locations where pipelines are preferred to go from onshore tooffshore) which are preferably used for new pipelines as well(EZVROM, 1984). Fig. 5 shows the routings found by the ArcGISleast-cost routing functions and Table 3 shows the technical andeconomic details of these pipelines.
2.5. MARKAL-NL-UU scenario assumptions
The role of CCS and the associated CO2 infrastructure within thetotal portfolio of mitigation options for a given year can bedetermined in the context of a scenario. The base scenario inputsthat underlie the runs of MARKAL-NL-UU are the following:
� The Dutch electricity demand will increase from 110 TWh in2005 to 175 TWh in 2050. This value is in line with the electricitydemand growth in the ‘‘strong Europe’’ scenario used by theDutch planning agencies (Janssen et al., 2006).� The permit price of CO2 increases from 25 s/tCO2 in 2010 to
60 s/tCO2 in 2030, and remains at this level up to 2050.� Nuclear power phases out in 2033 when the existing nuclear
power plant in Borssele of 450 MW has to shut down (VROM,2006).� Input data for the development of costs and performance
characteristics of the electricity generating technologies (includ-ing power plants with CCS, nuclear power plants, and renewableelectricity generation technologies) and of CO2 capture units inthe industry are described in (Broek et al., 2008; Damen et al.,2009).15 In these studies, the data for new and advanced gas- andcoal-fired power plant technologies (with and without CCS were
15 All cost data are updated to s2007 monetary units by using the CEPCI index.
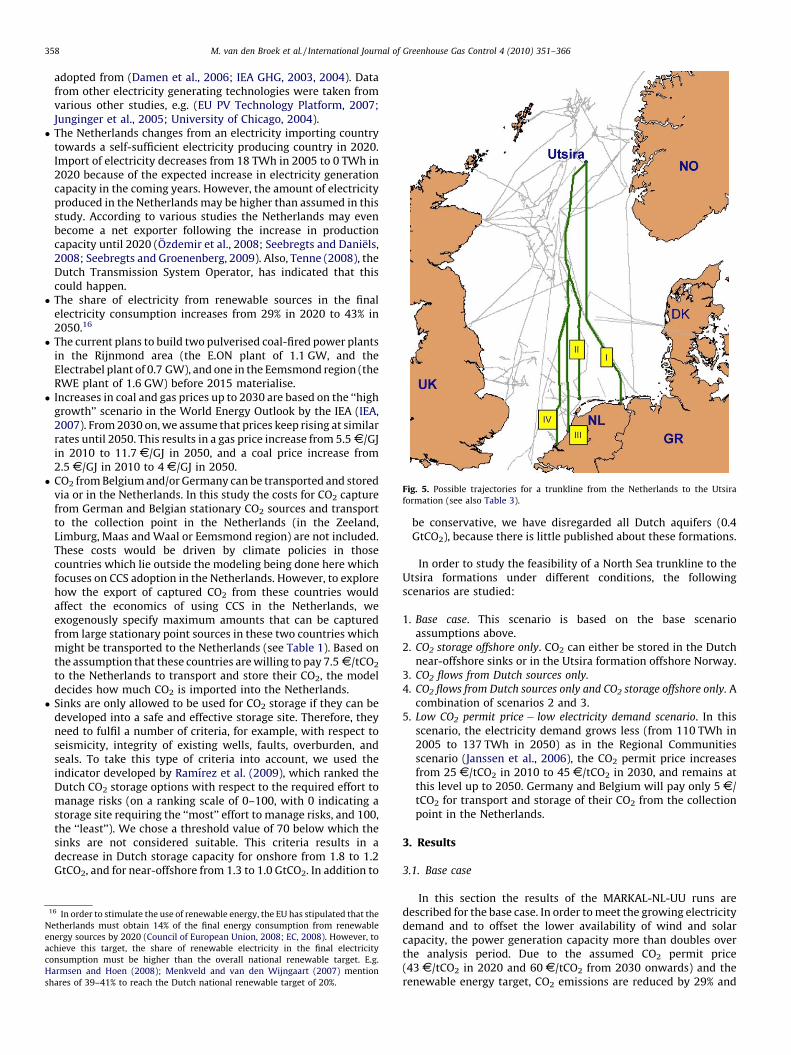
Fig. 5. Possible trajectories for a trunkline from the Netherlands to the Utsira
formation (see also Table 3).
M. van den Broek et al. / International Journal of Greenhouse Gas Control 4 (2010) 351–366358
adopted from (Damen et al., 2006; IEA GHG, 2003, 2004). Datafrom other electricity generating technologies were taken fromvarious other studies, e.g. (EU PV Technology Platform, 2007;Junginger et al., 2005; University of Chicago, 2004).� The Netherlands changes from an electricity importing country
towards a self-sufficient electricity producing country in 2020.Import of electricity decreases from 18 TWh in 2005 to 0 TWh in2020 because of the expected increase in electricity generationcapacity in the coming years. However, the amount of electricityproduced in the Netherlands may be higher than assumed in thisstudy. According to various studies the Netherlands may evenbecome a net exporter following the increase in productioncapacity until 2020 (Ozdemir et al., 2008; Seebregts and Daniels,2008; Seebregts and Groenenberg, 2009). Also, Tenne (2008), theDutch Transmission System Operator, has indicated that thiscould happen.� The share of electricity from renewable sources in the final
electricity consumption increases from 29% in 2020 to 43% in2050.16
� The current plans to build two pulverised coal-fired power plantsin the Rijnmond area (the E.ON plant of 1.1 GW, and theElectrabel plant of 0.7 GW), and one in the Eemsmond region (theRWE plant of 1.6 GW) before 2015 materialise.� Increases in coal and gas prices up to 2030 are based on the ‘‘high
growth’’ scenario in the World Energy Outlook by the IEA (IEA,2007). From 2030 on, we assume that prices keep rising at similarrates until 2050. This results in a gas price increase from 5.5 s/GJin 2010 to 11.7 s/GJ in 2050, and a coal price increase from2.5 s/GJ in 2010 to 4 s/GJ in 2050.� CO2 from Belgium and/or Germany can be transported and stored
via or in the Netherlands. In this study the costs for CO2 capturefrom German and Belgian stationary CO2 sources and transportto the collection point in the Netherlands (in the Zeeland,Limburg, Maas and Waal or Eemsmond region) are not included.These costs would be driven by climate policies in thosecountries which lie outside the modeling being done here whichfocuses on CCS adoption in the Netherlands. However, to explorehow the export of captured CO2 from these countries wouldaffect the economics of using CCS in the Netherlands, weexogenously specify maximum amounts that can be capturedfrom large stationary point sources in these two countries whichmight be transported to the Netherlands (see Table 1). Based onthe assumption that these countries are willing to pay 7.5 s/tCO2
to the Netherlands to transport and store their CO2, the modeldecides how much CO2 is imported into the Netherlands.� Sinks are only allowed to be used for CO2 storage if they can be
developed into a safe and effective storage site. Therefore, theyneed to fulfil a number of criteria, for example, with respect toseismicity, integrity of existing wells, faults, overburden, andseals. To take this type of criteria into account, we used theindicator developed by Ramırez et al. (2009), which ranked theDutch CO2 storage options with respect to the required effort tomanage risks (on a ranking scale of 0–100, with 0 indicating astorage site requiring the ‘‘most’’ effort to manage risks, and 100,the ‘‘least’’). We chose a threshold value of 70 below which thesinks are not considered suitable. This criteria results in adecrease in Dutch storage capacity for onshore from 1.8 to 1.2GtCO2, and for near-offshore from 1.3 to 1.0 GtCO2. In addition to
16 In order to stimulate the use of renewable energy, the EU has stipulated that the
Netherlands must obtain 14% of the final energy consumption from renewable
energy sources by 2020 (Council of European Union, 2008; EC, 2008). However, to
achieve this target, the share of renewable electricity in the final electricity
consumption must be higher than the overall national renewable target. E.g.
Harmsen and Hoen (2008); Menkveld and van den Wijngaart (2007) mention
shares of 39–41% to reach the Dutch national renewable target of 20%.
be conservative, we have disregarded all Dutch aquifers (0.4GtCO2), because there is little published about these formations.
In order to study the feasibility of a North Sea trunkline to theUtsira formations under different conditions, the followingscenarios are studied:
1. Base case. This scenario is based on the base scenarioassumptions above.
2. CO2 storage offshore only. CO2 can either be stored in the Dutchnear-offshore sinks or in the Utsira formation offshore Norway.
3. CO2 flows from Dutch sources only.
4. CO2 flows from Dutch sources only and CO2 storage offshore only. Acombination of scenarios 2 and 3.
5. Low CO2 permit price � low electricity demand scenario. In thisscenario, the electricity demand grows less (from 110 TWh in2005 to 137 TWh in 2050) as in the Regional Communitiesscenario (Janssen et al., 2006), the CO2 permit price increasesfrom 25 s/tCO2 in 2010 to 45 s/tCO2 in 2030, and remains atthis level up to 2050. Germany and Belgium will pay only 5 s/tCO2 for transport and storage of their CO2 from the collectionpoint in the Netherlands.
3. Results
3.1. Base case
In this section the results of the MARKAL-NL-UU runs aredescribed for the base case. In order to meet the growing electricitydemand and to offset the lower availability of wind and solarcapacity, the power generation capacity more than doubles overthe analysis period. Due to the assumed CO2 permit price(43 s/tCO2 in 2020 and 60 s/tCO2 from 2030 onwards) and therenewable energy target, CO2 emissions are reduced by 29% and
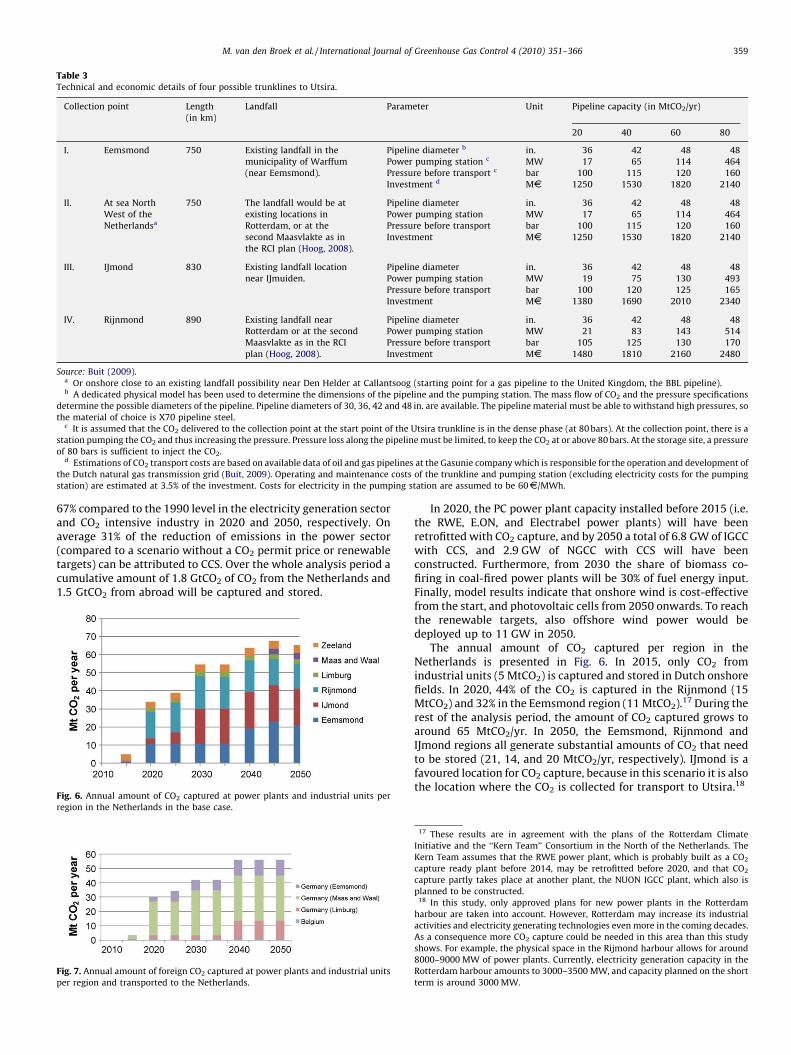
Table 3Technical and economic details of four possible trunklines to Utsira.
Collection point Length
(in km)
Landfall Parameter Unit Pipeline capacity (in MtCO2/yr)
20 40 60 80
I. Eemsmond 750 Existing landfall in the
municipality of Warffum
(near Eemsmond).
Pipeline diameter b in. 36 42 48 48
Power pumping station c MW 17 65 114 464
Pressure before transport c bar 100 115 120 160
Investment d Ms 1250 1530 1820 2140
II. At sea North
West of the
Netherlandsa
750 The landfall would be at
existing locations in
Rotterdam, or at the
second Maasvlakte as in
the RCI plan (Hoog, 2008).
Pipeline diameter in. 36 42 48 48
Power pumping station MW 17 65 114 464
Pressure before transport bar 100 115 120 160
Investment Ms 1250 1530 1820 2140
III. IJmond 830 Existing landfall location
near IJmuiden.
Pipeline diameter in. 36 42 48 48
Power pumping station MW 19 75 130 493
Pressure before transport bar 100 120 125 165
Investment Ms 1380 1690 2010 2340
IV. Rijnmond 890 Existing landfall near
Rotterdam or at the second
Maasvlakte as in the RCI
plan (Hoog, 2008).
Pipeline diameter in. 36 42 48 48
Power pumping station MW 21 83 143 514
Pressure before transport bar 105 125 130 170
Investment Ms 1480 1810 2160 2480
Source: Buit (2009).a Or onshore close to an existing landfall possibility near Den Helder at Callantsoog (starting point for a gas pipeline to the United Kingdom, the BBL pipeline).b A dedicated physical model has been used to determine the dimensions of the pipeline and the pumping station. The mass flow of CO2 and the pressure specifications
determine the possible diameters of the pipeline. Pipeline diameters of 30, 36, 42 and 48 in. are available. The pipeline material must be able to withstand high pressures, so
the material of choice is X70 pipeline steel.c It is assumed that the CO2 delivered to the collection point at the start point of the Utsira trunkline is in the dense phase (at 80 bars). At the collection point, there is a
station pumping the CO2 and thus increasing the pressure. Pressure loss along the pipeline must be limited, to keep the CO2 at or above 80 bars. At the storage site, a pressure
of 80 bars is sufficient to inject the CO2.d Estimations of CO2 transport costs are based on available data of oil and gas pipelines at the Gasunie company which is responsible for the operation and development of
the Dutch natural gas transmission grid (Buit, 2009). Operating and maintenance costs of the trunkline and pumping station (excluding electricity costs for the pumping
station) are estimated at 3.5% of the investment. Costs for electricity in the pumping station are assumed to be 60 s/MWh.
M. van den Broek et al. / International Journal of Greenhouse Gas Control 4 (2010) 351–366 359
67% compared to the 1990 level in the electricity generation sectorand CO2 intensive industry in 2020 and 2050, respectively. Onaverage 31% of the reduction of emissions in the power sector(compared to a scenario without a CO2 permit price or renewabletargets) can be attributed to CCS. Over the whole analysis period acumulative amount of 1.8 GtCO2 of CO2 from the Netherlands and1.5 GtCO2 from abroad will be captured and stored.
Fig. 6. Annual amount of CO2 captured at power plants and industrial units per
region in the Netherlands in the base case.
Fig. 7. Annual amount of foreign CO2 captured at power plants and industrial units
per region and transported to the Netherlands.
In 2020, the PC power plant capacity installed before 2015 (i.e.the RWE, E.ON, and Electrabel power plants) will have beenretrofitted with CO2 capture, and by 2050 a total of 6.8 GW of IGCCwith CCS, and 2.9 GW of NGCC with CCS will have beenconstructed. Furthermore, from 2030 the share of biomass co-firing in coal-fired power plants will be 30% of fuel energy input.Finally, model results indicate that onshore wind is cost-effectivefrom the start, and photovoltaic cells from 2050 onwards. To reachthe renewable targets, also offshore wind power would bedeployed up to 11 GW in 2050.
The annual amount of CO2 captured per region in theNetherlands is presented in Fig. 6. In 2015, only CO2 fromindustrial units (5 MtCO2) is captured and stored in Dutch onshorefields. In 2020, 44% of the CO2 is captured in the Rijnmond (15MtCO2) and 32% in the Eemsmond region (11 MtCO2).17 During therest of the analysis period, the amount of CO2 captured grows toaround 65 MtCO2/yr. In 2050, the Eemsmond, Rijnmond andIJmond regions all generate substantial amounts of CO2 that needto be stored (21, 14, and 20 MtCO2/yr, respectively). IJmond is afavoured location for CO2 capture, because in this scenario it is alsothe location where the CO2 is collected for transport to Utsira.18
17 These results are in agreement with the plans of the Rotterdam Climate
Initiative and the ‘‘Kern Team’’ Consortium in the North of the Netherlands. The
Kern Team assumes that the RWE power plant, which is probably built as a CO2
capture ready plant before 2014, may be retrofitted before 2020, and that CO2
capture partly takes place at another plant, the NUON IGCC plant, which also is
planned to be constructed.18 In this study, only approved plans for new power plants in the Rotterdam
harbour are taken into account. However, Rotterdam may increase its industrial
activities and electricity generating technologies even more in the coming decades.
As a consequence more CO2 capture could be needed in this area than this study
shows. For example, the physical space in the Rijmond harbour allows for around
8000–9000 MW of power plants. Currently, electricity generation capacity in the
Rotterdam harbour amounts to 3000–3500 MW, and capacity planned on the short
term is around 3000 MW.
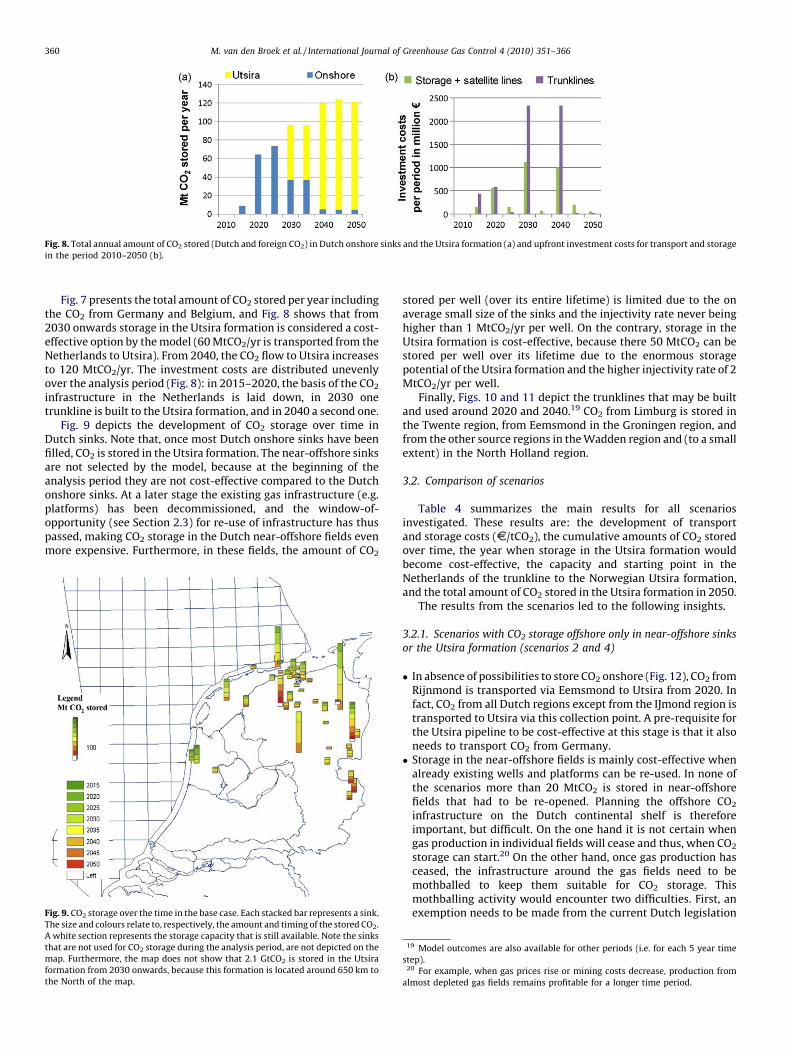
Fig. 8. Total annual amount of CO2 stored (Dutch and foreign CO2) in Dutch onshore sinks and the Utsira formation (a) and upfront investment costs for transport and storage
in the period 2010–2050 (b).
M. van den Broek et al. / International Journal of Greenhouse Gas Control 4 (2010) 351–366360
Fig. 7 presents the total amount of CO2 stored per year includingthe CO2 from Germany and Belgium, and Fig. 8 shows that from2030 onwards storage in the Utsira formation is considered a cost-effective option by the model (60 MtCO2/yr is transported from theNetherlands to Utsira). From 2040, the CO2 flow to Utsira increasesto 120 MtCO2/yr. The investment costs are distributed unevenlyover the analysis period (Fig. 8): in 2015–2020, the basis of the CO2
infrastructure in the Netherlands is laid down, in 2030 onetrunkline is built to the Utsira formation, and in 2040 a second one.
Fig. 9 depicts the development of CO2 storage over time inDutch sinks. Note that, once most Dutch onshore sinks have beenfilled, CO2 is stored in the Utsira formation. The near-offshore sinksare not selected by the model, because at the beginning of theanalysis period they are not cost-effective compared to the Dutchonshore sinks. At a later stage the existing gas infrastructure (e.g.platforms) has been decommissioned, and the window-of-opportunity (see Section 2.3) for re-use of infrastructure has thuspassed, making CO2 storage in the Dutch near-offshore fields evenmore expensive. Furthermore, in these fields, the amount of CO2
Fig. 9. CO2 storage over the time in the base case. Each stacked bar represents a sink.
The size and colours relate to, respectively, the amount and timing of the stored CO2.
A white section represents the storage capacity that is still available. Note the sinks
that are not used for CO2 storage during the analysis period, are not depicted on the
map. Furthermore, the map does not show that 2.1 GtCO2 is stored in the Utsira
formation from 2030 onwards, because this formation is located around 650 km to
the North of the map.
stored per well (over its entire lifetime) is limited due to the onaverage small size of the sinks and the injectivity rate never beinghigher than 1 MtCO2/yr per well. On the contrary, storage in theUtsira formation is cost-effective, because there 50 MtCO2 can bestored per well over its lifetime due to the enormous storagepotential of the Utsira formation and the higher injectivity rate of 2MtCO2/yr per well.
Finally, Figs. 10 and 11 depict the trunklines that may be builtand used around 2020 and 2040.19 CO2 from Limburg is stored inthe Twente region, from Eemsmond in the Groningen region, andfrom the other source regions in the Wadden region and (to a smallextent) in the North Holland region.
3.2. Comparison of scenarios
Table 4 summarizes the main results for all scenariosinvestigated. These results are: the development of transportand storage costs (s/tCO2), the cumulative amounts of CO2 storedover time, the year when storage in the Utsira formation wouldbecome cost-effective, the capacity and starting point in theNetherlands of the trunkline to the Norwegian Utsira formation,and the total amount of CO2 stored in the Utsira formation in 2050.
The results from the scenarios led to the following insights.
3.2.1. Scenarios with CO2 storage offshore only in near-offshore sinks
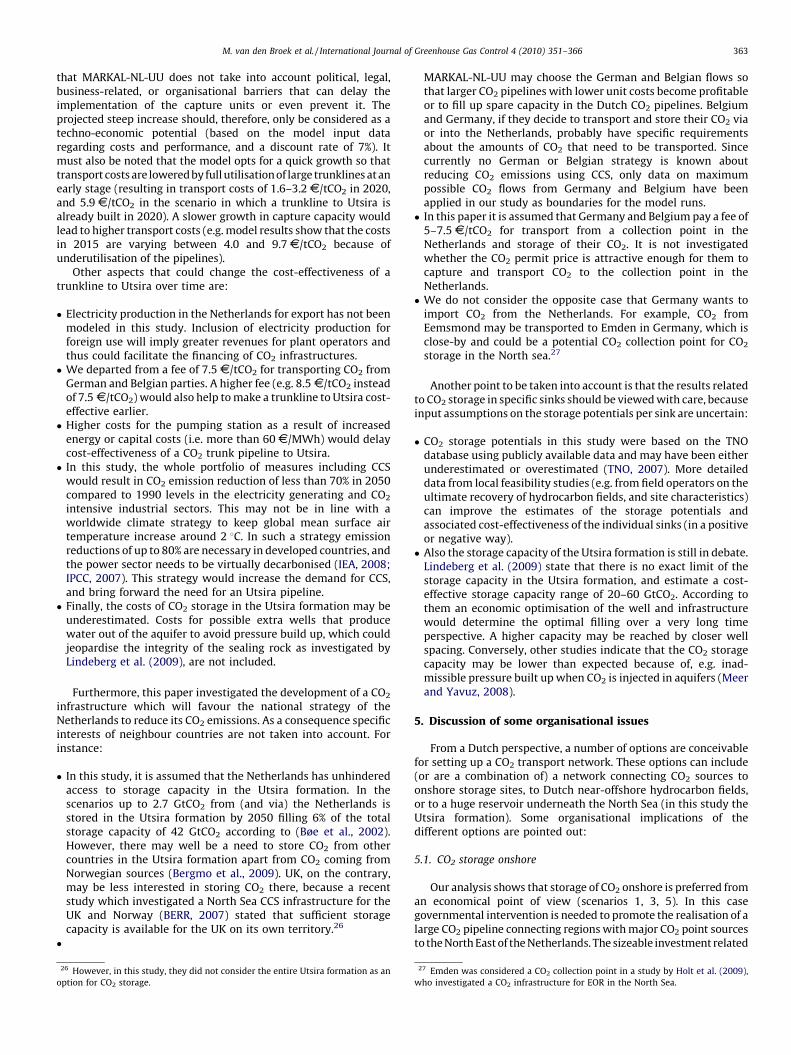
or the Utsira formation (scenarios 2 and 4)
� In absence of possibilities to store CO2 onshore (Fig. 12), CO2 fromRijnmond is transported via Eemsmond to Utsira from 2020. Infact, CO2 from all Dutch regions except from the IJmond region istransported to Utsira via this collection point. A pre-requisite forthe Utsira pipeline to be cost-effective at this stage is that it alsoneeds to transport CO2 from Germany.� Storage in the near-offshore fields is mainly cost-effective when
already existing wells and platforms can be re-used. In none ofthe scenarios more than 20 MtCO2 is stored in near-offshorefields that had to be re-opened. Planning the offshore CO2
infrastructure on the Dutch continental shelf is thereforeimportant, but difficult. On the one hand it is not certain whengas production in individual fields will cease and thus, when CO2
storage can start.20 On the other hand, once gas production hasceased, the infrastructure around the gas fields need to bemothballed to keep them suitable for CO2 storage. Thismothballing activity would encounter two difficulties. First, anexemption needs to be made from the current Dutch legislation
19 Model outcomes are also available for other periods (i.e. for each 5 year time
step).20 For example, when gas prices rise or mining costs decrease, production from
almost depleted gas fields remains profitable for a longer time period.
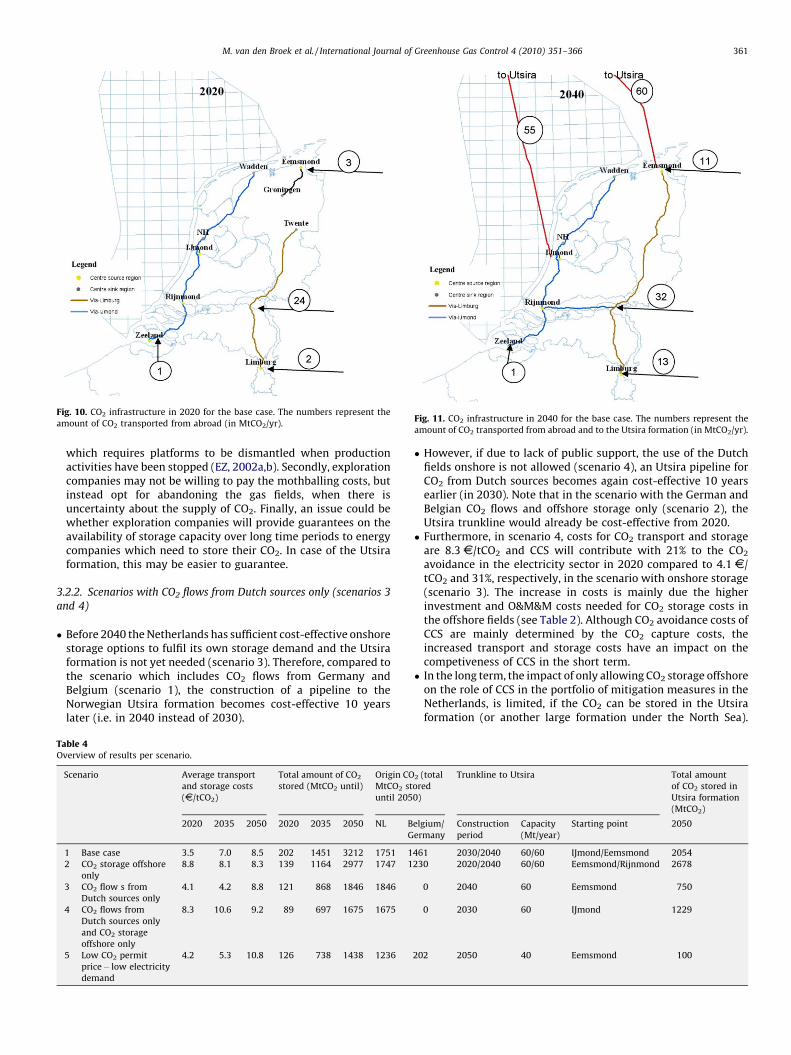
Fig. 11. CO2 infrastructure in 2040 for the base case. The numbers represent the
amount of CO2 transported from abroad and to the Utsira formation (in MtCO2/yr).
Fig. 10. CO2 infrastructure in 2020 for the base case. The numbers represent the
amount of CO2 transported from abroad (in MtCO2/yr).
M. van den Broek et al. / International Journal of Greenhouse Gas Control 4 (2010) 351–366 361
which requires platforms to be dismantled when productionactivities have been stopped (EZ, 2002a,b). Secondly, explorationcompanies may not be willing to pay the mothballing costs, butinstead opt for abandoning the gas fields, when there isuncertainty about the supply of CO2. Finally, an issue could bewhether exploration companies will provide guarantees on theavailability of storage capacity over long time periods to energycompanies which need to store their CO2. In case of the Utsiraformation, this may be easier to guarantee.
3.2.2. Scenarios with CO2 flows from Dutch sources only (scenarios 3
and 4)
� Before 2040 the Netherlands has sufficient cost-effective onshorestorage options to fulfil its own storage demand and the Utsiraformation is not yet needed (scenario 3). Therefore, compared tothe scenario which includes CO2 flows from Germany andBelgium (scenario 1), the construction of a pipeline to theNorwegian Utsira formation becomes cost-effective 10 yearslater (i.e. in 2040 instead of 2030).
Table 4Overview of results per scenario.
Scenario Average transport
and storage costs
(s/tCO2)
Total amount of CO2
stored (MtCO2 until)
Origin CO
MtCO2 st
until 205
2020 2035 2050 2020 2035 2050 NL B
G
1 Base case 3.5 7.0 8.5 202 1451 3212 1751 1
2 CO2 storage offshore
only
8.8 8.1 8.3 139 1164 2977 1747 1
3 CO2 flow s from
Dutch sources only
4.1 4.2 8.8 121 868 1846 1846
4 CO2 flows from
Dutch sources only
and CO2 storage
offshore only
8.3 10.6 9.2 89 697 1675 1675
5 Low CO2 permit
price� low electricity
demand
4.2 5.3 10.8 126 738 1438 1236
� However, if due to lack of public support, the use of the Dutchfields onshore is not allowed (scenario 4), an Utsira pipeline forCO2 from Dutch sources becomes again cost-effective 10 yearsearlier (in 2030). Note that in the scenario with the German andBelgian CO2 flows and offshore storage only (scenario 2), theUtsira trunkline would already be cost-effective from 2020.� Furthermore, in scenario 4, costs for CO2 transport and storage
are 8.3 s/tCO2 and CCS will contribute with 21% to the CO2
avoidance in the electricity sector in 2020 compared to 4.1 s/tCO2 and 31%, respectively, in the scenario with onshore storage(scenario 3). The increase in costs is mainly due the higherinvestment and O&M&M costs needed for CO2 storage costs inthe offshore fields (see Table 2). Although CO2 avoidance costs ofCCS are mainly determined by the CO2 capture costs, theincreased transport and storage costs have an impact on thecompetiveness of CCS in the short term.� In the long term, the impact of only allowing CO2 storage offshore
on the role of CCS in the portfolio of mitigation measures in theNetherlands, is limited, if the CO2 can be stored in the Utsiraformation (or another large formation under the North Sea).
2 (total
ored
0)
Trunkline to Utsira Total amount
of CO2 stored in
Utsira formation
(MtCO2)
elgium/
ermany
Construction
period
Capacity
(Mt/year)
Starting point 2050
461 2030/2040 60/60 IJmond/Eemsmond 2054
230 2020/2040 60/60 Eemsmond/Rijnmond 2678
0 2040 60 Eemsmond 750
0 2030 60 IJmond 1229
202 2050 40 Eemsmond 100
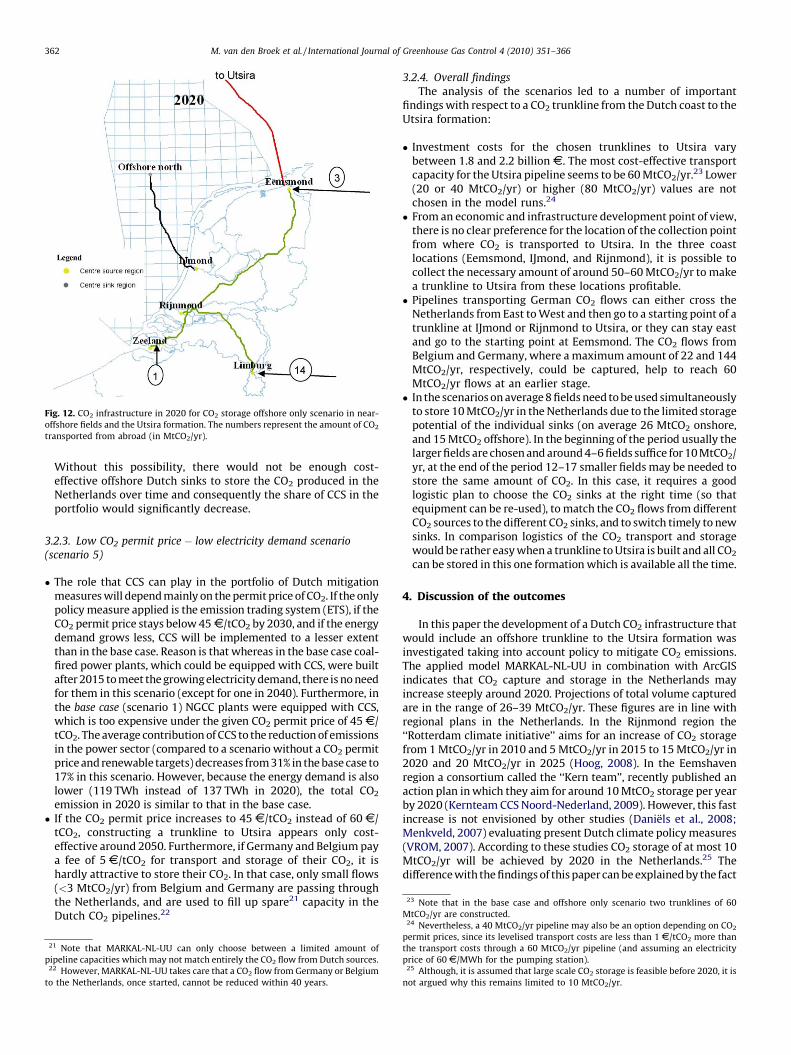
Fig. 12. CO2 infrastructure in 2020 for CO2 storage offshore only scenario in near-
offshore fields and the Utsira formation. The numbers represent the amount of CO2
transported from abroad (in MtCO2/yr).
23 Note that in the base case and offshore only scenario two trunklines of 60
MtCO2/yr are constructed.24
M. van den Broek et al. / International Journal of Greenhouse Gas Control 4 (2010) 351–366362
Without this possibility, there would not be enough cost-effective offshore Dutch sinks to store the CO2 produced in theNetherlands over time and consequently the share of CCS in theportfolio would significantly decrease.
3.2.3. Low CO2 permit price � low electricity demand scenario
(scenario 5)
� The role that CCS can play in the portfolio of Dutch mitigationmeasures will depend mainly on the permit price of CO2. If the onlypolicy measure applied is the emission trading system (ETS), if theCO2 permit price stays below 45 s/tCO2 by 2030, and if the energydemand grows less, CCS will be implemented to a lesser extentthan in the base case. Reason is that whereas in the base case coal-fired power plants, which could be equipped with CCS, were builtafter 2015 to meet the growing electricity demand, there is no needfor them in this scenario (except for one in 2040). Furthermore, inthe base case (scenario 1) NGCC plants were equipped with CCS,which is too expensive under the given CO2 permit price of 45 s/tCO2. The average contribution of CCS to the reduction of emissionsin the power sector (compared to a scenario without a CO2 permitprice and renewable targets) decreases from 31% in the base case to17% in this scenario. However, because the energy demand is alsolower (119 TWh instead of 137 TWh in 2020), the total CO2
emission in 2020 is similar to that in the base case.� If the CO2 permit price increases to 45 s/tCO2 instead of 60 s/
tCO2, constructing a trunkline to Utsira appears only cost-effective around 2050. Furthermore, if Germany and Belgium paya fee of 5 s/tCO2 for transport and storage of their CO2, it ishardly attractive to store their CO2. In that case, only small flows(<3 MtCO2/yr) from Belgium and Germany are passing throughthe Netherlands, and are used to fill up spare21 capacity in theDutch CO2 pipelines.22
21 Note that MARKAL-NL-UU can only choose between a limited amount of
pipeline capacities which may not match entirely the CO2 flow from Dutch sources.22 However, MARKAL-NL-UU takes care that a CO2 flow from Germany or Belgium
to the Netherlands, once started, cannot be reduced within 40 years.
3.2.4. Overall findings
The analysis of the scenarios led to a number of importantfindings with respect to a CO2 trunkline from the Dutch coast to theUtsira formation:
� Investment costs for the chosen trunklines to Utsira varybetween 1.8 and 2.2 billion s. The most cost-effective transportcapacity for the Utsira pipeline seems to be 60 MtCO2/yr.23 Lower(20 or 40 MtCO2/yr) or higher (80 MtCO2/yr) values are notchosen in the model runs.24
� From an economic and infrastructure development point of view,there is no clear preference for the location of the collection pointfrom where CO2 is transported to Utsira. In the three coastlocations (Eemsmond, IJmond, and Rijnmond), it is possible tocollect the necessary amount of around 50–60 MtCO2/yr to makea trunkline to Utsira from these locations profitable.� Pipelines transporting German CO2 flows can either cross the
Netherlands from East to West and then go to a starting point of atrunkline at IJmond or Rijnmond to Utsira, or they can stay eastand go to the starting point at Eemsmond. The CO2 flows fromBelgium and Germany, where a maximum amount of 22 and 144MtCO2/yr, respectively, could be captured, help to reach 60MtCO2/yr flows at an earlier stage.� In the scenarios on average 8 fields need to be used simultaneously
to store 10 MtCO2/yr in the Netherlands due to the limited storagepotential of the individual sinks (on average 26 MtCO2 onshore,and 15 MtCO2 offshore). In the beginning of the period usually thelarger fields are chosen and around 4–6 fields suffice for 10 MtCO2/yr, at the end of the period 12–17 smaller fields may be needed tostore the same amount of CO2. In this case, it requires a goodlogistic plan to choose the CO2 sinks at the right time (so thatequipment can be re-used), to match the CO2 flows from differentCO2 sources to the different CO2 sinks, and to switch timely to newsinks. In comparison logistics of the CO2 transport and storagewould be rather easy when a trunkline to Utsira is built and all CO2
can be stored in this one formation which is available all the time.
4. Discussion of the outcomes
In this paper the development of a Dutch CO2 infrastructure thatwould include an offshore trunkline to the Utsira formation wasinvestigated taking into account policy to mitigate CO2 emissions.The applied model MARKAL-NL-UU in combination with ArcGISindicates that CO2 capture and storage in the Netherlands mayincrease steeply around 2020. Projections of total volume capturedare in the range of 26–39 MtCO2/yr. These figures are in line withregional plans in the Netherlands. In the Rijnmond region the‘‘Rotterdam climate initiative’’ aims for an increase of CO2 storagefrom 1 MtCO2/yr in 2010 and 5 MtCO2/yr in 2015 to 15 MtCO2/yr in2020 and 20 MtCO2/yr in 2025 (Hoog, 2008). In the Eemshavenregion a consortium called the ‘‘Kern team’’, recently published anaction plan in which they aim for around 10 MtCO2 storage per yearby 2020 (Kernteam CCS Noord-Nederland, 2009). However, this fastincrease is not envisioned by other studies (Daniels et al., 2008;Menkveld, 2007) evaluating present Dutch climate policy measures(VROM, 2007). According to these studies CO2 storage of at most 10MtCO2/yr will be achieved by 2020 in the Netherlands.25 Thedifference with the findings of this paper can be explained by the fact
Nevertheless, a 40 MtCO2/yr pipeline may also be an option depending on CO2
permit prices, since its levelised transport costs are less than 1 s/tCO2 more than
the transport costs through a 60 MtCO2/yr pipeline (and assuming an electricity
price of 60 s/MWh for the pumping station).25 Although, it is assumed that large scale CO2 storage is feasible before 2020, it is
not argued why this remains limited to 10 MtCO2/yr.
M. van den Broek et al. / International Journal of Greenhouse Gas Control 4 (2010) 351–366 363
that MARKAL-NL-UU does not take into account political, legal,business-related, or organisational barriers that can delay theimplementation of the capture units or even prevent it. Theprojected steep increase should, therefore, only be considered as atechno-economic potential (based on the model input dataregarding costs and performance, and a discount rate of 7%). Itmust also be noted that the model opts for a quick growth so thattransport costs are lowered by full utilisation of large trunklines at anearly stage (resulting in transport costs of 1.6–3.2 s/tCO2 in 2020,and 5.9 s/tCO2 in the scenario in which a trunkline to Utsira isalready built in 2020). A slower growth in capture capacity wouldlead to higher transport costs (e.g. model results show that the costsin 2015 are varying between 4.0 and 9.7 s/tCO2 because ofunderutilisation of the pipelines).
Other aspects that could change the cost-effectiveness of atrunkline to Utsira over time are:
� Electricity production in the Netherlands for export has not beenmodeled in this study. Inclusion of electricity production forforeign use will imply greater revenues for plant operators andthus could facilitate the financing of CO2 infrastructures.� We departed from a fee of 7.5 s/tCO2 for transporting CO2 from
German and Belgian parties. A higher fee (e.g. 8.5 s/tCO2 insteadof 7.5 s/tCO2) would also help to make a trunkline to Utsira cost-effective earlier.� Higher costs for the pumping station as a result of increased
energy or capital costs (i.e. more than 60 s/MWh) would delaycost-effectiveness of a CO2 trunk pipeline to Utsira.� In this study, the whole portfolio of measures including CCS
would result in CO2 emission reduction of less than 70% in 2050compared to 1990 levels in the electricity generating and CO2
intensive industrial sectors. This may not be in line with aworldwide climate strategy to keep global mean surface airtemperature increase around 2 8C. In such a strategy emissionreductions of up to 80% are necessary in developed countries, andthe power sector needs to be virtually decarbonised (IEA, 2008;IPCC, 2007). This strategy would increase the demand for CCS,and bring forward the need for an Utsira pipeline.� Finally, the costs of CO2 storage in the Utsira formation may be
underestimated. Costs for possible extra wells that producewater out of the aquifer to avoid pressure build up, which couldjeopardise the integrity of the sealing rock as investigated byLindeberg et al. (2009), are not included.
Furthermore, this paper investigated the development of a CO2
infrastructure which will favour the national strategy of theNetherlands to reduce its CO2 emissions. As a consequence specificinterests of neighbour countries are not taken into account. Forinstance:
� In this study, it is assumed that the Netherlands has unhinderedaccess to storage capacity in the Utsira formation. In thescenarios up to 2.7 GtCO2 from (and via) the Netherlands isstored in the Utsira formation by 2050 filling 6% of the totalstorage capacity of 42 GtCO2 according to (Bøe et al., 2002).However, there may well be a need to store CO2 from othercountries in the Utsira formation apart from CO2 coming fromNorwegian sources (Bergmo et al., 2009). UK, on the contrary,may be less interested in storing CO2 there, because a recentstudy which investigated a North Sea CCS infrastructure for theUK and Norway (BERR, 2007) stated that sufficient storagecapacity is available for the UK on its own territory.26
�
26 However, in this study, they did not consider the entire Utsira formation as an
option for CO2 storage.
MARKAL-NL-UU may choose the German and Belgian flows sothat larger CO2 pipelines with lower unit costs become profitableor to fill up spare capacity in the Dutch CO2 pipelines. Belgiumand Germany, if they decide to transport and store their CO2 viaor into the Netherlands, probably have specific requirementsabout the amounts of CO2 that need to be transported. Sincecurrently no German or Belgian strategy is known aboutreducing CO2 emissions using CCS, only data on maximumpossible CO2 flows from Germany and Belgium have beenapplied in our study as boundaries for the model runs.� In this paper it is assumed that Germany and Belgium pay a fee of
5–7.5 s/tCO2 for transport from a collection point in theNetherlands and storage of their CO2. It is not investigatedwhether the CO2 permit price is attractive enough for them tocapture and transport CO2 to the collection point in theNetherlands.� We do not consider the opposite case that Germany wants to
import CO2 from the Netherlands. For example, CO2 fromEemsmond may be transported to Emden in Germany, which isclose-by and could be a potential CO2 collection point for CO2
storage in the North sea.27
Another point to be taken into account is that the results relatedto CO2 storage in specific sinks should be viewed with care, becauseinput assumptions on the storage potentials per sink are uncertain:
� CO2 storage potentials in this study were based on the TNOdatabase using publicly available data and may have been eitherunderestimated or overestimated (TNO, 2007). More detaileddata from local feasibility studies (e.g. from field operators on theultimate recovery of hydrocarbon fields, and site characteristics)can improve the estimates of the storage potentials andassociated cost-effectiveness of the individual sinks (in a positiveor negative way).� Also the storage capacity of the Utsira formation is still in debate.
Lindeberg et al. (2009) state that there is no exact limit of thestorage capacity in the Utsira formation, and estimate a cost-effective storage capacity range of 20–60 GtCO2. According tothem an economic optimisation of the well and infrastructurewould determine the optimal filling over a very long timeperspective. A higher capacity may be reached by closer wellspacing. Conversely, other studies indicate that the CO2 storagecapacity may be lower than expected because of, e.g. inad-missible pressure built up when CO2 is injected in aquifers (Meerand Yavuz, 2008).
5. Discussion of some organisational issues
From a Dutch perspective, a number of options are conceivablefor setting up a CO2 transport network. These options can include(or are a combination of) a network connecting CO2 sources toonshore storage sites, to Dutch near-offshore hydrocarbon fields,or to a huge reservoir underneath the North Sea (in this study theUtsira formation). Some organisational implications of thedifferent options are pointed out:
5.1. CO2 storage onshore
Our analysis shows that storage of CO2 onshore is preferred froman economical point of view (scenarios 1, 3, 5). In this casegovernmental intervention is needed to promote the realisation of alarge CO2 pipeline connecting regions with major CO2 point sourcesto the North East of the Netherlands. The sizeable investment related
27 Emden was considered a CO2 collection point in a study by Holt et al. (2009),
who investigated a CO2 infrastructure for EOR in the North Sea.
M. van den Broek et al. / International Journal of Greenhouse Gas Control 4 (2010) 351–366364
to this pipeline makes it unlikely that a private company would buildit on its own. The government may encourage and involve theprivate sector in constructing such a pipeline, for instance, by issuinga tender for a preferred trajectory such as Rijnmond–Eemsmond.Private companies may design, build and operate the pipeline, whilethe investment will most likely need to be co-financed by industryand government. As a consequence, ownership of the pipeline maybe both public and private.
Once Dutch onshore capacity has been filled up, it is probablytoo costly to exploit the Dutch near-offshore capacity, as pointedout in this study. In this case (after 2040) a trunkline towardsUtsira would need to be ready.
5.2. CO2 storage in Dutch near-offshore fields
Storage of CO2 offshore near the Dutch coast or elsewhere may bepreferred if the public acceptance of storage onshore would benegative, and/or because permitting procedures will be shorter(scenarios 2, 4). In this case, the government could advance fullexploitation of storage capacity in near-offshore depleted hydro-carbon fields (NOGEPA, 2008). The government would need to have agreater role in the selection of storage locations offshore, and takecare that platforms of near-offshore depleted gas fields are kept ingood condition until they can be used for CO2 storage. It is unlikelythat this would happen in absence of public intervention, sincemothballing platforms would involve expenditures in the order ofmillions of euros. As in the case of onshore storage design,construction and operation may be done effectively by privatecompanies, while both funding and ownership could be shared bythe public and private sector. Once near-offshore capacity has beenfilled up, a trunkline towards Utsira (or another major storageformation) would need to be ready, and some sort of Initiative takenby North Sea countries is needed to realise such a (joint) pipeline.
5.3. CO2 storage in the Utsira formation
Storage of CO2 before 2030 in the Utsira formation is a possibilityif CO2 may not be stored onshore and neighbouring countries willpay for the transport of their CO2 via the Netherlands (scenario 2).However, it could also be necessary if CO2 may not be stored onshore,and at the same time the Dutch government prefers not tocoordinate utilisation of near-offshore transport and storagecapacity. In these cases immediate realisation of a CO2 trunklinetowards Utsira will be necessary. Finally, the organisationalimplications of CO2 storage in the Utsira formation differ somewhatfrom the storage in onshore or near-offshore fields. A large numberof public and private parties (e.g. CO2 suppliers) from countriesneighbouring the North Sea need to be engaged, for example, inchoosing the trajectory of the pipeline towards Utsira. Thus, routingsand dimensions can be chosen which are preferred from a socio-economic and strategic point of view. Next, the governments mayrequest a tender for the construction of this pipeline, and design andconstruction will be in the hands of private companies. Funding, onthe other hand, may need to be shared between governments andprivate companies, because of the sizeable investment of 1–2 billions and uncertainty in future CO2 permit prices. Ownership could bewith the private sector from the start or public assets could be sold toa private company at some point during operation of the project.Finally, a private entity may be responsible for the operation ofpipeline infrastructure. This may be the operator of the storage site,or a gas transport company.
6. Conclusions
In this research we combined the energy bottom-up modelMARKAL and the geographic information system, ArcGIS, to assess
the feasibility of using the Utsira formation as part of a long-termDutch strategy to develop a CO2 infrastructure. We strived todetermine suitable technical configurations for such a pipeline, toassess the boundary conditions making its investment worthwhile,and to make a first inventory of the organisational implicationsaround the construction of this pipeline.
Application of the ArcGIS/MARKAL toolbox shows that anoffshore pipeline to the Utsira formation as part of a regionalsolution (transporting CO2 from the Netherlands, Belgium andGermany) appears a cost-effective option in the medium term(after 2020). A main condition for the pipeline to Utsira is theexistence of a high CO2 permit price (increasing from around 43 s/tCO2 in 2020 to 60 s/tCO2 in 2030). If the price stays below 45 s/tCO2 by 2030 and the growth of the electricity demand is limited,CCS will be implemented less, and constructing a pipeline to Utsirais only considered cost-effective by the model from 2050 onwards.
Model results suggest that an investment in a CO2 trunkpipeline towards the Utsira formation may even be cost-effectivefrom 2020 onwards, provided that onshore storage capacity is notpermitted or used and that Belgian and German CO2 is transportedas well. Exploitation of onshore capacity and exclusion of Belgianand German CO2 will each push back cost-effectiveness of atrunkline to Utsira by 10 years. From a national perspective, on theshort term storage in Dutch near-offshore fields is more cost-effective than in Utsira, but as yet there are major uncertaintiesrelated to the timing and effective exploitation of near-offshoreCO2 storage opportunities.
The ArcGIS/MARKAL toolbox proved to be valuable to get moreinsights into the boundary conditions of a CO2 trunkline from theNetherlands to Utsira, because it matches multiple sources tomultiple sinks with respect to costs, availability, and location as afunction of time. Furthermore, it investigates how and when CO2
flows from the Netherlands, Germany and Belgium could betransported and stored via a Dutch CO2 infrastructure. Finally, byadding the spatial aspect into a typical energy system study, thetoolbox can support policy makers to tackle the spatial issuesrelevant for CO2 infrastructure development and the timeframesinvolved. The resulting maps that make the development of a CO2
infrastructure more visible, may also be used as communicationtool among stakeholders.
Nevertheless, in this research there are important caveats thatneed to be addressed in future work. For instance, the nationalstrategies of Belgium and Germany to develop a CO2 infrastructurewere not taken into account. Also, the possibility to transport andstore CO2 via Germany should be considered. Finally, cost dataneed to be periodically updated (e.g. due to additional costs forwater production wells, or impurities in the CO2 pipelines) andchecked by industrial partners in order to assure that modellingresults are close to real developments.
Prioritisation of CO2 storage in onshore fields, near-offshorefields, and/or in the Utsira formation is an important aspect for theoptimal design of a Dutch CO2 infrastructure. Furthermore,suboptimal use of public resources available for developing CO2
transport networks, can and need to be avoided while fastdeployment of CCS is facilitated. The type of public responsibilityduring the development of CO2 networks would mainly depend onthe storage location. For onshore storage, greater public involve-ment is required in the permitting process for CO2 storage sites andpipeline trajectories, especially if CO2 storage is perceivedunfavourably by the local public. Furthermore, pipeline trajec-tories onshore may be defined in generic terms, while privatecompanies can design the precise layout after a tender procedure.For storage near-offshore, greater public involvement is requiredin order to fully exploit the near-offshore storage capacity sinceCO2 storage in these fields is only cost-effective when gas and oilproduction platforms are preserved for CO2 storage. Finally, CO2
M. van den Broek et al. / International Journal of Greenhouse Gas Control 4 (2010) 351–366 365
storage in the Utsira formation (or another large formation underthe North Sea) would require a major consortium of public andprivate parties near the North Sea to render this option cost-effective, and to decide on a preferred trajectory by all stakeholdersinvolved.
Acknowledgements
This research work was supported by the CATO programme andECN (project ECN-X—09-017). The CATO programme is the Dutchnational research programme on CO2 Capture and Storage (CCS),and is financially supported by the Dutch Ministry of EconomicAffairs and the consortium partners (for more information, seewww.CO2-cato.nl). The authors would like to thank Paul Lako,Raouf Saidi, and Ad Seebregts (ECN Policy Studies), Tore Torp(StatoilHydro), Luuk Buit (Gasunie), Leslie Kramers, Ton Wild-enborg, Muriel van der Kuip, and Jenny Hettelaar (TNO), MauriceHanegraaf and Hans Knippels (DCMR Rijnmond EnvironmentalAgency), Hedwig Verhagen (Ministry of Economic Affairs), AndreaEsken (Wuppertal Institute), and Evelien Brederode for theircontributions.
References
Bergmo, P.E.S., Grimstad, A., Lindeberg, E., Riis, F., Johansen, W.T., 2009. Exploringgeological storage sites for CO2 from Norwegian gas power plants: Utsira South.Energy Procedia 1 (1), 2953–2959.
BERR, 2007, Development of a CO2 transport and storage network in the North Sea,Report to the North Sea Basin Task Force, Department for Business, Energy &Regulatory Reform in association with Element Energy Ltd. with Poyry Energyand the British Geological Survey, UK.
Bøe, R., Magnus, C., Osmundsen, P.T., Rindstad, B.I., 2002, Geological storage of CO2
from combustion of fossil fuel. Summary Report of the GESTCO Project,2002.010, Geological Survey of Norway, Trondheim.
Broek, M.v.d., E. Brederode, A. Ramırez, L. Kramers, M.V.D. Kuip, T. Wildenborg, W.Turkenburg, A. Faaij, 2009. Combining GIS and MARKAL to design a CO2
infrastructure in line with the development of the energy supply system. Caseof the Netherlands, forthcoming.
Broek, M.v.d., Faaij, A., Turkenburg, W., 2008. Planning for an electricity sector withcarbon capture and storage. Case of the Netherlands. International Journal ofGreenhouse Gas Control 2, 105–129.
Buit, L., 2009. Personal communication with L. Buit of Gasunie about cost andperformance data of pipelines from the Netherlands to the Utsira formation.
CASTOR project, 2004. European Castor project on the capture and geologicalstorage of CO2, http://www.co2castor.com (October 2007).
Council of European Union, 2008. Presidency Conclusions of Brussels EuropeanCouncil of 11 and 12 December 2008.
CSA Group, 2008, Assessment of the potential for geological storage of CO2 for theisland of Ireland. Report prepared for Sustainable Energy Ireland, Environmen-tal Protection Agency, Geological Survey of Northern Ireland, Geological Surveyof Ireland.
Damen, K., Faaij, A., Turkenburg, W., 2009. Pathways towards a large-scale imple-mentation of CO2 capture and storage: a case study for the Netherlands.International Journal of Greenhouse Gas Control 3, 217–236.
Damen, K., Troost, M.v., Faaij, A., Turkenburg, W., 2006. A comparison of electricityand hydrogen production systems with CO2 capture and storage. Part A. Reviewand selection of promising conversion and capture technologies. Progress inEnergy and Combustion Science 32 (2), 215–246.
Daniels, B.W., Seebregts, A.J., Kroon, P., 2008. Trend analysis air pollution. Theeffects of the Dutch climate programme. In: Clean and Efficient on the Emissionsof Air Pollutants, ECN, Petten (in Dutch), ECN-E-08-002.
E.ON, 2007. E.ON plans hard coal fired power station in Antwerp harbour area(press release), http://www.eon-kraftwerke.com/pages/ekw_en/Media/Press_Releases/Latest_Press_Releases/Pressemitteilung.htm?id=658369 (October2008).
EC, 2008. Proposal for a directive of the European parliament and of the council onthe promotion of the use of energy from renewable sources. Commission of theEuropean communities.
EU Council Environment, 2005. Press Release, 2647th Council Meeting EnvironmentBrussels, March 10, 2005.
EU Geocapacity, 2009, Assessing European capacity for geological storage of carbondioxide. D42 GeoCapacity final report. http://www.geology.cz/geocapacity/publications., Project no. SES6-518318.
EU PV Technology Platform, 2007. A Strategic Research Agenda for PhotovoltaicSolar Energy Technology Research and Development in Support of Realizing theVision for Photovoltaic Technology. European Photovoltaic Technology Plat-form, Brussels.
EZ, 2002a. Mining Act, Act of 31st of October 2002. Rules related to the explorationfor and production of mining resources and other activities affiliated to miningactivities (in Dutch).
EZ, 2002b. Mining Decree, Decree of 6th of December 2002 related to rules for theenforcement of the Mining Act (in Dutch).
EZ, VROM, V&W, 1984. Dutch policy plan pipelines (in Dutch), extended up to 2008Netherlands Ministries of Economic Affairs, of Housing, Spatial Planning, andEnvironment, and of Transport, Public Works, and Water Management.
Gale, J., Christensen, N.P., Cutler, A., Torp, T.A., 2001. Demonstrating the potential forgeological storage of CO2: the Sleipner and GESTCO projects. EnvironmentalGeosciences 8 (3), 160–165.
GD, BGR, 2005. Kurzstudie CO2-Speicherpotenzial in NRW (not publicly availableyet). GD (Geologischer Dienst Nordrhein-Westfalen); BGR (Bundesanstalt furGeowissenschaften und Rohstoffe), Krefeld/Hannover.
Harmsen, R., Hoen, V., 2008. Provincial Ambitions Renewable Energy Generationand CO2 Storage in Relation to the Energy Policy ‘‘Clean and Economical’’.Ecofys, Utrecht (in Dutch).
Heddle, G., Herzog, H., Klett, M., 2003. The Economics of CO2 Storage, MIT LFEE2003-003 RP. MIT, Cambridge.
Hendriks, C., Egberts, P., 2003. Carbon Dioxide Sequestration Systems: EconomicEvaluation and Case Studies. GESTCO Technical Report. Ecofys and TNO-NITG,Utrecht, The Netherlands.
Hendriks, C., Wildenborg, T., Feron, P., Graus, W., Brandsma, R., 2003. EC-CASECarbon Dioxide Sequestration, M70066. Ecofys, TNO, Utrecht.
Hermanrud, C., Andresen, T., Eiken, O., Hansen, H., Janbu, A., Lippard, J., Bolas, H.N.,Simmenes, T.H., Teige, G.M.G., Østmo, S., 2009. Storage of CO2 in saline aqui-fers—lessons learned from 10 years of injection into the Utsira Formation in theSleipner area. Energy Procedia 1 (1), 1997–2004.
Holt, T., Lindeberg, E., Wessel-Berg, D., 2009. EOR and CO2 disposal—economic andcapacity potential in the North Sea. Energy Procedia 1 (1), 4159–4166.
Hoog, M.d., 2008. Rotterdam Climate Initiative: CO2 Capture, Transport, and Storagein Rijnmond. DCMR milieudienst Rijnmond, Rotterdam (in Dutch).
IEA, 2007. World Energy Outlook 2007. International Energy Agency, Paris.IEA, 2008. Energy Technology Perspectives 2008. IEA, Paris.IEA GHG, 2002. Transmission of CO2 and Energy, PH4-6. International Energy
Agency Greenhouse Gas R&D Programme, Cheltenham.IEA GHG, 2003. Potential for improvement in gasification combined cycle power
generation with CO2 capture, PH4/19, Cheltenham.IEA GHG, 2004. Improvement in power generation with post-combustion capture of
CO2, PH4-33, Cheltenham.IEA GHG, 2005a. Building the cost curves for CO2 storage: European sector, 2005/2.
International Energy Agency Greenhouse Gas R&D Programme, Cheltenham.IEA GHG, 2005b. Building the cost curves for CO2 storage: North America, 2005/3,
Cheltenham.IHS, 2008. IHS Indexes, IHS/CERA Upstream Capital Cost Index (UCCI). In: http://
ihsindexes.com/ucci-graph.htm (January 8, 2009).IHS, 2009. Graph IHS/CERA Upstream Capital Cost Index. .IPCC, 2007. Climate Change 2007: Mitigation of Climate Change. Summary for
Policymakers. .Janssen, L., Okker, V., Schuur, J., 2006. Welfare and environmental quality report for
the Netherlands in 2040 (in Dutch), Netherlands bureau for economic analysis,Netherlands environmental assessment agency, and Netherlands Institute forSpatial Research, The Hague and Bilthoven.
Junginger, M., Faaij, A., Turkenburg, W.C., 2005. Global experience curves for windfarms. Energy Policy 33, 133–150.
Kemp, S.J., Pearce, J.M., Steadman, E.J., 2002. Mineralogical, geochemical andpetrographical characterisation of Nordland Shale cores from well 15/9-A-11, Sleipner field, northern North Sea Sustainable Energy and GeophysicalSurveys Programme, Commissioned Report CR/02/313, British Geological Sur-vey, Keyworth, Nottingham.
Kernteam CCS Noord-Nederland, 2009. Carbon Capture and Storage, Action PlanNorth Netherlands. 978-90-79147-05-2 (in Dutch).
Kronimus, A., Busch, A., Alles, S., Juch, D., Jurisch, A., Littke, R., 2008. A preliminaryevaluation of the CO2 storage potential in unminable coal seams of the MunsterCretaceous Basin, Germany. International Journal of Greenhouse Gas Control 2(3), 329–341.
Lindeberg, E., Vuillaume, J., Ghaderi, A., 2009. Determination of the CO2 storagecapacity of the Utsira formation. Energy Procedia 1 (1), 2777–2784.
Loulou, R., Goldstein, G., Noble, K., 2004. Documentation for the MARKAL Family ofModels. ETSAP, Paris.
Markussen, P., Austell, J.M., Hustad, C.-W., 2002. A CO2-infrastructure for EOR inthe North Sea (CENS): macroeconomic implications for host countries. In:6th International conference on Greenhouse Gas Control Technologies,Kyoto.
May, F., Muller, C., Bernstone, C., Rubin, E.S., Keith, D.W., Gilboy, C.F., Wilson, M.,Morris, T., Gale, J., Thambimuthu, K., 2005. Assessment of the CO2 storagepotential in deep saline aquifers (in Germany). In: Greenhouse Gas ControlTechnologies 7, Proceedings of the 7th International Conference on GreenhouseGas Control Technologies. Elsevier Science Ltd., Vancouver, Canada, doi:10.1016/B978-008044704-9/50256-1.
McCollum, D., Ogden, J.M., 2006. Techno-economic Models for Carbon DioxideCompression, Transport, and Storage & Comparing Techno-economic Modelsfor Pipeline Transport of Carbon Dioxide, UCD-ITS-RR-06-14. Institute of Trans-portation Studies, University of California, Davis.
McKinsey&Company, 2008. Carbon Capture and Storage: Assessing the Economics.McKinsey&Company.
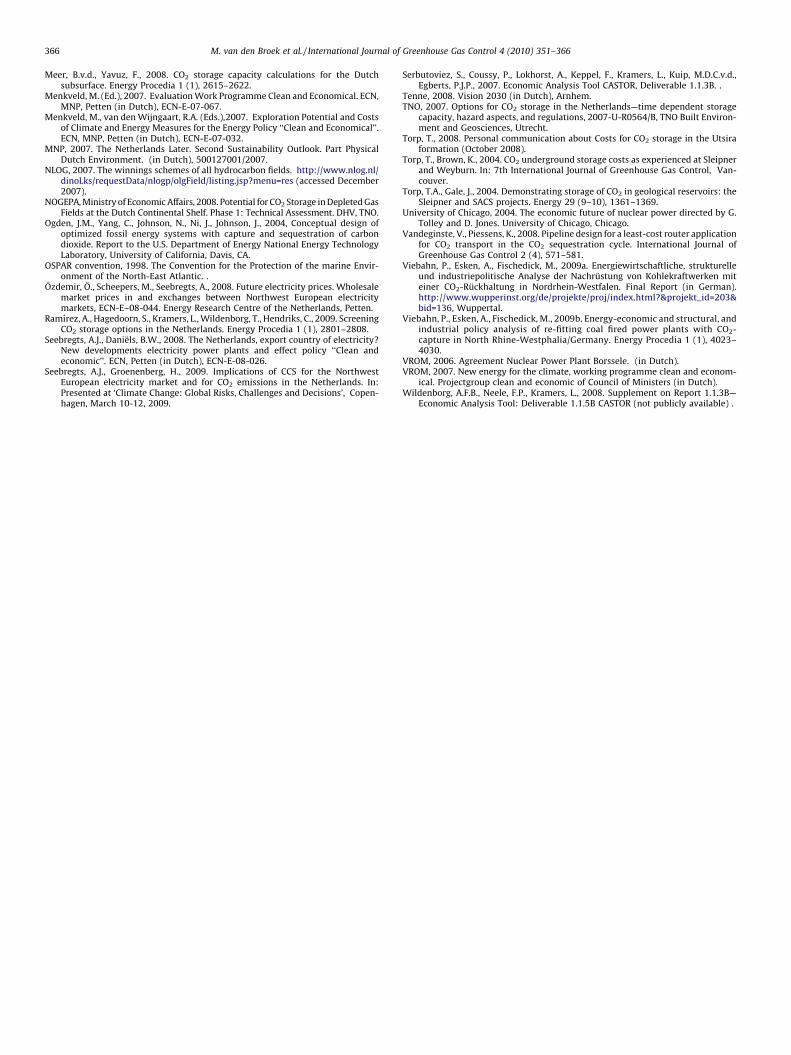
M. van den Broek et al. / International Journal of Greenhouse Gas Control 4 (2010) 351–366366
Meer, B.v.d., Yavuz, F., 2008. CO2 storage capacity calculations for the Dutchsubsurface. Energy Procedia 1 (1), 2615–2622.
Menkveld, M. (Ed.), 2007. Evaluation Work Programme Clean and Economical. ECN,MNP, Petten (in Dutch), ECN-E-07-067.
Menkveld, M., van den Wijngaart, R.A. (Eds.),2007. Exploration Potential and Costsof Climate and Energy Measures for the Energy Policy ‘‘Clean and Economical’’.ECN, MNP, Petten (in Dutch), ECN-E-07-032.
MNP, 2007. The Netherlands Later. Second Sustainability Outlook. Part PhysicalDutch Environment. (in Dutch), 500127001/2007.
NLOG, 2007. The winnings schemes of all hydrocarbon fields. http://www.nlog.nl/dinoLks/requestData/nlogp/olgField/listing.jsp?menu=res (accessed December2007).
NOGEPA, Ministry of Economic Affairs, 2008. Potential for CO2 Storage in Depleted GasFields at the Dutch Continental Shelf. Phase 1: Technical Assessment. DHV, TNO.
Ogden, J.M., Yang, C., Johnson, N., Ni, J., Johnson, J., 2004, Conceptual design ofoptimized fossil energy systems with capture and sequestration of carbondioxide. Report to the U.S. Department of Energy National Energy TechnologyLaboratory, University of California, Davis, CA.
OSPAR convention, 1998. The Convention for the Protection of the marine Envir-onment of the North-East Atlantic. .
Ozdemir, O., Scheepers, M., Seebregts, A., 2008. Future electricity prices. Wholesalemarket prices in and exchanges between Northwest European electricitymarkets, ECN-E–08-044. Energy Research Centre of the Netherlands, Petten.
Ramırez, A., Hagedoorn, S., Kramers, L., Wildenborg, T., Hendriks, C., 2009. ScreeningCO2 storage options in the Netherlands. Energy Procedia 1 (1), 2801–2808.
Seebregts, A.J., Daniels, B.W., 2008. The Netherlands, export country of electricity?New developments electricity power plants and effect policy ‘‘Clean andeconomic’’. ECN, Petten (in Dutch), ECN-E-08-026.
Seebregts, A.J., Groenenberg, H., 2009. Implications of CCS for the NorthwestEuropean electricity market and for CO2 emissions in the Netherlands. In:Presented at ‘Climate Change: Global Risks, Challenges and Decisions’, Copen-hagen, March 10-12, 2009.
Serbutoviez, S., Coussy, P., Lokhorst, A., Keppel, F., Kramers, L., Kuip, M.D.C.v.d.,Egberts, P.J.P., 2007. Economic Analysis Tool CASTOR, Deliverable 1.1.3B. .
Tenne, 2008. Vision 2030 (in Dutch), Arnhem.TNO, 2007. Options for CO2 storage in the Netherlands—time dependent storage
capacity, hazard aspects, and regulations, 2007-U-R0564/B, TNO Built Environ-ment and Geosciences, Utrecht.
Torp, T., 2008. Personal communication about Costs for CO2 storage in the Utsiraformation (October 2008).
Torp, T., Brown, K., 2004. CO2 underground storage costs as experienced at Sleipnerand Weyburn. In: 7th International Journal of Greenhouse Gas Control, Van-couver.
Torp, T.A., Gale, J., 2004. Demonstrating storage of CO2 in geological reservoirs: theSleipner and SACS projects. Energy 29 (9–10), 1361–1369.
University of Chicago, 2004. The economic future of nuclear power directed by G.Tolley and D. Jones. University of Chicago, Chicago.
Vandeginste, V., Piessens, K., 2008. Pipeline design for a least-cost router applicationfor CO2 transport in the CO2 sequestration cycle. International Journal ofGreenhouse Gas Control 2 (4), 571–581.
Viebahn, P., Esken, A., Fischedick, M., 2009a. Energiewirtschaftliche, strukturelleund industriepolitische Analyse der Nachrustung von Kohlekraftwerken miteiner CO2-Ruckhaltung in Nordrhein-Westfalen. Final Report (in German).http://www.wupperinst.org/de/projekte/proj/index.html?&projekt_id=203&bid=136, Wuppertal.
Viebahn, P., Esken, A., Fischedick, M., 2009b. Energy-economic and structural, andindustrial policy analysis of re-fitting coal fired power plants with CO2-capture in North Rhine-Westphalia/Germany. Energy Procedia 1 (1), 4023–4030.
VROM, 2006. Agreement Nuclear Power Plant Borssele. (in Dutch).VROM, 2007. New energy for the climate, working programme clean and econom-
ical. Projectgroup clean and economic of Council of Ministers (in Dutch).Wildenborg, A.F.B., Neele, F.P., Kramers, L., 2008. Supplement on Report 1.1.3B—
Economic Analysis Tool: Deliverable 1.1.5B CASTOR (not publicly available) .
Copyright © 2022 FDOKUMEN