FATIGUE FAILURE OF A ROTATING CHEMICAL VESSEL
17
Pergamon Engineering Failure Analysis, Vol.3, No. 2, pp. 77-93, 1996 Copyright (~) 1996Elsevier Science Ltd Printedin Great Britain. All rightsreserved 1350-6307/96 $15.00 + 0.00 PII:S 1350-6307(96)00007-6 FATIGUE FAILURE OF A ROTATING CHEMICAL VESSEL D. R. H. JONES Department of Engineering, University of Cambridge, Trumpington Street, Cambridge CB2 1PZ, U.K. and K. A. MACDONALD Department of Engineering, University of Aberdeen, Aberdeen AB9 2UE, U.K. (Received 30 January 1996) Abstract--This paper describes the fatigue failure of a welded steel vessel in a chemical plant. The process conditions required the vessel to be rotated continuously at a speed of about two revolutions per minute. To permit this rotation, a pair of trunnion shafts was welded to opposite sides of the vessel. Each shaft was supported in a self-aligning bearing. The connection between the shaft and the vessel was strengthened with gusset plates which were fixed to both vessel and shaft by fillet welds. Because of the self-weight of the vessel, each trunnion shaft was subjected to an upward reaction force of 13 tonnes applied at the centre-line of the bearing. After ~ years in service, 75% of the gusset-shaft welds had failed by fatigue. The failure was analysed using the weld fatigue curves given in BS 5400: Part 10:1980 and remedial measures were discussed. Copyright (~) 1996 Elsevier Science Ltd. 1. INTRODUCTION 1.1. Background Figure 1 is a schematic diagram of a process vessel in a chemical plant. The vessel was fabricated from mild steel and was operated as follows. First, the chemicals were poured into the vessel through a valve at the top. The valve was then closed and the vessel was rotated about a horizontal axis to agitate the chemicals. The process needed heat and this was supplied by circulating hot water through a hollow jacket which was welded to the outside of the vessel. The vessel rotated at a speed of about two revolutions per minute. When the reaction had finished, the vessel was stopped with the valve at the bottom. The valve was then opened and the chemicals were poured out. When the vessel was empty, it was turned through another half-turn so it could be filled with a fresh batch of chemicals. The cycle of events was then repeated. Drive gear Trunnion shaft ~ /~earing Idling side Driving side Fig. 1. Schematic side elevation of the chemical vessel. 7"7
Transcript of FATIGUE FAILURE OF A ROTATING CHEMICAL VESSEL

Pergamon Engineering Failure Analysis, Vol. 3, No. 2, pp. 77-93, 1996
Copyright (~) 1996 Elsevier Science Ltd Printed in Great Britain. All rights reserved
1350-6307/96 $15.00 + 0.00
PII:S 1350-6307(96)00007-6
FATIGUE FAILURE OF A ROTATING CHEMICAL VESSEL
D. R. H. JONES
Department of Engineering, University of Cambridge, Trumpington Street, Cambridge CB2 1PZ, U.K.
and
K. A. M A C D O N A L D
Department of Engineering, University of Aberdeen, Aberdeen AB9 2UE, U.K.
(Received 30 January 1996)
Abstract--This paper describes the fatigue failure of a welded steel vessel in a chemical plant. The process conditions required the vessel to be rotated continuously at a speed of about two revolutions per minute. To permit this rotation, a pair of trunnion shafts was welded to opposite sides of the vessel. Each shaft was supported in a self-aligning bearing. The connection between the shaft and the vessel was strengthened with gusset plates which were fixed to both vessel and shaft by fillet welds. Because of the self-weight of the vessel, each trunnion shaft was subjected to an upward reaction force of 13 tonnes applied at the centre-line of the bearing. After ~ years in service, 75% of the gusset-shaft welds had failed by fatigue. The failure was analysed using the weld fatigue curves given in BS 5400: Part 10:1980 and remedial measures were discussed. Copyright (~) 1996 Elsevier Science Ltd.
1. I N T R O D U C T I O N
1.1. Background Figure 1 is a schematic diagram of a process vessel in a chemical plant. The vessel was fabricated from mild steel and was operated as follows. First, the chemicals were poured into the vessel through a valve at the top. The valve was then closed and the vessel was rotated about a horizontal axis to agitate the chemicals. The process needed heat and this was supplied by circulating hot water through a hollow jacket which was welded to the outside of the vessel. The vessel rotated at a speed of about two revolutions per minute. When the reaction had finished, the vessel was stopped with the valve at the bottom. The valve was then opened and the chemicals were poured out. When the vessel was empty, it was turned through another half-turn so it could be filled with a fresh batch of chemicals. The cycle of events was then repeated.
Drive gear
Trunnion shaft ~ /~earing
Idling side Driving side Fig. 1. Schematic side elevation of the chemical vessel.
7"7

78 D. R. H. JONES and K. A. MACDONALD
The average gross weight of the vessel when it was operating was about 26 tonnes. This means that each trunnion shaft was subjected to an upward reaction force of 13 tonnes applied at the centre-line of the bearing. The bearings were self-aligning so the reaction force applied a bending moment to the shaft. In order to resist this moment, the attachment between the shaft and the vessel was stiffened with gusset plates as shown in Fig. 2. The gussets were fixed to the jacket and the shaft by fillet welds. Each shaft was attached using a total of eight gussets spaced equally around the circumference of the shaft. After 4½ years in service, cracks were found in most of the welds between the shaft and the gussets on the driving side of the vessel.
We can see that if the vessel is rotated through 180 ° the stresses in the welds will be reversed. If the vessel is rotated by another 180 °, the stresses will return to their initial values. This means that, with each revolution, the stresses in the welds will undergo a complete cycle of fatigue loading. The total number of fatigue cycles N experienced by the welds during the period of operation is given approximately by: 2 x 60 x 24 z 365 x 4.5 x 0.9 -- 4.3 x 10 6. The vessel was in continuous use for about 90% of the time and this is allowed for by the "utilization factor" of 0.9. This is a large number of cycles and the welds presumably failed by high-cycle fatigue.
1.2. Details of construction
Figure 3 is a photograph of the trunnion shaft, gussets and bearing on the idling side. The exterior of the vessel was covered with a layer of thermal insulation, which in turn was covered with cladding sheets of mild steel. The gusset-shaft welds are clearly visible, but the shaft- jacket welds are hidden by the cladding. Figure 4 is a photograph of the trunnion shaft and gussets on the driving side. The drive gear has been removed from the shaft. Some of the cladding and ir~sulation has been removed to reveal the surface of the jacket.
Figures 5 and 6 give details of the shafts and their attachments to the vessel. For simplicity, Figs 5 and 6 do not show various part-circumferential stiffening ribs which were inserted between the jacket wall and the vessel wall.
The geometry specified for the gusset-shaft welds is shown in Fig. 7. The gussets were made from 25 mm plate and the fillet welds had a leg of 12 mm.
1.3. Details of failures
The weld at gusset number 1 on the driving side was cracked as shown in Fig. 8. The crack almost certainly started at the toe of the weld. This is because (a) the change in section at the toe generates a stress concentration, (b) the surface of the weld bead is rough, (c) there is a
i
Fillet / i " ~ welds
i " N ~ Trunnion I
. . . . . / " - - L -- -7 3----
I Fig. 2. Arrangement of gussets.

Fatigue failure of a rotating chemical vessel 79
Fig. 3. Photograph of idling side.
tensile residual stress at the toe. Once the crack had initiated, it spread through the whole cross-section. As a result, the gusset became detached from the shaft and only a compressive load could be transferred from the shaft to the gusset. The welds at gussets 2, 4, 5, 6 and 8 on the driving side were cracked differently. As Fig. 9 shows, the cracks had passed through the throat of each weld bead. The cracks almost certainly started at the root of the weld. This is because there is both a high residual stress and a very bad stress concentration at this location. The welds at gussets 3 and 7 on the driving side were not cracked. There were no cracks in the welds on the idling side.
Figure 10 shows photographs of cracks at gussets 1, 2, 4, 6 and 8. Figure 10(a) and 10(b) shows that the crack in gusset 1 subsequently moved into the shaft- jacket weld and propagated a considerable distance around the circumference of the shaft on both sides of the gusset. As shown in Fig. 10(c) and 10(d) the gusset-shaft welds at gussets 8 and 2 were not continuous with the shaft- jacket welds. This allowed the circumferential cracking to propag- ate past gussets 8 and 2 to produce a quarter-circumferential crack. The plant operators were alerted to the failure by steam escaping from the jacket through the circumferential crack.
2. W E L D F A T I G U E S T R E N G T H S
Figure 11 gives fatigue curves for welds in structural steel, taken from the British Standard code for the design of bridges, BS 5400 [1]. Because the fatigue strength of a weld is sensitive to the geometry, the code divides the common types of welds into a number of weld classes,

8(3 D . R . H . JONES and K. A. M A C D O N A L D
Fig. 4. Photograph of driving side.
] = 51() ='
G u s s e l I
16 - 4 ~ [ ~ - - I ~.
G u s s e t 5
I ~ U ~ J a c k e t wal l
V e s s e l wal l
Fig. 5. Details of the driving side. Dimensions in mm.
Fatigue failure of a rotating chemical vessel
'~- 420 --
~-- t G u s s e t 1
6 i t II FTF
~ Jacket wall
~ Vessel wall
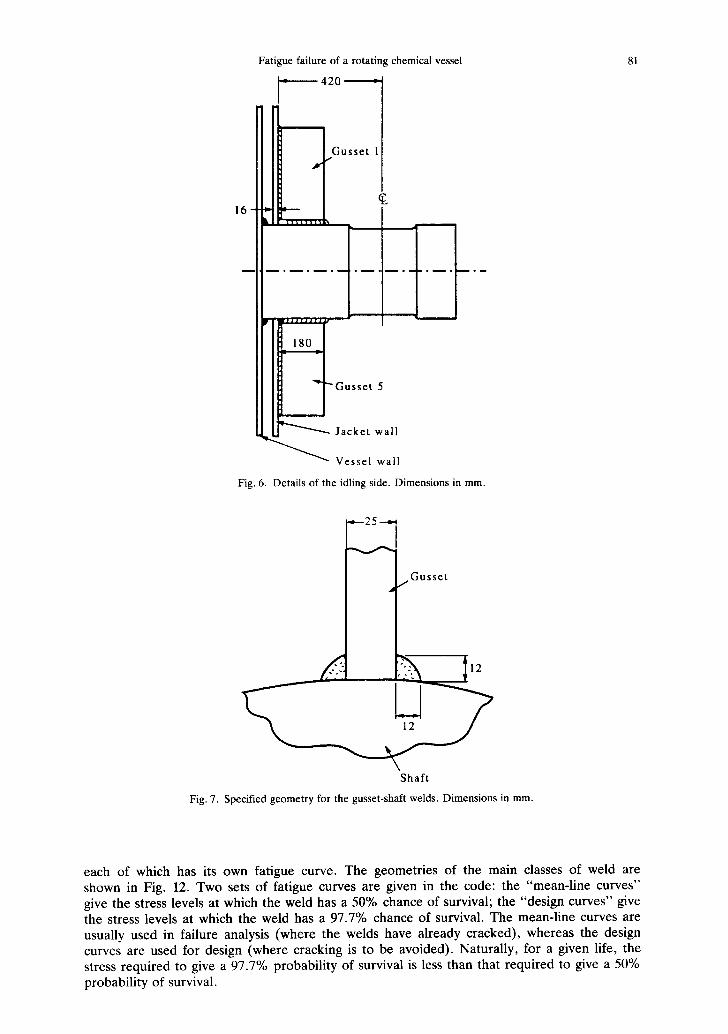
Fig. 6. Details of the idling side. Dimensions in mm.
81
.~---25
Gusset f
Shaft
Fig. 7. Specified geometry for the gusset-shaft welds. Dimensions in mm.
each of which has its own fatigue curve. The geometries of the main classes of weld are shown in Fig. 12. Two sets of fatigue curves are given in the code: the "mean-line curves" give the stress levels at which the weld has a 50% chance of survival; the "design curves" give the stress levels at which the weld has a 97.7% chance of survival. The mean-line curves are usually used in failure analysis (where the welds have already cracked), whereas the design curves are used for design (where cracking is to be avoided). Naturally, for a given life, the stress required to give a 97.7% probability of survival is less than that required to give a 50% probability of survival.

82 D. R, H. JONES and K. A. M A C D O N A L D
Fig. 8. Geometr~ of the fatigue crack m the gusset. The arrow marks the position where the crack probably started.
Fig. 9. Geometry of the fatigue cracks m the gusset-shalt welds. I 'he arrows mark the positions where the cracks probably started,
(a)
Fig. 10(a). Capt ion on p. 85.

Fatigue failure of a rotating chemical vessel 83
Fatigue data for uncracked components are traditionally obtained under conditions of zero mean stress. When the mean stress is not zero, Goodman 's rule indicates that the fatigue strength must be corrected by a factor which depends on the value of the mean stress. No such correction is needed for welds: their fatigue strength is assumed to depend only on the applied stress range Ao. This assumption derives from the fact that welds generally contain tensile residual stresses of yield magnitude. Thus, if the weld is subjected to a tensile load during the first quarter of the fatigue cycle, it will yield in tension and will shake down. All subsequent deformation will be elastic, with the maximum cyclic stress in the weld being equal to the yield stress in tension. The fatigue strength of the weld is therefore not affected by the extent to which the applied stress cycle is tensile.
Below 10 7 cycles the fatigue curves are based on experimental data for actual welds. However , care is needed when using the curves above 10 7 cycles. The situation is summarized
(b)
(c)
Fig. 10(b) and (c). Caption on p. 85.

84 D R, H. J()NES and K. A, MA( ' I ) f )NALD
in Fig. 13. Provided the stress range of the fatigue cycle is constant and the environment is clean, dry air, a fatigue limit operates: the welds will survive indefinitely as long as the stress range is less than the stress range at 10 7 cycles.
Random overloads can trigger the growth of defects that would be stable at the normal value of the stress range. The code allows for this by reducing the slope of the fatigue curve above 10 7 cycles as shown in Fig. 13. The extent of this reduction depends on the class of weld. The slope of the fatigue curve below 10 7 cycles is defined as 1/n (over one decade of stress range the number of cycles goes through n decades), n = 3 for Classes D to W, but rises to 3.5 for (?lass C and 4 for Class B. Above 10 7 cycles the slope of the fatigue curve is set equal to l / (u + 2).
(d)
(e)
I:' i~ I q)(d I a nd l e I. ( " a p t i o n ~VV~iu:'

Fatigue failure of a rotating chemical vessel 85
(f)
Fig. 10. Photographs of welds on the driving side. (a) (b) Cracks on either side of gusset 1. (c) Crack at gusset 8. (d) Crack at gusset 2. (e) Crack at gusset 4. (f) Crack at gusset 6.
Curves for 97.7% survival 300 200
~ 150 . ~
100
60
106 107 108 109
Number of cycles
Curves for 50% survival
200
~ 150 I ~ F E ~ 100 ~
6 0 I ~ ~
N 30 ~ 20 ~ 15
10
~05 106 107 108 109
Number of cycles
Fig. 11. Fatigue curves for welds in structural steel [1].

86 D . R . H . JONES and K. A. M A C D O N A L D
Delaily, on sur tace ot member Detatls on end connections of member
~/Cracking t
Grindin direction ]
B
~ C/D
/ k
~ F 2 DIE
Grinding direction /
c \ (]rind
all edges
I ' I
Fig. I2. Classes of welds for use with Fig. I 1.
e~
300
200 I50
100
60 50 40 30
20 -- 15 --
10 - -
8105
- 1 T ' ~ o o t I
Constant A o in c l ean dry air
"" • '~"t?ble 4
• - n + 2 3"
106 107 108 109
Nf
Fig. 13. W e l d fat igue data above 107 cycles .
hi'/"
3. F AILURE ANALYSIS
3.1. Initial assessment
The welds between the shaft and the gussets are responsible for transferring a direct load between the two components and are therefore classified as "weld details on end connections of member" by BS 5400. Because the crack at gusset 1 initiated at the toe of the weld and ran through the member itself, the welded connection is a Class F2 (see Fig. 12). On the other hand, the connections at gussets 2, 4, 5, 6 and 8 are Class W because the cracks ran through the throat of the weld.
In all classes of weld, except Class W, A o is the nominal stress range in the member. The stress range for the Class F2 weld is therefore the nominal stress range in the gusset itself, which we denote as Aol . In a Class W weld, however, A o is the nominal stress range in the throat of the fillet weld. We denote this stress range as Ao~. The two stress ranges are related by the equation

Fatigue failure of a rotating chemical vessel 87
g is the "effective throat dimension" of the fillet weld and is defined in Fig. 14 [2]. As shown in Fig. 14, b = 25 mm and g = 9 mm, so Ao2 = 1.38Aol.
Referring to Fig. 15, we can see that a Class F2 weld needs to be subjected to a stress range of 64 MPa to make it break after 4.3 x 10⁶ cycles: the stress range in gusset 1 on the driving side must therefore have been approximately 64 MPa. The stress range needed to break a Class W weld after 4.3 x 10⁶ cycles is 43 MPa: the weld throats at gussets 2, 4, 5, 6 and 8 on the driving side must therefore have been subjected to a stress range of approximately 43 MPa.
Referring to Fig. 16, we can see that a Class F2 weld will survive 4.3 x 10⁶ cycles as long as the stress range in the gusset is kept below 46 MPa; a Class W weld will survive 4.3 x 10⁶ cycles if the stress range in the weld throat is kept below 32 MPa. As there were no cracks at gussets 3 and 7 on the driving side, or at any of the gussets on the idling side, the stress ranges must have been less than 46 MPa in the gusset and 32 MPa in the weld throat.
It should be noted that a Class F2 weld fatigue failure would not be expected for the fabrication geometry specified. This is because (a) the stress range in the weld throat is greater than that in the gusset, and (b) the fatigue strength of a Class W weld is less than that of a Class F2 weld. The Class F2 failure observed in gusset 1 on the driving side is therefore anomalous. To obtain equal resistance to fatigue at the weld toe and the weld root, the throat
- i~ol r
'~ t a g =9
Fig. 14. Stress ranges in the welded connection. Dimensions in mm.
300
200
1 5 0
100
~ 60 ~ 5 0 v 4 0
.el 3 0
2(I
15 -
1 0 -
8 1 0 5
I~ -#a
- [- . . . . . . . . I , , ~ . . . . .
10 6 10 7
Nf
l 0 8 l 0 9
Fig. 15. Fatigue curves for 50% survival.

<3
300
200
150
100
60 50 40
l). R. H. J O N E S and K. A. M A C D O N A L D
30
20
15 -
1 0 -
8
105
- ~
I
I
{ J I i l l l l J l I ~ J i i [ l
1 0 6 I 0 7
N f
Fig. I~. Fat igue curves for ~)7.7% survival .
. . . . . . . . I ' > , ~ , • , ,z
10 8 10 9
dimension g would have to be increased from the specified 9 mm to 21 mm. The simplest explanation of the Class F2 failure is therefore that g was approximately twice that specified, either as a result of excessive leg length or significant root penetration.
The geometry of the vessel is complex and it is not easy to determine the value of Ao]. There are two methods of doing this to a reasonable degree of accuracy. The first (experimental) method inw)lves fixing strain gauges to the surface of the gusset near each weld and measuring the change in the signal output as the vessel is rotated through 180 ° . The second (theoretical) method is to analyse the elastic behaviour of the assembly using a finite-element (FE) software package. Both methods are t ime-consuming and require special- ist resources. Owing to financial and time constraints, it was not possible to employ either method during the early stages of the failure analysis. However, the locations of the failures could be accounted for in a qualitative way. Referring to Figs 5 and 6, it can be seen (a) that the gussets on the idling side are much wider than those on the driving side, and (b) that the bearing on the idling side is closer to the wall of the jacket than it is on the driving side. The welds were therefore subjected to a significantly smaller stress range on the idling side than on the driving side. This was consistent with the absence of fatigue failures on the idling side.
3.2. Weld geometry modification,s
An obvious way of strengthening a Class W weld is to increase the penetrat ion as shown in Fig. 17. This increases g and decreases Ao2. However , the best solution is to go for a full-penetration weld (see Fig. 17). This gets rid of the crack initiation site at the weld root and a Class W failure should not occur. An added bonus of a full-penetration weld is that it decreases the stress concentration at the weld toes on the surface of the gusset. As shown in Fig. 12, this allows one to reclassify the connection as Class F, giving even better fatigue properties.
The fatigue strength of the Class F connection can be improved even further by grinding the surface of the weld as shown in Fig. 17. This removes the rough finish of the weld and gives a smooth transition at the change of section, both of which lower the stress concentration at the weld toe. The heat-affected zone at the toe is a potential source of crack-like defects, and it is important to remove sufficient material at the toe to eliminate any defects. BS 7608 [3] gives details of the procedure to be followed when toe-grinding, and indicates that the process can improve the fatigue strength of the weld by 30%.
The data are summarized in Table 1. The toe-ground Class F weld has a design fatigue limit of 52 MPa, so the gusset-shaf t welds on the idling side should last indefinitely if the existing fillet welds are replaced by full-penetration toe-ground welds. However , the stress range on

Fatigue failure of a rotating chemical vessel 89
Fig. 17. Improving the fatigue strength of the welded connection.
Table 1. Nominal stress ranges in gusset at weld toe (MPa)
Design fatigue Mean fatigue strength of strength of
Actual stress range Actual stress range Class F weld Class F weld for driving side for idling side
Number of cycles (F2 failure) (F2 survival) As-welded Ground As-welded Ground
4.3 x 10⁶ 64 < 46 53 69 73 95 (4.5 years) 107 64 < 46 40 52 56 73 (fatigue limit)
the driving side lies midway between the design and mean fatigue limits of 52 and 73 MPa respectively. This implies that further design changes would be needed in order to ensure an indefinite life for the gusset-shaft welds on the driving side.
4. FINITE-ELEMENT ANALYSIS
Once the qualitative failure analysis had been accomplished, it was decided to embark on a finite-element (FE) analysis of the stresses in the region of the welds.
4.1. Computational facilities
FE models were prepared using MSC/PATRAN 3 version 1.4-1 graphics-based mesh- generating software [4]. The FE analyses were performed using ABAQUS/Standard version 5.4, a general-purpose FE program [5], and the results generated using ABAQUS/Post, an interactive postprocessing program. Currently, all the software is mounted on one of the Sun SparcServer 1000 computers (four 50 MHz CPUs) at the University of Aberdeen Computing Centre, running the Solaris operating system and accessed via SunSparc IPC workstations. The simpler geometries and minor alterations to complex models were edited directly using

90 D. R, H. JONES and K. A. M A C D O N A L D
the ABAQUS model data derivatives, but the more complex models were created using PATRAN.
4.2. Modelling procedure
Elastostatic solution procedures were employed with finite-strain computation to consider geometrically nonlinear large-displacement behaviour should it occur. Submodelling was exploited where the global component or structure was initially modelled with locally coarse meshes at any stress concentrations, and subsequent submodelling considered only the region containing the stress concentration, but with a refined mesh aiming to return a converged result. This method made use of St Venant's principle, where the elevating effect of the stress concentration dies away quickly with distance and does not affect the stresses elsewhere in the component. Significant savings in computation time can be obtained using such a procedure, particularly concerning analyses in three dimensions, where the number of degrees of freedom can rapidly escalate with increasing model size.
A full FE analysis of the vessel containing all features accurately represented would be an onerous task given the curved double-skin construction with stiffening ribs. An approximate analysis was carried out using a simplified three-dimensional (3-D) geometry modelling the driving-side trunnion region only, and neglecting the jacket (see Figs 18 and 19). A vertical symmetry plane was used on the shaft centreline. The boundary conditions used were straightforward, with vertical and lateral support at the bearing and a downward pressure along the base of the vessel wall equivalent to the operational load (see Figs 18 and 19). Owing to their renowned good performance in such problems [6], the 3-D solid elements used were 20-noded quadratic bricks with reduced integration. Such reduced integration elements give accurate displacements even in regions of high strain gradient, but may return inaccurate stresses. The submodel made use of the fully integrated form of the 20-noded elements.
symmetry plane
l
Fig. 18, FE global model of the driving
-,,,q
A g support
A A
J side: model with boundary conditions.

- - - _ _ _
/ /
f
Fig. 19.
Fatigue failure of a rotating chemical vessel
\
/
/
FE global model of the driving side: detail of gusset region.
gusset No.
1 IB I
4 ': 2A ]
' 2B ~ 2
~ 3B
4 "~ 7 4B
~ 5A 5
end of gusset
t 6 . ,
1 2 .
o3
i
8
to
4 .
0 . '
0 . 0
I I
0.I 0.2
DISTANCE ALONG GUSSET Irt~l]
Fig. 20. Stresses in the gussets from the global FE model.
0 . 3
weld toe
t
[xlO
0 .
]

92 D.R.H. JONES and K. A. MACDONALD
4.3. Results
In the weld fatigue rules, the joint classifications take account of the local stress concentration introduced by the weld detail itself. The stress ranges are the nominal stress ranges in the vicinity of, but not directly at, the weld. The rules do not, however, take into account the stress concentrating effect of the local structural arrangement, which must be separated carefully from the very localized weld profile detail. The results from the global analysis expressed as non-signed von Mises equivalent stress are shown in Fig. 20, where the stress along the free edge of the gusset approaching the shaft is clearly shown to vary with gusset orientation, reaching a maximum at gussets 1 and 5 as expected.
Submodelling of the gusset/weld region (see Fig. 21) was accomplished with checks on the submodel boundary (comparing an important variable, in this case maximum principal stress, at the global and submodel shared boundary) and a brief mesh optimization procedure with models employing increasing numbers of elements to check for convergence of the stresses in the gusset near to, but not directly at, the weld toe. The submodel results for gusset 5 (see Fig. 22) demonstrate the increase of stress (acting along the gusset longitudinal axis) as the joint with the shaft is approached. Separating the stress concentrating effect of the structural detail from that of the weld toe is problematic. Stress values extrapolated to the weld toe using a simple tinearization procedure are heavily influenced by proximity to the weld toe. They lie between 12.2 and 20.0 MPa, and give stress ranges of 24.4 to 40 MPa acting at gussets 1 and 5, depending on what linearization is taken. These values compare favourably with, but are somewhat lower than, the estimated stress range of 64 MPa based on the Class F2 fatigue data (see Table 1). Taking the peak stress at the weld toe gives a stress range of approximately 50 MPa, but this result is not fully converged at the weld toe. A more comprehensive model of the whole vessel with its curved double skin and stiffening ribs would obviously return more robust answers, but at substantially greater effort and cost.
, ! ! , " i "
Fig. 21. Submodel FE mesh (part of gusset).

Fatigue failure of a rotating chemical vessel 93
25.
20.
t~ 15.
n,, b. [Q
10.
1 I I
2
/ 2
/
20
12.23
5. I I I 1
o. 50. I 0 0 . 150. T 200 .
I DISTANCE ALONG GUSSET [mm] wetd toe
Fig. 22. Stresses in gusset 5 from the submodel analysis.
REFERENCES
1. British Standards Institution, BS 5400: 1980: Steel, Concrete and Composite Bridges: Part 10: Code of Practice for Fatigue.
2. British Standards Institution, BS 5400: 1982: Steel, Concrete and Composite Bridges: Part 3: Code of Practice for Design of Steel Bridges.
3. British Standards Institution, BS 7608: 1993: Code of Practice for Fatigue Design and Assessment of Steel Structures.
4. MacNeal-Schwendler Corporation, MSC/PATRAN 3 Release Notes, Release 1.4-1, Los Angeles (1995). 5. Hibbit, Karlson and Sorensen Inc, ABAQUS/Standard Release Notes, Version 5.4, Pawtucket (1995). 6. NAFEMS, A Finite Element Primer (2nd reprint), NEL, East Kilbride (1991).