robust control charts based on modified trimmed standard ...
Upload
khangminh22Category
view
0download
0
International Journal of
Environmental Research
and Public Health
Article
Fat Mass Centile Charts for Brazilian Children andAdolescents and the Identification of the Roles ofSocioeconomic Status and Physical Fitness on FatMass Development
Simonete Silva 1, Adam Baxter-Jones 2 and José Maia 3,*1 Department of Physical Education, University Regional of Cariri, Ceará 63112-012, Brazil;
[email protected] College of Kinesiology, University of Saskatchewan, Saskatoon, SK S7N 5B2, Canada; [email protected] Centro de Investigação, Formação, Intervenção e Inovação em Desporto (CIFI2D), Kinanthropometry Lab,
Faculty of Sport, University of Porto, Porto 4200-450, Portugal* Correspondence: [email protected]; Tel.: +351-22-042-5200; Fax: +351-22-550-0687
Academic Editor: María M. Morales Suárez-VarelaReceived: 17 November 2015; Accepted: 18 January 2016; Published: 22 January 2016
Abstract: This paper presents fat mass centile charts for Brazilian youth and investigates the rolesof socioeconomic status and physical fitness (PF) on fat mass (FM) development. Two northeastBrazilian samples were used: a cross-sectional sample of 3659 (1921 girls) aged 8 to 16 years anda mixed-longitudinal series of cohorts (8–10, 10–12, 12–14, 14–16 years) with 250 boys and 250 girls.A measure of somatic maturity was used as a marker of biological maturation; PF comprisedagility, explosive and static strength, and aerobic capacity. Socioeconomic status was based onschool attended; public or private. Slaughter’s anthropometric equations were used to estimateFM. Percentile charts was constructed using the LMS method. HLM (Hierarchical Linear Model)7 software modeled FM changes, identifying inter-individual differences and their covariates. Girlsand boys had different FM percentile values at each age; FM increased nonlinearly in both girls andboys. Higher PF levels reduced FM changes across time in both sexes. Sex-specific non-linear FMreferences were provided representing important tools for nutritionists, pediatriciann and educators.Physical fitness levels were found to act as a protective factor in FM increases. As such, we emphasizePF importance as a putative health marker and highlight the need for its systematic developmentacross the school years.
Keywords: reference percentile curves; fat mass; changes; children; adolescents
1. Introduction
Anthropometric markers of physical growth and body composition (BC) are considered importanthealth indicators at both the individual and population levels [1]. Further, growth reference values,expressed via percentile charts, are among the most widely used, and important instruments, in publichealth and clinical settings [1–3]. They are also used by nutritionists, physical educators and pediatricsport scientists [4–6]. It is recommended that reference values should be from the population understudy, as cultural and ethnic differences affect a child’s growth and development.
The prevalence of youth obesity worldwide has increased dramatically [7]. Additionally, thistrend is also linked to low physical activity levels as well as to insufficient health-related physical fitnesswhich apparently contribute to the development of type 2 diabetes, metabolic syndrome, cardiovasculardiseases, and all-cause mortality in both adults and children [8,9]. It is thus important to closely monitorfat mass development in children and youth, and the need for country specific reference values is
Int. J. Environ. Res. Public Health 2016, 13, 151; doi:10.3390/ijerph13020151 www.mdpi.com/journal/ijerph

Int. J. Environ. Res. Public Health 2016, 13, 151 2 of 14
of the utmost relevance. There are currently available several models and techniques to quantifyfat mass, varying in complexity and ease of use [10]. When data is gathered in the community onhundreds of subjects, skinfold measurements are amongst the cheapest markers to help in assessingand estimating fat and fat free mass development [10] across age groups in a variety of culturalcontexts [11]. Equations to estimate fat mass from skinfolds have been derived and used in manydeveloped [12] and developing countries [11]. Percentile reference charts for fat mass have beendeveloped for children and adolescents for use in US populations [13], as well as for Mexicans’ [14],Germans’ [15] and Turks’ [16], to name but a few. However, the ability of these cross-sectionaldeveloped charts to precisely illustrate children and adolescents growth is compromised as they do notcapture the longitudinal change patterns seen within and between sexes that occur at different timesand rates [17]. It is well known that BC and physical fitness (PF) parameters show variation in theirdevelopment with age and biological maturation [18]. There is also considerable evidence that lowsocioeconomic status (SES) is associated with an increased risk of obesity in children [19]. The searchfor meaningful relationships between PF levels, SES, biological maturation and BC development is animportant and challenging endeavor because of their links with children and adolescents health [20].
Although longitudinal data showing the influence of PF, physical activity (PA) and biologicalmaturation on fat mass changes during childhood and adolescence is scarce [21], cross-sectional datareport that moderate-to-high levels of PF and PA have an inverse relationships with overweight/obesityin children and youth [22–25]. Further, available epidemiological longitudinal data mostly use BMI(Body Mass Index) as a putative marker of body fat (BF) changes. For example, Martins et al. [26]using Azorean child data, followed consecutively from 6 to 10 years, did not find any significantassociations of PA and PF on their annual BMI changes. Conversely, De Souza et al. [27] reportedthat higher PF levels reduced BMI changes across time in Portuguese youth, followed from 10 to18 years. Additionally, Byrd-Williams et al. [28] identified that greater cardiorespiratory fitness wasprotective against increasing adiposity in Hispanics boys, but that in Hispanic girls no such significantassociations were found. Although BMI is widely used as a proxy for body fat, given its measurementsimplicity and valuable use in monitoring obesity trends in population studies, it does have somelimitations. The major disadvantage of using BMI is that it does not distinguish between tissue types.Thus increased BMI can result from both increased fat mass and/or increased lean mass. This can leadto significant misclassification of obesity status [29].
This paper aims to develop longitudinal fat mass centile charts for Brazilian children andinvestigate the roles, if any, of socioeconomic status and physical fitness on fat mass development.It is hypothesized that: (1) Brazilian boys and girls fat mass reference centile charts will showclear sex-differences; (2) fat mass longitudinal changes will show different trends in boys and girls;(3) socioeconomic status will act as a moderator covariate; (4) higher levels of PF will act as protectiveforces in the reduction of BF increases; and (5) that advanced biological maturation and high PFperformance will reduce fat mass development.
2. Methods
2.1. Participants
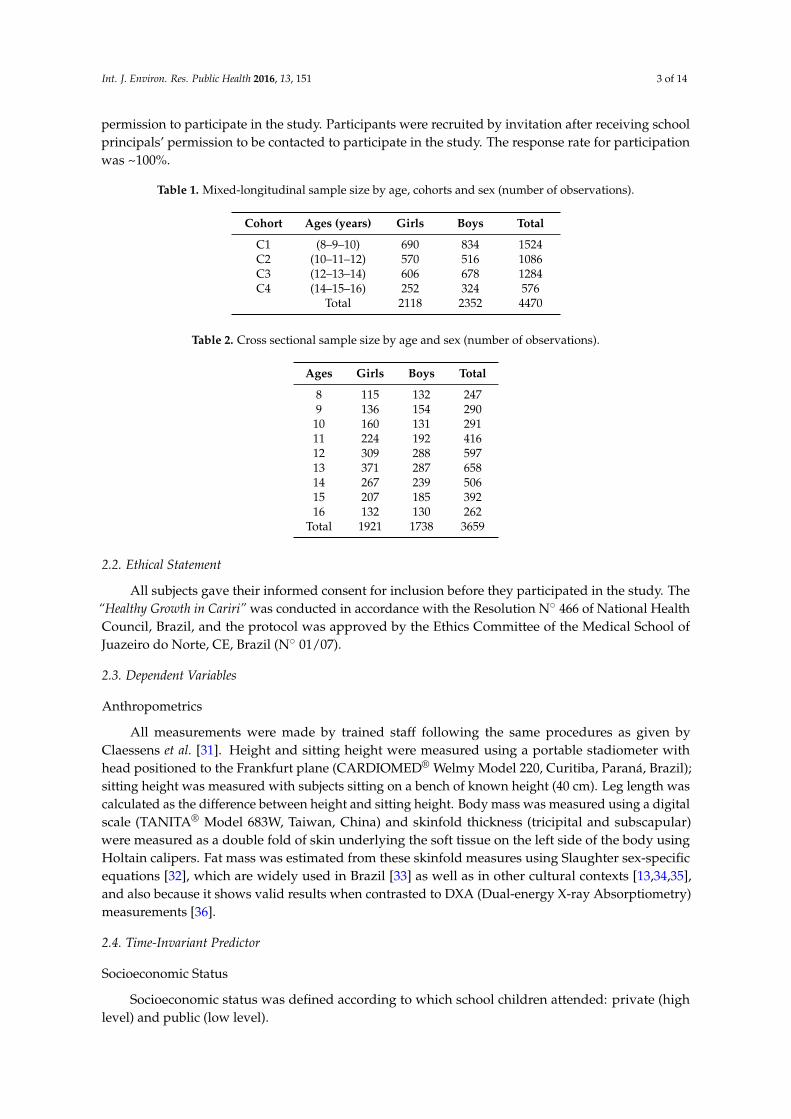
Data are taken from the “Healthy Growth in Cariri” project. This study comprises two distinct andrepresentative samples of randomly selected children and adolescents from public and private schoolssimultaneously studied from 2006 to 2009 [6,30]. The first sample comes from a mixed-longitudinalstudy comprising groups of individuals aged 8 to 16 years, from four baseline age cohorts (8, 10, 12,and 14 years) with overlapping years as shown in Table 1. Individuals were measured at 6 month timeintervals. The study aim was to investigate change and stability of growth, body composition, andmotor performances (Table 1). The second sample originated from a cross-sectional study (Table 2).All subjects came from three cities in the Cariri region: Juazeiro do Norte, Crato, and Barbalha locatedin Ceará State, Northeast of Brazil. Both samples comprised healthy children and youth with parental
Int. J. Environ. Res. Public Health 2016, 13, 151 3 of 14
permission to participate in the study. Participants were recruited by invitation after receiving schoolprincipals’ permission to be contacted to participate in the study. The response rate for participationwas ~100%.
Table 1. Mixed-longitudinal sample size by age, cohorts and sex (number of observations).
Cohort Ages (years) Girls Boys Total
C1 (8–9–10) 690 834 1524C2 (10–11–12) 570 516 1086C3 (12–13–14) 606 678 1284C4 (14–15–16) 252 324 576
Total 2118 2352 4470
Table 2. Cross sectional sample size by age and sex (number of observations).
Ages Girls Boys Total
8 115 132 2479 136 154 29010 160 131 29111 224 192 41612 309 288 59713 371 287 65814 267 239 50615 207 185 39216 132 130 262
Total 1921 1738 3659
2.2. Ethical Statement
All subjects gave their informed consent for inclusion before they participated in the study. The“Healthy Growth in Cariri” was conducted in accordance with the Resolution N˝ 466 of National HealthCouncil, Brazil, and the protocol was approved by the Ethics Committee of the Medical School ofJuazeiro do Norte, CE, Brazil (N˝ 01/07).
2.3. Dependent Variables
Anthropometrics
All measurements were made by trained staff following the same procedures as given byClaessens et al. [31]. Height and sitting height were measured using a portable stadiometer withhead positioned to the Frankfurt plane (CARDIOMED® Welmy Model 220, Curitiba, Paraná, Brazil);sitting height was measured with subjects sitting on a bench of known height (40 cm). Leg length wascalculated as the difference between height and sitting height. Body mass was measured using a digitalscale (TANITA® Model 683W, Taiwan, China) and skinfold thickness (tricipital and subscapular)were measured as a double fold of skin underlying the soft tissue on the left side of the body usingHoltain calipers. Fat mass was estimated from these skinfold measures using Slaughter sex-specificequations [32], which are widely used in Brazil [33] as well as in other cultural contexts [13,34,35],and also because it shows valid results when contrasted to DXA (Dual-energy X-ray Absorptiometry)measurements [36].
2.4. Time-Invariant Predictor
Socioeconomic Status
Socioeconomic status was defined according to which school children attended: private (highlevel) and public (low level).

Int. J. Environ. Res. Public Health 2016, 13, 151 4 of 14
2.5. Time-Varying Predictors
Maturity Status
Decimal age was calculated from the birth date to the date of measurement; categorical age (CA)was organized in groups (7.49–8.50 = 8 years). A biological age (a measure of maturity) was estimatedby identifying how far an individual was from attaining or having attained peak height velocity (PHV).In brief, sex-specific anthropometric equations were used to predict the age when PHV would beattained; covariates used included: CA, body mass, height, sitting height and leg length [37]. PHVis a comparable sexual milestone found in both boys and girls; the time from the attainment of PHVis coined as the maturity offset; at PHV maturity offset = 0. The maturity offset equation estimatesthe distance each subject is from their expected age (in years) of attainment of PHV. The values areexpressed in years (either + or ´) from PHV.
2.6. Physical Fitness
Performance-related PF was assessed using four tests, from two widely used batteries: TheAAHPERD [38] and the EUROFIT [39] which include measures of cardio respiratory endurance(a 12-min run), agility/speed (shuttle-run 10 ˆ 5 m), static strength (hand grip), and power (standinglong jump):
The 12-min run test: in a previously delimited field, schoolchildren in groups of 10–12 (male,female) run/walk the maximum possible distance in 12 min.
Standing long jump was measured as the distance from the take-off line to heel or other part ofthe body that touched the floor nearest the take-off line. Children stood with feet apart behind thetake-off line and were instructed to jump as far as possible. Two trials were recorded and the better ofthe two trials was retained for analysis.
The grip-strength test: the subjects were instructed to squeeze a calibrated hand dynamometer(Takei TKK 5401, Tokyo, Japan) with maximal force. All schoolchildren performed two trials with eachhand. The best trial from each hand was recorded in kg and was used to compute the mean musclestrength. The handle length was adjusted to control for variations in hand size.
The shuttle-run test: each subject performs five cycles (round-trip) at maximum speed betweentwo lines separated by five meters (total distance = 50 m); this test was conducted in pairs, and thebest trial was used in the analysis.
Approximately 30 to 40 children were assessed on a daily basis in all tests according to astandardized station setting. The cardiorespiratory test (12 min-run) was always administratedat the end of the data collection day. This procedure was tested in the pilot study after careful decisionabout the best testing sequence.
2.7. Data Quality Control
Data quality control was done in two steps. Team members were trained in and applied alltesting procedures on a sample of 26 children (pilot study), and an in-field reliability procedurewas implemented during the data collection. In each assessing day, a random sample of fivechildren was retested. Intra-observer technical error of measurement (TEM) and ANOVA-basedintraclass correlation coefficients (R) (test-retest) were computed; the obtained values were as follows:triceps and subscapular skinfolds TEM = 0.5 mm and 1.0 mm, respectively; further, R varied from0.87 (95%CI—Confidence Interval = 0.72–0.94) in the 12-min run to 0.96 (95%CI = 0.95–0.97) in thestanding long jump.

Int. J. Environ. Res. Public Health 2016, 13, 151 5 of 14
2.8. Statistical Analyses
2.8.1. Centile Charts
Descriptive statistics were computed using IBM-SPSS 20 software (IBM Corporation, New York,NY, USA). Centile curves for fat mass were constructed separately for each sex using the LMSmethod [40,41]. A Box-Cox power transformation was used to normalize the data at each age. Naturalcubic splines with knots at each distinct age (t) were fitted by maximum penalized likelihood to createthree smooth curves: L(t) the Box-Cox power, M(t) the median and S(t) the coefficient of variation.Centile curves at age t were then obtained as:
rC100aptq “ Mptqr1` LptqSptqZas1{Lptq
s
where Zα is the normal equivalent deviate for tail area α and C100α(t) is the centile correspondingto Zα. Equivalent degrees of freedom (edf) for L(t), M(t) and S(t) measure the complexity of eachfitted curve. Q tests [42,43] were used to check the goodness of fit with the aid of deviance measure ofpenalized likelihood [41,42,44]. These analyses were made in lmsChartmaker software [45].
2.8.2. Multilevel Modelling
All analyses were stratified by sex. No moderate or severe outliers (beyond one and ahalf box lengths in the box-plot representations), nor leverage points were identified. Modellinglongitudinal changes in fat mass was performed using the HLM 7.01 software (Scientific SoftwareInternational, Inc, Shokie, IL, USA). All parameters were simultaneously estimated by maximumlikelihood techniques with robust standard-errors [46]. In HLM analysis, the numbers and spacingof measurement observations may vary across subjects and the analysis can also accommodate datafrom mixed-longitudinal designs with missing data, under the assumption that data is missing is atrandom [47]. This is a very realistic assumption in longitudinal studies, and the mixed-effects regressionmodels are highly efficient in terms of parameter estimates [48]. A series of hierarchical nested modelswas fitted to the data using a “stepwise” approach. To facilitate interpretation of model parametersdescribing fat mass changes, the time metric was centered at baseline, i.e., the first measurement ofcohort 1, i.e., 8 years. Model 1 (M1) was fitted to identify the best descriptors of individual fat masstrajectories using polynomials of age (up to a 3rd degree, i.e., age, age2, and age3). In model 2 (M2), SESwas added as a fixed covariate. In the final model (M3), time-varying covariates, namely biological age,shuttle run time, long jump length, 12 min run distance and hand grip strength (expressed as relativestrength: strength/body mass) were added. A deviance statistic was used as a measure of global fit.Differences in deviances are distributed as an approximate Chi-square (χ2) distribution with degrees offreedom equal to the difference in the number of estimated parameters between two nested models. Asmodels’ increase in complexity, i.e., with more parameters, statistical significant decrease in deviance isexpected due to a better fit of the data. All time-varying predictors were centered to their grand means.
3. Results
Descriptive statistics for girls and boys at each time point (8 to 16 years of age) are shown inTable 3. As expected, boys and girls average heights, weights and fat masses increased until 16 yearsof age. On average, girls’ estimated age at PHV was ~13 years, while in boys it was ~15 years. Boysshowed systematic average improvements in all PF tests. Girls showed average increments in strength(explosive leg power and hand grip) with age, compared to no changes in their 12-min run or shuttle-runperformances after 10 years of ages.
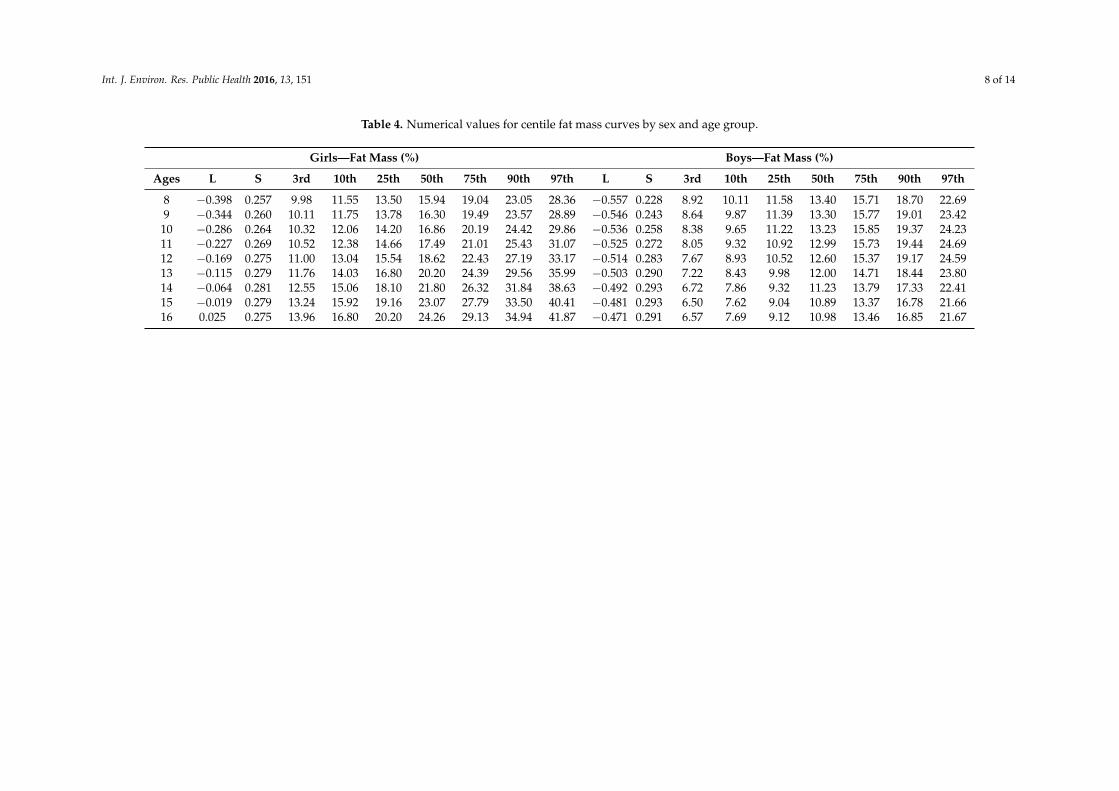
Table 4 shows numerical values of the data in the channels round the 7 fitted centiles of 3rd, 10th,25th, 50th, 75th, 90th, and 97th of fat mass. Figure 1 shows reference curves of fat mass for childrenof both sexes. These curves show different shapes in boys and girls. Girls’ fat mass 50th percentile

Int. J. Environ. Res. Public Health 2016, 13, 151 6 of 14
was higher than boys and increase almost linearly from 8 to 16 years, while in boys it increased until11 years; from 12 years onwards it gradually decreased.Int. J. Environ. Res. Public Health 2016, 13, x 7 of 13
(a) (b)
Figure 1. Centile curves for body mass of girls (a) and boys (b).
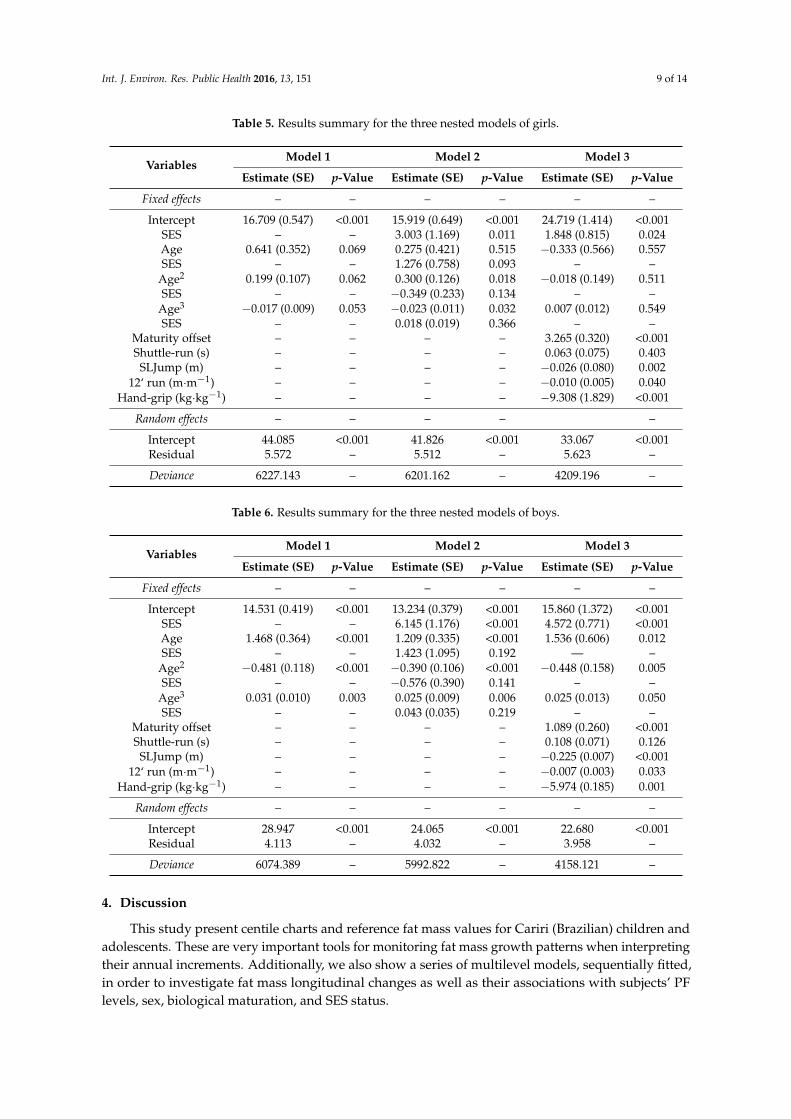
The results of the multilevel models are shown in Tables 5 (girls) and 6 (boys). In girls, the best
model describing intra-individual fat mass changes had a non-linear trend (3rd degree polynomial),
with p-values very close to 0.05. Model 1 can be interpreted to mean that, on average, fat mass of an 8
years old girl was 16.7%, followed by positive (velocity and acceleration) and mean negative
curvatures (age3). While Model 2 maintains the curve shape, the average fat mass drops to 15.9%,
for an 8 years old girl when SES is accounted for. Thus at 8 years of age those from private
schools had more fat mass (+3.0%). No significant effects of SES were found for % fat mass changes
across any other ages. Model 2 fitted the data better, indicated by a change in deviance
(i.e., 6227.143(M1) − 6201.162(M2) = 25.981 with 4 df, p < 0.001). In Model 3 SES effects were dropped;
this proved to be the best fitting model of the three (i.e., deviance 6201.162(M2) − 4209.196(M3) = 1991.966
with 2 df, p < 0.001). In Model 3, the average fat mass of a girl from a public school experiencing her
PHV, when holding all other predictor variables at their respective means, was 24.7%. Those from
private schools had 1.9% more fat mass when the other confounders were held constant. Time-varying
covariates (shuttle-run) did not independently predict (p = 0.403) fat mass development with age.
Those advanced in their biological maturation had more fat mass (β = 3.265 ± 0.320), but those with
more explosive (SLJump, β = −0.026 ± 0.080) and relative static strength (Hand-grip, β = −9.308 ± 1.829),
as well as higher aerobic fitness (12’ run, β = −0.010 ± 0.005) showed lower fat mass changes.
Boys’ fat mass trajectories in Model 1 showed that, on average, at 8 years of age fat mass was
14.5%. A non-linear (curvature) change in fat mass was evident, since age (β = 1.468 ± 0.364),
age2 (β = −0.481 ± 0.118), and age3 (β = 0.031 ± 0.010) parameter estimates were all statistically
significant (p ≤ 0.003). In Model 2, SES effects were only significant at baseline, indicating that boys
from private schools had, on average, at 8 years of age 6.2% more fat mass than their public school
peers. Model 2 fitted the data better than Model 1 [deviance is 6074.389(M1) − 5992.822(M2) = 81.567
with 4 df, p < 0.001]. In Model 3, the best model (deviance 5992.822(M2) − 4158.121(M3) = 1834.701
with 2 df, p < 0.001), the non-significant SES effects was discarded and biological age and PF
components were added as time-varying predictors of changes in fat mass. The average fat mass of a
boy from a public school experiencing his PHV was 15.9%, when all other time-varying predictors
were held constant to their respective means. Those from private schools had, on average, 4.5% more
fat. Mean velocity (β = 1.536 ± 0.606), acceleration (β = −0.448 ± 0.158), and a cubic (β = 0.025 ± 0.013)
trend was consistenly evident in fat changes, mirroiring the picture observed in their centile charts.
The more mature boys had higher fat mass values (β = 1.089 ± 0.260), whereas the fittest, i.e., with
more explosive (β = −0.053 ± 0.010) and relative static strength (β = −5.974 ± 0.185), as well as aerobic
fitness (β = −0.007 ± 0.003) showed lower fat mass changes.
Figure 1. Centile curves for body mass of girls (a) and boys (b).
The results of the multilevel models are shown in Table 5 (girls) and Table 6 (boys). In girls,the best model describing intra-individual fat mass changes had a non-linear trend (3rd degreepolynomial), with p-values very close to 0.05. Model 1 can be interpreted to mean that, on average,fat mass of an 8 years old girl was 16.7%, followed by positive (velocity and acceleration) and meannegative curvatures (age3). While Model 2 maintains the curve shape, the average fat mass dropsto 15.9%, for an 8 years old girl when SES is accounted for. Thus at 8 years of age those fromprivate schools had more fat mass (+3.0%). No significant effects of SES were found for % fat masschanges across any other ages. Model 2 fitted the data better, indicated by a change in deviance (i.e.,6227.143(M1) ´ 6201.162(M2) = 25.981 with 4 df, p < 0.001). In Model 3 SES effects were dropped; thisproved to be the best fitting model of the three (i.e., deviance 6201.162(M2) ´ 4209.196(M3) = 1991.966with 2 df, p < 0.001). In Model 3, the average fat mass of a girl from a public school experiencing herPHV, when holding all other predictor variables at their respective means, was 24.7%. Those fromprivate schools had 1.9% more fat mass when the other confounders were held constant. Time-varyingcovariates (shuttle-run) did not independently predict (p = 0.403) fat mass development with age. Thoseadvanced in their biological maturation had more fat mass (β = 3.265 ˘ 0.320), but those with moreexplosive (SLJump, β = ´0.026 ˘ 0.080) and relative static strength (Hand-grip, β = ´9.308 ˘ 1.829),as well as higher aerobic fitness (12’ run, β = ´0.010 ˘ 0.005) showed lower fat mass changes.
Boys’ fat mass trajectories in Model 1 showed that, on average, at 8 years of age fat mass was14.5%. A non-linear (curvature) change in fat mass was evident, since age (β = 1.468 ˘ 0.364), age2
(β = ´0.481 ˘ 0.118), and age3 (β = 0.031 ˘ 0.010) parameter estimates were all statistically significant(p ď 0.003). In Model 2, SES effects were only significant at baseline, indicating that boys from privateschools had, on average, at 8 years of age 6.2% more fat mass than their public school peers. Model2 fitted the data better than Model 1 [deviance is 6074.389(M1) ´ 5992.822(M2) = 81.567 with 4 df,p < 0.001]. In Model 3, the best model (deviance 5992.822(M2) ´ 4158.121(M3) = 1834.701 with 2 df,p < 0.001), the non-significant SES effects was discarded and biological age and PF components wereadded as time-varying predictors of changes in fat mass. The average fat mass of a boy from apublic school experiencing his PHV was 15.9%, when all other time-varying predictors were heldconstant to their respective means. Those from private schools had, on average, 4.5% more fat. Meanvelocity (β = 1.536 ˘ 0.606), acceleration (β = ´0.448 ˘ 0.158), and a cubic (β = 0.025 ˘ 0.013) trendwas consistenly evident in fat changes, mirroiring the picture observed in their centile charts. Themore mature boys had higher fat mass values (β = 1.089 ˘ 0.260), whereas the fittest, i.e., with moreexplosive (β = ´0.053 ˘ 0.010) and relative static strength (β = ´5.974 ˘ 0.185), as well as aerobicfitness (β = ´0.007 ˘ 0.003) showed lower fat mass changes.

Int. J. Environ. Res. Public Health 2016, 13, 151 7 of 14
Table 3. Descriptive statistics for girls and boys in each annual time point (8 to 16 years of age).
Variables8 Years 9 Years 10 Years 11 Years 12 Years 13 Years 14 Years 15 Years 16 Years
(n) Mean ˘ SD (n) Mean ˘ SD (n) Mean ˘ SD (n) Mean ˘ SD (n) Mean ˘ SD (n) Mean ˘ SD (n) Mean ˘ SD (n) Mean ˘ SD (n) Mean ˘ SD
Anthropometrics measures
Heigth (cm) Girls (67) 125.2 ˘ 6.0 (139) 127.2 ˘ 6.2 (166) 135.5 ˘ 7.3 (179) 139.6 ˘ 7.7 (161) 146.8 ˘ 8.1 (179) 150.0 ˘ 7.7 (136) 154.1 ˘ 6.6 (110) 156.2 ˘ 6.2 (56) 157.6 ˘ 6.1Boys (75) 125.1 ˘ 6.1 (153) 128.5 ˘ 6.9 (196) 134.6 ˘ 6.9 (177) 137.6 ˘ 6.6 (141) 144.5 ˘ 6.9 (191) 149.1 ˘ 7.6 (179) 156.9 ˘ 7.3 (131) 160.4 ˘ 7.4 (55) 166.7 ˘ 5.6
Weight (kg) Girls (67) 24.2 ˘ 4.4 (139) 27.3 ˘ 6.3 (166) 33.3 ˘ 9.6 (179) 35.9 ˘ 9.6 (161) 41.3 ˘ 10.6 (179) 45.1 ˘ 10.9 (136) 47.5 ˘ 10.9 (110) 48.9 ˘ .0 (56) 50.5 ˘ 5.8Boys (75) 26.6 ˘ 6.3 (153) 28.5 ˘ 7.7 (196) 32.5 ˘ 8.4 (177) 34.0 ˘ 8.3 (141) 37.8 ˘ 8.2 (191) 42.0 ˘ 8.9 (179) 47.5 ˘ 8.9 (131) 50.5 ˘ 8.0 (55) 57.9 ˘ 9.5
Fat mass (%)Girls (67) 16.8 ˘ 5.1 (128) 16.4 ˘ 4.3 (147) 18.9 ˘ 6.0 (157) 18.6 ˘ 5.9 (155) 21.6 ˘ 8.2 (174) 23.3 ˘ 8.9 (134) 24.0 ˘ 7.6 (109) 23.9 ˘ 7.9 (55) 24.7 ˘ 5.5Boys (69) 15.2 ˘ 5.3 (137) 14.3 ˘ 4.7 (161) 15.3 ˘ 5.6 (155) 13.4 ˘ 5.0 (132) 14.5 ˘ 6.1 (178) 14.4 ˘ 5.8 (159) 10.8 ˘ 3.5 (122) 11.3 ˘ 3.9 (51) 13.6 ˘ 5.8
MaturityOffset (years)
Girls (67) ´3.51 ˘ 0.35 (139) ´2.97 ˘ 0.48 (166) ´1.99 ˘ 0.57 (179) ´1.36 ˘ 0.60 (161) ´0.35 ˘ 0.62 (179) 0.29 ˘ 0.57 (136) 1.14 ˘ 0.51 (110) 1.68 ˘ 0.49 (56) 2.49 ˘ 0.46Boys (75) ´4.61 ˘ 0.34 (152) ´4.25 ˘ 0.48 (196) ´3.51 ˘ 0.53 (178) ´3.15 ˘ 0.47 (141) ´2.27 ˘ 0.56 (191) ´1.72 ˘ 0.59 (179) ´0.70 ˘ 0.68 (131) ´0.08 ˘ 0.70 (55) 1.11 ˘ 0.50
Physical Fitness tests
12-minuterun (m)
Girls (54)1431.6 ˘ 126.6
(139)1570.4 ˘ 348.2
(117)1601.8 ˘ 280.1
(151)1647.2 ˘ 258.3
(148)1641.7 ˘ 283.0
(164)1632.8 ˘ 321.1
(123)1680.6 ˘ 326.9
(87)1624.9 ˘ 339.1
(40)1619.3 ˘ 250.8
Boys (57)1445.6 ˘ 173.8
(153)1593.3 ˘ 369.9
(152)1764.0 ˘ 371.1
(156)1827.0 ˘ 353.8
(137)1884.5 ˘ 342.4
(180)1989.4 ˘ 390.1
(168)2116.0 ˘ 334.6
(124)2165.4 ˘ 380.8
(47)2161.9 ˘ 364.5
SLJ (cm)Girls (67) 109.6 ˘ 22.2 (139) 121.4 ˘ 21.6 (165) 125.9 ˘ 22.0 (173) 130.6 ˘ 23.0 (159) 134.5 ˘ 20.4 (177) 139.9 ˘ 21.9 (131) 139.5 ˘ 19.6 (107) 138.7 ˘ 22.6 (51) 137.4 ˘ 17.4Boys (57) 117.0 ˘ 22.0 (153) 128.7 ˘ 20.6 (195) 136.2 ˘ 18.7 (176) 142.7 ˘ 18.5 (141) 146.4 ˘ 19.5 (188) 158.2 ˘ 21.2 (174) 174.4 ˘ 23.4 (129) 178.9 ˘ 25.4 (55) 178.3 ˘ 26.8
SHR (s)Girls (67) 25.7 ˘ 1.9 (130) 24.5 ˘ 2.2 (164) 23.7 ˘ 1.8 (171) 23.2 ˘ 1.8 (158) 22.8 ˘ 1.7 (171) 22.6 ˘ 1.6 (129) 22.8 ˘ 1.9 (100) 22.9 ˘ 2.0 (49) 23.2 ˘ 1.9Boys (57) 24.7 ˘ 2.2 (153) 23.3 ˘ 1.8 (191) 22.4 ˘ 3.7 (174) 22.1 ˘ 1.5 (140) 22.0 ˘ 1.6 (185) 21.4 ˘ 1.7 (171) 20.7 ˘ 1.6 (130) 20.5 ˘ 1.6 (50) 20.5 ˘ 1.7
HGr (kg) Girls (67) 9.5 ˘ 2.0 (139) 10.6 ˘ 2.6 (158) 14.7 ˘ 3.7 (161) 15.9 ˘ 4.2 (144) 18.8 ˘ 5.7 (164) 20.8 ˘ 5.3 (120) 22.5 ˘ 5.5 (102) 24.1 ˘ 4.4 (55) 26.6 ˘ 3.4Boys (57) 11.0 ˘ 2.9 (153) 11.7 ˘ 2.7 (180) 15.2 ˘ 3.8 (158) 16.2 ˘ 3.8 (122) 19.5 ˘ 4.5 (167) 22.5 ˘ 5.4 (154) 28.7 ˘ 7.2 (109) 33.2 ˘ 7.1 (52) 36.0 ˘ 8.0
Int. J. Environ. Res. Public Health 2016, 13, 151 8 of 14
Table 4. Numerical values for centile fat mass curves by sex and age group.
Girls—Fat Mass (%) Boys—Fat Mass (%)
Ages L S 3rd 10th 25th 50th 75th 90th 97th L S 3rd 10th 25th 50th 75th 90th 97th
8 ´0.398 0.257 9.98 11.55 13.50 15.94 19.04 23.05 28.36 ´0.557 0.228 8.92 10.11 11.58 13.40 15.71 18.70 22.699 ´0.344 0.260 10.11 11.75 13.78 16.30 19.49 23.57 28.89 ´0.546 0.243 8.64 9.87 11.39 13.30 15.77 19.01 23.4210 ´0.286 0.264 10.32 12.06 14.20 16.86 20.19 24.42 29.86 ´0.536 0.258 8.38 9.65 11.22 13.23 15.85 19.37 24.2311 ´0.227 0.269 10.52 12.38 14.66 17.49 21.01 25.43 31.07 ´0.525 0.272 8.05 9.32 10.92 12.99 15.73 19.44 24.6912 ´0.169 0.275 11.00 13.04 15.54 18.62 22.43 27.19 33.17 ´0.514 0.283 7.67 8.93 10.52 12.60 15.37 19.17 24.5913 ´0.115 0.279 11.76 14.03 16.80 20.20 24.39 29.56 35.99 ´0.503 0.290 7.22 8.43 9.98 12.00 14.71 18.44 23.8014 ´0.064 0.281 12.55 15.06 18.10 21.80 26.32 31.84 38.63 ´0.492 0.293 6.72 7.86 9.32 11.23 13.79 17.33 22.4115 ´0.019 0.279 13.24 15.92 19.16 23.07 27.79 33.50 40.41 ´0.481 0.293 6.50 7.62 9.04 10.89 13.37 16.78 21.6616 0.025 0.275 13.96 16.80 20.20 24.26 29.13 34.94 41.87 ´0.471 0.291 6.57 7.69 9.12 10.98 13.46 16.85 21.67
Int. J. Environ. Res. Public Health 2016, 13, 151 9 of 14
Table 5. Results summary for the three nested models of girls.
VariablesModel 1 Model 2 Model 3
Estimate (SE) p-Value Estimate (SE) p-Value Estimate (SE) p-Value
Fixed effects – – – – – –
Intercept 16.709 (0.547) <0.001 15.919 (0.649) <0.001 24.719 (1.414) <0.001SES – – 3.003 (1.169) 0.011 1.848 (0.815) 0.024Age 0.641 (0.352) 0.069 0.275 (0.421) 0.515 ´0.333 (0.566) 0.557SES – – 1.276 (0.758) 0.093 – –
Age2 0.199 (0.107) 0.062 0.300 (0.126) 0.018 ´0.018 (0.149) 0.511SES – – ´0.349 (0.233) 0.134 – –
Age3 ´0.017 (0.009) 0.053 ´0.023 (0.011) 0.032 0.007 (0.012) 0.549SES – – 0.018 (0.019) 0.366 – –
Maturity offset – – – – 3.265 (0.320) <0.001Shuttle-run (s) – – – – 0.063 (0.075) 0.403
SLJump (m) – – – – ´0.026 (0.080) 0.00212‘ run (m¨m´1) – – – – ´0.010 (0.005) 0.040
Hand-grip (kg¨kg´1) – – – – ´9.308 (1.829) <0.001
Random effects – – – – –
Intercept 44.085 <0.001 41.826 <0.001 33.067 <0.001Residual 5.572 – 5.512 – 5.623 –
Deviance 6227.143 – 6201.162 – 4209.196 –
Table 6. Results summary for the three nested models of boys.
VariablesModel 1 Model 2 Model 3
Estimate (SE) p-Value Estimate (SE) p-Value Estimate (SE) p-Value
Fixed effects – – – – – –
Intercept 14.531 (0.419) <0.001 13.234 (0.379) <0.001 15.860 (1.372) <0.001SES – – 6.145 (1.176) <0.001 4.572 (0.771) <0.001Age 1.468 (0.364) <0.001 1.209 (0.335) <0.001 1.536 (0.606) 0.012SES – – 1.423 (1.095) 0.192 — –
Age2 ´0.481 (0.118) <0.001 ´0.390 (0.106) <0.001 ´0.448 (0.158) 0.005SES – – ´0.576 (0.390) 0.141 – –
Age3 0.031 (0.010) 0.003 0.025 (0.009) 0.006 0.025 (0.013) 0.050SES – – 0.043 (0.035) 0.219 – –
Maturity offset – – – – 1.089 (0.260) <0.001Shuttle-run (s) – – – – 0.108 (0.071) 0.126
SLJump (m) – – – – ´0.225 (0.007) <0.00112‘ run (m¨m´1) – – – – ´0.007 (0.003) 0.033
Hand-grip (kg¨kg´1) – – – – ´5.974 (0.185) 0.001
Random effects – – – – – –
Intercept 28.947 <0.001 24.065 <0.001 22.680 <0.001Residual 4.113 – 4.032 – 3.958 –
Deviance 6074.389 – 5992.822 – 4158.121 –
4. Discussion
This study present centile charts and reference fat mass values for Cariri (Brazilian) children andadolescents. These are very important tools for monitoring fat mass growth patterns when interpretingtheir annual increments. Additionally, we also show a series of multilevel models, sequentially fitted,in order to investigate fat mass longitudinal changes as well as their associations with subjects’ PFlevels, sex, biological maturation, and SES status.

Int. J. Environ. Res. Public Health 2016, 13, 151 10 of 14
Fat mass centile charts display different patterns between males and females. In girls, fat mass50th percentile increased almost linearly; an average 8 years old girl fat mass was 15.94%, by 16 years ofage it increased to 24.26%, representing an increase of 8.32%. In contrast, boys’ fat mass centiles showedsystematic decreases with age; at 8 years of age the 50th percentile (P50) fat mass was 13.40%, by16 years of age the P50 was 10.98%, i.e., a 2.5% reduction. Similar fat mass centile shapes were presentedin other studies, but their values were relatively higher. For example, US children and adolescents’ datareported by Laurson, Eisenmann and Welk [13] showed that an 8 year old girl’s fat mass was 17.9% anda boy’s was 15.5%. Similarly, reported data from Cicek et al. [16] of Turkish children (6–17 years), basedon four skinfolds, also showed that fat mass was 18.1% and 17.6% at 8 years of age, for girls and boysrespectively. Furthermore, and based on bio-impedance data from English children and adolescents(5–18 years), fat mass reports from McCarthy et al. [49] showed that 8 year old girls’ 50th percentilewas 24.1%, and in boys it was 19.5%; a similar trend was also seen in reference values reported byPlachta-Danielzik et al. [15] with German children and adolescents (3–16 years). These consistentdifferent values seen across centiles questions the validity of a “universal reference”, this was clearlypointed out by Olds [12] and relates to the fact that fat mass values in adolescents are the net resultsof the complexities of growth and development processes during puberty. Further, socioeconomiclevels and ethnicity are also confounding factors that should be taken into account when comparisionsbetween populations are made. On the other hand, and although there is an abundance of percentileBMI data, it is well-known that BMI values are expressed in an imperfect metric of fatness, and do notcharacterize fat distribution [50]. Additionally, skinfolds accurately and reliably measured by trainedanthropometrists provide much better information about body composition changes, which may beobscured using BMI. For example, the combination of dieting and lack of exercise may result in someadolescent girls having relatively low BMIs but high levels of body fat, as suggested by Olds [12].
Given the marginally differences in intercepts and non-linear trends among models (M1 to M2)of fat mass development, the present discussion will focus on the best fitting models (M3). Physicalfitness tests, as time-varying predictors, were negatively related to fat mass’ trajectories, suggestingthat fitter children and adolescents (estimated from standing long jumps, 12-min runs and hand gripstrengths) had lower mean fat mass changes. This relation is particularly marked in tests in which thebody is projected or moved through space (jumping and running/endurance and velocity), becausefat represents an excess of weight that has to be moved during these tasks, as well as the lack ofexperience in such weight-bearing tests [18,25]. This is relevant information indicating that consistentPF improvements, namely in cardiorespiratory fitness, speed, and strength, during late childhoodand adolescence may play an important roles in reducing fat mass accumulation. Although severalstudies [24,51,52] have examined the independent associations of PF with fat mass, very few haveexamined longitudinal fat mass changes using the multilevel modelling approach used in the presentstudy. De Souza et al. [27] using such a multilevel approach to model changes in BMI revealed, ina mixed-longitudinal study with 6.894 Portuguese adolescents, that BMI increased almost linearlywith age and that those with better PF levels had lower mean BMI changes; these results are consistentwith the trend found in the present study.
Socioeconomic status was found to be related to fat mass only at 8 years of age, i.e., those childrenand adolescents from private schools had greater fat mass than those from the public schools. This maybe linked to their greater access to video-games/computer use and thus a predicted increase in timespent in sedentary activities. From 9 to 10 years onwards, official Physical Education programs start tobe mandatory at school and this may reduce this negative trend in increased fat mass, as well as a moresedentary lifestyle of all these children. In a systematic review Shrewsbury and Wardle [19] presenteddata from cross-sectional research (1990 to 2005) relating SES and adiposity in school-age childrenfrom developed countries. They showed consistent negative relationships between SES and adiposity,i.e., highest adiposity was linked to the lowest SES. Further, in adults, a similar review conducted byMcLaren [53] also found lower SES associated with larger body size mostly in women from highlydeveloped countries. In the Cariri region children from private schools are also those with higher SES.
Int. J. Environ. Res. Public Health 2016, 13, 151 11 of 14
This condition is more likely to be associated with richer diets as well as higher number of electronicdevices and their time use with a consequently higher sedentariness. On the other hand, children frompublic schools are from a clearly distinct environment. For example, their daily diet is mostly based onnatural food such as beans, grains and fish; further, they also walk to and from school, and sometimeshelp their families in daily chores.
Biological maturation was significantly and positively associated with fat mass accrual in girlsand boys. These are expected results since more mature children and adolescents tend to be heavierand taller [18]. For example, in the FELS longitudinal study, Guo et al. [54] examined patterns ofchange in body composition with rates of skeletal maturation from 8 to 20 years of age, and foundthat total body fat, fat mass percentage and fat free mass consistently increased with increasing ratesof maturation. Clear sex-differences in fat mass percentile values and changes were identified inthe present study that can be primarily attributed to the action of sex steroid hormones. These sexhormones drive the differences during the pubertal years [55] as well as during childhood [56]. Thesedifferences are magnified during the growth spurt and persist into adulthood [57]. In a previousstudy with Portuguese youth, De Souza et al. [27] reported that girls and boys had similar mean BMIvalues at the age of peak height velocity, and that BMI increased almost linearly with age in both sexes.However, it should be remembered that BMI and fat mass are two distinct phenotypes representingdisparent aspects of body composition during growth.
It is important to recognize, at least, two limitations in the present study. First, fat mass wasestimated based on regression equations. However, Slaughter equations are largely applied in manystudies ranging from Caucasians to Afro-Americans [12,58]. Further, Hussain et al. [34] recently showedthat the Slaughter equations provided reliable information when compared to DEXA data. When usinglarge samples, it is impractical to use more sophisticated body composition assessment techniquesand also that they are very expensive, time-consuming and require specialized technicians to do theevaluations, but we anticipate that BIA may actually be a feasible technique in large samples eventhough there are some obvious limitations with this technique as well. Second, biological maturationwas estimated using the maturity offset suggested by Mirwald et al. [37], and their equations havenot been validated in Brazilian children and adolescents. Yet, all other methods (sexual maturationand skeletal age) also provide estimates which were never validated with Brazilian children andadolescents. Further, skeletal age assessments would create logistic and financial problems, andthe sexual maturation would also create ethical problems. Notwithstanding these limitations, thestudy has several important strong points. First, the mixed-longitudinal approach is an adequatedesign to provide enough data for a better understanding of the dynamics fat mass changes as wellas its correlates. Second, fat mass reference values and charts are provided for boys and girls usingCole and Green highly efficient statistical method. Third, multilevel modelling is a very flexibleand robust statistical procedure to fit fat mass trajectories in both boys and girls, even when data ismissing-by-design as is the case of a mixed-longitudinal study. Fourth, the use of a set of time varyingpredictors as well as fixed predictors allowed for a clearer picture of correlates of fat mass changes.Fifth, the relatively high sample size of our sample.
5. Conclusions
In summary, apart from the fact that SES does not act as a moderator in fat mass development,the most important hypotheses were confirmed, namely that Brazilian boys and girls fat mass centilecharts show clear sex-differences; also, fat mass longitudinal changes show different trends in boysand girls; further, higher levels of physical fitness seem to act as protective agents in the reductionof BF increases. Thus, we emphasize the importance of physical fitness not only as a putative healthmarker, but also the need to systematically increase their levels within the school context. We suggestthat in the near future researchers will address the question whether biological maturation categoriesand their links to different physical fitness levels impact %BF development in children and adolescentsin different ways.

Int. J. Environ. Res. Public Health 2016, 13, 151 12 of 14
Acknowledgments: The authors thanks the following funding: in Brazil, CAPES Process N˝ 99999.007403/2014-03—Ministry of Education and, in Portugal, FCT—Foundation for Science and Technology. We also thank the generous inputfrom the anonymous reviewers.
Author Contributions: Simonete Silva organized the study, collected the data, contributed to the data analysisand led the writing of the article. Adam Baxter-Jones contributed to drafting the paper as well as its data analysisand interpretation. José Maia organized and supervised the data collection and management, contributed todrafting the paper as well as in the data analysis. All authors read and approved the final manuscript.
Conflicts of Interest: The authors declare no conflict of interest.
References
1. WHO Expert Committee. Physical Status: The Use and Interpretation of Anthropometry; World HealthOrganization: Geneva, Switzerland, 1995; p. 452.
2. De Onis, M. Growth curves for school-age children and adolescents. Indian Pediatr. 2009, 46, 463–465.[PubMed]
3. Hermanussen, M.; Stec, K.; Abmann, C.; Meigen, C.; van Buuren, S. Synthetic growth reference charts. Am. J.Hum. Biol. 2015, 28, 98–111. [CrossRef] [PubMed]
4. Beunen, G.; Malina, R. Growth and physical performance relative to the timing of the adolescent spurt.Exerc. Sport Sci. Rev. 1988, 16, 503–540. [CrossRef] [PubMed]
5. Dietz, W. Critical periods in childhood for the development of obesity. Am. J. Clin. Nutr. 1994, 59, 955–959.[PubMed]
6. Silva, S.P.; Maia, J.; Claessens, A.; Beunen, G.; Pan, H. Growth references for brazilian children andadolescents: Healthy growth in cariri study. Ann. Hum. Biol. 2012, 39, 11–18. [CrossRef] [PubMed]
7. Lobstein, T.; Baur, L.; Uauy, R. Obesity in children and young people: A crisis in public health. Obes. Rev.2004, 5, S4–S85. [CrossRef] [PubMed]
8. Molnar, D.; Livingstone, B. Physical activity in relation to overweight and obesity in children and adolescents.Eur. J. Pediatr. 2000, 159, S45–S55. [CrossRef] [PubMed]
9. Wong, S.L.; Katzmarzyk, P.; Nichaman, M.Z.; Church, T.S.; Blair, S.N.; Ross, R. Cardiorespiratory fitnessis associated with lower abdominal fat independent of body mass index. Med. Sci. Sports Exerc. 2004, 36,286–291. [CrossRef] [PubMed]
10. Wells, J.; Fewtrell, M. Measuring body composition. Arch. Dis. Child. 2006, 91, 612–617. [CrossRef] [PubMed]11. Hoffman, D.J.; Toro-Ramos, T.; Sawaya, A.L.; Roberts, S.B.; Rondo, P. Estimating total body fat using
a skinfold prediction equation in brazilian children. Ann. Hum. Biol. 2012, 39, 156–160. [CrossRef] [PubMed]12. Olds, T. One million skinfolds: Secular trends in the fatness of young people 1951–2004. Eur. J. Clin. Nutr.
2009, 63, 934–946. [CrossRef] [PubMed]13. Laurson, K.; Eisenmann, J.; Welk, G. Body fat percentile curves for U.S. Children and adolescents. Am. J.
Prev. Med. 2011, 41, S87–S92. [CrossRef] [PubMed]14. Weber, D.; Moore, R.; Leonard, M.; Zemel, B. Fat and lean bmi reference curves in children and adolescents
and their utility in identifying excess adiposity compared with BMI and percentage body fat. Am. J. Clin. Nutr.2013, 98, 49–56. [CrossRef] [PubMed]
15. Plachta-Danielzik, S.; Gehrke, M.I.; Kehden, B.; Kromeyer-Hauschild, K.; Grillenberger, M.; Willhöft, C.;Bosy-Westphal, A.; Müller, M.J. Body fat percentiles for German children and adolescents. Obes. Facts 2012,5, 77–90. [CrossRef] [PubMed]
16. Cicek, B.; Ozturk, A.; Unalan, D.; Bayat, M.; Mazicioglu, M.; Kurtoglu, S. Four-site skinfolds and body fatpercentage references in 6-to-17-year old Turkish children and adolescents. J. Pak. Med. Assoc. 2014, 64,1154–1161. [PubMed]
17. Tanner, J. Introduction: Growth in height as a mirror of the standard of living. In Stature, Living Standards,and Economic Development; Komlos, J., Ed.; The University of Chicago Press: Chicago, IL, USA; 1994; pp. 1–6.
18. Malina, R.; Bouchard, C.; Bar-Or, O. Growth, Maturation and Physical Activity, 4th ed.; Human Kinetics Books:Champaign, IL, USA, 2004.
19. Shrewsbury, V.; Wardle, J. Socioeconomic status and adiposity in childhood: A systematic review ofcross-sectional studies 1990–2005. Obesity 2008, 16, 275–284. [CrossRef] [PubMed]
20. Steele, R.M.; Brage, S.; Corder, K.; Wareham, N.J.; Ekelund, U. Physical activity, cardiorespiratory fitness,and the metabolic syndrome in youth. J. Appl. Physiol. 2008, 105, 342–351. [CrossRef] [PubMed]

Int. J. Environ. Res. Public Health 2016, 13, 151 13 of 14
21. Malina, R. Top 10 research questions related to growth and maturation of relevance to physical activity,performance, and fitness. Res. Q. Exerc. Sport 2014, 85, 153–173. [CrossRef] [PubMed]
22. Chaput, J.; Perusse, L.; Despres, J.; Tremblay, A.; Bouchard, C. Findings from the quebec family study onthe etiology of obesity: Genetics and environmental highlights. Curr. Obes. Rep. 2014, 3, 54–66. [CrossRef][PubMed]
23. Huang, Y.; Malina, R. Body mass index and individual physical fitness tests in taiwanese youth aged9–18 years. Int. J. Pediatr. Obes. 2010, 5, 404–411. [CrossRef] [PubMed]
24. Spruijt, M. Etiology, treatment and prevention of obesity in childhood and adolescence: A decade in review.J. Res. Adolesc. 2012, 21, 129–152. [CrossRef] [PubMed]
25. Gulias-Gonzáles, R.; Martinez-Vizcaíno, V.; García-Pietro, J.; Díez-Fernandez, A.; Olivas-Bravo, A.;Sánchez-Lopez, M. Excess of weight, but not underweight, is associated with poor physical fitness inchildren and adolescents from Castilla-La Mancha, Spain. Eur. J. Pediatr. 2014, 173, 727–735. [CrossRef][PubMed]
26. Martins, D.; Maia, A.; Seabra, A.; Garganta, R.; Katzmarzyk, P.; Beunen, G. Correlates of change in BMI ofchildren from Azores islands. Int. J. Obes. 2010, 34, 1487–1493. [CrossRef] [PubMed]
27. De Souza, M.; Eisenmann, J.; Santos, D.; de Chaves, R.; de Moraes Forjaz, C.; Maia, J. Modeling the dynamicsof BMI changes during adolescence. The oporto growth, health and performance study. Int. J. Obes. 2015, 39,1063–1069. [CrossRef] [PubMed]
28. Byrd-Williams, C.; Shaibi, G.; Sun, P.; Lane, C.; Ventura, E.; Davis, J.; Kelly, L.; Goran, M. Cardiorespiratoryfitness predicts changes in adiposity in overweight Hispanic boys. Obesity 2008, 16, 1072–1077. [CrossRef][PubMed]
29. Prentice, A.M.; Jebb, S.A. Beyond body mass index. Obes. Rev. 2001, 2, 141–147. [CrossRef] [PubMed]30. Silva, S.P.; Maia, J.A.; Beunen, G. Crescer Com Saúde no Cariri. O Estudo do Crescimento Físico e Desempenho
Motor de Crianças e Jovens Caririenses; RDS Editora: Crato, Ceará, 2014; p. 160.31. Claessens, A.; Beunen, G.; Malina, R. Antropometry, physique, body composition, and maturity. In Paediatric
Exercise Science and Medicine, 2nd ed.; Armstrong, N., Mechelen, W.V., Eds.; Oxford University Press:New York, NY, USA, 2008.
32. Slaughter, M.H.; Lohman, T.G.; Boileau, R.A.; Horswill, C.A.; Stillman, R.J.; van Loan, M.D.; Bemben, D.A.Skinfold equations for estimation of body fatness in children and youth. Hum. Biol. 1988, 60, 709–726.[PubMed]
33. Hoffman, D.; Sawaya, A.; Verreschi, L.; Tucker, K.; Roberts, S. Why are nutritionally stunted childrenat increased risk of obesity? Studies of metabolic rate and fat oxidation in shantytown children fromSão Paulo, Brazil. Am. J. Clin. Nutr. 2000, 72, 702–707. [PubMed]
34. Hussain, Z.; Jafar, T.; Zaman, M.U.; Parveen, R.; Saeed, F. Correlations of skin fold thickness and validationof prediction equations using DEXA as the gold standard for estimation of body fat composition in Pakistanichildren. BMJ Open 2014, 4. [CrossRef] [PubMed]
35. Wells, J.; Hallal, P.; Reichert, F.; Menezes, A.; Araújo, C.; Victora, C. Sleep patterns and television viewing inrelation to obesity and blood pressure: Evidence from an adolescent Brazilian birth cohort. Int. J. Obes. 2008,32, 1042–1049. [CrossRef] [PubMed]
36. Silva, D.R.; Ribeiro, A.S.; Pavao, F.H.; Ronque, E.R.; Avelar, A.; Silva, A.M.; Cyrino, E.S. Validity of themethods to assess body fat in children and adolescents using multi-compartment models as the referencemethod: A systematic review. Rev. Assoc. Med. Bras. 2013, 59, 475–486. [CrossRef]
37. Mirwald, R.L.; Baxter-Jones, A.D.; Bailey, D.A.; Beunen, G.P. An assessment of maturity from anthropometricmeasurements. Med. Sci. Sports Exerc. 2002, 34, 689–694. [CrossRef]
38. AAHPERD. Health Related Physical Fitness Manual; American Alliance for Health, Physical Educations,Recreation and Dance: Washington, DC, USA, 1980.
39. EUROFIT. Handbook for the European Test of Physical Fitness; Council of European Committee for Developmentof Sport: Rome, Italy, 1988; p. 72.
40. Cole, T.J.; Bellizzi, M.C.; Flegal, K.M.; Dietz, W.H. Establishing a standard definition for child overweightand obesity worldwide: International survey. BMJ 2000, 320, 1240–1243. [CrossRef] [PubMed]
41. Cole, T.J.; Freeman, J.V.; Preece, M.A. British 1990 growth reference centiles for weight, height, body massindex and head circumference fitted by maximum penalized likelihood. Stat. Med. 1998, 17, 407–429.[CrossRef]

Int. J. Environ. Res. Public Health 2016, 13, 151 14 of 14
42. Pan, H.; Cole, T.J. A comparison of goodness of fit tests for age-related reference ranges. Stat. Med. 2004,1749–1765. [CrossRef] [PubMed]
43. Royston, P.; Wright, E.M. Goodness-of-fit statistics for age-specific reference intervals. Stat. Med. 2000,2943–2962. [CrossRef]
44. Pan, H.; Jiang, Y.; Jing, X.; Fu, S.; Jiang, Y.; Lin, Z.; Sheng, Z.; Cole, T. Child body mass index in four cities ofEast China compared to Western references. Ann. Hum. Biol. 2009, 36, 98–109. [CrossRef] [PubMed]
45. Pan, H.; Cole, T. User’s Guide to Lmschartmaker Pro; Medical Research Council: London, UK; pp. 1997–2005.46. Raudenbush, S.; Bryk, A.; Cheong, Y.; Congdon, R., Jr.; du Toit, M. HLM 7. Hierarchical Linear and Nonlinear
Modeling; Scientific Software International: Lincolnwood, IL, USA, 2011.47. Raudenbush, S. Hierarchical linear models to study the effects of social context on development. In The
Analysis of Change; Gottman, J., Ed.; Lawrence Erlbaum Associates, Publishers: Mahwah, NJ, USA, 1995;pp. 165–202.
48. Hedeker, D.; Gibbons, R. Longitudinal Data Analysis; John Wiley & Sons: Hoboken, NJ, USA, 2006.49. McCarthy, H.; Cole, T.; Fry, T.; Jebb, S.; Prentice, A. Body fat reference curves for children. Int. J. Obes. 2006,
30, 598–602. [CrossRef] [PubMed]50. Flegal, K.M.; Ogden, C.L. Childhood obesity: Are we all speaking the same language? Adv. Nutr. 2011, 2,
159S–166S. [CrossRef] [PubMed]51. Deforche, B.; Lefevre, J.; de Bourdeaudhuij, I.; Al, E. Physical fitness and physical activity in obese and
nonobese Flemish youth. Obes. Res. 2003, 11, 434–441. [CrossRef] [PubMed]52. Kimm, S.; Glynn, N.; Obarzanek, E.; Kriska, A.; Daniels, S.; Barton, B.; Liu, K. Relation between the changes
in physical activity and body-mass index during adolescence: A multicentre longitudinal study. Lancet 2005,366, 301–307. [CrossRef]
53. McLaren, L. Socioeconomic status and obesity. Epidemiol. Rev. 2007, 29, 29–48. [CrossRef] [PubMed]54. Guo, S.S.; Chumlea, W.C.; Roche, A.F.; Siervogel, R.M. Age-and maturity-related changes in body
composition during adolescence into adulthood: The fels longitudinal study. Int. J. Obes. Relat. Metab. Disord.1997, 21, 1167–1175. [CrossRef] [PubMed]
55. Forbes, G.B. Human Body Composition. Growth, Aging, Nutrition, and Activity; Springer-Verlag: New York, NY,USA, 1987; p. 350.
56. Rogol, A.D.; Roemmich, J.N.; Clark, P.A. Growth at puberty. J. Adolesc. Health 2002, 31, 192–200. [CrossRef]57. Malina, R. Variation in body composition associated with sex and ethnicity. In Human Body Composition;
Heymsfield, S., Lohman, T., Wang, Z., Going, S., Eds.; Human Kinetics: Champaign, IL, USA, 2005;pp. 271–298.
58. Lohman, T.; Roche, A.; Martorell, R. Anthropometric Standardization Reference Manual; Human Kinetics Books:Champaign, IL, USA, 1988.
© 2016 by the authors; licensee MDPI, Basel, Switzerland. This article is an open accessarticle distributed under the terms and conditions of the Creative Commons by Attribution(CC-BY) license (http://creativecommons.org/licenses/by/4.0/).
Copyright © 2022 FDOKUMEN