Fat Mass and Obesity-Associated (FTO) Gene Polymorphisms Are Associated with Physical Activity, Food...
23
Nutrients 2014, 6, 3130-3152; doi:10.3390/nu6083130 nutrients ISSN 2072-6643 www.mdpi.com/journal/nutrients Article Fat Mass and Obesity-Associated (FTO) Gene Polymorphisms Are Associated with Physical Activity, Food Intake, Eating Behaviors, Psychological Health, and Modeled Change in Body Mass Index in Overweight/Obese Caucasian Adults Janetta Harbron 1, *, Lize van der Merwe 2,3 , Monique G. Zaahl 4 , Maritha J. Kotze 5 and Marjanne Senekal 1 1 Division of Human Nutrition, Department of Human Biology, Faculty of Health Sciences, University of Cape Town, Private Bag X3, Observatory 7925, South Africa; E-Mail: [email protected] 2 Division of Molecular Biology and Human Genetics, Faculty of Medicine and Health Sciences, Stellenbosch University, Tygerberg 7505, South Africa; E-Mail: [email protected] 3 Department of Statistics, University of the Western Cape, Private Bag X17, Bellville 7535, South Africa 4 Department of Genetics, Faculty of Sciences, Stellenbosch University, Private Bag X1, Matieland 7602, South Africa; E-Mail: [email protected] 5 Division of Anatomical Pathology, Department of Pathology, Faculty of Medicine and Health Sciences, Stellenbosch University, P.O. Box 19063, Tygerberg 7505, South Africa; E-Mail: [email protected] * Author to whom correspondence should be addressed; E-Mail: [email protected]; Tel.: +27-21-406-6769; Fax: +27-21-448-7226. Received: 4 April 2014; in revised form: 30 June 2014 / Accepted: 16 July 2014 / Published: 6 August 2014 Abstract: The fat mass and obesity-associated (FTO) gene is currently recognized as the most robust predictor of polygenic obesity. We investigated associations between the FTO rs1421085 and rs17817449 polymorphisms and the FTO rs1421085–rs17817449 haplotype and dietary intake, eating behavior, physical activity, and psychological health, as well as the effect of these associations on BMI. N = 133 treatment seeking overweight/obese Caucasian adults participated in this study. Genotyping was performed from whole blood samples. Weight and height was measured and a non-quantified food frequency questionnaire was completed to assess food group intake. Validated questionnaires were completed to assess physical activity (Baecke questionnaire), OPEN ACCESS
-
Upload
independent -
Category
Documents
-
view
2 -
download
0
Transcript of Fat Mass and Obesity-Associated (FTO) Gene Polymorphisms Are Associated with Physical Activity, Food...

Nutrients 2014, 6, 3130-3152; doi:10.3390/nu6083130
nutrients ISSN 2072-6643
www.mdpi.com/journal/nutrients
Article
Fat Mass and Obesity-Associated (FTO) Gene Polymorphisms Are Associated with Physical Activity, Food Intake, Eating Behaviors, Psychological Health, and Modeled Change in Body Mass Index in Overweight/Obese Caucasian Adults
Janetta Harbron 1,*, Lize van der Merwe 2,3, Monique G. Zaahl 4, Maritha J. Kotze 5
and Marjanne Senekal 1
1 Division of Human Nutrition, Department of Human Biology, Faculty of Health Sciences,
University of Cape Town, Private Bag X3, Observatory 7925, South Africa;
E-Mail: [email protected] 2 Division of Molecular Biology and Human Genetics, Faculty of Medicine and Health Sciences,
Stellenbosch University, Tygerberg 7505, South Africa; E-Mail: [email protected] 3 Department of Statistics, University of the Western Cape, Private Bag X17,
Bellville 7535, South Africa 4 Department of Genetics, Faculty of Sciences, Stellenbosch University, Private Bag X1,
Matieland 7602, South Africa; E-Mail: [email protected] 5 Division of Anatomical Pathology, Department of Pathology, Faculty of Medicine and Health
Sciences, Stellenbosch University, P.O. Box 19063, Tygerberg 7505, South Africa;
E-Mail: [email protected]
* Author to whom correspondence should be addressed; E-Mail: [email protected];
Tel.: +27-21-406-6769; Fax: +27-21-448-7226.
Received: 4 April 2014; in revised form: 30 June 2014 / Accepted: 16 July 2014 /
Published: 6 August 2014
Abstract: The fat mass and obesity-associated (FTO) gene is currently recognized as
the most robust predictor of polygenic obesity. We investigated associations between the
FTO rs1421085 and rs17817449 polymorphisms and the FTO rs1421085–rs17817449
haplotype and dietary intake, eating behavior, physical activity, and psychological health,
as well as the effect of these associations on BMI. N = 133 treatment seeking
overweight/obese Caucasian adults participated in this study. Genotyping was performed
from whole blood samples. Weight and height was measured and a non-quantified food
frequency questionnaire was completed to assess food group intake. Validated
questionnaires were completed to assess physical activity (Baecke questionnaire),
OPEN ACCESS

Nutrients 2014, 6 3131
psychological health (General Health questionnaire, Rosenburg self-esteem scale and Beck
Depression Inventory), and eating behavior (Three Factor Eating questionnaire). The risk
alleles of the FTO polymorphisms were associated with poorer eating behaviors (higher
hunger, internal locus for hunger, and emotional disinhibition scores), a higher intake of
high fat foods and refined starches and more depressive symptoms. The modeled results
indicate that interactions between the FTO polymorphisms or haplotypes and eating
behavior, psychological health, and physical activity levels may be associated with BMI.
The clinical significance of these results for implementation as part of weight management
interventions needs further investigation.
Keywords: fat mass and obesity associated gene; FTO gene; eating behavior; depression;
psychological well-being; dietary intake; physical activity; BMI; obesity
1. Introduction
Obesity has reached epidemic proportions and is still escalating at an alarming rate world-wide,
affecting children and adults in both developed and developing countries [1,2]. The etiology of obesity
is multi-factorial and any combination of environmental and lifestyle factors may interact with multiple
genetic polymorphisms to result in the condition [3,4]. To date the fat mass and obesity-associated
(FTO) gene stands out as the most robust and significant genetic contributor to polygenic obesity [5,6].
The risk alleles of several FTO polymorphisms located within a 47 kb linkage disequilibrium (LD)
block encompassing sections of intron 1 and exon 2 of FTO have been associated with obesity and a
higher BMI [7–9]. In genome-wide association studies the strongest associations with weight related
phenotypes were reported for the FTO rs9939609 [8], rs9930506 [9], rs1421085, rs17817449, and
rs1121980 [7] polymorphisms. However, the cluster of afore-mentioned polymorphisms is intronic and
their physiological effects contributing to obesity development remain to be identified [10].
FTO encodes a Fe(II)- and 2-oxoglutarate (OG) dependent nucleic acid demethylase that localizes
to the nucleus of cells [11,12]. However, the exact structure of the FTO protein [13] as well as its
physiological function and role in obesity development still need to be elucidated [14]. The results of
in vitro experiments point to the possibility that FTO exerts gene regulation at RNA level in humans,
as it catalyzes the demethylation of 3-methylthymine in single-stranded DNA, 3-methyluracil in
RNA [11,13,15] and N6-methyladenosine in nuclear RNA [16].
FTO is expressed in the cell nucleus of almost all human tissues [7]. The highest expression
levels are found in the brain, specifically in the arcuate nucleus of the hypothalamus, which is known
to play a major role in controlling energy homeostasis and eating behavior [8]. A possible role in
energy homeostasis is supported by studies performed on humans, mice and rodents that have shown
that Fto mRNA expression is regulated by food intake [11,17–19], circulating glucose levels [20],
weight status [21,22] and energy expenditure [18,23]. In human and mouse cell lines, FTO expression
is reversibly influenced by essential amino acid deprivation and replacement [24]. Furthermore,
Pitman et al. [25] illustrated that knockdown of FTO expression increased ATP concentrations in

Nutrients 2014, 6 3132
neuronal cells, but decreased ATP concentrations in adipocytes, implying a mechanism of cell-specific
control over energy production.
Research in mouse models shows that knockout of Fto results in normal embryonic development,
but high postnatal lethality, growth retardation and lower weight and adiposity measures [23,26,27].
Similarly, adult onset Fto knockout mice also experience reduced weight and lean mass initially.
However, thereafter their weight tended to converge with that of wild-type mice due to increases in
body fat mass [27]. Fischer et al. [23] indicated that Fto knockout mice were protected from diet-induced
obesity throughout their entire life span when consuming a high fat diet, while a high fat intake
augmented weight gain in the mice with FTO overexpression [26]. Overexpression of FTO also seemed
to be associated with higher food intakes and consequent weight and fat mass gains when expenditure
and physical activity levels remained unchanged [26]. A number of possible but inconclusive mechanisms
for FTO’s role in explaining these findings have been proposed. These include that FTO may influence
protein and/or fat utilization [27], as well as energy expenditure and adrenalin levels [23,28].
Results from work in humans are also not yet conclusive, with some reporting a link between the risk
alleles and increased energy expenditure [29,30], whereas others failed to show any association [31–34].
The risk alleles have also been associated with poorer eating behaviors [7–9], higher food, energy and
fat intakes and specific preference for energy-dense foods with high fat content [29,32,34–37]. Although
these studies mostly investigated the rs9939609 polymorphism, McCaffery et al. [37] suggest that
the rs1421085 polymorphism may better illustrate the effect of the FTO locus on dietary intake and
patterns, as the associations they found between the latter variables and the risk alleles of rs1421085
were more consistent compared to the other FTO polymorphisms investigated (rs9939609, rs3751812,
rs9922708). However, it needs to be noted that Stutzman et al. [38] found no association between the
rs1421085 polymorphism and eating behavior or meal size and snacking patterns in Caucasians [38].
There is a paucity of information on the association between FTO rs17817449 and lifestyle related
variables. Further research is clearly necessary to elucidate the associations of FTO polymorphisms
with eating behavior, dietary intake, and energy expenditure.
The objectives of this study were firstly to investigate the association between the FTO rs1421085
and rs17817449 polymorphisms as well as the FTO rs1421085-rs17817449 haplotype and dietary
intake, eating behavior, physical activity, and psychological health in treatment seeking
overweight/obese subjects, and secondly to determine the effect of the interaction between these FTO
polymorphisms as well as haplotype and the mentioned variables on BMI. Please note that we refer to
the C-allele of the FTO rs1421085 polymorphism and the G-allele of the FTO rs17817449
polymorphism as the risk alleles, and the T-allele of both polymorphisms as the non-risk alleles as
previously described in the literature [7,30].
2. Experimental Section
2.1. Study Participants
The study population consisted of treatment seeking overweight and obese Caucasian subjects
who were South African citizens and were residing in Cape Town and surrounding areas. In this study
“Caucasian” refers to individuals of European descent, mainly from Dutch, French, German, and

Nutrients 2014, 6 3133
British origin. Subjects were recruited by means of advertisements placed in local newspapers, the e-mail
bulletins of local universities, and by word of mouth to participate in a weight loss intervention to
investigate the association between weight loss and genotype. All subjects attended an individual
recruitment interview with a registered dietitian to provide detailed information regarding the project,
take anthropometric measurements, and complete a number of questionnaires, including questions on
the inclusion and exclusion criteria of the study. To be included, subjects had to be between the ages of
25 and 40 years old with a BMI ≥ 27 kg/m2. Those who were pregnant or breastfeeding, had a history
of eating disorders, serious psychiatric illnesses or drug or alcohol abuse were excluded. Appointments
for two follow-up sessions were made during which the rest of the questionnaires were completed and
a blood sample was taken. A cross-sectional sample of n = 133 overweight/obese subjects was assessed.
The study was approved by the Health Research Ethics Committee of Stellenbosch University and
signed informed consent was obtained from all subjects.
2.2. Genotyping
Blood was drawn by trained phlebotomists in BD vacutainers with EDTA. A modified protocol by
Miller et al. [39] was used to extract DNA from the whole blood samples. The polymorphisms were
genotyped using PCR amplification in a GeneAmp® 2700 PCR System (Applied Biosystems, Foster
city, CA, USA). The volume of each PCR reaction was 25 μL consisting of 50 ng DNA, 0.2 mM of
each dNTP (dATP, dCTP, dGTP, dTTP), 10 pmoL of each primer, 2 mM magnesium chloride
(MgCl2), Taq polymerase and 1× Taq buffer. The following primers, manufactured by Integrated DNA
Technologies (Leuven, Belgium), were used: 5′-TAGTAGCAGTTCAGGTCCTAAGGCGTG-3′
(forward) and 5′-CAGATTAAGGTGATGGGTTG-3′ (reverse) for the FTO rs1421085
polymorphism (designed using In Silico); 5′-AGGACCTCCTATTTGGGACA-3′ (forward) and
5′-AGCTTCCATGGCTAGCATTA-3′ (reverse) for the FTO rs17817449 polymorphism [30]. The
PCR cycles consisted of an initial denaturation at 95 °C for 5 min, followed by 35 cycles of
denaturation at 95 °C for 30 s, annealing at 55 °C for 45 s and elongation at 72 °C for 30 s. The final
extension step occurred at 72 °C for 10 min. A mixture of 5 μL of each PCR product and 5 μL cresol
red loading buffer (2 mg/mL cresol red and 35% (w/v) sucrose) was loaded onto a 1% (w/v) horizontal
agarose gel (2 g agarose in 200 mL 1× TBE (90 mM Tris-HCl, 90 mM boric acid (H3BO3) and
0.1 mM EDTA, pH 8.0) and 0.01% ethidium bromide (EtBr)). Electrophoresis was performed at 120 V
for one hour in 1× TBE buffer solution and then visualized by ultraviolet light transillumination
(GeneSnap MultiGenius Bio Imaging System, Syngene, Synoptics, Cambridge, UK). A 100 bp ladder
was also loaded to confirm PCR amplification products of the correct fragment size, i.e., 240 bp (FTO
rs1421085) and 828 bp (FTO rs17817449).
Digestion of the PCR products was performed using restriction fragment length polymorphism
(RFLP) analysis in 20 μL reactions containing 10 μL PCR product, 1× buffer and 1U MaeIII for the
FTO rs1421085 polymorphism or 2U AlwNI for the FTO rs17817449 polymorphism. The solution was
incubated at 55 °C (FTO rs1421085) or 37 °C (FTO rs17817449) in a water bath overnight. The
digested PCR products were loaded onto a 3% agarose gel at 120 V for 1 h (FTO rs1421085) or 1.5%
Agarose gel at 120 V for 50 min and visualized by ultraviolet light transillumination (GeneSnap
MultiGenius Bio Imaging System, Syngene). Digestion results for all three genotypes of both

Nutrients 2014, 6 3134
polymorphisms were confirmed by Inqaba biotec (Inqaba Biotechnical Industries, Pretoria, South
Africa) using sequencing analysis, confirming analytical validity.
2.3. Anthropometry
Weight and height were measured by trained and standardized fieldworkers and body mass index
(BMI) was computed as weight (kg)/height (m)2. Weight was measured in light clothing without shoes
to the nearest 0.1 kg using a calibrated electronic scale with a 250 kg capacity (Physician scale,
Scales 2000, Durban, South Africa). Height without shoes was measured to the nearest 0.1 cm with a
stadiometer (Scales 2000, Durban, South Africa). The participants stood with their feet together and
heels, buttocks, scapulae, and back of the head touching the vertical surface of the stadiometer [40].
2.4. Physical Activity
The validated [41–43] self-administered 16-item Baecke Questionnaire of Habitual Physical
Activity [44] was used to measure physical activity at work (work index), sport during leisure
time (sport index), and physical activity during leisure time, excluding sport (leisure-time index).
Baecke et al. [44] reported good test-retest reliability for the work, sport, and leisure-time indices
of 0.88, 0.81 and 0.74, respectively. The scores for the three indices were calculated as described by
Baecke et al. [44]. Higher mean scores for each index reflect higher physical activity levels.
2.5. Dietary Intake
The aim of the dietary assessment was to investigate associations between the frequency of intake
of four indicator food groups and genotype. These food groups were derived from the food list of a
more comprehensive non-quantified food frequency questionnaire (FFQ) developed for this research.
Although not validated, this FFQ was derived by a panel of experts from a generic FFQ developed by
Steyn and Senekal [45] for South Africans, ensuring content and face validity. The four food groups
included (1) high fat foods (21 items), (2) energy-dense snacks (8 items), (3) energy-dense drinks
(4 items) and (4) refined bread and cereals (2 items). Frequency of intake of specific food items could
be indicated as <1/month, 1–3 times/months, 1/week, 2–4/week, 5–6/week, 1/day, 2–3/day,
4–5/day, 6+/day. For data-analysis the mean daily frequency of intake of each of the four food groups
was calculated.
2.6. Eating Behavior
Eating behavior was assessed with the validated [46,47] self-administered 51-item Three-Factor
Eating Questionnaire (TFEQ) [48]. Scores for three dimensions (scales) of eating behavior, namely
dietary restraint, disinhibition and perceived hunger [48] as well as different subscales (summarized
in Table 1) [49,50] were calculated. Higher scores on scales and subscales reflect higher levels of
restrained eating, disinhibited eating, and predisposition to hunger [51]. For our sample the Cronbach’s
alpha was 0.78 for restraint, 0.81 for disinhibition, and 0.78 for perceived hunger, indicating good
internal reliability.

Nutrients 2014, 6 3135
Table 1. Summary, explanation, score range, and reported association with body mass
index (BMI) of the scales and subscales of the three-factor eating questionnaire.
Eating Behavior Scale
or Subscale Explanation of Scale or Subscale
Score
Range
Reported/ Expected
Association with BMI Reference
Dietary restraint
The extent to which food intake is cognitively
restricted (by thought and will power) in order
to control body shape and weight.
0 to 21 − or + * [48–50]
Flexible control (consistent
restraint)
A more gradual approach towards eating
and dieting. Foods like sweets and treats
or fattening foods are eaten but in smaller
quantities, without feelings of guilt.
0 to 7 − [49]
Rigid control (inconsistent
restraint)
A dichotomous (all-or-nothing) approach
towards eating and dieting. All sweets, treats,
and fattening foods are avoided.
0 to 7 + [49]
Strategic dieting behavior Specific behaviors employed to control weight 0 to 4 − or + § [50]
Attitude to self-regulation (of
eating)
Subjects’ general view on dietary intake and
weight control. 0 to 5 + [50]
Avoidance of
fattening foods
Deliberate efforts to decrease
fat content in the diet. 0 to 4 [50]
Disinhibition
The extent of inability to control food intake in
response to the presence of (1) palatable food
that may result in the over-consumption of food
or (2) stimuli such as emotional stress or social
eating cues that may result in the
inability to resist food intake when not hungry
0 to 16 + [48–50]
Habitual susceptibility
to disinhibition
Circumstances predispose to
recurrent disinhibition 0 to 5 + [50]
Emotional susceptibility
to disinhibition
Specific negative affective states such as
emotional stress result in disinhibition 0 to 3 + [50]
Situational susceptibility
to disinhibition
Specific environmental cues result
in disinhibition 0 to 5 + [50]
Perceived hunger
The extent of food intake in response to
susceptibility to general subjective feelings and
perceptions of hunger and the behavioral
consequences thereof
0 to 16 + [48,52]
Internal locus for hunger Type of hunger that is interpreted and
regulated internally 0 to 6 + [50]
External locus for hunger Type of hunger that is regulated by
external cues 0 to 6 + [50]
(−) Negative association and (+) positive association. * Conflicting associations have been reported, also reflected in discussion of our
results. § Negative association for those dissatisfied with their weight; positive association for those satisfied with their weight.

Nutrients 2014, 6 3136
2.7. Psychological Health
The presence and severity of depressive symptoms was assessed with the validated [53,54]
self-administered 21-item Beck Depression Inventory (BDI) [54]. Scores for each of the 21 items are
summed to obtain a total score between 0 and 63. Higher scores reflect the presence of more severe
depressive symptoms [54]. For our sample the Cronbach’s alpha for the BDI was 0.92, indicating
excellent internal reliability.
General psychological well-being was assessed with the validated [55–57] self-administered
30-item General Health Questionnaire (GHQ) [56]. The questionnaire was developed to diagnose possible
cases of non-psychotic psychiatric disorders and differentiates psychiatric patients as a general class
from those who consider themselves to be well. A total score between 0 and 30 can be obtained.
A higher score is indicative of poorer mental health and a greater inability to carry out one’s normal
‘healthy’ functions [55]. For our sample the Cronbach’s alpha for the GHQ was 0.87, indicating good
internal reliability.
Self-esteem was assessed with the validated [58,59] 10-item self-administered Rosenberg
Self-Esteem Scale (RSES) that was developed by Rosenberg [60] to measure global feelings of
self-worth or self-acceptance. A total score between 10 and 40 can be obtained. Higher scores reflect
a higher self-esteem [60]. For our sample the Cronbach’s alpha for the RSES was 0.87, indicating good
internal reliability.
2.8. Statistical Analyses
For descriptive purposes, frequencies were calculated for categorical variables and means and
standard deviations (Mean ± SD) for numerical variables, as they were found to be normally distributed
(see Table 2). General linear models were used for all analyses, except for testing Hardy-Weinberg
Equilibrium (HWE). Unadjusted tests were used for comparing baseline variables, and as significant
gender differences were detected in a number of variables (results not shown), all further analyses were
adjusted for gender.
Genotype distributions were tested for HWE using the exact test. Gender-adjusted linear models
were used to test the association between lifestyle and psychological health variables and each FTO
polymorphism using the (1) genotype model (comparing the three genotype groups), (2) dominant
model (homozygous non-risk genotype vs. risk allele carriers), (3) recessive model (non-risk allele
carriers vs. homozygous risk genotype) and (4) additive allelic model (counted as zero, one and two
risk alleles). For these analyses only the significant differences of the best fitting model (smallest
p-value) are reported in the results section (see Table 3). Effect sizes were calculated to describe each
significant association.
Gender-adjusted linear models were also used to determine the effect of the interaction between
each lifestyle and psychological health variable and (1) the genotype groups (categorized as non-risk,
heterozygous, and risk genotypes) on BMI; and (2) the additive allelic variable (numerically coded as
zero, one and two minor alleles) on BMI. In all cases where significant p-values for the effect of the
interaction between genotype groups with a specific variable on BMI was found, a significant effect
for the additive allelic variable interaction with the variable was also found. Therefore, to visualize

Nutrients 2014, 6 3137
significant results, a plot depicting each of the significant additive allelic interactions with a specified
variable (x-axes) on BMI (y-axes) was drawn. On all plots, the symbols represent all (male and female)
individual observed values and the regression lines show the expected relationships for a female for each
genotype of the polymorphism under investigation. Due to gender adjustment of results, separate plots
need to be constructed for each gender. As there were more females in the sample, we chose to depict
regression lines for females to illustrate the results. The expected relationships between the lines would
be exactly the same for males, their trio of graphs would just start at a different point on the y-axis.
The plots reflect the modeled rate of change in BMI in response to a change in a specified variable for
each genotype group. A significant additive allelic interaction indicates that the slopes (e.g., increase in
BMI corresponding to a one-unit increase/decrease in the lifestyle or psychological health variable) of
the regression lines of each genotype group differ significantly from each other. A positive interaction
effect size indicates that the slope of the regression line for the heterozygotes is larger than for subjects
with no risk alleles, and the slope for the subjects with two risk alleles is even larger. Thus, a negative
interaction effect size indicates that the slope of the regression line for the heterozygotes is larger than
of subjects with risk alleles, and the slope for the subjects with no risk alleles is even larger. For each
plot, the genotype effect sizes reflect the association between BMI and the specified variable for
each genotype.
Gender-adjusted linear models were also used to test the association between the FTO
rs1421085–rs17817449 haplotype and each lifestyle and psychological health variable, as well as
the effect of the interaction between this haplotype and each lifestyle and psychological health variable
on BMI. Plots depicting significant additive allelic interactions were drawn. The haplotype analyses
determine whether a statistical significant difference exists between the slopes of all haplotype groups.
The slopes that are significantly different from each other on each plot are indicated in the
results section.
Data were analyzed using statistical program R [61] and R packages genetics and haplo.stats. All
results corresponding to a p-value of <0.05 were described as statistically significant. It should be
noted that multiple comparisons, as performed in this study, are recognized as a common statistical
approach in genetic association studies [62]. Furthermore, it has been suggested that adjustments, such
as Bonferroni, are too strict and may result in missing significant associations when performing
multiple association tests in one group of individuals [63]. Therefore, we did not adjust for multiple
testing but rather considered the results of all association tests while interpreting each significant p-value
with caution, taking into account the plausibility of the finding as recommended by Perneger [64].
Some results may thus be considered hypotheses generating, whereas the replication of previously
reported results and functional explanation of the association between the polymorphism and phenotype
may verify plausibility of such results [62].
3. Results
3.1. Socio-Demographic and Weight Profile of the Cross-Sectional Sample
The subjects had a mean ± SD age of 32.9 ± 4.4 years, weight of 99.9 ± 20.1 kg, height of
1.68 ± 0.08 m and BMI of 35.2 ± 6.6 kg/m2. In this sample 21.8% of subjects were overweight

Nutrients 2014, 6 3138
(BMI of 27–29.9 kg/m2), 33.1% were obese class I (BMI of 30–34.9 kg/m2), 24.1% were obese class II
(BMI of 35–39.9 kg/m2) and 21.0% were obese class III (BMI ≥ 40 kg/m2). Most were female,
married, Afrikaans speaking, had a tertiary qualification, and lived with their partners and children
(Table 2). There were no significant differences in mean BMI between the response categories of the
socio-demographic variables.
Table 2. Socio-demographic profile and genotype, allele and haplotype frequencies of the
FTO rs1421085 and rs17817449 polymorphisms.
Socio-Demographic Variables and Polymorphisms n % BMI (kg/m2)
Mean ± SD p-Value
Gender
Female 112 84.2 35.3 ± 6.9 0.818
Male 21 15.8 34.9 ± 4.5
Marital status
Married/living together 86 64.7 35.1 ± 6.3 0.703
Unmarried (including separated/divorced) 47 35.3 35.5 ± 7.1
Home language
Afrikaans 120 90.2 35.2 ± 6.5 0.729
English 13 9.8 35.8 ± 7.2
Level of education
Completed Grade 10 or Matric 43 32.3 35.1 ± 7.3 0.887
Tertiary qualification 90 67.7 35.3 ± 6.2
Living
alone 22 16.5 37.4 ± 8.0 0.156
with friends/parents 20 15.0 33.7 ± 6.0
with a partner 30 22.6 33.8 ± 5.6
with a partner and child (ren) 61 45.9 35.7 ± 6.5
FTO rs1421085 polymorphism
Genotype frequencies: TT 21 20.8 34.5 ± 7.3 0.1566
TC 55 54.5 36.6 ± 7.0
CC 25 24.7 33.6 ± 5.4
Allele frequencies: Risk allele: C 52.0 0.5831
FTO rs17817449 polymorphism
Genotype frequencies: TT 31 29.5 35.9 ± 7.0 0.7814
TG 32 30.5 34.9 ± 6.8
GG 42 40.0 36.0 ± 7.2
Allele frequencies: Risk allele: G 55.2 0.9178
FTO rs1421085-rs17817449 haplotype frequencies
Haplotypes: C-G * 27.3 * 0.6010
C-T 24.7
T-G 27.9
T-T 20.0
* Where haplotype allocation was uncertain (i.e., when a subject is heterozygous T-C and T-G for both polymorphisms, it
cannot be established whether the haplotype for the individual is for example T-T or C-G), different pairs of haplotypes,
with probabilities of being the true haplotype were inferred for individuals and thus cannot be counted.

Nutrients 2014, 6 3139
3.2. Genotype and Allele Frequencies
The frequencies of the homozygous GG genotype (n = 42, 40.0%) of the FTO rs17817449
polymorphism and the heterozygous TC genotype of the FTO rs1421085 polymorphism were the most
prevalent (Table 2). The frequencies of the risk alleles of both FTO polymorphisms were higher than
the respective non-risk T-alleles. The genotype frequencies of the FTO rs1421085 polymorphism
were in HWE (p = 0.4284), while the genotype frequencies of the FTO rs17817449 polymorphisms
were not in HWE (p = 0.0001). The frequency of the non-risk T-T haplotype of the FTO
rs1421085–rs17817449 haplotype was the lowest in this sample (Table 2). No associations between
BMI and genotype groups, additive allelic scores or haplotypes were found.
3.3. Dietary Intake of Indicator Food Groups
Subjects with the homozygous GG genotype of the FTO rs17817449 polymorphism had a
1.74 and 0.67 times higher intake of high-fat foods and refined starches, respectively, than subjects
with one or no risk alleles (Table 3). No significant associations were found between the FTO
polymorphisms and energy dense snacks or drinks consumed.
Table 3. Significant associations between genotype groups of FTO rs1421085 and
rs17817449 polymorphisms and lifestyle/psychological health variables.
Lifestyle/Psychological
Health Variable Polymorphisms Genotypes n * Mean ± SD
Effect
Size ± SE Model p-Value
Food groups Frequency of
intake/day
High fat foods FTO rs17817449 T-allele carriers
GG
59
38
4.9 ± 3.6
6.6 ± 4.9 1.74 ± 0.87 Recessive G 0.0494
Refined starches FTO rs17817449 T-allele carriers
GG
59
38
0.94 ± 1.36
1.59 ± 1.55 0.67 ± 0.30 Recessive G 0.0287
TFEQ Questionnaire
score
Perceived hunger FTO rs1421085
TT
TC
CC
20
54
23
5.9 ± 3.4
7.3 ± 3.0
8.8 ± 3.9
1.43 ± 0.52 Additive C 0.0072
Hunger:
Internal locus of control FTO rs1421085
TT
TC
CC
20
54
23
2.2 ± 1.7
2.8 ± 1.8
3.9 ± 2.0
0.84 ± 0.28 Additive C 0.0038
Emotional disinhibition FTO rs1421085 TT
C-allele carriers
20
77
2.0 ± 1.3
2.4 ± 1.1 0.58 ± 0.26 Dominant C 0.0281
Restraint scale:
Flexible control FTO rs1421085
TT
C-allele carriers
20
77
1.7 ± 1.6
2.5 ± 1.7 0.89 ± 0.43 Dominant C 0.0392
BDI FTO rs17817449 T-allele carriers
GG
61
40
12.7 ± 9.4
17.6 ± 10.7 4.58 ± 2.02 Recessive G 0.0256
BDI = Beck depression inventory, RSES = Rosenberg self-esteem scale. * n vary due to missing values. Risk allele for
FTO rs1421085 = C-allele and for FTO rs17817449 = G-allele. Non-significant differences not included in table.
Nutrients 2014, 6 3140
3.4. Eating Behavior
The association between the FTO rs1421085 polymorphism and perceived hunger was significant
for the recessive, dominant, genotype, and additive allelic models, with the latter being the best fit.
It was found that the perceived hunger score of subjects with one risk allele was 1.43 times higher than
the score of subjects with no risk alleles, while those with two risk alleles had a 2.86 times higher score
(Table 3). Similarly, subjects with two risk alleles of the FTO rs1421085 polymorphism had the highest
internal locus of control for hunger scores compared to those with one or no C-alleles. Furthermore,
the risk C-allele carriers also had higher emotional disinhibition and flexible control scores compared
to the TT homozygotes (Table 3).
The rate of change in BMI in response to a change in the rigid control (allelic effect size =1.67,
p = 0.0290, Figure 1a) and self-regulation (allelic effect size = 2.29, p = 0.0095, Figure 1b) subscale
scores differed significantly between the genotype groups of the FTO rs1421085 polymorphism. The
addition of one risk C-allele results in a 1.67-unit or 2.29-unit increase in the slope (rate of change) of
BMI for each one-unit increase in the rigid control (Figure 1a) or self-regulation (Figure 1b) score,
respectively, when compared to subjects with no risk alleles. Therefore, the addition of two risk alleles
would result in a 3.34-unit or 4.58-unit increase in the slope of BMI for each one-unit increase in the
rigid control or self-regulation scores, respectively. The most pronounced decrease in BMI in response
to an increase in the rigid control (genotype effect size = −2.37, p = 0.0078 for the TT regression line
on Figure 1a) or attitude to self-regulation scores (genotype effect size = −3.11; p = 0.0078 for the
TT regression line on Figure 1a) was observed for the non-risk TT homozygotes. Thus, each one-unit
increase in the rigid control or self-regulation score of TT homozygotes results in a 2.37-unit or
3.11-unit decrease in BMI, respectively. The unit change in BMI in response to an increase in the rigid
control score of the CT (−2.37 + 1.67 = −0.70 unit) and CC (−2.37 + 3.34 = 0.97 unit) genotypes was
smaller than the TT homozygotes and non-significant. Similarly, smaller non-significant changes in
BMI in response to an increase in the self-regulation score (CT: −3.11 plus 2.29 = −0.82 unit and
CC: −3.11 plus 4.58 = 1.47 unit) were found.
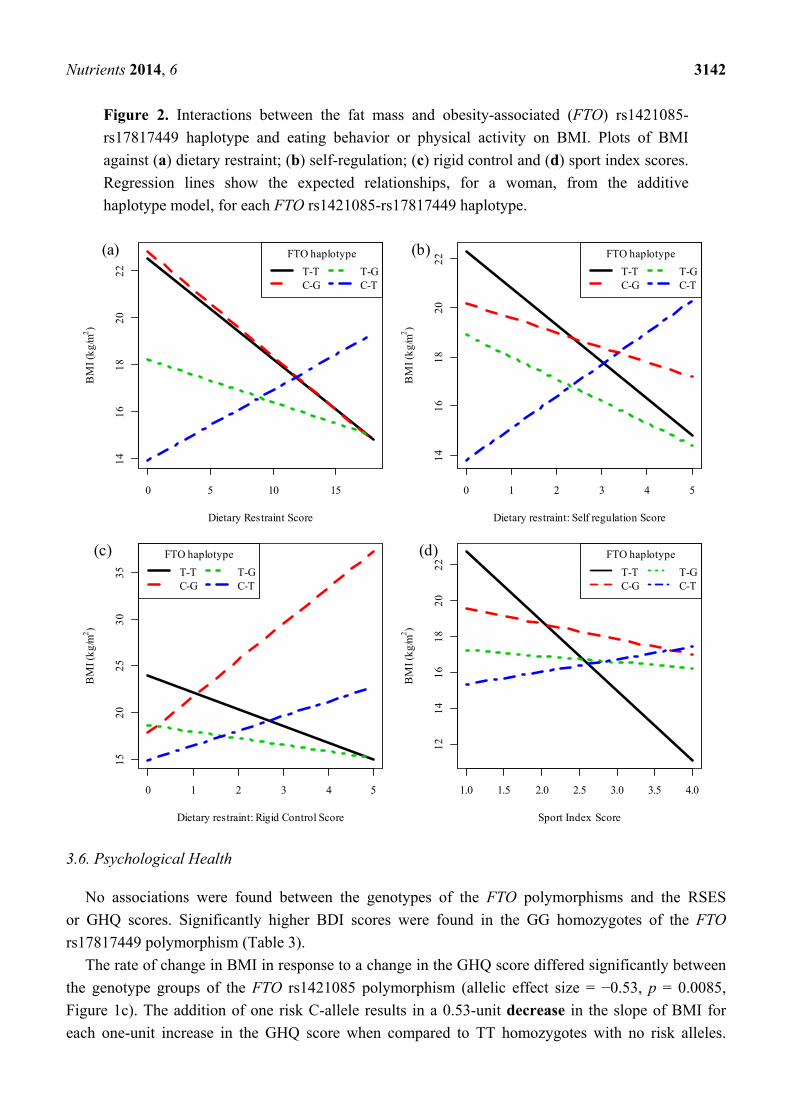
Haplotype analyses revealed that the rate of change in BMI in response to a change in the dietary
restraint (effect size = 0.74, SE = 0.35, p = 0.0389, Figure 2a) and self-regulation (effect size = 2.7,
SE = 1.21, p = 0.0273, Figure 2b) scores differed significantly between the T-T and C-T haplotypes
of the two FTO polymorphisms. Although it is evident from Figure 2a,b that an increase in
dietary restraint or attitude to self-regulation was associated with a decrease in BMI for each T-T
haplotype and an increase in BMI for each C-T haplotype, these individual associations were not
statistically significant.
The rate of change in BMI in response to a change in rigid control differed significantly between
the T-T and C-T (effect size = 2.25, SE = 0.95, p = 0.0190) as well as the T-T and C-G (effect
size = 2.31, SE = 1.03, p = 0.0268) haplotypes of the two FTO polymorphisms (Figure 2c). For each
T-T haplotype, a one-unit increase in the rigid control score results in a decrease in BMI of
1.79 kg/m2 (effect size = 1.79, p = 0.010). The change in BMI in response to a change in the rigid
control score was not significant for any of the other haplotypes.

Nutrients 2014, 6 3141
Figure 1. Interactions between the FTO rs1421085 polymorphism and eating behavior
or psychological health on BMI. Plots of BMI against (a) rigid control score (p = 0.0290);
(b) attitude to self-regulation score (p = 0.0095) and (c) General Health Questionnaire
score (p = 0.0085). Symbols represent all individual observed values for males and females
and regression lines show the expected relationships for a female, from the additive allelic
model, for each genotype of the FTO rs1421085 polymorphism.
3.5. Physical Activity
No associations were found between the FTO rs1421085 or rs17817449 polymorphisms
and physical activity levels (results not reported). However, the rate of change in BMI in response to
a change in the sports index score differed significantly between the T-T and C-T (effect size = 4.57,
SE = 1.95, p = 0.0212) as well as between the T-T and T-G (effect size = 3.53, SE = 1.75, p = 0.0469)
haplotypes of the two FTO polymorphisms (Figure 2d). For each T-T haplotype, a one-unit increase
in the sport index score results in a decrease in BMI of 3.87 kg/m2 (effect size = 3.87, p = 0.004). The
change in BMI in response to a change in the sport index score was not significant for any of the
other haplotypes.
0 1 2 3 4 5 6
3040
5060
70
Dietary restraint: Rigid Control Score
BM
I (k
g/m
2 )
FTO rs1421085
T/T C/T C/C
(a)
0 1 2 3 4 5
3040
5060
70Dietary restraint: Self Regulation Score
BM
I (k
g/m
2 )
FTO rs1421085
T/T C/T C/C
(b)
0 5 10 15 20 25
3040
5060
70
General Health Questionnaire
BM
I (k
g/m
2 )
FTO rs1421085
T/T C/T C/C
(c)
Nutrients 2014, 6 3142
Figure 2. Interactions between the fat mass and obesity-associated (FTO) rs1421085-
rs17817449 haplotype and eating behavior or physical activity on BMI. Plots of BMI
against (a) dietary restraint; (b) self-regulation; (c) rigid control and (d) sport index scores.
Regression lines show the expected relationships, for a woman, from the additive
haplotype model, for each FTO rs1421085-rs17817449 haplotype.
3.6. Psychological Health
No associations were found between the genotypes of the FTO polymorphisms and the RSES
or GHQ scores. Significantly higher BDI scores were found in the GG homozygotes of the FTO
rs17817449 polymorphism (Table 3).
The rate of change in BMI in response to a change in the GHQ score differed significantly between
the genotype groups of the FTO rs1421085 polymorphism (allelic effect size = −0.53, p = 0.0085,
Figure 1c). The addition of one risk C-allele results in a 0.53-unit decrease in the slope of BMI for
each one-unit increase in the GHQ score when compared to TT homozygotes with no risk alleles.
0 5 10 15
1416
1820
22
Dietary Restraint Score
BM
I (kg
/m2)
FTO haplotype
T-TC-G
T-GC-T
(a)
0 1 2 3 4 5
1416
1820
22
Dietary restraint: Self regulation Score
BM
I (kg
/m2)
FTO haplotype
T-TC-G
T-GC-T
(b)
0 1 2 3 4 5
1520
2530
35
Dietary restraint: Rigid Control Score
BM
I (kg
/m2 )
(c) FTO haplotype
T-TC-G
T-GC-T
1.0 1.5 2.0 2.5 3.0 3.5 4.0
1214
1618
2022
Sport Index Score
BM
I (kg
/m2 )
(d) FTO haplotype
T-TC-G
T-GC-T
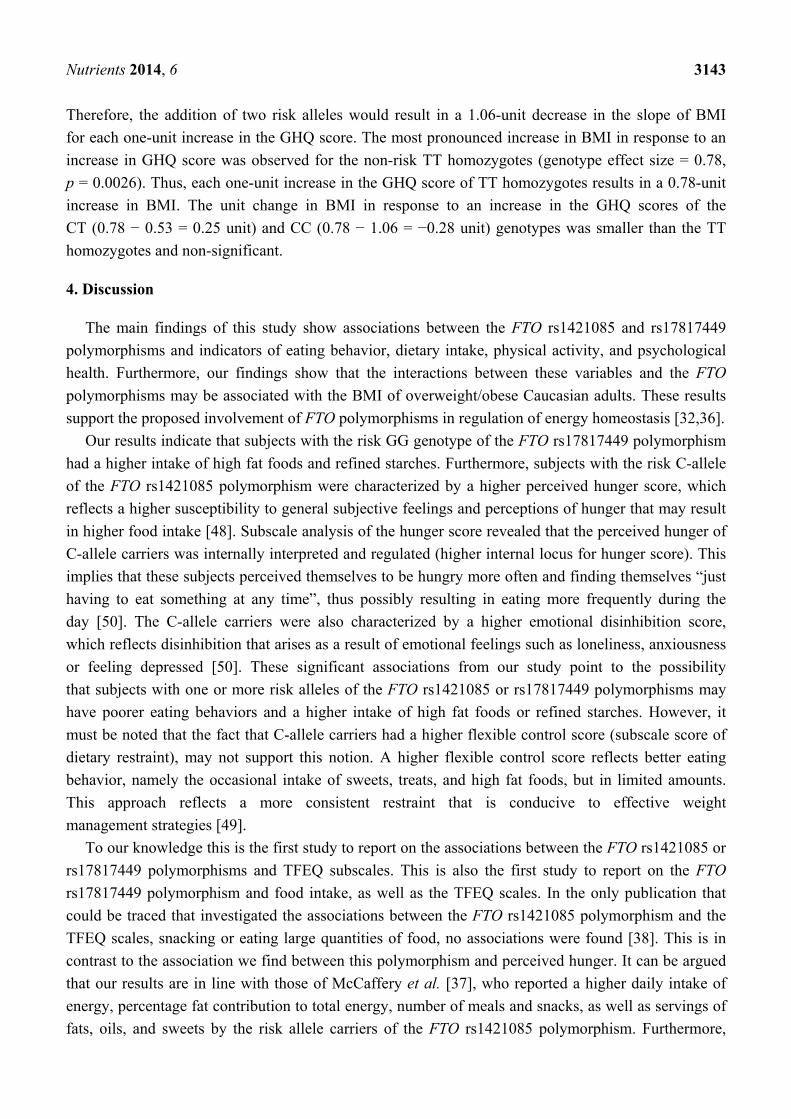
Nutrients 2014, 6 3143
Therefore, the addition of two risk alleles would result in a 1.06-unit decrease in the slope of BMI
for each one-unit increase in the GHQ score. The most pronounced increase in BMI in response to an
increase in GHQ score was observed for the non-risk TT homozygotes (genotype effect size = 0.78,
p = 0.0026). Thus, each one-unit increase in the GHQ score of TT homozygotes results in a 0.78-unit
increase in BMI. The unit change in BMI in response to an increase in the GHQ scores of the
CT (0.78 − 0.53 = 0.25 unit) and CC (0.78 − 1.06 = −0.28 unit) genotypes was smaller than the TT
homozygotes and non-significant.
4. Discussion
The main findings of this study show associations between the FTO rs1421085 and rs17817449
polymorphisms and indicators of eating behavior, dietary intake, physical activity, and psychological
health. Furthermore, our findings show that the interactions between these variables and the FTO
polymorphisms may be associated with the BMI of overweight/obese Caucasian adults. These results
support the proposed involvement of FTO polymorphisms in regulation of energy homeostasis [32,36].
Our results indicate that subjects with the risk GG genotype of the FTO rs17817449 polymorphism
had a higher intake of high fat foods and refined starches. Furthermore, subjects with the risk C-allele
of the FTO rs1421085 polymorphism were characterized by a higher perceived hunger score, which
reflects a higher susceptibility to general subjective feelings and perceptions of hunger that may result
in higher food intake [48]. Subscale analysis of the hunger score revealed that the perceived hunger of
C-allele carriers was internally interpreted and regulated (higher internal locus for hunger score). This
implies that these subjects perceived themselves to be hungry more often and finding themselves “just
having to eat something at any time”, thus possibly resulting in eating more frequently during the
day [50]. The C-allele carriers were also characterized by a higher emotional disinhibition score,
which reflects disinhibition that arises as a result of emotional feelings such as loneliness, anxiousness
or feeling depressed [50]. These significant associations from our study point to the possibility
that subjects with one or more risk alleles of the FTO rs1421085 or rs17817449 polymorphisms may
have poorer eating behaviors and a higher intake of high fat foods or refined starches. However, it
must be noted that the fact that C-allele carriers had a higher flexible control score (subscale score of
dietary restraint), may not support this notion. A higher flexible control score reflects better eating
behavior, namely the occasional intake of sweets, treats, and high fat foods, but in limited amounts.
This approach reflects a more consistent restraint that is conducive to effective weight
management strategies [49].
To our knowledge this is the first study to report on the associations between the FTO rs1421085 or
rs17817449 polymorphisms and TFEQ subscales. This is also the first study to report on the FTO
rs17817449 polymorphism and food intake, as well as the TFEQ scales. In the only publication that
could be traced that investigated the associations between the FTO rs1421085 polymorphism and the
TFEQ scales, snacking or eating large quantities of food, no associations were found [38]. This is in
contrast to the association we find between this polymorphism and perceived hunger. It can be argued
that our results are in line with those of McCaffery et al. [37], who reported a higher daily intake of
energy, percentage fat contribution to total energy, number of meals and snacks, as well as servings of
fats, oils, and sweets by the risk allele carriers of the FTO rs1421085 polymorphism. Furthermore,

Nutrients 2014, 6 3144
support for possible associations between dietary intake and eating behaviors and the FTO gene comes
from research on polymorphisms located in the same LD block as the rs1421085 and rs17817449
polymorphisms. In children, the high risk genotype or allele of the FTO rs9939609 polymorphism was
associated with impaired ability to respond to satiety cues [65], a higher intake of highly palatable
foods [36], a higher energy intake [29], more frequent “loss of control” eating episodes, and a higher
intake of high fat foods at a lunch buffet [35]. However, some studies were unable to replicate these
results in children or adolescents [33,66]. In Caucasian adults, a greater number of meals and snacks
per day [37] and a higher energy intake from fat [67] and a higher energy intake were associated with
the risk alleles of the FTO rs9939609 [32] and rs8050136 polymorphisms [34]. Most of the evidence at
this stage thus seems to support our findings that the risk allele carriers of the FTO polymorphisms
may have poorer eating behaviors. It could thus be argued that our finding that the risk genotype has
higher flexible control is possibly a false positive.
Our modeling results illustrate that interactions between FTO genotypes or haplotypes investigated
in this study and eating behavior may be associated with the BMI of subjects. For instance, the results
indicate that subjects with the non-risk TT genotype of the FTO rs1421085 polymorphism may benefit
from improving their attitude to self-regulation score (subscale score of dietary restraint) when
attempting weight reduction, while the same beneficial effect may not be experienced by the risk allele
carriers. It was evident that an increase in the self-regulation score of one-unit was associated with
a significant 3.11 kg/m2 decrease in BMI. An increase in attitude to self-regulation score denotes
increased dietary restraint and reflects a subject’s general view on eating and the importance of dieting,
more specifically consideration of the energy content of food and eating specific foods at specific
times for weight control [50]. Conflicting results regarding the association between dietary restraint
and BMI have been reported. However, the potential benefit from increasing dietary restraint during
weight reduction is supported by the fact that a lower restraint score has been associated with higher
body weight [68,69] and that decreases in dietary restraint over time were associated with concurrent
weight gain [70]. Furthermore, an increase in dietary restraint during weight loss was associated with a
greater weight loss [49,71] and was found to be a significant predictor of weight maintenance over
two years [72]. It is thus not surprising that Hill et al. [73] argue in a review article that chronic dietary
restraint is necessary to be an effective weight manager in the current obesogenic environment. Our
subscale analysis of dietary restraint further indicates that a modeled increase in the rigid control score
was associated with the most pronounced decrease in BMI of subjects with the non-risk TT genotype
of the FTO rs1421085 polymorphism and a significant decrease in the BMI of subjects with a T-T
haplotype. Rigid control specifically relates to the complete avoidance of “fattening foods”, sweets
and/or treats, with individuals employing an all-or-nothing approach to dieting. Over the short-term,
a high rigid control may be associated with decreases in BMI, which may explain our results.
However, high rigid control is not recommended for effective weight management purposes, as
frequent lapses or total relapse may occur, which explains the higher BMIs, energy intakes, and less
success with weight loss in individuals with a higher rigid control [49,74]. It should be noted that
the other significant interactions found between the FTO haplotype, BMI, and dietary restraint, as
well as attitude to self-regulation scores, cannot be further interpreted as no individual haplotype was
significantly associated with BMI and eating behavior changes.
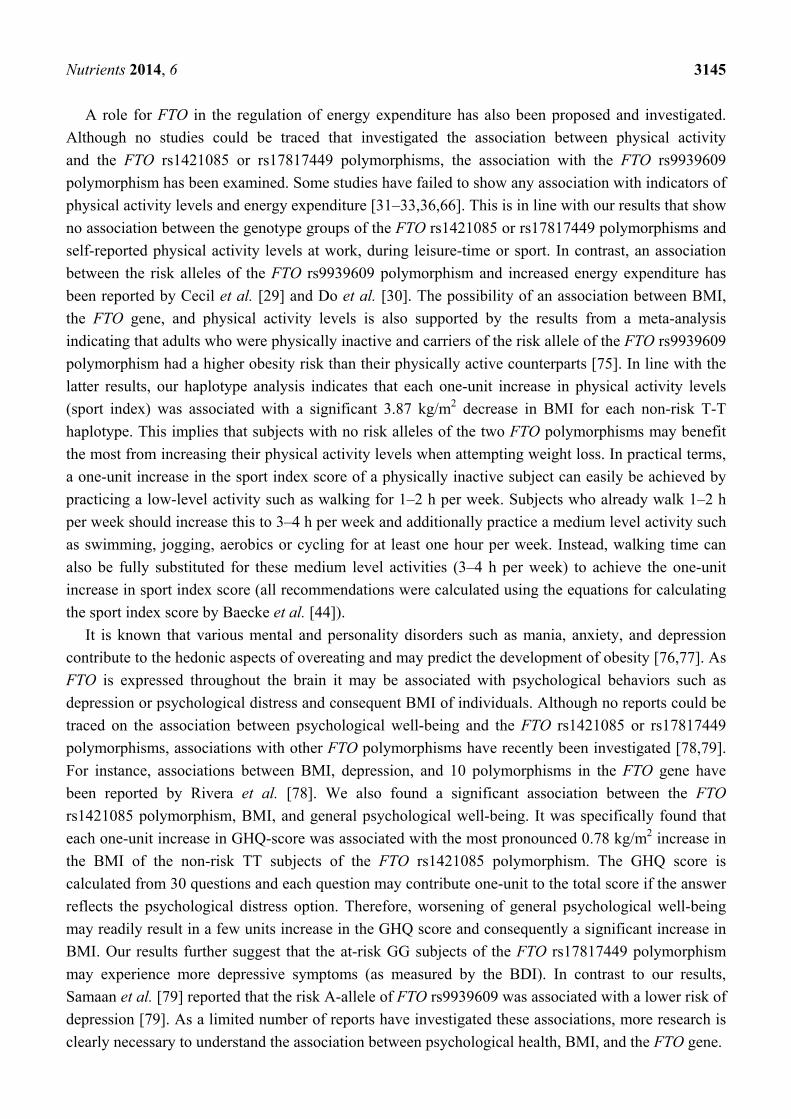
Nutrients 2014, 6 3145
A role for FTO in the regulation of energy expenditure has also been proposed and investigated.
Although no studies could be traced that investigated the association between physical activity
and the FTO rs1421085 or rs17817449 polymorphisms, the association with the FTO rs9939609
polymorphism has been examined. Some studies have failed to show any association with indicators of
physical activity levels and energy expenditure [31–33,36,66]. This is in line with our results that show
no association between the genotype groups of the FTO rs1421085 or rs17817449 polymorphisms and
self-reported physical activity levels at work, during leisure-time or sport. In contrast, an association
between the risk alleles of the FTO rs9939609 polymorphism and increased energy expenditure has
been reported by Cecil et al. [29] and Do et al. [30]. The possibility of an association between BMI,
the FTO gene, and physical activity levels is also supported by the results from a meta-analysis
indicating that adults who were physically inactive and carriers of the risk allele of the FTO rs9939609
polymorphism had a higher obesity risk than their physically active counterparts [75]. In line with the
latter results, our haplotype analysis indicates that each one-unit increase in physical activity levels
(sport index) was associated with a significant 3.87 kg/m2 decrease in BMI for each non-risk T-T
haplotype. This implies that subjects with no risk alleles of the two FTO polymorphisms may benefit
the most from increasing their physical activity levels when attempting weight loss. In practical terms,
a one-unit increase in the sport index score of a physically inactive subject can easily be achieved by
practicing a low-level activity such as walking for 1–2 h per week. Subjects who already walk 1–2 h
per week should increase this to 3–4 h per week and additionally practice a medium level activity such
as swimming, jogging, aerobics or cycling for at least one hour per week. Instead, walking time can
also be fully substituted for these medium level activities (3–4 h per week) to achieve the one-unit
increase in sport index score (all recommendations were calculated using the equations for calculating
the sport index score by Baecke et al. [44]).
It is known that various mental and personality disorders such as mania, anxiety, and depression
contribute to the hedonic aspects of overeating and may predict the development of obesity [76,77]. As
FTO is expressed throughout the brain it may be associated with psychological behaviors such as
depression or psychological distress and consequent BMI of individuals. Although no reports could be
traced on the association between psychological well-being and the FTO rs1421085 or rs17817449
polymorphisms, associations with other FTO polymorphisms have recently been investigated [78,79].
For instance, associations between BMI, depression, and 10 polymorphisms in the FTO gene have
been reported by Rivera et al. [78]. We also found a significant association between the FTO
rs1421085 polymorphism, BMI, and general psychological well-being. It was specifically found that
each one-unit increase in GHQ-score was associated with the most pronounced 0.78 kg/m2 increase in
the BMI of the non-risk TT subjects of the FTO rs1421085 polymorphism. The GHQ score is
calculated from 30 questions and each question may contribute one-unit to the total score if the answer
reflects the psychological distress option. Therefore, worsening of general psychological well-being
may readily result in a few units increase in the GHQ score and consequently a significant increase in
BMI. Our results further suggest that the at-risk GG subjects of the FTO rs17817449 polymorphism
may experience more depressive symptoms (as measured by the BDI). In contrast to our results,
Samaan et al. [79] reported that the risk A-allele of FTO rs9939609 was associated with a lower risk of
depression [79]. As a limited number of reports have investigated these associations, more research is
clearly necessary to understand the association between psychological health, BMI, and the FTO gene.

Nutrients 2014, 6 3146
This study is limited by the fact that most variables were self-reported, including physical activity,
dietary intake, eating behavior, and psychological health, which may not necessarily reflect the truth.
We aimed to improve the validity of these outcome measures by using instruments validated in similar
populations and checking the internal consistency reliability. Although content and face validity of the
food lists included in the FFQ were ensured, validation of the daily frequency of intake of items in the
four indicator food groups against another method, e.g., food records, is recommended. It is important
to note that the results of this study pertain to overweight/obese individuals only. This is reflected
by the genotype and allele frequencies of the two polymorphisms investigated in this sample, which
were in line with those previously reported for obese Caucasian populations [7,80,81]. Although the
sample did not include normal weight participants, the BMI range of included participants (27.0 kg/m2
to 57.6 kg/m2) supported the potential for investigation of associations between BMI, genotype
and lifestyle, eating behavior and psychological variables. The deviation found in HWE for the FTO
rs17817449 polymorphism also needs to be considered in the interpretation of the results for this
polymorphism. As genotyping errors can be excluded, we suggest that the fact that the sample is not
representative of a general population (did not include subjects with a BMI < 27) could explain the
HWE finding. As most obesity related polymorphisms are expected to have a small effect on obesity
development or weight loss outcomes, the sample size restricted statistical power of analyses. This
may have resulted in non-detection of possible associations.
5. Conclusions
The risk alleles of the FTO rs1421085 and rs17817449 polymorphisms may be associated with
poorer eating behaviors (reflected by higher hunger, internal locus for hunger, and emotional
disinhibition scores), a higher intake of high fat foods and refined starches and more depressive
symptoms in treatment seeking overweight/obese Caucasian adults. Furthermore, our modeled results
indicate that the interactions between the FTO polymorphisms or haplotypes and eating behavior,
psychological health and physical activity levels may be associated with BMI. A higher rigid control
and attitude to self-regulation score may decrease the BMI of the non-risk homozygotes of FTO
rs1421085, while an increase in psychological distress (increased GHQ score) may increase their BMI.
Furthermore, increased sport participation may result in a lower BMI in subjects with the non-risk
haplotype. These results may explain current findings that the risk alleles of both FTO polymorphisms
have consistently been associated with a higher BMI or obesity prevalence [7,9,30,38,80,81].
We recommend that the novel associations found in the current study should be viewed as “hypotheses
generating” and that they should be replicated and further investigated to establish the clinical
significance for implementation as part of weight management interventions.
Acknowledgments
The authors would like to thank the following people: Veronique Human, Nathaniel McGregor
and Jessica Vervalle for assistance in genotype analysis; Marelize Botes for assistance with data collection
and DNA extractions; Theo Nell for assistance with collection of anthropometric measurements
and blood samples. We would also like to thank the Medical Research Council of South Africa,

Nutrients 2014, 6 3147
Stellenbosch University and the University of Cape Town for funding as well as the Biostatistics unit
of the Medical Research Council of South Africa for statistical support.
Author Contributions
MS, JH and MJK designed the study; JH and MS supervised and conducted data collection; MGZ
and JH supervised and performed genotype analyses; JH captured and cleaned the data; JH and LM
performed statistical analyses; LM provided statistical expertise; JH wrote the paper; JH, MS, LM and
MJK critically revised the paper for important intellectual content; All authors read and approved the
final manuscript.
Conflicts of Interest
JH, LM and MS declare no conflict of interest. MGZ is the managing director of GENE diagnostics
that provides genetic testing, training, and research services. MJK is a director and shareholder of
Gknowmix (Pty) Ltd. that has developed a database tool for research translation under the auspices of
the Innovation Centre of the South African Medical Research Council.
References
1. World Health Organization. Diet, Nutrition and the Prevention of Chronic Diseases. Report for a
Joint Who/Fao Expert Consultation; WHO Technical Report Series, No. 916; WHO: Geneva,
Switzerland, 2003.
2. Obesity: Situation and Trends. Available online: http://www.who.int/gho/ncd/risk_factors/
obesity_text/en/index.html (accessed on 19 March 2014).
3. Marti, A.; Martinez-González, M.A.; Martinez, J.A. Interaction between genes and lifestyle
factors on obesity. Proc. Nutr. Soc. 2008, 67, 1–8.
4. Romao, I.; Roth, J. Genetic and environmental interactions in obesity and type 2 diabetes.
J. Am. Diet. Assoc. 2008, 108, S24–S28.
5. Larder, R.; Cheung, M.K.; Tung, Y.C.; Yeo, G.S.; Coll, A.P. Where to go with FTO?
Trends Endocrinol. Metab. 2011, 22, 53–59.
6. Speliotes, E.K.; Willer, C.J.; Berndt, S.I.; Monda, K.L.; Thorleifsson, G.; Jackson, A.U.;
Lango Allen, H.; Lindgren, C.M.; Luan, J.; Mägi, R.; et al. Association analyses of
249,796 individuals reveal 18 new loci associated with body mass index. Nat. Genet. 2010, 42,
937–948.
7. Dina, C.; Meyre, D.; Gallina, S.; Durand, E.; Körner, A.; Jacobson, P.; Carlsson, L.M.; Kiess, W.;
Vatin, V.; Lecoeur, C.; et al. Variation in FTO contributes to childhood obesity and severe adult
obesity. Nat. Genet. 2007, 39, 724–726.
8. Frayling, T.M.; Timpson, N.J.; Weedon, M.N.; Zeggini, E.; Freathy, R.M.; Lindgren, C.M.;
Perry, J.R.; Elliott, K.S.; Lango, H.; Rayner, N.W.; et al. A common variant in the FTO gene is
associated with body mass index and predisposes to childhood and adult obesity. Science 2007,
316, 889–894.

Nutrients 2014, 6 3148
9. Scuteri, A.; Sanna, S.; Chen, W.M.; Uda, M.; Albai, G.; Strait, J.; Najjar, S.; Nagaraja, R.; Orru, M.;
Usala, G.; et al. Genome-wide association scan shows genetic variants in the FTO gene are
associated with obesity-related traits. PLoS Genet. 2007, 3, e115.
10. Frayling, T.M.; Ong, K. Piecing together the FTO jigsaw. Genome Biol. 2011, 12, 104.
11. Gerken, T.; Girard, C.A.; Tung, Y.C.; Webby, C.J.; Saudek, V.; Hewitson, K.S.; Yeo, G.S.;
McDonough, M.A.; Cunliffe, S.; McNeill, L.A.; et al. The obesity-associated FTO gene encodes a
2-oxoglutarate-dependent nucleic acid demethylase. Science 2007, 318, 1469–1472.
12. Sanchez-Pulido, L.; Andrade-Navarro, M.A. The FTO (fat mass and obesity associated) gene
codes for a novel member of the non-heme dioxygenase superfamily. BMC Biochem. 2007, 8, 23.
13. Han, Z.; Niu, T.; Chang, J.; Lei, X.; Zhao, M.; Wang, Q.; Cheng, W.; Wang, J.; Feng, Y.; Chai, J.
Crystal structure of the FTO protein reveals basis for its substrate specificity. Nature 2010, 464,
1205–1209.
14. Fawcett, K.A.; Barroso, I. The genetics of obesity: FTO leads the way. Trends Genet. 2010, 26,
266–274.
15. Jia, G.; Yang, C.; Yang, S.; Jian, X.; Yi, C.; Zhou, Z.; He, C. Oxidative demethylation of
3-methylthymine and 3-methyluracil in single-stranded DNA and RNA by mouse and human
FTO. FEBS Lett. 2008, 582, 3313–3319.
16. Jia, G.; Fu, Y.; Zhao, X.; Dai, Q.; Zheng, G.; Yang, Y.; Yi, C.; Lindahl, T.; Pan, T.; Yang, YG.;
He, C. N6-methyladenosine in nuclear RNA is a major substrate of the obesity-associated FTO.
Chem. Biol. 2011, 7, 885–887.
17. Fredriksson, R.; Hägglund, M.; Olszewski, P.K.; Stephansson, O.; Jacobsson, J.A.; Olszewska,
A.M.; Levine, A.S.; Lindblom, J.; Schiöth, H.B. The obesity gene, FTO, is of ancient origin,
up-regulated during food deprivation and expressed in neurons of feeding-related nuclei of the
brain. Endocrinology 2008, 149, 2062–2071.
18. Stratigopoulos, G.; Padilla, S.L.; LeDuc, C.A.; Watson, E.; Hattersley, A.T.; McCarthy, M.I.;
Zeltser, L.M.; Chung, W.K.; Leibel, R.L. Regulation of Fto/Ftm gene expression in mice and
humans. Am. J. Physiol. Regul. Integr. Comp. Physiol. 2008, 294, R1185–R1196.
19. Tung, Y.C.; Ayuso, E.; Shan, X.; Bosch, F.; O’Rahilly, S.; Coll, A.P.; Yeo, G.S.
Hypothalamic-specific manipulation of Fto, the ortholog of the human obesity gene FTO, affects
food intake in rats. PLoS One 2010, 5, e8771.
20. Poritsanos, N.J.; Lew, P.S.; Fischer, J.; Mobbs, C.V.; Nagy, J.I.; Wong, D.; Rüther, U.; Mizuno, T.M.
Impaired hypothalamic Fto expression in response to fasting and glucose in obese mice.
Nutr. Diabetes 2011, 1, e19.
21. Wåhlén, K.; Sjölin, E.; Hoffstedt, J. The common rs9939609 gene variant of the fat mass- and
obesity-associated gene FTO is related to fat cell lipolysis. J. Lipid Res. 2008, 49, 607–611.
22. Zabena, C.; González-Sánchez, J.L.; Martínez-Larrad, M.T.; Torres-García, A.; Alvarez-Fernández-
Represa, J.; Corbatón-Anchuelo, A.; Pérez-Barba, M.; Serrano-Ríos, M. The FTO obesity gene.
Genotyping and gene expression analysis in morbidly obese patients. Obes. Surg. 2009, 19, 87–95.
23. Fischer, J.; Koch, L.; Emmerling, C.; Vierkotten, J.; Peters, T.; Brüning, J.C.; Rüther, U.
Inactivation of the Fto gene protects from obesity. Nature 2009, 458, 894–988.
24. Cheung, M.K.; Gulati, P.; O’Rahilly, S.; Yeo, G.S. FTO expression is regulated by availability of
essential amino acids. Int. J. Obes. 2013, 37, 744–747.

Nutrients 2014, 6 3149
25. Pitman, R.T.; Fong, J.T.; Billman, P.; Puri, N. Knockdown of the fat mass and obesity gene
disrupts cellular energy balance in a cell-type specific manner. PLoS One 2012, 7, e38444.
26. Church, C.; Moir, L.; McMurray, F.; Girard, C.; Banks, G.T.; Teboul, L.; Wells, S.; Brüning, J.C.;
Nolan, P.M.; Ashcroft, F.M.; et al. Overexpression of Fto leads to increased food intake and
results in obesity. Nat. Genet. 2010, 42, 1086–1092.
27. McMurray, F.; Church, C.D.; Larder, R.; Nicholson, G.; Wells, S.; Teboul, L.; Tung, Y.C.;
Rimmington, D.; Bosch, F.; Jimenez, V.; et al. Adult onset global loss of the Fto gene alters body
composition and metabolism in the mouse. PLoS Genet. 2013, 9, e1003166.
28. Gao, X.; Shin, Y.H.; Li, M.; Wang, F.; Tong, Q.; Zhang, P. The fat mass and obesity associated
gene FTO functions in the brain to regulate postnatal growth in mice. PLoS One 2010, 5, e14005.
29. Cecil, J.E.; Tavendale, R.; Watt, P.; Hetherington, M.M.; Palmer, C.N. An obesity-associated
FTO gene variant and increased energy intake in children. N. Engl. J. Med. 2008, 359, 2558–2566.
30. Do, R.; Bailey, S.D.; Desbiens, K.; Belisle, A.; Montpetit, A.; Bouchard, C.; Pérusse, L.;
Vohl, M.C.; Engert, J.C. Genetic variants of FTO influence adiposity, insulin sensitivity, leptin
levels, and resting metabolic rate in the Quebec Family Study. Diabetes 2008, 57, 1147–1150.
31. Berentzen, T.; Kring, S.I.; Holst, C.; Zimmermann, E.; Jess, T.; Hansen, T.; Pedersen, O.; Toubro, S.;
Astrup, A.; Sørensen, T.I. Lack of association of fatness-related FTO gene variants with energy
expenditure or physical activity. J. Clin. Endocrinol. Metab. 2008, 93, 2904–2908.
32. Speakman, J.R.; Rance, K.A.; Johnstone, A.M. Polymorphisms of the FTO gene are associated
with variation in energy intake, but not energy expenditure. Obesity 2008, 16, 1961–1965.
33. Hakanen, M.; Raitakari, O.T.; Lehtimäki, T.; Peltonen, N.; Pahkala, K.; Sillanmäki, L.; Lagström, H.;
Viikari, J.; Simell, O.; Rönnemaa, T. FTO genotype is associated with body mass index
after the age of seven years but not with energy intake or leisure-time physical activity.
J. Clin. Endocrinol. Metab. 2009, 94, 1281–1287.
34. Haupt, A.; Thamer, C.; Staiger, H.; Tschritter, O.; Kirchhoff, K.; Machicao, F.; Häring, H.U.;
Stefan, N.; Fritsche, A. Variation in the FTO gene influences food intake but not energy
expenditure. Exp. Clin. Endocrinol. Diabetes 2009, 117, 194–197.
35. Tanofsky-Kraff, M.; Han, J.C.; Anandalingam, K.; Shomaker, L.B.; Columbo, K.M.; Wolkoff, L.E.;
Kozlosky, M.; Elliott, C.; Ranzenhofer, L.M.; Roza, C.A.; et al. The FTO gene rs9939609
obesity-risk allele and loss of control over eating. Am. J. Clin. Nutr. 2009, 90, 1483–1488.
36. Wardle, J.; Llewellyn, C.; Sanderson, S.; Plomin, R. The FTO gene and measured food intake in
children. Int. J. Obes. 2009, 33, 42–45.
37. McCaffery, J.M.; Papandonatos, G.D.; Peter, I.; Huggins, G.S.; Raynor, H.A.; Delahanty, L.M.;
Cheskin, L.J.; Balasubramanyam, A.; Wagenknecht, L.E.; Wing, R.R. et al. Obesity susceptibility
loci and dietary intake in the Look AHEAD Trial. Am. J. Clin. Nutr. 2012, 95, 1477–1486.
38. Stutzmann, F.; Cauchi, S.; Durand, E.; Calvacanti-Proença, C.; Pigeyre, M.; Hartikainen, A.L.;
Sovio, U.; Tichet, J.; Marre, M.; Weill, J.; et al. Common genetic variation near MC4R is
associated with eating behavior patterns in European populations. Int. J. Obes. 2009, 33, 373–378.
39. Miller, S.A.; Dykes, D.D.; Polesky, H.F. A simple salting out procedure for extracting DNA from
human nucleated cells. Nucleic Acids Res. 1988, 16, 1215.
40. Norton, K.; Olds, T. Anthropometrica: A Textbook of Body Measurement for Sports and Health
Courses; UNSW: Sydney, Australia, 1996; pp. 35–37.

Nutrients 2014, 6 3150
41. Albanes, D.; Conway, J.M.; Taylor, P.R.; Moe, P.W.; Judd, J. Validation and comparison of
eight physical activity questionnaires. Epidemiology 1990, 1, 65–71.
42. Miller, D.J.; Freedson, P.S.; Kline, G.M. Comparison of activity levels using the Caltrac
accelerometer and five questionnaires. Med. Sci. Sports Exerc. 1994, 26, 376–382.
43. Richardson, M.T.; Ainsworth, B.E.; Wu, H.; Jacobs, D.R.; Leon, A.S. Ability of the
atherosclerosis risk in communities (ARIC)/Baecke questionnaire to assess leisure-time physical
activity. Int. J. Epidemiol. 1995, 24, 685–693.
44. Baecke, J.A.H.; Burema, J.; Frijters, J.E.R. A short questionnaire for the measurement of habitual
physical activity in epidemiological studies. Am. J. Clin. Nutr. 1982, 36, 936–942.
45. Steyn, N.P.; Senekal, M. A Guide for the Use of the Dietary Assessment and Education Kit
(DAEK); Medical Research Council: Cape Town, South Africa, 2005.
46. Laessle, R.G.; Tuschl, R.J.; Kotthaus, B.C.; Pirke, K.M. A comparison of the validity of
three scales for the assessment of dietary restraint. J. Abnorm. Psychol. 1989, 98, 504–507.
47. Provencher, V.; Drapeau, V.; Tremblay, A.; Després, J.P.; Lemieux, S. Eating behaviors and
indexes of body composition in men and women from the Québec Family Study. Obes. Res. 2003,
11, 783–792.
48. Stunkard, A.J.; Messick, S. The three-factor eating questionnaire to measure dietary restraint,
disinhibition and hunger. J. Psychosom. Res. 1985, 29, 71–83.
49. Westenhoefer, J.; Stunkard, A.J.; Pudel, V. Validation of the flexible and rigid control dimensions
of dietary restraint. Int. J. Eat. Disord. 1999, 26, 53–64.
50. Bond, M.J.; McDowell, A.J.; Wilkinson, J.Y. The measurement of dietary restraint, disinhibition
and hunger: An examination of the factor structure of the Three Factor Eating Questionnaire
(TFEQ). Int. J. Obes. 2001, 25, 900–906.
51. Bas, M.; Donmez, S. Self-efficacy and restrained eating in relation to weight loss among
overweight men and women in Turkey. Appetite 2009, 52, 209–216.
52. Chaput, J.P.; Leblanc, C.; Perusse, L.; Despres, J.P.; Bouchard, C.; Tremblay, A. Risk factors for
adult overweight and obesity in the Quebec Family Study: Have we been barking up the wrong
tree? Obesity 2009, 17, 1964–1970.
53. Beck, A.T.; Steer, R.A. Manual for the Beck Depression Inventory; The Psychological
Corporation: San Antonio, TX, USA, 1987.
54. Beck, A.T.; Steer, R.A.; Brown, G.K. BDI-II Manual; The Psychological Corporation:
San Antonio, TX, USA, 1996.
55. Goldberg, D.P. The Detection of Psychiatric Illness by Questionnaire; Oxford University Press:
London, UK, 1972.
56. Goldberg, D.P.; Rickels, K.; Downing, R.; Hesbacher, P. A comparison of two psychiatric
screening tests. Br. J. Psychiatry 1976, 129, 61–67.
57. Banks, M.H. Validation of the General Health Questionnaire in a young community sample.
Psychol. Med. 1983, 13, 349–353.
58. Lorr, M.; Wunderlich, R.A. Two objective measures of self-esteem. J. Pers. Assess. 1986, 50,
18–23.
59. Reynolds, W.M. Measurement of academic self-concept in college students. J. Pers. Assess. 1988,
52, 223–240.

Nutrients 2014, 6 3151
60. Rosenberg, M. Society and the Adolescent Self-Image; Princeton University Press: Princeton, NJ,
USA, 1965.
61. R: A Language and Environment for Statistical Computing. R Foundation for Statistical Computing,
Vienna, Austria. Available online: http://www.R-project.org/ (accessed on 18 July 2014).
62. Andersson, U.; McKean-Cowdin, R.; Hjalmars, U.; Malmer, B. Genetic variants in association
studies-review of strengths and weaknesses in study design and current knowledge of impact on
cancer risk. Acta Oncol. 2009, 48, 948–954.
63. Nyholt, D.R. A simple correction for multiple testing for single-nucleotide polymorphisms in
linkage disequilibrium with each other. Am. J. Hum. Genet. 2004, 74, 765–769.
64. Perneger, T.V. What’s wrong with Bonferroni adjustments. BMJ 1998, 316, 1236–1238.
65. Wardle, J.; Carnell, S.; Haworth, C.M.; Farooqi, I.S.; O’Rahilly, S.; Plomin, R. Obesity associated
genetic variation in FTO is associated with diminished satiety. J. Clin. Endocrinol. Metab. 2008,
93, 3640–3643.
66. Liu, G.; Zhu, H.; Lagou, V.; Gutin, B.; Stallmann-Jorgensen, I.S.; Treiber, F.A.; Dong, Y.;
Snieder, H. FTO variant rs9939609 is associated with body mass index and waist circumference,
but not with energy intake or physical activity in European- and African-American youth.
BMC Med. Genet. 2010, 11, 57.
67. Sonestedt, E.; Roos, C.; Gullberg, B.; Ericson, U.; Wirfält, E.; Orho-Melander, M. Fat and
carbohydrate intake modify the association between genetic variation in the FTO genotype and
obesity. Am. J. Clin. Nutr. 2009, 90, 1418–1425.
68. Hainer, V.; Kunesova, M.; Bellisle, F.; Parizkova, J.; Braunerova, R.; Wagenknecht, M.; Lajka, J.;
Hill, M.; Stunkard, A. The Eating Inventory, body adiposity and prevalence of diseases in a quota
sample of Czech adults. Int. J. Obes. 2006, 30, 830–836.
69. Rideout, C.A.; Barr, S.I. “Restrained eating” vs. “trying to lose weight”: How are they associated
with body weight and tendency to overeat among postmenopausal women? J. Am. Diet. Assoc.
2009, 109, 890–893.
70. Savage, J.S.; Hoffman, L.; Birch, L.L. Dieting, restraint, and disinhibition predict women’s
weight change over 6 y. Am. J. Clin. Nutr. 2009, 90, 33–40.
71. Foster, G.D.; Wadden, T.A.; Swain, R.M.; Stunkard, A.J.; Platte, P.; Vogt, R.A. The eating
inventory in obese women: Clinical correlates and relationship to weight loss. Int. J. Obes. 1998,
22, 778–785.
72. Vogels, N.; Diepvens, K.; Westerterp-Plantenga, M. Predictors of long-term weight maintenance.
Obes. Res. 2005, 13, 2162–2168.
73. Hill, J.O.; Wyatt, H.R.; Reed, G.W.; Peters, J.C. Obesity and the environment: Where do we go
from here? Science 2003, 299, 853–855.
74. Bryant, E.J.; King, N.A.; Blundell, J.E. Disinhibition: Its effects on appetite and weight
regulation. Obes. Rev. 2008, 9, 409–419.
75. Kilpeläinen, T.O.; Qi, L.; Brage, S.; Sharp, S.J.; Sonestedt, E.; Demerath, E.; Ahmad, T.; Mora,
S.; Kaakinen, M.; Sandholt, C.H.; et al. Physical activity attenuates the influence of FTO variants
on obesity risk: A meta-analysis of 218,166 adults and 19,268 children. PLoS Med. 2011,
8, e1001116.

Nutrients 2014, 6 3152
76. Ahlberg, A.C.; Ljung, T.; Rosmond, R.; McEwen, B.; Holm, G.; Akesson, H.O.; Björntorp, P.
Depression and anxiety symptoms in relation to anthropometry and metabolism in men.
Psychiatry Res. 2002, 112, 101–110.
77. Davis, C. Psychobiological traits in the risk profile for overeating and weight gain. Int. J. Obes.
2009, 33 (Suppl. 2), S49–S53.
78. Rivera, M.; Cohen-Woods, S.; Kapur, K.; Breen, G.; Ng, M.Y.; Butler, A.W.; Craddock, N.; Gill, M.;
Korszun, A.; Maier, W.; et al. Depressive disorder moderates the effect of the FTO gene on body
mass index. Mol. Psychiatry 2012, 17, 604–611.
79. Samaan, Z.; Anand, S.; Zhang, X.; Desai, D.; Rivera, M.; Pare, G.; Thabane, L.; Xie, C.; Gerstein, H.;
Engert, J.C.; et al. The protective effect of the obesity-associated rs9939609A variant in fat mass
and obesity associated gene on depression. Mol. Psychiatry 2012, 18, 1281.
80. Peeters, A.; Beckers, S.; Verrijken, A.; Roevens, P.; Peeters, P.; van Gaal, L.; van Hul, W.
Variants in the FTO gene are associated with common obesity in the Belgian population.
Mol. Genet. Metab. 2008, 93, 481–484.
81. Price, R.A.; Li, W.D.; Zhao, H. FTO gene SNPs associated with extreme obesity in cases,
controls and extremely discordant sister pairs. BMC Med. Genet. 2008, 9, 4.
© 2014 by the authors; licensee MDPI, Basel, Switzerland. This article is an open access article
distributed under the terms and conditions of the Creative Commons Attribution license
(http://creativecommons.org/licenses/by/3.0/).