A negative carbon isotope anomaly associated with the earliest Lopingian (Late Permian) mass...
9
A negative carbon isotope anomaly associated with the earliest Lopingian (Late Permian) mass extinction Kunio Kaiho a, * , Zhong-Qiang Chen b , Tomoyuki Ohashi a , Tetsuya Arinobu c , Ken Sawada d , Benjamin S. Cramer a a Institute of Geology and Paleontology, Tohoku University, Sendai 980-8578, Japan b School of Earth and Geographical Sciences, The University of Western Australia, Crawley, WA 3009, Australia c Department of Legal Medicine, Aichi Medical University School of Medicine, Aichi 480-1195, Japan d Division of Earth and Planetary Sciences, Hokkaido University, Sapporo 060-0810, Japan Received 15 September 2004; received in revised form 24 March 2005; accepted 31 March 2005 Abstract Palaeozoic life was severely affected in a pair of mass extinction events at the beginning (earliest Lopingian, 260 million years ago) and the end (251 million years ago) of the Late Permian. However, the biological and geochemical record of the earliest Lopingian crisis remains poorly constrained. We present analyses of strata in South China showing that a negative anomaly of stable carbon isotope ratios accompanied an abrupt extinction of marine faunas at the beginning of the Late Permian, similar to patterns observed at the end-Permian and the end-Cretaceous (65 million years ago) extinction events. D 2005 Published by Elsevier B.V. Keywords: Mass extinctions; Permian; C-13/C-12; China 1. Introduction As the most profound crisis in the history of earth’s biota, the end-Permian mass extinction triggered the most widespread reorganization of ecosystems and animal diversity in the past 500 million years and is largely responsible for much of the structure of marine ecosystems today (Bowring et al., 1999). However, such severe losses among Palaeozoic biota may in fact have resulted from two extinctions during the Late Permian (Stanley and Yang, 1994; Jin et al., 1994). While extensive research has resulted in multidiscipli- narily evidence documenting the end-Permian crisis (e.g., Erwin, 1993; Bowring et al., 1998; Jin et al., 2000; Becker et al., 2001; Kaiho et al., 2001), another mass mortality taking place in the earliest Lopingian, ~9 million years earlier than the end-Permian event, has received far less attention. The earliest Lopingian 0031-0182/$ - see front matter D 2005 Published by Elsevier B.V. doi:10.1016/j.palaeo.2005.04.013 * Corresponding author. E-mail address: [email protected] (K. Kaiho). Palaeogeography, Palaeoclimatology, Palaeoecology 223 (2005) 172– 180 www.elsevier.com/locate/palaeo
-
Upload
independent -
Category
Documents
-
view
1 -
download
0
Transcript of A negative carbon isotope anomaly associated with the earliest Lopingian (Late Permian) mass...

www.elsevier.com/locate/palaeo
Palaeogeography, Palaeoclimatology, P
A negative carbon isotope anomaly associated with the earliest
Lopingian (Late Permian) mass extinction
Kunio Kaihoa,*, Zhong-Qiang Chenb, Tomoyuki Ohashia, Tetsuya Arinobuc,
Ken Sawadad, Benjamin S. Cramera
aInstitute of Geology and Paleontology, Tohoku University, Sendai 980-8578, JapanbSchool of Earth and Geographical Sciences, The University of Western Australia, Crawley, WA 3009, Australia
cDepartment of Legal Medicine, Aichi Medical University School of Medicine, Aichi 480-1195, JapandDivision of Earth and Planetary Sciences, Hokkaido University, Sapporo 060-0810, Japan
Received 15 September 2004; received in revised form 24 March 2005; accepted 31 March 2005
Abstract
Palaeozoic life was severely affected in a pair of mass extinction events at the beginning (earliest Lopingian, 260
million years ago) and the end (251 million years ago) of the Late Permian. However, the biological and geochemical
record of the earliest Lopingian crisis remains poorly constrained. We present analyses of strata in South China showing
that a negative anomaly of stable carbon isotope ratios accompanied an abrupt extinction of marine faunas at the beginning
of the Late Permian, similar to patterns observed at the end-Permian and the end-Cretaceous (65 million years ago)
extinction events.
D 2005 Published by Elsevier B.V.
Keywords: Mass extinctions; Permian; C-13/C-12; China
1. Introduction
As the most profound crisis in the history of earth’s
biota, the end-Permian mass extinction triggered the
most widespread reorganization of ecosystems and
animal diversity in the past 500 million years and is
largely responsible for much of the structure of marine
0031-0182/$ - see front matter D 2005 Published by Elsevier B.V.
doi:10.1016/j.palaeo.2005.04.013
* Corresponding author.
E-mail address: [email protected] (K. Kaiho).
ecosystems today (Bowring et al., 1999). However,
such severe losses among Palaeozoic biota may in fact
have resulted from two extinctions during the Late
Permian (Stanley and Yang, 1994; Jin et al., 1994).
While extensive research has resulted in multidiscipli-
narily evidence documenting the end-Permian crisis
(e.g., Erwin, 1993; Bowring et al., 1998; Jin et al.,
2000; Becker et al., 2001; Kaiho et al., 2001), another
mass mortality taking place in the earliest Lopingian,
~9 million years earlier than the end-Permian event,
has received far less attention. The earliest Lopingian
alaeoecology 223 (2005) 172–180
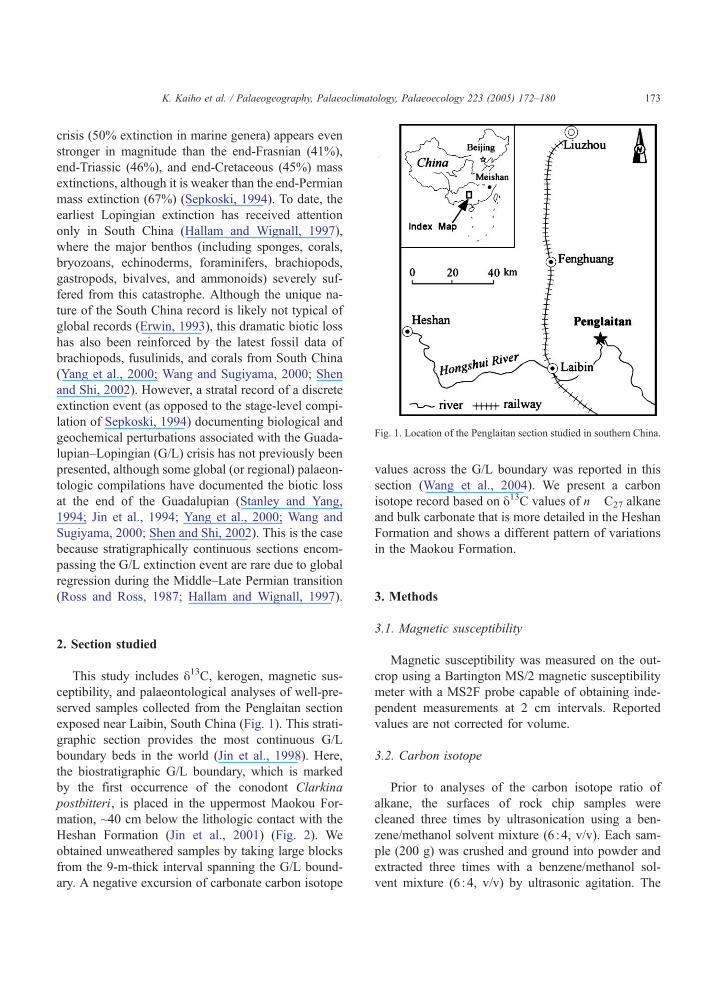
Fig. 1. Location of the Penglaitan section studied in southern China
K. Kaiho et al. / Palaeogeography, Palaeoclimatology, Palaeoecology 223 (2005) 172–180 173
crisis (50% extinction in marine genera) appears even
stronger in magnitude than the end-Frasnian (41%),
end-Triassic (46%), and end-Cretaceous (45%) mass
extinctions, although it is weaker than the end-Permian
mass extinction (67%) (Sepkoski, 1994). To date, the
earliest Lopingian extinction has received attention
only in South China (Hallam and Wignall, 1997),
where the major benthos (including sponges, corals,
bryozoans, echinoderms, foraminifers, brachiopods,
gastropods, bivalves, and ammonoids) severely suf-
fered from this catastrophe. Although the unique na-
ture of the South China record is likely not typical of
global records (Erwin, 1993), this dramatic biotic loss
has also been reinforced by the latest fossil data of
brachiopods, fusulinids, and corals from South China
(Yang et al., 2000; Wang and Sugiyama, 2000; Shen
and Shi, 2002). However, a stratal record of a discrete
extinction event (as opposed to the stage-level compi-
lation of Sepkoski, 1994) documenting biological and
geochemical perturbations associated with the Guada-
lupian–Lopingian (G/L) crisis has not previously been
presented, although some global (or regional) palaeon-
tologic compilations have documented the biotic loss
at the end of the Guadalupian (Stanley and Yang,
1994; Jin et al., 1994; Yang et al., 2000; Wang and
Sugiyama, 2000; Shen and Shi, 2002). This is the case
because stratigraphically continuous sections encom-
passing the G/L extinction event are rare due to global
regression during the Middle–Late Permian transition
(Ross and Ross, 1987; Hallam and Wignall, 1997).
2. Section studied
This study includes y13C, kerogen, magnetic sus-
ceptibility, and palaeontological analyses of well-pre-
served samples collected from the Penglaitan section
exposed near Laibin, South China (Fig. 1). This strati-
graphic section provides the most continuous G/L
boundary beds in the world (Jin et al., 1998). Here,
the biostratigraphic G/L boundary, which is marked
by the first occurrence of the conodont Clarkina
postbitteri, is placed in the uppermost Maokou For-
mation, ~40 cm below the lithologic contact with the
Heshan Formation (Jin et al., 2001) (Fig. 2). We
obtained unweathered samples by taking large blocks
from the 9-m-thick interval spanning the G/L bound-
ary. A negative excursion of carbonate carbon isotope
.
values across the G/L boundary was reported in this
section (Wang et al., 2004). We present a carbon
isotope record based on y13C values of n�C27 alkane
and bulk carbonate that is more detailed in the Heshan
Formation and shows a different pattern of variations
in the Maokou Formation.
3. Methods
3.1. Magnetic susceptibility
Magnetic susceptibility was measured on the out-
crop using a Bartington MS/2 magnetic susceptibility
meter with a MS2F probe capable of obtaining inde-
pendent measurements at 2 cm intervals. Reported
values are not corrected for volume.
3.2. Carbon isotope
Prior to analyses of the carbon isotope ratio of
alkane, the surfaces of rock chip samples were
cleaned three times by ultrasonication using a ben-
zene/methanol solvent mixture (6 :4, v/v). Each sam-
ple (200 g) was crushed and ground into powder and
extracted three times with a benzene/methanol sol-
vent mixture (6 :4, v/v) by ultrasonic agitation. The
-1
-2
-3
-4
5
4
2
1
0
3
Up
pe
r P
erm
ian
Gu
ad
alu
pia
nLo
ping
ian
Mao
kou
Hes
han
Thi
ckne
ss (
m)
Pen
glai
tan
Sec
tion
Ser
ies
For
mat
ion
Crinoid limestone Limestone
Limestone nodule
Marl
Muddy limestone nodule
Benthic fossil fragments (%)
Dec
reas
e in
ben
thic
foss
il fr
agm
ents
Last
occ
urre
nce
ofG
uada
lupi
an ta
xa
-29 -27
13C27 n-alkane (‰)
3 4 513C carbonate
(‰)
-28
Siliceous mudstone
30
Bed
num
ber
B
12
0
29
21
7
14
2019
18
22232425
-1
-2
-4
-5
-7
-6
-8
Tuff
-9-10-11
-13
-14
-16
-19
Sta
ge
Bed
num
ber
A
6
5
4
3c
k
k
a
e
aMid
dle
P
erm
ian
Clay
20 40 60 80 40 80
Marine kerogens (%)
-26 -18-22
13C organic (‰)
Sponge
BrachiopodaCrinoid
Coral
Gastropoda
Foraminifera
Bryozoa
Total of benthic fossils
δ δ
δ
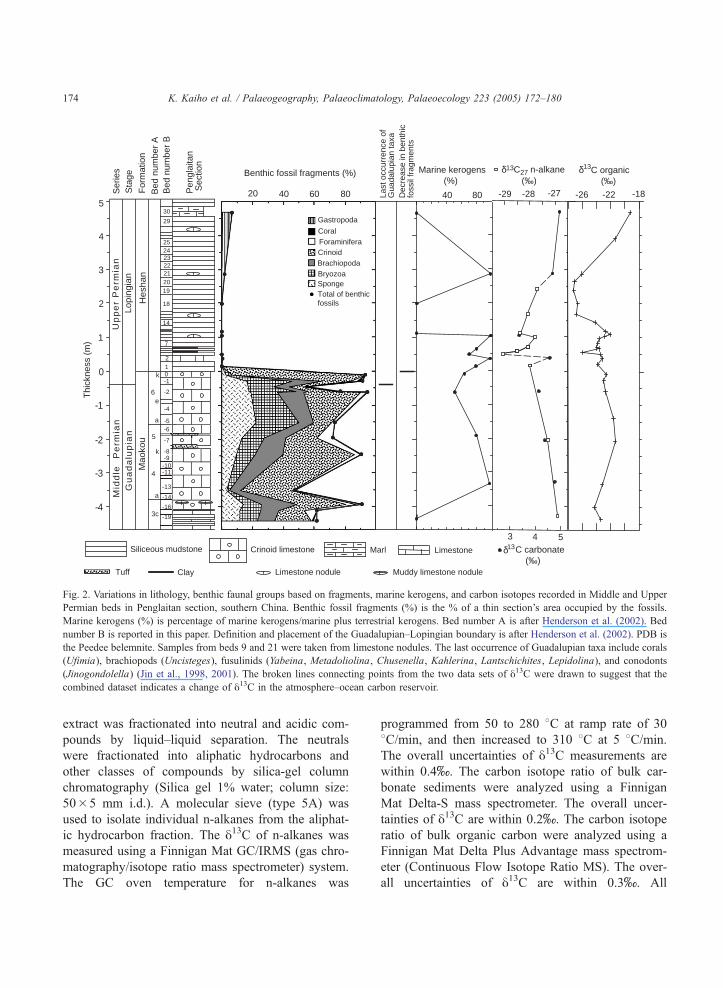
Fig. 2. Variations in lithology, benthic faunal groups based on fragments, marine kerogens, and carbon isotopes recorded in Middle and Upper
Permian beds in Penglaitan section, southern China. Benthic fossil fragments (%) is the % of a thin section’s area occupied by the fossils.
Marine kerogens (%) is percentage of marine kerogens/marine plus terrestrial kerogens. Bed number A is after Henderson et al. (2002). Bed
number B is reported in this paper. Definition and placement of the Guadalupian–Lopingian boundary is after Henderson et al. (2002). PDB is
the Peedee belemnite. Samples from beds 9 and 21 were taken from limestone nodules. The last occurrence of Guadalupian taxa include corals
(Ufimia), brachiopods (Uncisteges), fusulinids (Yabeina, Metadoliolina, Chusenella, Kahlerina, Lantschichites, Lepidolina), and conodonts
(Jinogondolella) (Jin et al., 1998, 2001). The broken lines connecting points from the two data sets of y13C were drawn to suggest that the
combined dataset indicates a change of y13C in the atmosphere–ocean carbon reservoir.
K. Kaiho et al. / Palaeogeography, Palaeoclimatology, Palaeoecology 223 (2005) 172–180174
extract was fractionated into neutral and acidic com-
pounds by liquid–liquid separation. The neutrals
were fractionated into aliphatic hydrocarbons and
other classes of compounds by silica-gel column
chromatography (Silica gel 1% water; column size:
50�5 mm i.d.). A molecular sieve (type 5A) was
used to isolate individual n-alkanes from the aliphat-
ic hydrocarbon fraction. The y13C of n-alkanes was
measured using a Finnigan Mat GC/IRMS (gas chro-
matography/isotope ratio mass spectrometer) system.
The GC oven temperature for n-alkanes was
programmed from 50 to 280 8C at ramp rate of 30
8C/min, and then increased to 310 8C at 5 8C/min.
The overall uncertainties of y13C measurements are
within 0.4x. The carbon isotope ratio of bulk car-
bonate sediments were analyzed using a Finnigan
Mat Delta-S mass spectrometer. The overall uncer-
tainties of y13C are within 0.2x. The carbon isotope
ratio of bulk organic carbon were analyzed using a
Finnigan Mat Delta Plus Advantage mass spectrom-
eter (Continuous Flow Isotope Ratio MS). The over-
all uncertainties of y13C are within 0.3x. All
K. Kaiho et al. / Palaeogeography, Palaeoclimatology, Palaeoecology 223 (2005) 172–180 175
isotopic values are reported relative to the Peedee
belemnite (PDB) standard.
3.3. Fossil
The quantitative point count data (Fig. 2) are
based on detailed sample sections focusing on the
microfacies and palaeontology of the G–L boundary
beds in Laibin. The point-counting data from each
thin-section are based on observation of 20 to 50
views in one sample. Percentages of various skeletal
components, micrite, silica and cavities were com-
bined to yield the mean abundance of each compo-
nent for the sample.
3.4. Kerogen
Whole rock samples were crushed to a fine powder
in an agate mortar. Powdered rock samples (5 to 10 g)
were treated sequentially within water bath shaker as
follows: HCl 6 M (100 ml, 60 8C, 12 h), HCl 12 M/
HF 46% (1 /1 v/v) (100 ml, 60 8C, and 24 h), HCl 6 M(100 ml, 60 8C, 4 h). After each treatment, the super-
natant was removed after centrifugation (3000 rpm, 10
min). The residue, kerogen, was sequentially washed
with HCl 6 M (�2) and distilled water (�5), and was
recovered and freeze-dried under vacuum.
Wet residual particles obtained after HCl/HF
treatment were siphoned and dropped to slides,
and were mounted in permanent slides for micro-
scopic examination. Three hundred particles of ker-
ogen macerals were point counted per slide under
transmitted light microscope. Fluorescence light mi-
croscopic observation was used to differentiate be-
tween marine-derived and terrestrially derived
amorphous kerogens since the former tends to fluo-
resce significantly (Sawada and Akiyama, 1994).
However, this method should be used with caution,
because the terrigenous amorphous kerogen formed
by the advanced degradation of herbaceous macerals,
such as sporinite and cutinite, might fluoresce (Smith,
1984; Oboh-Ikuenobe et al., 1997) and mature amor-
phous kerogen does not fluoresce even when derived
from marine organisms. Therefore, we examined the
identification of amorphous kerogens on the basis of
both the fluorescence and the morphology under
transmitted light microscope as reported by Boussafir
et al. (1995).
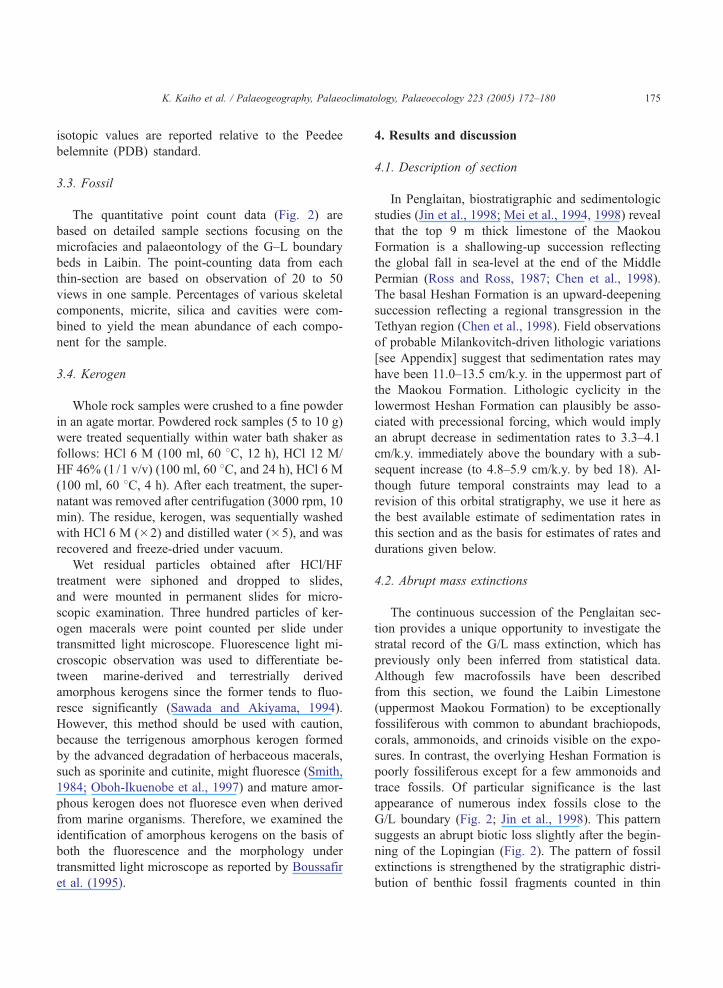
4. Results and discussion
4.1. Description of section
In Penglaitan, biostratigraphic and sedimentologic
studies (Jin et al., 1998; Mei et al., 1994, 1998) reveal
that the top 9 m thick limestone of the Maokou
Formation is a shallowing-up succession reflecting
the global fall in sea-level at the end of the Middle
Permian (Ross and Ross, 1987; Chen et al., 1998).
The basal Heshan Formation is an upward-deepening
succession reflecting a regional transgression in the
Tethyan region (Chen et al., 1998). Field observations
of probable Milankovitch-driven lithologic variations
[see Appendix] suggest that sedimentation rates may
have been 11.0–13.5 cm/k.y. in the uppermost part of
the Maokou Formation. Lithologic cyclicity in the
lowermost Heshan Formation can plausibly be asso-
ciated with precessional forcing, which would imply
an abrupt decrease in sedimentation rates to 3.3–4.1
cm/k.y. immediately above the boundary with a sub-
sequent increase (to 4.8–5.9 cm/k.y. by bed 18). Al-
though future temporal constraints may lead to a
revision of this orbital stratigraphy, we use it here as
the best available estimate of sedimentation rates in
this section and as the basis for estimates of rates and
durations given below.
4.2. Abrupt mass extinctions
The continuous succession of the Penglaitan sec-
tion provides a unique opportunity to investigate the
stratal record of the G/L mass extinction, which has
previously only been inferred from statistical data.
Although few macrofossils have been described
from this section, we found the Laibin Limestone
(uppermost Maokou Formation) to be exceptionally
fossiliferous with common to abundant brachiopods,
corals, ammonoids, and crinoids visible on the expo-
sures. In contrast, the overlying Heshan Formation is
poorly fossiliferous except for a few ammonoids and
trace fossils. Of particular significance is the last
appearance of numerous index fossils close to the
G/L boundary (Fig. 2; Jin et al., 1998). This pattern
suggests an abrupt biotic loss slightly after the begin-
ning of the Lopingian (Fig. 2). The pattern of fossil
extinctions is strengthened by the stratigraphic distri-
bution of benthic fossil fragments counted in thin
K. Kaiho et al. / Palaeogeography, Palaeoclimatology, Palaeoecology 223 (2005) 172–180176
sections (Fig. 2). We found that the abundance of
fossil fragments of sponges, bryozoans, brachiopods,
crinoids, foraminifers, corals, and gastropods de-
creased from 86% to 0% in the 18 cm interval across
the Maokou/Heshan Formation (Fig. 2). These data
suggest that a mass extinction occurred within a short
temporal duration corresponding to the uppermost 18
cm of the Maokou Formation (~1.5 k.y.; our estimate
of such a short duration is obviously subject to large
error but is probably correct within a factor of 10), in
the lowermost Lopingian.
Because the rapid decrease in fossil diversity cor-
responds to a lithologic transition from limestone
(Maokou Formation) to siliceous mudstone (Heshan
Formation), it is appropriate to consider the possibility
that the apparent extinction may simply reflect a local
facies shift. Our analyses of kerogens indicate that the
percentage of marine kerogens/marine plus terrestrial
kerogens does not change significantly across the
extinction boundary (Fig. 2; 62 to 78% in beds 0
and 1 and 50 to 98% between beds �13 and 9).
This implies that the rapid decrease in fossils occurred
without any significant change in the proportion of
marine vs terrestrial kerogens. It is therefore unlikely
that the disappearance of calcareous fossils at the top
of the Maokou Formation was due to an increase in
the input of terrestrial material associated with the
facies shift. Instead, the extinction of calcareous
biota and the associated environmental perturbation
most likely caused the lithologic change from lime-
stone to mudstone, similar to facies changes often
observed in records of the end Permian and K/T
boundary events. We conclude that the sharp decline
in biotic abundance and diversity in the Penglaitan
section most likely signals the G/L boundary mass
extinction previously inferred from statistic palaeon-
tologic data.
4.3. Negative shift of carbon isotope values
Carbon isotope ratios of long-chain n-alkane
(C26–C30), which are derived from terrestrial higher
plant wax, do not vary with maturity (Ishiwatari et
al., 1999). Therefore, y13C variations of long-chain
n-alkane remaining in older sediments represent ma-
terial derived from terrestrial higher plant wax. We
measured the y13C of higher molecular weight
n�C27 alkane, and the range of y13C variation
was approximately �29x to �27x (Fig. 2), similar
to y13C of terrestrial higher plants. The y13C of bulk
organic carbon shows a much larger range between
approximately �27x to �19x (Fig. 2), which we
take to be due to variations in the ratio of marine and
terrestrial organic carbon content superimposed on
variations in the y13C of atmospheric CO2. The y13Cvalues of n�C27 alkane are lower than those of bulk
organic carbon, which supports the interpretation of
y13C values of n�C27 alkane as representing mate-
rial derived from terrestrial higher plants. For our
interpretation, we have assumed that the y13C shift
for the n�C27 alkane is a direct reflection of a shift
in y13C values of atmospheric CO2 (Arinobu et al.,
1999).
A 1.1x negative shift in y13C values of n�C27
alkane occurred between beds 1 and 3 (bed number in
the Penglaitan Section) (Fig. 2). Values of y13C grad-
ually decrease by 1.1x from �26.9x to �28.0x in
the top 4 m of the Maokou Formation; followed by an
abrupt 1.1x decrease to �29.1x in the basal part (50
cm) of the Heshan Formation. Values then gradually
return by 1.5x to �27.7x at 2 m above the mini-
mum value. Although carbon isotope ratios of marine
bulk carbonate are sporadic in the basal 2 m of the
Heshan Formation, the y13C of marine bulk carbonate
shows mostly synchronized changes with that of
n�C27 alkane ranging between 3.2x and 4.8x(Fig. 2).
The y13C values of n�C27 alkane and those of
carbonate represent the y13C of the global surface
reservoir (atmosphere, surface ocean, and biota).
The compilation of both data sets (Fig. 2) indicates
that an abrupt negative excursion of ~2x occurred
between beds 2 and 3, some 46 cm (11–14 k.y.) above
the decrease in benthic fossil fragments. The rapidity
of the 2x decrease in y13C values, which occurred
between two samples, cannot be resolved in our re-
cord and likely occurred in ~1 k.y. or less. The
recovery occurred within 2 precession cycles (34–42
k.y.) following the minimum value (This follows the
description in the paragraphs above, indicating the
return to pre-excursion values 2 m above the mini-
mum value; if recovery is instead taken at the values
~28x near bed 7, then the duration would be a single
precession cycle, or ~17–21 k.y.). The y13C anomaly
is therefore similar in pattern and duration to that at
the end-Cretaceous mass extinction: an abrupt major

Upp
er
Per
mia
n
Gua
dalu
pian
Lopi
ngia
n
Mao
kou
Hes
han
Ser
ies
For
mat
ion
Sta
geM
iddl
e P
erm
ian
Tert
iary
Cre
t.P
erio
d
Thi
ckne
ss (
m)
δ C carbonate vs PDB (‰)13
δ C n-alkane 13
27vs PDB (‰)
δ C n-alkane 13
29vs PDB (‰)
Tim
e (k
yr)
-10
0
10
20
30-29 -28 -27
-29 -28 -27
-4
-3
-2
-1
0
1
2
3
4
3 4 5
Fig. 3. Correlation between variations in y13C across the Guadalu-
pian–Lopingian boundary in the Penglaitan section, southern China
and similar trends recorded across the Cretaceous–Tertiary bound-
ary in Caravaca, Spain (Arinobu et al., 1999). PDB is the Peedee
belemnite. Arrows indicate the mass extinction horizon.
K. Kaiho et al. / Palaeogeography, Palaeoclimatology, Palaeoecology 223 (2005) 172–180 177
decrease in b1 k.y. follows a more gradual increase
during several 10s of k.y. (Fig. 3).
5. Conclusions
The pattern, shown here, that a rapid decrease in
biotic diversity is followed by an abrupt negative
anomaly in carbon isotope values is comparable
with the record of the end-Permian mass extinction
in the Meishan section, South China (Bowring et al.,
1998; Jin et al., 2000; Kaiho et al., 2001). Our results
indicate that the G/L boundary mass extinction took
place in a single abrupt event in the earliest Lopin-
gian, corresponding to bed 1 in the basal Heshan
Formation in Penglaitan, South China.
Several studies (Hallam and Wignall, 1997, 1999;
Shi et al., 1999) have considered that Late Guadalu-
pian global regression was principally accountable for
the G/L mass extinction. Alternatively, Isozaki (1997)
suggested that the onset and climax of global oceanic
stratification across the Permian/Triassic (P/T) bound-
ary correspond with the G/L and end-Permian extinc-
tions, respectively. Courtillot et al. (1999) and Zhou et
al. (2002) proposed that the Emeishan flood basalts
(600 km diameter) in South China were erupted at the
G/L Transition, causing the extinction. However, our
study demonstrates that the dramatic losses of biota
coincide with the extremely negative shift of carbon
isotope curves. The comparable patterns of biotic
extinction and negative shift in y13C values suggest
that both the earliest Lopingian and end-Permian mass
extinctions were catastrophic events and may have
resulted from similar causes, although the direct cat-
astrophic causes remain unresolved at present.
Acknowledgments
This work was partly supported by a grant-in-aid
for scientific research from the Japan Society for the
Promotion of Science. This work was conducted as
part of the 21st Center-Of-Excellence program,
dAdvanced Science and Technology Center for the
Dynamic EarthT of Tohoku University. We thank D.
H. Erwin, P. B. Wignall, K.-U. Hinrichs, and J. C.
Ingle for comments.
Appendix A. Orbital cyclicity
In the upper Maokou Formation we observed an
alternation between mainly thick-bedded and mainly
thin-bedded chert/limestone intervals. These packages
are in turn a part of a repetitive alternation between
more easily erodable packages of (alternating thin-and
thick-bedded) chert/limestone and more massive
muddy limestones with mainly thick beds. We believe
that these repetitive lithologic variations reflect pre-
cessional forcing (resulting in alternating thick-and
thin-bedded intervals) modulated by the ~100 k.y.-
period eccentricity component (resulting in alternating
bedded and massive packages). On a larger scale,
there is a cyclic variation in the degree to which the
massive intervals project into the river that is consis-
tent with modulation by the ~400 k.y.-period long
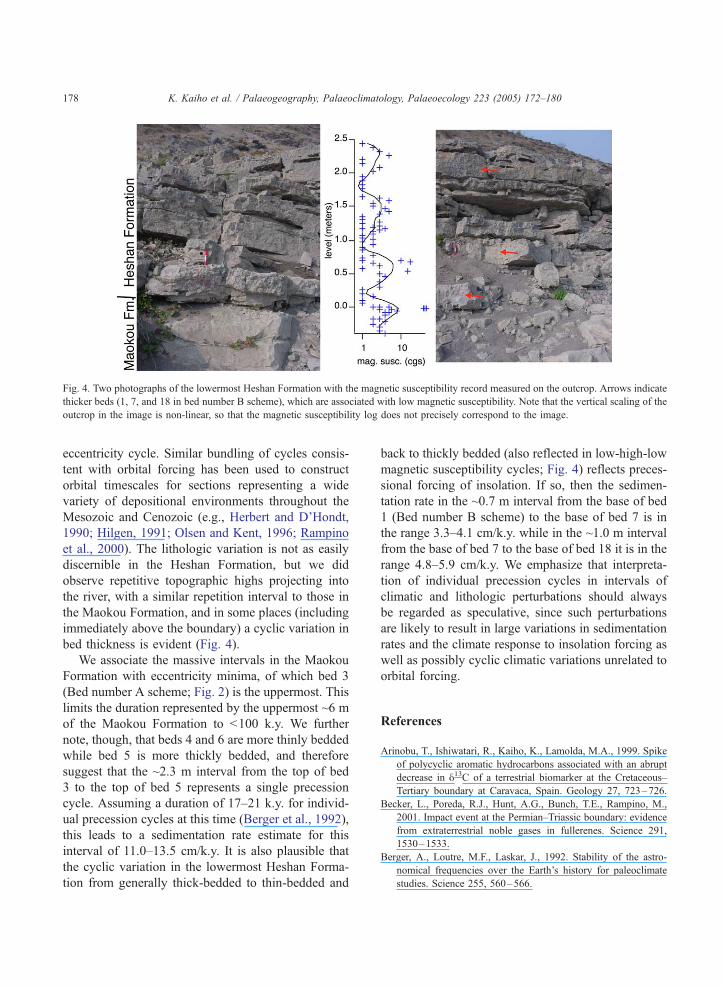
Fig. 4. Two photographs of the lowermost Heshan Formation with the magnetic susceptibility record measured on the outcrop. Arrows indicate
thicker beds (1, 7, and 18 in bed number B scheme), which are associated with low magnetic susceptibility. Note that the vertical scaling of the
outcrop in the image is non-linear, so that the magnetic susceptibility log does not precisely correspond to the image.
K. Kaiho et al. / Palaeogeography, Palaeoclimatology, Palaeoecology 223 (2005) 172–180178
eccentricity cycle. Similar bundling of cycles consis-
tent with orbital forcing has been used to construct
orbital timescales for sections representing a wide
variety of depositional environments throughout the
Mesozoic and Cenozoic (e.g., Herbert and D’Hondt,
1990; Hilgen, 1991; Olsen and Kent, 1996; Rampino
et al., 2000). The lithologic variation is not as easily
discernible in the Heshan Formation, but we did
observe repetitive topographic highs projecting into
the river, with a similar repetition interval to those in
the Maokou Formation, and in some places (including
immediately above the boundary) a cyclic variation in
bed thickness is evident (Fig. 4).
We associate the massive intervals in the Maokou
Formation with eccentricity minima, of which bed 3
(Bed number A scheme; Fig. 2) is the uppermost. This
limits the duration represented by the uppermost ~6 m
of the Maokou Formation to b100 k.y. We further
note, though, that beds 4 and 6 are more thinly bedded
while bed 5 is more thickly bedded, and therefore
suggest that the ~2.3 m interval from the top of bed
3 to the top of bed 5 represents a single precession
cycle. Assuming a duration of 17–21 k.y. for individ-
ual precession cycles at this time (Berger et al., 1992),
this leads to a sedimentation rate estimate for this
interval of 11.0–13.5 cm/k.y. It is also plausible that
the cyclic variation in the lowermost Heshan Forma-
tion from generally thick-bedded to thin-bedded and
back to thickly bedded (also reflected in low-high-low
magnetic susceptibility cycles; Fig. 4) reflects preces-
sional forcing of insolation. If so, then the sedimen-
tation rate in the ~0.7 m interval from the base of bed
1 (Bed number B scheme) to the base of bed 7 is in
the range 3.3–4.1 cm/k.y. while in the ~1.0 m interval
from the base of bed 7 to the base of bed 18 it is in the
range 4.8–5.9 cm/k.y. We emphasize that interpreta-
tion of individual precession cycles in intervals of
climatic and lithologic perturbations should always
be regarded as speculative, since such perturbations
are likely to result in large variations in sedimentation
rates and the climate response to insolation forcing as
well as possibly cyclic climatic variations unrelated to
orbital forcing.
References
Arinobu, T., Ishiwatari, R., Kaiho, K., Lamolda, M.A., 1999. Spike
of polycyclic aromatic hydrocarbons associated with an abrupt
decrease in y13C of a terrestrial biomarker at the Cretaceous–
Tertiary boundary at Caravaca, Spain. Geology 27, 723–726.
Becker, L., Poreda, R.J., Hunt, A.G., Bunch, T.E., Rampino, M.,
2001. Impact event at the Permian–Triassic boundary: evidence
from extraterrestrial noble gases in fullerenes. Science 291,
1530–1533.
Berger, A., Loutre, M.F., Laskar, J., 1992. Stability of the astro-
nomical frequencies over the Earth’s history for paleoclimate
studies. Science 255, 560–566.

K. Kaiho et al. / Palaeogeography, Palaeoclimatology, Palaeoecology 223 (2005) 172–180 179
Boussafir, M., Gelin, F., Lallier-Verges, E., Derenne, S., Bertrand,
P., Largeau, C., 1995. Electron microscopy and pyrolysis of
kerogens from the Kimmeridge Clay Formation, UK: source
organisms, preservation processes, and origin of microcycles.
Geochimica et Cosmochimica Acta 59, 3731–3747.
Bowring, S.A., Erwin, D.H., Jin, Y.G., Martin, M.W., David, E.K.,
Wang, W., 1998. U/Pb zircon geochronology and tempo of the
end-Permian mass extinction. Science 280, 1039–1045.
Bowring, S.A., Erwin, D.H., Isozaki, Y., 1999. The tempo of mass
extinction and recovery: the end-Permian example. Proceedings
of the National Academy of Sciences of the United States of
America 96, 8827–8828.
Chen, Z.Q., Jin, Y.G., Shi, G.R., 1998. Permian transgres-
sion–regression sequences and sea-level changes of
South China. Proceedings of the Royal Society of Victoria
110, 345–367.
Courtillot, V., Jaupart, C., Manighetti, I., Tapponnier, P., Besse,
J., 1999. On causal links between flood basalts and con-
tinental breakup. Earth and Planetary Science Letters 166,
177–195.
Erwin, D.H., 1993. The Great Paleozoic Crisis. Columbia Univer-
sity Press, New York. 327 pp.
Hallam, A., Wignall, P.B., 1997. Mass Extinctions and their After-
math. Oxford University Press, Oxford. 320 pp.
Hallam, A., Wignall, P.B., 1999. Mass extinctions and sea level
changes. Earth-Science Reviews 48, 217–250.
Henderson, C.M., Mei, S.L., Wardlaw, B.R., 2002. New conodont
definitions at the Guadalupian–Lopingian boundary. In: Hills,
L.V., Henderson, C.M., Bamber, E.W. (Eds.), Carboniferous and
Permian of the World, Memoir-Canadian Society of Petrolium
Geologists, vol. 19, pp. 725–735.
Herbert, T.D., D’Hondt, S.L., 1990. Precessional climate cyclicity in
Late Cretaceous–Early Tertiary marine sediments: a high reso-
lution chronometer of Cretaceous–Tertiary boundary events.
Earth and Planetary Science Letters 99, 263–275.
Hilgen, F.J., 1991. Astronomical calibration of Gauss to Matuyama
sapropels in the Mediterranean and implication for the Geomag-
netic Polarity Time Scale. Earth and Planetary Science Letters
104, 226–244.
Ishiwatari, R., Kon, M., Yamada, K., Arinobu, T., Naraoka, H.,
Okui, A., Waseda, A., 1999. Application of gas chromatog-
raphy/isotope ratio mass spectorometry to petroleum geo-
chemistry: carbon isotopic composition of individual long
chain normal alkanes in oils from Northeast Japan. Journal
of the Japanese Association of Petroleum Technologist 64,
551–559.
Isozaki, Y., 1997. Permo-Triassic boundary superanoxia and strat-
ified superocean: records from lost deep sea. Science 276,
235–238.
Jin, Y.G., Zhang, J., Shang, Q.H., 1994. Two phases of the end-
Permian mass extinction. Memoir-Canadian Society of Petro-
leum Geologists 17, 813–822.
Jin, Y.G., Mei, S.L., Wang, W., Wang, X.D., Shen, S.Z., Shang,
Q.H., Chen, Z.Q., 1998. On the Lopingian series of the Permian
system. Palaeoworld 9, 1–18.
Jin, Y.G., Wang, Y., Wang, W., Shang, Q.H., Cao, C.Q., Erwin,
D.H., 2000. Pattern of marine mass extinction near the
Permian–Triassic boundary in south China. Science 289,
432–436.
Jin, Y.G., Henderson, C.M., Wardlaw, B.R., Glenister, B.F., Mei,
S.L., Shen, S.Z., Wang, X.D., 2001. Proposal for the Global
Stratotype Section and Point (GSSP) for the Guadalupian–
Lopingian Boundary. Permophiles 39, 32–42.
Kaiho, K., Kajiwara, Y., Nakano, T., Miura, Y., Kawahata, H.,
Tazaki, K., Ueshima, M., Chen, Z., Shi, G.R., 2001. End-
Permian catastrophe by a bolide impact: evidence of a
gigantic release of sulfur from the mantle. Geology 29,
815–818.
Mei, S.L., Jin, Y.G., Wardlaw, B.R., 1994. Zonation of conodonts
from the Maokouan–Wuchiapingian boundary strata, South
China. Palaeoworld 4, 225–234.
Mei, S.L., Jin, Y.G., Wardlaw, B.R., 1998. Conodont succes-
sion of the Guadalupian–Lopingian boundary strata in Lai-
bin of Guangxi, China and West Texas, USA. Palaeoworld
9, 53–76.
Oboh-Ikuenobe, F.E., Yepes, O., ODP Leg 159 scientific
party, 1997. Palynofacies analysis of sedimentary from
the Cote d’Ivoire-Ghana transform margin: preliminary
correlation with some regional events in the Equatorial
Atlantic. Palaeogeography, Palaeoclimatology, Palaeoecology
29, 291–314.
Olsen, P.E., Kent, D.V., 1996. Milankovitch climate forc-
ing in the tropics of Pangaea during the Late Tri-
assic. Palaeogeography, Palaeoclimatology, Palaeoecology 122,
1–26.
Rampino, M.R., Prokoph, A., Adler, A., 2000. Tempo of the end-
Permian event: high-resolution cyclostratigraphy at the Perm-
ian–Triassic boundary. Geology 28, 643–646.
Ross, C.A., Ross, J.R.P., 1987. Late Paleozoic sea-levels and de-
positional sequence. In: Ross, C.A., Haman, D. (Eds.), Timing
and Depositional History of Eustatic Sequences: Constraints on
Seismic Stratigraphy. Cushman Foundation for Foraminiferal
Research Special Publication, vol. 24, pp. 137–149.
Sawada, K., Akiyama, M., 1994. Carbon isotope composition of
macerals separated from various kerogens by density separation
method. Journal of the Japanese Association of Petroleum Tech-
nologist 59, 244–255 (in Japanese).
Sepkoski Jr., J.J., 1994. Extinction and the fossil record. Geotimes,
15–17 (March).
Shen, S.Z., Shi, G.R., 2002. Paleobiogeographical extinction pat-
terns of Permian brachiopods in the Asian–western Pacific
region. Paleobiology 28, 449–463.
Shi, G.R., Shen, S.Z., Tong, J.N., 1999. Two discrete, possibly
unconnected, Permian marine mass extinctions. In: Yin, H.F.,
Tong, J.N. (Eds.), Proceedings of the International Conference
on Pangea and the Paleozoic–Mesozoic transition. China Uni-
versity of Geosciences Press, Wuhan, pp. 148–151.
Smith, P.M.R., 1984. The use of fluorescence microscopy in the
characterization of amorphous organic matter. Organic Geo-
chemistry 6, 839–845.
Stanley, S.M., Yang, X.N., 1994. A double mass extinction at the
end of the Paleozoic Era. Science 266, 1340–1344.
Wang, X.D., Sugiyama, T., 2000. Diversity and extinction patterns
of Permian coral faunas of China. Lethaia 33, 285–294.

K. Kaiho et al. / Palaeogeography, Palaeoclimatology, Palaeoecology 223 (2005) 172–180180
Wang, W., Cao, C., Wang, Y., 2004. The carbon isotope excursion
on GSSP candidate section of Lopingian–Guadalupian bound-
ary. Earth and Planetary Science Letters 220, 57–67.
Yang, X.N., Shi, G.J., Liu, J.R., Chen, Y.T., Zhou, J., 2000. Inter-
taxa differences in extinction process of Maokouan (Middle
Permian) fusulinaceans. Science in China, Series D: Earth
Sciences 43, 633–637.
Zhou, M.F., Malpas, J., Song, X.Y., Robinson, P.T., Sun, M.,
Kennedy, A.K., Lesher, C.M., Keays, R.R., 2002. A temporal
link between the Emeishan large igneous province (SW China)
and the end-Guadalupian mass extinction. Earth and Planetary
Science Letters 196, 113–122.