Fast Monte Carlo simulation on a voxelized human phantom deformed to a patient
13
Fast Monte Carlo simulation on a voxelized human phantom deformed to a patient G. Bueno a and O. Déniz a E.T.S.I. Industriales, Universidad de Castilla-La Mancha, Avenida Camilo José Cela s/n, E-13071 Ciudad Real, Spain C. B. Carrascosa and J. M. Delgado Instituto Oncológico (Grupo IMO), Hospital La Milagrosa, Modesto Lafuente, 14, E-28010 Madrid, Spain L. Brualla b NCTeam, Strahlenklinik, Universitätsklinikum Essen, Hufelandstr. 55, D-45122 Essen, Germany Received 20 March 2009; revised 7 September 2009; accepted for publication 21 September 2009; published 12 October 2009 Purpose: A method for performing fast simulations of absorbed dose using a patient’s computer- ized tomography CT scan without explicitly relying on a calibration curve is presented. Methods: The method is based on geometrical deformations performed on a standard voxelized human phantom. This involves spatially transforming the human phantom to align it with the patient CT image. Since the chemical composition and density of each voxel are given in the phantom data, a calibration curve is not used in the proposed method. For this study, the Monte Carlo MC code PENELOPE has been used as the simulation of reference. The results obtained with PENELOPE simulations are compared to those obtained with PENFAST and with the collapsed cone convolution algorithm implemented in a commercial treatment planning system. Results: The comparisons of the absorbed doses calculated with the different algorithms on two patient CTs and the corresponding deformed phantoms show a maximum distance to agreement of 2 mm, and in general, the obtained absorbed dose distributions are compatible within the reached statistical uncertainty. The validity of the deformation method for a broad range of patients is shown using MC simulations in random density phantoms. A PENFAST simulation of a 6 MV photon beam impinging on a patient CT reaches 2% statistical uncertainty in the absorbed dose, in a 0.1 cm 3 voxel along the central axis, in 10 min running on a single core of a 2.8 GHz CPU. Conclusions: The proposed method of the absorbed dose calculation in a deformed voxelized phantom allows for dosimetric studies in the geometry of a patient CT scan. This is due to the fact that the chemical composition and material density of the phantom are known. Furthermore, simu- lation using the phantom geometry can provide dosimetric information for each organ. The method can be used for quality assurance procedures. In relation to PENFAST, it is shown that a purely condensed-history algorithm class I can be used for absorbed dose estimation in patient CTs. © 2009 American Association of Physicists in Medicine. DOI: 10.1118/1.3245877 Key words: Monte Carlo, PENELOPE, collapsed cone convolution, phantom image registration I. INTRODUCTION The Monte Carlo MC method is increasingly used in the clinical context for radiotherapy applications. 1,2 A common source of type B uncertainties those of nonstatistical origin in MC simulations of the absorbed dose in patient comput- erized tomography CT scans is the conversion from Houn- sfield units HU to medium composition and mass density data. The CT scan of the patient must be introduced into the MC simulation in order to estimate the absorbed dose in each voxel. However, general-purpose radiation transport MC codes cannot deal with HU, the units in which CT scans are expressed. The chemical composition and the material den- sity are the required data from each voxel for a MC simula- tion. Therefore, a conversion process from HU to pairs of values that indicate the mass density and medium composi- tion is required prior to the simulation itself. For this conver- sion, the calibration curve of the CT scanner is normally used. However, external information must be entered into the conversion process since two quantities density and me- dium are inferred out of a single quantity HU for each voxel. Several approaches have been devised for such conversion, 3 but all of them depend on the calibration phan- tom used. Calibration phantoms are made of tissue equiva- lent materials and the calibration curve obtained with them would not be the same if biological tissues were employed. 4 In this article, a method that does not explicitly rely on a calibration curve for performing MC estimations of the ab- sorbed dose in a patient CT scan is proposed. It is based on simulations run on a voxelized human phantom 5 that has been deformed to match a given patient CT image. In that way, the chemical composition and density of each voxel depend on the definition of the phantom. Moreover, this phantom does not have the problem of the anthropomorphic ones, which do not align the patient’s geometry. 6,7 This 5162 5162 Med. Phys. 36 „11…, November 2009 0094-2405/2009/36„11…/5162/13/$25.00 © 2009 Am. Assoc. Phys. Med.
Transcript of Fast Monte Carlo simulation on a voxelized human phantom deformed to a patient

Fast Monte Carlo simulation on a voxelized human phantom deformedto a patient
G. Buenoa� and O. Déniza�
E.T.S.I. Industriales, Universidad de Castilla-La Mancha, Avenida Camilo José Cela s/n,E-13071 Ciudad Real, Spain
C. B. Carrascosa and J. M. DelgadoInstituto Oncológico (Grupo IMO), Hospital La Milagrosa, Modesto Lafuente, 14, E-28010 Madrid, Spain
L. Bruallab�
NCTeam, Strahlenklinik, Universitätsklinikum Essen, Hufelandstr. 55, D-45122 Essen, Germany
�Received 20 March 2009; revised 7 September 2009; accepted for publication 21 September 2009;published 12 October 2009�
Purpose: A method for performing fast simulations of absorbed dose using a patient’s computer-ized tomography �CT� scan without explicitly relying on a calibration curve is presented.Methods: The method is based on geometrical deformations performed on a standard voxelizedhuman phantom. This involves spatially transforming the human phantom to align it with thepatient CT image. Since the chemical composition and density of each voxel are given in thephantom data, a calibration curve is not used in the proposed method. For this study, the MonteCarlo �MC� code PENELOPE has been used as the simulation of reference. The results obtained withPENELOPE simulations are compared to those obtained with PENFAST and with the collapsed coneconvolution algorithm implemented in a commercial treatment planning system.Results: The comparisons of the absorbed doses calculated with the different algorithms on twopatient CTs and the corresponding deformed phantoms show a maximum distance to agreement of2 mm, and in general, the obtained absorbed dose distributions are compatible within the reachedstatistical uncertainty. The validity of the deformation method for a broad range of patients is shownusing MC simulations in random density phantoms. A PENFAST simulation of a 6 MV photon beamimpinging on a patient CT reaches 2% statistical uncertainty in the absorbed dose, in a 0.1 cm3
voxel along the central axis, in 10 min running on a single core of a 2.8 GHz CPU.Conclusions: The proposed method of the absorbed dose calculation in a deformed voxelizedphantom allows for dosimetric studies in the geometry of a patient CT scan. This is due to the factthat the chemical composition and material density of the phantom are known. Furthermore, simu-lation using the phantom geometry can provide dosimetric information for each organ. The methodcan be used for quality assurance procedures. In relation to PENFAST, it is shown that a purelycondensed-history algorithm �class I� can be used for absorbed dose estimation in patientCTs. © 2009 American Association of Physicists in Medicine. �DOI: 10.1118/1.3245877�
Key words: Monte Carlo, PENELOPE, collapsed cone convolution, phantom image registration
I. INTRODUCTION
The Monte Carlo �MC� method is increasingly used in theclinical context for radiotherapy applications.1,2 A commonsource of type B uncertainties �those of nonstatistical origin�in MC simulations of the absorbed dose in patient comput-erized tomography �CT� scans is the conversion from Houn-sfield units �HU� to medium composition and mass densitydata. The CT scan of the patient must be introduced into theMC simulation in order to estimate the absorbed dose in eachvoxel. However, general-purpose radiation transport MCcodes cannot deal with HU, the units in which CT scans areexpressed. The chemical composition and the material den-sity are the required data from each voxel for a MC simula-tion. Therefore, a conversion process from HU to pairs ofvalues that indicate the mass density and medium composi-tion is required prior to the simulation itself. For this conver-
sion, the calibration curve of the CT scanner is normally5162 Med. Phys. 36 „11…, November 2009 0094-2405/2009/36„
used. However, external information must be entered into theconversion process since two quantities �density and me-dium� are inferred out of a single quantity �HU� for eachvoxel. Several approaches have been devised for suchconversion,3 but all of them depend on the calibration phan-tom used. Calibration phantoms are made of tissue equiva-lent materials and the calibration curve obtained with themwould not be the same if biological tissues were employed.4
In this article, a method that does not explicitly rely on acalibration curve for performing MC estimations of the ab-sorbed dose in a patient CT scan is proposed. It is based onsimulations run on a voxelized human phantom5 that hasbeen deformed to match a given patient CT image. In thatway, the chemical composition and density of each voxeldepend on the definition of the phantom. Moreover, thisphantom does not have the problem of the anthropomorphic
6,7
ones, which do not align the patient’s geometry. This516211…/5162/13/$25.00 © 2009 Am. Assoc. Phys. Med.

5163 Bueno et al.: Fast MC simulation on a deformed human phantom 5163
method allows for dosimetric studies of the absorbed dose ina geometry that registers the morphological characteristics ofthe patient. Also, if it is required to know the absorbed dosein an organ not included in the CT scan of a patient that hasbeen already treated, it is possible to deform the originalanthropomorphic phantom using the patient’s CT scan andother anatomical information on the patient �weight, height,and perimeter at different heights� in order to obtain an ap-proximate CT scan of the patient that includes the organ ofinterest not originally scanned. With this CT, an approximatecalculation of the absorbed dose in the organ of interest atthe time of treatment can be done, and it can be evaluated ifthe applied treatment could have been the origin of a secondcancer.
Both the original patient CT scans and the deformedphantoms have been used for calculating the absorbed dosein two patients �pelvic and thoracic regions� from a 6 MVphoton beam. The dose calculation codes used for this taskwere PENELOPE,8 PENFAST �Ref. 9� �a fast MC algorithm�,and the collapsed cone convolution �CCC� algorithm imple-mented in the commercial treatment planning system �TPS�ADAC Pinnacle.10 The latter was applied only to the pelvicregion and was used to test the method in a clinical settingcarried out at the Oncology Center Grupo IMO.
The MC programs applied to the different CT geometriesunder consideration are briefly described in Sec. II. SectionIII describes the CT geometries studied and the processingcarried out for modifying the geometrical characteristics ofthe voxelized human phantom. Comparisons of the resultsobtained with each simulation are given in Sec. IV. Conclu-sions are drawn in Sec. V.
II. MC CODES USED FOR THE SIMULATION OFTHE LINAC AND THE ESTIMATION OF THEABSORBED DOSE IN CT GEOMETRIES
In order to estimate the absorbed dose in a CT geometryusing a MC algorithm, the clinical linear accelerator �linac�that will be used during the treatment must be modeled. Forthis study, a 6 MV beam of a Varian Clinac 2100 C/D hasbeen used. The simulation of the linac head has been doneusing the PENELOPE code with the main program PENMAIN.The geometry of the linac and the configuration files forPENMAIN have been generated with AUTOLINAC �Automaticlinac Constructor�.11
AUTOLINAC is a FORTRAN program thatgenerates geometry and configuration files of linacs to besimulated with PENELOPE. The code does not require the userto know the geometrical details and the most adequatevariance-reduction techniques for a particular simulation. Alibrary of preprogramed parts of linacs with movable acces-sories, such as multileaf collimators, electron applicators,and wedges, is coded inside AUTOLINAC together with a setof adaptive variance-reduction techniques.
Several lateral and depth dose profiles were experimen-tally measured with the linac under consideration. These pro-files were used to tune in the energy of the primary electronsource. A monoenergetic point primary electron source has
been used in the simulation of the linac. Compatible resultsMedical Physics, Vol. 36, No. 11, November 2009
below the 2% �2� level� statistical uncertainty have beenobtained between the simulated profiles and the experimentalones.
The simulations related to the CT geometries under con-sideration have used a 20�5 cm2 field size. With a PENE-
LOPE simulation, a phase-space file �PSF� produced by4�106 primary showers was created at 65.4 cm from thetarget, containing 13�106 particles. In producing this PSF,rotational splitting with a splitting factor of 15 was applied.11
Rotational splitting is a variance-reduction technique in allaspects equivalent to azimuthal particle redistribution,12 ex-cept for the sampling of the azimuthal angle, which is con-stant. Also, interaction forcing �as it is coded in PENELOPE
�Ref. 8�� was applied in the simulation of the target andprimary collimator. The tallied PSF produced an absorbeddose map in a water phantom that showed 2% statisticaluncertainty �2� level� in the directly irradiated area at 5 cmdepth. With subsequent simulations, the PSF has been trans-ported into different CT geometries using two different MCFORTRAN programs, namely, PENELOPE �linked to PENCT�and PENFAST.
On the one hand, PENCT is a main program that doesconventional MC calculation of dose distributions in CTstructures using the general-purpose code PENELOPE.PENELOPE implements accurate physical interaction models�limited only by the required generality� and a robust track-ing algorithm for electrons and positrons.13,14
PENCT takesadvantage of the geometrical simplicity of the CT structureand allows the use of variance-reduction methods �particlesplitting and interaction forcing� without altering the physicsand tracking algorithms of PENELOPE. Since PENCT is just amain program of PENELOPE, it allows for all the materialspresent in the PENELOPE database and new materials can becreated provided either the chemical composition or the stoi-chiometric formula is known.
On the other hand, PENFAST �Ref. 9� simulates coupledtransport of photons, electrons, and positrons in voxelizedgeometries. This algorithm is based on the same physicalinteraction models used in the general-purpose code PENE-
LOPE, but it implements a different transport mechanics forelectrons and positrons. PENFAST differs from other fast MCalgorithms in the sense that it consistently uses complete-grouping condensed, also known as class I in the terminol-ogy of Berger, simulation15 for electron and positron trans-port. In class I simulation, the collective effect of allinteractions undergone by a transported electron along agiven path length is simulated, in an approximate manner,with a single computational step. The use of class I simula-tion for absorbed dose estimation in radiotherapy has beenhindered by the inability of multiple-scattering theories toaccurately account for energy straggling effects. PENFAST
avoids this problem by using multiple-scattering distribu-tions generated with PENELOPE. This procedure frees thisclass I algorithm from one of the major limitations of con-ventional multiple scattering theories. Another importantlimitation of class I algorithms is that the multiple-scatteringdistributions correspond to fixed path lengths in an unlimited
medium; therefore, they are not applicable when the trans-
5164 Bueno et al.: Fast MC simulation on a deformed human phantom 5164
ported electron �positron� gets closer than the fixed pathlength to an interface. To circumvent this problem, approxi-mate scaling rules are used in PENFAST. They modify theresidual path length and the effective stopping power accord-ing to the local material composition and density. PENFAST
uses a simplified photon transport model adapted to CT ge-ometries, which introduces an artificial interaction mecha-nism, the delta scattering,16 with a mean free path thatchanges from voxel to voxel so to obtain a constant totalmean free path across the whole CT. PENFAST uses the sametotal photon cross sections as PENELOPE but employs simpli-fied differential cross sections for Compton scattering andpair production. This is discussed in more detail in Ref. 9.PENFAST has in its database energy loss and angular distribu-tions for water, air, compact bone �ICRU �Ref. 17��, lung�ICRP �Ref. 18��, lead �for collimating inserts�, and titanium�for prostheses�. Additionally, it gives the possibility of gen-erating new materials for the database. The gain in efficiencyand simulation speed with respect to PENELOPE is about afactor of 5 for both electron and photon beams.
In order to test the accuracy of the PENFAST simulation ofwater respect to simulating soft tissue with PENELOPE,two simulations of a monochromatic point source of 1 MeVphotons impinging on the surface of a 20�20�20 cm3
voxelized homogeneous phantom �voxel size of0.2�0.2�0.2 cm3� were run. In one case, the simulationwas run using PENELOPE and the phantom was filled withsoft tissue to reproduce the conditions of the radiation trans-port inside the body of the patient. In the other case, the codeused was PENFAST and the phantom was filled with water,reproducing the conditions of the simulation inside the softtissue regions of the patient with the approximations as-sumed by PENFAST. Both phantoms were homogeneous witha density of 1 g /cm3. Figure 1 shows the lateral profiles ofthe absorbed dose along the central x axis at a depth of10 cm for both simulations. In order to appreciate the tail of
FIG. 1. Lateral profiles of the absorbed dose along the central x axis at adepth of 10 cm using a monochromatic photon 1 MeV point source.PENELOPE simulation in soft tissue phantom shown with squares. PENFAST
simulation in water phantom shown with diamonds. Uncertainty bars �3��are not shown since they are smaller than symbol size.
the penumbra, the absorbed doses have been plotted in loga-
Medical Physics, Vol. 36, No. 11, November 2009
rithmic scale. Both profiles coincide even five orders of mag-nitude below the maximum dose.
III. DESCRIPTION OF THE VOXELIZED GEOMETRYFILES FOR PENELOPE AND PENFAST
SIMULATIONS
Two CT scans centered on the pelvic and thoracic regionsof male patients have been used for this study. The originalimages have dimensions equal to 47.974�47.974�30.800and 47.974�47.974�25.200 cm3; they are formed by512�512�44 and 512�512�36 voxels, respectively, forthe pelvic and thoracic CT scans, yielding a voxel size equalto 0.0937�0.0937�0.700 cm3. MC simulations have beenperformed on reduced 128�128�44 and 128�128�36grids, although one simulation was run for benchmarkingpurposes on the 512�512�44 grid of the pelvis. For thereduced grids, voxels have been grouped in the original CTscans by means of downsampling each slice from512�512 to 128�128 voxels. This was done by picking1 HU out of every 22 pixels from the original 512�512 CTdata, yielding a piecewise-constant interpolant based on thenearest neighbor.
A cubic spline interpolation has been applied to the cali-bration data of the CT scanners that were used for obtainingthe images of the considered patients. The obtained calibra-tion curves were used for assigning a mass density and amedium composition to each HU present in the original CTscans of the patients. Throughout this article the mediumcomposition and the mass density of each voxel will be re-ferred to as “medium-density pairs.”
Since PENELOPE and PENFAST have different material da-tabases, the conversion from HU to medium compositiondepends on the code to be used. The mass density assign-ment is the same for both codes. The simulations on thepatient CT done with PENELOPE use the following materials:Water, skin �ICRP�, adipose tissue �ICRP�, soft tissue�ICRP�, striated muscle �ICRU�, testes �ICRP�, air, brain�ICRP� �used for medula in bones�, compact bone �ICRU�,and lung �ICRP�.17,18 On the other hand, simulations on thepatient CT run with PENFAST use only water, compact bone,air, and lung. Constrained to the region of the patientscanned, any medium which is neither bone, air, nor lung, isconsidered to be water in PENFAST. The density map of thepatient is the same, independent of the MC code used for thesimulation.
The voxelized male adult phantom used in this study hasbeen the one prepared by Kramer et al. called MAX.5 Theoriginal MAX phantom contains 158�74�487 voxels rep-resenting the whole body, each one with size equal to0.36�0.36�0.36 cm3. The portions of the original MAXphantom corresponding to the pelvic and thoracic regionshave been geometrically aligned to the two patient geom-etries considered. This deformation process is driven by theconstrained optical flow formulation for image registration19
combined with a spatially adaptive model. In addition to theintensity constraint, our method introduces spatial constraints
based on Gaussian probability distribution functions of the
5165 Bueno et al.: Fast MC simulation on a deformed human phantom 5165
elements in the deformation field. This constraint makes themethod suitable to deform the MAX-phantom toward thepatient CT, while preserving the topology of the image dataand dealing with large deformations. The deformationmethod is independent of the anatomical site. However, theaccuracy and the computational cost are dependent on theshape similarities between the MAX phantom and the patientCT. In this article, the registered MAX phantoms or de-formed phantoms are referred to as “dMAX phantoms.”
In order to study the effect on the absorbed dose not in-cluding an anatomical structure, the femur heads of the pel-vic case were not included in the corresponding dMAXphantom. In contrast, the dMAX phantom corresponding tothe thoracic case was fully registered. To study the influenceof the accuracy of the registration of the MAX phantom onthe patient CT image, the registration process was prema-turely halted before the full number of iterations was com-pleted. The deformed MAX phantom obtained in this casewas termed the “ill-deformed dMAX phantom.”
CT images of dMAX phantoms have been produced atresolutions of 512�512�44 and 128�128�44 in order toapproach the pelvic patient CT region and at resolutions of512�512�36 and 128�128�36 in order to approach thethoracic patient CT region. Figure 2 shows the results of theregistration process in which the original MAX phantom wasdeformed to the two considered patient CT geometries. The
FIG. 2. CT scan images and deformation process of the MAX phantom. Theleft column corresponds to the pelvic case, while the right column corre-sponds to the thoracic case. ��a� and �b�� Central slices of the patient CTimages at 512�512 grid size. ��c� and �d�� Original MAX-phantom imagesat 158�74 grid size, which correspond to the same slice than the patientCTs �a� and �b�. ��e� and �f�� Processed images �dMAX phantoms�,128�128, obtained after the geometrical deformation was applied to theMAX phantom in the pelvic and thoracic regions.
geometrical deformations were applied to the whole consid-
Medical Physics, Vol. 36, No. 11, November 2009
ered volumes, that is, the 44 and 36 slices, consisting of158�74 voxels each, for the pelvic and thoracic cases, re-spectively. In the pelvic case, only a predefined set of organsof interest was registered, namely, the bladder, the hip bones,the rectum, and the body contour. In the thoracic case, allanatomical structures were registered.
The materials used for the PENELOPE simulations ofdMAX phantoms were water, skin �ICRP�, soft tissue�ICRP�, compact bone �ICRU�, striated muscle �ICRU�, air,and lung �ICRP, only for the thoracic case�.17,18 For the simu-lations with PENFAST, the materials used were the same fordMAX phantoms as for the patient CTs �water, bone, air, andlung�. Table I summarizes the materials used for each com-bination of code and CT geometry. Lung has only been usedin the simulations related to the thoracic region since thepelvic CTs did not include any lung tissue.
Figure 3 shows the material maps at the central slice usedfor PENELOPE and PENFAST simulations. Each tone corre-sponds to a different material. On the first column the mate-rial maps of the pelvic case are shown, whereas the secondcolumn corresponds to the thoracic case. Figure 4 shows thedensity maps on the central slice for both patients �pelvic andthoracic�. PENELOPE and PENFAST codes use the same densitymaps.
Even though in this article we only compare the absorbeddose obtained in two patient CT images to the ones obtainedon the corresponding dMAX phantoms, the generality of thedeformation method presented can be inferred from the fol-lowing. For a given linac beam, the absorbed dose in a tissuedepends on three variables: �i� The materials the beam en-counters along its path, �ii� the length of the path that thebeam travels along each material, and �iii� the mass densityof the different voxels crossed. The material whose presenceis more relevant in the MC simulation is bone, and both thepatient CT image and the dMAX phantom have bone definedin the same zones �with the exception of the femur heads forthe pelvic case that will be discussed later�. The distances
TABLE I. Materials present in the geometry of each combination of code andCTs tested. The lung material is used only in the thoracic case study.
Patient CTs dMAX phantoms
Air AirSkin Skin
Soft tissue Soft tissuePENELOPE Bone Bone
Muscle MuscleWater WaterLung LungTestesBrain
Adipose
Water WaterPENFAST Bone Bone
Air AirLung Lung
traveled by the beam inside the different materials on both,

5166 Bueno et al.: Fast MC simulation on a deformed human phantom 5166
the patient’s CTs and the dMAX phantoms, are the same inall cases since the deformations on the dMAX phantomshave been done in such a way that the volume of the regis-tered organs and the body contours correspond to the ones ofthe corresponding patient’s CTs. However, the density of thepatient CT images differs at each voxel from the one of thecorresponding dMAX phantom since the patient presents thenormal density fluctuations from voxel to voxel, while theMAX phantom, and hence the dMAX phantoms, have a ho-mogeneous density for each considered material, namely, thenominal density of each ICRU and ICRP tissueemployed.17,18 Therefore, a study on the effect of using dif-ferent densities for patient’s CT scans and the dMAX phan-toms is required.
Figures 5�a� and 5�b� show maps of the relative densitydifference, in logarithmic scale, between the two patient’s
FIG. 3. Comparison among material maps used. Only the central slices areshown. The left column corresponds to the pelvic case, while the rightcolumn corresponds to the thoracic case. ��a� and �b�� Patient CT images forPENELOPE simulations at 512�512 resolution, ��c� and �d�� patient’s CTimages for PENELOPE simulations at 128�128 resolution, ��e� and �f��dMAX-phantom CT images for PENELOPE simulations at 128�128 reso-lution, and ��g� and �h�� dMAX-phantom CT images for PENFAST simulationsat 128�128 resolution.
CT scans and the corresponding dMAX phantoms for the
Medical Physics, Vol. 36, No. 11, November 2009
isocenter slices. It can be seen that the larger differences areobtained from the bones, the bladder �filled with water forthe MC simulation�, and the lung, which are smaller than12%. For the adipose tissue, the percentage relative differ-ence is smaller than 7%, whereas for the soft tissue andmuscle, this value reduces to less than 3%. There are a fewvoxels located on the skin of both patient CTs in which therelative density differences between the patient CT and thedMAX phantom is a thousand times larger. These voxelscorrespond to the body contour. The fact that the density ofair is about thousand times smaller than that of the skin andsoft tissue explains this effect on some of the contour voxels.For the rest of slices, the results are the same. Figure 5�c�shows the relative difference between the thoracic patient CTand the ill-deformed dMAX phantom at the isocenter slice.The homogeneous tone areas around the heart correspond to
FIG. 4. Density maps used in both PENELOPE and PENFAST algorithms at128�128 resolution. Mass densities are expressed in g /cm3 and are shownin grayscale. �a� Patient’s CT image of the pelvic region. �b� Patient’s CTimage of the thoracic region.
FIG. 5. Relative density differences, in logarithmic scale, for the isocenterslices shown in different tone scale for each voxel. �a� Differences betweenthe patient CT and the dMAX phantom in the pelvic region. �b� Differencesbetween the patient CT and the dMAX phantom in the thoracic region. �c�Differences between the patient CT and the ill-deformed dMAX phantom inthe thoracic region. �d� Differences between dMAX phantom and ill-deformed dMAX phantom in the thoracic region. Light colored voxels in �d�correspond to a percentage relative difference of 13%, while black voxelsindicate that the density in both phantoms is the same. All densities are
calculated on the low resolution, 128�128, CT images.
5167 Bueno et al.: Fast MC simulation on a deformed human phantom 5167
regions in which the registering process was incomplete dueto the prematurely stop of the algorithm. Figure 5�d� showsthe relative density difference between the dMAX phantomand the ill-deformed dMAX phantom for the thoracic case.Since both phantoms are based on the MAX phantom, whichexhibits homogeneous densities in its anatomical structures,only two tones appear on the plot. The light region corre-sponds to regions where the full deformation was not cap-tured because the registration process was prematurelyhalted.
The last step for statistically validating the proposedmethod is to evaluate the effect that variations in the massdensity have on the absorbed dose. From calculations on theavailable density data of different tissues,20–23 it can be in-ferred that the density variation among patients is about 7%for water, 5% for bone, and 3% for muscle and soft tissue.These variations are within the maximum relative differencesfound between the patient CT images and the dMAX phan-toms mentioned above. It is reasonable to assume that den-sity variations in a given tissue among human beings followa normal distribution, with mean equal to the nominal den-sity quoted by ICRU and ICRP tables, and standard deviationequal to a half of the relative maximum difference observedin our case study �standard deviations of water, bone, andadipose tissue equal to 0.04, 0.03, and 0.02 g /cm3, respec-tively�. With this assumption, two phantoms were preparedfor each material under consideration, one having all voxelswith the tissue at the nominal density, and the other one withdensities chosen at random following the normal distributionjust described. PENELOPE simulations were run on all phan-toms using the 20�5 cm2 PSF and the absorbed dose ateach voxel was obtained. Relative differences in the ab-sorbed dose between the homogeneous and the normally dis-tributed phantoms were within 1% for each material. In Fig.6 the isodose distributions for the bone, water, and adiposetissue phantoms are shown. Thin isodose lines correspond tosimulations run on the homogeneous phantoms, while thicklines correspond to phantoms with densities following a ran-dom normal distribution. The materials chosen for the plotare the ones that presented a larger density variability be-tween the patient CTs and the dMAX phantoms. These con-clusions are not strongly dependent on the width of the nor-mal distribution used for constructing the phantom. Pilotsimulations were run using standard deviations that doubledthe ones quoted, yielding the same conclusions.
IV. RESULTS OF ABSORBED DOSES OBTAINEDWITH PENELOPE, PENFAST AND PINNACLE’SCCC
IV.A. Simulation efficiency of the MC codes
For measuring the effectiveness of the anatomical defor-mation method and the MC algorithms studied herein, thecommon definition of the efficiency � at a voxel of referenceplaced 5 cm deep into the patient/dMAX-phantom bodyalong the central axis �CAX� �Ref. 24� will be used. Thisdefinition is given by �see, for example, the PENELOPE
8
manual �Medical Physics, Vol. 36, No. 11, November 2009
� = � E
�E�2
1
T, �1�
where T is the CPU time of the simulation, E is the averageenergy deposited to that voxel, and �E is the standard devia-
tion of E. Additionally, the intrinsic efficiency of the simula-tion, that is, the efficiency independent of the number ofhistories and the CPU speed, is defined as
�N = �T
N, �2�
where N is the number of simulated histories. It can be ar-gued that the intrinsic efficiency is related to the amount ofinformation delivered to the voxel of reference by particlehistory.
Finally, the speed s of a simulation is defined as
s =N
T. �3�
All MC simulations in this article have been run on an iMacdesktop computer with a 2.8 GHz Intel Core 2 Duo CPU�running in a single core�. The codes have been compiled bythe Intel Fortran Compiler 10.1 for Mac OS X, using the-fast option.
Table II shows benchmark results for the MC simulationsperformed on the low and high resolution CT images of thepelvic case. It can be seen that PENFAST is from five to six
FIG. 6. Relative isodose lines �80%, 60%, 40%, and 20%� obtained withPENELOPE simulations using the 20�5 cm2 PSF on 40�40�40 cm3 phan-toms made of bone, water, and adipose tissue. Thin lines correspond tosimulations run on homogeneous phantoms �densities of 1.85, 1, and0.92 g /cm3 for bone, water, and adipose tissue, respectively�, while thicklines correspond to phantoms with a random normal distribution of densi-ties. In total, the figure shows isodose lines obtained from six phantoms�three different materials at two different density maps for each material�.
times more efficient than PENELOPE irrespective of the CT

5168 Bueno et al.: Fast MC simulation on a deformed human phantom 5168
geometry used. It must be said that the PENELOPE simulationswere run with simulation parameters that attained about themaximum possible speed while keeping approximately thesame accuracy. The PENELOPE transport parameters deter-mine the average angular deflection between two consecutivehard elastic collisions �C1�, the maximum fractional energyloss between two hard elastic collisions �C2�, and the cutoffenergy for hard inelastic interactions and hard bremsstrah-lung emission �Wcc and Wcc, respectively�.8 The transportparameters chosen for the PENELOPE simulations wereC1=C2=0.1 and Wcc=200 keV and Wcr=50 keV. The ab-sorption energies in all materials were set to 200 keV forelectrons and positrons and 50 keV for photons. For reachingthe higher efficiency of the fast MC code, PENFAST performsrepetitive interaction forcing combined with delta interac-tions throughout the CT, thus producing particles with asmaller amount of information. The slightly smaller intrinsicefficiencies of the PENFAST simulations with respect to thePENELOPE ones are an indication of the much higher interac-tion forcing performed in the PENFAST simulation. The samevoxel of reference �located 5 cm deep into the body of thepatient along CAX� was set on all MC simulations. The ab-solute dose in this voxel is presented in Table II together withthe relative percentage uncertainty at this voxel. All the ab-sorbed doses obtained are compatible within the statisticaluncertainty, irrespective of the code or CT used. It isworth noting that the fast MC algorithm yields statisticaluncertainties smaller than 1.7% �1�� in a voxel size equal to0.3748�0.3748�0.700 cm3 in less than 20 min using asingle core of a CPU. On the other hand, PENELOPE yieldsthe same statistical uncertainty in about 1.5 h, a time whichis within quality assurance requirements. Even though thenumber of voxel-boundary crossings of particles increases byan order of magnitude in the high resolution CT images withrespect to the low resolution ones, the PENFAST simulationspeed is only reduced in 25%. Since all MC simulations usethe same PSF as energy source, the variance of the simula-tions performed on the high resolution CT images is obvi-ously larger. Similar simulation times are obtained for the
TABLE II. Comparison of benchmark results obtainedlow and high resolution grids. The efficiency, intrinsicreference voxel located 5 cm deep into the body oassociated percentage statistical uncertainty in the do
128�12
PEENFAST
Patient dMAX phantom
Time �min� 18.5 17.1s �s−1�103� 3.48 3.95� �s−1� 3.41 3.39�N �10−3� 0.98 0.86D �eV/g primary e−� 0.89 0.88Uncertainty �%� 1.63 1.70
thoracic case.
Medical Physics, Vol. 36, No. 11, November 2009
IV.B. Comparison of dose distributions
Two metrics have been used to quantitatively compare thedose distributions obtained with the MC codes and the CCCalgorithm, namely, the gamma test ��� and the Hausdorffdistance. The gamma test based on the method of Bakai etal.,25 which is analogous to the one proposed by Low et al.,26
was used to compare the whole 3D absorbed dose distribu-tions. The � test was applied with 1% acceptance level onabsorbed dose maps of the pelvic and thoracic CTs. In eachgamma test the absorbed doses of the reference CT werecompared up to the tenth nearest neighbor in the tested CT.The quality index ��ra,b� of the � tests determines the pass-fail criteria when comparing the dose distribution b against areference distribution a. If ��ra,b��1, the calculation passes,otherwise it fails. rb is the dose position in the CT beingtested respect to the dose found in the CT of reference.
The Hausdorff distance is defined on the space of non-empty closed bounded subsets of a metric space.27 It mea-sures how far two subsets of this metric space are from eachother. Let isodoses of the patient, Ipa, and dMAX-phantomCT, IdM, be two nonempty subsets, the Hausdorff distance,dH�Ipa ,IdM�, is defined by
dH�Ipa,IdM� = max� supx�Ipa
infy�IdM
d�x,y�, supy�IdM
infx�Ipa
d�x,y�� ,
�4�
where sup is the supremum, inf is the infimum, and d�x ,y� isthe Euclidean distance between the isodose values x and y,x�Ipa and y�IdM.
IV.B.1. Results obtained on the pelvic case
In order to test the viability of the method in clinicalroutine, the pelvic dMAX phantom was adapted to the dicomformat to be read by ADAC Pinnacle and simulated with theCCC algorithm included within this TPS.
The comparison between the relative dose obtained on thepelvic patient CTs and the corresponding dMAX phantomsusing Pinnacle’s CCC algorithm yields a maximum
CCC
C simulations of the pelvic case considered with theiency, and statistical uncertainty are calculated in thepatient and dMAX-phantom CTs along CAX. Thegiven to 1� level.
4 512�512�44
PENELOPE PENFAST
nt dMAX phantom Patient dMAX phantom
4 85.8 23.9 20.864 0.75 2.70 3.1067 0.79 0.49 0.5005 1.05 0.18 0.1689 0.88 0.91 0.8557 1.57 3.78 4.02
for Meffic
f these is
8�4
Patie
101.0.0.1.0.1.
�max �rpa,dM�=0.56 �the following abbreviations have been

5169 Bueno et al.: Fast MC simulation on a deformed human phantom 5169
used in these expressions: CCC=Pinnacle’s CCC, pe=PENELOPE, pf=PENFAST, pa=patient CT, dM=dMAXphantom�. Regarding the MC simulations, the absolute dosesobtained on the patient and dMAX-phantom CTs have beencompared obtaining �max
pe �rpa,dM�=0.45 and �maxpf �rpa,dM�
=0.24. In general, the quality indices obtained are muchsmaller than the maximum values just quoted, and 100% ofthe voxels passed all the � tests carried out on the pelviccase. The behavior of the quality indices obtained with the �tests performed are in agreement with the conclusions in-ferred from the comparison of the root mean squared differ-ences discussed below. The two MC codes have been com-
FIG. 7. � Histograms for the patient CTs and the corresponding dMAX phaphantom. �b� Simulations with CCC and PENELOPE on dMAX phantom. �c�PENELOPE and PENFAST on the dMAX phantom. �e� Simulations with PENELOP
and dMAX phantom.
pared through the � test using the patient CT image,
Medical Physics, Vol. 36, No. 11, November 2009
obtaining �maxpa �rpe,pf�=0.19, which is the smallest maximum
value found in the � tests. This result shows that both codesproduce essentially the same results, and the small differ-ences arise from the differences in the material compositionbetween the PENELOPE and the PENFAST patient CTs. Figure 7shows the histogram distribution of each � test consideredfor the pelvic case.
The Hausdorff distance was applied on the isodose linesin the coronal and axial directions along the CAX. The re-sults for the 95%, 90%, 80%, 70%, 50%, and 35% relativeisodose lines obtained on the 128�128 pelvic CTs are
s of the pelvic region. �a� Simulations with CCC on patient CT and dMAXlations with PENELOPE and PENFAST on the patient CT. �d� Simulations withpatient CT and dMAX phantom. �f� Simulations with PENFAST on patient CT
ntomSimuE on
shown in Table III for all simulation algorithms and Table IV

5170 Bueno et al.: Fast MC simulation on a deformed human phantom 5170
for MC based comparison, where ��Pat,dMAX� refers to thevariation obtained between the patient CT and the dMAXphantom and �MC refers to the variation obtained betweenPENELOPE and PENFAST simulations for both the patient CTand the dMAX phantom. The Hausdorff distance calculatedfor the CCC simulation gives account of the differences be-tween the patient and the dMAX-phantom CTs in the regionwhere each isodose curve is plotted. The Hausdorff distanceapplied to the MC simulations gives not only a measure ofthe differences between both CTs but also the statistical un-certainty associated with the stochastic nature of MC meth-ods. For this reason, all distances associated with the CCCare smaller than their MC counterparts. It can be seen thatthe larger differences in the pelvic case between the patientCT and the corresponding dMAX phantom are located in theregion around the 50% and at the 95% isodose �near the boneareas�. These areas are the ones that, in fact, show the largestdifferences between the patient and the dMAX-phantomCTs. Some areas were not included in the deformation pro-cess, as mentioned before, so the patient CT has a largerbone volume than the corresponding dMAX phantom. Thesame analysis cannot be performed on the Hausdorff dis-tances obtained from MC simulations, since statistical uncer-tainties mask the differences between both CTs.
TABLE III. Hausdorff distance of the dose distribution to the pelvic patientCT and the corresponding dMAX phantom for all simulation algorithmsconsidered, PENFAST, PENELOPE, and CCC. Study applied to the low reso-lution, 128�128�44, CTs. Statistical uncertainties are given at 2� leveland distances are expressed in centimeters.
Isodoses�%�
��Pat,dMAX�
PENFAST PENELOPE CCC
95 0.89�0.05 0.79�0.01 0.67�0.0290 0.75�0.08 0.88�0.08 0.28�0.0580 0.73�0.10 0.85�0.18 0.45�0.2170 0.83�0.28 0.81�0.28 0.35�0.3150 0.88�0.29 0.89�0.28 0.78�0.3535 0.91�0.31 0.92�0.31 0.58�0.37
TABLE IV. Hausdorff distance of the dose distribution to the pelvic patientCT and the corresponding dMAX phantom for the MC �PENFAST andPENELOPE� based simulation algorithms considered. Study applied to the lowresolution, 128�128�44, CTs. Statistical uncertainties are given at 2�level and distances are expressed in centimeters.
Isodoses�%�
�MC
Patient CT dMAX phantom
95 0.74�0.06 0.84�0.0690 0.64�0.08 0.81�0.0880 0.69�0.19 0.82�0.1970 0.65�0.28 0.75�0.2850 0.87�0.28 0.89�0.2935 0.89�0.30 0.91�0.31
Medical Physics, Vol. 36, No. 11, November 2009
The absolute absorbed doses for the whole CT volumesobtained with the MC simulations were also compared tak-ing the root mean squared difference of the absolute dosevoxel per voxel between pairs of simulations and using allvoxels conforming each CT. Each of the results obtained iscompared to the maximum dose of the first simulation ofeach pair comparison. The root mean squared difference be-tween the PENFAST and the PENELOPE simulation on the lowresolution patient CT image �pelvis� amounts to 1.3% of themaximum absolute dose in the 3D voxelized structure calcu-lated with PENFAST. The comparisons done on the dMAXphantoms and the patient CTs yield 2.6% and 2.2% whenPENELOPE and PENFAST are used, respectively, for the pelviccase. The larger percentage difference between the pelvicdMAX-phantom and the patient CTs when simulated withPENELOPE in comparison with PENFAST arises from the largernumber of materials present in the PENELOPE patient CT im-age than in the PENFAST one. In all cases the observed dif-ferences are within acceptable clinical uncertainties.
The qualitative validations of the pelvic case are shown inFigs. 8–10. These figures show the relative isodose lines ob-tained with the different simulation algorithms in the iso-center slice of the patient CT and dMAX phantom. In allthese plots, the relative isodose lines correspond to 95%,90%, 80%, 70%, 50%, and 35% of the maximum dose ofeach case studied. The isodose lines have been superimposedon the isocenter slice of the patient CT image to illustrate thequalitative validations. The data used for plotting all MCisodose lines have been taken directly from the simulationswithout applying any kind of smoothing or averaging algo-rithm.
In Fig. 9 a comparison between the isodoses obtained onthe pelvic patient CT and the corresponding dMAX phantomis done using all simulation codes: �a� PENFAST,�b� PENELOPE, and �c� CCC. In terms of the absorbed dose,simulations on the patient CT and dMAX-phantom imagesare equivalent. The differences observed in the 35% and 50%isodose lines are due to the number of organs used in thedeformation process. A higher number of preselected organsincluding, for example, the femur would improve the resultsin the regions where organs were not deformed. Notice that
FIG. 8. Isodoses �95%, 90%, 80%, 70%, 50%, and 35%� on the isocenterslice of the pelvic patient CT image computed on the patient CT and dMAXphantom with 128�128�44 voxels. Thick lines correspond to results ob-tained with PENFAST, whereas thin lines correspond to results obtained withPENELOPE: �a� MC simulations on patient CT and �b� MC simulations ondMAX phantom.
the differences in the absorbed dose between the two CTs

5171 Bueno et al.: Fast MC simulation on a deformed human phantom 5171
appear after the beam crosses the femur heads. This effectcan also be noticed from the Hausdorff distance. Zankl etal.28 also observed a similar dependence on the absorbeddose due to differences in anatomical structures when com-paring several human voxelized phantoms.
The isodose lines shown in Fig. 9�d� �512�512 grid� arecompatible with the ones plotted in Fig. 9�a� �128�128grid�, but with a larger statistical uncertainty because of thelarger number of voxels. Both figures correspond to simula-tions performed with PENFAST on the patient CTs and thecorresponding dMAX phantoms.
Figure 10 shows comparisons of the results obtained onthe pelvic case using the MC algorithms and the CCC algo-rithm. Figure 10�a� shows the isodose lines obtained withPENELOPE and the CCC algorithm on the patient CT. Figure10�b� shows the isodose lines obtained with PENFAST and theCCC algorithm on the pelvic dMAX phantom. Small differ-
FIG. 9. Isodoses �95%, 90%, 80%, 70%, 50%, and 35%� on the isocenterslice of the pelvic patient CT image computed on the patient CT and dMAXphantom with 128�128�44 voxels in all cases except �d�, where512�512�44 voxels were used. Thick lines correspond to patient CTs,whereas thin lines correspond to dMAX phantoms: �a� Simulations withPENFAST �low-res�, �b� simulations with PENELOPE, �c� simulations with CCC,and �d� simulations with PENFAST �high-res�.
FIG. 10. Isodoses �95%, 90%, 80%, 70%, 50%, and 35%� on the isocenterslice of the pelvic patient CT image computed on the patient CT and dMAXphantom with 128�128�44 voxels. Thick lines correspond to simulationsrun with �a� PENELOPE and �b� PENFAST, whereas thin lines correspond tocalculations done with the CCC algorithm. �a� Simulations on the patient
CT. �b� Simulations on the corresponding dMAX phantom.Medical Physics, Vol. 36, No. 11, November 2009
ences in the absorbed dose calculated with MC methods andthe CCC algorithm appear behind the bone areas. Back-scattering on the bone regions of the CT is slightly underes-timated by the CCC algorithm since this code assumes thatthe medium where radiation transport occurs is water.
The build-up region, where the beam enters the body ofthe patient, presents discrepancies between the MC and theCCC algorithms for the pelvic case. Pinnacle’s CCC algo-rithm produces results in the build-up regions that are inreasonable agreement with MC simulated and experimentaldata,29 hence, the differences do not arise from the radiationtransport algorithm itself, but from geometrical restrictionson the body contour imposed by Pinnacle’s CCC algorithmsince isodose lines are forced to be closed inside the bodycontour.
FIG. 11. Isodoses �95%, 90%, 80%, 70%, 50%, and 35%� on the isocenterslice of the thoracic patient CT image computed on the patient CT anddMAX phantom with 128�128�36 voxels. �a� PENELOPE simulation onpatient CT �thick line� and dMAX phantom �thin line�. �b� PENFAST simula-tion on patient CT �thick line� and dMAX phantom �thin line�. �c� PENFAST
�thick line� and PENELOPE �thin line� simulations on patient CT. �d� PENFAST
�thick line� and PENELOPE �thin line� simulations on the correspondingdMAX phantom.
FIG. 12. �a� Isodoses �95%, 90%, 80%, 70%, 50%, and 35%� on the iso-center slice of the thoracic patient CT image estimated with PENELOPE simu-lations using the ill-deformed dMAX phantom �thick lines� and the dMAXphantom �thin lines�. �b� Isodoses �95%, 80%, 70%, 50%, 35%, and 15%�on the isocenter slice of the thoracic patient CT image estimated withPENFAST simulations using a three beams configuration on the patient CT
�thick lines� and the corresponding dMAX phantom �thin lines�.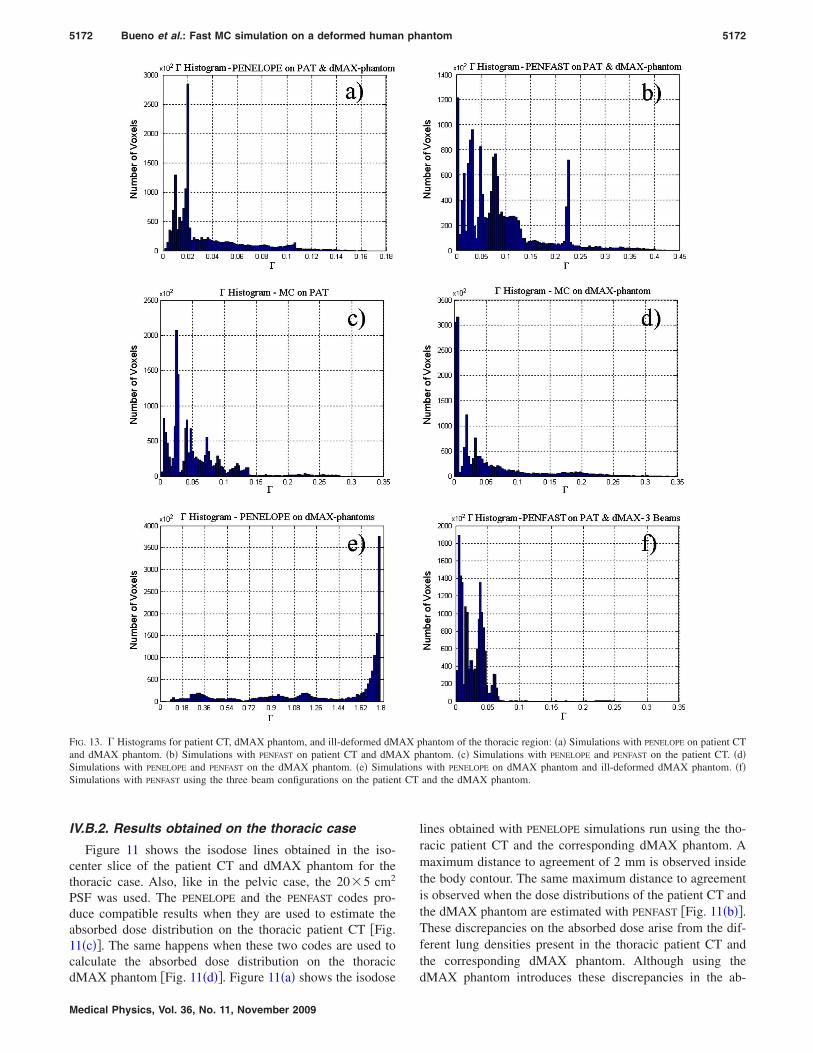
t CT
5172 Bueno et al.: Fast MC simulation on a deformed human phantom 5172
IV.B.2. Results obtained on the thoracic case
Figure 11 shows the isodose lines obtained in the iso-center slice of the patient CT and dMAX phantom for thethoracic case. Also, like in the pelvic case, the 20�5 cm2
PSF was used. The PENELOPE and the PENFAST codes pro-duce compatible results when they are used to estimate theabsorbed dose distribution on the thoracic patient CT �Fig.11�c��. The same happens when these two codes are used tocalculate the absorbed dose distribution on the thoracic
FIG. 13. � Histograms for patient CT, dMAX phantom, and ill-deformed dMand dMAX phantom. �b� Simulations with PENFAST on patient CT and dMASimulations with PENELOPE and PENFAST on the dMAX phantom. �e� SimulSimulations with PENFAST using the three beam configurations on the patien
dMAX phantom �Fig. 11�d��. Figure 11�a� shows the isodose
Medical Physics, Vol. 36, No. 11, November 2009
lines obtained with PENELOPE simulations run using the tho-racic patient CT and the corresponding dMAX phantom. Amaximum distance to agreement of 2 mm is observed insidethe body contour. The same maximum distance to agreementis observed when the dose distributions of the patient CT andthe dMAX phantom are estimated with PENFAST �Fig. 11�b��.These discrepancies on the absorbed dose arise from the dif-ferent lung densities present in the thoracic patient CT andthe corresponding dMAX phantom. Although using the
hantom of the thoracic region: �a� Simulations with PENELOPE on patient CThantom. �c� Simulations with PENELOPE and PENFAST on the patient CT. �d�
with PENELOPE on dMAX phantom and ill-deformed dMAX phantom. �f�and the dMAX phantom.
AX pX p
ations
dMAX phantom introduces these discrepancies in the ab-

5173 Bueno et al.: Fast MC simulation on a deformed human phantom 5173
sorbed dose, it must be taken into account that the dose dis-tribution obtained on the patient CT presents larger uncer-tainties respect to the actual radiotherapy treatment since thelung tissue has large density variations during the radio-therapy treatment due to the breathing cycle of the patient.
Figure 12�a� shows the isodose lines obtained from PENE-
LOPE simulations on the thoracic dMAX phantom and theill-deformed dMAX phantom. There are noticeable discrep-ancies between the two calculations, in particular, around theheart where the ill-deformed dMAX phantom did not con-verge. The maximum distance to agreement between iso-doses lines is 7 mm.
Finally, the applicability of the method has been testedusing several fields. For doing so, the PSF was rotated 90°around CAX and was later used in three positions: The origi-nal position perpendicular to CAX, 60° to the left side of thepatient, and 60° to the right of the patient �following the arcdefined by the gantry movement�. At each position, one-thirdof the particles contained in the PSF was transported into theCT geometry using PENFAST. As it is expected, using severalangles of incidence for the PSF reduces the differences be-tween the absorbed dose distributions estimated using thepatient CT or the corresponding dMAX phantom. All isodoselines above 35% relative uncertainty estimated with both CTsare compatible within the uncertainty, and only the 15% iso-dose line shows a discrepancy of 2 mm, depending on theCT geometry used.
Figure 13 shows the � tests applied to the thoraciccase. The values obtained are �max
pe �rpa,dM�=0.17,�max
pf �rpa,dM�=0.43, �maxpa �rpe,pf�=0.28, �max
dM �rpe,pf�=0.35, and�max
pe �rdM,ill-dM�=1.8. All simulations passed the � test with100% of the voxels conforming the CTs except for the ill-deformed phantom, where most of the voxels showed agamma index larger than 1. In that figure it is also noticedthat the overall minimum gamma indices are obtained withthe three beam treatment configurations.
Tables V and VI show the Hausdorff distance comparisonof the thoracic study. The isodose lines estimated with PEN-
FAST on the patient CT and the corresponding dMAX phan-tom shown a maximum distance of 1.26 cm at 35%. Theagreement improves when the CTs are irradiated using three
TABLE V. Hausdorff distance of the dose distributions applied to the thoraciccase. ��Pat,dMAX� refers to the comparison between patient CT and thecorresponding dMAX phantom. �MC refers to the comparison between theMC codes PENFAST and PENELOPE. Studies applied to the low resolution,128�128�36, CT images. Statistical uncertainties are given at 2� leveland distances in centimeters.
Isodoses�%�
Pat�MC
PENFAST
��Pat,dMAX�dMAX�MC
PENELOPE
��Pat,dMAX�
95 0.71�0.06 0.72�0.02 0.41�0.09 0.89�0.0890 0.36�0.07 0.63�0.07 0.40�0.09 0.63�0.0880 0.80�0.07 0.85�0.08 0.33�0.09 0.87�0.0870 0.60�0.08 0.93�0.07 0.48�0.09 0.95�0.0950 0.91�0.10 0.99�0.08 0.64�0.09 0.94�0.0935 1.10�0.13 1.26�0.11 0.84�0.13 1.07�0.12
beams. As it is expected, the agreement on the cases that
Medical Physics, Vol. 36, No. 11, November 2009
involve the ill-deformed dMAX phantom is poor.Finally, the root mean square difference between PENFAST
and PENELOPE simulations on the thoracic patient CTsamounts to 2.1% of the absolute absorbed dose. The rootmean square difference of the absolute absorbed dose ob-tained on the thoracic patient CT and the correspondingdMAX phantom is 2.9% when both simulations are run ei-ther with PENELOPE or PENFAST.
V. CONCLUSIONS
A method for performing MC simulations of the absorbeddose in patients without explicitly depending on a calibrationcurve for converting HU into medium composition and massdensity data has been tested. The method is based on thegeometrical deformation of a standard voxelized humanphantom to align a given patient CT image. The deformedphantom and the patient CT yield, in general, compatibleabsorbed dose distributions, within 2% �1�� statistical uncer-tainty. When discrepancies appear, the distance to agreementis smaller than 2 mm. Furthermore, MC simulation on thedeformed phantom is about 15%–20% more efficient thanthe simulation on the actual patient’s CT. The accuracy of thesimulation results obtained on the deformed phantom de-pends on the number of anatomical structures defined in thedeformation process and the fact that the phantom must befully deformed in order to obtain reliable results. The methodis general enough to allow the deformation of the voxelizedphantom to register any patient CT image.
The deformed phantom method can also be used with acommercial TPS, and therefore the validity of the deforma-tion method applied to an anthropomorphic phantom fordose calculation is not limited to MC simulations. MC re-sults obtained with the different CT geometries and testedcodes have been compared against the results obtained withthe commercial TPS ADAC Pinnacle using the CCC algo-rithm, yielding all algorithms compatible results within thestatistical uncertainty.
This article presents the first results obtained in patientCT structures with the fast MC algorithm PENFAST. PENFAST
simulations are from five to six times faster than PENELOPE.
TABLE VI. Hausdorff distance of the dose distributions applied to the tho-racic case. ��Pat,dMAX� refers to the comparison between patient CT andthe corresponding dMAX phantom. “ill-dMAX” refers to the ill-deformeddMAX phantom. Studies applied to the low resolution, 128�128�36, CTimages. Statistical uncertainties are given at 2� level and distances are ex-pressed in centimeters.
Isodoses�%�
PENELOPE
��Pat, ill-dMAX�PENFAST �3 beams�
��Pat,dMAX�PENELOPE
��dMAX,ill-dMAX�
95 9.56�0.08 0.95�0.10 5.55�0.0790 9.48�0.10 0.65�0.08 4.67�0.0880 9.41�0.09 0.73�0.09 4.67�0.0870 9.36�0.09 0.75�0.09 4.59�0.0950 9.31�0.10 0.80�0.09 4.67�0.0935 8.81�0.14 0.83�0.12 6.00�0.13
A statistical uncertainty in the absorbed dose of 2% �1�� at

5174 Bueno et al.: Fast MC simulation on a deformed human phantom 5174
5 cm depth into the body of the patient can be reached in10 min using a 6 MV photon beam PSF and a voxel sizeslightly smaller than 0.1 cm3.
ACKNOWLEDGMENTS
The authors gratefully acknowledge R. Palanco-Zamoraand F. Salvat for carefully reading the manuscript and givinguseful suggestions. This work has been funded by the Span-ish Junta de Comunidades de Castilla-La Mancha throughProject No. PBC06-0019. The authors acknowledge partialfinancial support from the VI Framework Programme of theEuropean Commission through the MAESTRO �Methodsand Advanced Equipment for Simulation and Treatment inRadio Oncology� project �Grant No. IP CE503564�.
a�Also at Robotics Institute, Carnegie Mellon University, 5000 Forbes Av.,Pittsburgh, PA 15213; Electronic mail: [email protected]
b�Also at Facultat de Física �ECM�, Universitat de Barcelona, Diagonal647, E-08028 Barcelona, Spain.
1I. J. Chetty et al., “Report of the AAPM Task Group No. 105: Issuesassociated with clinical implementation of Monte Carlo-based photon andelectron external beam treatment planning,” Med. Phys. 34, 4818–4853�2007�.
2N. Reynaert, S. van der Marck, D. Schaart, W. V. der Zeea, C. V. Vliet-Vroegindeweija, M. Tomseja, J. Jansena, B. Heijmena, M. Coghea, and C.D. Wagtera, “Monte Carlo treatment planning for photon and electronbeams,” Radiat. Phys. Chem. 76, 643–686 �2007�.
3B. Vanderstraeten et al., “Conversion of CT numbers into tissue param-eters for Monte Carlo dose calculations: A multi-centre study,” Phys.Med. Biol. 52, 539–562 �2007�.
4U. Schneider, E. Pedroni, and A. Lomax, “The calibration of CT Houn-sfield units for radiotherapy treatment planning,” Phys. Med. Biol. 41,111–124 �1996�.
5R. Kramer, J. Vieira, H. Khoury, F. Lima, and D. Fuelle, “All aboutMAX: A male adult voxel phantom for Monte Carlo calculations in ra-diation protection dosimetry,” Phys. Med. Biol. 48, 1239–1262 �2003�.
6H. Zaidi and X. Xu, “Computational anthropomorphic models of the hu-man anatomy: The path to realistic Monte Carlo modeling in radiologicalsciences,” Annu. Rev. Biomed. Eng. 9, 1.1–1.30 �2007�.
7A. Badal, L. Kyprianou, A. Badano, and J. Sempau, “Monte Carlo simu-lation of a realistic anatomical phantom described by triangle meshes:Application to prostate brachytherapy imaging,” Radiother. Oncol. 86,99–103 �2008�.
8F. Salvat, J. M. Fernández-Varea, and J. Sempau, PENELOPE—A code sys-tem for Monte Carlo simulation of electron and photon transport OECDNuclear Energy Agency, Issy-les-Moulineaux, France, 2006.
9F. Salvat, L. Brualla, and J. Sempau, “A purely condensed-history trans-port algorithm for the Monte Carlo simulation of electron transport in CTstructures” �unpublished�.
10T. R. Mackie, J. W. Scrimger, and J. J. Battista, “A convolution method ofcalculating dose for 15 MV x rays,” Med. Phys. 12, 188–196 �1985�.
11L. Brualla, F. Salvat, and R. Palanco-Zamora, “Efficient Monte Carlo
simulation of multileaf collimators using geometry-related variance-Medical Physics, Vol. 36, No. 11, November 2009
reduction techniques,” Phys. Med. Biol. 54, 4131–4149 �2009�.12K. Bush, S. Zavgorodni, and W. Beckham, “Azimuthal particle redistri-
bution for the reduction of latent phase-space variance in Monte Carlosimulations,” Phys. Med. Biol. 52, 4345–4360 �2007�.
13B. Faddegon, M. Asai, J. Perl, C. Ross, J. Sempau, J. Tinslay, and F.Salvat, “Benchmarking of Monte Carlo simulation of bremsstrahlungfrom thick targets at radiotherapy energies,” Med. Phys. 35, 4308–4317�2008�.
14F. Salvat and J. Fernández-Varea, “Overview of physical interaction mod-els for photon and electron transport used in Monte Carlo codes,” Metro-logia 46, S112–S138 �2009�.
15M. Berger and S. Seltzer, Technical Report Radiation Shielding Informa-tion Center �RSIC� Report No. CCC-107 �Oak Ridge National Labora-tory, Oak Ridge, TN, 1973�.
16E. Woodcock, T. Murphy, P. Hemmings, and S. Longsworth, Proceedingsof the Conference on Applications of Computing Methods to ReactorProblems, p. 557, 1965 �unpublished�.
17ICRU, “Tissue substitutes in radiation dosimetry and measurement,” Re-port No. 44 �International Commission on Radiation Units and Measure-ments, ICRU, Bethesda, MD, 1989�.
18ICRP, Report of the Task Group on Reference Man, Publication No. 23,�International Commission on Radiological Protection, ICRP, Oxford,1975�.
19D. Wang, R. W. Hill, S. L. H. Wang, J. O. L. Dong, R. Mohan, A. S.Garden, K. K. Ang, D. A. Kuban, M. B. J. Y. Chang, and R. Cheung,“Validation of an accelerated demons algorithm for deformable imageregistration in radiation therapy,” Phys. Med. Biol. 50, 2887–2905�2005�.
20K. J. Cassell, P. A. Hobday, and R. P. Parker, “The implementation of ageneralised Batho inhomogeneity correction for radiotherapy planningwith direct use of CT numbers,” Phys. Med. Biol. 26, 825–833 �1981�.
21J. Geleijns, J. V. Unnik, J. Zoetelief, D. Zweers, and J. J. Broerse, “Com-parison of two methods for assessing patient dose from computed tomog-raphy,” Br. J. Radiol. 67, 360–366 �1994�.
22W. Schneider, T. Bortfeld, and W. Schlegel, “Correlation between CTnumbers and tissue parameters needed for Monte Carlo simulations ofclinical dose distributions,” Phys. Med. Biol. 45, 459–478 �2000�.
23T. Fujisaki et al., “Effects of density changes in the chest on lung stereo-tactic radiotherapy,” Radiat. Med. 22, 233–238 �2004�.
24IAEA, “Absorbed dose determination in external beam radiotherapy: Aninternational code of practice for dosimetry based on standards of ab-sorbed dose to water,” Report No. TRG-398 �International Atomic EnergyAgency, 2000�.
25A. Bakai, M. Alber, and F. Nüsslin, “A revision of the �-evaluation con-cept for the comparison of dose distributions,” Phys. Med. Biol. 48,3543–3553 �2003�.
26D. Low, W. Harms, S. Mutic, and J. Purdy, “A technique for the quanti-tative evaluation of dose distributions,” Med. Phys. 25, 656–661 �1998�.
27J. Munkres, Topology, 2nd ed. �Prentice-Hall, Englewood Cliffs, NJ,1999�.
28M. Zankl, U. Fill, N. Petoussi, and D. Regulla, “Organ dose conversioncoefficients for external photon irradiation of male and female voxel mod-els,” Phys. Med. Biol. 47, 2367–2385 �2002�.
29P. Carrasco, N. Jornet, M. Duch, L. Weber, M. Ginjaume, T. Eudaldo, D.Jurado, A. Ruiz, and M. Ribas, “Comparison of dose calculation algo-rithms in phantoms with lung equivalent heterogeneities under conditions
of lateral electronic disequilibrium,” Med. Phys. 31, 2899–2911 �2004�.