Analysis of deformed YBa 2 Cu 3 O 7
9
JOURNAL OF MATERIALS SCIENCE 25 (1990) 1978-1986 Analysis of deformed YBa2Cua07_ M. J. KRAMER, L. S. CHUMBLEY, R. W. McCALLUM 206 Wilhelm Hall, Ames Laboratory, Ames, Iowa 50011, USA In this study, polycrystalline YBa2Cu3OT_ a (1 23) was deformed under controlled conditions with a confining pressure of 1.0GPa, temperatures of 25, 500 and 800~ and a strain rate of 10 -4 sec 1 in order to ascertain the micromechanisms of deformation that give rise to the macroscopic plastic behaviour. The deformed material was analysed using optical microscopy, transmission electron microscopy (TEM), and a SQUID magnetometer to study the effects of deformation on the microstructure of YBa2Ou307 a and how changes in the microstructure affected the superconducting properties. The results of these preliminary experiments suggest that the 123 material will be very difficult to deform plastically as slip occurs only on the (001) plane. The lack of multiple slip systems implies that this material will show some brittle behaviour up to a very high homologous temperature. Even when plastic behaviour can be sustained for high strains it may require high annealing temperatures to remove lattice imper- fections which impede the superconducting currents, Densification by high pressure defor- mation may make reoxygenation difficult due to the reduced diffusion rates between the grains. These factors combined suggest that traditional fabrication techniques are not applic- able to the 123 material. More work needs to be carried out to determine how annealing affects the microstructures of deformed materials and how these changes in microstructure affect the superconducting properties of these materials. 1. Introduction In order for the high T, ceramic superconductors to be widely utilized, it is necessary to be able to form and draw these materials into a number of different shapes [1]. In addition, the anisotropic current-carrying capacity of the high T,. materials suggests that aligned crystal textures may be necessary to obtain high criti- cal currents [2]. The possibility of producing wires of crystallographically textured superconducting material via deformation processing, e.g. wire drawing or extrusion, would seem to be the most desirable method of obtaining the desired shape and perfor- mance. A basic understanding of the deformation mechanisms operating in these materials, and the effect of deformation on the superconducting proper- ties, is therefore of considerable interest. In this study, polycrystalline YBa2Cu307_a (123) was deformed under controlled conditions of pressure, temperature and strain rate, in order to ascertain the micromechan- isms of deformation that give rise to the macroscopic plastic behaviour. The deformed material was ana- lysed using optical microscopy, transmission electron microscopy (TEM), and a SQUID magnetometer to study the effects of deformation on the microstructure of YBa2Cu3OT_ a and how changes in the microstruc- ture affected the superconducting properties. The results of some preliminary deformation experiments will be discussed. 2. Experimental procedure A stoichiometric composition of BaCO 3, CuO and Y203 was reacted twice in 02 at 890~ for 24 h then pressed into cylindrical cores which were 3 mm in dia- meter and approximately 6 mm in length. These cores were then annealed at 1000~ for 24h in 02, cooled to 450 ~ C and annealed for another 5 h. The resulting material was X-ray pure (some minor phases were detected using differential thermal analysis) coarse grained (40 to 50#m) YBa2Cu3OT_6 superconductor with a T, of 93 K having an average twin spacing of 0.14 + 0.05#m as determined by TEM on jet pol- ished samples. The individual cores were deformed in a solid-media, high-temperature, triaxial, constant strain rate press commonly used to study the rheologi- cal properties of geological materials [3] (Fig. l). In this press, a solid is used to transmit the hydrostatic pressure to the sample. The confining load is applied from above as shown by the small arrows in Fig. 1. The axial load is applied by a WC piston which is driven by an a.c. motor at a constant rate. Defor- mation experiments were performed at temperatures of 25, 500 and 800 ~ C with a strain rate of 10 a sec and a confining pressure of 1.0 GPa. At 25 ~ C, pure NaC1 was used as the solid pressure medium. At 500~ NaC1 doped with 10wt % Fe203 was used as the pressure medium in order to increase the oxygen fugacity since a graphite resistance .furnace which results in a reducing chemical environment was used. At 800~ mechanical instabilities due to the high mobility of the NaC1 results in rupturing of the thermocouple used to monitor the sample tempera- ture, therefore BN was used instead. While the BN resulted in stable temperature control, the oxygen fugacity was very low, thus some oxygen was expected 1 978 0022-2461/90 $03.00 + .12 1990 Chapman and Hall Ltd.
Transcript of Analysis of deformed YBa 2 Cu 3 O 7

J O U R N A L OF M A T E R I A L S S C I E N C E 25 (1990) 1978-1986
Analysis of deformed YBa2Cua07_
M. J. KRAMER, L. S. C H U M B L E Y , R. W. M c C A L L U M 206 Wilhelm Hall, Ames Laboratory, Ames, Iowa 50011, USA
In this study, polycrystalline YBa2Cu3OT_ a (1 23) was deformed under controlled conditions with a confining pressure of 1.0GPa, temperatures of 25, 500 and 800~ and a strain rate of 10 -4 sec 1 in order to ascertain the micromechanisms of deformation that give rise to the macroscopic plastic behaviour. The deformed material was analysed using optical microscopy, transmission electron microscopy (TEM), and a SQUID magnetometer to study the effects of deformation on the microstructure of YBa2Ou307 a and how changes in the microstructure affected the superconducting properties. The results of these preliminary experiments suggest that the 123 material will be very difficult to deform plastically as slip occurs only on the (001) plane. The lack of multiple slip systems implies that this material will show some brittle behaviour up to a very high homologous temperature. Even when plastic behaviour can be sustained for high strains it may require high annealing temperatures to remove lattice imper- fections which impede the superconducting currents, Densification by high pressure defor- mation may make reoxygenation difficult due to the reduced diffusion rates between the grains. These factors combined suggest that traditional fabrication techniques are not applic- able to the 123 material. More work needs to be carried out to determine how annealing affects the microstructures of deformed materials and how these changes in microstructure affect the superconducting properties of these materials.
1. In troduct ion In order for the high T, ceramic superconductors to be widely utilized, it is necessary to be able to form and draw these materials into a number of different shapes [1]. In addition, the anisotropic current-carrying capacity of the high T,. materials suggests that aligned crystal textures may be necessary to obtain high criti- cal currents [2]. The possibility of producing wires of crystallographically textured superconducting material via deformation processing, e.g. wire drawing or extrusion, would seem to be the most desirable method of obtaining the desired shape and perfor- mance. A basic understanding of the deformation mechanisms operating in these materials, and the effect of deformation on the superconducting proper- ties, is therefore of considerable interest. In this study, polycrystalline YBa2Cu307_a (123) was deformed under controlled conditions of pressure, temperature and strain rate, in order to ascertain the micromechan- isms of deformation that give rise to the macroscopic plastic behaviour. The deformed material was ana- lysed using optical microscopy, transmission electron microscopy (TEM), and a SQUID magnetometer to study the effects of deformation on the microstructure of YBa2Cu3OT_ a and how changes in the microstruc- ture affected the superconducting properties. The results of some preliminary deformation experiments will be discussed.
2. Experimental procedure A stoichiometric composition of BaCO 3, CuO and Y203 was reacted twice in 02 at 890~ for 24 h then
pressed into cylindrical cores which were 3 mm in dia- meter and approximately 6 mm in length. These cores were then annealed at 1000~ for 24h in 02, cooled to 450 ~ C and annealed for another 5 h. The resulting material was X-ray pure (some minor phases were detected using differential thermal analysis) coarse grained (40 to 50#m) YBa2Cu3OT_6 superconductor with a T, of 93 K having an average twin spacing of 0.14 + 0.05#m as determined by TEM on jet pol- ished samples. The individual cores were deformed in a solid-media, high-temperature, triaxial, constant strain rate press commonly used to study the rheologi- cal properties of geological materials [3] (Fig. l). In this press, a solid is used to transmit the hydrostatic pressure to the sample. The confining load is applied from above as shown by the small arrows in Fig. 1. The axial load is applied by a WC piston which is driven by an a.c. motor at a constant rate. Defor- mation experiments were performed at temperatures of 25, 500 and 800 ~ C with a strain rate of 10 a sec and a confining pressure of 1.0 GPa. At 25 ~ C, pure NaC1 was used as the solid pressure medium. At 500~ NaC1 doped with 10wt % Fe203 was used as the pressure medium in order to increase the oxygen fugacity since a graphite resistance .furnace which results in a reducing chemical environment was used. At 800~ mechanical instabilities due to the high mobility of the NaC1 results in rupturing of the thermocouple used to monitor the sample tempera- ture, therefore BN was used instead. While the BN resulted in stable temperature control, the oxygen fugacity was very low, thus some oxygen was expected
1 978 0022-2461/90 $03.00 + .12 �9 1990 Chapman and Hall Ltd.

! I
l c m ',4 F&,m'e I Schematic of the sample assembly used in the deformation experiments.
to be lost from the 123 during these experiments. All of the cores were wrapped in three layers of 50/~m thick Ag foil to minimize contamination from the confining media. The cores were axially shortened approximately 20% by pressing. The deformed cores were then sectioned along the axis of the cylinder. One half was used for optical microscopy while the other half was used for magnetometer analysis and TEM. The TEM samples were prepared by drilling discs from 0.25 mm thick slabs which had been cut along the axis of the cylinder. These disks were dimpled to 50/~m and then ion milled using a liquid-N2 cooled cold stage. TEM examination was carried out on a JEOL 100CX.
Material remaining from the deformation experi- ments which was not used in the optical mounts or in the TEM foils, which was approximately one half of each of the cores, was then annealed in O~ at 450 ~ C for 24h to reoxygenate the material. Magnetometer analysis was then performed. This same material was then annealed in O~ for 24 h, then cooled to 450 ~ C and held for 5 h before cooling to room temperature. Mag- netometer analysis, optical microscopy, and TEM were then performed on this remaining material.
3. Experimental results 3.1. As-deformed microstructure 3. 1.1. Optical microscopy observations The 25~ sample showed pervasive intra- and inter- crystalline fracturing with the majority of the strain accomodated along narrow (25 and 100/xm wide) shear zones (Fig. 2a). The material cleaved along the (00 1) planes and showed irregular fractures in other crystallographic directions. The crystallographic directions were determined using the technique of Verhoeven [4]. The material in the narrow shear zones showed extensive comminution with a particle size less than 1 Fm. Outside of the shear zone, twin boundaries were disrupted, but could be matched across fractures. Although some twin lamellae showed curvature near fractures, deformation appeared almost entirely brittle in nature. The effective grain size (regions bounded by fractures or grain boundaries) outside of the shear zones is approximately 10/~m.
The 500 ~ C sample showed less fracturing compared to the 25~ sample. Most grains showed trans- granular fractures at high angles to the (00 1) planes and narrow alternating light and dark bands parallel' to the (00 1) planes (Fig. 2b). Many of these bands were slightly curved and variable in thickness, and their optical activity was identical to that of the twins. The normal twin pattern was grossly disrupted. The narrow bands parallel to the (00 1) planes are criss- crossed by { 1 1 0} twins which appeared very different than the normal transformation twins seen in the undeformed material. These twin lamellae either tapered to a point within the crystal or terminated at the narrow bands parallel to the (0 0 1) planes. Optical activity was variable across individual grains, suggest- ing substantial intracrystalline strain. Crystals whose long axis lay nearly parallel to the maximum com- pressive stress showed contrast variations which suggest the development of subgrains separated by deformation bands. The appearance of twins was not common in such regions.
The 800~ sample showed very little fracturing when compared to either the 500 or 25 ~ C samples and a much higher degree of plastic behaviour. Longer grains showed extensive bending without fracturing; this was particularly true for grains whose long axes were nearly parallel to the maximum confining stress (Fig. 2c). Apparent subgrain development (i.e., regions within a crystal with discrete boundaries which show distinctly different optical activity but are not twins) was more distinct in this material than in the 500~ material. Little twinning is observed in most of the crystals, most likely a result of loss of 02. Heating to 800~ results in transformation to the tetragonal crystal structure which is maintained during cooling due to the reducing environment [5].
3. 1.2. TEM observations The 25~ sample contained mostly transgranular fractures, mainly on the (00 1) planes. Dislocations lying in the (00 1) planes were observed. These dis- locations resulted in a slight distortion of the twin lamellae, but did not appear to dominate the micro- structure (Fig. 3a). The average twin spacing was
1979

Figure 2 Optical micrographs of deformed 123 material. (a) 25~ sample. Cleavage fractures parallel to (00 1) are indicated at (A) and irregular fractures are shown at (B). (b) 500~ sample. The [1 1 0} twins terminate at (0 0 1) boundaries (A) or within the crystal (B). (c) 800~ sample. Note the lack of twinning in most crystals. Kinked (00 1) planes (A) indicate that slip has occurred on this plane.
narrower than the undeformed material, averaging 0.06 +_ 0.02/~m. Occasional stacking faults were seen on the (0 0 1) planes in areas of unusually high dislo- cation densities (Fig. 3b). The partial dislocations terminating these stacking faults were curved, indicat- ing that the disassociation is not simple. However, most of the other dislocations were straight and had line vectors of f1 0 0] and [1 1 0]. Because of distortions present in the diffraction patterns of the TEM used for this investigation, it was impossible to distinguish between the [1 0 0] and the [0 1 0] directions since the orthorhombic distortion (s) is slight (i.e., s ~ 0.017). Dislocations were more commonly observed when the 123 was fractured at high angles to the (00 l) planes than when the material fractured along the (00 I) cleavage planes, yet the dislocations still lay only on the (00 1) plane (Fig. 3b).
In contrast, the 500~ sample showed extensive development of dislocation arrays confined to the (0 0 1) planes (Fig. 3c). These arrays of dislocations were usually evenly spaced across an individual crystal with few isolated dislocations being found between the arrays. The measured spacing of the arrays (0.15 +_ 0.05/~m) correspond to the spacing of the optical light and dark bands parallel to the (0 0 1) planes previously described. Microdiffraction showed that there was a crystallographic mismatch of 2 to 4 ~ across the dis- location arrays. The dislocations were generally
1980
straight and had line vectors of [1 00] and f1 1 0]. The (1 1 0) twins, having an average spacing of 0.15 _+ 0.05/~m, often terminated at the dislocation arrays on (00 1) planes. Most twin fringes continued through multiple sets of dislocation arrays, yet showed some distortion at the dislocation array boundaries (Fig. 3c). Where the twins terminated within the crystal, and were not associated with the dislocation arrays, they tapered to a point. No tapering of the twins was seen when they terminated at (0 0 1) cleavage fractures.
There were two distinct microstructural features in the 800~ deformed material. Most grains showed a very narrow spacing (0.1 to 0.05#m) between the dislocation arrays lying on the (001) planes, and poorly developed twin fringes (Fig. 3d). Some grains appeared to have polygonal structures where the sub- grains were separated by tangles of very long dislo- cations which were not confined to a single glide plane (Fig. 3c). The polygonal regions with no twins and few dislocations, as in Fig. 3e, were surrounded by regions which had faint { 1 1 0} twins and a higher dislocation density. The dislocations had line vectors of (1 0 0) and (1 1 0). These features correspond to the defor- mation bands shown in Fig. 2c. The faint twinning fringes which were observed in many of the crystals suggest that the material had undergone substantial oxygen loss and was reverting to the tetragonal unit cell.
3.2. Post oxygen-annealing microstructure 3.2. 1. Optical microscopy observations The remaining fraction of the deformed cores was annealed at 450~ and 900~ according to the schedule previously described. Magnetometer analysis was performed after each anneal. After the 900~ anneal, the remaining material was used to make TEM foils and optical mounts. The optical sections showed changes in the twinning pattern for all samples

Figure 3 TEM micrograph of deformed material. (a) 25~ sample. Note distortion of the twin lamellae due to dislocations (A). (b) A different grain in the same sample showing an irregular fracture (A) and stacking faults (B). (c) 500~ sample. Dislocation arrays (A) are on (0 0 l) planes and deformation twins (B) are on { 1 1 0} planes. Insert shows the sample with a 10 ~ tilt toward the [0 0 1] to reveal the dislocations going through the foil. (d) 800~ sample. Note that faint residual contrast of the {1 1 01 twins (A). (e) Different grain in the 800~ sample showing a polygonal structure (see the text).
after annealing. The 25~ deformed material after annealing showed a narrower twin spacing compared to the undeformed and as-deformed material, but no indication of recrystallization or healing of fractures. The twins were not continuous across intracrystalline fractures (Fig. 4a). For the 500 ~ C material, the widely spaced twins with the tapered points which usually terminated within the crystal gave way to a much more closely spaced twinning pattern in which the twins terminated at grain boundaries or fractures and not at the (0 0 1) subgrain boundaries. Twin lamellae were also not continuous across intracrystalline frac-
tures in this material. Bands parallel to the (00 1) planes were faint, but still present. The finely spaced {1 1 0} twins and the (00 1) bands give the crystals a tweed texture (Fig. 4b) instead of the irregular tapered twins seen before annealing (Fig. 2b). Subgrains are evident with the {1 1 0} twin lamellae and the (00 1) bands being subparallel between subgrains. The 800~ material, which showed little twinning after deformation, also shows a very fine tweed pattern after the 900~ anneal. The grains in the 800~ material, which appeared highly strained in the as- deformed state, show distinct differences in optical activity between subgrains after the anneal, suggesting that recovery and perhaps some recrystallization has taken place (Fig. 4c). Otherwise, there was no optical evidence for extensive recrystallization after the 900 ~ C anneal.
3.2.2. TEM observations The 500 and 800 ~ C materials possess similar structure
1 981

Figure4 Optical micrographs of 900~ oxygen-annealed 123 material. (a) 25 ~ C sample. Note the disruption of twins across the fractures. (b) 500~ sample. The deformed material shows sub- parallel {1 1 0} twins across the subgrains at (A) and (B). (c) 800~ sample. Optical activity variations indicate extensive subgrain development and some possible recrystallization.
consisting of very narrow twin spacings (0.05/~m) with extensive development of stacking faults on the (0 0 1) planes after annealing (Fig. 5). Stacking faults were also present in the 25~ material but were not nearly as numerous as in the 500 or 800~ material. The spacing between the stacking faults was nearly identical to the spacing of the dislocation arrays for the 500 and 800~ deformed materials before annealing. There were some isolated dis- locations with [1 1 0] and [1 00] line vectors, but they were not as numerous as in the pre-annealed material: The partial dislocations on the trailing edges of the stacking faults are generally curved and always lie in the (0 0 1) plane. The separation of the partials result- ing in the stacking faults is from 0.1 to 0.35/~m. No dislocation arrays were observed in any of the annealed material regardless of the temperature of deformation.
3.3. Magnetometer results The Meissner effect results in the expulsion of magnetic flux lines from the superconducting material. The penetration depth, 2(T), of the magnetic field increases with increasing temperature until the critical temperature (T~) limit is reached and the material is no longer capable of expelling the magnetic field (i.e., the material becomes invisible to the magnetic field). For isolated spheres, the magnetization suppression
1982
factor, P, is given by
e(x) = 1 - (3 /x)coth (x) + 3Ix 2 (1)
where x = R/2(T) [6]. R is the sphere radius. The two-fluid model for the temperature dependence of the penetration depth is assumed so that,
, ~ / , ~ ( 0 2 = 1 - t 4 ( 2 )
where t = T/T~ [7]. For densely packed polycrystal- line samples, Equation 1 is only a good first approxi- mation since the grain boundaries may act as weak Josephson junctions [6]. However, consideration of the above equations indicates that the magnetization curves should reflect any changes in grain size (R) due to deformation if all other variables are held constant. That is, the magnetization suppression factor should increase with increasing grain size. Empirically, the finer grained material should also show a more gradual increase in the slope of the
Figure 5 TEM micrograph of the 800 ~ C deformed material after the 900 ~ C anneal.

A s l ) e r o r n l e d 450"C A n n e a l 9I)IVC A n n e a l Zero Field Cooled Zero Fiehl (;{)()led
Z e r o V i e l d C o o l e d
- 1 0
~" - 2 0 =
-30"
-40"
-50 0
J an ! nu.m m m.nm ~m g , ~ u a ~
& . A ~ l l l i ' l ~
as sintered
. . . . - & - - - 25"C
. . . . -~ - , - . 500"C ,~ )
(a)
i ~ i i �9
20 40 60 80
Temperature (K)
100
- 1 0
"~ -20' =
-30'
-40'
-50
p- as sintered
. . . . . A- - - - 25"C (
. . . . �9 - B - . - - 5 0 0 " C ,,~
- - -o.- - 800"0 , . ~
oooooooooO~ ~O'r: -------%7 I " 1 1 " 1 1 " 1 1 �9 I
__j {bl
i i i I
20 40 60 80
Temperature (K)
.10 �84
"~ -20 =
-30
-40
-50 100 0
a s s i n t e r e d
. . . . . A - - - - 2 5 " C
. . . . . . B - . - - 5 0 0 " C
- - " O - - 8 0 0 " C
(c) i v �9 l l
20 40 60 80 100
Temperature (K)
4 5 0 ~ A n n e a l Normalized Zero Field Cooled
900~ A n n e a l Normalized Zero Fiehl ('ooled
0.0"
-0.2
-0.4
@
-o.6
- 0 . 8
- 1 . 0
- 1 . 2
as sinterecl
. . . . . A - - - - 2 5 " C
. . . . . - B - . - . 5 0 0 " C
- - " O - - - 8 0 0 " 0
Z
(d) i i i i
20 40 60 80 100
Temperature (K)
0 . 0
-0.2
-0.4
O
-0.6
-0.8
-L0 '
- 1 . 2
as sintered
. . . . . A-- -- 25"C
. . . . ..B-.-. 500 'C
- - < } - - 800"C
(e) i i i i
20 40 60 80 100
Temperature (K)
Figure 6 Zero field cooled magnetization curves for the 123 material (a) after deformation, (b) after the 450~ re-oxygenation and (c) after the 900~ anneal. The data normalized to the magnetization measured at I0 K for each sample (d) after the 450~ re-oxygenation and (e) after the 900~ anneal.
magnetization curve (i.e., a slower transition) with increasing temperature compared to more coarse grained material. Fig. 6a shows the effect of defor- mation on the magnetization suppression factor. The undeformed material is shown for reference. The sharp transition to the superconducting state for the undeformed material is typical of the coarse grained material. The slight increase in magnetization with increasing temperature is probably due to flux trap- ping during cooling. The 25 and 500~ samples, which were buffered to prevent substantial 02 loss, show the ideal monotonically increasing slope with
increasing temperature. The 25~ deformed material shows a higher magnetization but a more gradual change in slope than the 500~ material. The differ- ence in curvature indicates that the 25~ material possesses a smaller particle size (i.e. greater particle size reduction during deformation) than the 500~ material. The lower magnetization and yet sharper transition for the 500~ material is difficult to inter- pret. There was most likely some loss of 02 as well as some flux trapping. The curve for the material deformed at 800 ~ C, which is believed to have lost 02 during the deformation process, shows substantial
1983
(110) twins
fl[llllllllllll fracture
, C axis as d~
rllll[llllll; (Q) (b]
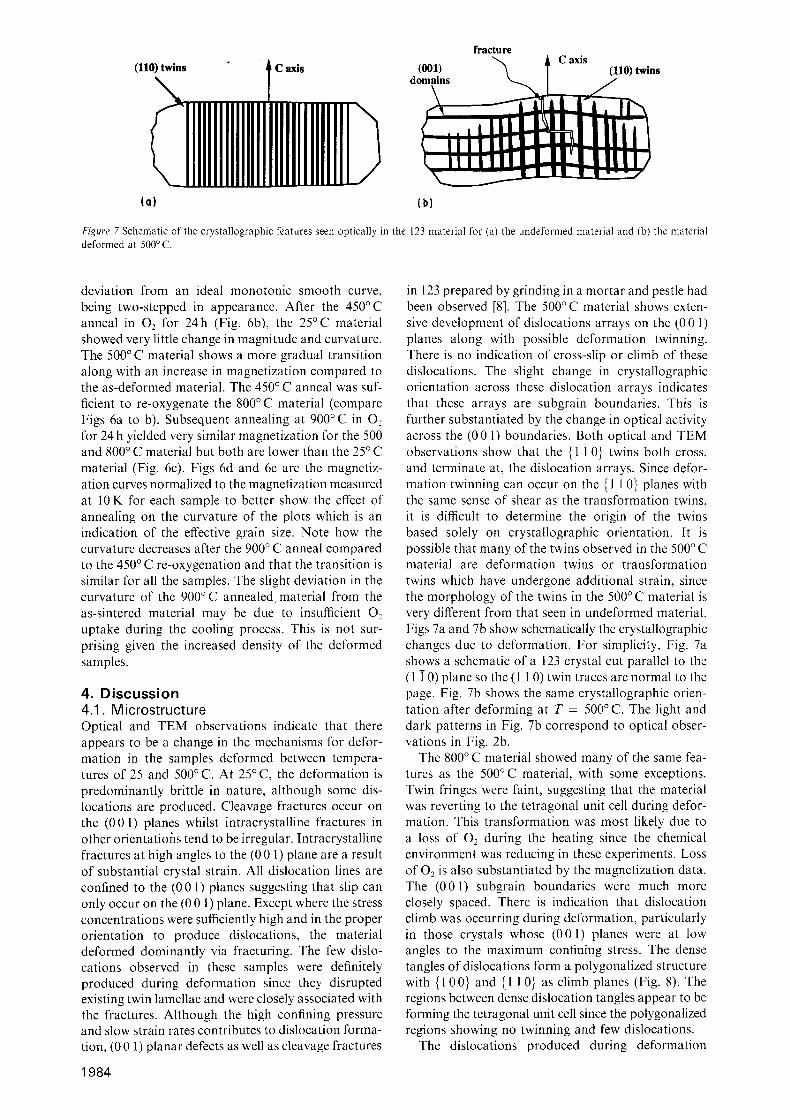
Figure 7 Schematic of the crystallographic features seen optically in the 123 material for (a) the undeformed material and (b) the material deformed at 500~
deviation from an ideal monotonic smooth curve, being two-stepped in appearance. After the 450~ anneal in 02 for 24h (Fig. 6b), the 25~ material showed very little change in magnitude and curvature. The 500~ material shows a more gradual transition along with an increase in magnetization compared to the as-deformed material. The 450 ~ C anneal was suf- ficient to re-oxygenate the 800~ material (compare Figs 6a to b). Subsequent annealing at 900~ in O~ for 24 h yielded very similar magnetization for the 500 and 800 ~ C material but both are lower than the 25 ~ C material (Fig. 6c). Figs 6d and 6e are the magnetiz- ation curves normalized to the magnetization measured at 10K for each sample to better show the effect of annealing on the curvature of the plots which is an indication of the effective grain size. Note how the curvature decreases after the 900 ~ C anneal compared to the 450 ~ C re-oxygenation and that the transition is similar for all the samples. The slight deviation in the curvature of the 900~ annealed material from the as-sintered material may be due to insufficient O~ uptake during the cooling process. This is not sur- prising given the increased density of the deformed samples.
4. Discussion 4.1. Microstructure Optical and TEM observations indicate that there appears to be a change in the mechanisms for defor- mation in the samples deformed between tempera- tures of 25 and 500 ~ C. At 25 ~ C, the deformation is predominantly brittle in nature, although some dis- locations are produced. Cleavage fractures occur on the (00 1) planes whilst intracrystalline fractures in other orientatiohs tend to be irregular. Intracrystalline fractures at high angles to the (0 0 1) plane are a result of substantial crystal strain. All dislocation lines are confined to the (0 0 1) planes suggesting that slip can only occur on the (0 0 l) plane. Except where the stress concentrations were sufficiently high and in the proper orientation to produce dislocations, the material deformed dominantly via fracturing. The few dislo- cations observed in these samples were definitely produced during deformation since they disrupted existing twin lamellae and were closely associated with the fractures. Although the high confining pressure and slow strain rates contributes to dislocation forma- tion, (0 0 1) planar defects as well as cleavage fractures
1984
in 123 prepared by grinding in a mortar and pestle had been observed [8]. The 500~ material shows exten- sive development of dislocations arrays on the (0 0 1) planes along with possible deformation twinning. There is no indication of cross-slip or climb of these dislocations. The slight change in crystallographic orientation across these dislocation arrays indicates that these arrays are subgrain boundaries. This is further substantiated by the change in optical activity across the (0 0 1) boundaries. Both optical and TEM observations show that the {1 10} twins both cross, and terminate at, the dislocation arrays. Since defor- mation twinning can occur on the {1 1 0} planes with the same sense of shear as the transformation twins, it is difficult to determine the origin of the twins based solely on crystallographic orientation. It is possible that many of the twins observed in the 500 ~ C material are deformation twins or transformation twins which have undergone additional strain, since the morphology of the twins in the 500 ~ C material is very different from that seen in undeformed material. Figs 7a and 7b show schematically the crystallographic changes due to deformation. For simplicity, Fig. 7a shows a schematic of a 123 crystal cut parallel to the (1 1" 0) plane so the (1 1 0) twin traces are normal to the page. Fig. 7b shows the same crystallographic orien- tation after deforming at T = 500 ~ C. The light and dark patterns in Fig. 7b correspond to optical obser- vations in Fig. 2b.
The 800~ material showed many of the same fea- tures as the 500~ material, with some exceptions. Twin fringes were faint, suggesting that the material was reverting to the tetragonal unit cell during defor- mation. This transformation was most likely due to a loss of 02 during the heating since the chemical environment was reducing in these experiments. Loss of O~ is also substantiated by the magnetization data. The (00 1) subgrain boundaries were much more closely spaced. There is indication that dislocation climb was occurring during deformation, particularly in those crystals whose (00 l) planes were at low angles to the maximum confining stress. The dense tangles of dislocations form a polygonalized structure with {1 0 0} and {1 1 0} as climb planes (Fig. 8). The regions between dense dislocation tangles appear to be forming the tetragonal unit cell since the polygonalized regions showing no twinning and few dislocations.
The dislocations produced during deformation

(001)
r
(110)
Figure 8 Schematic of the polygonal substructure in the deformed 123. The climb planes appear to be of the type [1001 and {110}.
have the same line vector as those produced by melt- textured growth ((1 00)). However, the inferred slip plane in the melt-textured growth material was the ,r 00}, not the (00 1) as determined in this study [9]. Earlier high resolution TEM on as-sintered 123 pos- tulated dislocations to be a(1 00 ) (00 1) [ref. 10].
The overall behaviour of the 123 material can be explained with conventional thermodynamics. For anisotropic materials, the flow stress is a function of crystallographic orientation as well as strain rate and temperature,
= Q,,,A exp ( - A G / k T ) (3)
where Q,,, is the dislocation density and AG is the activation energy for dislocation movement which varies for different slip systems [11]. For T = 25 ~ C, the energy barrier a dislocation must overcome in order to slip is, in general, much larger than the energy necessary to form new surfaces, and the material frac- tures. Dislocations are produced where the stress con- centrations on the slip plane are sufficient to overcome the opposing energy barrier. With increasing tempera- ture, thermal agitation increases, reducing the energy barrier for dislocation movement, and dislocations are produced more easily. By T = 500 ~ except when the applied stress is unfavourable for slip, dislocations are produced instead of fractures. The ductility is still low, however, since slip is confined to the (0 0 1) plane. However, the material may also deform plastically via twinning; deformation twinning is theoretically poss- ible on the {1 10} planes, and there is optical and TEM evidence for { 1 1 0} twins being formed during deformation in the 500~ samples. At T = 800 ~ C, there was enough thermal energy to allow for dislo- cation climb as indicated by the appearance of poly- gonal structures, but no evidence of cross-slip was seen and the material was still very brittle. Also, the loss of 02 at this temperature prevented the transfor- mation to the orthorhombic unit cell upon cooling, precluding formation of twins. The effect of strain rate on the deformation behaviour has yet to be investi- gated, but in general it can be expected that the faster the strain rate, the higher the temperature necessary to induce the same amount of plastic behaviour.
The most striking microstructural changes between the as-deformed material and the 900~ annealed material are the formation of stacking faults in place of dislocation arrays and a finer twinning pattern. This was true of all the deformed material studied, regardless of the temperature of deformation. It is
hypothesized that the finer spaced {1 10} twins seen in the samples after the 900~ anneal are transfor- mational twins formed during the cooling through the tetragonal orthorhombic transition and subsequent re-oxygenation. The closer spaced twins are a result of a smaller grain size after deformation {12]. The higher the temperature at which the material was deformed, the more closely spaced the dislocation arrays became, thus, more stacking faults were seen in the 800~ samples than in the 25 and 500 ~ C samples. The stack- ing faults appear to cross the twins with little disrup- tion. Since the twins are removed during the orthogonal to tetragonal transition at 710 ~ C in one atmosphere of 02, it can be assumed that the twins seen in the post- annealed material formed either concurrently with or, what is more probable, after the formation of the stacking faults.
One possible model for the formation of a stacking fault requires either the loss (or insertion) of either a Ba-Cu or a Y-Cu layer. If a layer were lost, the stoichiometry would be ACuO2 (A is Ba or Y) [13] with a stacking fault vector of c /3(00 1). Another model would be the loss o fa Ba or Y layer or insertion o fa CuO layer, resulting in a double CuO layer similar to that seen in degraded 123 which has a fault vector of (a/2, O, c/6) [14]. Why the dislocations should dis- sociate during the annealing is not yet clear. The large separation of the partials forming the stacking faults suggests a low stacking fault energy for this material. A minimum stacking fault energy of 11.56 ergscm -2 was estimated by using the largest measured separ- ation of the partials (0.35/tm), the shortest possible Burgers vector (a(1 0 0)), and the following relation- ship [11]
Gb 2 7 - 4~d (4)
where G = 35.2 GPa [15]. For comparison, this value for the shear modulus is similar to that of silica glass.
4.2. Magnetization data The magnetization data demonstrates that deformation and subsequent annealing results in microstructural changes which alter the effective superconducting grain size of this material. Although the data cannot be quantitatively interpreted at this time, some quali- tative observations can be made. The decrease in mag- netization for the 25~ material is believed to be a result of the comminution of the larger particles due primarily to brittle fracturing. No oxygen was lost during the deformation since there was no change in the magnitude of the magnetization or curvature for the 25~ material after the 450~ anneal. The increase in the magnetization after the 900~ anneal may reflect healing of microfractures which would give a larger effective grain size although no positive evidence has yet been observed in the TEM to support the hypothesis of healing microfl'actures. The only microstructural changes observed in the TEM after the 900 ~ C anneal was the formation of stacking faults where the occasional dislocations formerly existed. The 123 material deformed at 500 ~ C shows a substan- tial decrease in the magnetization but only a slight
1985

change in the curvature due to deformation. A sub- stantial increase in magnetization and in the curvature is observed after the 4500 C anneal for both the 500 and 800 ~ C material which can be attributed primarily to oxygen uptake. The efficiency of the oxygen uptake may be hindered by the increased densification as a result of the high pressure deformation. The 900~ anneal of the 500~ material results in a sharper transition but little change in the magnetization compared to the 450~ anneal. The 500 and 800~ materials both show very similar magnetization values after the 900~ anneal, but both are substantially lower than for the 25 ~ C material. The slight deviation from an ideally smooth curve for all the samples after the 900 ~ C anneal may be due to inhomogeneous flux trapping due to thermal gradients in the sample result- ing from cooling too quickly.
These data suggest that the recovery occurring during the 900~ anneal results in subgrain bound- aries which act as efficiently as grain boundaries to impede the superconducting currents. This is expected since the subgrain boundaries are normal to the Cu-O planes which carry the superconducting currents.
5. C o n c l u s i o n s Based upon optical and transmission electron micro- scopy observations and magnetization measurements, the following conclusions can be drawn.
1. The results of these preliminary experiments sug- gests that the 123 material will be very difficult to plastically deform as slip only appears to occur on the (0 0 1) plane. The lack of multiple slip systems implies that this material will show some brittle behaviour up to a very high homologous temperature. Even when plastic behaviour can be sustained for high strains it may require high annealing temperatures to remove lattice imperfections which appear to disrupt the superconducting currents.
2. Densification by high pressure deformation may make re-oxygenation difficult due to the reduced dif- fusion rates between the grains [16].
3. The preceding conclusions imply that fabrication of 123 will involve innovative techniques.
4. More work needs to be carried out to determined how annealing affects the microstructures of deformed materials and how these changes in microstructure affect the superconducting properties of these materials. Of particular importance is the effect of low
angle grain boundaries on the effective superconduct- ing grain size.
Acknowledgements We would like to thank the Department of Geological and Atmospheric Sciences at Iowa State University for the use of their triaxial press. This work was performed at the Ames Laboratory, Iowa State Uni- versity and was supported by the Director of Energy Research, Office of Basic Sciences, US Department of Energy under Contract No. W-7405-Eng-82.
References |. D. W. MURPHY, D. W. JOHNSON, S. JIN and R. E,
HOWARD, Science 241 (1988) 922.
2. S. JIN, T. H. TIEFEL, R. C+ SHERWOOD, R . B .
VAN DOVER, M. E. DAVIS, G. W. KAMMLOTT and
R. A. FASTNACHT, Appl. Phys. Lett. 52 (1988) 2074.
3. T. E. TULLIS and J. A. TULLIS, in "Mineral and Rock
Deformation Laboratory Studies" (Geophysical Monograph
36, American Geophysical Union, Washington, DC, 1986)
p. 297.
4. J. D. VERHOEVEN, Metallography 22 (1988) 245.
5. J. HAUK, K. BICKMAN and F. ZUCHT, J. Mater. Res. 2 (1987) 762.
6. J. R+ CLEM and V. G. KOGAN, Jpn J. Appl. Phys. 26 (1987) 1161.
7. M. TINKHAM, in +'Introduction to Superconductivity"
(Robert E. Krieger, New York, 1985) p. 296.
8. L. D. MARKS, D. J. L1, H+ SH1BAHARA and J. P. ZHANG, J. Elec. Micro. Tech. 8 (1988) 297.
9. S. NAKAHARA+ S. JIN, R. C. SHERWOOD and T. H. TIEFEL, Appl. Phys. Lea. 54 (1989) 1926.
10. Y. MATSU], E. T A K A Y A M A - M U R O M A C H I and
K. KATO. Jpn. J. Appl. Phys. 27 (1988) L350.
II. D. HULL and D. J. BACON, in +'Introduction to Dislo- cations" (International Series on Materials Science and Tech-
nology, Vol. 37, Pergamon Press, London, 1984) p. 257.
12. L. S. CHUMBLEY, J. D. VERHOEVEN, M. R. KIM, A. L. CORNELIUS and M. J. KRAMER, IEEE Suppl. MAG-25 (1989) 2337.
13. A. OURMAZD, J. C. H. SPENCE, J. M. ZUO and C. H. L1, J. Elec. Micro. Teeh. 8 (1988) 251.
14. H. W. Z A N D E R B E R G E N , R. GRONSKY and
G. THOMAS, Phys. Status Solidi (a) 105 (1988) 207.
15. H. M. LEDBETTER, M. W. AUSTIN, S. A. KIM and
M. LEI, J. Mater. Res. 2 (1987) 786.
16. J. ALS-N1ELSEN, N. H. ANDERSEN, C. BROHOLM, K. N. CLAUSEN, B. LEBECH and M. NIELSEN,
IEEE Suppl. MAG-25 (1989) 2254.
Received 15 February and accepted 17 May 1989
1 986


![Spatially resolved studies of chemical composition, critical temperature, and critical current density of a YBa[sub 2]Cu[sub 3]O[sub 7−δ] thin film](https://static.fdokumen.com/doc/165x107/63406b20b91292f29a0af454/spatially-resolved-studies-of-chemical-composition-critical-temperature-and-critical.jpg)