Farmers' Information Needs and Search Behaviors - CiteSeerX
48
IFPRI Discussion Paper 01165 March 2012 Farmers’ Information Needs and Search Behaviors Case Study in Tamil Nadu, India Suresh Chandra Babu Claire J. Glendenning Kwadwo Asenso-Okyere Senthil Kumar Govindarajan Eastern and Southern Africa Regional Office
-
Upload
khangminh22 -
Category
Documents
-
view
0 -
download
0
Transcript of Farmers' Information Needs and Search Behaviors - CiteSeerX
IFPRI Discussion Paper 01165
March 2012
Farmers’ Information Needs and Search Behaviors
Case Study in Tamil Nadu, India
Suresh Chandra Babu
Claire J. Glendenning
Kwadwo Asenso-Okyere
Senthil Kumar Govindarajan
Eastern and Southern Africa Regional Office
INTERNATIONAL FOOD POLICY RESEARCH INSTITUTE
The International Food Policy Research Institute (IFPRI) was established in 1975. IFPRI is one of 15 agricultural research centers that receive principal funding from governments, private foundations, and international and regional organizations, most of which are members of the Consultative Group on International Agricultural Research (CGIAR).
PARTNERS AND CONTRIBUTORS IFPRI gratefully acknowledges the generous unrestricted funding from Australia, Canada, China, Denmark, Finland, France, Germany, India, Ireland, Italy, Japan, the Netherlands, Norway, the Philippines, South Africa, Sweden, Switzerland, the United Kingdom, the United States, and the World Bank.
AUTHORS Suresh Chandra Babu, International Food Policy Research Institute Senior Research Fellow, Partnership Impact and Capacity Strengthening Unit [email protected] Claire J. Glendenning, International Food Policy Research Institute Postdoctoral Fellow, Eastern and Southern Africa Regional Office Kwadwo Asenso-Okyere, International Food Policy Research Institute Director, Eastern and Southern Africa Regional Office Senthil Kumar Govindarajan, International Food Policy Research Institute Project Coordinator, Eastern and Southern Africa Regional Office
Notices 1.IFPRI Discussion Papers contain preliminary material and research results. They have been peer reviewed but have not been subject to a formal external review via IFPRI’s Publications Review Committee. They are circulated in order to stimulate discussion and critical comment; any opinions expressed are those of the author(s) and do not necessarily reflect the policies or opinions of IFPRI. 2.The boundaries and names shown and the designations used on the map(s) herein do not imply official endorsement or acceptance by the International Food Policy Research Institute (IFPRI) or its partners and contributors.
Copyright 2012 International Food Policy Research Institute. All rights reserved. Sections of this material may be reproduced for personal and not-for-profit use without the express written permission of but with acknowledgment to IFPRI. To reproduce the material contained herein for profit or commercial use requires express written permission. To obtain permission, contact the Communications Division at [email protected].
iii
Contents
Abstract v
Acknowledgments vi
Abbreviations and Acronyms vii
1. Introduction 1
2. Conceptual Framework for Assessing Farmers’ Information Needs and Search Behavior 2
3. Study Area Description, Data, and Methodology 6
4. Results 10
5. Discussion and Policy Implications 32
6. Concluding Remarks 34
References 35
iv
Tables
3.1—Survey random sampling strategy 7 3.2—Description of explanatory variables for logistic regression model and ordered probit model 8 4.1—Sociodemographic variables, by district of household head (percentage) 10 4.2—Main crops grown during Samba crop season in the study districts 11 4.3—Summary statistics for the three variables used in information search clusters 11 4.4—Search behavior clusters identified from Ward’s cluster analysis 12 4.5—Search behavior clusters, by sociodemographic characteristics 13 4.6—Search behavior clusters, by district 14 4.7—Importance of rice information needs, by search behavior cluster 17 4.8—Other information needs, by search behavior cluster 19 4.9—Factors derived from principal components analysis with corresponding Cronbach’s alpha,
variables, and loading for each variable 20 4.10—Four factors of rice information needs, by search behavior cluster 20 4.11—Attitude toward information 21 4.12—Factors for attitude toward information, using principal components analysis with Cronbach’s
alphas and loadings 22 4.13—Four factors 22 4.14—Fraction of medium used, by search behavior cluster 25 4.15—Preferences for information media 27 4.16—Logit regression of high search category and low search category 28 4.17—Willingness to pay, by search behavior cluster 30 4.18—Ordered probit regression model for willingness to pay for information 30
Figures
2.1—A conceptual framework of farmers’ information needs and search behavior 4 3.1—Position of Thanjavur (light gray) and Tiruvarur (dark gray) in Tamil Nadu state in India 6 4.1—Dendogram of cluster analysis for number of information sources accessed, frequency of
information source use, and number of sources from which information was acted on by farmers 12
4.2—Crops for which information was most required (1st, 2nd, and 3rd rank) 14 4.3—Top three crop ranks for which information was needed, by search behavior cluster 15 4.4—Rice information needs, by importance and percentage who had accessed that information 16 4.5—Noncrop information needs, by importance 18 4.6—Type of sources accessed, by number of sources accessed (from 1 to 7) 24 4.7—Sources accessed by each search behavior cluster 24 4.8—Preferred information medium 26 4.9—Willingness to pay for voice-based mobile messages 29
v
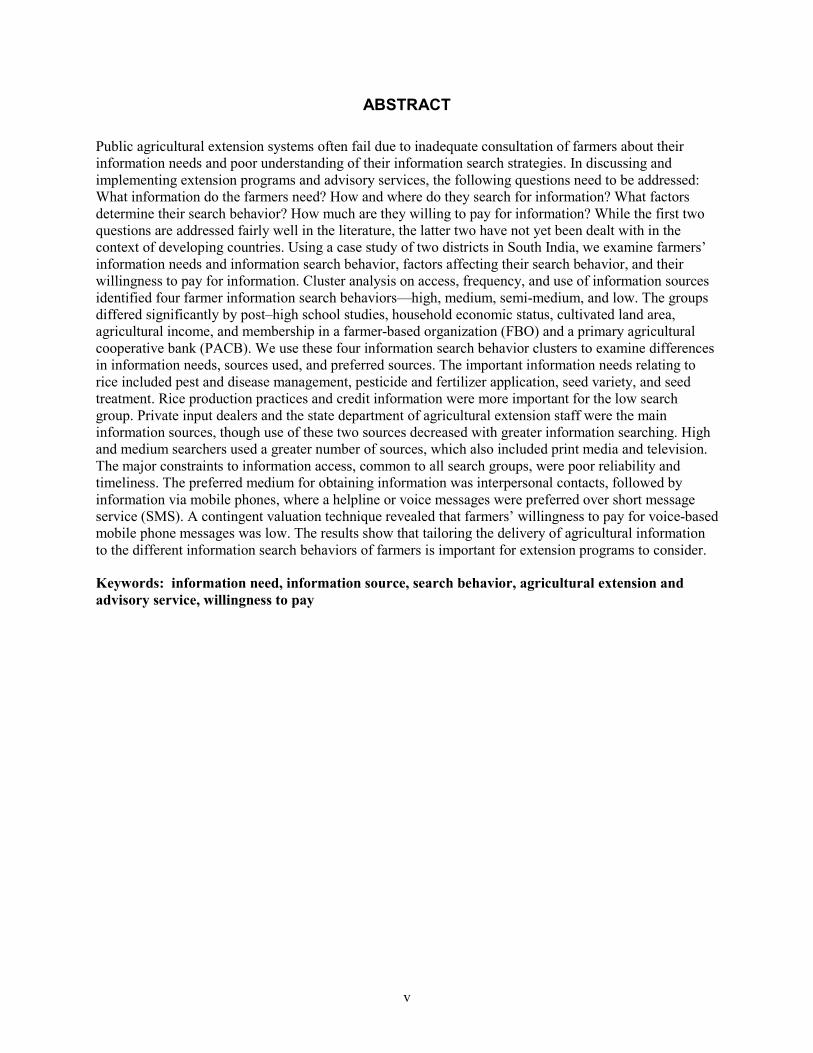
ABSTRACT
Public agricultural extension systems often fail due to inadequate consultation of farmers about their information needs and poor understanding of their information search strategies. In discussing and implementing extension programs and advisory services, the following questions need to be addressed: What information do the farmers need? How and where do they search for information? What factors determine their search behavior? How much are they willing to pay for information? While the first two questions are addressed fairly well in the literature, the latter two have not yet been dealt with in the context of developing countries. Using a case study of two districts in South India, we examine farmers’ information needs and information search behavior, factors affecting their search behavior, and their willingness to pay for information. Cluster analysis on access, frequency, and use of information sources identified four farmer information search behaviors—high, medium, semi-medium, and low. The groups differed significantly by post–high school studies, household economic status, cultivated land area, agricultural income, and membership in a farmer-based organization (FBO) and a primary agricultural cooperative bank (PACB). We use these four information search behavior clusters to examine differences in information needs, sources used, and preferred sources. The important information needs relating to rice included pest and disease management, pesticide and fertilizer application, seed variety, and seed treatment. Rice production practices and credit information were more important for the low search group. Private input dealers and the state department of agricultural extension staff were the main information sources, though use of these two sources decreased with greater information searching. High and medium searchers used a greater number of sources, which also included print media and television. The major constraints to information access, common to all search groups, were poor reliability and timeliness. The preferred medium for obtaining information was interpersonal contacts, followed by information via mobile phones, where a helpline or voice messages were preferred over short message service (SMS). A contingent valuation technique revealed that farmers’ willingness to pay for voice-based mobile phone messages was low. The results show that tailoring the delivery of agricultural information to the different information search behaviors of farmers is important for extension programs to consider.
Keywords: information need, information source, search behavior, agricultural extension and advisory service, willingness to pay
vi
ACKNOWLEDGMENTS
This paper emanated from a project funded by IKP Trust of India, to whom we are grateful.
vii
ABBREVIATIONS AND ACRONYMS
AAO assistant agricultural officer AO agricultural officer APL above poverty Line ATMA Agricultural Technology Management Agency FBO farmer-based organization FGD focus group discussion ICT information and communication technology IKSL IFFCO Kisan Sanchar Limited NGO nongovernmental organization PACB primary agricultural cooperative bank RML Reuters Market Light SC/ST scheduled caste / scheduled tribe SMS short message service SRI System of Rice Intensification TANWA Tamil Nadu Women in Agriculture VAO village administrative officer WTP willingness to pay

1
1. INTRODUCTION
The agriculture sector in developing countries is becoming increasingly knowledge intensive. Researchers at the global, regional, and national levels continue to generate new information. As agriculture systems become more complex, farmers’ access to reliable, timely, and relevant information sources becomes more critical to their competitiveness. Information must be relevant and meaningful to farmers, in addition to being packaged and delivered in a way preferred by them (Diekmann, Loibl, and Batte 2009).
Context-specific information could have a greater impact on the adoption of technologies and increase farm productivity for marginal and small agricultural landholders (Sammadar 2006). However, making information context-specific is more resource intensive. It requires information at the farm level, which could vary spatially and temporally, and with different degrees of specificity (Garforth et al. 2003). Despite the additional cost and time associated with generating localized content, this content could be more relevant and useful in meeting farmers’ information needs (Cecchini and Scott 2003; UNDP 2001). Since developing appropriate educational and marketing strategies for farmers will need to reflect how farmer groups differ in their information search behavior, a better understanding of farmers’ agricultural information needs and information search behaviors could help guide extension and other agricultural programs to better target specific groups of farmers. This has important implications for extension programs, particularly where information failures in public-sector extension systems (such as limited feedback and reach to farmers) has reduced content relevance and thus extension impact (Anderson and Feder 2004, 2007).
Information needs assessments give program designers the ability to develop interventions that target users with specific information needs. Information needs can be classified according to the “agricultural cycle” (Mittal, Gandhi, and Tripathi 2010) or the “agricultural value chain” (de Silva and Ratnadiwakara 2008; Ali and Kumar 2011). Both approaches work through the different phases of decisionmaking that a farmer faces during a cropping season—acquisition of inputs, production planning, cultivation, harvesting, packing and storing, transportation, and selling. In addition to production-oriented information, off-farm income-generation options and the implications of changing policies are also important information needs (Van den Ban 1998), in addition to information on sustainable natural resource management (Swanson 2008). In an information needs assessment, a farmer may highlight an important information need based on his or her requirements and interests, but unfelt or unrecognized needs will not be revealed through this approach (Carter and Batte 1993). Nevertheless, the value of an information needs assessment, by engaging directly with users of information, should not be overlooked. A two-way process enables farmers to share lessons and best practices related to their farm enterprise, thus incorporating their knowledge base as well (de Silva and Ratnadiwakara 2008). An information needs assessment should act as an initial guide to developing programs, so that contextually appropriate content is generated (Chapman and Slaymaker 2002; Roman and Colle 2003).
This paper has two tasks. First, we describe an economic approach to information search behavior among farmers. Second, we present some basic evidence testing the implications of this approach by identifying the information needs of farmers and the differences in needs across the farming population in two districts of Tamil Nadu: Thanjavur and Tiruvarur. The paper relies on a farm-level survey of 576 farmers using a structured questionnaire and 27 focus group discussions to examine farmers’ information needs relating to rice cultivation and other general information. A key objective of this study is to identify farmers’ information needs, their sources of information, and their preferences with regard to sources.
The paper is organized as follows: the next section develops a conceptual framework for assessing farmers’ information needs and search behavior. Section 3 describes the study area, the methodology, and the data used in the study. Section 4 presents the results of the analysis of farmer information search behavior, and how information search behavior influences farmers’ information needs and their preferences for information sources. Section 5 discusses the policy implications. Concluding remarks form the last section.
2
2. CONCEPTUAL FRAMEWORK FOR ASSESSING FARMERS’ INFORMATION NEEDS AND SEARCH BEHAVIOR
In his broad review of the contributions of the economics of information, Stiglitz (2000) suggests that only limited progress has been made in understanding how societies and communities such as farmer groups absorb and adapt to using new information. Also, he predicts that further advances will be made in understanding how different organizational designs will influence the nature of information generation, transmission, absorption, and use (Stiglitz 2000, 1471).
Understanding farmers’ information needs helps in designing appropriate policies, programs, and organizational innovations. At least three strands of literature that highlight the importance of information search and use are helpful in the context of the economics of information in agriculture. First, studies that recognize that economic agents guide their future choices by effectively using their accumulated information and experience emphasize the role of learning equally with the search for new information (Callander 2011). Beginning with Arrow (1962), these studies have developed both theoretical and empirical evidence on how economic agents learn by experimenting with the choices of production processes. The optimal level of investment in experimentation and learning has also been explored (Aghion et al. 1991).
Since Putnam’s (1993) exposition of the role of social capital in the sharing and use of information by members of a community, modeling the factors that contribute to accumulation of social capital has gained importance (Glaeser, Laibson, and Sacerdote 2002). In the context of farmers’ information search and use behavior, social capital can play a crucial role. Progressive farmers, for example, could have a higher propensity to invest in accumulating social capital by joining farmers’ clubs and associations, which may enhance their access to current information. Farmers’ interactions with other farmers, private input dealers, and extension workers, and long-standing relationships with government officials, can be captured by their level of social capital. Understanding the factors affecting social capital formation—such as individual characteristics of farmers and their investments in developing and nurturing relationships—could be helpful in understanding farmers’ information-seeking behavior.
The third set of literature that connects individual characteristics to information search behavior relates to the formation of aspirations (Bernard, Dercon, and Taffesse 2011). The capacity to aspire and gaps in aspiration could influence the search behavior of individuals (Ray 2006; Appadurai 2002). Thus, socioeconomic and psychological characteristics that affect farmers’ aspirations in life could influence their search behavior.
In what follows we review selected applied studies that attempt to explain information search behavior by farmers.
Farmers are clearly not a homogenous group, and understanding the specific factors that influence their information source selection, access, and use is a first step toward better targeting of extension programs and advisory services that facilitate information sharing. However, a majority of published literature that examines the factors that affect farmers’ information search behaviors, and the factors that influence farmers’ use of different information sources, comes from studies in developed countries.
Factors that influence farmers’ use of information include personal characteristics such as age (Carter and Batte 1993), education (Waller et al. 1998), and experience in farming (Schnitkey et al. 1992); business characteristics such as market orientation of farming (Ngathou Bukenya and Chembezi, 2006), farm size (Solano et al. 2003; Alvarez and Nuthall 2006; Llewellyn 2007), type of farm enterprise (Carter and Batte 1993), debt level (Tucker and Napier 2002), and ownership of farm (Ngathou et al. 2002); and geographical characteristics such as distance to market centers (Solano et al. 2003) and distance to nearest technological adopter (Llewellyn 2007).
Recent studies go beyond the factors influencing farmer information use to identify opportunities for interventions that will help increase information dissemination, based on the information search behavior of the farmers. Bekele (2006) used Ethiopian farmers’ subjective rankings of agricultural problems and a stated preference model to determine their preferences for development intervention.
3
Socioeconomic circumstances and ranking of agricultural problems play a major role in the type of development intervention preferred. Villamil, Silvis, and Bollero (2008) found a high degree of variability in preferences for methods of information delivery among farmers, even in small geographic areas, and suggested segmenting the population into target groups to increase the efficiency of knowledge communication through each group’s preferred information channels. Diekmann, Loibl, and Batte (2009) describe four typologies of search behavior based on frequency of use: low, moderate, online, and high. Farmers’ attitudes toward information search, farm sales, years farming, Internet access, and farm type were good predictors of their information search strategies. Those farmers with more self-confidence about making decisions tended to have higher information search behavior. These studies conclude that by understanding the information needs of farmers, programs can be better customized to address the needs of different groups.
Published studies on farmer information needs and preferences are limited in developing countries. In Africa, farmer information sources and information needs have been analyzed (Aina 2006; Stefane et al. 2005; Kaniki 1991), and a number of studies have examined the factors that influence farmer search strategies (Okwu and Dauda 2011; Opara 2010; Adolwa et al. 2010). In India, for example, where more than half the population is dependent on agriculture and allied activities, improved knowledge delivery to farmers is needed to support sustainable farm productivity. But the factors that influence farmers’ information needs or sources are rarely explored. An analysis of the Indian NSSO 2003 survey showed that small and marginal farmers accessed less information, and from fewer sources, than medium and large-scale farmers (Adhiguru, Birthal, and Ganesh Kumar 2009). Studies like this show the heterogeneity of farmer access and use of information, but a greater understanding of the factors that influence information source access, use, and preference is needed. Factors that influence information search strategies are not common to all regions in a country. For example, Halakatti, Gowda, and Natikar (2010), in the Haveri district of Karnataka, examined farmers’ use of mass media; television was most used, followed by radio and then print media. Meitei and Devi (2009), in rural Manipur, found that farmers needed a variety of information related to seed varieties, pesticides, and fertilizer. The preferred medium was radio, followed by television and newspapers. Bhagat, Nain, and Narda (2004) interviewed 200 farmers in Jammu and Kashmir, where the most-used information source was contact farmers, followed by the state department of extension staff, and then television and radio. Singh (1990) surveyed 120 farmers in Meghalaya and Sikkim, where information needs related mostly to cultural practices of crops, plant protection, and new varieties. Singh, Narwal, and Malik (2003) interviewed 80 farmers in Haryana and found that progressive farmers were the most frequently accessed information source. Small farmers cited market prices, weather information, information on diseases and plant protection, and seed information as their top needs (Mittal, Gandhi, and Tripathi 2010). Using the Indian NSSO 2003 survey, Adhiguru, Brithal, and Ganesh Kumar (2009) showed that small and marginal farmers accessed less information and from fewer sources than medium and large-scale farmers.
The conceptual framework presented in Figure 2.1 is based on a combination of the literature on information needs; the behavior models developed by Wilson (2006); and Diekmann, Loibl, and Batte’s (2009) framework for the economics of agricultural information. Bringing these approaches together helps show how characteristics of information search from an individual perspective translate into final welfare outcomes such as farm productivity and income through the various contexts of information search, information content and sources, and how information is converted into specific action through its adoption by the farmers.
4
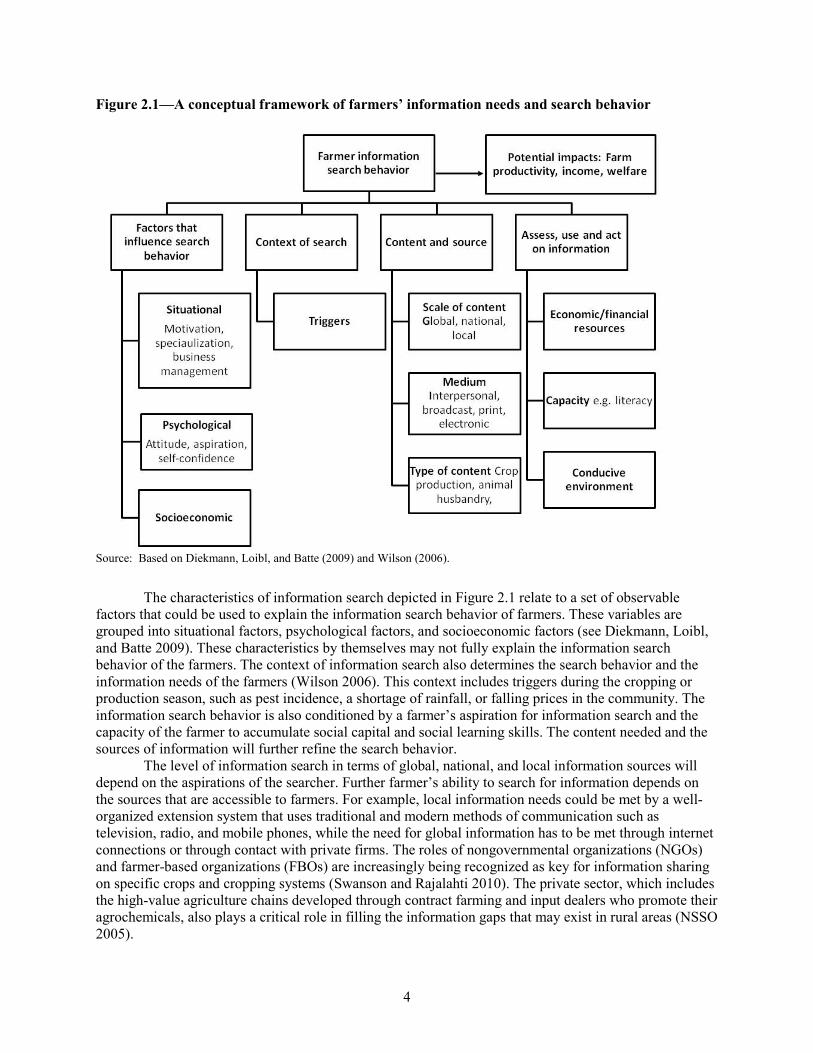
Figure 2.1—A conceptual framework of farmers’ information needs and search behavior
Source: Based on Diekmann, Loibl, and Batte (2009) and Wilson (2006).
The characteristics of information search depicted in Figure 2.1 relate to a set of observable factors that could be used to explain the information search behavior of farmers. These variables are grouped into situational factors, psychological factors, and socioeconomic factors (see Diekmann, Loibl, and Batte 2009). These characteristics by themselves may not fully explain the information search behavior of the farmers. The context of information search also determines the search behavior and the information needs of the farmers (Wilson 2006). This context includes triggers during the cropping or production season, such as pest incidence, a shortage of rainfall, or falling prices in the community. The information search behavior is also conditioned by a farmer’s aspiration for information search and the capacity of the farmer to accumulate social capital and social learning skills. The content needed and the sources of information will further refine the search behavior.
The level of information search in terms of global, national, and local information sources will depend on the aspirations of the searcher. Further farmer’s ability to search for information depends on the sources that are accessible to farmers. For example, local information needs could be met by a well-organized extension system that uses traditional and modern methods of communication such as television, radio, and mobile phones, while the need for global information has to be met through internet connections or through contact with private firms. The roles of nongovernmental organizations (NGOs) and farmer-based organizations (FBOs) are increasingly being recognized as key for information sharing on specific crops and cropping systems (Swanson and Rajalahti 2010). The private sector, which includes the high-value agriculture chains developed through contract farming and input dealers who promote their agrochemicals, also plays a critical role in filling the information gaps that may exist in rural areas (NSSO 2005).
5
To access, assess, and apply the content, users must have economic resources, including money, skills, and technology, and social resources, such as motivation, trust, confidence, and knowledge (Heeks 2005). Individuals must be able not only to access that content, assess its relevance, and apply it to a specific decision, but ultimately to act upon the information. This requires further resources at the user level, including action resources and capacity. For example, content may be available to a community, but it may not be accessed because of, for instance, low levels of literacy, or it may be accessed but not acted upon because of poor financial capacity to buy the necessary inputs. Some studies have shown that farmers who have access to information technology are more likely to participate in agricultural and rural development programs and other political, social, and cultural practices (Anastasios, Koutsouris, and Konstadinos 2010). However, unless the whole information chain operates successfully at the user level, information provided by information and communication technology (ICT) cannot contribute to development (Heeks 2005). As Coudel and Tonneau note, “Information may seem appropriate, usable, relevant, but it can only be useful if the actors have the capacity to use it and if their environment offers them the opportunity to use it” (2010, 63). A good example of this is described in a review of various ICT initiatives in India by Sulaiman et al. (2011). This study did not find any clear correlation between the use of ICT and the empowerment of women. Access to information was found necessary but not sufficient, where additional complementary services and support are required. When ICT is combined as part of an integrated service, for example, mobile information provided to rural women in Tamil Nadu to support goat rearing as part of a microfinance loan, the results have been more positive (Balasubramanian et al. 2010). The nature and extension of the benefits farmers gain by using information in specific operations will determine not only productivity and welfare outcomes but also how information is sought in the next round of information search.
In order to appropriately target extension programs and advisory services, it is therefore important to understand the factors that influence farmers’ information search behavior and the willingness of farmers to pay for information services, which will be explored in the following sections of this paper.
6
3. STUDY AREA DESCRIPTION, DATA, AND METHODOLOGY
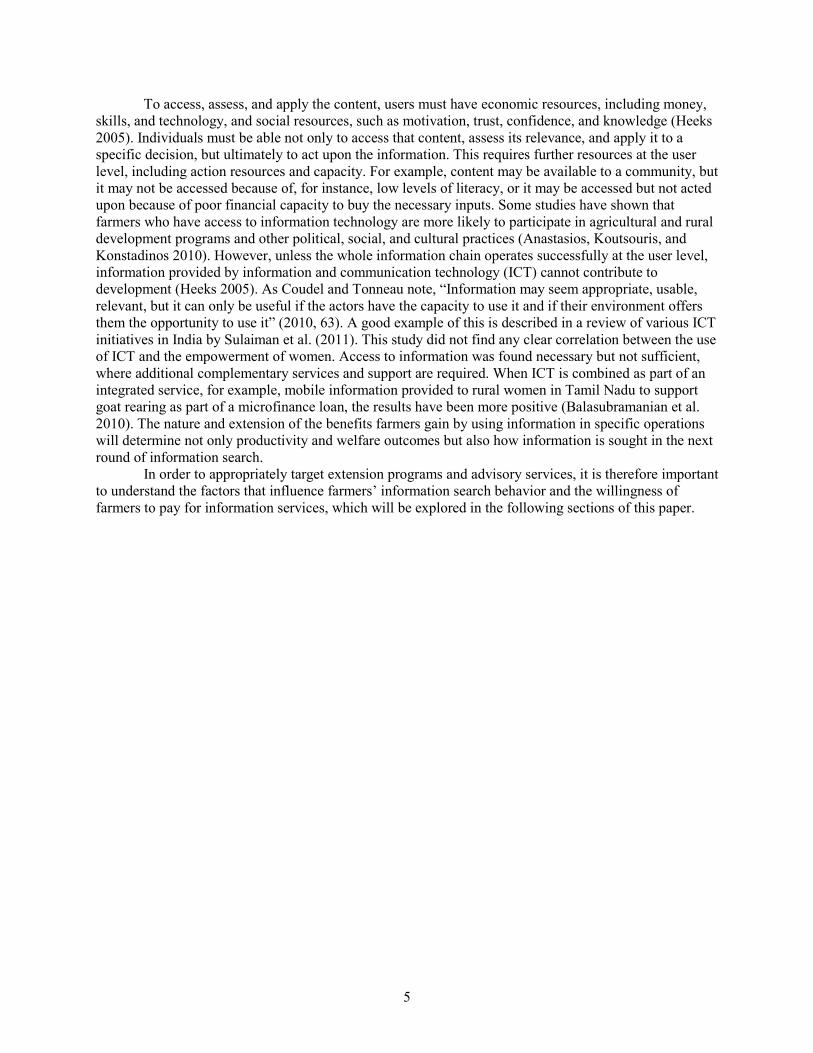
This study forms part of a larger effort to develop an integrated knowledge management system for the rice farmers of Tamil Nadu state in India. The focus of the knowledge management system begins with the two districts, Thanjavur and Tiruvarur, hence the focus on these districts in this study. Thanjavur and Tiruvarur lie on the east coast of India in the southern Indian state of Tamil Nadu (Figure 3.1). The region is traditionally known as the rice bowl of Tamil Nadu.
Figure 3.1—Position of Thanjavur (light gray) and Tiruvarur (dark gray) in Tamil Nadu state in India
Source: Maps of India (www.mapsofindia.com, Accessed February 15, 2011)
Thanjavur district has a total population of about 2,216,000, of which about 66 percent live in rural areas. It receives an average 1,053 mm annual rainfall, and 57 percent of the total area is cultivated. Thanjavur district can be divided into two distinct regions based on whether the agriculture has access to water from Cauvery River. The deltaic region covers the whole northern and eastern portions of the district, where the Cauvery River is a major source of irrigation. The upland area, or nondeltaic region, is in the southern and western parts of the district. Tiruvarur district receives an average of 967 mm annual rainfall. This district is a deltaic plain comprising old and new delta areas. The old delta has a network of canals and channels of the Cauvery River. The total population of Tiruvarur is about 1,169,000, of which 90 percent live in rural areas. The similarities in the cropping patterns make the two districts a useful case study to examine farmer information search behaviors and information needs.
Survey Data and Methodology The target population for this study was all farmers who cultivated land during 2010 in Thanjavur and Tiruvarur districts. An initial survey instrument was pretested in Thanjavur district in December 2010. The survey included sociodemographic information in addition to details on access and use of information sources. Likert scales were used to record the importance of different types of information related to rice and other farm enterprises. A contingent valuation technique using a bidding process elicited farmers’
7
willingness to pay for information delivered via mobile phone as a voice-based message. To complement the quantitative survey, 27 focus group discussions (FGDs) were conducted among various groups of farmers in eight villages. Survey data collection and FGDs were carried out between March and May 2011.
Survey Sampling Strategy Farmers were randomly sampled (Table 3.1). From each district, eight blocks were randomly selected. From each of the eight blocks, 4 villages were randomly selected. This gave a total of 32 villages across the two districts. In each village, 18 farmers were randomly selected from the farm household list maintained by the village administrative officer (VAO), using systematic random sampling. If a randomly selected farmer had not cultivated his or her land in 2010 but had rented it out, the farmer who rented out the land and cultivated it was instead interviewed. If the farmer was not available for interview, the next consecutive farmer on the list was identified for the interview.
Table 3.1—Survey random sampling strategy District Number of
Blocks Number of Villages in Each
Block Respondents per
Village Total
Respondents Thanjavur 4 4 18 288 Tiruvarur 4 4 18 288 Total 8 8 36 576
Source: Authors.
Focus Group Discussion Methodology Twenty-seven FGDs were carried out in eight randomly selected villages, from two randomly selected blocks in each district. Focus groups were formed based on landholding size and gender. In each village, the goal was to form three groups of male farmers and three groups of female farmers based on three landholding sizes: small (less than or equal to 5 acres), medium (5 to 10 acres), and large (more than 10 acres). The VAO list of landholdings was used to identify farmers. For each of the six groups, 10 farmers were randomly selected to form a group. The formation of three groups of women farmers in each village was not possible. In all villages but one, only one women’s group could be formed. Group size varied, but generally contained between 6 and 12 farmers, depending on the situation. On average, three to four FGDs were carried out in each village. The sessions were summarized and analyzed to identify trends in the qualitative responses of the participants regarding their agricultural information needs, information sources used, preferred information medium, and bottlenecks to information searching.
Data Analysis In addition to the descriptive statistics computed from the data, cluster and factor analyses were used. Cluster analysis enabled similar information search behaviors of farmers to be assembled into meaningful groups. Factor analysis was applied to the different information needs related to rice and to the attitudes toward information to reduce the variables into larger overarching groups. These variables were then used in the models, as explained below.
Information Search Behaviors The high and low information search behaviors, defined using Ward’s hierarchical clustering technique, were used as two separate dependent variables in two logit regression models. To determine the factors that influence high search behaviors and low search behaviors, the variables in Table 3.2 were used.
8
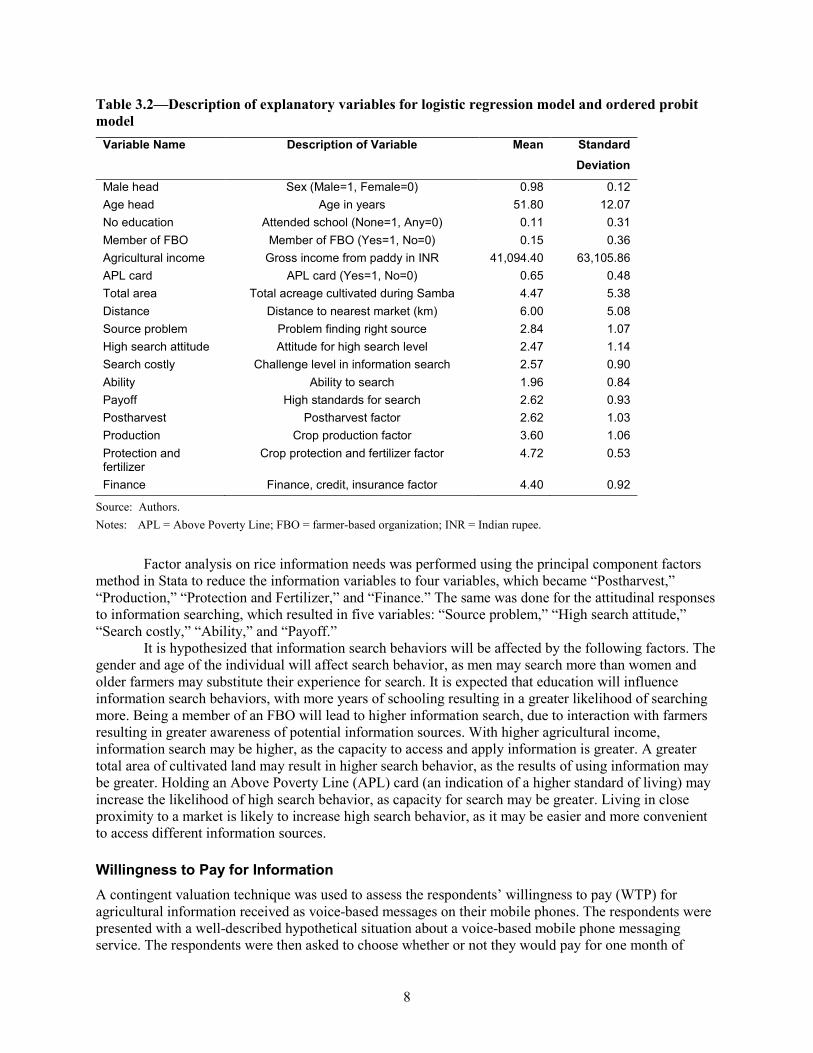
Table 3.2—Description of explanatory variables for logistic regression model and ordered probit model
Variable Name Description of Variable Mean Standard Deviation
Male head Sex (Male=1, Female=0) 0.98 0.12 Age head Age in years 51.80 12.07 No education Attended school (None=1, Any=0) 0.11 0.31 Member of FBO Member of FBO (Yes=1, No=0) 0.15 0.36 Agricultural income Gross income from paddy in INR 41,094.40 63,105.86 APL card APL card (Yes=1, No=0) 0.65 0.48 Total area Total acreage cultivated during Samba 4.47 5.38 Distance Distance to nearest market (km) 6.00 5.08 Source problem Problem finding right source 2.84 1.07 High search attitude Attitude for high search level 2.47 1.14 Search costly Challenge level in information search 2.57 0.90 Ability Ability to search 1.96 0.84 Payoff High standards for search 2.62 0.93 Postharvest Postharvest factor 2.62 1.03 Production Crop production factor 3.60 1.06 Protection and fertilizer
Crop protection and fertilizer factor 4.72 0.53
Finance Finance, credit, insurance factor 4.40 0.92
Source: Authors. Notes: APL = Above Poverty Line; FBO = farmer-based organization; INR = Indian rupee.
Factor analysis on rice information needs was performed using the principal component factors method in Stata to reduce the information variables to four variables, which became “Postharvest,” “Production,” “Protection and Fertilizer,” and “Finance.” The same was done for the attitudinal responses to information searching, which resulted in five variables: “Source problem,” “High search attitude,” “Search costly,” “Ability,” and “Payoff.”
It is hypothesized that information search behaviors will be affected by the following factors. The gender and age of the individual will affect search behavior, as men may search more than women and older farmers may substitute their experience for search. It is expected that education will influence information search behaviors, with more years of schooling resulting in a greater likelihood of searching more. Being a member of an FBO will lead to higher information search, due to interaction with farmers resulting in greater awareness of potential information sources. With higher agricultural income, information search may be higher, as the capacity to access and apply information is greater. A greater total area of cultivated land may result in higher search behavior, as the results of using information may be greater. Holding an Above Poverty Line (APL) card (an indication of a higher standard of living) may increase the likelihood of high search behavior, as capacity for search may be greater. Living in close proximity to a market is likely to increase high search behavior, as it may be easier and more convenient to access different information sources.
Willingness to Pay for Information A contingent valuation technique was used to assess the respondents’ willingness to pay (WTP) for agricultural information received as voice-based messages on their mobile phones. The respondents were presented with a well-described hypothetical situation about a voice-based mobile phone messaging service. The respondents were then asked to choose whether or not they would pay for one month of
9
mobile phone voice messages at a specified price. A structured bidding procedure was used. For example, if the respondent declined an initial high offer, the subscription price was lowered and the respondent was asked to reconsider the new offer. The offer was lowered successively until a bid was accepted or until the lowest offer was reached. An ordered probit model was estimated to determine significant variables related to respondents’ WTP for information through mobile technology.
The WTP was estimated using a multivariate ordered probit model with eight explanatory variables (Table 3.2). It is hypothesized that WTP for voice messages on a mobile phone would differ depending on the gender and age of the individual. It is expected that education would influence WTP, with more years of schooling resulting in greater WTP, as the awareness and capacity to use mobile phones and access information from this channel may be greater. It is expected that being a member of an FBO would increase WTP, for a similar reason as explained above. If any extension service is used, WTP might be greater because of demonstrated interest in accessing many information sources. With higher agricultural income WTP may be higher, as the capacity to pay is greater. Larger land area cultivated may increase WTP, as information needs may be greater and capacity as well. Higher living standards, as indicated by an APL card, would be expected to demonstrate a similar increase in WTP. Distance to market may increase WTP, as those further from a market may find it more convenient to receive information directly via mobile phone.
10
4. RESULTS
The results presented below describe the following: (1) information search and use behaviors of farmers, (2) information needs of farmers, (3) factor analysis of rice information needs, (4) attitude of farmers toward information search and factor analysis of these attitudinal variables, (5) constraints to information access, (6) information sources farmers accessed, (7) preferred information medium, (8) factors that influence information search behaviors of farmers, and (9) farmers’ willingness to pay for agricultural information via mobile phone as a voice-based message.
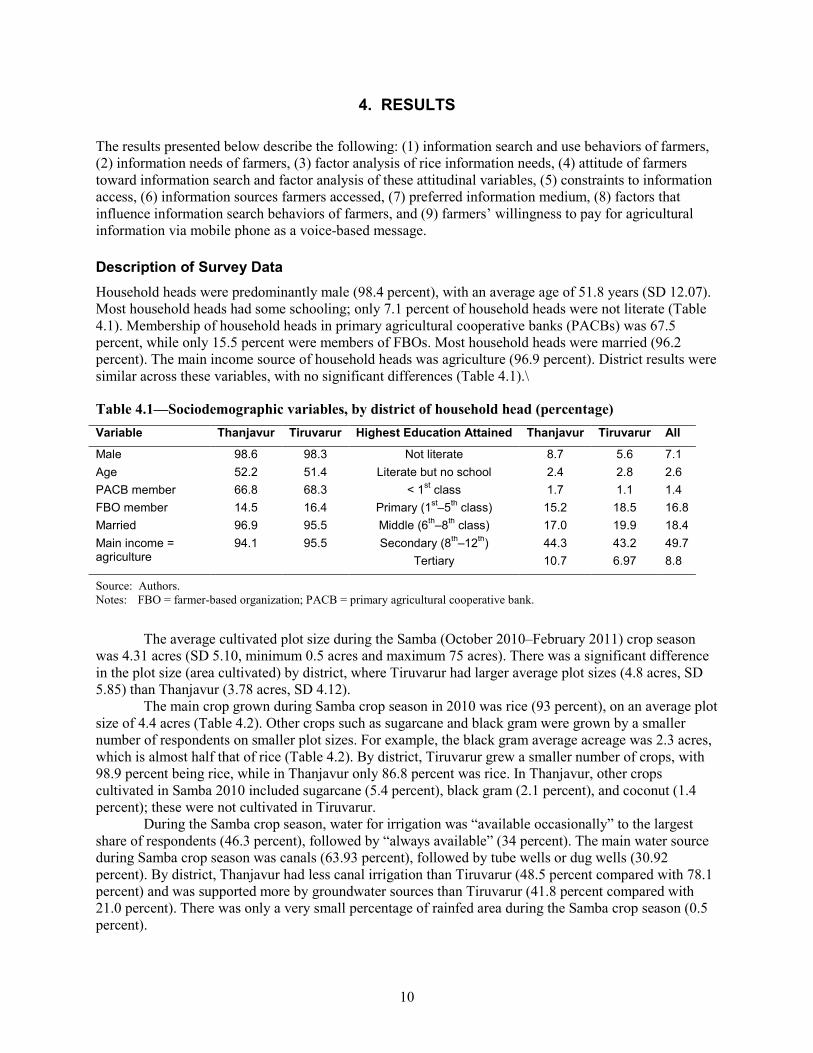
Description of Survey Data Household heads were predominantly male (98.4 percent), with an average age of 51.8 years (SD 12.07). Most household heads had some schooling; only 7.1 percent of household heads were not literate (Table 4.1). Membership of household heads in primary agricultural cooperative banks (PACBs) was 67.5 percent, while only 15.5 percent were members of FBOs. Most household heads were married (96.2 percent). The main income source of household heads was agriculture (96.9 percent). District results were similar across these variables, with no significant differences (Table 4.1).\
Table 4.1—Sociodemographic variables, by district of household head (percentage) Variable Thanjavur Tiruvarur Highest Education Attained Thanjavur Tiruvarur All
Male 98.6 98.3 Not literate 8.7 5.6 7.1 Age 52.2 51.4 Literate but no school 2.4 2.8 2.6 PACB member 66.8 68.3 < 1st class 1.7 1.1 1.4 FBO member 14.5 16.4 Primary (1st–5th class) 15.2 18.5 16.8 Married 96.9 95.5 Middle (6th–8th class) 17.0 19.9 18.4 Main income = agriculture
94.1 95.5 Secondary (8th–12th) 44.3 43.2 49.7 Tertiary 10.7 6.97 8.8
Source: Authors. Notes: FBO = farmer-based organization; PACB = primary agricultural cooperative bank.
The average cultivated plot size during the Samba (October 2010–February 2011) crop season was 4.31 acres (SD 5.10, minimum 0.5 acres and maximum 75 acres). There was a significant difference in the plot size (area cultivated) by district, where Tiruvarur had larger average plot sizes (4.8 acres, SD 5.85) than Thanjavur (3.78 acres, SD 4.12).
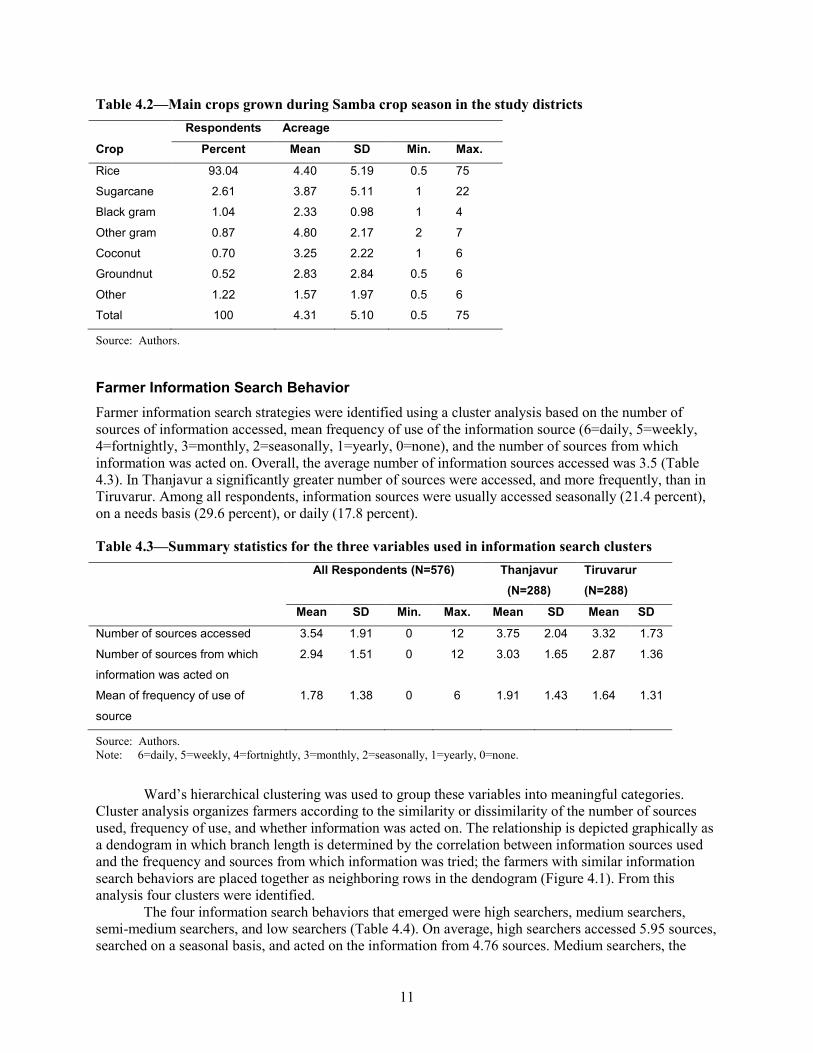
The main crop grown during Samba crop season in 2010 was rice (93 percent), on an average plot size of 4.4 acres (Table 4.2). Other crops such as sugarcane and black gram were grown by a smaller number of respondents on smaller plot sizes. For example, the black gram average acreage was 2.3 acres, which is almost half that of rice (Table 4.2). By district, Tiruvarur grew a smaller number of crops, with 98.9 percent being rice, while in Thanjavur only 86.8 percent was rice. In Thanjavur, other crops cultivated in Samba 2010 included sugarcane (5.4 percent), black gram (2.1 percent), and coconut (1.4 percent); these were not cultivated in Tiruvarur.
During the Samba crop season, water for irrigation was “available occasionally” to the largest share of respondents (46.3 percent), followed by “always available” (34 percent). The main water source during Samba crop season was canals (63.93 percent), followed by tube wells or dug wells (30.92 percent). By district, Thanjavur had less canal irrigation than Tiruvarur (48.5 percent compared with 78.1 percent) and was supported more by groundwater sources than Tiruvarur (41.8 percent compared with 21.0 percent). There was only a very small percentage of rainfed area during the Samba crop season (0.5 percent).
11
Table 4.2—Main crops grown during Samba crop season in the study districts Respondents Acreage
Crop Percent Mean SD Min. Max.
Rice 93.04 4.40 5.19 0.5 75
Sugarcane 2.61 3.87 5.11 1 22
Black gram 1.04 2.33 0.98 1 4
Other gram 0.87 4.80 2.17 2 7
Coconut 0.70 3.25 2.22 1 6
Groundnut 0.52 2.83 2.84 0.5 6
Other 1.22 1.57 1.97 0.5 6
Total 100 4.31 5.10 0.5 75
Source: Authors.
Farmer Information Search Behavior Farmer information search strategies were identified using a cluster analysis based on the number of sources of information accessed, mean frequency of use of the information source (6=daily, 5=weekly, 4=fortnightly, 3=monthly, 2=seasonally, 1=yearly, 0=none), and the number of sources from which information was acted on. Overall, the average number of information sources accessed was 3.5 (Table 4.3). In Thanjavur a significantly greater number of sources were accessed, and more frequently, than in Tiruvarur. Among all respondents, information sources were usually accessed seasonally (21.4 percent), on a needs basis (29.6 percent), or daily (17.8 percent).
Table 4.3—Summary statistics for the three variables used in information search clusters All Respondents (N=576) Thanjavur
(N=288) Tiruvarur (N=288)
Mean SD Min. Max. Mean SD Mean SD
Number of sources accessed 3.54 1.91 0 12 3.75 2.04 3.32 1.73
Number of sources from which
information was acted on
2.94 1.51 0 12 3.03 1.65 2.87 1.36
Mean of frequency of use of
source
1.78 1.38 0 6 1.91 1.43 1.64 1.31
Source: Authors. Note: 6=daily, 5=weekly, 4=fortnightly, 3=monthly, 2=seasonally, 1=yearly, 0=none.
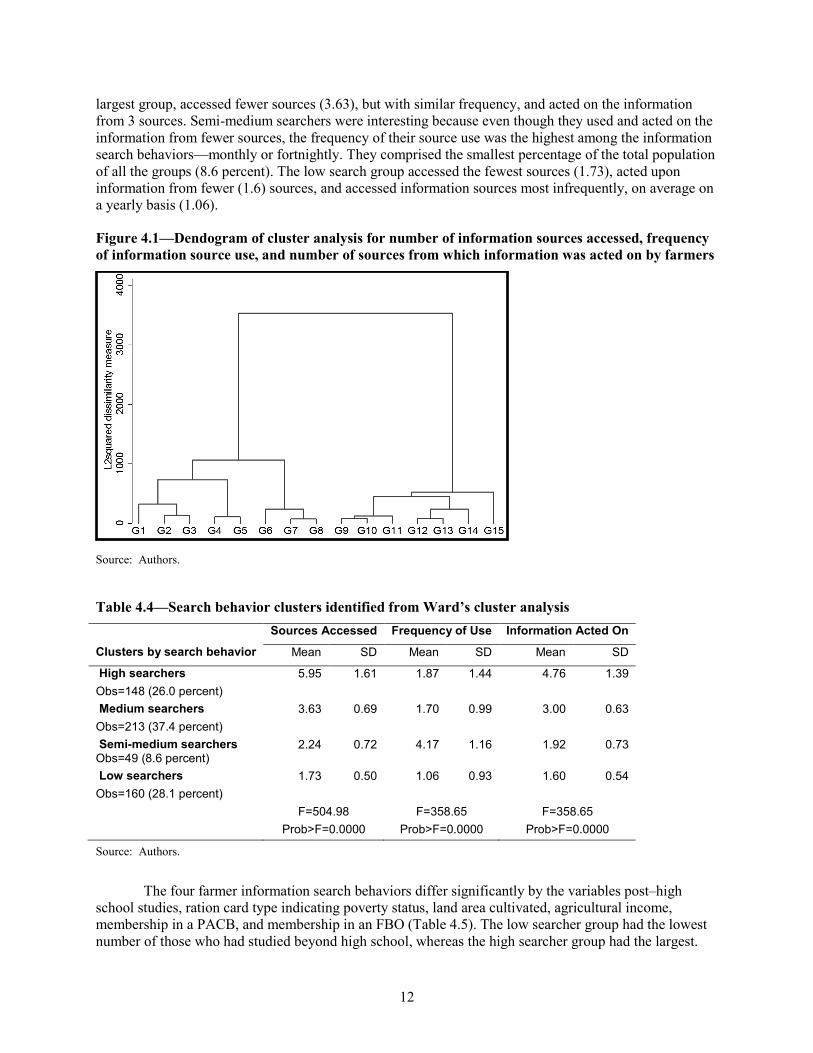
Ward’s hierarchical clustering was used to group these variables into meaningful categories. Cluster analysis organizes farmers according to the similarity or dissimilarity of the number of sources used, frequency of use, and whether information was acted on. The relationship is depicted graphically as a dendogram in which branch length is determined by the correlation between information sources used and the frequency and sources from which information was tried; the farmers with similar information search behaviors are placed together as neighboring rows in the dendogram (Figure 4.1). From this analysis four clusters were identified.
The four information search behaviors that emerged were high searchers, medium searchers, semi-medium searchers, and low searchers (Table 4.4). On average, high searchers accessed 5.95 sources, searched on a seasonal basis, and acted on the information from 4.76 sources. Medium searchers, the
12
largest group, accessed fewer sources (3.63), but with similar frequency, and acted on the information from 3 sources. Semi-medium searchers were interesting because even though they used and acted on the information from fewer sources, the frequency of their source use was the highest among the information search behaviors—monthly or fortnightly. They comprised the smallest percentage of the total population of all the groups (8.6 percent). The low search group accessed the fewest sources (1.73), acted upon information from fewer (1.6) sources, and accessed information sources most infrequently, on average on a yearly basis (1.06).
Figure 4.1—Dendogram of cluster analysis for number of information sources accessed, frequency of information source use, and number of sources from which information was acted on by farmers
Source: Authors.
Table 4.4—Search behavior clusters identified from Ward’s cluster analysis
Clusters by search behavior
Sources Accessed Frequency of Use Information Acted On
Mean SD Mean SD Mean SD
High searchers Obs=148 (26.0 percent)
5.95 1.61 1.87 1.44 4.76 1.39
Medium searchers Obs=213 (37.4 percent)
3.63 0.69 1.70 0.99 3.00 0.63
Semi-medium searchers Obs=49 (8.6 percent)
2.24 0.72 4.17 1.16 1.92 0.73
Low searchers Obs=160 (28.1 percent)
1.73 0.50 1.06 0.93 1.60 0.54
F=504.98 Prob>F=0.0000
F=358.65 Prob>F=0.0000
F=358.65 Prob>F=0.0000
Source: Authors.
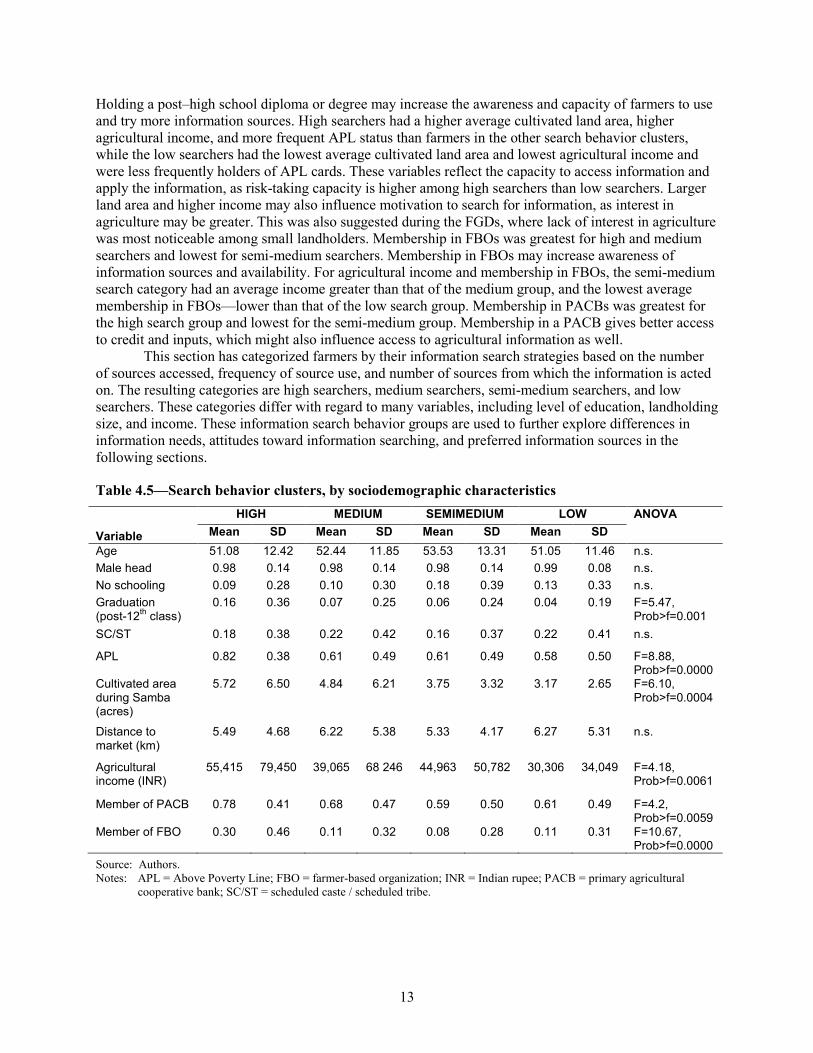
The four farmer information search behaviors differ significantly by the variables post–high school studies, ration card type indicating poverty status, land area cultivated, agricultural income, membership in a PACB, and membership in an FBO (Table 4.5). The low searcher group had the lowest number of those who had studied beyond high school, whereas the high searcher group had the largest.
13
Holding a post–high school diploma or degree may increase the awareness and capacity of farmers to use and try more information sources. High searchers had a higher average cultivated land area, higher agricultural income, and more frequent APL status than farmers in the other search behavior clusters, while the low searchers had the lowest average cultivated land area and lowest agricultural income and were less frequently holders of APL cards. These variables reflect the capacity to access information and apply the information, as risk-taking capacity is higher among high searchers than low searchers. Larger land area and higher income may also influence motivation to search for information, as interest in agriculture may be greater. This was also suggested during the FGDs, where lack of interest in agriculture was most noticeable among small landholders. Membership in FBOs was greatest for high and medium searchers and lowest for semi-medium searchers. Membership in FBOs may increase awareness of information sources and availability. For agricultural income and membership in FBOs, the semi-medium search category had an average income greater than that of the medium group, and the lowest average membership in FBOs—lower than that of the low search group. Membership in PACBs was greatest for the high search group and lowest for the semi-medium group. Membership in a PACB gives better access to credit and inputs, which might also influence access to agricultural information as well.
This section has categorized farmers by their information search strategies based on the number of sources accessed, frequency of source use, and number of sources from which the information is acted on. The resulting categories are high searchers, medium searchers, semi-medium searchers, and low searchers. These categories differ with regard to many variables, including level of education, landholding size, and income. These information search behavior groups are used to further explore differences in information needs, attitudes toward information searching, and preferred information sources in the following sections.
Table 4.5—Search behavior clusters, by sociodemographic characteristics
Variable
HIGH MEDIUM SEMIMEDIUM LOW ANOVA Mean SD Mean SD Mean SD Mean SD
Age 51.08 12.42 52.44 11.85 53.53 13.31 51.05 11.46 n.s. Male head 0.98 0.14 0.98 0.14 0.98 0.14 0.99 0.08 n.s. No schooling 0.09 0.28 0.10 0.30 0.18 0.39 0.13 0.33 n.s. Graduation (post-12th class)
0.16 0.36 0.07 0.25 0.06 0.24 0.04 0.19 F=5.47, Prob>f=0.001
SC/ST 0.18 0.38 0.22 0.42 0.16 0.37 0.22 0.41 n.s.
APL 0.82 0.38 0.61 0.49 0.61 0.49 0.58 0.50 F=8.88, Prob>f=0.0000
Cultivated area during Samba (acres)
5.72 6.50 4.84 6.21 3.75 3.32 3.17 2.65 F=6.10, Prob>f=0.0004
Distance to market (km)
5.49 4.68 6.22 5.38 5.33 4.17 6.27 5.31 n.s.
Agricultural income (INR)
55,415 79,450 39,065 68 246 44,963 50,782 30,306 34,049 F=4.18, Prob>f=0.0061
Member of PACB 0.78 0.41 0.68 0.47 0.59 0.50 0.61 0.49 F=4.2, Prob>f=0.0059
Member of FBO 0.30 0.46 0.11 0.32 0.08 0.28 0.11 0.31 F=10.67, Prob>f=0.0000
Source: Authors. Notes: APL = Above Poverty Line; FBO = farmer-based organization; INR = Indian rupee; PACB = primary agricultural
cooperative bank; SC/ST = scheduled caste / scheduled tribe.
14
The four search behaviors also differ significantly by district, with Thanjavur having the greater number of high searchers and Tiruvarur having greater numbers of low searchers (Table 4.6).
Table 4.6—Search behavior clusters, by district Thanjavur Tiruvarur
Search behaviors Percent Percent
High 30.88 21.05
Medium 32.98 41.75
Semi-medium 10.88 6.32
Low 25.26 30.88
F=4.66, Prob>F=0.0032
Source: Authors.
Farmer Information Needs
Information Needs Related to Rice Cultivation
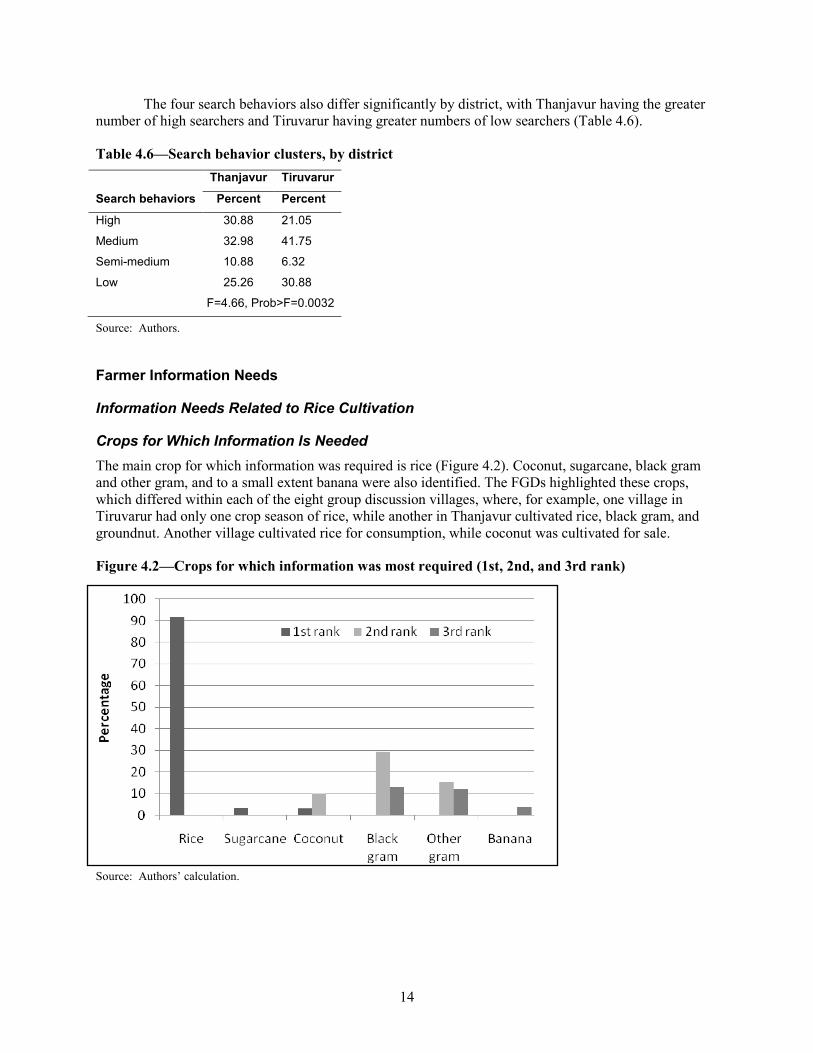
Crops for Which Information Is Needed The main crop for which information was required is rice (Figure 4.2). Coconut, sugarcane, black gram and other gram, and to a small extent banana were also identified. The FGDs highlighted these crops, which differed within each of the eight group discussion villages, where, for example, one village in Tiruvarur had only one crop season of rice, while another in Thanjavur cultivated rice, black gram, and groundnut. Another village cultivated rice for consumption, while coconut was cultivated for sale.
Figure 4.2—Crops for which information was most required (1st, 2nd, and 3rd rank)
Source: Authors’ calculation.
15
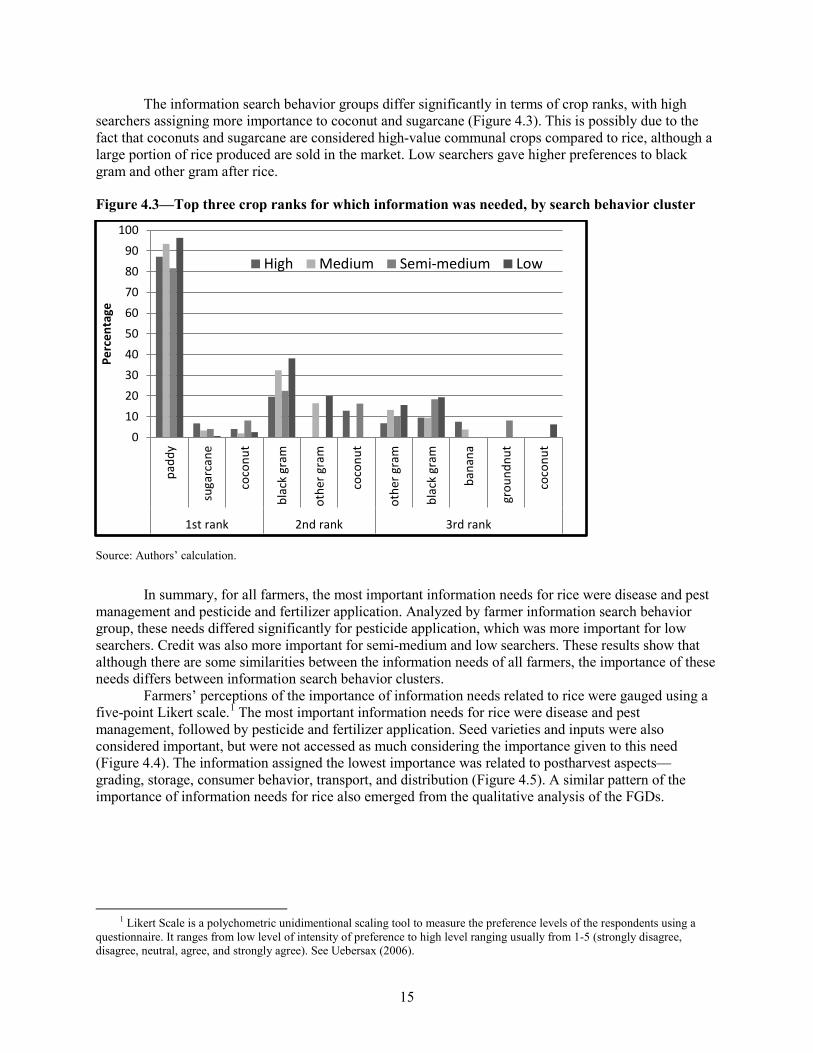
The information search behavior groups differ significantly in terms of crop ranks, with high searchers assigning more importance to coconut and sugarcane (Figure 4.3). This is possibly due to the fact that coconuts and sugarcane are considered high-value communal crops compared to rice, although a large portion of rice produced are sold in the market. Low searchers gave higher preferences to black gram and other gram after rice.
Figure 4.3—Top three crop ranks for which information was needed, by search behavior cluster
Source: Authors’ calculation.
In summary, for all farmers, the most important information needs for rice were disease and pest management and pesticide and fertilizer application. Analyzed by farmer information search behavior group, these needs differed significantly for pesticide application, which was more important for low searchers. Credit was also more important for semi-medium and low searchers. These results show that although there are some similarities between the information needs of all farmers, the importance of these needs differs between information search behavior clusters.
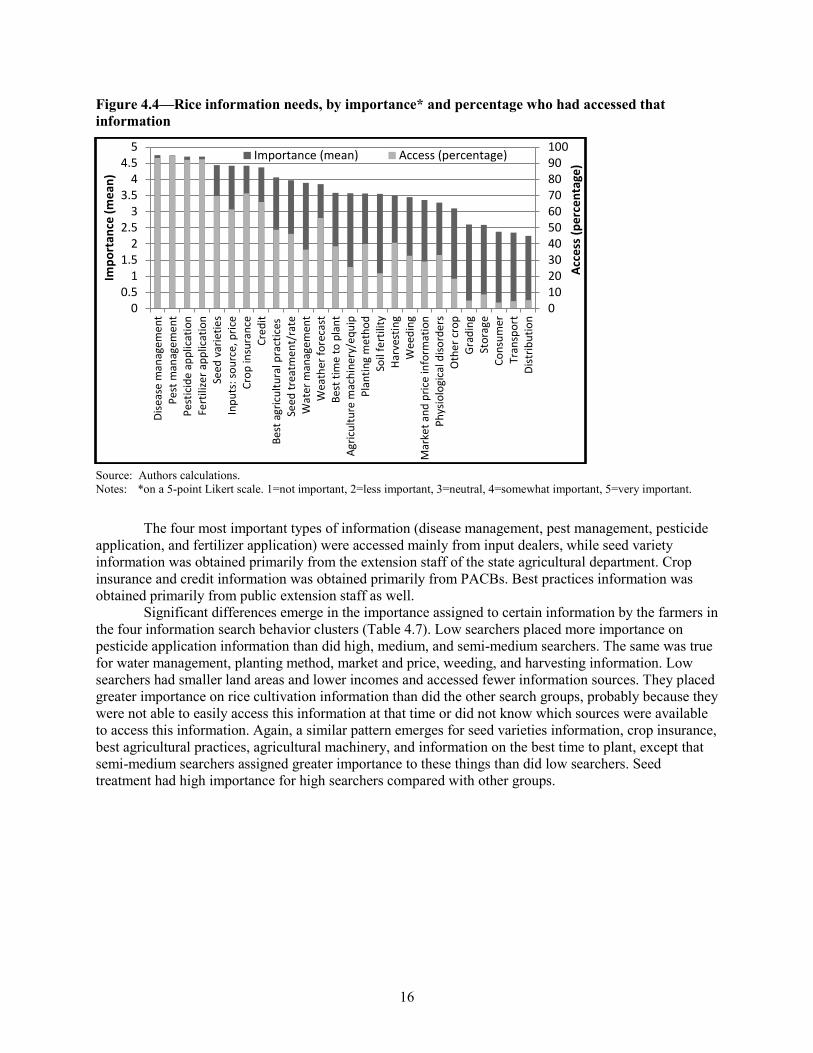
Farmers’ perceptions of the importance of information needs related to rice were gauged using a five-point Likert scale.1 The most important information needs for rice were disease and pest management, followed by pesticide and fertilizer application. Seed varieties and inputs were also considered important, but were not accessed as much considering the importance given to this need (Figure 4.4). The information assigned the lowest importance was related to postharvest aspects—grading, storage, consumer behavior, transport, and distribution (Figure 4.5). A similar pattern of the importance of information needs for rice also emerged from the qualitative analysis of the FGDs.
1 Likert Scale is a polychometric unidimentional scaling tool to measure the preference levels of the respondents using a
questionnaire. It ranges from low level of intensity of preference to high level ranging usually from 1-5 (strongly disagree, disagree, neutral, agree, and strongly agree). See Uebersax (2006).
0102030405060708090
100
padd
y
suga
rcan
e
coco
nut
blac
k gr
am
othe
r gra
m
coco
nut
othe
r gra
m
blac
k gr
am
bana
na
grou
ndnu
t
coco
nut
1st rank 2nd rank 3rd rank
Perc
enta
ge
High Medium Semi-medium Low
16
Figure 4.4—Rice information needs, by importance* and percentage who had accessed that information
Source: Authors calculations. Notes: *on a 5-point Likert scale. 1=not important, 2=less important, 3=neutral, 4=somewhat important, 5=very important.
The four most important types of information (disease management, pest management, pesticide application, and fertilizer application) were accessed mainly from input dealers, while seed variety information was obtained primarily from the extension staff of the state agricultural department. Crop insurance and credit information was obtained primarily from PACBs. Best practices information was obtained primarily from public extension staff as well.
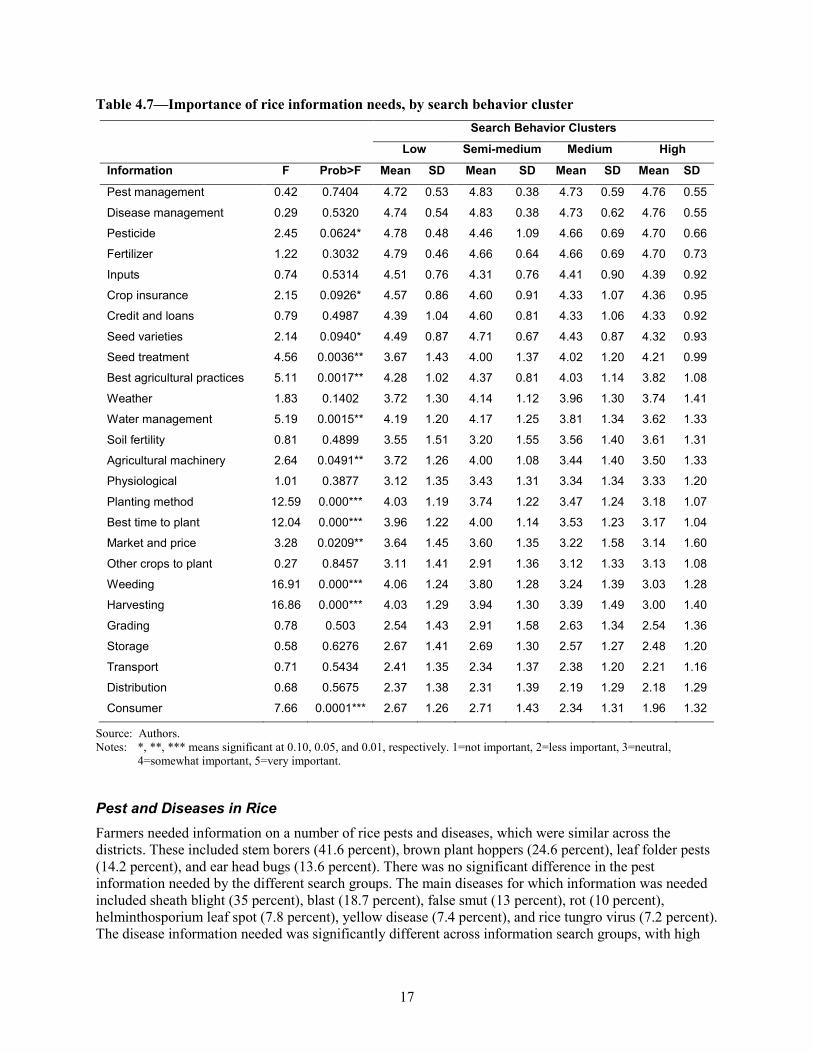
Significant differences emerge in the importance assigned to certain information by the farmers in the four information search behavior clusters (Table 4.7). Low searchers placed more importance on pesticide application information than did high, medium, and semi-medium searchers. The same was true for water management, planting method, market and price, weeding, and harvesting information. Low searchers had smaller land areas and lower incomes and accessed fewer information sources. They placed greater importance on rice cultivation information than did the other search groups, probably because they were not able to easily access this information at that time or did not know which sources were available to access this information. Again, a similar pattern emerges for seed varieties information, crop insurance, best agricultural practices, agricultural machinery, and information on the best time to plant, except that semi-medium searchers assigned greater importance to these things than did low searchers. Seed treatment had high importance for high searchers compared with other groups.
0102030405060708090100
00.5
11.5
22.5
33.5
44.5
5Di
seas
e m
anag
emen
tPe
st m
anag
emen
tPe
stic
ide
appl
icat
ion
Fert
ilize
r app
licat
ion
Seed
var
ietie
sIn
puts
: sou
rce,
pric
eCr
op in
sura
nce
Cred
itBe
st a
gric
ultu
ral p
ract
ices
Seed
trea
tmen
t/ra
teW
ater
man
agem
ent
Wea
ther
fore
cast
Best
tim
e to
pla
ntAg
ricul
ture
mac
hine
ry/e
quip
Plan
ting
met
hod
Soil
fert
ility
Harv
estin
gW
eedi
ngM
arke
t and
pric
e in
form
atio
nPh
ysio
logi
cal d
isord
ers
Oth
er c
rop
Grad
ing
Stor
age
Cons
umer
Tran
spor
tDi
strib
utio
n
Acce
ss (p
erce
ntag
e)
Impo
rtan
ce (m
ean)
Importance (mean) Access (percentage)
17
Table 4.7—Importance of rice information needs, by search behavior cluster Search Behavior Clusters
Low Semi-medium Medium High
Information F Prob>F Mean SD Mean SD Mean SD Mean SD
Pest management 0.42 0.7404 4.72 0.53 4.83 0.38 4.73 0.59 4.76 0.55
Disease management 0.29 0.5320 4.74 0.54 4.83 0.38 4.73 0.62 4.76 0.55
Pesticide 2.45 0.0624* 4.78 0.48 4.46 1.09 4.66 0.69 4.70 0.66
Fertilizer 1.22 0.3032 4.79 0.46 4.66 0.64 4.66 0.69 4.70 0.73
Inputs 0.74 0.5314 4.51 0.76 4.31 0.76 4.41 0.90 4.39 0.92
Crop insurance 2.15 0.0926* 4.57 0.86 4.60 0.91 4.33 1.07 4.36 0.95
Credit and loans 0.79 0.4987 4.39 1.04 4.60 0.81 4.33 1.06 4.33 0.92
Seed varieties 2.14 0.0940* 4.49 0.87 4.71 0.67 4.43 0.87 4.32 0.93
Seed treatment 4.56 0.0036** 3.67 1.43 4.00 1.37 4.02 1.20 4.21 0.99
Best agricultural practices 5.11 0.0017** 4.28 1.02 4.37 0.81 4.03 1.14 3.82 1.08
Weather 1.83 0.1402 3.72 1.30 4.14 1.12 3.96 1.30 3.74 1.41
Water management 5.19 0.0015** 4.19 1.20 4.17 1.25 3.81 1.34 3.62 1.33
Soil fertility 0.81 0.4899 3.55 1.51 3.20 1.55 3.56 1.40 3.61 1.31
Agricultural machinery 2.64 0.0491** 3.72 1.26 4.00 1.08 3.44 1.40 3.50 1.33
Physiological 1.01 0.3877 3.12 1.35 3.43 1.31 3.34 1.34 3.33 1.20
Planting method 12.59 0.000*** 4.03 1.19 3.74 1.22 3.47 1.24 3.18 1.07
Best time to plant 12.04 0.000*** 3.96 1.22 4.00 1.14 3.53 1.23 3.17 1.04
Market and price 3.28 0.0209** 3.64 1.45 3.60 1.35 3.22 1.58 3.14 1.60
Other crops to plant 0.27 0.8457 3.11 1.41 2.91 1.36 3.12 1.33 3.13 1.08
Weeding 16.91 0.000*** 4.06 1.24 3.80 1.28 3.24 1.39 3.03 1.28
Harvesting 16.86 0.000*** 4.03 1.29 3.94 1.30 3.39 1.49 3.00 1.40
Grading 0.78 0.503 2.54 1.43 2.91 1.58 2.63 1.34 2.54 1.36
Storage 0.58 0.6276 2.67 1.41 2.69 1.30 2.57 1.27 2.48 1.20
Transport 0.71 0.5434 2.41 1.35 2.34 1.37 2.38 1.20 2.21 1.16
Distribution 0.68 0.5675 2.37 1.38 2.31 1.39 2.19 1.29 2.18 1.29
Consumer 7.66 0.0001*** 2.67 1.26 2.71 1.43 2.34 1.31 1.96 1.32
Source: Authors. Notes: *, **, *** means significant at 0.10, 0.05, and 0.01, respectively. 1=not important, 2=less important, 3=neutral,
4=somewhat important, 5=very important.
Pest and Diseases in Rice Farmers needed information on a number of rice pests and diseases, which were similar across the districts. These included stem borers (41.6 percent), brown plant hoppers (24.6 percent), leaf folder pests (14.2 percent), and ear head bugs (13.6 percent). There was no significant difference in the pest information needed by the different search groups. The main diseases for which information was needed included sheath blight (35 percent), blast (18.7 percent), false smut (13 percent), rot (10 percent), helminthosporium leaf spot (7.8 percent), yellow disease (7.4 percent), and rice tungro virus (7.2 percent). The disease information needed was significantly different across information search groups, with high
18
and medium searchers requesting information on blast and sheath blight, while the semi-medium and low search groups also wanted more information on helminthosporium and false smut.
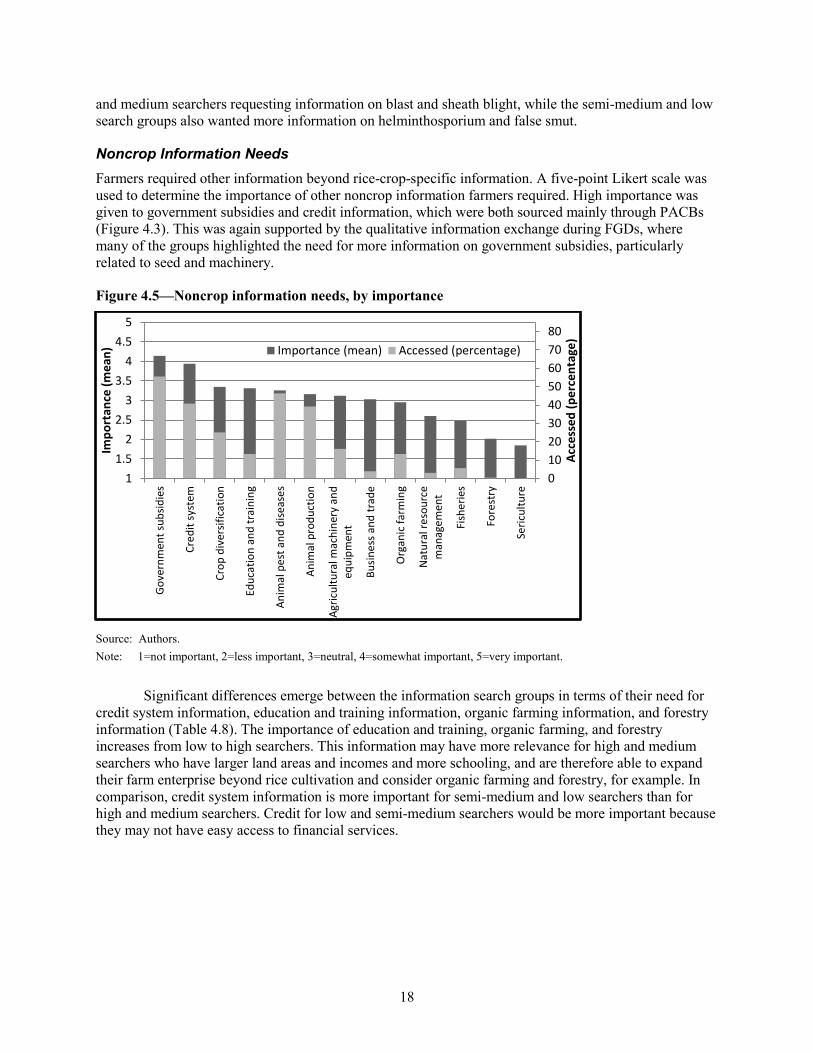
Noncrop Information Needs Farmers required other information beyond rice-crop-specific information. A five-point Likert scale was used to determine the importance of other noncrop information farmers required. High importance was given to government subsidies and credit information, which were both sourced mainly through PACBs (Figure 4.3). This was again supported by the qualitative information exchange during FGDs, where many of the groups highlighted the need for more information on government subsidies, particularly related to seed and machinery.
Figure 4.5—Noncrop information needs, by importance
Source: Authors. Note: 1=not important, 2=less important, 3=neutral, 4=somewhat important, 5=very important.
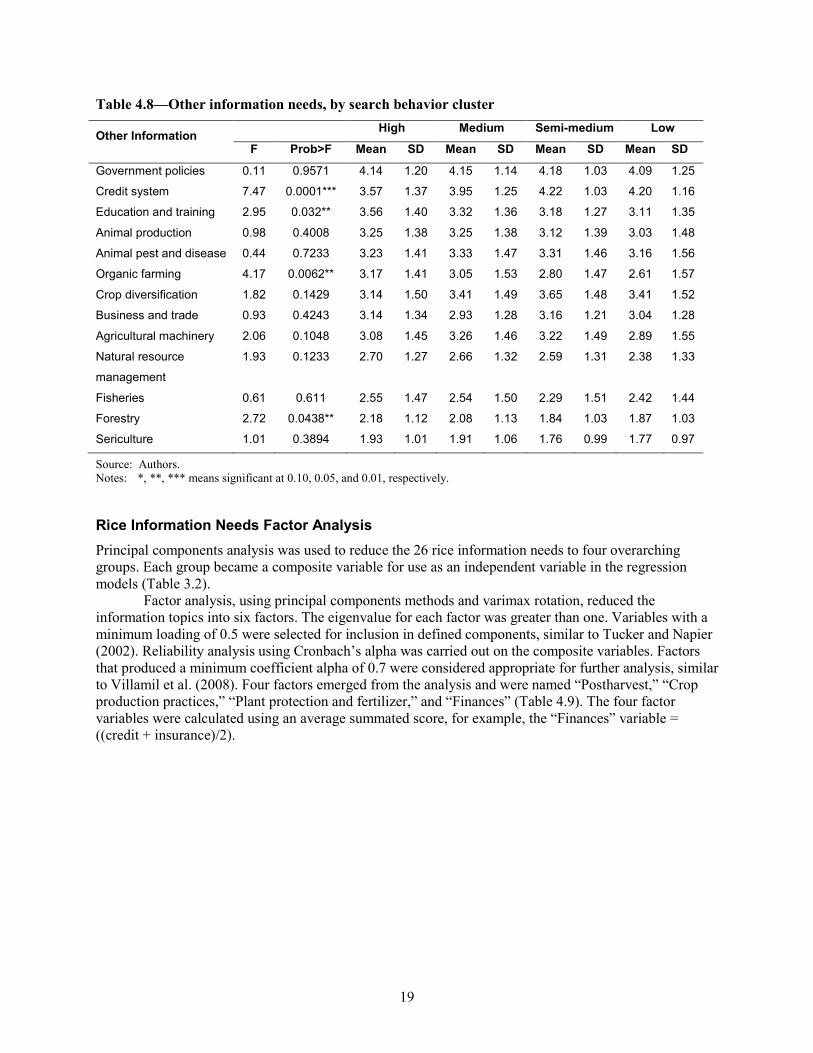
Significant differences emerge between the information search groups in terms of their need for credit system information, education and training information, organic farming information, and forestry information (Table 4.8). The importance of education and training, organic farming, and forestry increases from low to high searchers. This information may have more relevance for high and medium searchers who have larger land areas and incomes and more schooling, and are therefore able to expand their farm enterprise beyond rice cultivation and consider organic farming and forestry, for example. In comparison, credit system information is more important for semi-medium and low searchers than for high and medium searchers. Credit for low and semi-medium searchers would be more important because they may not have easy access to financial services.
01020304050607080
11.5
22.5
33.5
44.5
5
Gove
rnm
ent s
ubsid
ies
Cred
it sy
stem
Crop
div
ersif
icat
ion
Educ
atio
n an
d tr
aini
ng
Anim
al p
est a
nd d
iseas
es
Anim
al p
rodu
ctio
n
Agric
ultu
ral m
achi
nery
and
equi
pmen
t
Busin
ess a
nd tr
ade
Org
anic
farm
ing
Nat
ural
reso
urce
man
agem
ent
Fish
erie
s
Fore
stry
Seric
ultu
re
Acce
ssed
(per
cent
age)
Impo
rtan
ce (m
ean)
Importance (mean) Accessed (percentage)
19
Table 4.8—Other information needs, by search behavior cluster
Other Information High Medium Semi-medium Low
F Prob>F Mean SD Mean SD Mean SD Mean SD
Government policies 0.11 0.9571 4.14 1.20 4.15 1.14 4.18 1.03 4.09 1.25
Credit system 7.47 0.0001*** 3.57 1.37 3.95 1.25 4.22 1.03 4.20 1.16
Education and training 2.95 0.032** 3.56 1.40 3.32 1.36 3.18 1.27 3.11 1.35
Animal production 0.98 0.4008 3.25 1.38 3.25 1.38 3.12 1.39 3.03 1.48
Animal pest and disease 0.44 0.7233 3.23 1.41 3.33 1.47 3.31 1.46 3.16 1.56
Organic farming 4.17 0.0062** 3.17 1.41 3.05 1.53 2.80 1.47 2.61 1.57
Crop diversification 1.82 0.1429 3.14 1.50 3.41 1.49 3.65 1.48 3.41 1.52
Business and trade 0.93 0.4243 3.14 1.34 2.93 1.28 3.16 1.21 3.04 1.28
Agricultural machinery 2.06 0.1048 3.08 1.45 3.26 1.46 3.22 1.49 2.89 1.55
Natural resource
management
1.93 0.1233 2.70 1.27 2.66 1.32 2.59 1.31 2.38 1.33
Fisheries 0.61 0.611 2.55 1.47 2.54 1.50 2.29 1.51 2.42 1.44
Forestry 2.72 0.0438** 2.18 1.12 2.08 1.13 1.84 1.03 1.87 1.03
Sericulture 1.01 0.3894 1.93 1.01 1.91 1.06 1.76 0.99 1.77 0.97
Source: Authors. Notes: *, **, *** means significant at 0.10, 0.05, and 0.01, respectively.
Rice Information Needs Factor Analysis Principal components analysis was used to reduce the 26 rice information needs to four overarching groups. Each group became a composite variable for use as an independent variable in the regression models (Table 3.2).
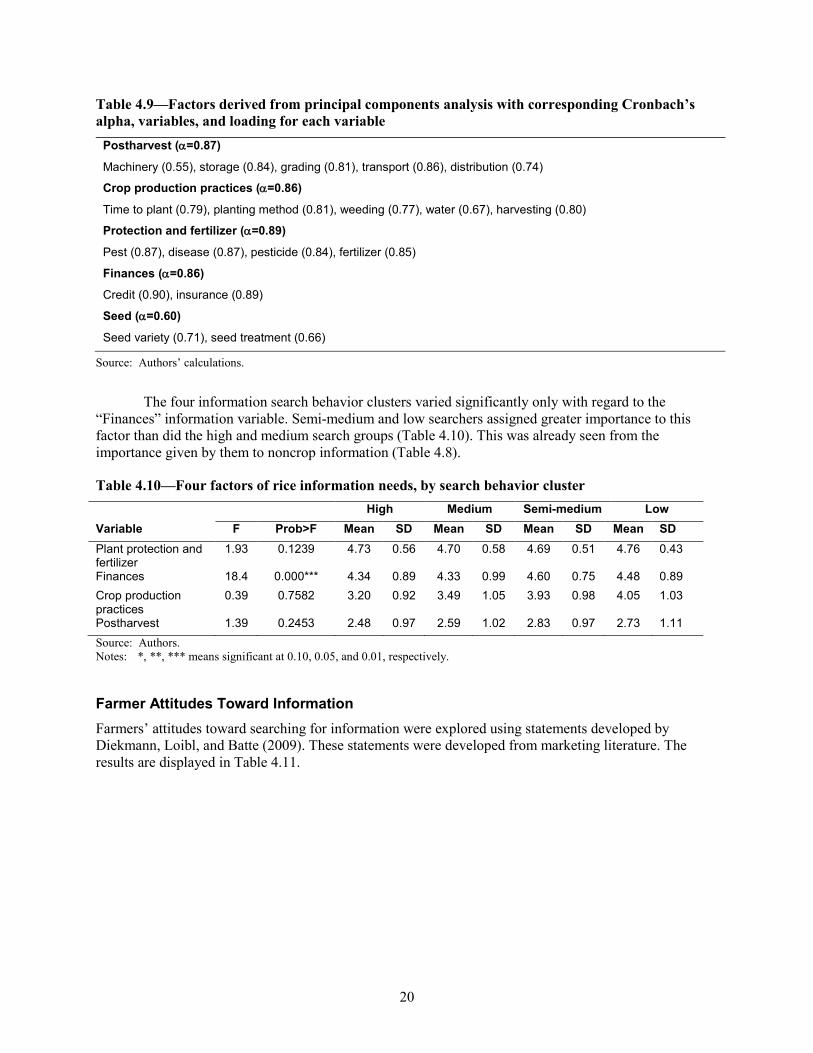
Factor analysis, using principal components methods and varimax rotation, reduced the information topics into six factors. The eigenvalue for each factor was greater than one. Variables with a minimum loading of 0.5 were selected for inclusion in defined components, similar to Tucker and Napier (2002). Reliability analysis using Cronbach’s alpha was carried out on the composite variables. Factors that produced a minimum coefficient alpha of 0.7 were considered appropriate for further analysis, similar to Villamil et al. (2008). Four factors emerged from the analysis and were named “Postharvest,” “Crop production practices,” “Plant protection and fertilizer,” and “Finances” (Table 4.9). The four factor variables were calculated using an average summated score, for example, the “Finances” variable = ((credit + insurance)/2).
20
Table 4.9—Factors derived from principal components analysis with corresponding Cronbach’s alpha, variables, and loading for each variable
Postharvest (α=0.87)
Machinery (0.55), storage (0.84), grading (0.81), transport (0.86), distribution (0.74)
Crop production practices (α=0.86)
Time to plant (0.79), planting method (0.81), weeding (0.77), water (0.67), harvesting (0.80)
Protection and fertilizer (α=0.89)
Pest (0.87), disease (0.87), pesticide (0.84), fertilizer (0.85)
Finances (α=0.86)
Credit (0.90), insurance (0.89)
Seed (α=0.60)
Seed variety (0.71), seed treatment (0.66)
Source: Authors’ calculations.
The four information search behavior clusters varied significantly only with regard to the “Finances” information variable. Semi-medium and low searchers assigned greater importance to this factor than did the high and medium search groups (Table 4.10). This was already seen from the importance given by them to noncrop information (Table 4.8).
Table 4.10—Four factors of rice information needs, by search behavior cluster High Medium Semi-medium Low Variable F Prob>F Mean SD Mean SD Mean SD Mean SD Plant protection and fertilizer
1.93 0.1239 4.73 0.56 4.70 0.58 4.69 0.51 4.76 0.43
Finances 18.4 0.000*** 4.34 0.89 4.33 0.99 4.60 0.75 4.48 0.89 Crop production practices
0.39 0.7582 3.20 0.92 3.49 1.05 3.93 0.98 4.05 1.03
Postharvest 1.39 0.2453 2.48 0.97 2.59 1.02 2.83 0.97 2.73 1.11 Source: Authors. Notes: *, **, *** means significant at 0.10, 0.05, and 0.01, respectively.
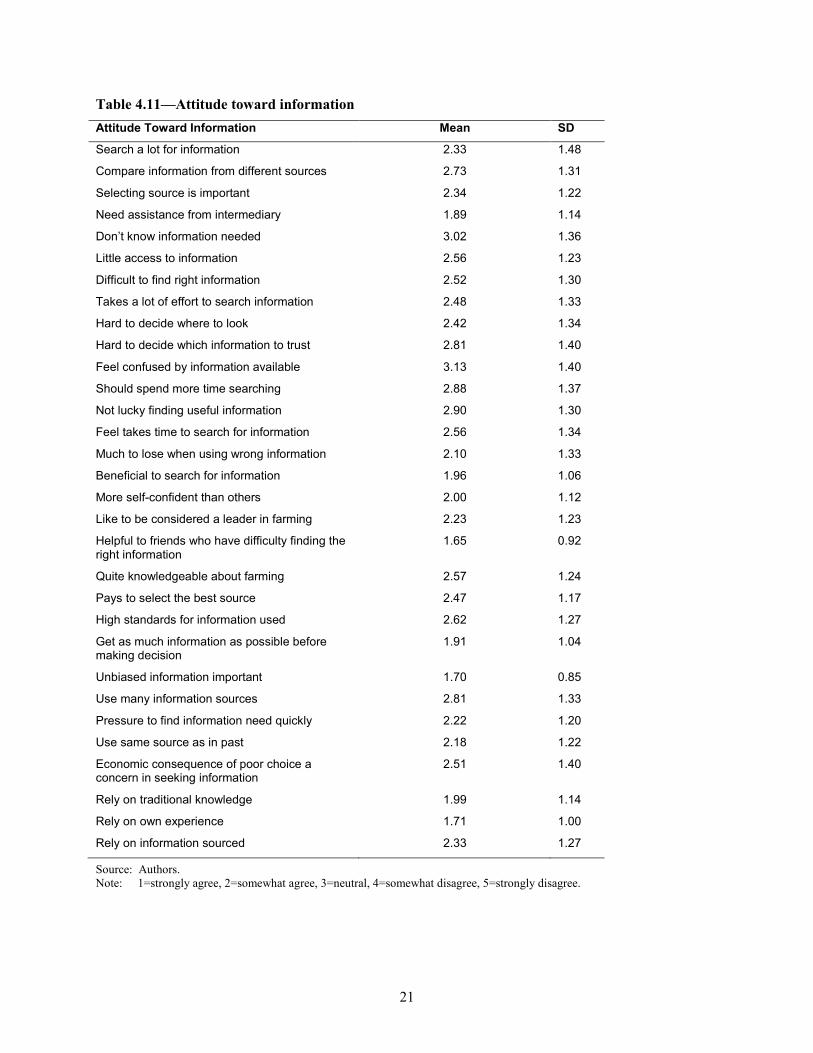
Farmer Attitudes Toward Information Farmers’ attitudes toward searching for information were explored using statements developed by Diekmann, Loibl, and Batte (2009). These statements were developed from marketing literature. The results are displayed in Table 4.11.
21
Table 4.11—Attitude toward information Attitude Toward Information Mean SD
Search a lot for information 2.33 1.48
Compare information from different sources 2.73 1.31
Selecting source is important 2.34 1.22
Need assistance from intermediary 1.89 1.14
Don’t know information needed 3.02 1.36
Little access to information 2.56 1.23
Difficult to find right information 2.52 1.30
Takes a lot of effort to search information 2.48 1.33
Hard to decide where to look 2.42 1.34
Hard to decide which information to trust 2.81 1.40
Feel confused by information available 3.13 1.40
Should spend more time searching 2.88 1.37
Not lucky finding useful information 2.90 1.30
Feel takes time to search for information 2.56 1.34
Much to lose when using wrong information 2.10 1.33
Beneficial to search for information 1.96 1.06
More self-confident than others 2.00 1.12
Like to be considered a leader in farming 2.23 1.23
Helpful to friends who have difficulty finding the right information
1.65 0.92
Quite knowledgeable about farming 2.57 1.24
Pays to select the best source 2.47 1.17
High standards for information used 2.62 1.27
Get as much information as possible before making decision
1.91 1.04
Unbiased information important 1.70 0.85
Use many information sources 2.81 1.33
Pressure to find information need quickly 2.22 1.20
Use same source as in past 2.18 1.22
Economic consequence of poor choice a concern in seeking information
2.51 1.40
Rely on traditional knowledge 1.99 1.14
Rely on own experience 1.71 1.00
Rely on information sourced 2.33 1.27
Source: Authors. Note: 1=strongly agree, 2=somewhat agree, 3=neutral, 4=somewhat disagree, 5=strongly disagree.
22
Strong agreement was expressed with statements about needing help with an intermediary, seeing benefit in searching for information, being helpful to friends, and relying on own experience. But for most of the statements agreement was close to neutral. In the FGDs, farmers said that their interest in farming was low because it was not profitable. This was particularly true for the small landholders. Also, farmers said in the FGDs that they did not know what information they needed. This statement received a neutral response in the survey, however (Table 4.10).
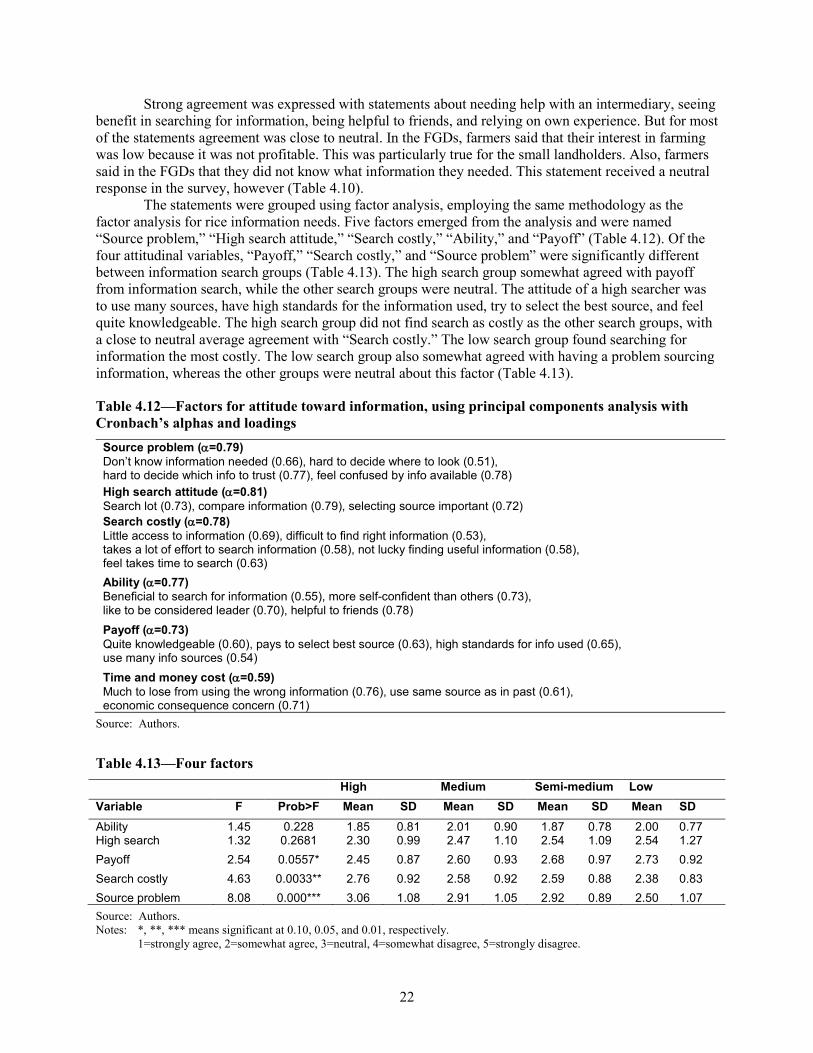
The statements were grouped using factor analysis, employing the same methodology as the factor analysis for rice information needs. Five factors emerged from the analysis and were named “Source problem,” “High search attitude,” “Search costly,” “Ability,” and “Payoff” (Table 4.12). Of the four attitudinal variables, “Payoff,” “Search costly,” and “Source problem” were significantly different between information search groups (Table 4.13). The high search group somewhat agreed with payoff from information search, while the other search groups were neutral. The attitude of a high searcher was to use many sources, have high standards for the information used, try to select the best source, and feel quite knowledgeable. The high search group did not find search as costly as the other search groups, with a close to neutral average agreement with “Search costly.” The low search group found searching for information the most costly. The low search group also somewhat agreed with having a problem sourcing information, whereas the other groups were neutral about this factor (Table 4.13).
Table 4.12—Factors for attitude toward information, using principal components analysis with Cronbach’s alphas and loadings
Source problem (α=0.79) Don’t know information needed (0.66), hard to decide where to look (0.51), hard to decide which info to trust (0.77), feel confused by info available (0.78) High search attitude (α=0.81) Search lot (0.73), compare information (0.79), selecting source important (0.72) Search costly (α=0.78) Little access to information (0.69), difficult to find right information (0.53), takes a lot of effort to search information (0.58), not lucky finding useful information (0.58), feel takes time to search (0.63) Ability (α=0.77) Beneficial to search for information (0.55), more self-confident than others (0.73), like to be considered leader (0.70), helpful to friends (0.78) Payoff (α=0.73) Quite knowledgeable (0.60), pays to select best source (0.63), high standards for info used (0.65), use many info sources (0.54) Time and money cost (α=0.59) Much to lose from using the wrong information (0.76), use same source as in past (0.61), economic consequence concern (0.71)
Source: Authors.
Table 4.13—Four factors High Medium Semi-medium Low Variable F Prob>F Mean SD Mean SD Mean SD Mean SD Ability 1.45 0.228 1.85 0.81 2.01 0.90 1.87 0.78 2.00 0.77 High search 1.32 0.2681 2.30 0.99 2.47 1.10 2.54 1.09 2.54 1.27 Payoff 2.54 0.0557* 2.45 0.87 2.60 0.93 2.68 0.97 2.73 0.92 Search costly 4.63 0.0033** 2.76 0.92 2.58 0.92 2.59 0.88 2.38 0.83 Source problem 8.08 0.000*** 3.06 1.08 2.91 1.05 2.92 0.89 2.50 1.07 Source: Authors. Notes: *, **, *** means significant at 0.10, 0.05, and 0.01, respectively.
1=strongly agree, 2=somewhat agree, 3=neutral, 4=somewhat disagree, 5=strongly disagree.
23
Farmer Information Sources
Main Information Sources The main sources farmers relied on for agricultural information in 2010 was the private input dealer (68.6 percent), followed by the state government’s department of agriculture extension staff (51.2 percent), television (43.6 percent), family members or relatives (39.9 percent), progressive farmers (36.2 percent), PACBs (35.7 percent), and newspapers (30.6 percent). Farm magazines were accessed by 9.2 percent. Only a small percentage used radio (5.4 percent) and farmer group associations (4.7 percent) for information. The sugar factory was a source for 2.8 percent of respondents. The public-sector research stations and Krishi Vigyan Kendras (Farm Science Centers) were accessed by even fewer respondents—1.7 percent and 1.6 percent, respectively. While the use of the input dealer for information in India is well acknowledged (the NSSO 2003 survey found that it was the second major source of information used [NSSO 2005]), it is interesting to note the high use of the state government department of agriculture extension staff (agricultural officer [AO] and assistant agricultural officer [AAO]) and television for information.
These results were further supported by the outcomes of the FGDs. Aside from relying on their own experience, the main sources for agricultural information highlighted in the FGDs were the input dealer, neighbors and relatives, and the AO or AAO. There were a number of bottlenecks to using these sources, however. While providing inputs on credit, the input dealer was criticized for exploiting farmers’ time pressure to purchase inputs by pushing certain products. In one village farmers said that each of the input dealers sold products from only one company, so it was difficult for farmers to compare product prices. One farmer said that farmers tend to follow the input application and use patterns of their neighbors, so information is integrated between different sources to apply inputs. Despite the use of the state department of agriculture staff, there were many complaints about the service provided. In some villages the AO did not visit frequently or was not interested in talking with farmers, while in another the extension staff dealt with only certain farmers, namely progressive farmers. In one village the women’s group stated that the AAO for their village was female, and she interacted with them. This compares with another village where the women’s group said that the male AO did not interact with them. The women in this group had participated in the TANWA (Tamil Nadu Women in Agriculture) program, which ran from 1998 to 2004. They said during that time the AO worked closely with them, and the benefits of the training they received were still being felt—for example, one woman said she could successfully identify pests and diseases in the crops. Some considered the information from the extension staff untrustworthy and inconsistent with other information sourced. Despite the problems identified in the FGD, the AAO was suggested as a preferred source of information. The women often cited their husbands as information sources as well. Farmers watched their neighbors’ fields, met with other farmers in tea shops, and spoke with progressive farmers.
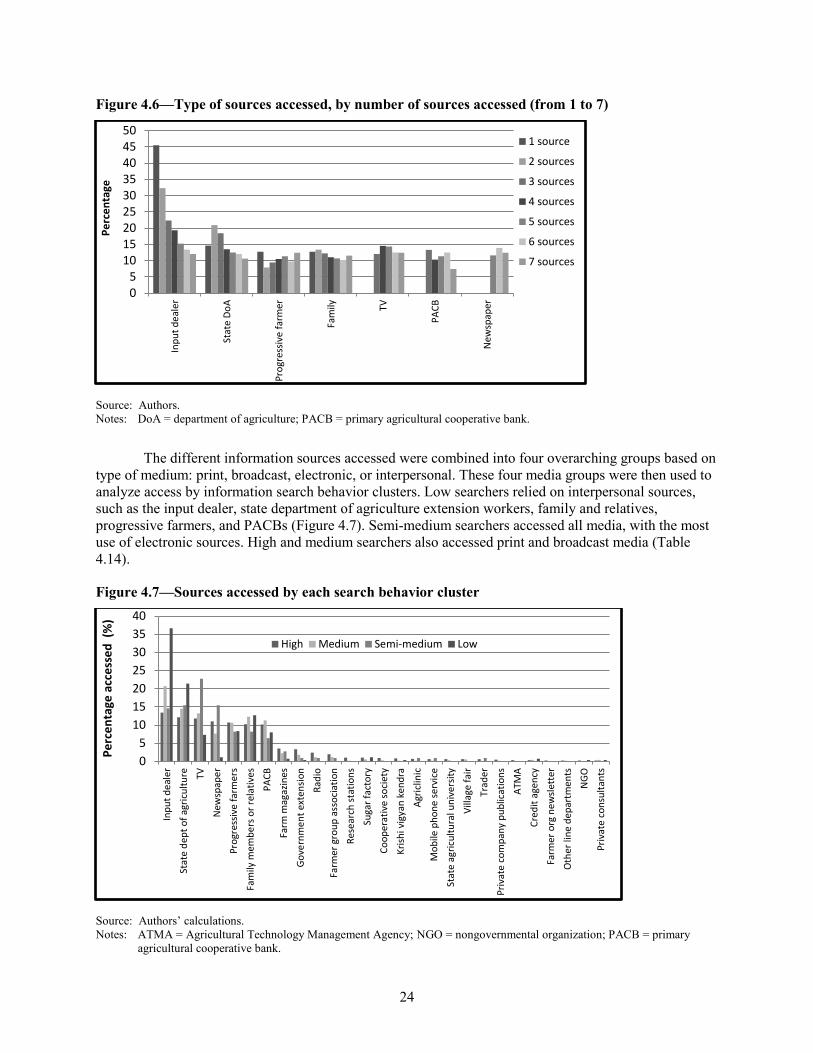
It is interesting to note that reliance on the input dealer decreases as the number of information sources increases (Figure 4.6). As more sources are used, the use of each source becomes almost even. For certain sources, though, there is a similar percentage of use regardless of the number of sources accessed—that is, family and relatives and progressive farmers. Television, PACBs, and newspapers become important sources of information as more sources are accessed.
The main reasons for choice of source were proximity (33.7 percent), assured quality (21.1 percent), only available option (20.6 percent), and timely availability (13.7 percent). The main crop for which information was obtained was rice (72.8 percent), followed by sugarcane (5.8 percent), coconut (5.1 percent), and black gram (3.1 percent). The average distance to the information source was 5.3 km (SD 22.46). The main reasons for not using other sources listed included not available (68.4 percent), do not know about the source (16.2 percent), poor service (9.2 percent), and low relevance (3.0 percent). The main types of information received were on plant protection (28.2 percent), overall crop information (22.0 percent), cultivation practices (14.2 percent), government subsidies (8.9 percent), general information (5.5 percent), and credit (6.0 percent). This reflects the important information needs.
24
Figure 4.6—Type of sources accessed, by number of sources accessed (from 1 to 7)
Source: Authors. Notes: DoA = department of agriculture; PACB = primary agricultural cooperative bank.
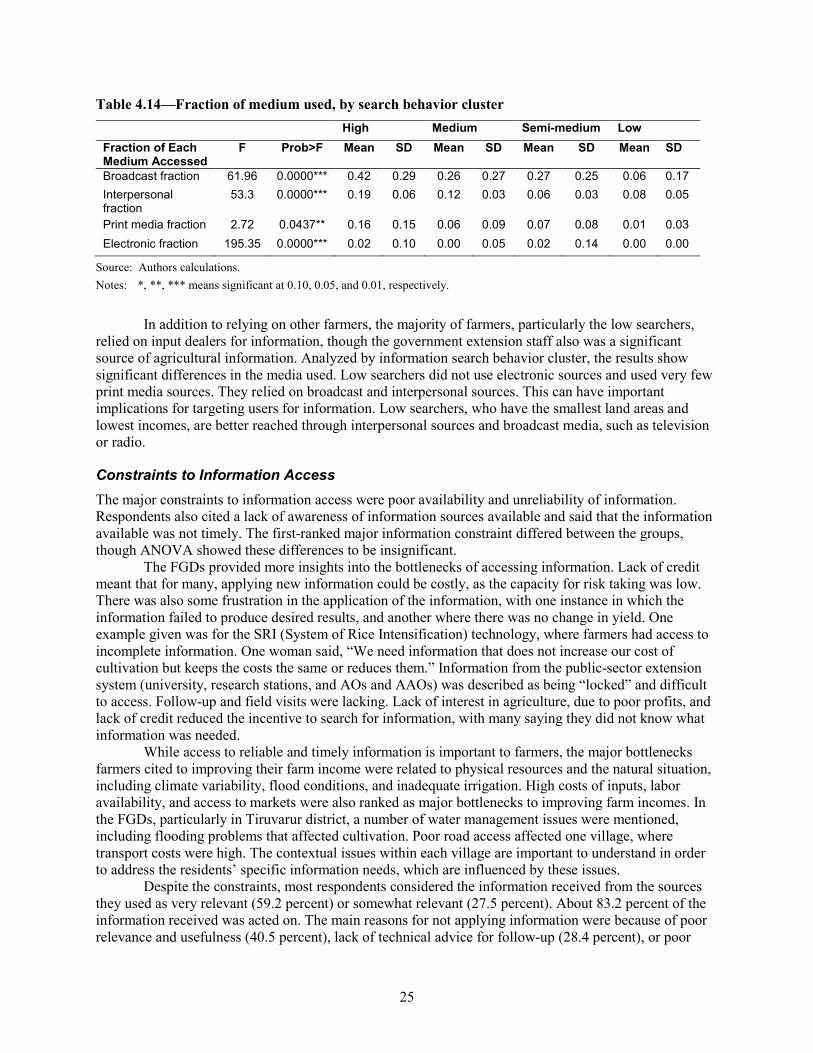
The different information sources accessed were combined into four overarching groups based on type of medium: print, broadcast, electronic, or interpersonal. These four media groups were then used to analyze access by information search behavior clusters. Low searchers relied on interpersonal sources, such as the input dealer, state department of agriculture extension workers, family and relatives, progressive farmers, and PACBs (Figure 4.7). Semi-medium searchers accessed all media, with the most use of electronic sources. High and medium searchers also accessed print and broadcast media (Table 4.14).
Figure 4.7—Sources accessed by each search behavior cluster
Source: Authors’ calculations. Notes: ATMA = Agricultural Technology Management Agency; NGO = nongovernmental organization; PACB = primary
agricultural cooperative bank.
05
101520253035404550
Inpu
t dea
ler
Stat
e Do
A
Prog
ress
ive
farm
er
Fam
ily TV
PACB
New
spap
er
Perc
enta
ge
1 source
2 sources
3 sources
4 sources
5 sources
6 sources
7 sources
05
10152025303540
Inpu
t dea
ler
Stat
e de
pt o
f agr
icul
ture TV
New
spap
erPr
ogre
ssiv
e fa
rmer
sFa
mily
mem
bers
or r
elat
ives
PACB
Farm
mag
azin
esGo
vern
men
t ext
ensio
nRa
dio
Farm
er g
roup
ass
ocia
tion
Rese
arch
stat
ions
Suga
r fac
tory
Coop
erat
ive
soci
ety
Krish
i vig
yan
kend
raAg
riclin
icM
obile
pho
ne se
rvic
eSt
ate
agric
ultu
ral u
nive
rsity
Villa
ge fa
irTr
ader
Priv
ate
com
pany
pub
licat
ions
ATM
ACr
edit
agen
cyFa
rmer
org
new
slett
erO
ther
line
dep
artm
ents
NGO
Priv
ate
cons
ulta
nts
Perc
enta
ge a
cces
sed
(%)
High Medium Semi-medium Low
25
Table 4.14—Fraction of medium used, by search behavior cluster High Medium Semi-medium Low Fraction of Each Medium Accessed
F Prob>F Mean SD Mean SD Mean SD Mean SD
Broadcast fraction 61.96 0.0000*** 0.42 0.29 0.26 0.27 0.27 0.25 0.06 0.17 Interpersonal fraction
53.3 0.0000*** 0.19 0.06 0.12 0.03 0.06 0.03 0.08 0.05
Print media fraction 2.72 0.0437** 0.16 0.15 0.06 0.09 0.07 0.08 0.01 0.03 Electronic fraction 195.35 0.0000*** 0.02 0.10 0.00 0.05 0.02 0.14 0.00 0.00
Source: Authors calculations. Notes: *, **, *** means significant at 0.10, 0.05, and 0.01, respectively.
In addition to relying on other farmers, the majority of farmers, particularly the low searchers, relied on input dealers for information, though the government extension staff also was a significant source of agricultural information. Analyzed by information search behavior cluster, the results show significant differences in the media used. Low searchers did not use electronic sources and used very few print media sources. They relied on broadcast and interpersonal sources. This can have important implications for targeting users for information. Low searchers, who have the smallest land areas and lowest incomes, are better reached through interpersonal sources and broadcast media, such as television or radio.
Constraints to Information Access The major constraints to information access were poor availability and unreliability of information. Respondents also cited a lack of awareness of information sources available and said that the information available was not timely. The first-ranked major information constraint differed between the groups, though ANOVA showed these differences to be insignificant.
The FGDs provided more insights into the bottlenecks of accessing information. Lack of credit meant that for many, applying new information could be costly, as the capacity for risk taking was low. There was also some frustration in the application of the information, with one instance in which the information failed to produce desired results, and another where there was no change in yield. One example given was for the SRI (System of Rice Intensification) technology, where farmers had access to incomplete information. One woman said, “We need information that does not increase our cost of cultivation but keeps the costs the same or reduces them.” Information from the public-sector extension system (university, research stations, and AOs and AAOs) was described as being “locked” and difficult to access. Follow-up and field visits were lacking. Lack of interest in agriculture, due to poor profits, and lack of credit reduced the incentive to search for information, with many saying they did not know what information was needed.
While access to reliable and timely information is important to farmers, the major bottlenecks farmers cited to improving their farm income were related to physical resources and the natural situation, including climate variability, flood conditions, and inadequate irrigation. High costs of inputs, labor availability, and access to markets were also ranked as major bottlenecks to improving farm incomes. In the FGDs, particularly in Tiruvarur district, a number of water management issues were mentioned, including flooding problems that affected cultivation. Poor road access affected one village, where transport costs were high. The contextual issues within each village are important to understand in order to address the residents’ specific information needs, which are influenced by these issues.
Despite the constraints, most respondents considered the information received from the sources they used as very relevant (59.2 percent) or somewhat relevant (27.5 percent). About 83.2 percent of the information received was acted on. The main reasons for not applying information were because of poor relevance and usefulness (40.5 percent), lack of technical advice for follow-up (28.4 percent), or poor
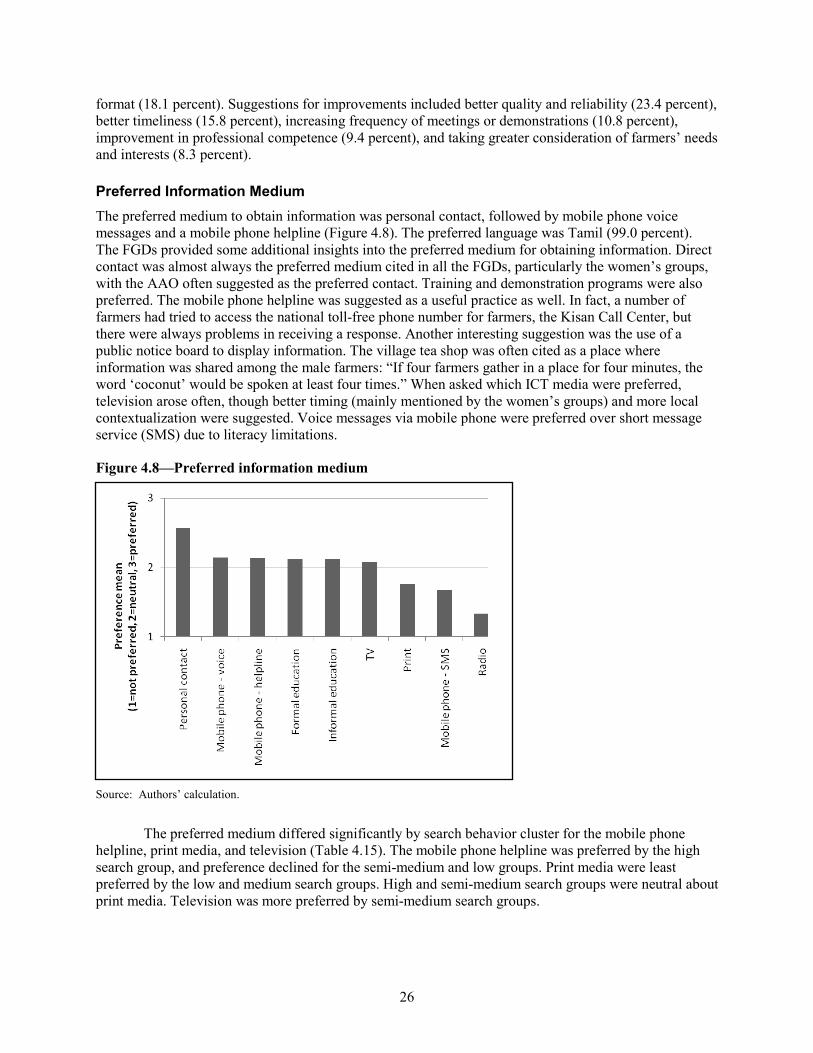
26
format (18.1 percent). Suggestions for improvements included better quality and reliability (23.4 percent), better timeliness (15.8 percent), increasing frequency of meetings or demonstrations (10.8 percent), improvement in professional competence (9.4 percent), and taking greater consideration of farmers’ needs and interests (8.3 percent).
Preferred Information Medium The preferred medium to obtain information was personal contact, followed by mobile phone voice messages and a mobile phone helpline (Figure 4.8). The preferred language was Tamil (99.0 percent). The FGDs provided some additional insights into the preferred medium for obtaining information. Direct contact was almost always the preferred medium cited in all the FGDs, particularly the women’s groups, with the AAO often suggested as the preferred contact. Training and demonstration programs were also preferred. The mobile phone helpline was suggested as a useful practice as well. In fact, a number of farmers had tried to access the national toll-free phone number for farmers, the Kisan Call Center, but there were always problems in receiving a response. Another interesting suggestion was the use of a public notice board to display information. The village tea shop was often cited as a place where information was shared among the male farmers: “If four farmers gather in a place for four minutes, the word ‘coconut’ would be spoken at least four times.” When asked which ICT media were preferred, television arose often, though better timing (mainly mentioned by the women’s groups) and more local contextualization were suggested. Voice messages via mobile phone were preferred over short message service (SMS) due to literacy limitations.
Figure 4.8—Preferred information medium
Source: Authors’ calculation.
The preferred medium differed significantly by search behavior cluster for the mobile phone helpline, print media, and television (Table 4.15). The mobile phone helpline was preferred by the high search group, and preference declined for the semi-medium and low groups. Print media were least preferred by the low and medium search groups. High and semi-medium search groups were neutral about print media. Television was more preferred by semi-medium search groups.
27
Use of different media to access information has already been shown to differ significantly by information search behavior group, where low searchers relied on interpersonal and broadcast media. Semi-medium and low searchers had a lower preference for television, which is a broadcast media, and the lowest preference for print media, which reflected their current information access patterns. This confirms the importance of targeting information through appropriate media.
Table 4.15—Preferences for information media High Medium Semi-medium Low Preferred Medium
F Prob>F Mean SD Mean SD Mean SD Mean SD
Personal contact 1.98 0.1162 2.58 0.66 2.52 0.74 2.43 0.82 2.67 0.71 Mobile helpline 7.76 0.0000*** 2.41 0.85 2.12 0.94 1.84 0.94 1.98 0.94 Mobile voice 1.97 0.1175 2.26 0.84 2.13 0.89 1.92 0.93 2.13 0.93 Formal education 1.23 0.2962 2.22 0.71 2.06 0.79 2.16 0.83 2.11 0.91 Informal education 1.36 0.2539 2.14 0.73 2.08 0.81 1.98 0.88 2.21 0.91 Print media 10.42 0.0000*** 1.99 0.85 1.74 0.83 1.92 0.95 1.48 0.77 TV 4.69 0.0030** 1.89 0.85 2.08 0.91 2.41 0.84 2.15 0.93 Mobile SMS 0.17 0.9143 1.66 0.83 1.67 0.86 1.63 0.86 1.71 0.88 Radio 0.29 0.8292 1.35 0.64 1.32 0.61 1.27 0.57 1.35 0.63 Electronic media 1.25 0.2911 1.25 0.51 1.21 0.48 1.14 0.46 1.16 0.44
Source: Authors’ calculation. Notes: *, **, *** means significant at 0.10, 0.05, and 0.01, respectively. 1=not preferred, 2=neutral, 3=preferred.
Factors That Influence Farmers’ Information Search Behaviors The foregoing analysis has demonstrated that farmers differ in their information needs, sources used, and preferred medium for information access. In order to further understand the determinants of the high and low search behaviors, logistic regression models were estimated (Table 4.16). The high and low information search behaviors, defined using Ward’s hierarchical clustering technique, were used as two separate dependent variables in two logit regression models. To determine the factors that influence high search behaviors and low search behaviors, the variables in Table 3.2 were used. This included the rice information need factors and the factors reflecting attitude toward information searching.
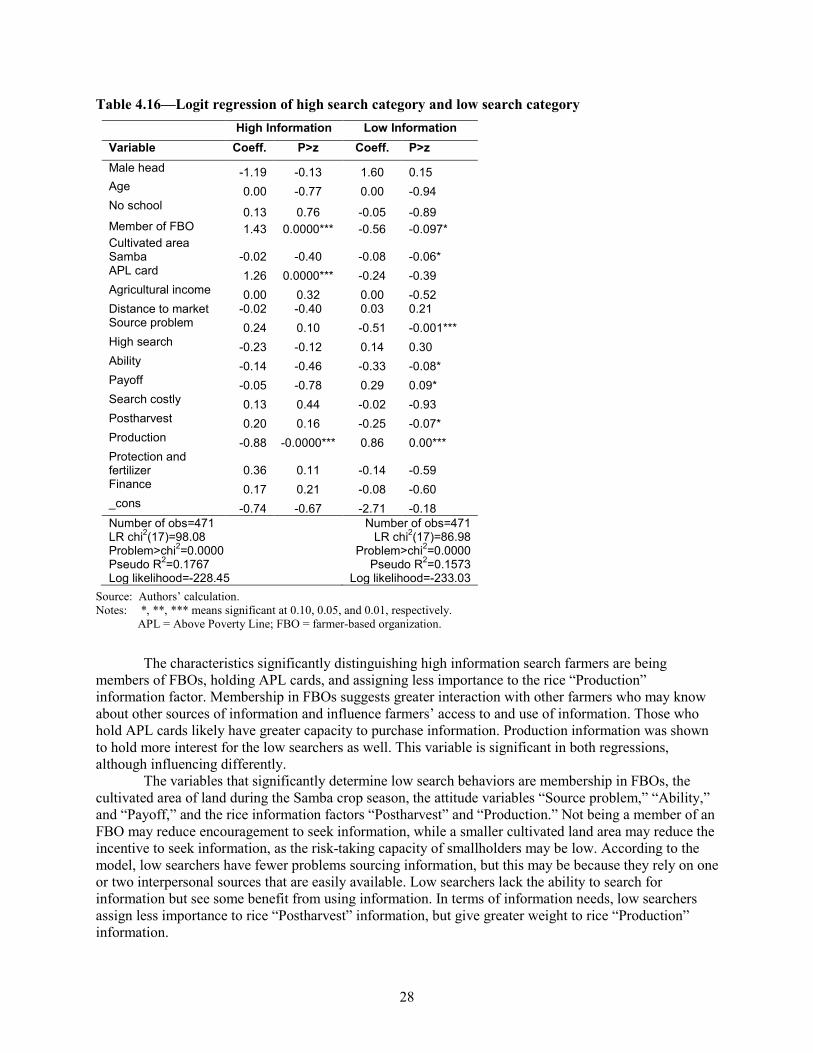
28
Table 4.16—Logit regression of high search category and low search category High Information Low Information Variable Coeff. P>z Coeff. P>z Male head -1.19 -0.13 1.60 0.15 Age 0.00 -0.77 0.00 -0.94 No school 0.13 0.76 -0.05 -0.89 Member of FBO 1.43 0.0000*** -0.56 -0.097* Cultivated area Samba -0.02 -0.40 -0.08 -0.06* APL card 1.26 0.0000*** -0.24 -0.39 Agricultural income 0.00 0.32 0.00 -0.52 Distance to market -0.02 -0.40 0.03 0.21 Source problem 0.24 0.10 -0.51 -0.001*** High search -0.23 -0.12 0.14 0.30 Ability -0.14 -0.46 -0.33 -0.08* Payoff -0.05 -0.78 0.29 0.09* Search costly 0.13 0.44 -0.02 -0.93 Postharvest 0.20 0.16 -0.25 -0.07* Production -0.88 -0.0000*** 0.86 0.00*** Protection and fertilizer 0.36 0.11 -0.14 -0.59 Finance 0.17 0.21 -0.08 -0.60 _cons -0.74 -0.67 -2.71 -0.18 Number of obs=471 LR chi2(17)=98.08 Problem>chi2=0.0000 Pseudo R2=0.1767 Log likelihood=-228.45
Number of obs=471 LR chi2(17)=86.98
Problem>chi2=0.0000 Pseudo R2=0.1573
Log likelihood=-233.03 Source: Authors’ calculation. Notes: *, **, *** means significant at 0.10, 0.05, and 0.01, respectively.
APL = Above Poverty Line; FBO = farmer-based organization.
The characteristics significantly distinguishing high information search farmers are being members of FBOs, holding APL cards, and assigning less importance to the rice “Production” information factor. Membership in FBOs suggests greater interaction with other farmers who may know about other sources of information and influence farmers’ access to and use of information. Those who hold APL cards likely have greater capacity to purchase information. Production information was shown to hold more interest for the low searchers as well. This variable is significant in both regressions, although influencing differently.
The variables that significantly determine low search behaviors are membership in FBOs, the cultivated area of land during the Samba crop season, the attitude variables “Source problem,” “Ability,” and “Payoff,” and the rice information factors “Postharvest” and “Production.” Not being a member of an FBO may reduce encouragement to seek information, while a smaller cultivated land area may reduce the incentive to seek information, as the risk-taking capacity of smallholders may be low. According to the model, low searchers have fewer problems sourcing information, but this may be because they rely on one or two interpersonal sources that are easily available. Low searchers lack the ability to search for information but see some benefit from using information. In terms of information needs, low searchers assign less importance to rice “Postharvest” information, but give greater weight to rice “Production” information.
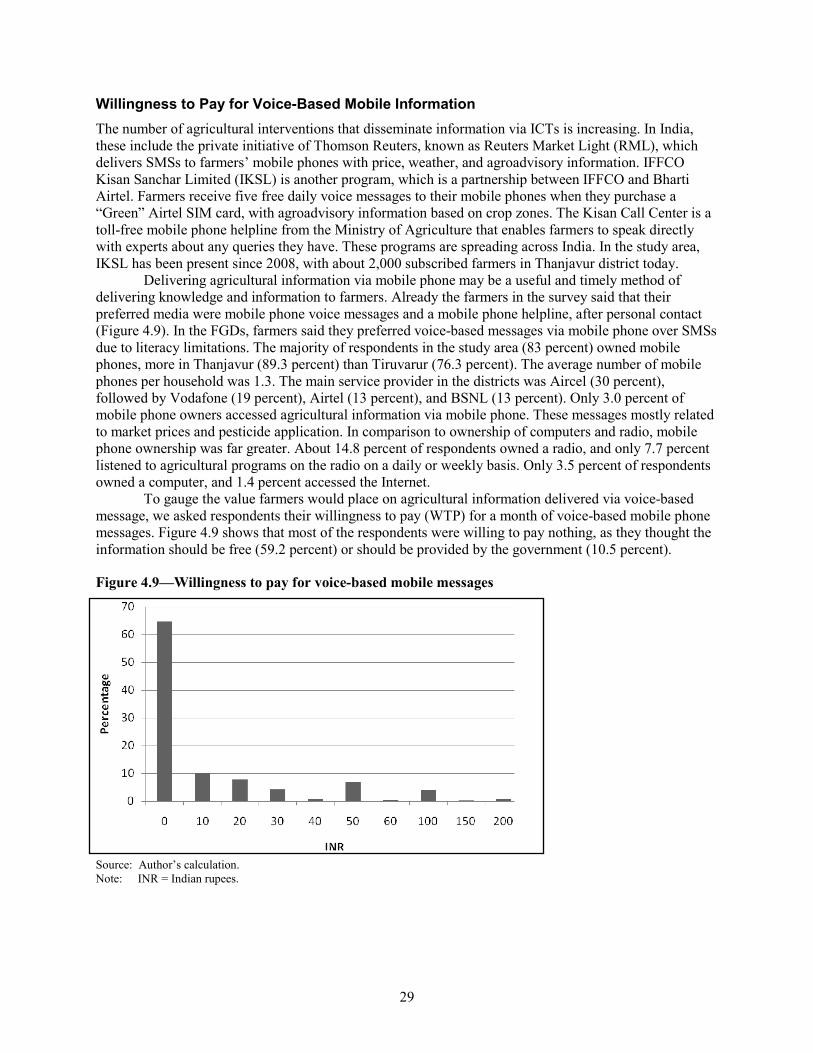
29
Willingness to Pay for Voice-Based Mobile Information The number of agricultural interventions that disseminate information via ICTs is increasing. In India, these include the private initiative of Thomson Reuters, known as Reuters Market Light (RML), which delivers SMSs to farmers’ mobile phones with price, weather, and agroadvisory information. IFFCO Kisan Sanchar Limited (IKSL) is another program, which is a partnership between IFFCO and Bharti Airtel. Farmers receive five free daily voice messages to their mobile phones when they purchase a “Green” Airtel SIM card, with agroadvisory information based on crop zones. The Kisan Call Center is a toll-free mobile phone helpline from the Ministry of Agriculture that enables farmers to speak directly with experts about any queries they have. These programs are spreading across India. In the study area, IKSL has been present since 2008, with about 2,000 subscribed farmers in Thanjavur district today.
Delivering agricultural information via mobile phone may be a useful and timely method of delivering knowledge and information to farmers. Already the farmers in the survey said that their preferred media were mobile phone voice messages and a mobile phone helpline, after personal contact (Figure 4.9). In the FGDs, farmers said they preferred voice-based messages via mobile phone over SMSs due to literacy limitations. The majority of respondents in the study area (83 percent) owned mobile phones, more in Thanjavur (89.3 percent) than Tiruvarur (76.3 percent). The average number of mobile phones per household was 1.3. The main service provider in the districts was Aircel (30 percent), followed by Vodafone (19 percent), Airtel (13 percent), and BSNL (13 percent). Only 3.0 percent of mobile phone owners accessed agricultural information via mobile phone. These messages mostly related to market prices and pesticide application. In comparison to ownership of computers and radio, mobile phone ownership was far greater. About 14.8 percent of respondents owned a radio, and only 7.7 percent listened to agricultural programs on the radio on a daily or weekly basis. Only 3.5 percent of respondents owned a computer, and 1.4 percent accessed the Internet.
To gauge the value farmers would place on agricultural information delivered via voice-based message, we asked respondents their willingness to pay (WTP) for a month of voice-based mobile phone messages. Figure 4.9 shows that most of the respondents were willing to pay nothing, as they thought the information should be free (59.2 percent) or should be provided by the government (10.5 percent).
Figure 4.9—Willingness to pay for voice-based mobile messages
Source: Author’s calculation. Note: INR = Indian rupees.
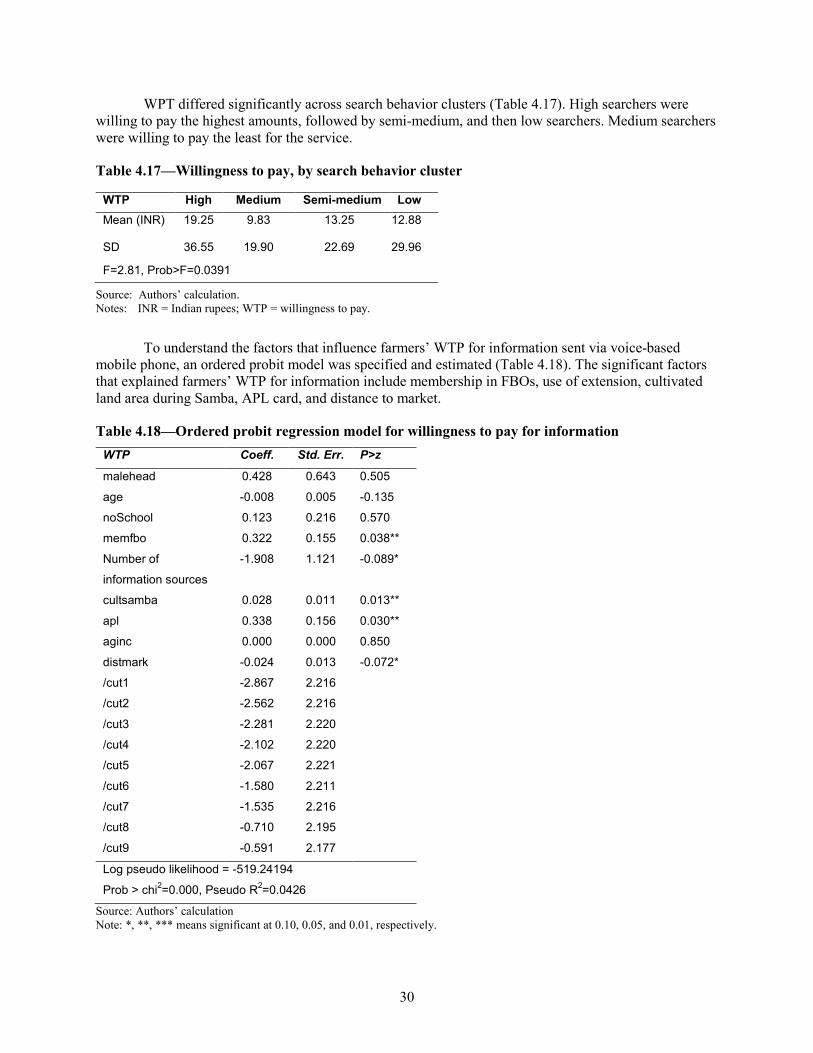
30
WPT differed significantly across search behavior clusters (Table 4.17). High searchers were willing to pay the highest amounts, followed by semi-medium, and then low searchers. Medium searchers were willing to pay the least for the service.
Table 4.17—Willingness to pay, by search behavior cluster
Source: Authors’ calculation. Notes: INR = Indian rupees; WTP = willingness to pay.
To understand the factors that influence farmers’ WTP for information sent via voice-based mobile phone, an ordered probit model was specified and estimated (Table 4.18). The significant factors that explained farmers’ WTP for information include membership in FBOs, use of extension, cultivated land area during Samba, APL card, and distance to market.
Table 4.18—Ordered probit regression model for willingness to pay for information WTP Coeff. Std. Err. P>z
malehead 0.428 0.643 0.505
age -0.008 0.005 -0.135
noSchool 0.123 0.216 0.570
memfbo 0.322 0.155 0.038**
Number of
information sources
-1.908 1.121 -0.089*
cultsamba 0.028 0.011 0.013**
apl 0.338 0.156 0.030**
aginc 0.000 0.000 0.850
distmark -0.024 0.013 -0.072*
/cut1 -2.867 2.216
/cut2 -2.562 2.216
/cut3 -2.281 2.220
/cut4 -2.102 2.220
/cut5 -2.067 2.221
/cut6 -1.580 2.211
/cut7 -1.535 2.216
/cut8 -0.710 2.195
/cut9 -0.591 2.177
Log pseudo likelihood = -519.24194
Prob > chi2=0.000, Pseudo R2=0.0426
Source: Authors’ calculation Note: *, **, *** means significant at 0.10, 0.05, and 0.01, respectively.
WTP High Medium Semi-medium Low Mean (INR) 19.25 9.83 13.25 12.88
SD 36.55 19.90 22.69 29.96
F=2.81, Prob>F=0.0391
31
Membership in FBOs increased farmers’ WTP for mobile voice messages. Perhaps belonging to an FBO increases awareness of mobile-based services, and the potential convenience of access and timely availability increase WTP. As more information sources were accessed by farmers, their WTP for information through mobile phone decreased, which may be because sufficient information was already available to them (though this contradicts high searchers’ WTP, which is highest, but is reflected by medium searchers’ lowest WTP; see Table 4.17). As expected, richer farmers whose area of land cultivated was largest and who held an APL card had a higher WTP. This may be because their capacity to pay was greater. As distance to market increased, WTP decreased. This may be because mobile services are less accessible and network strength is weaker when the farmer lives away from the market center, and so WTP for mobile phone messages is lower.
The results show that WTP for mobile phone messages is not high. For example, the WTP was less than the subscriptions charged by RML. This is not very encouraging, considering the increasing number of projects pushing agricultural information via mobile phone. However, the Kisan Call Center, a toll-free number allowing farmers to reach experts, could be valuable for farmers, as the mobile phone is the preferred medium for many. But the FGDs found that the Kisan Call Center performance was poor in terms of the response rate and connectivity.
32
5. DISCUSSION AND POLICY IMPLICATIONS
Understanding what information farmers need, how they search for information, which sources they depend on for accessing information, and how much they are willing to pay for such information can help in designing effective extension programs and advising services in developing countries. This study examined the information search behavior of farmers in southern India and confirms the heterogeneity of this behavior within farming communities. The results of this study can support targeted extension programs in the area. The main outcomes and implications of the study are discussed below.
Information Search Behaviors Because increases in the productivity of smallholder agriculture crucially depend on information related to production, processing, and markets, identifying farmers’ sources of information and search behavior becomes important. The provision and targeted delivery of agricultural information to small and marginal farmers remain a challenge in extension programs (Swanson 2008; Swanson and Rajalahti 2010). The results of this study show that the low information searchers had smaller landholding sizes, lower levels of education, and lower standards of living. Their information needs and crops also differed from those of farmers in the other search categories. Low searchers required information on crop practices and credit availability, as well as information on less-water-intensive crops such as black gram and other gram. The low searchers used a fewer number of information sources, and less frequently. The main sources of the low searchers were interpersonal—the input dealer, the state department of agriculture extension staff, family, and progressive farmers. The results clearly show that reaching farmers who are low information searchers requires different delivery and content strategies in extension programs. The formation of FBOs and farmer groups is often encouraged to reach these farmers (Swanson 2008). This approach is supported by the results of this study, as membership in FBOs was associated with high search behaviors. In India, formation of farmer groups is the current approach of the national public-sector agricultural extension program called the Agricultural Technology Management Agency (ATMA). Considering the already high use of state department of agriculture extension staff by the smallholder farmers in the area, the state department of agriculture could take further initiative to facilitate the formation of farmer groups, including women’s farmer groups. However, organizational performance issues in the public-sector extension system, which came out in the FGDs, may need to be addressed to ensure the successful formation of such groups.
Most Used Information Sources and Preferred Medium Agricultural extension and advisory services in India are pluralistic. The results of the study show that farmers access information from a range of sources, but this is related to their information search behaviors. Despite varying search behaviors, almost all the farmers in this region are already seeking information from one source or another. The results indicate that private input dealers, state department of agriculture officials, local farmer cooperative banks, newspapers, and television are the most used information sources of farmers. Interpersonal methods of information sharing are the preferred mode of dissemination.
The results of this study differ greatly from those of the NSSO 2003, which found that 60 percent of farmers did not access any information on modern technology to support their farm enterprises (NSSO 2005). To improve extension coverage, sources like the state department of agriculture, the agricultural cooperative banks, newspapers, and television could be targeted as appropriate sources for delivery of information. The current challenge, however, is to provide relevant, appropriate, and contextualized content for various agroecological zones. Information needs to be provided in local languages. The heavy reliance on private input dealers is of concern, considering the conflict of interest inherent in this service. Given that the main information needs of farmers relate to pesticide and fertilizer application and pest and disease management, training and capacity building of private input dealers on specific crop pests,
33
diseases, and other crop management methods would reduce misinformation and the exploitation of poor farmers who depend on both information and credit from the input dealers. Complementing this approach by establishing more agriclinics, which are privately owned but publicly subsidized programs to encourage trained individuals, would help in creating a competitive environment for agricultural information sharing (Global AgriSystem 2008).
Mass Media, ICTs, and Willingness to Pay ICTs are increasingly highlighted as a valuable and efficient way of providing information to farmers (Richardson 2006a, 2006b). The high search farmers in the study area already use newspapers, and television is a key source of information for all the farmers, including the low searchers. The newer technologies, such as the Internet and mobile phones, are currently underutilized to access information in the study districts. Despite high mobile phone ownership, access to information via mobile phone is low. The contingent valuation exercise showed that fee-based delivery of information via mobile phone is not in high demand. This may inhibit penetration of private approaches like RML or IKSL, but the Kisan Call Centers currently implemented by the government may become a valuable information source. However, the performance of the Kisan Call Centers needs to improve, as the FGDs showed that accessing information from them was problematic. Despite this, farmers would prefer to access information via mobile phone, after interpersonal sources, suggesting that mobile phones could be a useful way to reach farmers, provided the service is freely available. The role of public–private partnership in the provision of agricultural information needs to be explored further in this context.
Information Needs Inappropriate or poor-quality information could be a hindrance to farmers’ use of information sources. However, in this study the farmers said the information they accessed was relevant most of the time. The major constraints to information access are poor availability, poor reliability, a lack of awareness of information sources available, and untimely provision of information. Improvement in the service delivery of information seems to be more relevant than improving the content of the information. This relates back to the already mentioned organizational performance of the public extension system, which needs to improve its timely delivery of information. Awareness creation, through newspapers and television, of the various sources of information for farmers would also be helpful. In addition, the use of a public notice board in a public space, such as the village tea shop, would be a useful place to begin, as the value of this space was highlighted in many of the focus group discussions. The decentralized panchayat administration system in rural India could be connected to information dissemination in agriculture, thereby increasing the returns to public information from the agriculture sector.
34
6. CONCLUDING REMARKS
In recent decades, the value of information has increased considerably as the agricultural systems in developing countries become more knowledge intensive. Access to and use of current information is critical, not only for the financial success of farmers, but to support sustainable agricultural systems. Yet, farmers are rarely consulted about their needs and preferences before the design of extension services. But by understanding how farmers access and use agricultural information, their agricultural information needs, and the factors that influence their information search behavior, programs disseminating agricultural information could better target farmers. The findings from this study have important implications for the dissemination of agricultural information by the public extension system and other programs in developing countries. Targeting smallholder farmers with low agricultural incomes is important, as they search for less information. These farmers may lack motivation and interest in agriculture, so improving the timely delivery and reliability of information could encourage them to improve their information search strategies and consequently have important farm outcomes. The information needs of farmers could be categorized according to the farm characteristics and channeled through their preferred medium. Further research is needed to explore the organizational performance challenges in the extension system that are restricting the timely delivery, appropriate availability, and reliability of information for farmers. While this study highlights strong heterogeneity within a rice farming system in Tamil Nadu, greater understanding of the differences in farmer information strategies across the states and farming systems of India is needed.
35
REFERENCES
Adhiguru, P., P. S. Birthal, and B. Ganesh Kumar. 2009. “Strengthening Pluralistic Agricultural Information Delivery Systems in India.” Agricultural Economics Research Review 22:71–79.
Adolwa, I. S., A. O. Esilaba, P. O. Okoth, and M. R. Mulwa. 2010. “Factors Influencing Uptake of Integrated Soil Fertilizer Management Knowledge among Smallholder Farmers in Western Kenya.” Paper presented at the 12th KARI Biennial Scientific Conference, Nairobi, Kenya, November 8–12.
Aghion, P., P. Bolton, C. Harris, and B. Jullien. 1991. “Optimal Learning by Experimentation.” Review of Economic Studies, 58(4): 621-54.
Aina, L. O. 2006. “Information Provision to Farmers in Africa: The Library-Extension Service Linkage.” Paper presented at the World Library and Information Congress: 72nd IFLA General Conference and Council, Seoul, South Korea, August 20–24.
Aker, J. 2011. Dial “A” for Agriculture: A Review of Information and Communication Technologies for Agricultural Extension in Developing Countries. Working Paper 269. Washington, DC: Center for Global Development.
Ali, J., and S. Kumar. 2011. “Information and Communication Technologies (ICTs) and Farmers Decision-Making across the Agricultural Supply Chain.” International Journal of Information Management 31:149–159.
Alvarez, J., and P. Nuthall. 2006. “Adoption of Computer Based Information Systems: The Case of Dairy Farmers in Canterbury, NZ, and Florida, Uruguay.” Computers and Electronics in Agriculture 50:48–60.
Anastasios, M., A. Koutsouris, and M. Konstadinos. 2010. “Information and Communication Technologies as Agricultural Extension Tools: A Survey among Farmers in West Macedonia, Greece.” Journal of Agricultural Education and Extension 16 (3): 249–263.
Anderson, J. R., and G. Feder. 2004. “Agricultural Extension: Good Intentions and Hard Realities.” World Bank Research Observer 19 (1): 41–60.
________. 2007. “Handbook of Agricultural Economics.” Agricultural Extension 3:2343–2378.
Appadurai, A. 2002. “The Capacity to Aspire.” In Culture and Public Action, edited by V. Rao and M. Walton. Washington, DC: World Bank.
Arrow, K.J. 1962. “The Economic Implications of Learning by Doing.” Review of Economic Studies, 29: 155-73.
Balasubramanian, K., P. Thamizoli, A. Umar, and A. Kanwar. 2010. “Using Mobile Phones to Promote Lifelong Learning Among Rural Women in Southern India.” Distance Education 31: 2, 193–209
Bekele, W. 2006. Development Intervention Programs: A Case Study of Subsistence Farmers from East Ethiopian Highlands. Abidjan, Côte d’Ivoire: African Development Bank.
Bernard, T., S. Dercon, and A. S. Taffesse. 2011. Beyond Fatalism: An Empirical Exploration of Self-Efficacy and Aspirations Failure in Ethiopia. IFPRI Discussion Paper 1101. Washington, DC: International Food Policy Research Institute.
Bhagat, G. R., M. S. Nain, and R. Narda. 2004. “Information Sources for Agricultural Technology.” Indian Journal of Extension Education 40 (1–2): 109–110.
Callander, S. 2011. “Searching and Learning by Trial and Error.” American Economic Review 101: 2277-2308.
Carter, B. R., and M. T. Batte. 1993. “Identifying Needs and Audiences in Farm Management Outreach Education.” Review of Agricultural Economics 15 (3): 403–415.
Cecchini, S., and C. Scott. 2003. “Can Information and Communications Technolgoy Applications Contribute to Poverty Reduction? Lessons from Rural India.” Information Technology for Development 10:73–84.
Chapman, R., and T. Slaymaker. 2002. ICTs and Rural Development: Review of the Literature, Current Interventions, and Opportunities for Action. ODI Working Paper 192. London: Overseas Development Institute.
36
Coudel, E., and P. Tonneau. 2010. “How Can Information Contribute to Innovative Learning Processes? Insight from a Farmer University in Brazil.” Agricultural Information Worldwide 3 (2): 56–63.
de Silva, H., and D. Ratnadiwakara. 2008. Using ICT to Reduce Transaction Costs in Agriculture through Better Communication: A Case Study from Sri Lanka. Colombo, Sri Lanka: LIRNEasia. www.lirneasia.net/wp-content/uploads/2008/11/transactioncosts.pdf. Accessed: 10 December, 2011.
Diekmann, F., C. Loibl, and M. T. Batte. 2009. “The Economics of Agricultural Information: Factors Affecting Commercial Farmers’ Information Strategies in Ohio.” Review of Agricultural Economics 31 (4): 853–872.
Garforth, C., B. Angell, J. Archer, and K. Green. 2003. Improving Farmers’ Access to Advice on Land Management: Lessons from Case Studies in Developed Countries. ODI Agricultural Research and Extension Network Paper 125. London: Overseas Development Institute.
Glaeser, E. L., D. Laibson, and B. Sacerdote. 2002. “An Economic Approach to Social Capital.” Economic Journal 112 (November): F347–F458.
Global AgriSystem. 2008. AgriClinics and AgriBusiness Centre Evaluation Study. New Delhi: Global AgriSystem.
Heeks, R. 2005. “Foundations of ICTs in Development: The Information Chain.” eDevelopment Briefing 3.
Halakatti, S. V., D. S. M. Gowda, and K. V. Natikar. 2010. “Role of Mass Media in Transfer of Agricultural Technologies.” Research Journal of Agricultural Sciences 1 (3): 290–291.
Kaniki, A. M. 1991. “Information Seeking and Information Providers among Zambian Farmers.” Libri 41 (3): 147–164.
Llewellyn, R. S. 2007. “Information Quality and Effectiveness for More Rapid Adoption Decisions by Farmers.” Field Crops Research 104:148–156.
Meitei, L. S., and T. P. Devi. 2009. “Farmers Information Needs in Rural Manipur: An Assessment.” Annals of Library and Information Studies 56:35–40.
Mittal, S., S. Gandhi, and G. Tripathi. 2010. Socio-economic Impact of Mobile Phones on Indian Agriculture. Working Paper No. 246. New Delhi: Indian Council for Research on International Economic Relations.
Ngathou, I. N., J. O. Bukenya, and D. M. Chembezi. 2006. “Managing Agricultural Risk: Examining Information Sources Preferred by Limited Resource Farmers.” Journal of Extension 44 (6). Article 6FEA2. Accessed at http://www.joe.org/joe/2006december/a2.php. Accessed 15 March, 2011
NSSO (National Sample Survey Organization). 2005. Situation Assessment Survey of Farmers: Access to Modern Technology for Farming, 59th Round (January–December 2003). Report No. 499 (59/33/2). New Delhi: NSSO, Ministry of Statistics and Programme Implementation, Government of India.
Okwu, O. J., and S. Dauda. 2011. “Extension Communication Channels’ Usage and Preference by Farmers in Benue State, Nigeria.” Journal of Agricultural Extension and Rural Development 3 (5): 88–94.
Opara, U. N. 2010. “Personal and Socio-economic Determinants of Agricultural Information Use by Farmers in the Agricultural Development Program Zones of Imo State, Nigeria.” Library Philosophy and Practice 434. Accessed at http://unllib.unl.edu/LPP/opara.htm. 3 November, 2011.
Putnam, R.D. 1993. Making Democracy Work: Civic Traditions in Modern Italy (Princeton: Princeton University Press).
Ray, D. 2006. “Aspirations, Poverty, and Economic Change.” In Understanding Poverty, edited by A. V. Banerjee, R. Bénabou, and D. Mookherjee. Oxford, UK: Oxford University Press.
Richardson, D. 2006a. ICTs: Transforming Agricultural Extension? Report of the 6th Consultative Expert Meeting of CTA’s Observatory on ICTs. CTA Working Document Number 8034. Wageningen, the Netherlands: ACP-EU Technical Centre for Agricultural and Rural Cooperation.
________. 2006b. “How Can Agricultural Extension Best Harness ICTs to Improve Rural Livelihoods in Developing Countries?” In ICT in Agriculture: Perspectives of Technological Innovation, edited by E. Gelb and A. Offer. Athens, Greece: European Federation for Information Technologies in Agriculture, Food and the Environment.
37
Roman, R., and R. D. Colle. 2003. “Content Creation for ICT Development Projects: Integrating Normative Approaches and Community Demand.” Information Technology for Development 10: 85–94.
Samaddar, A. 2006. “Traditional and Post-Traditional: A Study of Agricultural Rituals in Relation to Technological Complexity among Rice Producers in Two Zones of West Bengal, India.” Journal of Culture and Agriculture 28 (2): 108–121.
Schnitkey, G., M. Batte, E. Jones, and J. Botomogno. 1992. “Information Preferences of Ohio Commercial Farmers: Implications for Extension.” American Agricultural Economics Association 74:486–497.
Singh, B. 1990. “Socio-personal Correlates of Adoption Behaviour and Information Needs of Tribal Farmers in Respect of Rainfed Technology.” Indian Journal of Extension Education 26 (3–5): 53–58.
Singh, B., R. S. Narwal, and J. S. Malik. 2003. “Communication Sources Used by Extension Personnel and Farmers.” Indian Journal of Extension Education 39 (1–2): 26–30.
Solano, C., H. Leon, E. Perez, and M. Herrero. 2003. “The Role of Personal Information Sources on the Decision-Making Process of Costa Rican Dairy Farmers.” Agricultural Systems 76:3–18.
Stefane, L., S. Hendriks, C. Stilwell, and C. Morris. 2005. “Printed Information Needs of Small-Scale Organic Farmers in KwaZulu-Natal.” Libri 55 (1): 56–66.
Stiglitz, J. 2000. “The Contributions of the Economics of Information to Twentieth Century Economics.” Quarterly Journal of Economics 115 (4): 1441–1478.
Sulaiman, R., and P. Ramasundaram. 2011. ICT and Empowerment of Indian Rural Women. CRISP Working Paper 2011-001. Hyderabad, India: Centre for Research and Innovation and Science Policy.
Swanson, B. 2008. Global Review of Good Agricultural Extension and Advisory Service Practices. Rome: Food and Agriculture Organization of the United Nations.
Swanson, B., and R. Rajalahti. 2010. Strengthening Agricultural Extension and Advisory Systems: Procedures for Assessing, Transforming, and Evaluating Extension Systems. Agricultural and Rural Development Discussion Paper 45. Washington, DC: World Bank.
Tucker, M., and T. L. Napier. 2002. “Preferred Sources and Channels of Soil and Water Conservation Information among Farmers in Three Midwestern US Watersheds.” Agriculture, Ecosystems and Environment 92:297–313.
Uebersax, J.S. 2006. “Likert Scaling.” Research Methods Knowledge Base, 2nd Edition. Retrieved, February 2009.
UNDP (United Nations Development Programme). 2001. Essentials: Sythesis of Lessons Learned. No. 5. New York: UNDP.
Van den Ban, A. 1998. “Supporting Farmers’ Decision-Making Process by Agricultural Extension.” Journal of Extension Systems 14:55–64.
Villamil, M. B., A. H. Silvis, and G. A. Bollero. 2008. “Potential Miscanthus’ Adoption in Illinois: Information Needs and Preferred Information Channels.” Biomass and Bioenergy 32:1338–1348.
Waller, B. E., C. W. Hoy, J. L. Henderson, B. Stinner, and C. Welty. 1998. “Matching Innovations with Potential Users: A Case Study of Potato IPM Practices.” Agriculture, Ecosystems and Environment 70:203–215.
Wilson, T. D. 2006. “On User Studies and Information Needs.” Journal of Documentation 62 (6): 658–670.

RECENT IFPRI DISCUSSION PAPERS
For earlier discussion papers, please go to www.ifpri.org/pubs/pubs.htm#dp. All discussion papers can be downloaded free of charge.
1164. Rural demography, public services, and land rights in Africa: A village-level analysis in Burkina Faso. Margaret McMillan, William A. Masters, and Harounan Kazianga, 2012.
1163. Economic development, external shocks, and food security in Tajikistan. Kamiljon T. Akramov and Ganga Shreedhar, 2012.
1162. Infectious disease detection with private information. Alexander E. Saak, 2012.
1161. Economic transformation in Ghana: Where will the path lead? Shashi Kolavalli, Elizabeth Robinson, Xinshen Diao, Vida Alpuerto, Renato Folledo, Mira Slavova, Guyslain Ngeleza, and Felix Asante, 2012.
1160. Globalization, structural change, and productivity growth. Margaret McMillan and Dani Rodrik, 2012.
1159. A review of input and output policies for cereals production in India. Ganga Shreedhar, Neelmani Gupta, Hemant Pullabhotla, A. Ganesh-Kumar, and Ashok Gulati, 2012.
1158. Demand and supply of cereals in India: 2010-2025. A. Ganesh-Kumar, Rajesh Mehta, Hemant Pullabhotla, Sanjay K. Prasad, Kavery Ganguly, and Ashok Gulati, 2012.
1157. Close eye or closed eye: The Case of export misinvoicing in Bangladesh. Pranav Kumar Gupta, Devesh Roy, and Kaikaus Ahmad, 2012.
1156. The sophistication and diversification of the African Agricultural sector: A Product Space Approach. John Ulimwengu and Thaddée Badibanga, 2012.
1155. Why women are progressive in education?: Gender disparities in human capital, labor markets, and family arrangement in the Philippines. Futoshi Yamauchi and Marites Tiongco, 2012.
1154. Resource-rich yet malnourished: Analysis of the demand for food nutrients in the Democratic Republic of Congo. John Ulimwengu, Cleo Roberts, and Josee Randriamamonjy, 2012.
1153. Putting gender on the map: Methods for mapping gendered farm management systems in Sub-Saharan Africa. Ruth Meinzen-Dick, Barbara van Koppen, Julia Behrman, Zhenya Karelina, Vincent Akamandisa, Lesley Hope, and Ben Wielgosz, 2012.
1152. Household preferences and governance of water services: A Hedonic analysis from rural Guatemala. William F. Vásquez, 2011.
1151. Peer effects, risk pooling, and status seeking: What explains gift spending escalation in rural China? Xi Chen, Ravi Kanbur, and Xiaobo Zhang, 2011.
1150. Agricultural productivity and policies in Sub-Saharan Africa. Bingxin Yu and Alejandro Nin-Pratt, 2011.
1149. Common-pool resources, livelihoods, and resilience: Critical challenges for governance in Cambodia. Blake D. Ratner, 2011.
1148. The impact of global climate change on the Indonesian economy. Rina Oktaviani, Syarifah Amaliah, Claudia Ringler, Mark W. Rosegrant, and Timothy B. Sulser, 2011.
1147. Evaluating the Mexico City Policy: How US foreign policy affects fertility outcomes and child health in Ghana. Kelly M. Jones, 2011.
1146. Income shocks and HIV in Sub-Saharan Africa. Marshall Burke, Erick Gong, and Kelly Jones, 2011.
1145. Emerging policies and partnerships under CAADP: Implications for long-term growth, food security, and poverty reduction. Ousmane Badiane, Sunday Odjo, and John Ulimwengu, 2011.
INTERNATIONAL FOOD POLICY RESEARCH INSTITUTE
www.ifpri.org
IFPRI HEADQUARTERS 2033 K Street, NW Washington, DC 20006-1002 USA Tel.: +1-202-862-5600 Fax: +1-202-467-4439 Email: [email protected]
IFPRI ADDIS ABABA P. O. Box 5689 Addis Ababa, Ethiopia Tel.: + 251 (0) 11-617-2500 Fax: + 251 (0) 11-646-2927 Email: [email protected]