FANTASIO: a versatile experimental set-up to investigate jet-cooled molecules
40
For Peer Review Only FANTASIO: a versatile experimental set-up to investigate jet-cooled molecules Journal: Molecular Physics Manuscript ID: TMPH-2006-0025 Manuscript Type: Full Paper Date Submitted by the Author: 20-Sep-2006 Complete List of Authors: Herman, Michel; Université Libre de Bruxelles, Chimie quantique et Photophysique Didriche, Keevin; ULB Hurtmans, Daniel; ULB Kizil, Baris; ULB Macko, Peter; Comenius University Rizopoulos, Atina; ULB Van Poucke, Patrick; ULB Keywords: jet-cooled molecules, FTIR spectroscopy, Quadrupole mass spectrometry, CRDS Note: The following files were submitted by the author for peer review, but cannot be converted to PDF. You must view these files (e.g. movies) online. Fig7.OPJ URL: http://mc.manuscriptcentral.com/tandf/tmph Molecular Physics peer-00513056, version 1 - 1 Sep 2010 Author manuscript, published in "Molecular Physics 105, 05-07 (2007) 815-823" DOI : 10.1080/00268970601063820
Transcript of FANTASIO: a versatile experimental set-up to investigate jet-cooled molecules

For Peer Review O
nly
FANTASIO: a versatile experimental set-up to investigate
jet-cooled molecules
Journal: Molecular Physics
Manuscript ID: TMPH-2006-0025
Manuscript Type: Full Paper
Date Submitted by the Author:
20-Sep-2006
Complete List of Authors: Herman, Michel; Université Libre de Bruxelles, Chimie quantique et Photophysique Didriche, Keevin; ULB Hurtmans, Daniel; ULB Kizil, Baris; ULB Macko, Peter; Comenius University Rizopoulos, Atina; ULB Van Poucke, Patrick; ULB
Keywords: jet-cooled molecules, FTIR spectroscopy, Quadrupole mass spectrometry, CRDS
Note: The following files were submitted by the author for peer review, but cannot be converted to PDF. You must view these files (e.g. movies) online.
Fig7.OPJ
URL: http://mc.manuscriptcentral.com/tandf/tmph
Molecular Physicspe
er-0
0513
056,
ver
sion
1 -
1 Se
p 20
10Author manuscript, published in "Molecular Physics 105, 05-07 (2007) 815-823"
DOI : 10.1080/00268970601063820

For Peer Review O
nly
Page 1 of 38
URL: http://mc.manuscriptcentral.com/tandf/tmph
Molecular Physics
123456789101112131415161718192021222324252627282930313233343536373839404142434445464748495051525354555657585960
peer
-005
1305
6, v
ersi
on 1
- 1
Sep
2010

For Peer Review O
nly
1
FANTASIO: a versatile experimental set-up
to investigate jet-cooled molecules
Submitted to Molecular Physics
(John Brown’s special issue)
M. Herman, K. Didriche*, D. Hurtmans, B. Kizil**,
P. Macko***, A. Rizopoulos, and P. Van Poucke
Laboratoire de Chimie quantique et Photophysique
CP160/09
Université libre de Bruxelles
Ave. Roosevelt, 50
B-1050
Brussels, Belgium
*FRIA Researcher
** FNRS Engineer
*** FNRS and ARC postdoctoral researcher; Permanent address:
Faculty of Mathematics, Physics and Informatics, Comenius University,
Mlynská dolina, 84248 Bratislava, Slovakia.
Pages: 25
Figures: 11
Send mail to Prof. M. Herman
Email: [email protected]
Page 2 of 38
URL: http://mc.manuscriptcentral.com/tandf/tmph
Molecular Physics
123456789101112131415161718192021222324252627282930313233343536373839404142434445464748495051525354555657585960
peer
-005
1305
6, v
ersi
on 1
- 1
Sep
2010

For Peer Review O
nly
2
Abstract
The design of a new apparatus for studying jet-cooled molecules,
named FANTASIO, is described. It includes, around the same supersonic
expansion cell, a high resolution Fourier transform spectrometer with
single or multipass optics, a tunable diode laser spectrometer with
optional cavity ring-down facilities, and a quadrupole mass spectrometer.
Performances and operation procedures are illustrated.
Page 3 of 38
URL: http://mc.manuscriptcentral.com/tandf/tmph
Molecular Physics
123456789101112131415161718192021222324252627282930313233343536373839404142434445464748495051525354555657585960
peer
-005
1305
6, v
ersi
on 1
- 1
Sep
2010

For Peer Review O
nly
3
1. Introduction
In addition to many high resolution spectroscopic investigations of
jet-cooled molecules in the visible spectral region, including those from
John Brown (e.g. (1)), a number of studies were dedicated to jet-cooled
molecules in the infrared range. The latter used both tunable diode laser
(TDL) (see among many others (2, 3)) and Fourier transform infrared
(FTIR) spectrometers (see review in (4) and e.g. (5-7) for a sample of more
recent papers). The ULB group so far contributed to FTIR-based
investigations, exclusively. Following a first generation set-up (8-10), a
more performing system was developed at ULB, with various
configurations (11, 12), allowing the vibration-rotation spectrum of several
species to be significantly simplified, thanks to both rotational and, for low
frequency modes, vibrational cooling. As a result, the vibration-rotation
analysis of infrared bands was made possible for a number of stable and
less stable species, usually gaseous under standard conditions, namely
methane (CH4)(13), dinitrogen trioxide (N
2O
3) (14), ethylene (C
2H
4) (15-19),
dinitrogen tetroxide (N2O
4) (20), acetaldehyde (CH
3CHO) (21), sulfur
hexafluoride (SF6) (22), ethane (C
2H
6) (23-26), 1,2 dichlorethane (1,2
C2H
4Cl
2) (27), propene (C
3H
6) (28), dimethylether (C
2H
6O) (29), propane
(C3H
8) (30), and formic acid dimer ((HCO
2H)
2) (15).
We have designed a new set-up, so far only very briefly reported on
in the literature (31), which we name FANTASIO, for ‘‘Fourier trANsform,
Tunable diode and quadrupole mAss spectrometers interfaced to a
Page 4 of 38
URL: http://mc.manuscriptcentral.com/tandf/tmph
Molecular Physics
123456789101112131415161718192021222324252627282930313233343536373839404142434445464748495051525354555657585960
peer
-005
1305
6, v
ersi
on 1
- 1
Sep
2010

For Peer Review O
nly
4
Supersonic expansIOn’’. FANTASIO is presented in this paper and its
performances illustrated by a sample of recent results and experimental
procedures.
2. General description of FANTASIO
In the set-up, the jet is produced vertically from above through
either circular or slit nozzles. The circular nozzle we are currently using,
in stainless steel, is 500 µm in diameter. The slit, in brass, is about 1 cm
long and 30 µm wide. All results presented in this work are obtained using
one of these nozzles. The gas injection conditions are of continuous type, to
match the FTIR sampling characteristics.
The expansion can be monitored in a single, horizontal plane
perpendicular to the vertical expansion, using high resolution FTIR, cavity
ring-down spectroscopy (CRDS) and quadrupole mass spectrometry (MS).
The slit nozzle can be turned around the vertical axis to fit either probe
path. The vertical distance separating the nozzle exit from the probe
plane can be varied between approximately 5 and 35 mm by stretching the
bellow supporting the nozzle. The reservoir (p0) and residual (p∞) pressures
are measured using MKS Baratron gauges (1000 and 1 torr full scale,
respectively). The studied and carrier gas flows are measured using MKS
flowmeters (10000 and 50000 sccm full scale, respectively).
Page 5 of 38
URL: http://mc.manuscriptcentral.com/tandf/tmph
Molecular Physics
123456789101112131415161718192021222324252627282930313233343536373839404142434445464748495051525354555657585960
peer
-005
1305
6, v
ersi
on 1
- 1
Sep
2010

For Peer Review O
nly
5
We use a large turbomolecular pump, Leybold MAG W3200 CT
teflon coated, which is backed by an Alcatel ADS 860 HII group. It brings
significant changes compared to our previous system based on a 16 cm
long slit nozzle and large Roots blower (15). Because of the lower pumping
throughput, the amount of material injected in the jet should be now
significantly reduced, leading to an undesired decrease in the signal to
noise ratio (S/N). As detailed in sections 3 and 5 this drawback is,
however, cancelled thanks to the implementation of more sensitive
detection systems than in the previous set-up. On the other hand, more
hazardous or less standard gases can now be injected, opening new
perspective. For instance acetylene spectra will be reported in the present
work, which we did not dare injecting in our previous set-up. Another
improvement is that the residual pressure in the absorption cell is
dramatically reduced, typically from 10 Pa down to 1 Pa, for similar
reservoir pressures, of the order of 50 kPa. The pressure ratio on both
sides of the nozzle is therefore now of the order of 50000, i.e. about ten
times larger than before. Lower rotational temperatures can therefore be
achieved. For instance, for strong bands in standard gases such as
acetylene and methane seeded in Ar, some 5 K can be currently obtained
on routine FTIR operation, compared to typically 35 K previously, with
similar S/N. Given the increase in S/N when using the TDL system
described in section 5, even lower rotational temperatures could probably
be achieved.
Page 6 of 38
URL: http://mc.manuscriptcentral.com/tandf/tmph
Molecular Physics
123456789101112131415161718192021222324252627282930313233343536373839404142434445464748495051525354555657585960
peer
-005
1305
6, v
ersi
on 1
- 1
Sep
2010

For Peer Review O
nly
6
3. FTIR probe
The expansion is optically probed perpendicularly to the central
flow axis using a FTIR Bruker IFS120HR with maximum available
resolution of 0.0043 cm−1 (defined as 0.9/δ, with δ the maximum optical
path difference). This instrumental resolution is the limiting factor when
using the slit jet, as further commented on in section 5. It is not when
using an axisymmetric expansion. The latter is indeed shaped as a series
of concentric divergent cones, with decreasing particle densities as the
cone angle increases. Different classes of molecules therefore contribute to
high resolution absorption line shapes when optically probing the
expansion in a direction perpendicular to the jet axis. These classes are
distinct by the cone angle, inducing a specific Doppler shift, and by the
particle density, contributing a specific weight to the absorption intensity.
As a result, line profiles with FWHM about twice broader than the optimal
FT instrumental resolution presently available are observed when probing
an expansion produced from the 500 µm circular nozzle. This is
demonstrated in Fig. 1, which compares the profile of the jet cooled R(0)
line in ν3, pure N
2O, recorded by FTIR using the axisymmetric jet to the
Doppler profile calculated at the rotational temperature of the probed gas
(22 K).
Page 7 of 38
URL: http://mc.manuscriptcentral.com/tandf/tmph
Molecular Physics
123456789101112131415161718192021222324252627282930313233343536373839404142434445464748495051525354555657585960
peer
-005
1305
6, v
ersi
on 1
- 1
Sep
2010

For Peer Review O
nly
7
The FT light source, a heated resisting ceramic, is focused onto the
entrance iris of the FT instrument. As presented in Fig. 2, the light exiting
the spectrometer through the iris is focused using two plane mirrors and a
toroidal one (250/40 mm) into the jet chamber. The light is then collected
and focused onto an appropriate detector, usually MCT or InSb, using a
second toroidal mirror.
Two different optical paths can be selected to probe the expansion.
In the first one, a single light pass crosses the expansion as schematized in
Fig. 2(top). In this configuration, the cell windows can be set very close to
the expansion. Using a 1.5 mm FTIR iris produces a beam with diameter
around 3.5 mm at the cell windows, with a waist imaging the iris at the
centre of the expansion. This configuration, combined with the low
residual pressures (p∞ = 1 Pa) strongly limits undesired contribution to the
absorption from hot gas surrounding the expansion.
The other optical configuration available in the expansion cell
involves multipass optics. Various designs were reported in the FT-jet
literature (see ((4)). The present one is schematized in Fig. 2(bottom). The
injection optics is identical to the single pass one, but for the focus point
now set at the entrance aperture of the multipass system. It is directly
inspired from (32). It uses two gold coated spherical mirrors each with 50
mm focal length (f) and separated by a distance of 165 mm (d). Computer
simulations accounting for the resulting ratio d/f = 3.3 predict some 10
Page 8 of 38
URL: http://mc.manuscriptcentral.com/tandf/tmph
Molecular Physics
123456789101112131415161718192021222324252627282930313233343536373839404142434445464748495051525354555657585960
peer
-005
1305
6, v
ersi
on 1
- 1
Sep
2010

For Peer Review O
nly
8
reflections. The two mirrors are mounted on 4 horizontal aluminum bars
set in holders fitting the largest horizontal exits in the expansion cell.
When entering a white light beam in the multipass system, a reddish spot
is observed in the transmitted beam, due to the specific spectral filtering
of the mirrors. Monitoring the reddest focus point allows the optics to be
fine tuned and the number of reflections to be estimated. Fig. 3 shows the
absorbance spectrum of 12
CH4 around 3000 cm−1, as recorded without (top)
and with (bottom) the multipass optics installed (other, very similar
experimental conditions for both recordings are indicated in the caption of
Fig. 3). The absorbance shows an increase of a factor of 10.4, while the
noise approximately doubles. Therefore the gain is ~ 5 on the S/N. The
beam passing straight into the assembly also contributes to the signal,
probably explaining the increase slightly larger than the factor 10
expected from the predicted number of reflections. Fig. 3 demonstrates the
improvement, both in increasing the S/N on ν3, CH
4, and in making the
ν2+ν
4 band of this molecule emerge from the noise level on the spectrum
around 2850 cm−1. The occurrence of peaks with negative absorbance in
the spectra of Fig. 3 will be discussed in section 4.
The drawback of the multipass system is to spread the infrared
beam along the cell which now probes a very large section of the
expansion, thus integrating different cooling conditions. Also, the
contribution to the spectrum of the residual, hot gas around the expansion
is also decupled. A specific procedure will be presented in the next section
Page 9 of 38
URL: http://mc.manuscriptcentral.com/tandf/tmph
Molecular Physics
123456789101112131415161718192021222324252627282930313233343536373839404142434445464748495051525354555657585960
peer
-005
1305
6, v
ersi
on 1
- 1
Sep
2010

For Peer Review O
nly
9
to help removing this undesired contribution. In any case, the multipass
system boosts the absorption from jet-cooled molecules, thus canceling the
reduction factor due to the decrease in gas throughput due to the
turbomolecular pumping compared to the Roots blowers used in our
previous set-up previously referred to in section 2.
4. MS 4. MS 4. MS 4. MS probeprobeprobeprobe
MS experiments are performed using a quadrupole mass
spectrometer (Hiden RC PIC Analyser-HPR30) interfaced to the jet
chamber. As schematized in Fig. 4, it has a retractable sampling probe
with circular aperture diameter of about 50 µm, i.e. small enough to access
the local conditions of the probed portion of the flow. The probe moves
horizontally, perpendicular to both the jet and the light beam axes. The
probe extremity, although also represented as horizontal in Fig. 4, actually
faces the vertical jet axis. Molecules travel a long distance in the probe
tube before reaching the MS and memory of initial molecular speed is lost
before detection. The MS measurements, in counts/s, can separate mass
different by one unit, up to mass 510, in amu. The MS uses E2M1.5 rotary
and EXT75DX CF63 turbomolecular BOC EDWARDS pumps and
channeltron, type detection. The detector has ppm sensitivity. The design
of the MS probe is such that it can physically sample only half of the jet
cell, from side to center. In the case of an axisymmetric expansion, the
Page 10 of 38
URL: http://mc.manuscriptcentral.com/tandf/tmph
Molecular Physics
123456789101112131415161718192021222324252627282930313233343536373839404142434445464748495051525354555657585960
peer
-005
1305
6, v
ersi
on 1
- 1
Sep
2010

For Peer Review O
nly
10
rotation along the vertical axis of the measured evolution of the mass
density from side to center provides a complete horizontal map of the
expansion. One can perform additional measurements by moving the
nozzle exit up and down, resulting into a 3D picture of the expansion.
Similar procedure can be applied to the slit nozzle.
We achieved such a map in a pure N2O gas expansion, monitoring
the MS signal at mass 30 corresponding to NO+. It is illustrated in Fig. 5
which shows the variation, in function of the vertical nozzle-to probe
distance d, of the relative density in the expansion. The density below the
nozzle along the central jet axis is close to the expected 1/d2 or 1/d
dependence, for the axisymmetric and slit expansions, respectively. The
third, distance axis corresponds to the slit axis in the second part.
A current application of the present MS probe is a procedure to
‘‘clean’’ the infrared spectrum for hot gas contribution. Thanks to the
combined mass selection and very high detection sensitivity, one can
indeed selectively measure the studied gas density around the expansion,
thus the fraction contributing to the residual, hot gas absorption
superposing to the jet-cooled spectrum. A similar ‘‘hot spectrum’’ can be
later recorded in the same cell without running the large turbomolecular
pump, also measuring the gas density. Tuning its intensity to match the
relative MS density measurements performed when and without running
the jet, one can generate the equivalent ‘‘hot spectrum’’, which can be
Page 11 of 38
URL: http://mc.manuscriptcentral.com/tandf/tmph
Molecular Physics
123456789101112131415161718192021222324252627282930313233343536373839404142434445464748495051525354555657585960
peer
-005
1305
6, v
ersi
on 1
- 1
Sep
2010

For Peer Review O
nly
11
subtracted from the initial jet-cooled one. The procedure is illustrated in
Fig. 6. It shows that contribution to the spectrum from hot species is
indeed reasonably removed. It is less precise for higher J-lines since they
are those dominant in the hot gas contribution and minimal in the cold
gas absorption. This explains the pseudo negative absorbance in the
resulting spectrum, thus after subtraction, already pointed out in section
3. The procedure furthermore neglects potential non linear features
depending on the signal intensity. Despite these limitations it was found
to be efficient for single pass recordings, in particular. It has been applied
to all FTIR spectra presented in this report.
5. 5. 5. 5. TTTTDLDLDLDL probe probe probe probe
A diode laser emitting in the 1.5 µm range (DFB, ILX lightwave, 1
MHz linewidth) with InGaAs detector (type PT511, 300 µm, TO-4G flat
window) was coupled to the expansion. We initially used both single pass
and multipass optics as described in section 3. Fig. 7 shows multipass TDL
spectra of 12
C2H
2, in ν
1+ν
3, with Ar as carrier gas and using the circular
nozzle. The subtraction procedure was used to remove the hot gas
contribution. The general line profile is typical of the circular nozzle
expansion geometry, as already commented on in section 3. The center dip
in R(0) is likely to be indirectly due to the formation of clusters containing
acetylene, more efficient along the central jet axis and therefore
Page 12 of 38
URL: http://mc.manuscriptcentral.com/tandf/tmph
Molecular Physics
123456789101112131415161718192021222324252627282930313233343536373839404142434445464748495051525354555657585960
peer
-005
1305
6, v
ersi
on 1
- 1
Sep
2010

For Peer Review O
nly
12
decreasing the amount of absorbing acetylene with zero Doppler
contribution, hence at the line center (e.g. (33, 34)). The broad signature of
acetylene clusters formed in the expansion was actually observed using
the FT probe (35), similar to the one presented in (36). The decrease of the
dip intensity with increasing J-values is interesting. One possible
explanation is that the clusters are less efficiently bounded when kinetic
rotation energy increases as investigated in (37). Clusters would then less
and less contribute to the absorption profile, i.e. here to the dip at higher J
values, as observed.
CRDS (e.g. (38-41)) was implemented in the set-up, according to the
diagram in Fig. 8 and design presented in Fig. 9. It is directly inspired by
the developments from the Grenoble group, as detailed in (42, 43). In the
present set-up, the DFB diode beam is sent through an optical isolator
(Thorlabs 4015 5AFC-APC) and then split by a coupler (Thorlabs, 10
202A-99-APC). Some 1% of the light intensity is sent with the help of a
fiber collimation package (f=8 mm) into a home made Fabry-Pérot made of
two 50% reflection flat mirrors positioned on an Invar bar, providing a
FSR of about 955 MHz. The remaining 99% of the light are focused by a
fiber collimation package (f=4.5 mm) onto an acousto-optical modulator
(AOM) from AA Opto-Electronic (MGAS 80-A1). The order 1 output from
the AOM is injected into the TEM00
mode of a linear ring-down cavity
through a series of two lenses (f1=30 mm, f
2=50 mm) and two flat mirrors.
The cavity is made of two concave mirrors (Radius = 1000 mm; Reflectivity
Page 13 of 38
URL: http://mc.manuscriptcentral.com/tandf/tmph
Molecular Physics
123456789101112131415161718192021222324252627282930313233343536373839404142434445464748495051525354555657585960
peer
-005
1305
6, v
ersi
on 1
- 1
Sep
2010

For Peer Review O
nly
13
= 99.988%), separated by about 540 mm. The output coupler is mounted
on a piezo system (Piezomechanik HPST 1000/15-8/5). The light exiting
the cavity is focused through a lens (f=20 mm) on a InGaAs photodiode
(type PT511, 300 µm, TO-4G flat window). The signal from the photodiode
is converted by a trans-impedance amplifier (OPA627).
The ring-down detection works as follows. The piezo mount is
driven at a selected frequency (typically 500 Hz) and cavity mode
matching with the laser is achieved at twice the selected frequency. The
AOM is switched off as soon as the cavity mode intensity attains a
threshold value. The same event triggers the measurement procedure of
the ring-down decay. This procedure is controlled by appropriate home
made electronics. The ring-down decays are sampled by multifunction
data acquisition card PCI-6251, with 16bit 1.25 MHz A/D input. The
acquisition is PC driven by home made software written using LabVIEW.
Each ring-down exponential decay is fitted by a procedure based on the
nonlinear Levenberg-Marquardt method. Typically, some 50 ring-downs
per spectral point are fitted and their mean characteristic decay frequency
(•) is recorded. The absorption coefficient • is directly calculated using
(44):
( )cl
L0ννα −= (1)
Page 14 of 38
URL: http://mc.manuscriptcentral.com/tandf/tmph
Molecular Physics
123456789101112131415161718192021222324252627282930313233343536373839404142434445464748495051525354555657585960
peer
-005
1305
6, v
ersi
on 1
- 1
Sep
2010

For Peer Review O
nly
14
in which •0 is the ring-down decay frequency in an empty cavity (i.e.
without absorber), L and l are respectively the lengths of the cavity and
the absorption path in the medium and c is the speed of light.
The typical ring-down time is about 15 •s, corresponding to some
8333 passes in the 540 mm long CRDS cavity.
The diode laser frequency can be continuously tuned by sweeping
the temperature using a home made PID stabilizer. The temperature
tuning from about 60 °C to −5 °C corresponds approximately to the 6544.8
to 6579.3 cm−1 spectral range.
Fig. 10 compares spectra of ν1+ν
3,
12C
2H
2, recorded using a circular
nozzle with either FTIR or CRDS. In case of the FT recording, with
multipass optics, the acetylene pressure was kept as high as possible
within the pumping throughput capacity to increase the S/N, while it was
kept very low to optimize the cooling efficiency when using CRDS, thus
leaving room for significantly improved S/N in the latter case. The
expected sensitivity improvement is striking, calculated to be ~750 only
accounting for the ratio between the effective absorption pathlengths.
Residual weaker lines in the CRDS spectrum are mainly from hot bands.
Fig. 11 shows the R(1) line in ν1+ν
3,
12C
13CH
2, in natural abundance
(~2%). It was recorded under supersonic jet conditions with CRDS using
either a circular nozzle (top) or a slit nozzle (bottom), under similar gas
flow conditions (see legend of Fig. 11). The top part is actually a blow-up of
Page 15 of 38
URL: http://mc.manuscriptcentral.com/tandf/tmph
Molecular Physics
123456789101112131415161718192021222324252627282930313233343536373839404142434445464748495051525354555657585960
peer
-005
1305
6, v
ersi
on 1
- 1
Sep
2010

For Peer Review O
nly
15
the CRDS spectrum of Fig. 10. The absorption coefficient α is presented in
Fig. 11, calculated using Eq. (1). As expected, the line is narrower under
slit jet compared to circular nozzle conditions. The FWHM is limited, to
~0.02 cm−1, by geometrical effects when using the nozzle expansion, as
detailed in section 2, while it is instrumentally limited, to ~0.004 cm−1, by
the present electronic design when using the slit.
It is interesting to notice that the central dip in R(1), 12
C13
CH2, is
observed when using an axisymmetric expansion, as for the normal
isotopologue (see Fig. 7). The absence of dip when using the slit jet could
be due to a lack of resolution and/or to the planar nature of the section of
the slit expansion probed by the TDL, demonstrating no inhomogeneous
molecular behavior.
6. 6. 6. 6. ConclusionConclusionConclusionConclusion
In this paper we have presented a new instrumental set-up, named
FANTASIO, designed to investigate molecular species in a supersonic
expansion. It includes a high resolution FT spectrometer with single and
multipass optics, a CRD spectrometer and a quadrupole MS, all interfaced
to the same supersonic expansion produced using a large turbomolecular
pump backed up by Roots blowers. Various performances of FANTASIO
were highlighted, including the MS mapping of axisymmetric or planar
Page 16 of 38
URL: http://mc.manuscriptcentral.com/tandf/tmph
Molecular Physics
123456789101112131415161718192021222324252627282930313233343536373839404142434445464748495051525354555657585960
peer
-005
1305
6, v
ersi
on 1
- 1
Sep
2010

For Peer Review O
nly
16
expansions, the FTIR detection of jet-cooled ν2+ν
4,
12CH
4 (T
rot = 7K) using
multipass optics, the removal of hot gas contribution in the spectral output
of a single pass FT spectrum using MS facilities, and the detection of R(1)
ν1+ν
3 in
12C
13CH
2, in natural abundance, using CRDS.
Various limitations were also pointed out, indicating that
FANTASIO can be improved in several ways, in terms of resolution for the
CRDS detection, in particular. Instrumental advances will be carried on
along various lines of developments. In addition, implementation of pulsed
nozzles with the present set-up are foreseen with both CRDS and FTIR
probes, making profit in the latter case of time resolved FT sampling
procedures already developed at ULB (45).
Meanwhile, the investigation of various molecular systems will be
undertaken taking advantage of all FANTASIO features.
AcknowledgmentsAcknowledgmentsAcknowledgmentsAcknowledgments
This paper is dedicated to John Brown for his most significant
contribution to our field and for his kind and constant attention to the
experimental progresses of the ULB group.
Page 17 of 38
URL: http://mc.manuscriptcentral.com/tandf/tmph
Molecular Physics
123456789101112131415161718192021222324252627282930313233343536373839404142434445464748495051525354555657585960
peer
-005
1305
6, v
ersi
on 1
- 1
Sep
2010

For Peer Review O
nly
17
We are indebted to Prof. R. Georges (U. of Rennes-France) for
making possible the construction of the expansion chamber, to Dr. R.
Pétry (U. of Giessen-Germany) for providing information on the multipass
optics, to Dr. M. Termonia (DMS-Belgium) for helping us to select the
mass spectrometer and, at ULB, to Dr. J. Vander Auwera for supporting
the FTIR instrument in various occasions and Mr. R. Pétrisse for building
some of the equipment.
This work was sponsored by the Fonds National de la Recherche
Scientifique (FNRS, contracts FRFC and IISN), the « Action de Recherches
Concertées de la Communauté française de Belgique », and ULB research
funds. It is performed within the activities of the ‘‘LEA HiRes ‘‘.
ReferencesReferencesReferencesReferences
1. A.J. Ross, P. Crozet, R. Bacis, S. Churassy, B. Erba, S.H. Ashworth, N.M.
Lakin, M.R. Wickham, L.R. Beattie, and J.M. Brown, J. Mol. Spectrosc. 177,
134-142 (1996).
2. G. Winnewisser, T. Drascher, T. Giesen, I. Pak, F. Schmülling, and R.
Schieder, Spectrochimica Acta, Part A: Molecular and Biomolecular
Spectroscopy 55A, 2121-2142 (1999).
3. M.D. Brookes, C. Xia, J. Tang, J.A. Anstey, B.G. Fulsom, K.-X.A. Yong, J.M.
King, and A.R.W. McKellar, Spectrochim. Acta A 60, 3235-3242 (2004).
Page 18 of 38
URL: http://mc.manuscriptcentral.com/tandf/tmph
Molecular Physics
123456789101112131415161718192021222324252627282930313233343536373839404142434445464748495051525354555657585960
peer
-005
1305
6, v
ersi
on 1
- 1
Sep
2010

For Peer Review O
nly
18
4. M. Herman, R. Georges, M. Hepp, and D. Hurtmans, Int. Rev. Phys. Chem.
19, 277-325 (2000).
5. A. Bonnamy, R. Georges, E. Hugo, and R. Signorell, Physical Chemistry
Chemical Physics 7, 963-969 (2005).
6. P. Asselin, M. Goubet, Z. Latajka, P. Soulard, and M. Lewerenz, Phys. Chem.
Chem. Phys. 7, 592-599 (2005).
7. C. Emmeluth, V. Dyczmons, and M.A. Suhm, Journal of Physical Chemistry
A 110, 2906 - 2915 (2006).
8. J.K. Holland, M. Carleer, R. Pétrisse, and M. Herman, Chem. Phys. Lett. 194,
175-180 (1992).
9. F. Mélen, M. Carleer, and M. Herman, Chem. Phys. Lett. 199, 124-130 (1992).
10. F. Mélen, M. Herman, G.Y. Matti, and D.M. McNaughton, J. Mol. Spectrosc.
160, 601-603 (1993).
11. R. Georges, G. Durry, M. Bach, R. Pétrisse, R. Jost, and M. Herman, Chem.
Phys. Lett. 246, 601-606 (1995).
12. M. Hepp, F. Herregodts, and M. Herman, Chem. Phys. Lett. 294, 528-532
(1998).
13. R. Georges, M. Herman, J.C. Hillico, and D. Robert, J. Mol. Spectrosc. 187,
13-20 (1998).
14. R. Georges, J. Liévin, M. Herman, and A. Perrin, Chem. Phys. Lett. 256, 675-
678 (1996).
15. R. Georges, M. Bach, and M. Herman, Mol. Phys. 90, 381-387 (1997).
16. M. Bach, R. Georges, M. Hepp, and M. Herman, Chem. Phys. Lett. 294, 533-
537 (1998).
Page 19 of 38
URL: http://mc.manuscriptcentral.com/tandf/tmph
Molecular Physics
123456789101112131415161718192021222324252627282930313233343536373839404142434445464748495051525354555657585960
peer
-005
1305
6, v
ersi
on 1
- 1
Sep
2010

For Peer Review O
nly
19
17. M. Bach, R. Georges, M. Herman, and A. Perrin, Mol. Phys. 97, 265-277
(1999).
18. M. Bach, R. Georges, M. Herman, and A. Perrin, Mol. Phys. 97, 265-277
(1999).
19. D. Hurtmans, A. Rizopoulos, M. Herman, L.M.S. Hassan, and A. Perrin, Mol.
Phys. 99, 455-461 (2001).
20. M. Hepp, R. Georges, M. Herman, J.-M. Flaud, and W.J. Lafferty, J. Mol.
Struct. 517-518, 171-180 (2000).
21. I. Kleiner, R. Georges, M. Hepp, and M. Herman, J. Mol. Spectrosc. 192, 228-
230 (1999).
22. V. Boudon, M. Hepp, M. Herman, I. Pak, and G. Pierre, J. Mol. Spectrosc.
192, 359-367 (1998).
23. M. Hepp, R. Georges, and M. Herman, Chem. Phys. Lett. 275, 513-518
(1997).
24. M. Hepp and M. Herman, Mol. Phys. 94, 829-838 (1998).
25. M. Hepp and M. Herman, J. Mol. Spectrosc. 194, 87-94 (1999).
26. M. Hepp and M. Herman, J. Mol. Spectrosc. 197, 56-63 (1999).
27. Y. El Youssoufi, R. Georges, J. Liévin, and M. Herman, J. Mol. Spectrosc.
186, 239-245 (1997).
28. W.J. Lafferty, J.M. Flaud, and M. Herman, J. Mol. Struct. 780-781, 65-69
(2006).
29. L.H. Coudert, P. Carçabal, M. Chevalier, M. Broquier, M. Hepp, and M.
Herman, J. Mol. Spectrosc. 212, 203-207 (2002).
30. J.M. Flaud, W.J. Lafferty, and M. Herman, J. Chem. Phys. 114, 9361-9366
(2001).
Page 20 of 38
URL: http://mc.manuscriptcentral.com/tandf/tmph
Molecular Physics
123456789101112131415161718192021222324252627282930313233343536373839404142434445464748495051525354555657585960
peer
-005
1305
6, v
ersi
on 1
- 1
Sep
2010

For Peer Review O
nly
20
31. M. Herman, K. Didriche, A. Rizopoulos, and D. Hurtmans, Chem. Phys. Lett.
414, 282-286 (2005).
32. R. Petry, S. Klee, M. Lock, B.P. Winnewisser, and M. Winnewisser, J. Mol.
Spectrosc. 612, 369-381 (2002).
33. K. Veeken and J. Reuss, Appl. Phys. B34, 149-159 (1984).
34. M. Snels and G. Baldacchini, Applied Physics B: Photophysics and Laser
Chemistry B47, 277-82 (1988).
35. V. Vaidyanathan, Y.-C. Lee, Y.-P. Lee, P. Macko, K. Didriche, and M.
Herman, Chem. Phys. Lett. submitted for publication, (2006).
36. S. Hirabayashi and Y. Hirahara, Chem. Phys. Lett. 361, 265-270 (2002).
37. C. Boulet, P.-M. Flaud, and J.-M. Hartmann, J. Chem. Phys. 120, 11053-
11061 (2004).
38. A. O'Keefe and D.A.G. Deacon, Rev. Sci. Instrum. 59, 2544 (1988).
39. J.J. Scherer, J.B. Paul, A. O'keefe, and R.J. Saykally, Chem. Rev. 97, 25-51
(1997).
40. P. Dupre, Comptes Rendus de l'Academie des Sciences; Serie IV: Physique,
Astrophysique 2, 929-964 (2001).
41. S. Wu, P. Dupre, and T.A. Miller, Physical Chemistry Chemical Physics 8,
1682-1689 (2006).
42. D. Romanini, A.A. Kachanov, and F. Stoeckel, Chem. Phys. Lett. 270, 538-
545 (1997).
43. P. Macko, D. Romanini, S.N. Mikhailenko, O.V. Naumenko, S. Kassi, A.
Jenouvrier, V.G. Tyuterev, and A. Campargue, J. Mol. Spectrosc 90-108
(2004).
Page 21 of 38
URL: http://mc.manuscriptcentral.com/tandf/tmph
Molecular Physics
123456789101112131415161718192021222324252627282930313233343536373839404142434445464748495051525354555657585960
peer
-005
1305
6, v
ersi
on 1
- 1
Sep
2010

For Peer Review O
nly
21
44. K.W. Busch and M.A. Busch, Cavity-Ringdown Spectroscopy, ed. A.s. series.
Vol. 720. 1999, Washington: American Chemical Society. 34-48.
45. S. Kassi, C. Depiesse, M. Herman, and D. Hurtmans, Mol. Phys. 101, 1155-
1163 (2003).
Page 22 of 38
URL: http://mc.manuscriptcentral.com/tandf/tmph
Molecular Physics
123456789101112131415161718192021222324252627282930313233343536373839404142434445464748495051525354555657585960
peer
-005
1305
6, v
ersi
on 1
- 1
Sep
2010

For Peer Review O
nly
22
Figure captionsFigure captionsFigure captionsFigure captions
Figure 1 (a): Observed jet cooled R(0) line in ν3, pure N
2O, recorded
by FTIR (p∞ = 0.3 Pa , p0 = 118 hPa, Resolution = 0.0043 cm−1, 50 scans
accumulated); (b): Gaussian shaped Doppler line profile calculated for T=
22 K and convoluted for various instrumental effects including FTIR
resolution (0.0043 cm−1); (c): Straight Gaussian shaped Doppler line profile
calculated for T= 22 K. The amplitude of the two calculated profiles was
adapted to match the maximum absorbance of the experimental R(0) line.
Figure 2: FTIR optical paths in the expansion cell further detailed
in the text: (top) single pass and (bottom) multipass optics. The same
injection optics is used in both configurations but only shown in the top
part. It uses two plane mirrors (Mp) and a toroidal one (250/40 mm)
(MT(1)) to enter the jet chamber and a second toroidal mirror (M
T(2)) to
focus the light onto the detector.
Figure 3: Jet-cooled FTIR transmittance spectra of 12
CH4, with
single (top) and multipass (bottom) optics. Flow conditions: CH4, 0.36
l/min; Ar: 3.6 l/min. Reservoir (p0) and residual (p∞) pressures are, for (a):
860 hPa and 1.3 Pa, respectively; and for (b): 847 hPa and 0.4. Pa,
respectively. Resolution = 0.0043 cm−1, 50 scans accumulated, 500 µm
circular nozzle. Hot gas contribution was removed as later illustrated (see
Fig. 6).
Page 23 of 38
URL: http://mc.manuscriptcentral.com/tandf/tmph
Molecular Physics
123456789101112131415161718192021222324252627282930313233343536373839404142434445464748495051525354555657585960
peer
-005
1305
6, v
ersi
on 1
- 1
Sep
2010

For Peer Review O
nly
23
Figure 4: Section of the supersonic expansion cell interfaced to the
MS with retractable probe in two extreme positions, acting on a bellow.
The FTIR beam with single pass optics is also indicated. The expansion,
not indicated, is perpendicular to the section of the cell. The probe orifice
is actually oriented towards the incoming expansion.
Figure 5: Measured relative N2O density along the central vertical
jet axis by monitoring the MS signal at mass 30, corresponding to NO+, at
various distances d from the nozzle exit. The density presents a 1/d² (left)
or 1/d (right) dependence, for an axisymmetric (500 µm circular nozzle;
adapted from (31)), and slit (1 cm long and 30 µm wide slit) expansions,
respectively. Flow conditions: for (a) N2O 1 l/min, p
0 = 253 hPa and p∞ = 0.1
Pa; for (b): N2O, 1 l/min; 206 hPa and 0.1. Pa.
Figure 6: FTIR transmittance spectra of 12
CH4, recorded under (top)
jet-cooled and (middle) room temperature conditions. For the top spectrum
(Trot
= 8 K), flow conditions are: CH4, 0.36 l/min; Ar: 3.6 l/min, reservoir (p
0)
and residual (p∞) pressures are 841 hPa and 0.4 Pa, respectively. For the
middle spectrum (Room temperature), flow conditions with pure CH4 are
0.007 l/min, with a residual pressure of 1.6 Pa. Resolution = 0.0043 cm−1,
50 scans accumulated, 500 µm circular nozzle, multipass optics for both
spectra. The intensity of the room temperature data has been tuned to
match hot gas density MS measurements performed in both cases, as
Page 24 of 38
URL: http://mc.manuscriptcentral.com/tandf/tmph
Molecular Physics
123456789101112131415161718192021222324252627282930313233343536373839404142434445464748495051525354555657585960
peer
-005
1305
6, v
ersi
on 1
- 1
Sep
2010

For Peer Review O
nly
24
explained in the text. The bottom spectrum was generated by subtraction
of the middle spectrum from the top one.
Figure 7: First R(J) lines in ν1+ν
3,
12C
2H
2, recorded under supersonic
jet conditions with a circular nozzle and multipass optics, using TDL
absorption (flow conditions: C2H
2 1 l/min, p
0 and p∞ are 473 hPa and 0.9
Pa, respectively). A subtraction procedure was applied to remove the hot
gas contribution.
Figure 8: Diagram of CRDS detection implemented around the
supersonic expansion. Further information is provided in the text. Arrows
indicate the light beam and straight lines highlight electronic connections.
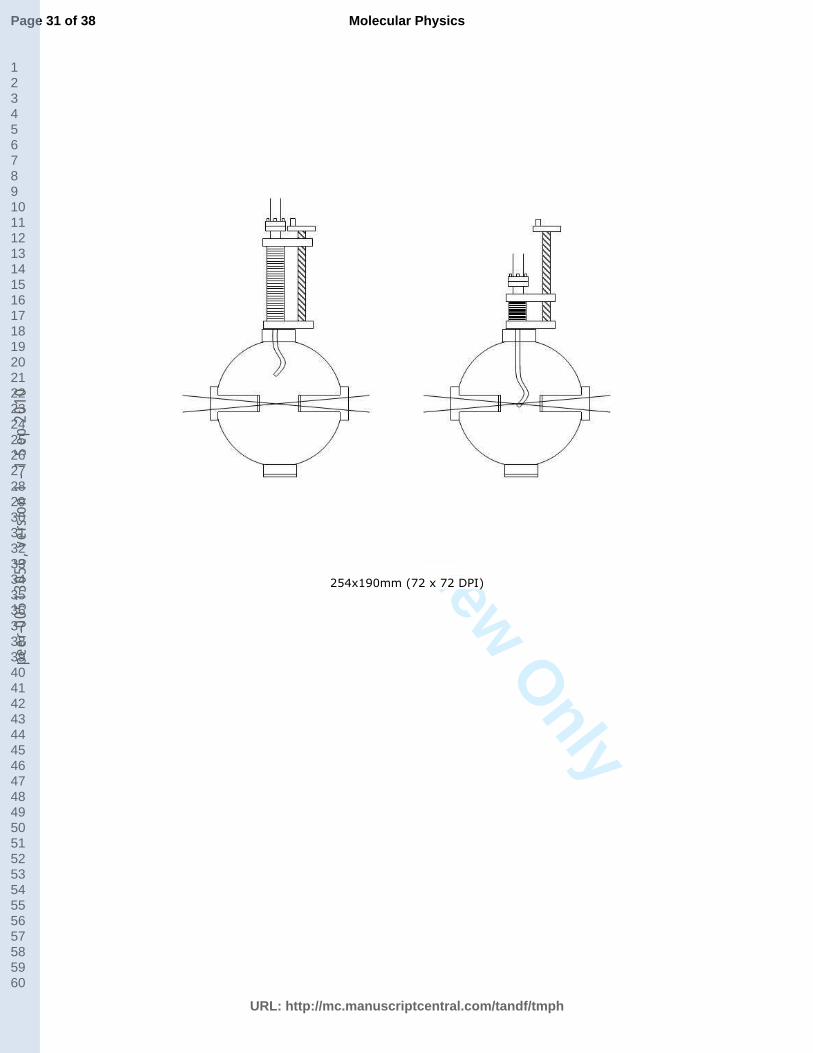
Figure 9: Schematic view of the supersonic expansion cell
interfaced to the CRDS. The set-up, with all elements detailed in the text,
includes a fibered tunable diode laser (TDL) with optical isolator (OpIs),
an acousto-optical modulator (OAM), a Fabry-Pérot (F-P), injection optics
made of two lenses (L1, L
2) and two planar mirrors (M
1, M
2), a ring-down
cavity made of two concave mirrors (M3, M
4) and controlled by a
piezoelectric translator (PZT), a focusing lens (L3) and light detectors (D
1,
D2). Interfaces to FTS and MS are indicated for completeness. The jet axis
is perpendicular to the section of the expansion cell.
Page 25 of 38
URL: http://mc.manuscriptcentral.com/tandf/tmph
Molecular Physics
123456789101112131415161718192021222324252627282930313233343536373839404142434445464748495051525354555657585960
peer
-005
1305
6, v
ersi
on 1
- 1
Sep
2010

For Peer Review O
nly
25
Figure 10: The first J lines in ν1+ν
3,
12C
2H
2, recorded under
supersonic jet conditions with a circular nozzle 500 µm in diameter using,
(top) FTIR with multipass optics, flow conditions are: C2H
2, 1.3 l/min; Ar:
1.4 l/min, p0 and p∞ are 853 hPa and 1.6 Pa, respectively; (bottom) CRDS,
flow conditions are: C2H
2, 0.25 l/min; Ar: 2 l/min, p∞ is 4.1 Pa. Rotational
assignments are indicated on the top spectrum.
Figure 11: The absorption coefficient of the R(1) line in ν1+ν
3,
12C
13CH
2, in natural abundance, recorded under supersonic jet conditions
with CRDS: (top) using a circular nozzle, flow conditions are: C2H
2, 0.25
l/min; Ar: 2 l/min, p∞ is 4.1 Pa; (bottom) using a slit nozzle, flow conditions
are: C2H
2, 0.25 l/min; Ar: 2 l/min, p
0 and p∞ are 633 hPa and 3.9. Pa,
respectively.
Page 26 of 38
URL: http://mc.manuscriptcentral.com/tandf/tmph
Molecular Physics
123456789101112131415161718192021222324252627282930313233343536373839404142434445464748495051525354555657585960
peer
-005
1305
6, v
ersi
on 1
- 1
Sep
2010

For Peer Review O
nly
1184x831mm (72 x 72 DPI)
Page 27 of 38
URL: http://mc.manuscriptcentral.com/tandf/tmph
Molecular Physics
123456789101112131415161718192021222324252627282930313233343536373839404142434445464748495051525354555657585960
peer
-005
1305
6, v
ersi
on 1
- 1
Sep
2010

For Peer Review O
nly
254x190mm (72 x 72 DPI)
Page 28 of 38
URL: http://mc.manuscriptcentral.com/tandf/tmph
Molecular Physics
123456789101112131415161718192021222324252627282930313233343536373839404142434445464748495051525354555657585960
peer
-005
1305
6, v
ersi
on 1
- 1
Sep
2010

For Peer Review O
nly
254x190mm (72 x 72 DPI)
Page 29 of 38
URL: http://mc.manuscriptcentral.com/tandf/tmph
Molecular Physics
123456789101112131415161718192021222324252627282930313233343536373839404142434445464748495051525354555657585960
peer
-005
1305
6, v
ersi
on 1
- 1
Sep
2010

For Peer Review O
nly
254x190mm (72 x 72 DPI)
Page 30 of 38
URL: http://mc.manuscriptcentral.com/tandf/tmph
Molecular Physics
123456789101112131415161718192021222324252627282930313233343536373839404142434445464748495051525354555657585960
peer
-005
1305
6, v
ersi
on 1
- 1
Sep
2010
For Peer Review O
nly
254x190mm (72 x 72 DPI)
Page 31 of 38
URL: http://mc.manuscriptcentral.com/tandf/tmph
Molecular Physics
123456789101112131415161718192021222324252627282930313233343536373839404142434445464748495051525354555657585960
peer
-005
1305
6, v
ersi
on 1
- 1
Sep
2010

For Peer Review O
nly
254x190mm (72 x 72 DPI)
Page 32 of 38
URL: http://mc.manuscriptcentral.com/tandf/tmph
Molecular Physics
123456789101112131415161718192021222324252627282930313233343536373839404142434445464748495051525354555657585960
peer
-005
1305
6, v
ersi
on 1
- 1
Sep
2010

For Peer Review O
nly
254x190mm (72 x 72 DPI)
Page 33 of 38
URL: http://mc.manuscriptcentral.com/tandf/tmph
Molecular Physics
123456789101112131415161718192021222324252627282930313233343536373839404142434445464748495051525354555657585960
peer
-005
1305
6, v
ersi
on 1
- 1
Sep
2010

For Peer Review Only
FT light beam
MSprobe
99%
1%
TDL
>
> >
>
>
>L1 L2
L3
D1
D2
M1
M2
M3
M4
PZT
AOM
F-P
OpIs
>
>
Page 34 of 38
URL: http://mc.manuscriptcentral.com/tandf/tmph
Molecular Physics
123456789101112131415161718192021222324252627282930313233343536373839404142434445464748495051525354555657585960
peer
-005
1305
6, v
ersi
on 1
- 1
Sep
2010

For Peer Review Only
FT light beam
MSprobe
99%
1%
TDL
>
> >
>
>
>L1 L2
L3
D1
D2
M1
M2
M3
M4
PZT
AOM
F-P
OpIs
>
>
Page 35 of 38
URL: http://mc.manuscriptcentral.com/tandf/tmph
Molecular Physics
123456789101112131415161718192021222324252627282930313233343536373839404142434445464748495051525354555657585960
peer
-005
1305
6, v
ersi
on 1
- 1
Sep
2010

For Peer Review O
nly
254x190mm (72 x 72 DPI)
Page 36 of 38
URL: http://mc.manuscriptcentral.com/tandf/tmph
Molecular Physics
123456789101112131415161718192021222324252627282930313233343536373839404142434445464748495051525354555657585960
peer
-005
1305
6, v
ersi
on 1
- 1
Sep
2010

For Peer Review O
nly
254x190mm (72 x 72 DPI)
Page 37 of 38
URL: http://mc.manuscriptcentral.com/tandf/tmph
Molecular Physics
123456789101112131415161718192021222324252627282930313233343536373839404142434445464748495051525354555657585960
peer
-005
1305
6, v
ersi
on 1
- 1
Sep
2010

For Peer Review O
nly
254x190mm (72 x 72 DPI)
Page 38 of 38
URL: http://mc.manuscriptcentral.com/tandf/tmph
Molecular Physics
123456789101112131415161718192021222324252627282930313233343536373839404142434445464748495051525354555657585960
peer
-005
1305
6, v
ersi
on 1
- 1
Sep
2010

For Peer Review Only
DFB Isolator CouplerEtalon
AOM
InjectorCavityDetect.
Piezo
Trigger
T/i reg.PC
Detect.
Figure 9, Herman et al.
Page 39 of 38
URL: http://mc.manuscriptcentral.com/tandf/tmph
Molecular Physics
123456789101112131415161718192021222324252627282930313233343536373839404142434445464748495051525354555657585960
peer
-005
1305
6, v
ersi
on 1
- 1
Sep
2010