MULTIMODE TRIMMING OF IMPERFECT THIN RINGS USING MASSES AT PRE-SELECTED LOCATIONS
Upload
leidenunivCategory
view
1download
0
Fano resonances in a multimodewaveguide coupled to a high-Qsilicon nitride ring resonator
Dapeng Ding,1,* Michiel J. A. de Dood,1 Jared F. Bauters,2Martijn J. R. Heck,2 John E. Bowers,2 and Dirk Bouwmeester1,2
1 Huygens-Kamerlingh Onnes Laboratory, Leiden University, Niels Bohrweg 2, 2333 CALeiden, The Netherlands
2 Department of Physics, University of California Santa Barbara, Santa Barbara, California93106, USA
Abstract: Silicon nitride (Si3N4) optical ring resonators provide ex-ceptional opportunities for low-loss integrated optics. Here we study thetransmission through a multimode waveguide coupled to a Si3N4 ringresonator. By coupling single-mode fibers to both input and output ports ofthe waveguide we selectively excite and probe combinations of modes in thewaveguide. Strong asymmetric Fano resonances are observed and the degreeof asymmetry can be tuned through the positions of the input and outputfibers. The Fano resonance results from the interference between modes ofthe waveguide and light that couples resonantly to the ring resonator. Wedevelop a theoretical model based on the coupled mode theory to describethe experimental results. The large extension of the optical modes out of theSi3N4 core makes this system promising for sensing applications.
© 2014 Optical Society of America
OCIS codes: (230.5750) Resonators; (130.0130) Integrated optics; (230.7370) Waveguides;(060.2310) Fiber optics.
References and links1. F. Xia, L. Sekaric, and Y. Vlasov, “Ultracompact optical buffers on a silicon chip,” Nat. Photonics 1, 65–71
(2007).2. B. E. Little, S. T. Chu, W. Pan, D. Ripin, T. Kaneko, Y. Kokubun, and E. Ippen, “Vertically coupled glass
microring resonator channel dropping filters,” IEEE Photon. Technol. Lett. 11, 215–217 (1999).3. V. R. Almeida, C. A. Barrios, R. R. Panepucci, and M. Lipson, “All-optical control of light on a silicon chip,”
Nature 431, 1081–1084 (2004).4. A. Ksendzov and Y. Lin, “Integrated optics ring-resonator sensors for protein detection,” Opt. Lett. 30, 3344–
3346 (2005).5. S. Fan, “Sharp asymmetric line shapes in side-coupled waveguide-cavity systems,” Appl. Phys. Lett. 80, 908–910
(2002).6. C.-Y. Chao and L. J. Guo, “Biochemical sensors based on polymer microrings with sharp asymmetrical reso-
nance,” Appl. Phys. Lett. 83, 1527–1529 (2003).7. A. Chiba, H. Fujiwara, J. Hotta, S. Takeuchi, and K. Sasaki, “Fano resonance in a multimode tapered fiber
coupled with a microspherical cavity,” Appl. Phys. Lett. 86, 261106 (2005).8. A. C. Ruege, and R. M. Reano, “Sharp Fano resonances from a two-mode waveguide coupled to a single-mode
ring resonator,” J. Lightwave Technol. 28, 2964–2968 (2010).9. A. C. Ruege and R. M. Reano, “Multimode waveguide-cavity sensor based on fringe visibility detection,” Opt.
Express 17, 4295–4305 (2009).10. B.-B. Li, Y.-F. Xiao, C.-L. Zou, Y.-C. Liu, X.-F. Jiang, Y.-L. Chen, Y. Li, and Q. Gong, “Experimental observation
of Fano resonance in a single whispering-gallery microresonator,” Appl. Phys. Lett. 98, 021116 (2011).
#202951 - $15.00 USD Received 16 Dec 2013; revised 5 Mar 2014; accepted 7 Mar 2014; published 17 Mar 2014(C) 2014 OSA 24 March 2014 | Vol. 22, No. 6 | DOI:10.1364/OE.22.006778 | OPTICS EXPRESS 6778

11. Y.-F. Xiao, L. He, J. Zhu, and L. Yang, “Electromagnetically induced transparency-like effect in a singlepolydimethylsiloxane-coated silica microtoroid,” Appl. Phys. Lett. 94, 231115 (2009).
12. B.-B. Li, Y.-F. Xiao, C.-L. Zou, X.-F. Jiang, Y.-C. Liu, F.-W. Sun, Y. Li, and Q. Gong, “Experimental controllingof Fano resonance in indirectly coupled whispering-gallery microresonators,” Appl. Phys. Lett. 100, 021108(2012).
13. P. Rabiei and W. H. Steier, “Polymer microring resonators,” in Optical Microcavities, K. Vahala, eds. (WorldScientific, 2005), pp. 321–324.
14. S. Fan, W. Suh, and J. D. Joannopoulos, “Temporal coupled-mode theory for the Fano resonance in opticalresonators,” J. Opt. Soc. Am. A 20, 569–572 (2003).
15. J. F. Bauters, M. J. R. Heck, D. John, D. Dai, M.-C. Tien, J. S. Barton, A. Leinse, R. G. Heideman, D. J.Blumenthal, and J. E. Bowers, “Ultra-low-loss high-aspect-ratio Si3N4 waveguides,” Opt. Express 19, 3163–3174 (2011).
16. M.-C. Tien, J. F. Bauters, M. J. R. Heck, D. T. Spencer, D. J. Blumenthal, and J. E. Bowers, “Ultra-high qualityfactor planar Si3N4 ring resonators on Si substrates,” Opt. Express 19, 13551–13556 (2011).
17. R. M. Knox and P. P. Toulios, “Integrated circuits for the millimeter through optical frequency range,” in Pro-ceedings of the Symposium on Submillimeter Waves, (Polytechnic Press, 1970), pp. 497–516.
18. J. F. Bauters, M. J. R. Heck, D. D. John, J. S. Barton, C. M. Bruinink, A. Leinse, R. G. Heideman, D. J. Blu-menthal, and J. E. Bowers, “Planar waveguides with less than 0.1 dB/m propagation loss fabricated with waferbonding,” Opt. Express 19, 24090–24101 (2011).
1. Introduction
Integrated optical circuits consist of waveguides and beamsplitters that can transport and dis-tribute optical signals on a chip. The addition of resonant structures, such as ring resonators,adds important functionality to integrated circuits. On resonance, light can be coupled froma waveguide into a ring resonator and vice versa via evanescent fields. The interference be-tween light in a single-mode waveguide and a ring resonator generates a symmetric resonancedip (that can be approximated as a Lorentzian function in the vicinity of the minimum) in thetransmission spectrum of the waveguide. The resonant energy transfer between the waveguideand ring resonator leads to numerous applications such as light storage [1], add/drop filters [2],integrated switches [3] and sensors [4].
The symmetric transmission spectrum is significantly modified by introducing an additionaloptical channel into the system. The interference between the direct and indirect transport chan-nels gives rise to an asymmetric, Fano-like transmission lineshape. So far the realization of anadditional transport channel leading to the Fano resonance includes, but is not limited to, theuse of two partial reflecting elements in the waveguide [5, 6], multimode waveguides [7–9],multimode ring resonators [10,11] and multiple ring resonators [12]. When multimode waveg-uides are used, the Fano resonances appear and the degree of asymmetry is determined by thecoupling of the different modes of the waveguide and ring resonator. It has been shown that thedegree of asymmetry of the Fano resonances can be tuned by varying the coupling region onthe multimode waveguide [7] or by varying the relative phase of the light injected into differentmodes in the waveguide [8]. Sensing applications have been demonstrated in a system wherelight is coupled into a ring resonator via a multimode waveguide and coupled out via multiplesingle-mode waveguides [9].
In this article we explore the tunability of the Fano resonances in a multimode waveguidecoupled to a multimode ring resonator. The waveguide and the ring resonator consist of a high-aspect-ratio silicon nitride (Si3N4) core embedded in silicon dioxide (SiO2) cladding. The modeselectivity is achieved by positioning and butt-coupling single-mode fibers to the multimodewaveguide at both ends. We observe the Fano resonance with various degree of asymmetrywhen the two fibers are independently scanned along the core width direction. Advantages andlimitations of this system and the Fano resonance scheme for sensing applications are discussed.
#202951 - $15.00 USD Received 16 Dec 2013; revised 5 Mar 2014; accepted 7 Mar 2014; published 17 Mar 2014(C) 2014 OSA 24 March 2014 | Vol. 22, No. 6 | DOI:10.1364/OE.22.006778 | OPTICS EXPRESS 6779
E1 E2
E3 E4
E5L1
Input Output
x
zy
Pin Pout
SM SM
R
L2
CR
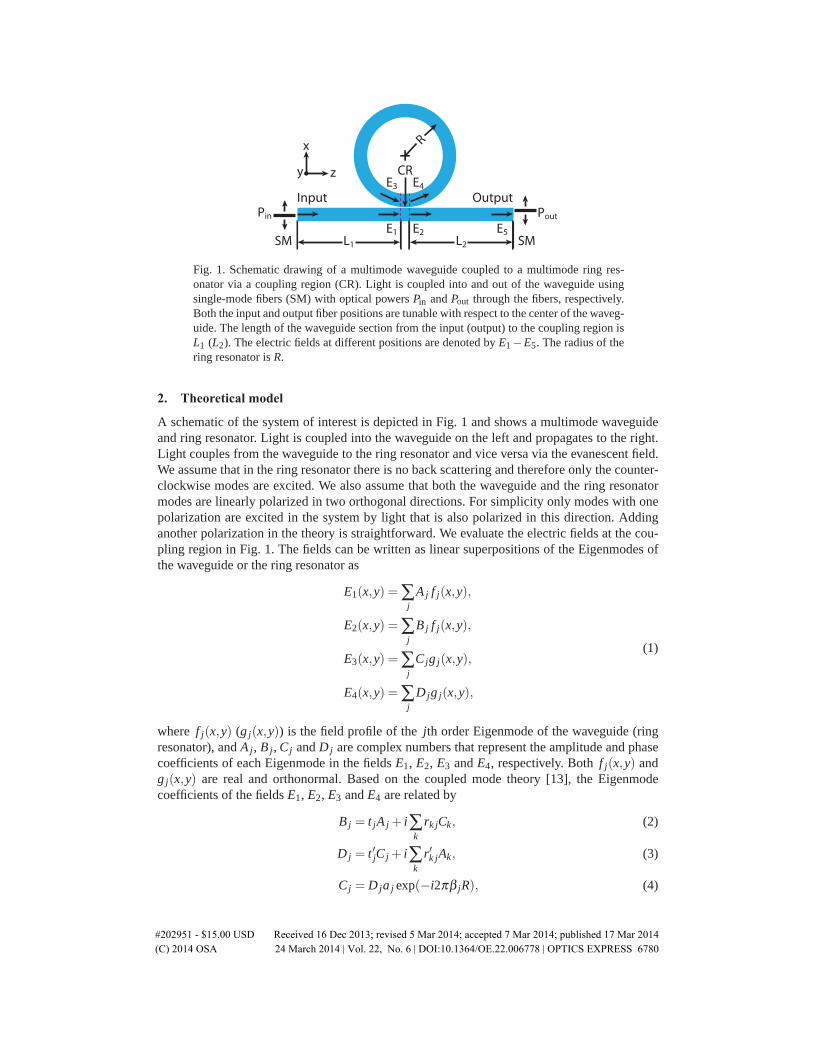
Fig. 1. Schematic drawing of a multimode waveguide coupled to a multimode ring res-onator via a coupling region (CR). Light is coupled into and out of the waveguide usingsingle-mode fibers (SM) with optical powers Pin and Pout through the fibers, respectively.Both the input and output fiber positions are tunable with respect to the center of the waveg-uide. The length of the waveguide section from the input (output) to the coupling region isL1 (L2). The electric fields at different positions are denoted by E1 −E5. The radius of thering resonator is R.
2. Theoretical model
A schematic of the system of interest is depicted in Fig. 1 and shows a multimode waveguideand ring resonator. Light is coupled into the waveguide on the left and propagates to the right.Light couples from the waveguide to the ring resonator and vice versa via the evanescent field.We assume that in the ring resonator there is no back scattering and therefore only the counter-clockwise modes are excited. We also assume that both the waveguide and the ring resonatormodes are linearly polarized in two orthogonal directions. For simplicity only modes with onepolarization are excited in the system by light that is also polarized in this direction. Addinganother polarization in the theory is straightforward. We evaluate the electric fields at the cou-pling region in Fig. 1. The fields can be written as linear superpositions of the Eigenmodes ofthe waveguide or the ring resonator as
E1(x,y) = ∑j
A j f j(x,y),
E2(x,y) = ∑j
B j f j(x,y),
E3(x,y) = ∑j
Cjg j(x,y),
E4(x,y) = ∑j
D jg j(x,y),
(1)
where f j(x,y) (g j(x,y)) is the field profile of the jth order Eigenmode of the waveguide (ringresonator), and Aj, Bj, Cj and Dj are complex numbers that represent the amplitude and phasecoefficients of each Eigenmode in the fields E1, E2, E3 and E4, respectively. Both f j(x,y) andg j(x,y) are real and orthonormal. Based on the coupled mode theory [13], the Eigenmodecoefficients of the fields E1, E2, E3 and E4 are related by
Bj = t jA j + i∑k
rk jCk, (2)
Dj = t ′jCj + i∑k
r′k jAk, (3)
Cj = Dja j exp(−i2πβ jR), (4)
#202951 - $15.00 USD Received 16 Dec 2013; revised 5 Mar 2014; accepted 7 Mar 2014; published 17 Mar 2014(C) 2014 OSA 24 March 2014 | Vol. 22, No. 6 | DOI:10.1364/OE.22.006778 | OPTICS EXPRESS 6780
where t j (t ′j) is the complex transmission coefficient of the jth order Eigenmode of the waveg-uide (ring resonator), rk j (r′k j) is the complex coupling coefficient from the kth order Eigenmodeof the ring resonator (waveguide) to the jth order Eigenmode of the waveguide (ring resonator),a j and β j are the one-round-trip transmission and propagation constants of the jth order Eigen-mode of the ring resonator, and R is the radius of the ring resonator. The propagation constantβ j is simply
β j =2πnp j(ν)ν
c, (5)
where ν is the frequency of light, np j(ν) is the effective phase index of the jth order Eigenmodeof the ring resonator at frequency ν , and c is the speed of light in vacuum.
By combining Eq. (2), Eq. (3) and Eq. (4), and solving equations for Aj and Bj, one obtainsan input-output relation of the form
Bj = t jA j −∑k
akrk j ∑l
r′lkAl
exp(i2πβkR)−akt ′k. (6)
In the experiment, one can selectively pump and probe variable superpositions of the Eigen-modes of the waveguide by coupling light into and out of the multimode waveguide with single-mode fibers. At the input port of the waveguide, a single-mode fiber with a Gaussian modeprofile h(x,y) couples to each of the Eigenmodes of the waveguide. The coupling efficiency tothe jth order Eigenmode of the waveguide η j is
η j(x′,y′) =
∫∫f j(x,y)h(x− x′,y− y′)dxdy, (7)
where (x′,y′) are the coordinates of the center of the input coupling fiber. These Eigenmodecomponents of the waveguide propagate from the input port to the coupling region and gaindifferent phase factors, therefore
Aj(x′,y′) = η j(x
′,y′)√
Pin exp(−iβ ′jL1), (8)
where Pin is the power through the input fiber, β ′j is the propagation constant of the jth order
Eigenmode of the waveguide, L1 is the distance from the input port to the coupling region ofthe waveguide, and the waveguide is assumed to be lossless. The total field at the output port ofthe waveguide is
E5(x,y,x′,y′) = ∑
jB j(x
′,y′)exp(−iβ ′jL2) f j(x,y), (9)
where L2 is the distance from the coupling region to the output port of the waveguide. Atthe output port of the waveguide, a single-mode fiber with the same field profile as the inputcoupling fiber couples to the output field. The power through the output fiber Pout is then
Pout(x′,y′,x′′,y′′) =
∣∣∣∣∫∫
E5(x,y,x′,y′)h(x− x′′,y− y′′)dxdy
∣∣∣∣2
≡∣∣∣∣∣∑j
S j(x′′,y′′)Bj
∣∣∣∣∣2
, (10)
where (x′′,y′′) are the coordinates of the center of the output coupling fiber and Sj(x′′,y′′) ≡η j(x′′,y′′)exp(−iβ ′
jL2). Eventually, the power transmission through the input-output fibers isgiven by
T (x′,y′,x′′,y′′) =Pout
Pin=
∣∣∣∣∣∑jS jB j
∣∣∣∣∣2
1Pin
. (11)
#202951 - $15.00 USD Received 16 Dec 2013; revised 5 Mar 2014; accepted 7 Mar 2014; published 17 Mar 2014(C) 2014 OSA 24 March 2014 | Vol. 22, No. 6 | DOI:10.1364/OE.22.006778 | OPTICS EXPRESS 6781

By using the explicit form of Bj in Eq. (6) and βk in Eq. (5), the power transmission T becomes
T (Δν ,x′,y′,x′′,y′′) =
∣∣∣∣∣∣∣∑jS jt jA j −∑
k
ak ∑j,l
S jrk jr′lkAl
exp[iek(ν0 +Δν)]−akt ′k
∣∣∣∣∣∣∣
2
1Pin
, (12)
where ek = 4π2npk(ν)R/c and Δν is frequency detuning with respect to a reference frequencyν0. Note that Aj ∝
√Pin as given in Eq. (8) and thus Pin cancels out in Eq. (12).
For the jth order Eigenmode of the ring resonator, resonances occur when
e j(ν0 +Δν) = 2mπ, (13)
with m being an integer. The resonant frequency detunings of the jth order Eigenmode of thering resonator are
Δν0 j =2mπe j
−ν0 =mc
2πnp j(ν)R−ν0. (14)
The free spectral range (FSR) of the jth order Eigenmode of the ring resonator is definedas the frequency difference between two adjacent resonant frequencies. If one assumes lineardispersion relations of the materials within one FSR (typically tens of GHz for a ring resonator),the FSR can be expressed as
FSR j =c
2πng j(ν)R, (15)
where ng j(ν) = np j(ν)+ ν(dnp j(ν)/dν) is the effective group index of the jth order Eigen-mode of the ring resonator at frequency ν . In the experiment, we will use Eq. (15) to extracteffective group indices from measured FSRs.
Equation (12) can be simplified under the assumption that the resonances of the modes arenarrow enough to be well separated in frequency domain. In the vicinity of the resonant fre-quency detuning of the jth order Eigenmode Δν0 j, the terms for the other Eigenmodes in thesummation in Eq. (12) are slowly varying functions with respect to Δν and might be approx-imated as complex functions qk (k �= j). qk is not a function of Δν , but still a function of (x′,y′)and (x′′,y′′). Under this simplification, Eq. (12) reads
T (Δν ,x′,y′,x′′,y′′)�∣∣∣∣∣q−
b j
exp[ie j(ν0 +Δν)]−a jt ′j
∣∣∣∣∣2
, (16)
where q= (∑jS jt jA j − ∑
k �= jqk)/
√Pin and b j = a j ∑
k,lSkr jkr′l jAl/
√Pin are complex and dimension-
less functions of (x′,y′) and (x′′,y′′). The exponential term in Eq. (16) can be further simplifiedby the Taylor expansion with respect to Δν0 j and keeping (Δν −Δν0 j) up to the second power:
T (Δν ,x′,y′,x′′,y′′)� ζ j +α j
[φ 2
j (Δν −Δν0 j)2 +2φ jθ jγ j(Δν −Δν0 j)+θ 2
j γ2j
(Δν −Δν0 j)2 + γ2j
], (17)
where ζ j, α j, φ j and θ j are real and dimensionless functions of (x′,y′) and (x′′,y′′) that charac-terize the profile of the transmission spectra (see below). Their explicit expressions in terms ofthe coefficients in Eq. (16) are tedious and not given here. The expression of γ j is simple:
γ j =1−a jt ′je j
√a jt ′j
. (18)
#202951 - $15.00 USD Received 16 Dec 2013; revised 5 Mar 2014; accepted 7 Mar 2014; published 17 Mar 2014(C) 2014 OSA 24 March 2014 | Vol. 22, No. 6 | DOI:10.1364/OE.22.006778 | OPTICS EXPRESS 6782
Equation (17) will be used to analyze our experimental data. We note that Eq. (17) and Eq. (18)are also valid for the coupling of a multimode waveguide to a single-mode ring resonator.
α j, φ j and θ j in Eq. (17) are under-determined and extra constraint conditions can be added.In analogy to [14], we impose
φ j =√
1−θ 2j and α j,ζ j > 0, (19)
which requires 0< φ j < 1 and −1< θ j < 1. The term in the square bracket of Eq. (17) describesa lineshape with amplitude in between zero and one. For θ j = 0 and φ j = 1, the lineshape is anormal Lorentzian dip, while for θ j =±1 and φ j = 0, the lineshape turns into a Lorentzian peak.In between it gives an asymmetric lineshape, with maximum asymmetry for θ2
j = φ 2j = 1/2.
Opposite signs of θ j result in mirror-symmetric lineshapes. α j and ζ j rescale the lineshape, butthe degree of asymmetry remains the same. The coefficient θ j will be referred to as the Fanoparameter, since its absolute value measures the degree of asymmetry of the lineshape and itssign determines one of the two mirror-symmetric lineshapes.
For a specific geometry and materials of the waveguide and the ring resonator and fixedoperating wavelength, the parameter γ j in Eq. (18) is a constant, while ζ j, α j, φ j and θ j varywith the input and output fiber positions. By tuning the input and output fiber positions withrespect to the waveguide, it is possible to achieve θ j = 0 and φ j = 1 where the transmissionlineshape of the jth order Eigenmode of the ring resonator becomes a Lorentzian function. Thequality factor of the Lorentzian lineshape is given by
Qj =ν0 +Δν0 j
2γ j=
e j
√a jt ′j(ν0 +Δν0 j)
2(1−a jt ′j), (20)
which is a function of internal and coupling losses and is independent of the input and outputfiber positions. Consequently, when the input and output fiber positions are scanned with respectto the waveguide, the transmission lineshape varies, but the quality factor remains the same.Therefore Eq. (20) is also valid for the Fano resonance. We emphasize that the above assertionis based on the assumption that the resonances of the ring resonator are narrow enough to bewell separated in frequency domain and is always valid for a single-mode ring resonator.
For a Lorentzian lineshape (θ j = 0 or 1 in Eq. (17)), the slope responsivity of the transmis-sion spectrum defined as |dT/dΔν |max is (3
√3/8)α j/γ j (≈ 0.65α j/γ j), when Δν −Δν0 j =
±(√
3/3)γ j. In contrast, a Fano lineshape with the maximum asymmetry (θ j = ±√2/2 in
Eq. (17)) has the slope responsivity of the transmission spectrum α j/γ j, when Δν = Δν0 j. Thusfor the same α j and γ j, the Fano resonance with the maximum asymmetry improves the sloperesponsivity by a factor of 1.54 compared to the Lorentzian resonance.
At off-resonant frequencies, strong fields can not build up in the ring resonator and thereforethe transmission in the waveguide is effectively decoupled from the ring resonator, i.e. Aj =Bj. Combining Eq. (7), Eq. (8) and Eq. (11), and using Aj = Bj, we obtain the off-resonancetransmission for a given input and output positions of the fibers
Toff(x′,y′,x′′,y′′) =
∣∣∣∣∣∑j
∫∫f j(x,y)h(x− x′,y− y′)dxdy
∫∫f j(x,y)h(x− x′′,y− y′′)dxdy
exp[iβ ′j(L1 +L2)]
∣∣∣∣∣2
. (21)
Since h(x,y) is an even function and f j(x,y) is either an even or an odd function, it can beproved that Toff is invariant upon the transformation x′ ↔ x′′ and x′ ↔ −x′′. Hence x′ = x′′ andx′ =−x′′ are two symmetry axes of Toff in the coordinate system of (x′′,x′). This property willbe used in Section 5 to determine the central position of the waveguide.
#202951 - $15.00 USD Received 16 Dec 2013; revised 5 Mar 2014; accepted 7 Mar 2014; published 17 Mar 2014(C) 2014 OSA 24 March 2014 | Vol. 22, No. 6 | DOI:10.1364/OE.22.006778 | OPTICS EXPRESS 6783

3. Sample description
The ring resonator is fabricated by a combination of chemical vapor deposition (CVD), lithogra-phy and etching. Details of the sample design, fabrication and basic characterization at 1.5 μmwavelength are reported elsewhere [15, 16]. We give a brief summary of the properties thatare important to this work. Both the ring resonator and the waveguide share the same cross-sectional structure and it is shown in Fig. 2(a), which is a high-aspect-ratio Si3N4 core em-bedded in SiO2 cladding material. For the particular sample measured in the present work, theSi3N4 core has a width of 5.25 μm and a thickness of 50 nm. The radius of the ring resonatoris 6 mm and the gap between the waveguide and the ring resonator is 3 μm. The thicknesses ofthe top and bottom cladding are both 15 μm.
Since the radius of the ring resonator is much larger than the width of the Si3N4 core, weassume that the modes of the ring resonator can be approximated by the modes of the straightwaveguide, i.e. f j(x,y) � g j(x,y). If one assumes that the refractive index of the thin Si3N4
core is equal to that of bulk amorphous Si3N4 (n = 1.99) and that the refractive index of theSiO2 cladding is 1.45 at 978 nm wavelength, the waveguide modes can be calculated by thefinite element method (FEM) using COMSOL (COMSOL Inc.). The FEM simulation showstwo transverse magnetic (TM, polarized along the core thickness, or y-direction) modes (TM0
and TM1) with effective phase indices of 1.4576 and 1.4530 and three transverse electric (TE,polarized along the core width, or x-direction) modes (TE0, TE1 and TE2) with effective phaseindices of 1.4768, 1.4703, 1.4600, respectively. We note that the effective phase indices ofthe fundamental TM and TE modes calculated by the effective index method [17] are 1.4578and 1.4770, respectively, in good agreement with the FEM simulations. The possibility to usethe effective index method greatly facilitates design and optimization of such waveguides witha high aspect-ratio. The calculated mode profiles are shown in Fig. 2. Due to much smallerdimension of the Si3N4 core in the y-direction compared to the wavelength, the waveguideshows single-mode properties in the y-direction and multimode properties in the x-direction.
(c)
x (µm)−4 −3 −2 −1 0 1 2 3 4
−2
0
2
(b)
y (µ
m)
−2
0
2
−1
0
1(a)
−1
−0.8
−0.6
−0.4
−0.2
0
0.2
0.4
0.6
0.8
1Si3N4
SiO2
(f)
x (µm)−4 −3 −2 −1 0 1 2 3 4
−1
0
1
(e)
−1
0
1
(d)
−1
0
1
−1
−0.8
−0.6
−0.4
−0.2
0
0.2
0.4
0.6
0.8
1
Fig. 2. Cross-sectional drawing (a) of a Si3N4 waveguide with a width of 5.25 μm anda thickness of 50 nm in SiO2 cladding and calculated TM ((b) TM0 and (c) TM1, y-component electric field or Ey) and TE ((d) TE0, (e) TE1 and (f) TE2, x-component electricfield or Ex) mode profiles of this waveguide at 978 nm wavelength. The refractive indicesof the Si3N4 core and SiO2 cladding are assumed to be 1.9885 and 1.4507, respectively.The simulation is implemented by the finite element method (FEM) using COMSOL.
Using dispersion relations of fused silica and amorphous Si3N4 the effective group indicesare also calculated by the FEM. The results of the two TM modes are 1.4895 and 1.4866 and
#202951 - $15.00 USD Received 16 Dec 2013; revised 5 Mar 2014; accepted 7 Mar 2014; published 17 Mar 2014(C) 2014 OSA 24 March 2014 | Vol. 22, No. 6 | DOI:10.1364/OE.22.006778 | OPTICS EXPRESS 6784

those of the three TE modes are 1.5478, 1.5502, 1.5504, respectively. Nevertheless, we donot expect a detailed agreement of the calculated effective group indices with the experimentbecause the actual effective group indices depend on the stress-optic effect and changes inSi3N4 refractive index and thickness due to the annealing process [18].
4. Experimental method
FBS1
FPCRing
DAQ
PD1
PD2FPI
PD3
FBS2
ECDL
HV-Amp
Motor1 Motor2x
zy
Fig. 3. Schematic of the experimental setup for measuring the transmission of the multi-mode waveguide and ring resonator system. Abbreviations: ECDL (External Cavity DiodeLaser), FBS (Fiber Beamsplitter), FPI (Fabry-Perot Interferometer), PD (Photodetector),DAQ (Data Acquisition) and HV-Amp (High Voltage Amplifier). Black lines denote singlemode optical fibers and purple lines denote electrical wirings.
A schematic of the setup used to measure the transmission properties of the multimodewaveguide coupled to a ring resonator is shown in Fig. 3. Two cleaved bare single-mode fibers(980-HP, Nufern Inc.) with a mode field diameter of 4.2 μm at 980 nm wavelength are used tobutt-couple light in and out of the waveguide structure. To this end, both fibers are mounted onxyz-translation stages. The two translation stages are motorized in the x-direction to scan alongthe core of the waveguide.
Light from a tunable, narrow-linewidth laser (DL pro, TOPTICA Photonics AG) is distrib-uted over three single-mode fibers using two cascaded fiber beamsplitters (FBS1 and FBS2).One of the outputs is used as a power monitor (by PD2), while another part of the light issent to a Fabry-Perot interferometer (FPI) and a photodetector (PD3) to monitor the frequencydetuning of the laser during the scan. The remaining light is sent through a fiber polarizationcontroller (FPC) and is used to measure the transmitted power of the waveguide coupled to thering resonator by PD1. The normalized transmission is then obtained by dividing the signal ofPD1 by the signal of PD2. The FPC is used to maximize transmission contrast of a specific res-onance. All fiber connections, except those used for butt-coupling to the waveguide, are eitherangle-cleaved or filled with index-matching liquid to minimize back reflection.
The laser operates at ∼978 nm wavelength and is tuned over approximately 20 GHz aroundthis central wavelength. The detuning is monitored by a computer controlled data acquisition(DAQ) system that generates a voltage VS to control the frequency detuning and records thesignals on PD1, PD2 and PD3 as functions of VS. The laser frequency detuning Δν as a functionof the voltage VS can be well approximated by a quadratic relation. The coefficients of thisquadratic function can be found by fitting to the scan voltages corresponding to maximumtransmission of the FPI, using known FSR of 4.00 GHz of the FPI. From this transmissionspectra as a function of the frequency detuning of the laser are obtained.
5. Results and discussion
A typical transmission spectrum at certain input and output fiber positions is shown in Fig. 4.The data consists of repetitive sets of resonances labeled by numbers 1, 2 and 3. The measured
#202951 - $15.00 USD Received 16 Dec 2013; revised 5 Mar 2014; accepted 7 Mar 2014; published 17 Mar 2014(C) 2014 OSA 24 March 2014 | Vol. 22, No. 6 | DOI:10.1364/OE.22.006778 | OPTICS EXPRESS 6785
−2 0 2 4 6 8 10 12 14 16 180.1
0.15
0.2
0.25
0.3
0.35
Frequency Detuning (GHz)
Tra
nsm
issi
on
1
2
3
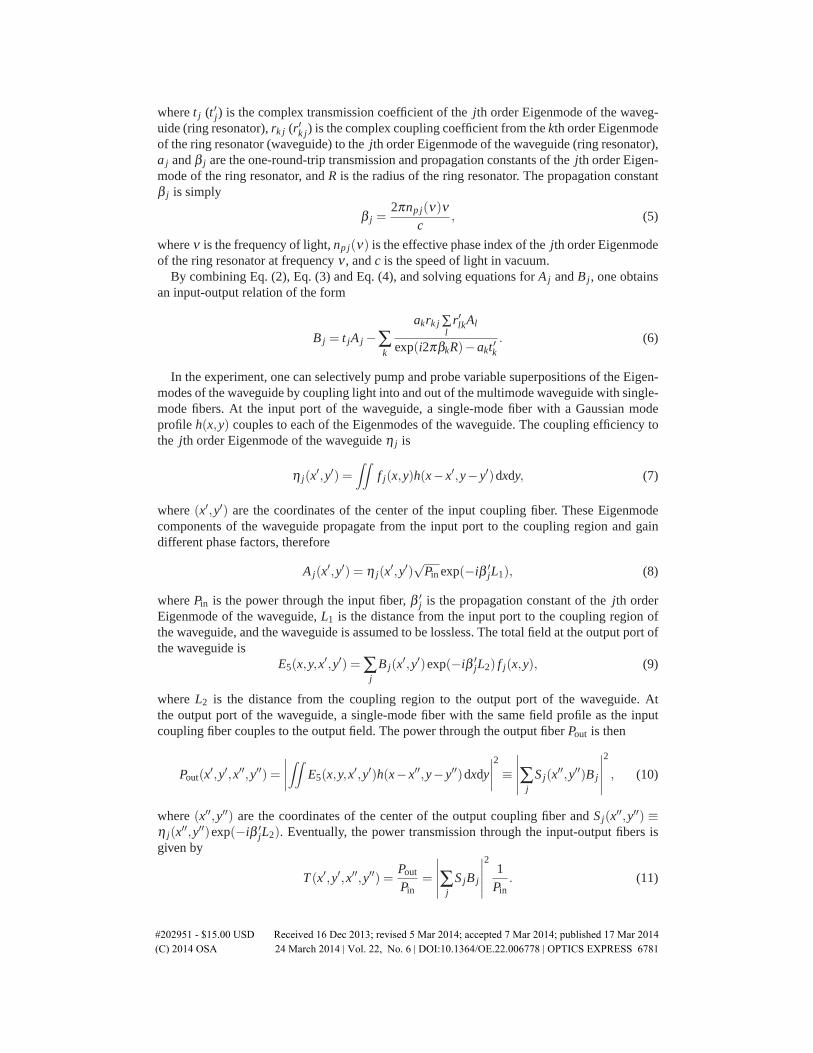
Fig. 4. Measured transmission as a function of laser frequency detuning over a 20 GHzrange. The free spectral range (FSR) of the ring resonator is approximately 5.3 GHz andthe measurement range includes four sets of three resonances spaced by one FSR.
FSRs of resonance 1, 2 and 3 are 5.39, 5.29 and 5.29 (±0.01) GHz corresponding to effectivegroup indices of 1.475, 1.505 and 1.505 (±0.003), respectively. By optimizing an individualresonance using the FPC and then measuring the polarization of the transmitted light, we findthat resonances 1 and 3 correspond to TM and TE modes, respectively. The polarization ofresonance 2 is difficult to measure because of its low contrast. As anticipated the effectivegroup indices derived from the measurement systematically deviate from the calculated values(see Section 3). This deviation is due to the stress and diffusion of the Si3N4 core caused by theannealing process [18].
9.5 10 10.5 11 11.5
0.16
0.18
0.2
0.22
0.24
0.26
0.28
0.3
0.32
0.34
Tra
nsm
issi
on
Frequency Detuning (GHz)
1 2 3
10.64 10.69 10.740.29
0.294
0.2982
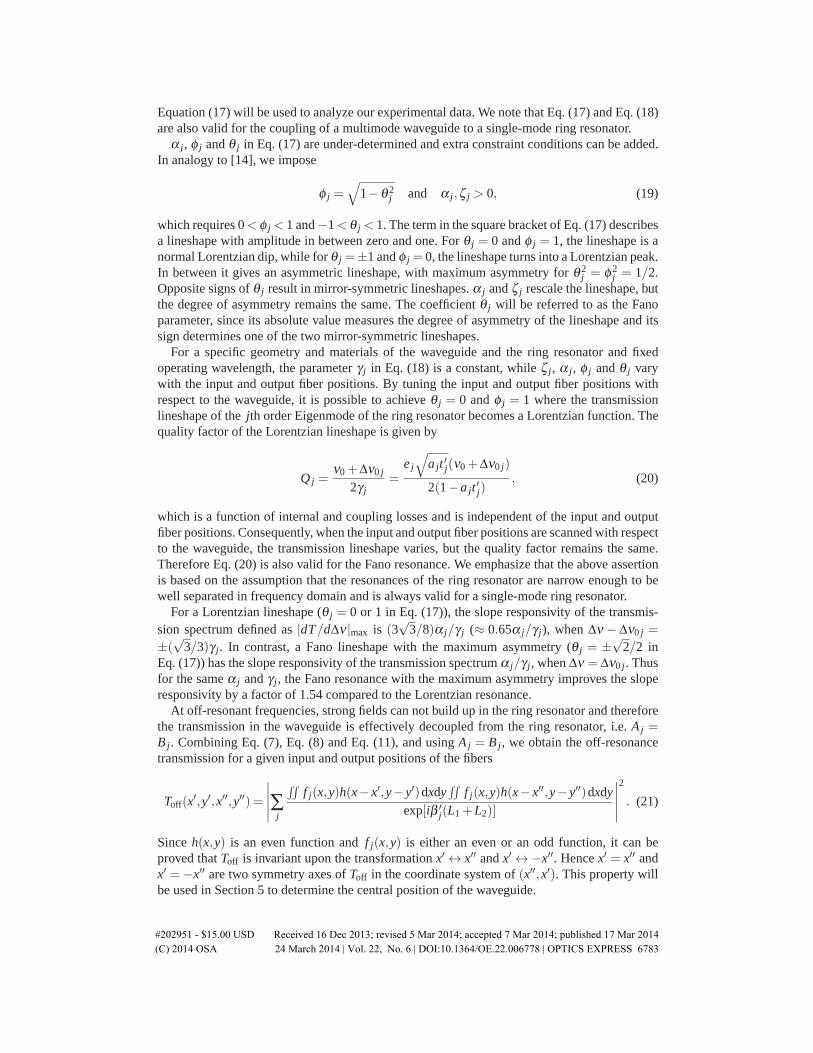
Fig. 5. Detailed transmission measurement as a function of laser frequency detuning (bluedots) showing three resonances. The red curve through the data is a fit to Eq. (12). Thethree resonances labeled by 1, 2 and 3 correspond to the three resonances in Fig. 4 with thesame labels. Inset: magnified plot of the main figure for resonance 2.
Figure 5 shows a more detailed measurement of resonances 1, 2 and 3. The red curve through
#202951 - $15.00 USD Received 16 Dec 2013; revised 5 Mar 2014; accepted 7 Mar 2014; published 17 Mar 2014(C) 2014 OSA 24 March 2014 | Vol. 22, No. 6 | DOI:10.1364/OE.22.006778 | OPTICS EXPRESS 6786

the data is a fit to Eq. (12) in the form of
T (Δν) =
∣∣∣∣∣p−3
∑j=1
b j
exp[ie j(Δν +ν0 j)]−d j
∣∣∣∣∣2
, (22)
where p, ν0 j and d j are real coefficients, b j are complex coefficients, and e j are fixed parame-ters calculated by the effective phase indices. The three resonances demonstrate different degreeof asymmetry in their lineshapes. Although Eq. (12) is derived under the assumption that onlymodes with one polarization are excited, we can prove that fitting Eq. (12) to the transmissiondata with modes in two orthogonal polarizations gives correct parameters ajt ′j and hence cor-rect quality factors. The quality factors that can be extracted from the fit (see Eq. (20), wherea jt ′j ≡ d j) are (8.1±0.2)×106, (1.9±0.1)×107 and (6.9±0.2)×106 for resonances 1, 2 and3, respectively. We attribute resonance 1 to the TM0 mode (mode profile in Fig. 2(b)) and res-onances 2 and 3 to the TE0 mode (lower coupling and bending losses, therefore higher qualityfactor; mode profile in Fig. 2(d)) and TE1 mode (mode profile in Fig. 2(e)), respectively. Res-onances of other modes can not be recognized in the transmission measurements due to theirlow contrasts.
Because of the single-mode property of the waveguide in the y-direction (see Fig. 2), movingthe coupling fibers along the y-direction changes the overall coupling efficiency, but hardlyaffects the relative weight of different modes excited and collected in the waveguide given thatthe confinement in the y-direction only very weakly depends on the mode. As a consequence,we observe that the transmission lineshape and Fano resonances are independent of the fiberpositions in the y-direction. Therefore in the experiment both of the input and output fibersare aligned to the center of the waveguide in the y-direction (y = y′ = 0) by maximizing thetransmission amplitude and are only scanned in the x-direction.
−0.5 0 0.50
0.05
0.1
0.15
0.2
−0.5 0 0.50
0.05
0.1
0.15
−0.5 0 0.50.1
0.15
0.2
0.25
−0.5 0 0.50.032
0.034
0.036
0.038
0.04
Frequency Detuning (GHz)
Tra
nsm
issi
on
θ = 1.00(a) θ = −0.70(b)
θ = 0.73(c) θ = 0.04(d)
Fig. 6. Measured transmission of resonance 1 as a function of frequency detuning (bluedots). The red curves through the data are fits to Eq. (17) for four different input-outputfiber positions. The Fano parameter θ obtained from the fit is shown for each transmissioncurve. A value of θ close to unity corresponds to a transmission dip (a), while θ close tozero corresponds to a transmission peak (d). θ close to ±√
2/2 (≈ 0.707) gives maximumnegative (b) and positive (c) asymmetry. The slope responsivity defined as |dT/dν |max are4.23, 4.90, 5.35 and 0.22 GHz−1, respectively.
We will focus on resonance 1 which has the highest contrast, indicating that this mode isclosest to critical coupling. The FPC is set to maximize the contrast of resonance 1 from here on.
#202951 - $15.00 USD Received 16 Dec 2013; revised 5 Mar 2014; accepted 7 Mar 2014; published 17 Mar 2014(C) 2014 OSA 24 March 2014 | Vol. 22, No. 6 | DOI:10.1364/OE.22.006778 | OPTICS EXPRESS 6787

Under such a polarization condition, only the two TM modes are excited and the TE modes arenegligible. In the vicinity of the resonant frequency, Eq. (17) is applicable. Because resonance1 is far detuned from other resonances in the frequency domain, the physical origin of theFano resonance is the coupling of the multimode waveguide to a single resonance of the ringresonator. Figure 6 shows the measured transmission of resonance 1 at four different input-output fiber positions together with the fits to Eq. (17). The slope responsivity (|dT/dν |max) ofthe four transmission spectra are 4.23, 4.90, 5.35 and 0.22 GHz−1, respectively. From the fits,the Fano parameter θ is extracted and the off-resonant transmission Toff is obtained as
Toff = ζ +αφ 2. (23)
Figure 7 shows a contour plot of Toff as a function of the input and output fiber positions (x′and x′′, respectively) on a logarithmic scale. By using the symmetric property of Toff (Eq. (21)),two symmetry axes, x′ = x′′ and x′ =−x′′, are determined and shown as dashed lines in Fig. 7.The intersection of the two symmetry axes corresponds to the center of the waveguide and isdefined as the origin of the input and output fiber positions (x′ = x′′ = 0). Close to the edges ofFig. 7, the TM1 mode of the waveguide is more strongly excited or more efficiently collectedbecause of its larger spatial extent. Consequently, valley I can be understood as follows: theTM0 mode is weakly excited, while the output fiber only couples to this mode (the TM1 modeis orthogonal to the fiber mode). Similarly, at valley II, only the TM0 mode is strongly excitedwhile the output fiber couples weakly to this mode.
Inpu
t Pos
ition
x’ (
μm)
Output Position x’’ (μm)
−8 −6 −4 −2 0 2 4 6 8−8
−6
−4
−2
0
2
4
6
8
−2.5
−2
−1.5
−1
−0.5
0
(a)
(b)
(c)
(d) (I)
(I)
(II) (II)
Fig. 7. Contour plot of the measured log10 Toff as a function of the input and output fiberpositions. The two dashed lines are symmetry axes of the Toff data. The origin of the plotis defined as the intersection of the two symmetry axes. The points marked by (a) - (d) arepositions where the transmission (a) - (d) in Fig. 6 are measured, respectively.
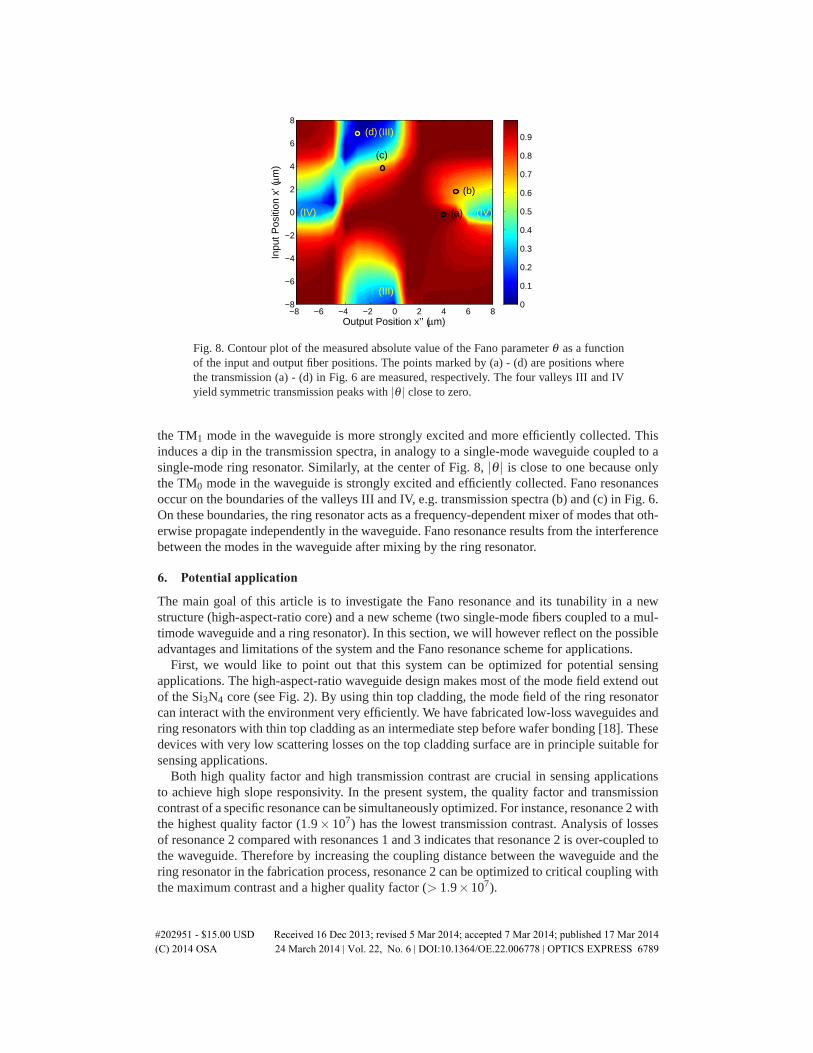
A contour plot of the absolute value of the Fano parameter θ of resonance 1 as a functionof the input and output fiber positions is shown in Fig. 8. For most of the input-output fiberpositions, |θ | is close to 1 corresponding to the commonly observed Lorentzian dip. There aretwo valleys III and IV where |θ | is close to zero (transmission peaks). They are inherentlyrelated to the valleys I and II in Fig. 7. For the valley IV, the TM1 mode in the waveguideis indirectly excited through the ring resonator at resonant frequency without interfering withthe direct transmission of this mode in the waveguide (zero). As to the valley III, the TM1
mode in the waveguide is more strongly excited. However, by coupling to the ring resonator,the TM0 mode in the waveguide is indirectly excited. On the other hand, at the four corners,
#202951 - $15.00 USD Received 16 Dec 2013; revised 5 Mar 2014; accepted 7 Mar 2014; published 17 Mar 2014(C) 2014 OSA 24 March 2014 | Vol. 22, No. 6 | DOI:10.1364/OE.22.006778 | OPTICS EXPRESS 6788
Inpu
t Pos
ition
x’ (
μm)
Output Position x’’ (μm)
−8 −6 −4 −2 0 2 4 6 8−8
−6
−4
−2
0
2
4
6
8
0
0.1
0.2
0.3
0.4
0.5
0.6
0.7
0.8
0.9
(a)
(b)
(c)
(d) (III)
(III)
(IV) (IV)
Fig. 8. Contour plot of the measured absolute value of the Fano parameter θ as a functionof the input and output fiber positions. The points marked by (a) - (d) are positions wherethe transmission (a) - (d) in Fig. 6 are measured, respectively. The four valleys III and IVyield symmetric transmission peaks with |θ | close to zero.
the TM1 mode in the waveguide is more strongly excited and more efficiently collected. Thisinduces a dip in the transmission spectra, in analogy to a single-mode waveguide coupled to asingle-mode ring resonator. Similarly, at the center of Fig. 8, |θ | is close to one because onlythe TM0 mode in the waveguide is strongly excited and efficiently collected. Fano resonancesoccur on the boundaries of the valleys III and IV, e.g. transmission spectra (b) and (c) in Fig. 6.On these boundaries, the ring resonator acts as a frequency-dependent mixer of modes that oth-erwise propagate independently in the waveguide. Fano resonance results from the interferencebetween the modes in the waveguide after mixing by the ring resonator.
6. Potential application
The main goal of this article is to investigate the Fano resonance and its tunability in a newstructure (high-aspect-ratio core) and a new scheme (two single-mode fibers coupled to a mul-timode waveguide and a ring resonator). In this section, we will however reflect on the possibleadvantages and limitations of the system and the Fano resonance scheme for applications.
First, we would like to point out that this system can be optimized for potential sensingapplications. The high-aspect-ratio waveguide design makes most of the mode field extend outof the Si3N4 core (see Fig. 2). By using thin top cladding, the mode field of the ring resonatorcan interact with the environment very efficiently. We have fabricated low-loss waveguides andring resonators with thin top cladding as an intermediate step before wafer bonding [18]. Thesedevices with very low scattering losses on the top cladding surface are in principle suitable forsensing applications.
Both high quality factor and high transmission contrast are crucial in sensing applicationsto achieve high slope responsivity. In the present system, the quality factor and transmissioncontrast of a specific resonance can be simultaneously optimized. For instance, resonance 2 withthe highest quality factor (1.9× 10⁷) has the lowest transmission contrast. Analysis of lossesof resonance 2 compared with resonances 1 and 3 indicates that resonance 2 is over-coupled tothe waveguide. Therefore by increasing the coupling distance between the waveguide and thering resonator in the fabrication process, resonance 2 can be optimized to critical coupling withthe maximum contrast and a higher quality factor (> 1.9×10⁷).
#202951 - $15.00 USD Received 16 Dec 2013; revised 5 Mar 2014; accepted 7 Mar 2014; published 17 Mar 2014(C) 2014 OSA 24 March 2014 | Vol. 22, No. 6 | DOI:10.1364/OE.22.006778 | OPTICS EXPRESS 6789
The method of using single-mode fibers coupled to a multimode waveguide to generate andto tune the Fano resonances implies that only part of the incident light is detected. This seems tolimit the use of the Fano resonance for sensing applications. For example the slope responsivityof the Fano resonance shown in Fig. 6(c) is 5.35 GHz−1, while the maximum slope responsivityof the system is 34.37 GHz−1 obtained from a symmetric lineshape when both the input andoutput fibers are aligned to the center of the waveguide. However one should realize that thelight that is not recorded in the Fano resonance is still available and also carries informationon the resonance of the ring resonator. A more detailed analysis considering detecting all theoutput power of the waveguide is needed to investigate whether there can be an overall gain insensitivity compared to a single-mode-waveguide-ring-resonator configuration. However thisis beyond the scope of this article.
7. Conclusion
In summary, we measured transmission through a multimode Si3N4 waveguide coupled to ahigh-Q Si3N4 ring resonator at 978 nm wavelength. By scanning the positions of single-modefibers at both input and output ports of the waveguide, we selectively excite and probe combi-nations of the modes in the waveguide. Fano resonances are observed as a function of the inputand output fiber positions, which originates from the interference between the modes in thewaveguide after mixing by the ring resonator. We developed a theoretical model based on thecoupled mode theory to describe the system. We also showed that the effective index method isa good approximation in calculating the modes of our high-aspect-ratio Si3N4 waveguide. Withthe large spatial extent of the mode out of the Si3N4 core, our Si3N4 ring resonator is of interestfor sensing applications.
Acknowledgments
This work is part of the research programme of the Foundation for Fundamental Research onMatter (FOM), which is part of the Netherlands Organisation for Scientific Research (NWO).This work was supported by NWO VICI Grant No. 680-47-604, NSF DMR-0960331, NSFPHY-1206118 and DARPA IPHOD contract HR0011-09-C-0123.
#202951 - $15.00 USD Received 16 Dec 2013; revised 5 Mar 2014; accepted 7 Mar 2014; published 17 Mar 2014(C) 2014 OSA 24 March 2014 | Vol. 22, No. 6 | DOI:10.1364/OE.22.006778 | OPTICS EXPRESS 6790
Copyright © 2022 FDOKUMEN