fai Mumbai - 400 085, wnr India - International Nuclear ...
27
BARC/2003/E/013 A CLEAN LABORATORY FOR ULTRATRACE ANALYSIS THE ULTRATRACE ANALYTICAL FACILITY (UTAF) by S.G. Jadhav, Suvarna Sounderajan. Sanjukta A. Kumar. A.C. Udas, M. Ramanamurlhi. M M Palrecha and M. Sudersanan Analytical Chemistry Division 'CrT7fT T R W T TO xmnnj gfe fai Mumbai - 400 085, wnr India 2003
-
Upload
khangminh22 -
Category
Documents
-
view
3 -
download
0
Transcript of fai Mumbai - 400 085, wnr India - International Nuclear ...

BARC/2003/E/013
A CLEAN LABORATORY FOR ULTRATRACE ANALYSIS THE ULTRATRACE ANALYTICAL FACILITY (UTAF)
by S.G. Jadhav, Suvarna Sounderajan. Sanjukta A. Kumar.
A.C. Udas, M. Ramanamurlhi. M M Palrecha
and
M. Sudersanan Analytical Chemistry Division
'CrT7fT TRWT
TO x m n n j g f e
f a i Mumbai - 400 085, wnr India
2003
BARC/2003®0n
GOVERNMENT OF INDIA ATOMIC ENERGY COMMISSION
A CLEAN LABORATORY FOR (JLTRATRACE ANALYSIS THE ULTRATRACE ANALYTICAL FACILITY (UTAF)
by S. G. Jadhav, Suvama Sounderajan, Sanjukta A. Kumar,
A. C. Udas, M Ramaoamurthi, M. M. Palrecha and
M.Sudersanan Analytical Oiemistiy Division
BHABHA ATOMIC RESEARCH CENTRE MUMBAI, INDIA
2003

BARC/2003/E/0I3
BIBLIOGRAPHIC DESCRIPTION S H U T FOR TECHNICAL REPORT I n per B i M N - B H )
0 Security classification : Unclassified
02 Distribution : External
03 ' Report status : New
04 Series : BARC External
05 Report type Technical Report
06 Report No. : BARC/2003/E/013
07 Part No. or Volume No. :
08 Contract No. :
10 Title and subtitle: A clean laboratory for ultrmtr»ce analysis: the tftratrace analytical facility (UTAF)
II Collation : 27 p., 10 figs., 4 tabs., 1 ill.
13 Project No. :
20 Persona! author(s) : S.G. Jadhav; Suvarna Sounderajan; Sanjukta A. Kumar; A.C. Udas; M. Ramanamurthi; M.M. Palrecha; M. Sudersanan
2/ Affiliation of avthorfsj : Analytical Chemistry Division, Bhabha Atomic Research Centre, Mumbai
22 Corporate aaherfa): Bhabha Atomic Research Centre, Mumbai-400 085
23 Originating unit : Analytical Chemistry Division, BARC, Mumbai
24 Sponsorfs) Name : Department of Atomic Energy
Type. Government

BARC7W03/B0I3
30 Dote of submission : May 2003
31 Publication/Issue date : June 2003
40 Publisher/Distributor : Head, Library and Information Services Diviiion, Bhabha Atomic Research Centre, Mumbat
42 Form of distribution : Hard copy
JO Language of text: English
51 Language of summary : English, Hindi
J2 No. of references : 10 refs.
JJ Gives Jata on .
60 Abstract: There has been an incieasing demand for the quantification of various elements at extremely low concentrations in a variety of samples buck as high purity materials, environmental and biological samples. The need for a controlled environment to obtain reliable and reproducible data necessitates the use of strategies and practices to minimize contamination during the analytical procedure. This report describes the protocol observed in our clean laboratory to eliminate contamination and ensure low laboratoiy blanks and some of the methodologies developed to carry out the analysis. The analysis is carried out by Graphite Furnace Atomic Absorption Spectrometry and electrochemical techniques such as Anodic/Cathodtc'Adsorptive Stripping Voltammetry. Characterisation of SN (total impurities tOppm) arsenic is routinely carried out Al in serum of patients suffering from end stage renal failure are also analyzed. Pine leaves, spinach, carrot puree and milk powder have been characterized for Al and Hg content and bovine serum has been characterized for Cu, Zn, Na, K s a m p l e s as part of intercomparison exercises.
70 keywords/Descriptors; ABSORPTION SPECTROSCOPY; VOLTAMETRY: ARSENIC; QUANTITATIVE CHEMICAL ANALYSIS;; ENVIRONMENT; PARTICULATES; BLOOD SERUM; BISMUTH; CADMIUM; IMPURmES.SENSITIVlTY; TRACE AMOUNTS, NUCLEAR FUELS
71 IN IS Subject Category No : S37
99 Supplementary elements :

A CLEAN LABORATORY FOR ULTRATRACE ANALYSIS THE ULTRATRACE ANALYTICAL FACILITY (UTAF)
S.G.Jadhav, Suvama Sounderajan, Sanjukta A.Kumar, A.C.Udas,
M.Ramanamurthi, M.M.Palrecha & M.Sudersanan
Analytical Chemistry Division
BARC, Mumbai -400085.
ABSTRACT
Thare has been an increasing demand for the quantification of various elements at
extremely low concentrations in a variety of samples such a s high purity materials,
environmental and biological samples. The need for a controlled environment to
obtain reliable and reproducible data necessitates the use of strategies and practices
to minimize contamination during the analytical procedure. This report describes the
protocol observed in our clean laboratory to eliminate contamination and ensure low
laboratory blanks and some of the methodologies developed to carry out the
analysis. The analysis is carried out by Gcaph'rte Furnace Atomic Absorption
Spectrometry and electrochemical techniques such as Anodic/ Cathodic / Adsorptive
Stripping Voltammetry. Characterisation of 5N (total impurities 10ppm) arsenic is
routinely carried out. Al in serum of patients suffering from end stage renal failure
are also analyzed. Pine leaves, spinach, c a r o l puree and milk powder have been
characterized for Al and Hg content and bovine s e w n has been characterized for
Cu, Zn, Na, K in samples as part of intercomparison exercises.

mi ftyttaui w t f U^M^IIHI
TTTT3I j ^ w (UTAF)
fgvclwiirq* JPTPT •WW - 400 08?
3*5? TOSff, TprfgTTJfhi (TOT s H ^ ^Pjft 3FR> TftR ft^T
W5TTT TIT fijf>Ff rfi f % 1TMl4t3F><U| fcg TFT # fe jf t I ElT<W4ta IHI 9T7T dfieTR^ fTOfafT WTrWW fat? t ^ f e f e ^ ^ R 3 f t
fa^^ro ^f grr^ fas 3T«ire tfr fc i M r t ih feasor w
srr grt^ y^'iviwi ^ w f fetr tjift gj^ ^ y ^ w r o i
ftthTfTI ^MWri tTOT "TT ^ «Ff t I ^ f^T^VT
Ttar*? irft 3?!T faq^ qrcr ftfa ^r fa^fUIMWlto f^W ta UTrlT % I 5 N (10 ppm fH )
55F ^ arfHWR few sTTrrr t I <
A CLEAN LABORATORY FOR ULTRATRACE ANALYSIS THE ULTRATRACE ANALYTICAL FACILITY (UTAF)
S.G.Jadhav, Suvama Sounderajan, sanjukta A.Kumar, A.C.Udas,
M.Ramanamurthi. M.M.Palrecha & M.Sudersanan
Analytical Chemistry Division
BARC, Mumbai -400085.
INTRODUCTION
The term trace analysis is widely used to describe the application of analytical
techniques under circumstances where the amount of analyte is very small. It has a
special significance in nuclear technology. Materials such a s fuels, moderators,
cladding materials, control and other structural materials have very specific purity
requirements. There is also a widespread need for trace analysis in a variety of other
applications such as characterization of ultrapure materials for technological
advances, establishment of meaningful tolerance limits for pollutants, analysis of
geological and celestial samples, determining the distribution and abundance of trace
constituents to effectively use the ocean resources, scientific data for forensic
investigations, studying the physics and chemistry of semiconductors, elucidating the
role of trace metals in biological functions and determining mechanisms by which
heavy metal? induce toxicity [1,2].
The purity of a material is specified on the 'number of nines* concept. A
specification of 5N indicates a purity of 99.999% and 4NS indicates a purity of
99.995% The N value is assigned after totaling all the impurity concentrations
expressed as a percentage and subtracting from 100. Characterisation of elements
at microgram to nanogram levels constitutes a major task in trace analysis. This
requires the development of new methods and techniques for highly sensitive and
accurate analysis. This also requires methods for preventing and controlling
contamination in the laboratory. Contamination is the most insidious problem
affecting accurate trace analysis. It is caused by particulates in the air. handling of
sample, reagents, trace elements in containers used during the analysis and from the
analyst. The magnitude of the contamination is measured by the process blank. Thus
it is imperative to minimize the magnitude and variability of the blank to obtain the
best possible detection limits. This objective is achieved by carrying out the analysis
in a clean room. The Ultra Trace Analytical Facility (UTAF) was set up with the above
objectives in mind.
CLASSIFICATION OF CLEAN LABORATORIES
A clean room is any room or area where an attempt is made to limit, control, and
eliminate the amount of airborne contamination. The word 'attempt" is important,
because there is no such tiling a s a totally clean room, i.e., a room with absolutely no
contamination. There are only degrees of cleanliness, but more Often than not, these
less than perfect conditions will suffice for the purpose at hand. Clean laboratories
are classified according to the international airborne particulate cleanliness
classification by ISO (3]( Table 1).
in June 1999 the International Standards Organisation (ISO) published a standard
ISO 14644-1 [3], The classes are based on the formula
Cn= 10nX(0.1/D)2W
where Cn is the maximum permitted number of particles per cubic meter equal to or
greater than the specified particle size. It is rounded to a whole number, N is the ISO
class number, which must be a multiple of 0.1, and be 9 or less, D is the particle size
in micrometers.
Cleanliness class designations and quantity have changed from FS209E. Along with
the obvious change to metric measure of air volume, ISO 14644-1 adds three
additional classes , two cleaner than Class 1 and one less clean than Class 100,000.
ULTRA TRACE ANALYTICAL FACILITY ( UTAF)
A. Nort Laminar Flow Positive Pressure Clean Laboratory A schematic layout of UTAF is given in figure 1. The laboratory was constructed by
suitably modifying the existing laboratory and is designed to have different areas of
air cleanliness, tt has a total area of 100 m2. The laboratory is isolated from the
external air. The outside air is cooled and blown into the clean room after filtering
through prefilters and a bank of HEPA filters using two blowers (4). This clean room
is maintained at a positive pressure to allow clean air to diffuse into the other parts as
well as to prevent air from the other parts of the laboratory to enter into the clean
room. Double door entry system is used for personnel to step in and out of the dean
room. Five laminar flow work benches designed to provide class 100 or better work
surfaces are located inside the clean room. Besides the laminar flow benches, two
other plain benches for accommodating the Atomic Absorption unit and the Electro
benches for carrying out the various cleaning and sample processing operations. The
clean benches and other fixtures are made of wood and/or polypropylene. The
wooden surfaces are laminated. The walls are coated with epoxy paint to prevent any
dust arising from them. The laboratory is equipped with several polypropylene sinks
and storage shelves and cabinets made of laminated wood. The flooring is made of
2mm thick sheets of PVC. The laboratory Is divided Into four zones a s indicated in
the figure 1. The innermost zone (Zone A) housing the LAF benches is the cleanest
zone with respect to particulate matter as air filtered through the HEPA filters directly
enters this zone before diffusing to other zones. The laminar air flow benches are
housed in this zone. Zone B (Etectroanatytical Room) is the area where tittered air
mixes with air diffusing out of Zone A and is therefore less clean than Zone A. Zone
C (General Laboratory) and Zone D (AAS Room) receive a mixture of filtered air and
air diffusing from Zone A and Zone B and are therefore less clean with respect to
particle counts than the other two zones. Particle counts are taken in four different
zones of UTAF daily using a LASAIR II particle counter ( PMS Inc., USA). It is a
1CFM particle counter using a 50 mW infrared diode laser lasing at 760 nm. It
accumulates counts in 6 channels, the channel thresholds being 0.5, 0.7,1.0, 2 0.
3.0, 5.0 and 10.0 nm. It has a countings efficiency of >50% and can count a
maximum concentration of 900,000/ft3.
The minimum number of sampling locations to be measured for particulate
counts is given by the formula
"Ni=VA" where
Ni = the minimum number of sampling locations, rounded to a whole number and
A = the area of the clean room or clean air controlled space in m2.
Data was collected in both 'a t rest * condition and under "operational"
condition. Sampling locations were evenly distributed throughout the area of the
clean room and positioned at the height of the work activity. The laminar benches
meet the ISO Class 4 ( F S Class 10) criteria. Zone A meets ISO Class 6 ( F S Class
1000), Zone B meets ISO Class 7 ( FS Class 10000) and Zone C and D meet
ISO Class 8 ( F S Class 100000) criteria,
b. Laminar Air Flow Benches
There are four laminar air flow benches located in Zone A, two of which are vertical
type (7.5 ft2) and two horizontal type (6.0 ft2). These benches are equipped with
HEPA filters with PVC frames and separators working at an efficiency of 99.7 % for
0.5n particles. They are made of polypropylene and laminated particle board. The

horizontal type work benches are used for storage of clean vessels. The vertical flow
benches are used for carrying out chemical work. One of the benches is equipped
with an exhaust system to enable handling of adds .
c. Clean Room Apparel
The analyst is one of the principle sources of contamination and all cane is taken to
prevent contamination from clothing, hair and hands. The analyst wears clean room
garments which produce UtUe or no particle emission by itself. Synthetic fibers woven
into fabrics best meet these requirement. All clean room apparel used in the
laboratory is made of Oacron. Dacron is emission free, crisp and soft and drapes
smoothly. It develops low static charge, retains it's whiteness and is one of the most
wrinkle resistant fabrics known, it is quick drying, retaining less than 1% of the
moisture on washing. All personnel working in the clean laboratory wear full length
two piece coveralls with plastic buttons( knee length) and pajamas. They are also
equipped with hand gloves, overshoes with PVC soles, surgeon type caps covering
the head and ears.
Tacky Mats (sticky mats) are placed at the entrances of alt zones to trap any
dust on the footwear onto these mats.
d. High Purity Water The most important aspect in ultra trace analysis is the availability of ultra pure water
and ultra pure reagents. The most important class of reagents are the mineral acids.
Large amounts of ultra pure acids and water are required all through the various
steps of ultra trace analysis, starting from cleaning of vessels to sample dissolution.
Ultra pure water is obtained starting from tap water using a two stage purification
procedure supplied by Bamstead Thermolyne. in the first stage, a high capacity
cartridge D 0803 purifies tap water to provide feed water with a resistivity of 2 MTL
This feed water is then fed into a Type D 4700 Nanopure analytical deionisation
system to provide water with a resistivity of 18.3 Mn required for ultratrace analysis.
The O 4700 system consists of one pretreatment cartridge, two ultra pure cartridges
and one organic free cartridge. The water is collected in 15 litres polythene carboys.
Some of the important trace impurities in this water which have been measured by
GFAAS.are given in Table 2.
Mineral Acids
HNOs is used extensively in the laboratory for cleaning of labware and during the
analytical procedures itsetf. For preparation of acid baths and for cleaning purposes,
acid purified from analar grade acid by sub-boiling distillation is used (fig 4). The
purity levels of this acid with respect to common trace impurities are given in Table 2.
Double distilled acid has also been prepared in this apparatus and surpasses the
quality of Suprapure Nitric Acid. For purposes of sample preparations and dilution of
standards, Suprapure Nitric Acid from E.Merck, Germany is used. The acid is
accompanied with a purity certificate and the maximum concentrations of common
trace impurities does not exceed 5 ng/ml
f. Labware and Cleaning Procedures Contamination and losses of trace elements by leaching or adsorption from
the laboratory ware lead to inaccuracies in trace elemental estimations. Glassware is
especially known to cause errors due to H's adsorption and leaching properties and
it's use is best avoided or minimised to the extent possible. Labware made of
polythene, teflon PFA or high purity quartz are used for most applications. The
various acid baths are made of seamless, rotational moulded polyethylene tanks
which are lightweight and easy to handle. These tanks are resistant to most acids
and alkalis. They are made with wide top flanges and include covers.(Fig 5)
The labware to be used is subjected to a rigourous cleaning procedure prior
to use. They are first washed with tap water to remove surface dirt and dust and then
rinsed with acetone to remove greasy material. This is followed by thorough rinsing
with ultrapure water several times. They are then immersed in three successive
bathsof 10%, 1% and 0.1% of distilled nitric acid in polyethylene tanks for one week
each. The labware is left in the last bath till further use. They are then once again
rinsed several times with high purity water before the actual use.
The high purity water is stored in HDPE dispensing jugs of 20 liters capacity.
Samples after dissolution are stored in pre cleaned Teflon PFA vials with screw caps.
g. Sample Dissolution
Sample dissolution carried out by the traditional open beaker digestion Is an antiquated method susceptible to errors primarily from contamination and losses of analytes from the sample. Sample dissolutions m UTAF are carried out using a closed system Microwave sample Dissolution equipment The system ensures a

clean, closed and controlled reaction environment. The amount of acid used is
diminished to stoichiometric quantities of the reagent, further reducing the possibility
of contamination from the acid. The closed vessel decomposition is carried oul in
specially const meted PFA vessels capable of withstanding pressures up to 600 P8I
(Fig 6). This leads to superheating of the acid mixtures, resulting in a dramatic
acceleration of the digestion reaction — up to 100 times faster than a hotplate! The
system ensures high throughput and rapid sample turnaround, improved recoveries
of volatile analyte, eliminates cross contamination and reduces acid trace impurities
thus leading to lower detection limits and higher sensitivity. The microwave power
output is managed through direct feedback from temperature and pressure probes,
providing control of the chemical reactions. The system is constructed of solid steel,
encased in a protective polymer shell, and has a fluoro polymer coated cavity and an
impact resistant door for safety and durability.
h. Instrumental Facilities
(i) Graphite Furnace Atomic Absorption Spectrometry (GFAAS)
Graphite furnace atomic absorption spectroscopy (GFAAS) is a highly sensitive
spectroscopic technique that provides excellent detection limits for measuring
concentrations of metals in solid and liquid samples. The detection limits range from
the ppb to ppm levels for the most common contaminants. In this technique, a beam
of electromagnetic radiation of specific wavelength (resonance wavelength)
corresponding to the element of interest is passed through the atomic vapor of the
element, and measurement is made of the attenuation of the intensity of the beam as
a result of absorption. Since atomic transitions are sharp and intense, veiy low
concentrations also give rise to measurable absorbance. The relationship between
change in intensity and concentration is given by the Beer Lambert's relationship
Absorbance (A) = Log lo/li =e c I where l0 = Incident beam intensity
I t• Transmitted beam intensity
€ = extinction coeffecient
c= concentration and
l=path length
Quantitative analysis by AA depends on: (1) accurate measurement of the intensities
of the incident and transmitted beam and (2) the condition that the radiation absorbed
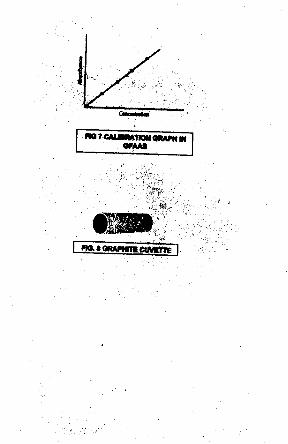
is proportional to atomic concentration as per the above relationship. A calibration
curve is constructed by plotting concentrations of standards vs. the absorbance

(fig 7). The samples can be tested and measured against this curve. Samples to be analyzed by AA must be vaporized or atomized, typically by using a flame or graphite fumace.( Fig 8) The graphite furnace Is an electrothermal atomizer system that can produce temperatures as high as 3,000°C. The heated graphite furnace provides the thermal energy to break chemical bonds within the sample and produce free ground state atoms. Ground state atoms then are capable of absorbing energy, m the form of light, and are elevated to an excited stale. The amount of light energy absoibed increases as the concentration of the selected element increases. The absorbance of the analyte in the sample is measured and the concentration determined from the calibration curve.
GFAAS instruments have the following basic features (fig. 9)
1. a source of light that emits the resonance radiation
2. an atomization chamber (graphite tube) in which the sample is vaporised 3. a monochromator for selecting only one of the characteristic wavelengths
(visible or ultraviolet) of the element of interest
4. a detector, generally a photomuttiplier tube suitable for low intensity applications, that measures the amount of absorption
5. a signal processor and computer system
Working standards in the range of expected anafyte concentration are prepared just prior to analysis by diluting a suitable stock solution of the analyte standard. Dilutions are carried out with variable volume micropipettes using disposable precleaned polypropylene tips. Transfer of sample and samples from clean room after processing for analytical measurements is carried out through pass through transfer boxes which open in a specific direction to allow clean air to pass from the inner room to the outside, (fig. 1)
(II) Stripping Voltammetry
Stripping voltammetry is one of the most sensitive, convenient, and cost effective analytical method for detection and quantitation of metal contaminants in solution samples. The method pre concentrates the analyte at the working electrode by a bulk electrolysis step. This preconcentration step does not require any sample handling thus reducing the incumbent risk of contamination. As a result of the insitu preconcentration step, stripping voltammetry techniques yield extremely low de tec t ion limits, detection limits of 1 0 1 0 M b e i n g c o m m o n for many metals. S e v e r a l
metals such a s Sb, Bi, Cu, Pb and Cd can be analyzed simultaneously on account of
their differing half wave potentials by this method giving it a multielement capability.
Following the electrodeposition step, the material is stripped from the electrode by
electrolysis using a potential sweep. Current peaks appear at potentials
corresponding to the oxidation of metals as they are oxidized (stripped) from the
electrode back into the solution. The amount of the metal deposited at the cathode
during the preconcentration is a function of the deposition time, the stirring rate and
the electrode surface area. The peak height or area can be correlated with the
concentration of the metal ions in the solution. Prior calibration with standard
solutions containing known quantities of the metal ions is carried out and from the
peak location and height on the sample, the identity and concentration of the anaiyte
can be determined.
Hie stripping step may consist of a positive or a negative potential scan,
creating either an anodic or cathodic current respectively. Hence. Anodic Stripping
Voltammetry (ASV) and Cathodic Stripping Voltammetry (CSV) are two specific
stripping techniques.
In anodic stripping voltammetry, the cell is made up of a solution of a
supporting electrolyte (eg. KCI) and three electrodes: a working electrode-hanging
Hg drop electrode or a mercury film deposited onto glassy carbon, a reference
electrode of silver/silver chloride and an auxiliary electrode of platinum wire. The
mercuric ion is added directly to the supporting electrolyte and during the
preconcentration step it codeposits with the metal of interest.
Two of the techniques that can be used to reoxidize the metal from the
electrode surface are linear sweep voltammetry and differential pulse voltammetry.
in linear sweep voltammetry, the potential is scanned linearly a s a function of time.
In differential pulse voltammetry, a rectangular pulse is applied to a potential ramp.
The output for differential pulse voltammetry is in the form of a peak whose height is
proportional to the concentration of the analyte. Differential pulse voltammetry is a current measurement technique that enhances the analytical (faradaic) current and
avoids the background (charging) current, resulting in a higher signal to noise ratio
for a better detection limit.
Cathodic Stripping Voltammetry is used to determine those anatytes that form insoluble compounds with mercury. In CSV, the mercury working electrode is not inert, but takes an active part in the formation of the deposit Stripping In CSV consists of a cathodic scan to reduce the surface deposited mercuric compound

back into the solution. This technique finds use in the quantification of anions such as
CI".Br, r ,S 2 \SeOa 2 ' e tc .
Adsorptive stripping methods are used for the quantification of Nl, Co and Cr
as some of their complexes have a tendency to get adsorbed from aqueous
solutions on to the mercury surface. This is followed by stripping the complex back
into the solution by applying a cathodic potential scan.
A typical anodic stripping voKammetry scan of high purity arsenic sample
taken for 5 trace elements viz. Cd, Pb, Cu> Sb and Bi is shown below (fig 10). After
the procedure has been standardized, analysis of a large number of samples can be
carried out routinely and rapidly with a high degree of precision and accuracy.
Analysis can be carried out in the sub ng to tig levels for the above elements.
i. Role of Blank In Analytical Determinations
An important prerequisite in ultra trace analytical measurements is the reduction and
control of the blank. Accurate and detailed measurements of the blank are necessary
for any trace and ultra trace measurement. The quality of the data will be highly
dependant upon these blank determinations. The blank values in UTAF for some of
the common elements are given in table 3 . The values for the same elements in an
ordinary laboratory by an identical procedure and measurement protocol are
juxtapositioned to highlight the improvement observed in the clean room.
J. Sample Analysis
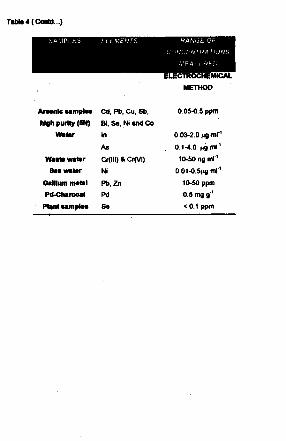
Table 4 lists some of the samples analysed at UTAF. The list of samples
encompasses a range of material such as high purity arsenic, biological,
environmental and agricultural samples. The range of concentrations measured Ml
in the ppb to ppm range. The methodologies used in these analyses have been
developed in this laboratory and published.
CONCLUSIONS
The Ultra Trace Analytical Facility is ideally suited to carry out analysis of samples in
which the levels of impurities are in the low ppm or ppb range. This has relevance in
diverse fields such as clinical, biological, agricultural, metallurgical and environmental
samples. A large number of such samples are being routinely analysed in this
laboratory and with the experience gained and with the upgradation of the existing
facilities, possibilities of analysis at even lower levels can be opened up.

REFERENCES
1. Uttrapurityin Trace Analysis, J.W.Mrtche)), Anafytica) Chemistry, 46,492A(1973).
2. Federal Standard 209E, Federal Standard Airborne Cleanliness Classes in
Cleanrooms and Clean Zones, Sep 1992.
3. A Clean Laboratory for Ultralow Concentration Heavy Metal Analysts, C.F.
Boutron, Fresnius J Anal Chem 337(1990) ,462.
4. Nuclear and other Instrumental Methods of Analysis at Trace and Uttrafrace
Levels of Concentrations, Jayaram Amnachalam, Ph.D. Thesis, Bombay
University, October 1991
5. Insitu Matrix Volatilisation Studies and Characterisation of some Trace Elements
in High Purity Arsenic by GFAAS, A.C.Udas, M.B.Sanglikar, Sanjukta A.Kumar,
M.Ramanamurthi, M.Sudersanan and P.K.Mathur, Atomic Spectroscopy,
21(2000), 71.
6. Adsorptive Stripping Voltammetric Determination of Chromium in Gallium,
M.M.Palrecha and P.K.Mathur, Talanta, 45 (1997), 433.
7. Square Wave Adsorptive Stripping Vottammetric Determination of Chromium in
High Purity Arsenic Metal, Suvarna Sounderajan and M.M.Palrecha, presented in
the Seventh International Symposium on Electrochemical Science and
Technology (SAEST-VII), Nov 27-29,2002.
8. Determination Of Trace Amounts of Selenium in Arsenic Metal by Differentia)
Pulse Cathodic Stripping Vottammetry, Suvama S.Shelke, S.S.Sawant,
M.M.Parecha, AV.Kulkami and P.K-Mathur, Bulletin of Electrochemistry,
18(2002), 13
9. Determination of Zinc in High Purify Gallium by Differential Pulse Anodic
Stripping Voltammetry, Suvama Sounderajan, Avanti Singh and M.M.Palrecha,
Indian Journal of Chemistry, 41A (2002), 1433
10. Simultaneous Determination of Cd(ll), Cu(ll), Pb (II), Bi(lll) and Sb(lll) in High
Purity Arsenious Oxide by Differential Pulse Anodic Stripping Vottammetiy,
Suvama Sounderajan, M.M.Palrecha and P.K.Mathur, presented at national
seminar on Trends in Chemical Research, GND University, Amritsar, March
1999.
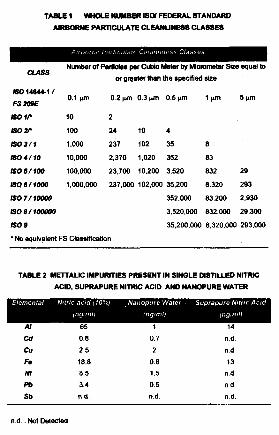
TABLE 1 WHOLE NUMBER ISOf FEDERAL STANDARD AIRBORNE PARTICULATE CLEANUNES8 CLASSES
Auhotne P,)ihcul.irv Cl«,mhnoss C.la:ssos
Number of Particles per Cubio Meter by Micrometer Size equal to
or greater than the specified size
S 0 1 4 6 4 4 - 1 /
FS209E 0.1 0.2 \im 0.3 0.5 fim 1 j»m 5 jim
Boir 10 2
SO If 100 24 10 4
BOJ/1 1,000 237 102 35 8
ISO 4/10 10.000 2.370 1,020 352 83
ISO 5/100 100.000 23,700 10.200 3.520 832 29
ISO «/1000 1,000.000 237,000 102,000 35,200 8,320 293
ISO 7 / 1 0 0 0 0 352,000 83,200 2,930
isoe/100000 3,520,000 832,000 29,300
ISO0 35,200,000 8,320,000 283,000
* No equivalent FS Classification
TABLE 2 METTALIC IMPURITIES PRESENT IN SINGLE DISTILLED NITRIC ACID, SUPRAPURE NITRIC ACID AND NANOPURE WATER
Elemental Nitric acid (10%)
(n(j:nill
Nanopure Water
Ing/mil
Suprapure Nitric Acid
lug/mil
AJ 65 1 14
Cd 0.8 0.7 n.d.
Cu 2 5 2 n.d Ft 18.8 0 8 13 HI 8.5 1.5 n.d. Pb 3.4 0 5 n.d.
Sb n.d. n.d. n.d.
n.d.: Not Detected

TABLE! COMPARISON OF BLANK VALUES IN CLEAN ROOM vis. • vis. ORDHARY LAB
F:! F Ml-tJ r ci ! AN 'ifJAHr
JU 26 126 CO 0.2 1.0 Cu 1.0 5.0
Co 1.8 33 Cr 0.2 16 Ft 17 110
Ml) 3 3 Pt 5 16 Zn 5 16

TABLE 4 TYPICAL SAMPLES ANALYSED AT UTAF
SAMPLES ELEMENTS RANGE OF
CONCENTRATIONS
v f A v w ;
OFAAS
ppro Arsenic Samples Al. Ag. Bi, Ca. Cd, 0.05-1
High Purity (5N) Co, Cr. Cu. Fe.
Mn. Mo, Se, Te,
Sb, Ni, Pb, Mg,
Zn, Sn
Blood Swum Al 0 01
Whole Blood Se 0 01
Spinach Al 1.9mg/g
Hg <02
Carrot Puraa Al 1.0
Hg <02
Milk Puree Al 5 0
Hg <0 2
Cauliflower Al 199
Hg <02
Bovine Serum Cu 0.04 -1 .5
Fe 0 2 - 2 0
Zn 0 . 0 4 - 0 . 1
(Contd...)
ELECTKOCHEMK*AL METHOO
Arsenic samples Cd, Pt>, Cu, 8b,
Wgh purity (9N) Bl, Se, Ni and Co
in
As
Cr(lll) & Cr(VI)
Ni
I Pb.Zn Pd-Charcoal Pd
Plant samples Se
0.05-0.5 ppm
0 03-2.0 ng ml1
0.1-4.0 tig ml1
10-50 ng ml'1
0 01-0 5^8 ml'1
10-50 ppm 0.5 mg g1
< 0.1 ppm

FIG. 1 ULTRA TRACE A N A L Y T I C A L FACILITY
ANALYTICAL CHEMISTRY DIVISION
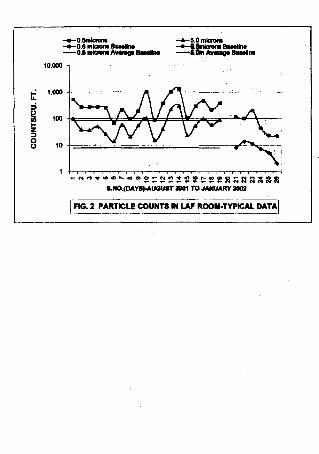
-*-0.5mlcrans -a—5.0 micron* -•—0.5 microns Basslint -•-fefoicrons BsssUns ——0.5 microns Avsrsgs BassNns —JtOm Avsrags Basslf
8.NO.(DAYS)-AWGUST 2001 TO JANUARY 2002
FIG. 2 PARTICLE COUNTS IN LAF ROOM-TYPICAL DATA]
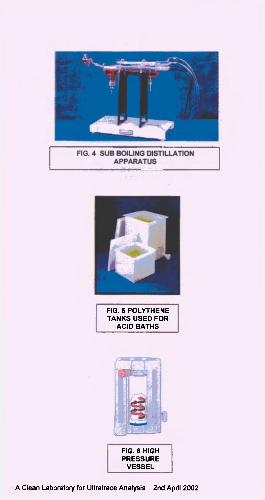
FIG. 5 POLYTHENE TANKS USED FOR
ACID BATHS
FIG. 6 HIGH PRESSURE
VESSEL
A Clean Laboratory for Ultratrace Analysis 2nd April 2002
n o r m e w m o w w v u w w anui
I n a « Q R A P H m c w » m g ]

LigN Sonar
GrapHteFunm
FIO. • UAORAM OF OFAAS COMPONENTS

Figure 10 Typical Voltammotric scan or high purity arsenic by DPASV A : Blank B : Sample (4 mg/ml) C.D.E: Standard Additions
Cd : 0.4,0.8,1.2 ng/ml: Cu : 1,2,3 ng/ml: Pt>. Sb„ Bl: 2,4 6 ng/ml

@ 0.5m • 5 .0m 100000
10000 i.hihl 1 LAF LAF ROOM EA ROOM G E N L A B AA3 ROOM
B E N C H E S
FIG. 3 P A R T I C L E C O U N T S DISTRIBUTION UTAF
AT