Need of device Sack and Loop Method Use of Dog-catching hoops with nets (Butterfly Nets
Upload
independentCategory
view
6download
0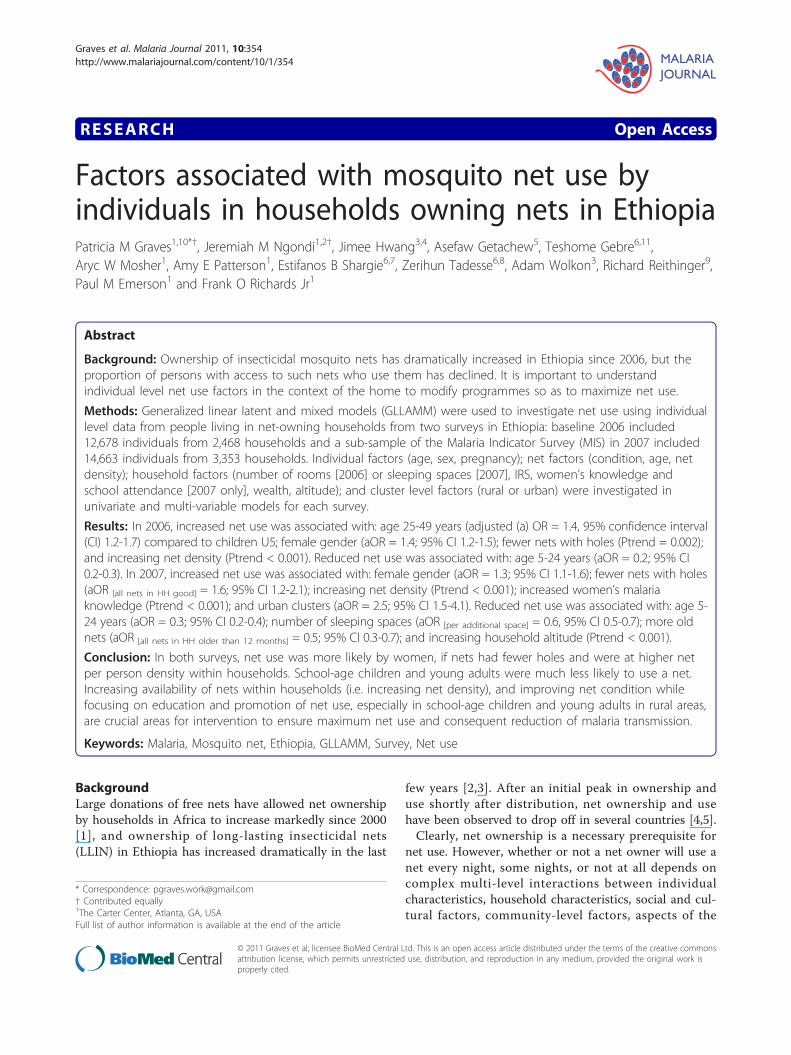
RESEARCH Open Access
Factors associated with mosquito net use byindividuals in households owning nets in EthiopiaPatricia M Graves1,10*†, Jeremiah M Ngondi1,2†, Jimee Hwang3,4, Asefaw Getachew5, Teshome Gebre6,11,Aryc W Mosher1, Amy E Patterson1, Estifanos B Shargie6,7, Zerihun Tadesse6,8, Adam Wolkon3, Richard Reithinger9,Paul M Emerson1 and Frank O Richards Jr1
Abstract
Background: Ownership of insecticidal mosquito nets has dramatically increased in Ethiopia since 2006, but theproportion of persons with access to such nets who use them has declined. It is important to understandindividual level net use factors in the context of the home to modify programmes so as to maximize net use.
Methods: Generalized linear latent and mixed models (GLLAMM) were used to investigate net use using individuallevel data from people living in net-owning households from two surveys in Ethiopia: baseline 2006 included12,678 individuals from 2,468 households and a sub-sample of the Malaria Indicator Survey (MIS) in 2007 included14,663 individuals from 3,353 households. Individual factors (age, sex, pregnancy); net factors (condition, age, netdensity); household factors (number of rooms [2006] or sleeping spaces [2007], IRS, women’s knowledge andschool attendance [2007 only], wealth, altitude); and cluster level factors (rural or urban) were investigated inunivariate and multi-variable models for each survey.
Results: In 2006, increased net use was associated with: age 25-49 years (adjusted (a) OR = 1.4, 95% confidence interval(CI) 1.2-1.7) compared to children U5; female gender (aOR = 1.4; 95% CI 1.2-1.5); fewer nets with holes (Ptrend = 0.002);and increasing net density (Ptrend < 0.001). Reduced net use was associated with: age 5-24 years (aOR = 0.2; 95% CI0.2-0.3). In 2007, increased net use was associated with: female gender (aOR = 1.3; 95% CI 1.1-1.6); fewer nets with holes(aOR [all nets in HH good] = 1.6; 95% CI 1.2-2.1); increasing net density (Ptrend < 0.001); increased women’s malariaknowledge (Ptrend < 0.001); and urban clusters (aOR = 2.5; 95% CI 1.5-4.1). Reduced net use was associated with: age 5-24 years (aOR = 0.3; 95% CI 0.2-0.4); number of sleeping spaces (aOR [per additional space] = 0.6, 95% CI 0.5-0.7); more oldnets (aOR [all nets in HH older than 12 months] = 0.5; 95% CI 0.3-0.7); and increasing household altitude (Ptrend < 0.001).
Conclusion: In both surveys, net use was more likely by women, if nets had fewer holes and were at higher netper person density within households. School-age children and young adults were much less likely to use a net.Increasing availability of nets within households (i.e. increasing net density), and improving net condition whilefocusing on education and promotion of net use, especially in school-age children and young adults in rural areas,are crucial areas for intervention to ensure maximum net use and consequent reduction of malaria transmission.
Keywords: Malaria, Mosquito net, Ethiopia, GLLAMM, Survey, Net use
BackgroundLarge donations of free nets have allowed net ownershipby households in Africa to increase markedly since 2000[1], and ownership of long-lasting insecticidal nets(LLIN) in Ethiopia has increased dramatically in the last
few years [2,3]. After an initial peak in ownership anduse shortly after distribution, net ownership and usehave been observed to drop off in several countries [4,5].Clearly, net ownership is a necessary prerequisite for
net use. However, whether or not a net owner will use anet every night, some nights, or not at all depends oncomplex multi-level interactions between individualcharacteristics, household characteristics, social and cul-tural factors, community-level factors, aspects of the
* Correspondence: [email protected]† Contributed equally1The Carter Center, Atlanta, GA, USAFull list of author information is available at the end of the article
Graves et al. Malaria Journal 2011, 10:354http://www.malariajournal.com/content/10/1/354
© 2011 Graves et al; licensee BioMed Central Ltd. This is an open access article distributed under the terms of the creative commonsattribution license, which permits unrestricted use, distribution, and reproduction in any medium, provided the original work isproperly cited.
physical environment and characteristics of the netitself.In Ethiopia, a decline was observed in net use in
households owning nets between two representativehousehold surveys conducted approximately one yearapart, and this did not appear to be associated with dif-ferences in sampling or any climatic or seasonal differ-ences between the survey years [3]. To investigatefurther the reasons for the decline, characteristics ofnets that may be impacting their use in Ethiopia werestudied. Between 2006 and 2007, the proportion ofhouseholds owning at least one net increased dramati-cally from 19.6% to 65.6%, but the proportion of netsused the previous night in households owning netsdecreased from 85.1% to 56.0% [3,6]. In the net levelanalysis, factors independently associated in both sur-veys with reduced likelihood that a net would be usedwere: increasing net age, increasing damage of nets,increasing household net density (nets/person), andincreasing altitude (> 2,000 m). Factors associated withincreased likelihood of a net being used were: increasingwealth index (at both surveys), LLIN net type (in 2006),and household status of indoor residual spraying withinsecticide (in 2007) [6].At the individual level, factors influencing net use
have been reported to include age and gender [5,7-10],education, occupation/livelihood [11-13], degree of con-trol over household decision-making [14], malariaknowledge, beliefs and risk perceptions [5,15-21], per-ceived benefits and disadvantages of nets [5,17,18,21],trust in health workers providing health education andLLINs [22], knowledge of appropriate net use/care prac-tices, and net-hanging skills [23-25]. Household leveldeterminants of net use include household size andcomposition [14], the number of children under fiveyears of age (U5) in the household, intra-householdsleeping arrangements [5,13,26], household structureand space [5,7,9,18,26,27], household decision-makingprocesses and power structures [14], and use of othervector control measures [14,19,28]. At the communitylevel, social norms and values [13], cultural beliefs andpractices [13,20], mechanisms of LLIN distribution anddistance to LLIN suppliers [14,20], rumours aboutLLINs [20] and social support and pressure [24] all havethe potential to influence net use by individuals andwithin households. For example, white nets may beassociated with burial shrouds and death, and free netsmay be regarded as toxic or even deliberately harmful torecipient groups [20]. Important environmental factorsinclude climate and temperature [7,18], perceived mos-quito density [19], availability and proximity of land forfarming and grazing livestock [13]. Characteristics of thenets themselves, such as their cost, size, shape, colour,physical condition, type of insecticide used and
perceived durability have also been shown to influencenet use [7,19,20], and are likely to interact with indivi-dual, household, community and environmental factorsin complex ways to determine attitudes towards net useand the feasibility of net use for a given individual orhousehold.A recent review of literature on determinants of net
use highlights the need for greater understanding ofthese determinants and the relationships between them[29]. In addition, net use among those who own nets iscommonly interrupted by temporary, periodic or infre-quent conditions, which can inhibit net use even amongregular net users. These conditions include travelling,night work, sleeping in the fields during planting or har-vest seasons or while tending livestock, attending late-night social events, disruption of usual sleeping arrange-ments, net unavailability due to washing or dirtiness,extreme fatigue, labour pains, illness or forgetfulness[13,27,30-32].This study builds on a previous analysis at the net
level [6] of the results of two sequential surveys inEthiopia [3] that demonstrated certain modifiable factorsconcerning net use, such as improved net care andreplacement. In the previous study, the outcome wasuse or non-use for each net [6], whereas here factorsassociated with the outcome of individual use or non-use were investigated. The current study adjusts forboth household and net level factors, including theimportant net age and condition characteristics identi-fied previously [6]. In contrast to most previous studies,including some in Ethiopia [19,33,34], this analysis wasnot restricted to high risk groups (children U5 and preg-nant women), but examined net use in all age groupsincluding the 5-24 year old school-age children andyoung adults, women of reproductive age, and adultsage 50 years and older. School-age children are a groupgenerally least protected by insecticide-impregnated netsin Africa [35], including Ethiopia [9].Since availability of a net in the household is a prere-
quisite for use, only those households owning at leastone net are included in this analysis, to avoid biasingthe results by lack of net availability in some house-holds. Net density (i.e. number of nets per person ineach household) is also used to account for differinghousehold sizes and intra-household access to nets. Thegoal of this study is to identify under-served groups andmodifiable factors that could be used to better targetefforts to increase net use and, hence, assist in long-term reduction of malaria transmission in Ethiopia.
MethodsThe study setting and surveysThe characteristics, survey design and sampling for thetwo surveys analysed here have been described
Graves et al. Malaria Journal 2011, 10:354http://www.malariajournal.com/content/10/1/354
Page 2 of 12
previously [6]. Briefly, the analysis focused on the regio-nal states of Amhara, Oromia and Southern Nations,Nationalities and Peoples’ (SNNPR) of Ethiopia. For thebaseline survey in 2006, a multi-stage cluster randomsampling with probability proportional to populationsize was used to select 224 clusters with 25 householdsin each cluster. For the Malaria Indicator Survey (MIS)in 2007, a nationally representative sample was selectedusing a two-stage design stratified by three domains:areas below 1,500 m, rural areas between 1,500 m and2,500 m, and urban areas between 1,500 m and 2,500m. To enable comparisons with the baseline survey,only MIS 2007 clusters for three regional states,Amhara, Oromia and SNNPR, were included in the ana-lysis presented here. This is referred to as the MIS 3R2007 sub-sample and comprised 245 clusters defined ascensus enumeration areas (EA). A simple random sam-ple of 25 households was selected from all mappedhouseholds in each EA, with altitude and location ofeach household recorded using personal digital assis-tants equipped with Global Positioning Systemcapability.
Outcome and risk factor measurementThe survey questionnaires were both based on the MISHousehold Questionnaire modified for the local condi-tions to include socio-economic factors [36] as has beendescribed previously [37]. The questionnaire was trans-lated and conducted in Amharic language and pilot-tested in a non-survey cluster to determine the validityof the pre-coded answers. Interviews were conductedwith the head of household, or another adult if the headof household was absent or unable to respond for anyreason.During the interviews, age and gender of all residents
was recorded; and the number of rooms (2006) or sleep-ing spaces (2007) noted. The respondents were askedabout mosquito nets in their household: presence, num-ber, type and who used which nets the previous night.Both surveys used net rosters to associate individualswith specific observed nets.Reports of recent (within the last 12 months) indoor
residual spraying of the household with insecticide wererecorded. At MIS 2007, women of reproductive agecompleted the malaria knowledge questionnaire whichincluded questions assessing knowledge of the cause,symptoms, danger signs, and preventive measures ofmalaria.
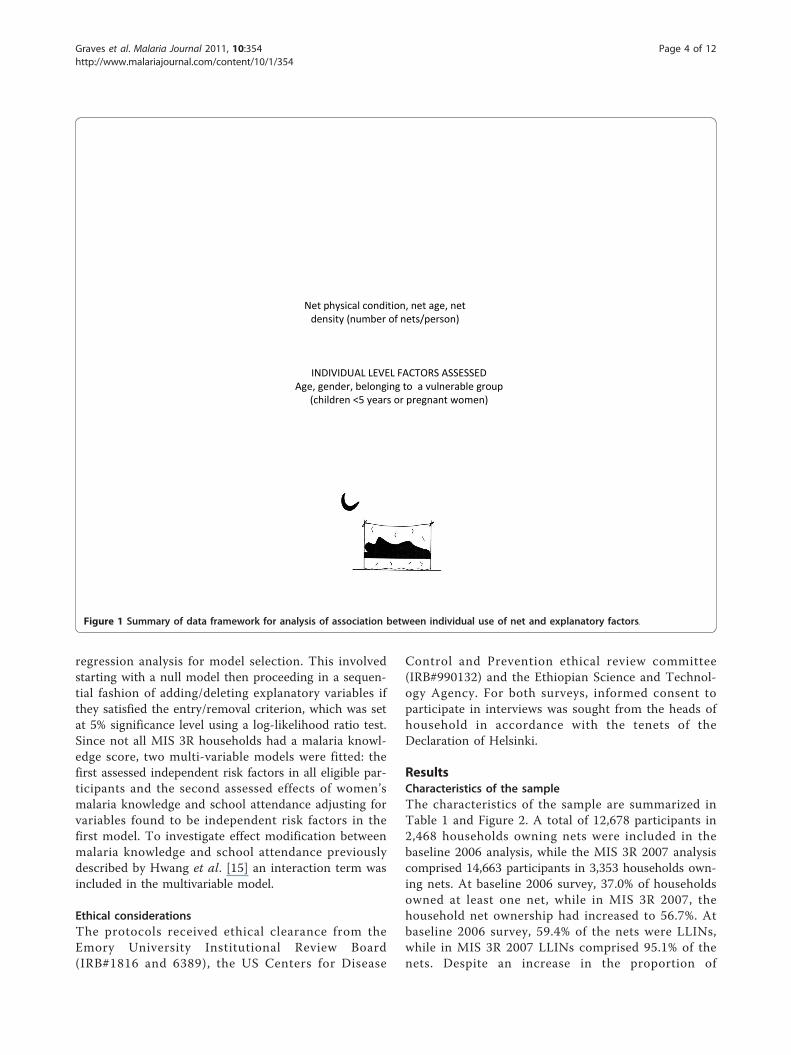
Statistical methodsFigure 1 summarizes the framework for analysis of asso-ciation between use of net and explanatory factors. Theanalysis was restricted to participants living in house-holds owning at least one net. Each survey was
considered separately. The reported use (or not) of a netby individuals the previous night was the dependentvariable. Since this analysis was at the individual level,in order to examine characteristics of all nets in thehousehold, including those not slept under, we devel-oped summary variables for the age and condition ofthe nets in each household. Households with nets wereclassified as having ‘none’, ‘some’ or ‘all’ nets in goodcondition (i.e. a net without any holes). Proportion ofnets older than one year was defined as households hav-ing ‘none’, ‘some’ or ‘all’ nets for 12 months or more.Net density was calculated by dividing the number ofnets in a household by the number of people in thehousehold.The household wealth index was derived from relevant
household characteristics using principal componentsanalysis as previously described [38] and terciles defined(poorest, middle, richest). For the MIS 3R 2007, malariaknowledge score was derived based on methods pre-viously described by Hwang et al. [15]. In brief, fromthe malaria knowledge questionnaire, a compositemalaria knowledge score was calculated for each womanwhere every correct answer received a single point. Themaximum knowledge score achieved out of 3,055women was 18, but the median was 4 and 97% ofwomen scored less than 10. Most households (2,392 of2,701 or 89%) had only one woman respondent, 232(10%) had two, 30 (1.1%) had three, 6 (0.2%) had four,and 1 (0.04%) had five respondents. To account forhouseholds that had more than one woman completingthe malaria knowledge questionnaire (11% of 2,701households), a mean malaria knowledge score was gen-erated for every household and categorized into terciles(0-1, 2-4, and ≥ 5). School attendance was only obtainedfor women of reproductive age; school attendance wasclassified for a household as ‘Yes’ if any woman in thehousehold had attended school.Statistical analysis was conducted using Stata 8.2
(Stata Corporation, College Station, Texas). Descriptivestatistics were used to examine the characteristics of thesample, and prevalence of outcomes and explanatoryfactors. To account for differences in the samplingdesign, prevalence estimates were adjusted for samplingweights. To investigate the association of reported netuse by individuals the previous night and explanatoryfactors, hierarchical regression models were developedusing generalized linear latent and mixed models(GLLAMM) [39]. The multi-level structure ofGLLAMM allowed for non-independence of the house-hold variables, enabled clustering of net observationswithin households and clusters, and allowed for variabil-ity at household and cluster levels. Univariate analysiswas conducted for each potential explanatory factor.Multi-variable models were then developed by stepwise
Graves et al. Malaria Journal 2011, 10:354http://www.malariajournal.com/content/10/1/354
Page 3 of 12
regression analysis for model selection. This involvedstarting with a null model then proceeding in a sequen-tial fashion of adding/deleting explanatory variables ifthey satisfied the entry/removal criterion, which was setat 5% significance level using a log-likelihood ratio test.Since not all MIS 3R households had a malaria knowl-edge score, two multi-variable models were fitted: thefirst assessed independent risk factors in all eligible par-ticipants and the second assessed effects of women’smalaria knowledge and school attendance adjusting forvariables found to be independent risk factors in thefirst model. To investigate effect modification betweenmalaria knowledge and school attendance previouslydescribed by Hwang et al. [15] an interaction term wasincluded in the multivariable model.
Ethical considerationsThe protocols received ethical clearance from theEmory University Institutional Review Board(IRB#1816 and 6389), the US Centers for Disease
Control and Prevention ethical review committee(IRB#990132) and the Ethiopian Science and Technol-ogy Agency. For both surveys, informed consent toparticipate in interviews was sought from the heads ofhousehold in accordance with the tenets of theDeclaration of Helsinki.
ResultsCharacteristics of the sampleThe characteristics of the sample are summarized inTable 1 and Figure 2. A total of 12,678 participants in2,468 households owning nets were included in thebaseline 2006 analysis, while the MIS 3R 2007 analysiscomprised 14,663 participants in 3,353 households own-ing nets. At baseline 2006 survey, 37.0% of householdsowned at least one net, while in MIS 3R 2007, thehousehold net ownership had increased to 56.7%. Atbaseline 2006 survey, 59.4% of the nets were LLINs,while in MIS 3R 2007 LLINs comprised 95.1% of thenets. Despite an increase in the proportion of
Figure 1 Summary of data framework for analysis of association between individual use of net and explanatory factors.
Graves et al. Malaria Journal 2011, 10:354http://www.malariajournal.com/content/10/1/354
Page 4 of 12
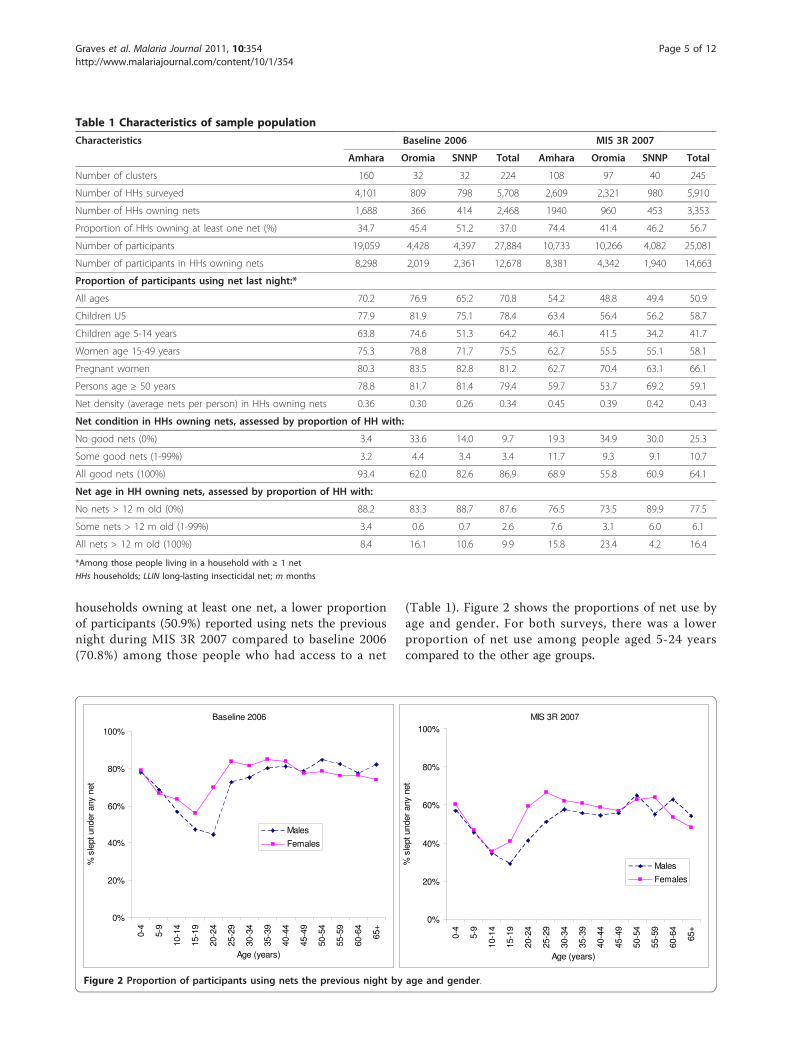
households owning at least one net, a lower proportionof participants (50.9%) reported using nets the previousnight during MIS 3R 2007 compared to baseline 2006(70.8%) among those people who had access to a net
(Table 1). Figure 2 shows the proportions of net use byage and gender. For both surveys, there was a lowerproportion of net use among people aged 5-24 yearscompared to the other age groups.
Table 1 Characteristics of sample population
Characteristics Baseline 2006 MIS 3R 2007
Amhara Oromia SNNP Total Amhara Oromia SNNP Total
Number of clusters 160 32 32 224 108 97 40 245
Number of HHs surveyed 4,101 809 798 5,708 2,609 2,321 980 5,910
Number of HHs owning nets 1,688 366 414 2,468 1940 960 453 3,353
Proportion of HHs owning at least one net (%) 34.7 45.4 51.2 37.0 74.4 41.4 46.2 56.7
Number of participants 19,059 4,428 4,397 27,884 10,733 10,266 4,082 25,081
Number of participants in HHs owning nets 8,298 2,019 2,361 12,678 8,381 4,342 1,940 14,663
Proportion of participants using net last night:*
All ages 70.2 76.9 65.2 70.8 54.2 48.8 49.4 50.9
Children U5 77.9 81.9 75.1 78.4 63.4 56.4 56.2 58.7
Children age 5-14 years 63.8 74.6 51.3 64.2 46.1 41.5 34.2 41.7
Women age 15-49 years 75.3 78.8 71.7 75.5 62.7 55.5 55.1 58.1
Pregnant women 80.3 83.5 82.8 81.2 62.7 70.4 63.1 66.1
Persons age ≥ 50 years 78.8 81.7 81.4 79.4 59.7 53.7 69.2 59.1
Net density (average nets per person) in HHs owning nets 0.36 0.30 0.26 0.34 0.45 0.39 0.42 0.43
Net condition in HHs owning nets, assessed by proportion of HH with:
No good nets (0%) 3.4 33.6 14.0 9.7 19.3 34.9 30.0 25.3
Some good nets (1-99%) 3.2 4.4 3.4 3.4 11.7 9.3 9.1 10.7
All good nets (100%) 93.4 62.0 82.6 86.9 68.9 55.8 60.9 64.1
Net age in HH owning nets, assessed by proportion of HH with:
No nets > 12 m old (0%) 88.2 83.3 88.7 87.6 76.5 73.5 89.9 77.5
Some nets > 12 m old (1-99%) 3.4 0.6 0.7 2.6 7.6 3.1 6.0 6.1
All nets > 12 m old (100%) 8.4 16.1 10.6 9.9 15.8 23.4 4.2 16.4
*Among those people living in a household with ≥ 1 net
HHs households; LLIN long-lasting insecticidal net; m months
Baseline 2006
0%
20%
40%
60%
80%
100%
0-4
5-9
10-1
4
15-1
9
20-2
4
25-2
9
30-3
4
35-3
9
40-4
4
45-4
9
50-5
4
55-5
9
60-6
4
65+
Age (years)
% s
lept
und
er a
ny n
et
Males
Females
MIS 3R 2007
0%
20%
40%
60%
80%
100%
0-4
5-9
10-1
4
15-1
9
20-2
4
25-2
9
30-3
4
35-3
9
40-4
4
45-4
9
50-5
4
55-5
9
60-6
4
65+
Age (years)
% s
lept
und
er a
ny n
et
Males
Females
Figure 2 Proportion of participants using nets the previous night by age and gender.
Graves et al. Malaria Journal 2011, 10:354http://www.malariajournal.com/content/10/1/354
Page 5 of 12
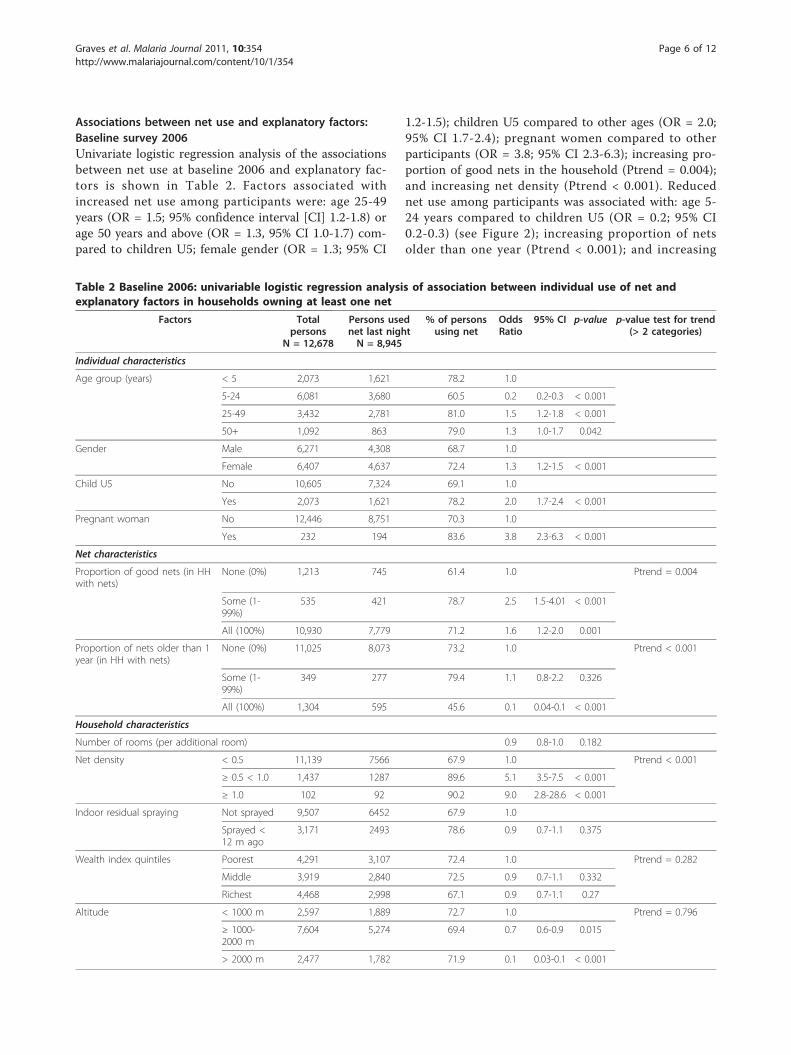
Associations between net use and explanatory factors:Baseline survey 2006Univariate logistic regression analysis of the associationsbetween net use at baseline 2006 and explanatory fac-tors is shown in Table 2. Factors associated withincreased net use among participants were: age 25-49years (OR = 1.5; 95% confidence interval [CI] 1.2-1.8) orage 50 years and above (OR = 1.3, 95% CI 1.0-1.7) com-pared to children U5; female gender (OR = 1.3; 95% CI
1.2-1.5); children U5 compared to other ages (OR = 2.0;95% CI 1.7-2.4); pregnant women compared to otherparticipants (OR = 3.8; 95% CI 2.3-6.3); increasing pro-portion of good nets in the household (Ptrend = 0.004);and increasing net density (Ptrend < 0.001). Reducednet use among participants was associated with: age 5-24 years compared to children U5 (OR = 0.2; 95% CI0.2-0.3) (see Figure 2); increasing proportion of netsolder than one year (Ptrend < 0.001); and increasing
Table 2 Baseline 2006: univariable logistic regression analysis of association between individual use of net andexplanatory factors in households owning at least one net
Factors Totalpersons
N = 12,678
Persons usednet last nightN = 8,945
% of personsusing net
OddsRatio
95% CI p-value p-value test for trend(> 2 categories)
Individual characteristics
Age group (years) < 5 2,073 1,621 78.2 1.0
5-24 6,081 3,680 60.5 0.2 0.2-0.3 < 0.001
25-49 3,432 2,781 81.0 1.5 1.2-1.8 < 0.001
50+ 1,092 863 79.0 1.3 1.0-1.7 0.042
Gender Male 6,271 4,308 68.7 1.0
Female 6,407 4,637 72.4 1.3 1.2-1.5 < 0.001
Child U5 No 10,605 7,324 69.1 1.0
Yes 2,073 1,621 78.2 2.0 1.7-2.4 < 0.001
Pregnant woman No 12,446 8,751 70.3 1.0
Yes 232 194 83.6 3.8 2.3-6.3 < 0.001
Net characteristics
Proportion of good nets (in HHwith nets)
None (0%) 1,213 745 61.4 1.0 Ptrend = 0.004
Some (1-99%)
535 421 78.7 2.5 1.5-4.01 < 0.001
All (100%) 10,930 7,779 71.2 1.6 1.2-2.0 0.001
Proportion of nets older than 1year (in HH with nets)
None (0%) 11,025 8,073 73.2 1.0 Ptrend < 0.001
Some (1-99%)
349 277 79.4 1.1 0.8-2.2 0.326
All (100%) 1,304 595 45.6 0.1 0.04-0.1 < 0.001
Household characteristics
Number of rooms (per additional room) 0.9 0.8-1.0 0.182
Net density < 0.5 11,139 7566 67.9 1.0 Ptrend < 0.001
≥ 0.5 < 1.0 1,437 1287 89.6 5.1 3.5-7.5 < 0.001
≥ 1.0 102 92 90.2 9.0 2.8-28.6 < 0.001
Indoor residual spraying Not sprayed 9,507 6452 67.9 1.0
Sprayed <12 m ago
3,171 2493 78.6 0.9 0.7-1.1 0.375
Wealth index quintiles Poorest 4,291 3,107 72.4 1.0 Ptrend = 0.282
Middle 3,919 2,840 72.5 0.9 0.7-1.1 0.332
Richest 4,468 2,998 67.1 0.9 0.7-1.1 0.27
Altitude < 1000 m 2,597 1,889 72.7 1.0 Ptrend = 0.796
≥ 1000-2000 m
7,604 5,274 69.4 0.7 0.6-0.9 0.015
> 2000 m 2,477 1,782 71.9 0.1 0.03-0.1 < 0.001
Graves et al. Malaria Journal 2011, 10:354http://www.malariajournal.com/content/10/1/354
Page 6 of 12
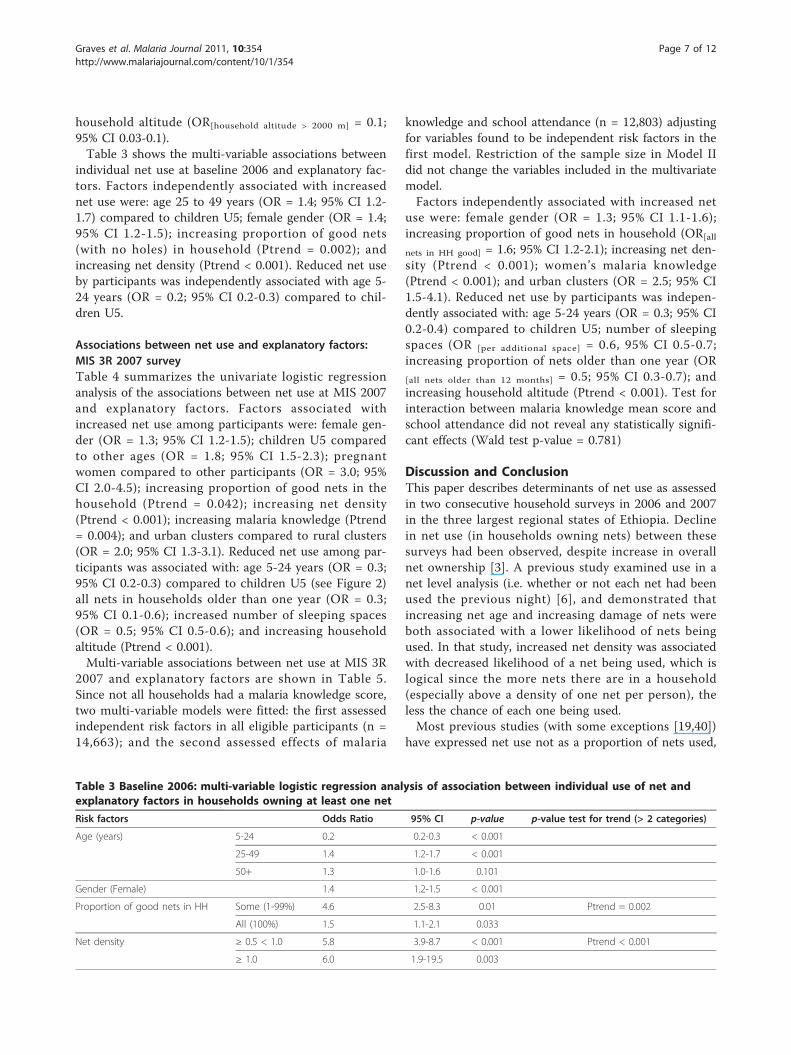
household altitude (OR[household altitude > 2000 m] = 0.1;95% CI 0.03-0.1).Table 3 shows the multi-variable associations between
individual net use at baseline 2006 and explanatory fac-tors. Factors independently associated with increasednet use were: age 25 to 49 years (OR = 1.4; 95% CI 1.2-1.7) compared to children U5; female gender (OR = 1.4;95% CI 1.2-1.5); increasing proportion of good nets(with no holes) in household (Ptrend = 0.002); andincreasing net density (Ptrend < 0.001). Reduced net useby participants was independently associated with age 5-24 years (OR = 0.2; 95% CI 0.2-0.3) compared to chil-dren U5.
Associations between net use and explanatory factors:MIS 3R 2007 surveyTable 4 summarizes the univariate logistic regressionanalysis of the associations between net use at MIS 2007and explanatory factors. Factors associated withincreased net use among participants were: female gen-der (OR = 1.3; 95% CI 1.2-1.5); children U5 comparedto other ages (OR = 1.8; 95% CI 1.5-2.3); pregnantwomen compared to other participants (OR = 3.0; 95%CI 2.0-4.5); increasing proportion of good nets in thehousehold (Ptrend = 0.042); increasing net density(Ptrend < 0.001); increasing malaria knowledge (Ptrend= 0.004); and urban clusters compared to rural clusters(OR = 2.0; 95% CI 1.3-3.1). Reduced net use among par-ticipants was associated with: age 5-24 years (OR = 0.3;95% CI 0.2-0.3) compared to children U5 (see Figure 2)all nets in households older than one year (OR = 0.3;95% CI 0.1-0.6); increased number of sleeping spaces(OR = 0.5; 95% CI 0.5-0.6); and increasing householdaltitude (Ptrend < 0.001).Multi-variable associations between net use at MIS 3R
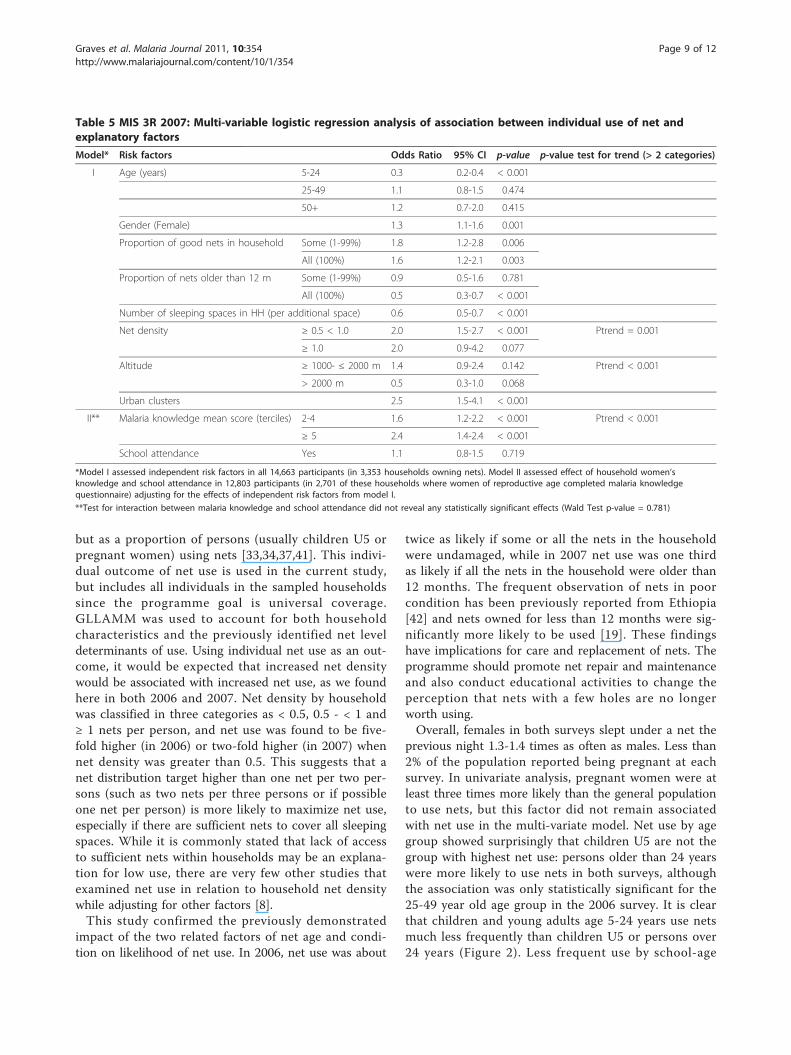
2007 and explanatory factors are shown in Table 5.Since not all households had a malaria knowledge score,two multi-variable models were fitted: the first assessedindependent risk factors in all eligible participants (n =14,663); and the second assessed effects of malaria
knowledge and school attendance (n = 12,803) adjustingfor variables found to be independent risk factors in thefirst model. Restriction of the sample size in Model IIdid not change the variables included in the multivariatemodel.Factors independently associated with increased net
use were: female gender (OR = 1.3; 95% CI 1.1-1.6);increasing proportion of good nets in household (OR[all
nets in HH good] = 1.6; 95% CI 1.2-2.1); increasing net den-sity (Ptrend < 0.001); women’s malaria knowledge(Ptrend < 0.001); and urban clusters (OR = 2.5; 95% CI1.5-4.1). Reduced net use by participants was indepen-dently associated with: age 5-24 years (OR = 0.3; 95% CI0.2-0.4) compared to children U5; number of sleepingspaces (OR [per additional space] = 0.6, 95% CI 0.5-0.7;increasing proportion of nets older than one year (OR
[all nets older than 12 months] = 0.5; 95% CI 0.3-0.7); andincreasing household altitude (Ptrend < 0.001). Test forinteraction between malaria knowledge mean score andschool attendance did not reveal any statistically signifi-cant effects (Wald test p-value = 0.781)
Discussion and ConclusionThis paper describes determinants of net use as assessedin two consecutive household surveys in 2006 and 2007in the three largest regional states of Ethiopia. Declinein net use (in households owning nets) between thesesurveys had been observed, despite increase in overallnet ownership [3]. A previous study examined use in anet level analysis (i.e. whether or not each net had beenused the previous night) [6], and demonstrated thatincreasing net age and increasing damage of nets wereboth associated with a lower likelihood of nets beingused. In that study, increased net density was associatedwith decreased likelihood of a net being used, which islogical since the more nets there are in a household(especially above a density of one net per person), theless the chance of each one being used.Most previous studies (with some exceptions [19,40])
have expressed net use not as a proportion of nets used,
Table 3 Baseline 2006: multi-variable logistic regression analysis of association between individual use of net andexplanatory factors in households owning at least one net
Risk factors Odds Ratio 95% CI p-value p-value test for trend (> 2 categories)
Age (years) 5-24 0.2 0.2-0.3 < 0.001
25-49 1.4 1.2-1.7 < 0.001
50+ 1.3 1.0-1.6 0.101
Gender (Female) 1.4 1.2-1.5 < 0.001
Proportion of good nets in HH Some (1-99%) 4.6 2.5-8.3 0.01 Ptrend = 0.002
All (100%) 1.5 1.1-2.1 0.033
Net density ≥ 0.5 < 1.0 5.8 3.9-8.7 < 0.001 Ptrend < 0.001
≥ 1.0 6.0 1.9-19.5 0.003
Graves et al. Malaria Journal 2011, 10:354http://www.malariajournal.com/content/10/1/354
Page 7 of 12
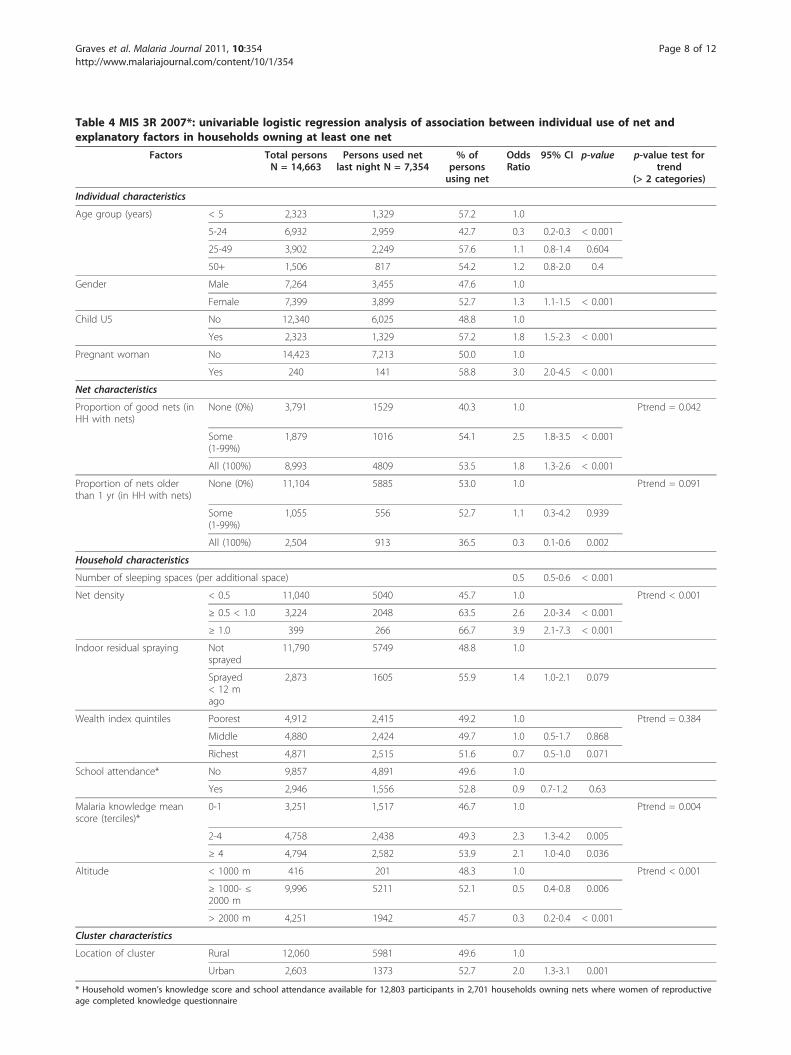
Table 4 MIS 3R 2007*: univariable logistic regression analysis of association between individual use of net andexplanatory factors in households owning at least one net
Factors Total personsN = 14,663
Persons used netlast night N = 7,354
% ofpersonsusing net
OddsRatio
95% CI p-value p-value test fortrend
(> 2 categories)
Individual characteristics
Age group (years) < 5 2,323 1,329 57.2 1.0
5-24 6,932 2,959 42.7 0.3 0.2-0.3 < 0.001
25-49 3,902 2,249 57.6 1.1 0.8-1.4 0.604
50+ 1,506 817 54.2 1.2 0.8-2.0 0.4
Gender Male 7,264 3,455 47.6 1.0
Female 7,399 3,899 52.7 1.3 1.1-1.5 < 0.001
Child U5 No 12,340 6,025 48.8 1.0
Yes 2,323 1,329 57.2 1.8 1.5-2.3 < 0.001
Pregnant woman No 14,423 7,213 50.0 1.0
Yes 240 141 58.8 3.0 2.0-4.5 < 0.001
Net characteristics
Proportion of good nets (inHH with nets)
None (0%) 3,791 1529 40.3 1.0 Ptrend = 0.042
Some(1-99%)
1,879 1016 54.1 2.5 1.8-3.5 < 0.001
All (100%) 8,993 4809 53.5 1.8 1.3-2.6 < 0.001
Proportion of nets olderthan 1 yr (in HH with nets)
None (0%) 11,104 5885 53.0 1.0 Ptrend = 0.091
Some(1-99%)
1,055 556 52.7 1.1 0.3-4.2 0.939
All (100%) 2,504 913 36.5 0.3 0.1-0.6 0.002
Household characteristics
Number of sleeping spaces (per additional space) 0.5 0.5-0.6 < 0.001
Net density < 0.5 11,040 5040 45.7 1.0 Ptrend < 0.001
≥ 0.5 < 1.0 3,224 2048 63.5 2.6 2.0-3.4 < 0.001
≥ 1.0 399 266 66.7 3.9 2.1-7.3 < 0.001
Indoor residual spraying Notsprayed
11,790 5749 48.8 1.0
Sprayed< 12 mago
2,873 1605 55.9 1.4 1.0-2.1 0.079
Wealth index quintiles Poorest 4,912 2,415 49.2 1.0 Ptrend = 0.384
Middle 4,880 2,424 49.7 1.0 0.5-1.7 0.868
Richest 4,871 2,515 51.6 0.7 0.5-1.0 0.071
School attendance* No 9,857 4,891 49.6 1.0
Yes 2,946 1,556 52.8 0.9 0.7-1.2 0.63
Malaria knowledge meanscore (terciles)*
0-1 3,251 1,517 46.7 1.0 Ptrend = 0.004
2-4 4,758 2,438 49.3 2.3 1.3-4.2 0.005
≥ 4 4,794 2,582 53.9 2.1 1.0-4.0 0.036
Altitude < 1000 m 416 201 48.3 1.0 Ptrend < 0.001
≥ 1000- ≤2000 m
9,996 5211 52.1 0.5 0.4-0.8 0.006
> 2000 m 4,251 1942 45.7 0.3 0.2-0.4 < 0.001
Cluster characteristics
Location of cluster Rural 12,060 5981 49.6 1.0
Urban 2,603 1373 52.7 2.0 1.3-3.1 0.001
* Household women’s knowledge score and school attendance available for 12,803 participants in 2,701 households owning nets where women of reproductiveage completed knowledge questionnaire
Graves et al. Malaria Journal 2011, 10:354http://www.malariajournal.com/content/10/1/354
Page 8 of 12
but as a proportion of persons (usually children U5 orpregnant women) using nets [33,34,37,41]. This indivi-dual outcome of net use is used in the current study,but includes all individuals in the sampled householdssince the programme goal is universal coverage.GLLAMM was used to account for both householdcharacteristics and the previously identified net leveldeterminants of use. Using individual net use as an out-come, it would be expected that increased net densitywould be associated with increased net use, as we foundhere in both 2006 and 2007. Net density by householdwas classified in three categories as < 0.5, 0.5 - < 1 and≥ 1 nets per person, and net use was found to be five-fold higher (in 2006) or two-fold higher (in 2007) whennet density was greater than 0.5. This suggests that anet distribution target higher than one net per two per-sons (such as two nets per three persons or if possibleone net per person) is more likely to maximize net use,especially if there are sufficient nets to cover all sleepingspaces. While it is commonly stated that lack of accessto sufficient nets within households may be an explana-tion for low use, there are very few other studies thatexamined net use in relation to household net densitywhile adjusting for other factors [8].This study confirmed the previously demonstrated
impact of the two related factors of net age and condi-tion on likelihood of net use. In 2006, net use was about
twice as likely if some or all the nets in the householdwere undamaged, while in 2007 net use was one thirdas likely if all the nets in the household were older than12 months. The frequent observation of nets in poorcondition has been previously reported from Ethiopia[42] and nets owned for less than 12 months were sig-nificantly more likely to be used [19]. These findingshave implications for care and replacement of nets. Theprogramme should promote net repair and maintenanceand also conduct educational activities to change theperception that nets with a few holes are no longerworth using.Overall, females in both surveys slept under a net the
previous night 1.3-1.4 times as often as males. Less than2% of the population reported being pregnant at eachsurvey. In univariate analysis, pregnant women were atleast three times more likely than the general populationto use nets, but this factor did not remain associatedwith net use in the multi-variate model. Net use by agegroup showed surprisingly that children U5 are not thegroup with highest net use: persons older than 24 yearswere more likely to use nets in both surveys, althoughthe association was only statistically significant for the25-49 year old age group in the 2006 survey. It is clearthat children and young adults age 5-24 years use netsmuch less frequently than children U5 or persons over24 years (Figure 2). Less frequent use by school-age
Table 5 MIS 3R 2007: Multi-variable logistic regression analysis of association between individual use of net andexplanatory factors
Model* Risk factors Odds Ratio 95% CI p-value p-value test for trend (> 2 categories)
I Age (years) 5-24 0.3 0.2-0.4 < 0.001
25-49 1.1 0.8-1.5 0.474
50+ 1.2 0.7-2.0 0.415
Gender (Female) 1.3 1.1-1.6 0.001
Proportion of good nets in household Some (1-99%) 1.8 1.2-2.8 0.006
All (100%) 1.6 1.2-2.1 0.003
Proportion of nets older than 12 m Some (1-99%) 0.9 0.5-1.6 0.781
All (100%) 0.5 0.3-0.7 < 0.001
Number of sleeping spaces in HH (per additional space) 0.6 0.5-0.7 < 0.001
Net density ≥ 0.5 < 1.0 2.0 1.5-2.7 < 0.001 Ptrend = 0.001
≥ 1.0 2.0 0.9-4.2 0.077
Altitude ≥ 1000- ≤ 2000 m 1.4 0.9-2.4 0.142 Ptrend < 0.001
> 2000 m 0.5 0.3-1.0 0.068
Urban clusters 2.5 1.5-4.1 < 0.001
II** Malaria knowledge mean score (terciles) 2-4 1.6 1.2-2.2 < 0.001 Ptrend < 0.001
≥ 5 2.4 1.4-2.4 < 0.001
School attendance Yes 1.1 0.8-1.5 0.719
*Model I assessed independent risk factors in all 14,663 participants (in 3,353 households owning nets). Model II assessed effect of household women’sknowledge and school attendance in 12,803 participants (in 2,701 of these households where women of reproductive age completed malaria knowledgequestionnaire) adjusting for the effects of independent risk factors from model I.
**Test for interaction between malaria knowledge and school attendance did not reveal any statistically significant effects (Wald Test p-value = 0.781)
Graves et al. Malaria Journal 2011, 10:354http://www.malariajournal.com/content/10/1/354
Page 9 of 12
children has been observed in many other African coun-ties [35] and it would be interesting to conduct a studyof net use in which children’s own school attendance,access to nets, and knowledge are taken into account,rather than using proxies from women in their house-holds. It is critical that more attention is paid to increas-ing net use in children, teenagers and young adults (e.g.perhaps by school-based education campaigns and activ-ities), since they likely contribute significantly to trans-mission and are at risk of severe disease, if infected.The finding of higher net use in urban compared to
rural areas in MIS 2007 was surprising, since urbandwellers might be expected to associate net use with vil-lagers and rural life. However, another study in Ethiopia[19] observed the same higher use of LLIN in urbanareas. Possible reasons include: higher levels of educa-tion; potentially larger and more diverse social networksperhaps due to greater population density; or a moreprogressive attitude among urban dwellers leading toearlier adoption of unfamiliar strategies. Other potentialunmeasured factors (other than those for which weadjusted such as net density, socio-economic status,malaria knowledge, and IRS status) should be exploredfurther.Women’s malaria knowledge and school attendance
were assessed only in the MIS 3R 2007 survey, andexpressed as terciles of an index of correct scores,applied at the household level. The results shown heresupport those of Hwang et al. [15] and others [33,34]that increased women’s knowledge of malaria canimprove net use by individuals and/or members of theirhousehold. However, the interaction effect previouslydescribed [15], whereby higher women’s knowledge(score of > = 1) only increased net use in themselvesand their children U5 if the women had not attendedschool, was not observed here. This may be due to thedifferent outcome (net use in all ages), different quantifi-cation of knowledge scores (in terciles), or application ofwomen’s knowledge scores and school attendance at thehousehold level.Potential limitations of this study include the fact that
a number of other possible determinants of net usewere not assessed, including, but not limited to, percep-tions of malaria risk, the proportion of nets that werehanging, and the opinions or beliefs of householdersabout their ability to hang nets and/or difficulty of hang-ing nets in their homes. In addition, aspects of net con-dition other than the presence of holes (e.g. cleanliness,smell and perceived effectiveness of insecticide) thatmight affect a person’s choice to sleep under a net werenot measured. It may be that once the novelty of newlydistributed nets has worn off, people stop using netsbecause the practice grows tiresome and their risk per-ception returns to initial lower levels, suggesting the
need for sustained behaviour change communication.Differences in climate factors or seasonality between thetwo surveys are potential limitations, but a previousstudy examined this question extensively [3] and showedthat slight differences in survey timing in each year didnot result in important differences in rainfall or tem-perature conditions between the surveys. Differences insampling strategy between surveys were also examinedand were found to be highly unlikely to have introducedbias in the estimate of net use [3].Examining net use from both the net level [6] and the
individual level (present study) while restricting the datato only households owning nets enables adjustment forthe different levels of analysis (net, household, cluster)and avoidance of spurious associations, while using netdensity in the models allows accounting for changes innet ownership over time. Increasing availability of netswithin households (i.e. increasing net density), andimproving net condition while focusing on educationand promotion of net use, especially in school-age chil-dren and young adults in rural areas, are crucial areasfor intervention to ensure maximum net use and conse-quent reduction of malaria transmission.Despite large distribution of new nets between the
surveys, the pool of nets in households in 2007 wasolder and in less good condition than 2006 due to netsremaining from earlier distributions as well as rapidaccumulation of damage to nets [43]. Older nets in poorcondition are used less than new nets [5]. The studyraises important issues about the longevity of nets andwhen a net is considered ‘expired’ or no longer suitablefor use. More research on this issue is warranted sincefirstly nets considered to be too damaged may not beused; and secondly the accumulation of ‘expired’ nets inhouseholds would inflate estimates of net ownership instandard household surveys and net density estimates asused in this analysis. Qualitative research investigatingwhen households would consider nets unfit for use, anddetermining whether this expectation would be realistic- from an operational and programmatic perspective - isnecessary. Why damaged and unused nets are kept, orhow they are disposed of is also of interest. Such infor-mation would generate realistic assessments of averageusable net life and improve planning of sensible andsustainable replacement and communication strategiesinstead of blanket mass distributions at predeterminedintervals.
AcknowledgementsThe baseline survey was financially and technically supported by The CarterCenter and carried out in collaboration with the Amhara, Oromia and SNNPRegional Health Bureaus. The follow-up Malaria Indicator Survey 2007 wasthe result of joint support and efforts by multiple partners, including theFederal Ministry of Health of Ethiopia, The Carter Center, Malaria Control andEvaluation Partnership for Africa (MACEPA, a program at PATH), World Health
Graves et al. Malaria Journal 2011, 10:354http://www.malariajournal.com/content/10/1/354
Page 10 of 12
Organization (WHO), United Nations Children’s Fund (UNICEF), President’sMalaria Initiative [US Agency for International Development (USAID)/USCenters for Disease Control and Prevention (CDC)], the Ethiopia CentralStatistical Agency, Center for National Health Development in Ethiopia, andMalaria Consortium.This research was made possible through support provided by thePresident’s Malaria Initiative via the Office of Health, Infectious Diseases, andNutrition, Bureau for Global Health, US Agency for InternationalDevelopment, under the terms of an inter-agency agreement with CDC. Theopinions expressed herein are those of the author(s) and do not necessarilyreflect the views of the US Centers for Disease Control and Prevention, theUS Agency for International Development, or other employing organizationsor sources of funding.We are especially grateful to Minister Tedros Adhanom Gebreyesus and allthe persons who assisted in both surveys, including but not limited to:Laurent Bergeron, Hana Bilak, Brian Chirwa, Firew Demeke, WubishetDinkessa, Yeshewamebrat Ejigsemahu, Tekola Endeshaw, Kebede Etana,Gashu Fente, Anatoly Frolov, Khoti Gausi, Afework Hailemariam, Daddi Jima,Henok Kebede, Christopher Lungu, Ambachew Medhin, John Miller, RoryNefdt, Dereje Olana, Richard Steketee, Zerihun Tadesse, Tesfaye Teferri,Eskindir Tenaw, Abate Tilahun, Gedeon Yohannes, and Mulat Zerihun. Wethank Dr. Stephen Kaptoge, Department of Public Health and Primary Care,University of Cambridge, UK for statistical advice. We appreciate assistancefrom Stephanie Palmer in preparing Figure 1. The authors owe sinceregratitude to all the survey participants who gave freely of their time in thesurveys.
Author details1The Carter Center, Atlanta, GA, USA. 2University of Cambridge, Cambridge,UK. 3Centers for Disease Control and Prevention, Atlanta, GA, USA. 4GlobalHealth Group, University of California, San Francisco, CA, USA. 5MACEPA,Addis Ababa, Ethiopia. 6The Carter Center, Addis Ababa, Ethiopia. 7StrategicInformation Team, The Global Fund to Fight AIDS, Tuberculosis and Malaria,Chemin de Blandonnet 8, Geneva, 1214, Vernier, Switzerland. 8FederalMinistry of Health, Addis Ababa, Ethiopia. 9US Agency for InternationalDevelopment, Addis Ababa, Ethiopia. 10School of Public Health, TropicalMedicine and Rehabilitation Sciences, Faculty of Medicine, Health andMolecular Sciences, PO Box 6811, Cairns Qld 4870, Australia. 11InternationalTrachoma Initiative, The Task Force for Global Health, Ethio-China FriendshipRoad, Dire Dawa Building, 5th Floor, Room 301, PO Box 10001, Addis Ababa,Ethiopia.
Authors’ contributionsPG, JH, RR, FR, TG and PE conceived and planned the study; PG, JH, TG, AM,ES, ZT, AW and RR trained staff, carried out the survey and managed thedata; JN and PG undertook data analysis with input from JH, AM, and RR;PG, JN and AP wrote the paper with input from JH, AM, RR, FR, TG, ZT andPE; all authors approved the final draft.
Competing interestsThe authors declare that they have no competing interests.
Received: 5 August 2011 Accepted: 13 December 2011Published: 13 December 2011
References1. Noor AM, Mutheu JJ, Tatem AJ, Hay SI, Snow RW: Insecticide-treated net
coverage in Africa: mapping progress in 2000-07. Lancet 2009, 373:58-67.2. WHO: World Malaria Report 2010 Global Malaria Program; 2010.3. Shargie EB, Ngondi J, Graves PM, Getachew A, Hwang J, Gebre T,
Mosher AW, Ceccato P, Endeshaw T, Jima D, Tadesse Z, Tenaw E,Reithinger R, Emerson PM, Richards FO, Ghebreyesus TA: Rapid increase inownership and use of long-lasting insecticidal nets and decrease inprevalence of malaria in three regional States of Ethiopia (2006-2007). JTrop Med 2010, 750978, Epub 2010 Sep 23.
4. Garcia-Basteiro AL, Schwabe C, Aragon C, Baltazar G, Rehman AM, Matias A,Nseng G, Kleinschmidt I: Determinants of bed net use in children underfive and household bed net ownership on Bioko Island, EquatorialGuinea. Malar J 2011, 10:179.
5. Toé LP, Skovmand O, Dabire KR, Diabate A, Diallo Y, Guiguemde TR,Doannio JM, Akogbeto M, Baldet T, Gruenais ME: Decreased motivation in
the use of insecticide-treated nets in a malaria endemic area in BurkinaFaso. Malar J 2009, 8:175.
6. Ngondi JM, Graves PM, Gebre T, Mosher AW, Shargie EB, Emerson PM,Richards FO Jr: Which nets are being used: factors associated withmosquito net use in Amhara, Oromia and Southern Nations,Nationalities and Peoples’ Regions of Ethiopia. Malar J 2011, 10:92.
7. Alaii JA, Hawley WA, Kolczak MS, ter Kuile FO, Gimnig JE, Vulule JM,Odhacha A, Oloo AJ, Nahlen BL, Phillips-Howard PA: Factors affecting useof permethrin-treated bed nets during a randomized controlled trial inwestern Kenya. Am J Trop Med Hyg 2003, 68:137-141.
8. Eisele TP, Keating J, Littrell M, Larsen D, Macintyre K: Assessment ofinsecticide-treated bednet use among children and pregnant womenacross 15 countries using standardized national surveys. Am J Trop MedHyg 2009, 80:209-214.
9. Baume CA, Marin MC: Intra-household mosquito net use in Ethiopia,Ghana, Mali, Nigeria, Senegal, and Zambia: are nets being used? Who inthe household uses them? Am J Trop Med Hyg 2007, 77:963-971.
10. Rashed S, Johnson H, Dongier P, Moreau R, Lee C, Crepeau R, Lambert J,Jefremovas V, Schaffer C: Determinants of the Permethrin ImpregnatedBednets (PIB) in the Republic of Benin: the role of women in theacquisition and utilization of PIBs. Soc Sci Med 1999, 49:993-1005.
11. Thomson M, Connor S, Bennett S, D’Alessandro U, Milligan P, Aikins M,Langerock P, Jawara M, Greenwood B: Geographical perspectives onbednet use and malaria transmission in The Gambia, West Africa. Soc SciMed 1996, 43:101-112.
12. MacCormack CP, Snow RW: Gambian cultural preferences in the use ofinsecticide-impregnated bed nets. J Trop Med Hyg 1986, 89:295-302.
13. Dunn CE, Le Mare A, Makungu C: Malaria risk behaviours, socio-culturalpractices and rural livelihoods in southern Tanzania: implications forbednet usage. Soc Sci Med 2011, 72:408-417.
14. Wiseman V, Scott A, McElroy B, Conteh L, Stevens W: Determinants of bednet use in The Gambia: Implications for malaria control. Am J Trop MedHyg 2007, 76:830-836.
15. Hwang J, Graves PM, Jima D, Reithinger R, Kachur SP: Knowledge ofmalaria and its association with malaria-related behaviors–results fromthe Malaria Indicator Survey, Ethiopia, 2007. Plos One 2010, 5:e11692.
16. Hausmann-Muela S, Muela Ribera J, Mushi AK, Tanner M: Medicalsyncretism with reference to malaria in a Tanzanian community. Soc SciMed 2002, 55.
17. Adongo P, Kirkwood B, Kendall C: How local community knowledgeabout malaria affects insecticide treated net use in northern GhanaMIM-PA-238950. Acta Trop 2005, 95:S49-S50.
18. Ng’ang’a PN, Jayasinghe G, Kimani V, Shililu J, Kabutha C, Kabuage L,Githure J, Mutero C: Bed net use and associated factors in a rice farmingcommunity in Central Kenya. Malar J 2009, 8.
19. Baume CA, Reithinger R, Woldehanna S: Factors associated with use andnon-use of mosquito nets owned in Oromia and Amhara regional states,Ethiopia. Malar J 2009, 8:264.
20. Chuma J, Okungu V, Ntwiga J, Molyneux C: Towards achieving Abujatargets: identifying and addressing barriers to access and use ofinsecticides treated nets among the poorest populations in Kenya. BMCPublic Health 2010, 10:137.
21. Dye TD, Apondi R, Lugada ES, Kahn JG, Smith J, Othoro C: “Before we usedto get sick all the time": perceptions of malaria and use of long-lastinginsecticide-treated bed nets (LLINs) in a rural Kenyan community. MalarJ 2010, 9:345.
22. de Hoop T, van Kempen L: Trust in health providers as a catalyst formalaria prevention: hetergeneous impacts of health education in ruralGhana. Developing Economies 2010, 48:376-404.
23. Widmar M, Nagel CJ, Ho DY, Benziger PW, Hennig N: Determining andaddressing obstacles to the effective use of long-lasting insecticide-impregnated nets in rural Tanzania. Malar J 2009, 8.
24. Rickard DG, Dudovitz RN, Wong MD, Jen HC, Osborn RD, Fernandez HE,Donkor CI: Closing the gap between insecticide treated net ownershipand use for the prevention of malaria. Progress in community healthpartnerships: research, education, and action 2011, 5:123-131.
25. Cohee L, Mills LA, Kagaayi J, Jacobs I, Galiwango R, Ludigo J, Ssekasanvu J,Reynolds SJ: High retention and appropriate use of insecticide-treatednets distributed to HIV-affected households in Rakai, Uganda: resultsfrom interviews and home visits. Malar J 2009, 8:76.
Graves et al. Malaria Journal 2011, 10:354http://www.malariajournal.com/content/10/1/354
Page 11 of 12
26. Iwashita H, Dida G, Futami K, Sonye G, Kaneko S, Horio M, Kawada H,Maekawa Y, Aoki Y, Minakawa N: Sleeping arrangement and housestructure affect bed net use in villages along Lake Victoria. Malar J 2010,9.
27. Keating J, Macintyre K, Mbogo CM, Githure JI, Beier JC: Self-reportedmalaria and mosquito avoidance in relation to household risk factors ina Kenyan coastal city. J Biosoc Sci 2005, 37:761-771.
28. Edelu BO, Ikefuna AN, Emodi JI, Adimora GN: Awareness and use ofinsecticide-treated bed nets among children attending outpatient clinicat UNTH, Enugu - the need for an effective mobilization process. AfricanHealth Sciences 2010, 10:117-119.
29. Pulford J, Hetzel MW, Bryant M, Siba PM, Mueller I: Reported reasons fornot using a mosquito net when one is available: a review of thepublished literature. Malar J 2011, 10.
30. Alaii JA, van den Borne HW, Kachur SP, Mwenesi H, Vulule JM, Hawley WA,Meltzer MI, Nahlen BL, Phillips-Howard PA: Perceptions of bed nets andmalaria prevention before and after a randomized controlled trial ofpermethrin-treated bed nets in western Kenya. Am J Trop Med Hyg 2003,68:142-148.
31. Brieger WR, Ekanem OJ, Nwankwo E, Ezike VI, Robinson T, Sexton JD,Breman JG, Parker KA: Social and behavioural baseline for guidingimplementation of an efficacy trial of insecticide impregnated bed netsfor malaria control at nsukka, Nigeria. International quarterly of communityhealth education 1996, 16:47-61.
32. Pettifor A, Taylor E, Nku D, Duvall S, Tabala M, Meshnick S, Behets F: Bednet ownership, use and perceptions among women seeking antenatalcare in Kinshasa, Democratic Republic of the Congo (DRC):Opportunities for improved maternal and child health. BMC Public Health2008, 8.
33. Belay M, Deressa W: Use of insecticide treated nets by pregnant womenand associated factors in a pre-dominantly rural population in northernEthiopia. Trop Med Int Health 2008, 13:1303-1313.
34. Haileselassie B, Ali A: Assessment of insecticide treated nets coverage formalaria control in Kafta-Humera District, Tigray; Possession versus useby high-risk groups. Ethiop J Health Dev 2008, 22:259-267.
35. Noor AM, Kirui VC, Brooker SJ, Snow RW: The use of insecticide treatednets by age: implications for universal coverage in Africa. BMC PublicHealth 2009, 9:369.
36. Malaria RB: Malaria Indicator Survey: Basic documentation for surveydesign and implementation. Calverton MD: RBM Monitoring andEvaluation Research Group, WHO, UNICEF, Measure Evaluation, US Centersfor Disease Control and Prevention; 2005.
37. Jima D, Getachew A, Bilak H, Steketee RW, Emerson PM, Graves PM,Gebre T, Reithinger R, Hwang J: Malaria indicator survey 2007, Ethiopia:coverage and use of major malaria prevention and controlinterventions. Malar J 2010, 9:58.
38. Graves PM, Richards FO, Ngondi J, Emerson PM, Shargie EB, Endeshaw T,Ceccato P, Ejigsemahu Y, Mosher AW, Hailemariam A, Zerihun M, Teferi T,Ayele B, Mesele A, Yohannes G, Tilahun A, Gebre T: Individual, householdand environmental risk factors for malaria infection in Amhara, Oromiaand SNNP regions of Ethiopia. Trans R Soc Trop Med Hyg 2009,103:1211-1220.
39. Rebe-Hesketh S, Skrondal A, Pickles A: GLLAMM Manual (October 2004).Working Paper series Berkeley CA: UC Berkeley; 2004.
40. Fettene M, Balkew M, Gimblet C: Utilization, retention and bio-efficacystudies of PermaNet in selected villages in Buie and Fentalie districts ofEthiopia. Malar J 2009, 8:114.
41. Astatkie A, Feleke A: Utilization of insecticide treated nets in ArbaminchTown and the malarious villages of Arbaminch Zuria District, SouthernEthiopia. Ethiopian Journal of Health Development 2009, 24:15-24.
42. NetMark: Ethiopia Bednet Utilization Study: Why some nets owned arenot used. 2008.
43. Smith S, Brackery A, Yohannes G, Graves PM, Endeshaw T, Shargie EB,Mosher AW, Emerson PM, Gebre T: Monitoring the durability of long-lasting insecticidal bed nets in rural Ethiopia (abstract). Am J Trop MedHyg 2010, 83:180.
doi:10.1186/1475-2875-10-354Cite this article as: Graves et al.: Factors associated with mosquito netuse by individuals in households owning nets in Ethiopia. MalariaJournal 2011 10:354.
Submit your next manuscript to BioMed Centraland take full advantage of:
• Convenient online submission
• Thorough peer review
• No space constraints or color figure charges
• Immediate publication on acceptance
• Inclusion in PubMed, CAS, Scopus and Google Scholar
• Research which is freely available for redistribution
Submit your manuscript at www.biomedcentral.com/submit
Graves et al. Malaria Journal 2011, 10:354http://www.malariajournal.com/content/10/1/354
Page 12 of 12
Copyright © 2022 FDOKUMEN