Incorporating Interdependency of Trust Values in Existing Trust Models for Trust Dynamics

Factors associated with breastfeedingin England: an analysis by primary caretrust
Laura L Oakley,1 Mary J Renfrew,2 Jennifer J Kurinczuk,1 Maria A Quigley1
To cite: Oakley LL,Renfrew MJ, Kurinczuk JJ,et al. Factors associated withbreastfeeding in England: ananalysis by primary caretrust. BMJ Open 2013;3:e002765. doi:10.1136/bmjopen-2013-002765
▸ Prepublication history andadditional material for thispaper is available online. Toview these files please visitthe journal online(http://dx.doi.org/10.1136/bmjopen-2013-002765).
Received 20 February 2013Revised 17 April 2013Accepted 26 April 2013
This final article is availablefor use under the terms ofthe Creative CommonsAttribution Non-Commercial2.0 Licence; seehttp://bmjopen.bmj.com
1Policy Research Unit inMaternal Health and Care,National PerinatalEpidemiology Unit, Universityof Oxford, Oxford, UK2Mother and Infant ResearchUnit, College of Medicine,Dentistry and Nursing,University of Dundee,Dundee, UK
Correspondence toDr Laura Oakley;[email protected]
ABSTRACTObjectives: To identify the sociodemographic factorsassociated with variation in area-based breastfeeding inEngland; to calculate the predicted breastfeeding ratesadjusted for sociodemographic variations.Design: Ecological analysis of routine data usingrandom effects logistic regression.Setting: All 151 primary care trusts (PCTs) in England2010–2011.Outcome measures: PCT level data on breastfeeding:initiation, any and exclusive breastfeeding at 6–8 weeks.Results: There was considerable variation inbreastfeeding across PCTs (breastfeeding initiation mean72%, range 39–93%; any breastfeeding at 6–8 weeksmean 45%, range 19–83%; exclusive breastfeeding at6–8 weeks mean 32%, range 14–58%), with LondonPCTs reporting markedly higher rates. Maternal age wasstrongly associated with area-based breastfeeding, with a4–6% increase in odds of breastfeeding associated witha unit increase in the percentage of older mothers.Outside London, the proportion of the local populationfrom a Black and Minority Ethnic (BME) background,compared with those from a White British background,was associated with higher breastfeeding (1–3% increasein odds per unit increase in the proportion from a BMEbackground). Area-based deprivation was associated withreduced odds of breastfeeding (21–32% reduced oddscomparing most deprived quintile to least deprivedquintile). Weaker associations were observed betweensociodemographic factors and breastfeeding in LondonPCTs. Very few PCTs reported breastfeeding figuressubstantially above or below the national average, havingadjusted for variations in sociodemographic factors.Conclusions: Our results show striking associationsbetween sociodemographic factors and breastfeeding atthe area level, with much of the variation in breastfeedingrates explained by the sociodemographic profile. Thesociodemographic context of breastfeeding is clearlyimportant at the area level as well as the individual level.Our findings can be used to inform decision-makingrelating to local priorities and service provision.
INTRODUCTIONBreastfeeding confers multiple benefits onboth infants and mothers, with evidencelinking breastfeeding to a lower risk of many
ARTICLE SUMMARY
Article focus▪ The primary aim of the reported study was to iden-
tify the sociodemographic factors independentlyassociated with variation in area-based breastfeed-ing in England (breastfeeding initiation, any andexclusive breastfeeding rates at 6–8 weeks).
▪ The secondary aim was to calculate the predictedarea-based breastfeeding rates adjusted forsociodemographic variations using multivariablemodelling.
Key messages▪ Striking associations between sociodemographic
factors and breastfeeding at the area level explainmuch of the variation in breastfeeding ratesbetween areas. These associations were stron-gest in PCTs outside London; for London PCTs,the associations were less consistent.
▪ After adjustment for sociodemographic factors,most PCTs have breastfeeding rates in line withthose expected given the overall trends; however,the breastfeeding rates are still comparativelylow, especially for exclusive breastfeeding.
▪ The findings of this study confirm the importanceof the sociodemographic context and support theview that breastfeeding interventions need to betailored to the needs of a particular setting. Ourresults can be used to compare breastfeedingacross areas with similar sociodemographic char-acteristics and to inform service commissioning.
Strengths and limitations of this study▪ To our knowledge, this is the first UK study to
investigate the relationship between sociodemo-graphic factors and breastfeeding at an area-based level. We used routine data to look atbreastfeeding prevalence and sociodemographicfactors, and our analysis covers all English PCTs.
▪ This is an ecological study, and as such ourresults are subject to the usual limitation thatcausality cannot be inferred. It is possible thatvariations in breastfeeding rates may be partiallyexplained by area-level factors not measured inthis study.
▪ The small sample number of PCTs in Londonmay affect our confidence in the results from ouranalysis of London PCTs.
Oakley LL, Renfrew MJ, Kurinczuk JJ, et al. BMJ Open 2013;3:e002765. doi:10.1136/bmjopen-2013-002765 1
Open Access Research

adverse outcomes1 2 including gastroenteritis,3 4 respira-tory disease,4 5 necrotising enterocolitis6 and otitismedia1 5 in infants, and a lower risk of breast cancer inmothers.1 2 7 Breastfeeding has also been linked toother health, social and cognitive outcomes includingchildhood obesity and cognitive development.8 9
Current UK guidance recommends that infants areexclusively breastfed to 6 months of age.10 In England,just over four of five (83%) mothers now start breast-feeding,11 but the recent improvements in initiationhave not been reflected to the same extent in durationand exclusivity; by 6 weeks, the proportion breastfeedinghas dropped to 57%. Only 36% of mothers are stillbreastfeeding at 6 months. Twenty-four per cent ofmothers are breastfeeding exclusively at 6 weeks, andthere are just 13% at 4 months.11 Percentages are lowerstill in the other constituent countries of the UK, and byinternational comparisons, UK breastfeeding ratescompare poorly with those of other Europeancountries.12
A recent report estimated that a moderate increase inbreastfeeding rates in the UK could save over £17million a year as a result of reduced costs for treatingfour acute infant diseases, with further savings accruingfrom the resulting reduction in breast cancer cases.2 Inthe UK, breastfeeding is a major factor in inequalities inhealth; not being breastfed is both a cause and a conse-quence of social inequalities.2 Improving breastfeedingrates in the UK has been a key focus of successive gov-ernments over the last decade,13 14 with the recentpublic health outcomes framework for England identify-ing breastfeeding as a key indicator for healthimprovement.15
Previous studies have identified a variety of sociodemo-graphic and behavioural factors, including area of resi-dence, maternal age, socioeconomic background,maternal education, ethnicity, smoking behaviour andmaternal obesity, as being associated with breastfeedingin both the UK and other high income countries.11 16–28
However, these are based on the analysis of individualwomen and little is known about the factors that areassociated with breastfeeding at the area level. InEngland, breastfeeding data have formed part of theDepartment of Health (DH) Vital Signs MonitoringReturn since 2004 and are routinely reported at anumber of different aggregate levels. Studies based onarea-level data are well placed to make use of routinelycollected data such as this, and can help to inform com-missioning of services as well as providing a frameworkwith which to evaluate relevant interventions. A recentstudy by Freemantle et al29 used an approach similar tothe one described here to look at factors associated withprimary care trust (PCT) level perinatal and infantmortality.The aim of this study was to identify the sociodemo-
graphic factors associated with variation in area-basedbreastfeeding rates in England.
METHODSWe conducted an area-based analysis making use of dataroutinely collected at the PCT level. Until their abolitionin April 2013, PCTs were the administrative bodiesresponsible for commissioning all primary, communityand secondary health services in a defined geographicalarea in England. For the time period under study, PCTsranged in population size and annual number of birthsfrom 1134 to 14 972 births (mean 4550, SD 2429;median 3823, IQR 2952–5591; 2010 data). All 151 PCTsin England (boundaries as of 2010) were eligible forinclusion. Ethical approval was not required as thedataset comprised publicly available routine data at theaggregate level.
Outcome measuresIn England, the breastfeeding status at birth and at6–8 weeks is routinely collected shortly after birth and atthe 6–8 week infant review. We focused on three breast-feeding outcomes: breastfeeding initiation at birth, anybreastfeeding at 6–8 weeks, and total (exclusive) breast-feeding at 6–8 weeks.30
Breastfeeding is recorded as being initiated if infantsreceive any breast milk in the first 24 h after birth. At6–8 weeks, infants are classified into one of three cat-egories according to feeding method in the preceding24 h: not breastfed; partially breastfed; or totally breast-fed (hereafter referred to as ‘exclusively’ breastfed). Thelast two groups are combined to give the outcome ‘anybreastfeeding’. Data on breastfeeding outcomes at thesetwo time points (birth and 6–8 weeks) are released quar-terly by DH. For this analysis, the overall figures for2010–2011 were calculated by summing the raw quar-terly actual data. PCTs were included where reporteddata for at least two of the four quarters of 2010–2011met DH data coverage standards (≥95% data coveragefor initiation; for 6–8 week data, ≥90% and ≥95% datacoverage for quarters 1–3 and quarter 4, respectively)and passed validation checks (relating to consistency inthe reporting of the number of maternities/infants duein a 6–8 week check). According to the usual DH prac-tice, infants for whom a breastfeeding status (initiationor at 6–8 weeks) was not recorded were considered to benot breastfed, as long as the proportion of infants fallingin this category within an individual PCT was small (<5%or <10% depending on the threshold for the quarter).
Explanatory variablesThe following area-based sociodemographic indicatorswere included in our analysis: area-based deprivation,the proportion of births to older (aged >35 years) andyounger (aged <20 years) mothers, and the proportionof the PCT population deriving from Black and MinorityEthnic (BME) backgrounds. We included the prevalenceof maternal smoking as an additional explanatory factor.We used the 2010 Index of Multiple Deprivation
(IMD) as our indicator of material deprivation.31 Data
2 Oakley LL, Renfrew MJ, Kurinczuk JJ, et al. BMJ Open 2013;3:e002765. doi:10.1136/bmjopen-2013-002765
Factors associated with breastfeeding: an analysis by English primary care trust

on 38 domains contribute to this index and are com-bined to reflect a broad concept of deprivation. IMD iscalculated at the level of ‘lower super output area’(LSOA), of which there are 32 482 in England. Thescore for each PCT is the average of the constituentLSOAs.The estimated proportion of each PCT population
from a BME background was derived from the Officefor National Statistics (ONS) Population Estimates byEthnic Group (PEEG) for 2009.32 PEEG is calculatedusing a cohort component methodology using data fromthe 2001 Census and recent data on births, deaths andmigration. BME was defined as non-White British.The percentage of women smoking at delivery by PCT
is reported quarterly by PCTs in England. In this ana-lysis, we used the figures for 2010–2011 published byDH for England.30 As with breastfeeding data, DHimposes quality checks on these data (minimum of≥95% data coverage, reported numbers of maternitiesand women smoking/not smoking must satisfy consist-ency checks).Information on the percentage of births at the PCT
level occurring to older mothers (women aged olderthan 35) and younger mothers (women aged less than20) in 2010–2011 was derived from Hospital EpisodeStatistics (HES) data reported by the Child andMaternal Health Observatory.33
Data on other factors strongly associated with breast-feeding, for example, maternal education, are not col-lected routinely at the PCT level. We were thereforeunable to include other factors of interest in the analysis.
Statistical analysisThe association between sociodemographic variablesand all three breastfeeding outcomes was investigatedusing separate logistic regression models. Randomeffects logistic regression models were used to take intoaccount the clustered hierarchical nature of the data.Most explanatory variables were analysed as continu-
ous variables, for example, the proportion of births in aPCT to mothers aged less than 20; thus, we estimatedthe effect of a one percentage point increase in eachvariable on the breastfeeding proportion in the PCT.IMD scores were divided into quintiles for ease ofanalysis.Preliminary analyses of the data revealed a striking dif-
ference in the sociodemographic profile of LondonPCTs when compared with PCTs outside London. Therewas also evidence that the effect of area-based depriv-ation differed according to whether PCTs were inLondon or not. For this reason, all analysis was stratifiedby region (London vs non-London).Variables (or any resulting ORs for that variable)
which were associated (p<0.10 using Wald’s test for atleast one relevant OR) with breastfeeding in univariableanalysis were included in multivariable random effectslogistic regression models. The final model included allvariables which were associated (p<0.05 using Wald’s test
for at least one relevant OR) with the outcome afteradjusting for other factors in the model. This strategywas repeated for each relationship under study.The final multivariable models were used to generate
predicted proportions of all breastfeeding outcomes forPCTs in England, assuming fixed effects for the explana-tory variables shown in the tables. Differences betweenobserved and predicted proportions were examined bycalculating standardised residuals for all PCTS; thosewith observed proportions that were two or more stan-dardised residuals above or below the predicted propor-tions were highlighted as possible outliers. These figurescan be used to provide a more suitable comparison oflocal performance, as they take into account the distri-bution of sociodemographic factors that we know affectbreastfeeding.All statistical analyses were conducted using Stata V.11
(StataCorp, College Station, Texas, USA); all tests weretwo tailed and a 5% significance level was used unlessspecified otherwise.
RESULTSAll 151 PCTs in England in 2010 were included for theanalysis of breastfeeding initiation, but 10 PCTs failed toreport 6–8 week data that met DH quality controls fortwo or more quarters. Therefore, information on breast-feeding initiation was available for 151 PCTs, and forbreastfeeding status at 6–8 weeks, data were available for141 PCTs.Breastfeeding initiation varied across the PCTs from
39% to 93%, with a mean of 72% (table 1). For breast-feeding status at 6–8 weeks, the mean percentage of anybreastfeeding was 45% (range 19–83%) and for exclu-sive breastfeeding, 32% (range 14–58%). On average,one in five (19%) births in each PCT were to womenaged over 35 (range 9–42%) and 6% were to womenaged under 20 (range 1–12%). The mean proportion ofmothers who were smoking at the time of delivery was15% (range 3–33%). The proportion of the PCT popu-lation from a BME background averaged 19% across allPCTs (range 4–67%).The profile of London PCTs differed markedly from
PCTs in the rest of England. Breastfeeding tended to bemore common in London PCTs, with average breast-feeding initiation at 86%, compared with 69% for PCTsoutside London. Equivalent figures for any and exclusivebreastfeeding at 6–8 weeks in London were 68% and41%, and outside London, 40% and 29%. London PCTsalso had a higher proportion of births to older mothers(25% vs 18%), a higher proportion of residents from aBME background (40% vs 13%), a lower proportion ofbirths to teenage mothers (3% vs 7%) and a lowerprevalence of maternal smoking at delivery (7% vs17%). The deprivation profile was similar when compar-ing London and non-London PCTs. All further resultsare shown separately for PCTs outside (n=120) andinside (n=31) London.
Oakley LL, Renfrew MJ, Kurinczuk JJ, et al. BMJ Open 2013;3:e002765. doi:10.1136/bmjopen-2013-002765 3
Factors associated with breastfeeding: an analysis by English primary care trust

Table 1 Distribution of the prevalence of breastfeeding and socio-demographic variables across PCTs
All PCTs (n = 151) Non-London PCTs (n = 120) London PCTS (n = 31)
Mean
(SD) Median (IQR)
Minimum,
maximum
Mean
(SD) Median (IQR)
minimum,
maximum
Mean
(SD) Median (IQR)
Minimum,
maximum
Breastfeeding
Breastfeeding initiation
(%)
72.3 (11.2) 72.8 (65.2–79.9) 39.0, 92.9 68.7 (9.1) 69.6 (62.5–75.7) 39.0, 85.5 86.3 (6.6) 88.9 (83.1–91.3) 67.7, 92.9
Any breastfeeding at 6–8
weeks (%)*
45.3 (15.0) 42.3 (34.5–54.0) 19.2, 83.1 39.7 (10.0) 39.9 (33.7–45.5) 19.2, 70.5 67.5 (10.6) 71.3 (63.0–73.7) 38.1, 83.1
Exclusive breastfeeding
at 6–8 weeks (%)*
31.6 (9.1) 31.4 (24.9–37.1) 14.2, 58.2 29.2 (7.4) 29.3 (24.2–33.2) 14.3, 58.2 41.2 (8.8) 42.5 (35.0–48.6) 20.5, 57.5
Sociodemographic
IMD (raw score)† 23.6 (8.4) 23.3 (16.6–29.5) 8.8, 45.3 23.1 (8.3) 22.8 (16.4–28.5) 8.8, 45.3 25.6 (8.8) 25.0 (16.7–31.9) 10.1, 41.8
Mothers aged 35+ (%) 19.3 (5.7) 18.4 (15.1–22.0) 9.4, 41.8 17.8 (4.4) 17.6 (14.5–21.2) 9.4, 32.3 25.2 (6.4) 24.5 (20.1–30.4) 15.4, 41.8
Mothers aged <20 (%) 5.9 (2.3) 5.8 (4.1–7.4) 1.3, 11.8 6.6 (1.9) 6.3 (5.3, 7.9) 2.8, 11.8 3.1 (1.1) 2.8 (2.2–3.8) 1.3, 5.6
Population BME (%) 18.7 (14.3) 13.0 (7.8–25.9) 4.3, 67.0 13.1 (8.7) 10.9 (7.3–16.9) 4.3, 67.0 40.4 (10.9) 42.9 (33.9–47.5) 16.4, 61.9
Mothers smoking at
delivery (%)‡
14.7 (6.1) 15.0 (10.7–18.8) 3.0, 33.2 16.7 (4.8) 16.5 (13.7,-19.9) 6.1, 33.2 6.6 (2.9) 5.9 (4.4–7.5) 3.0, 13.6
*Restricted to 141 PCTs with data on breastfeeding at 6–8 weeks.†A high score is indicative of greater deprivation.‡Restricted to 146 PCTs with data on smoking at delivery.Information on maternal smoking at delivery was unavailable for a number of PCTs, leaving 144 and 137 PCTs included in the complete case analysis for breastfeeding initiation andbreastfeeding at 6–8 weeks (115 non-London PCTs and 29 London PCTs; 110 non-London PCTs and 27 London PCTs).BME, Black and Minority Ethnic; IMD, Index of Multiple Deprivation; PCT, primary care trust.
4Oakley
LL,RenfrewMJ,Kurinczuk
JJ,etal.BMJOpen
2013;3:e002765.doi:10.1136/bmjopen-2013-002765
Facto
rsassociate
dwith
bre
astfe
edin
g:ananalysis
byEnglis
hprim
ary
care
trust

PCTs outside LondonThe relationship between any breastfeeding at 6–8 weeksand each of the five sociodemographic variables understudy is presented in a series of scatter plots in figure 1,with data points for non-London PCTs highlighted withsolid markers. There are striking associations betweenbreastfeeding and most of the sociodemographic vari-ables: at the PCT level, the percentage of mothersbreastfeeding tends to decrease as deprivation increases,and as the proportion of both younger mothers andmaternal smoking increases. In general, breastfeedingrises in line with increases in the proportion of oldermothers and the proportion of the population from aBME background. Scatter plots for breastfeeding initi-ation and exclusive breastfeeding at 6–8 weeks showedsimilar patterns (see online supplementary table S1).ORs for the association between these sociodemo-
graphic factors and each of the three breastfeeding out-comes are shown in table 2. In a univariable analysis,breastfeeding (all outcomes) was significantly higher inthose PCTs with a higher proportion of older mothersand a higher BME population. Lower breastfeeding atbirth and at 6–8 weeks was observed in PCTs withincreased deprivation and those areas with a higherprevalence of maternal smoking or teenage mothers.In a multivariable analysis of non-London PCTs with
complete data (n=115 for initiation, n=110 for 6–8 weeks),the following variables were independently associatedwith breastfeeding (all outcomes): lower area-baseddeprivation, more births to older women, and higherBME population (table 2). The proportions of teenagemothers and maternal smoking were no longer signifi-cant after adjustment for other variables (p values forteenage mothers in the last included model: 0.67, 0.49and 0.39 for initiation, any and exclusive; p values for
maternal smoking in the last included model: 0.73, 0.98and 0.63 for initiation, any and exclusive). The effect ofdeprivation was somewhat attenuated by adjustment forother factors, although when compared with the leastdeprived quintile, a significant decrease in odds was stillobserved in quintiles 4 and 5 for exclusive breastfeedingat 6–8 weeks, and in quintile 5 for breastfeeding initiationand any breastfeeding at 6–8 weeks. For breastfeeding ini-tiation, the most deprived quintile (quintile 5) was asso-ciated with a reduction in the odds of 32% (adjusted OR0.68) when compared with the least deprived quintile.Areas with higher proportions of older mothers, andincreased BME population all had higher odds of breast-feeding at birth and at 6–8 weeks. Of these two factors,the strongest association was with older maternal age,where a unit increase in the percentage of mothers aged35 or over was associated with a 6% increase in the oddsof any breastfeeding at 6–8 weeks (adjusted OR 1.06) anda 5% increase in the odds of breastfeeding initiation orexclusive breastfeeding at 6–8 weeks (adjusted OR 1.05).
London PCTsThe same striking associations between breastfeedingand the sociodemographic variables are evident in theLondon PCTs (figure 1, highlighted with hollowmarkers). The only exception was area deprivation,which was not strongly associated with breastfeeding.These figures also provide strong evidence of the differ-ence in both the sociodemographic and the breastfeed-ing profile of London PCTs compared with non-LondonPCTs.A univariable analysis of the London PCTs showed sig-
nificant associations between all breastfeeding outcomesand the maternal age profile of PCTs, the proportion ofa PCT population from a BME background, and
Figure 1 Scatter plots for any breastfeeding at 6–8 weeks by sociodemographic factors (London vs non-London).
IMD, Index of Multiple Deprivation (a high score is indicative of greater deprivation); BME, black and minority ethnic.
Oakley LL, Renfrew MJ, Kurinczuk JJ, et al. BMJ Open 2013;3:e002765. doi:10.1136/bmjopen-2013-002765 5
Factors associated with breastfeeding: an analysis by English primary care trust

Table 2 Association between the prevalence of breastfeeding and the prevalence of socio-demographic variables at the PCT level: non-London PCTs
Non-London PCTs
Breastfeeding initiation (n = 115) Any breastfeeding at 6–8 weeks (n = 110) Exclusive breastfeeding at 6–8 weeks (n = 110)
Unadjusted Adjusted* Unadjusted Adjusted† Unadjusted Adjusted‡
OR (95% CI)` OR (95% CI) OR (95% CI) OR (95% CI) OR (95% CI) OR (95% CI)
IMD
Quintile 1 (least
deprived)
1.00 1.00 1.00 1.00 1.00 1.00
Quintile 2 0.82 (0.68 to 1.00) 1.03 (0.88 to 1.20) 0.74* (0.60 to 0.91) 0.98 (0.85 to 1.12) 0.83* (0.70 to 0.98) 1.02 (0.89 to 1.17)
Quintile 3 0.68*** (0.56 to 0.83) 0.97 (0.82 to 1.15) 0.61*** (0.49 to 0.75) 0.89 (0.77 to 1.04) 0.67*** (0.56 to 0.79) 0.94 (0.80 to 1.10)
Quintile 4 0.56*** (0.46 to 0.68) 0.84 (0.70 to 1.01) 0.54*** (0.44 to 0.67) 0.83* (0.71 to 0.98) 0.61*** (0.51 to 0.72) 0.90 (0.76 to 1.06)
Quintile 5 (most
deprived)
0.50** (0.41 to 0.61) 0.68** (0.54 to 0.86) 0.51*** (0.41 to 0.64) 0.69*** (0.57 to 0.85) 0.54*** (0.45 to 0.65) 0.79* (0.64 to 0.97)
Mothers aged 35+ (%) 1 07 *** (1.06 to 1.09) 1.05*** (1.04 to 1.07) 1.08*** (1.06 to 1.09) 1.06** (1.04 to 1.07) 1.07*** (1.05 to 1.08) 1.05*** (1.04 to 1.07)
Mothers aged <20 (%) 0.86*** (0.83 to 0.88) 0.84*** (0.82 to 0.87) 0.88*** (0.86 to 0.90)
Population BME (%) 1.01* (1.00 to 1.02) 1.02*** (1.01 to 1.02) 1.02*** (1.01 to 1.03) 1.03*** (1.02 to 1.04) 1.01* (1.00 to 1.02) 1.01 *** (1.01 to 1.02)
Mothers smoking at
delivery (%)
0.94*** (0.93 to 0.95) 0.93*** (0.92 to 0.94) 0.95*** (0.94 to 0.96)
*p<0.05; **p<0.01; ***p<0.001.*Variables in model: IMD, percentage of births to older mothers, percentage of population BME.†Variables in model: IMD, percentage of births to older mothers, percentage of population BME.‡Variables in model: IMD, percentage of births to older mothers, percentage of population BME.BME, Black and Minority Ethnic; IMD, Index of Multiple Deprivation; PCT, primary care trust.
6Oakley
LL,RenfrewMJ,Kurinczuk
JJ,etal.BMJOpen
2013;3:e002765.doi:10.1136/bmjopen-2013-002765
Facto
rsassociate
dwith
bre
astfe
edin
g:ananalysis
byEnglis
hprim
ary
care
trust
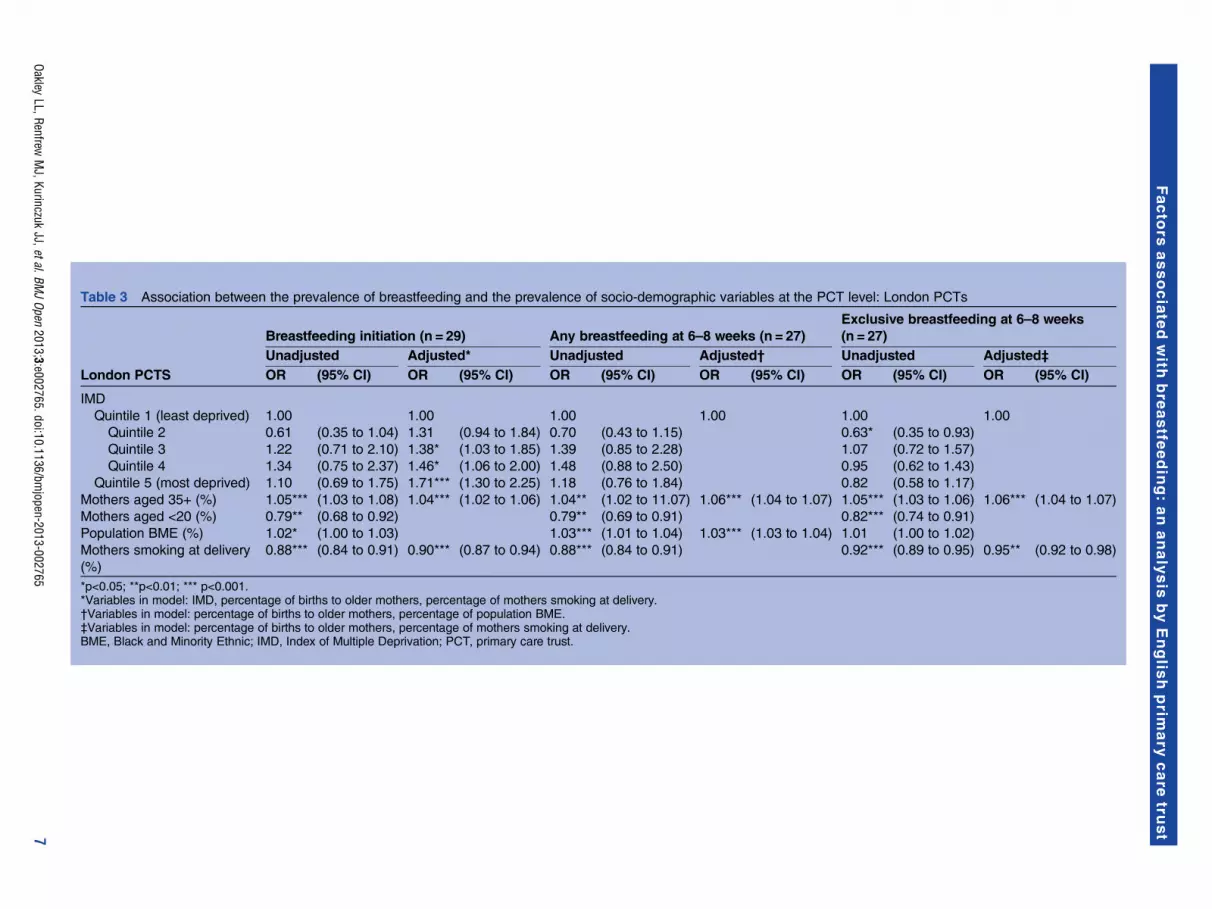
Table 3 Association between the prevalence of breastfeeding and the prevalence of socio-demographic variables at the PCT level: London PCTs
London PCTS
Breastfeeding initiation (n = 29) Any breastfeeding at 6–8 weeks (n = 27)
Exclusive breastfeeding at 6–8 weeks
(n = 27)
Unadjusted Adjusted* Unadjusted Adjusted† Unadjusted Adjusted‡
OR (95% CI) OR (95% CI) OR (95% CI) OR (95% CI) OR (95% CI) OR (95% CI)
IMD
Quintile 1 (least deprived) 1.00 1.00 1.00 1.00 1.00 1.00
Quintile 2 0.61 (0.35 to 1.04) 1.31 (0.94 to 1.84) 0.70 (0.43 to 1.15) 0.63* (0.35 to 0.93)
Quintile 3 1.22 (0.71 to 2.10) 1.38* (1.03 to 1.85) 1.39 (0.85 to 2.28) 1.07 (0.72 to 1.57)
Quintile 4 1.34 (0.75 to 2.37) 1.46* (1.06 to 2.00) 1.48 (0.88 to 2.50) 0.95 (0.62 to 1.43)
Quintile 5 (most deprived) 1.10 (0.69 to 1.75) 1.71*** (1.30 to 2.25) 1.18 (0.76 to 1.84) 0.82 (0.58 to 1.17)
Mothers aged 35+ (%) 1.05*** (1.03 to 1.08) 1.04*** (1.02 to 1.06) 1.04** (1.02 to 11.07) 1.06*** (1.04 to 1.07) 1.05*** (1.03 to 1.06) 1.06*** (1.04 to 1.07)
Mothers aged <20 (%) 0.79** (0.68 to 0.92) 0.79** (0.69 to 0.91) 0.82*** (0.74 to 0.91)
Population BME (%) 1.02* (1.00 to 1.03) 1.03*** (1.01 to 1.04) 1.03*** (1.03 to 1.04) 1.01 (1.00 to 1.02)
Mothers smoking at delivery
(%)
0.88*** (0.84 to 0.91) 0.90*** (0.87 to 0.94) 0.88*** (0.84 to 0.91) 0.92*** (0.89 to 0.95) 0.95** (0.92 to 0.98)
*p<0.05; **p<0.01; *** p<0.001.*Variables in model: IMD, percentage of births to older mothers, percentage of mothers smoking at delivery.†Variables in model: percentage of births to older mothers, percentage of population BME.‡Variables in model: percentage of births to older mothers, percentage of mothers smoking at delivery.BME, Black and Minority Ethnic; IMD, Index of Multiple Deprivation; PCT, primary care trust.
OakleyLL,Renfrew
MJ,Kurinczuk
JJ,etal.BMJOpen
2013;3:e002765.doi:10.1136/bmjopen-2013-002765
7
Facto
rsassociate
dwith
bre
astfe
edin
g:ananalysis
byEnglis
hprim
ary
care
trust

maternal smoking (table 3). Area-based deprivationshowed no or little significant association with breast-feeding in London.In the multivariable analysis, factors independently asso-
ciated with breastfeeding initiation were area deprivation,older maternal age and maternal smoking (table 3).The proportion of teenage mothers and BME populationwere not retained in the final model as they were nolonger significant after adjustment (p values for the lastmodel including these variables: 0.73 for teenage mothers,0.94 for BME). Increased maternal smoking at delivery wasassociated with lower breastfeeding initiation, and in linewith the results for PCTs outside London, increased preva-lence of older mothers was associated with higher breast-feeding initiation. However, contrary to the resultsobserved outside London, increased deprivation appearedto be independently associated with higher breastfeedinginitiation. Quintiles 3–5 had a significantly increased ORcompared with the least deprived quintile 1; for quintile 5(most deprived PCTs), the adjusted OR was 1.71.After adjustment for other factors, deprivation was not
independently associated with breastfeeding at 6–8 weeksin London PCTs (not taken forward to multivariablemodelling in analysis of any breastfeeding; p values forthe last model including this variable in the analysis ofexclusive breastfeeding ranged from 0.21 to 0.74).Older maternal age was associated with breastfeeding at6–8 weeks, with an OR of 1.06 for both any and exclusivebreastfeeding. This is equivalent to a 6% increase in theodds of breastfeeding for every 1% increase in the
proportion of older mothers. The proportion of teenagemothers was not associated with either any breastfeedingor exclusive breastfeeding at 6–8 weeks after adjustmentfor other factors (p values for the last models includingthis variable: 0.28 for any breastfeeding, 0.74 for exclusivebreastfeeding). The proportion of the local populationfrom a BME background was independently associatedwith any breastfeeding at 6–8 weeks (OR 1.03/unitchange), and maternal smoking associated withdecreased exclusive breastfeeding. In the final multivari-able model for any breastfeeding at 6–8 weeks, maternalsmoking did not retain significance (p value for the lastmodel including this variable 0.58).
Observed and predicted proportionsFigure 2 shows the breastfeeding proportions observedin each PCT plotted against the breastfeeding propor-tion that would be predicted based on the multivariablemodels shown in tables 2 and 3. The vast majority ofPCTs reported proportions consistent (within two stan-dardised residuals) with the proportions predicted bythe models. Three PCTs (all non-London) reportedbreastfeeding initiation as being considerably higherthan predicted, and two PCTs (both non-London)reported figures lower than predicted (outliers are high-lighted in figure 2). Three PCTs (all non-London) andfour PCTs (three non-London, one London) reportedproportions of any and exclusive breastfeeding higherthan predicted. One London PCT reported the propor-tion of any breastfeeding at 6–8 weeks as lower than
Figure 2 Observed versus predicted proportions of any breastfeeding at 6–8 weeks.NB, In some cases PCTs classified as potential outliers reported similar breastfeeding figures to PCTs not identified as potential outliers, thisdiscrepancy is due to differences in PCT size.Breastfeeding initiation: performing above – Hampshire, Sheffield, Somerset; performing below - Dudley, Sefton. Any breastfeeding at 6–8 weeks:performing above – Devon, Leeds, Sheffield; performing below – Brent. Exclusive breastfeeding at 6–8 weeks: performing above – City andHackney, Devon, Leeds, Sheffield.
8 Oakley LL, Renfrew MJ, Kurinczuk JJ, et al. BMJ Open 2013;3:e002765. doi:10.1136/bmjopen-2013-002765
Factors associated with breastfeeding: an analysis by English primary care trust

expected. Online supplementary table S2 shows theobserved and predicted breastfeeding proportions foreach PCT.
DISCUSSIONTo our knowledge, this is the first UK study designed toinvestigate the relationship between sociodemographicfactors and breastfeeding at the area level, an analysiswhich is important, given that services are commissionedand delivered at this level. There was enormous variationin the area-based rates of breastfeeding. However, afteradjusting for sociodemographic factors, most areas havebreastfeeding rates within the expected range of thenational average, albeit a relatively low national average(eg, 45% any breastfeeding at 6–8 weeks). The area-based analysis revealed some striking associationsbetween sociodemographic factors and breastfeeding;these persisted after adjustment for other factors. Forexample, an increase in the proportion of mothers aged35 or older from 15% to 20% is associated with a 30%increase in the odds for area-level any breastfeeding at6–8 weeks.
LimitationsThis study used aggregate data and as such is subject tothe usual limitation that causality cannot be inferred.Although the use of routine data has many benefits, forexample, wide geographical coverage, there are alsoinherent disadvantages such as the difficulty in assessingdata quality. It is also possible that higher levels of breast-feeding can be partially explained by area-level factorsnot measured in this study, for example, a greaternumber of accessible breastfeeding services. Weincluded all socioeconomic indicators routinely availableat the PCT level. There may be other relevant factorsthat would have been useful to include, such as levels ofmaternal education.DH for England does not make raw figures for annual
outturn breastfeeding data routinely available. In orderto model figures in our regression analysis, we relied onquarterly actual data. These data may differ very slightlyfrom annual outturn data, but there is no reason tosuspect that trends would be different. One advantage ofour method (summing breastfeeding data across quar-ters) was that we were able to include PCTs with one ortwo data quarters missing, thus minimising data loss.However, a small number of PCTs were excluded asbreastfeeding data did not meet our stipulated criteria(acceptable data quality for at least two quarters). In add-ition, the small number of PCTs in London (27–29depending on analysis) may affect our confidence in theresults from our analysis of London PCTs: it is unclearwhether lack of association reflects a true lack of effort oris simply the consequence of an underpowered analysis.The observed breastfeeding proportions used in this ana-lysis are likely to be an underestimate of the true numberbreastfeeding as we mirrored the denominators used by
DH, which assumes that those for whom a breastfeedingstatus was not recorded are not breastfeeding.Data on smoking at delivery were not available for all
PCTs. Six PCTs were not eligible for inclusion asreported data did not meet DH quality checks. Despitethis, smoking status was available for 99% of maternitiesin 2010–2011 (range for individual PCTs included inthis analysis 95.5–100%).Our ethnicity indicator related to the general PCT
population rather than the maternal population. Giventhe high level of missing data on maternal ethnicityfrom HES (approximately 8% in 2009–201034), usingthese data would have resulted in a reduction in oursample size. We compared the general ethnicity datawith the HES maternal ethnicity data and noted that itcorrelated well, although the HES maternal ethnicitydata reported higher proportions across all PCTs, prob-ably due to the younger age profile of BME populations.We combined all non-White groups into a single BMEindicator. This helped to minimise potential problemsdue to the small numbers of certain ethnic groups inmany PCTs. This decision was also supported by strongevidence that all non-White women are more likely toinitiate and continue breastfeeding when compared withWhite women.11 However, our approach left us unableto examine the separate contribution of individualethnic groups or relevant factors such as migrationhistory or acculturation status35 to breastfeeding rates.
Interpretation of resultsThere was compelling evidence of a strong area effect ofolder maternal age on breastfeeding, with a 1% increasein the percentage of older mothers in a PCT associatedwith a 4–6% increase in the odds of breastfeeding. Thistrend was consistent across all outcomes and in bothLondon and non-London PCTs, and is in line with evi-dence from individual level studies that older mothers aremore likely to initiate and continue breastfeeding.11 24
Outside London, the proportion of the PCT popula-tion from a BME background was associated withbreastfeeding, with a unit increase in BME populationresulting in a 1–3% increase in the odds of breastfeeding.Non-white ethnicity has consistently been linkedto increased breastfeeding in individual levelstudies,16 17 20 22 26 although there is some variationbetween individual ethnic groups and by acculturationstatus.35 The existing literature suggests that the strongestoverall effect of ethnicity is on initiation and continu-ation, with minimal differences by ethnicity in thenumber of women who breastfeed exclusively.36 37
Although the proportion of the PCT population from aBME background was associated with all breastfeedingoutcomes outside London, it was only independentlyassociated with breastfeeding at 6–8 weeks in London.The fact that we did not identify an independent effect ofBME population on initiation in London may be partlydue to the high rate of BME in the London PCTs (meanvalue 40%) making it difficult to detect an independent
Oakley LL, Renfrew MJ, Kurinczuk JJ, et al. BMJ Open 2013;3:e002765. doi:10.1136/bmjopen-2013-002765 9
Factors associated with breastfeeding: an analysis by English primary care trust
effect of ethnicity. In addition, it may be that the highrates of breastfeeding in ethnically diverse areas supportsthe concept of ‘community ethnicity’,20 whereby somegroups of White women appear to be more likely tobreastfeed if they reside in an area with a high BMEpopulation. Differences in the composition of BMEpopulations in London compared with outside Londonmay also help to explain the inconsistency in theobserved effect of BME on breastfeeding.PCTs in the most deprived quintile had a 21–32%
reduced odds of breastfeeding compared with PCTs inthe least deprived quintile. In London PCTs, resultswere less consistent after adjustment, with area depriv-ation only associated with breastfeeding initiation, andthis association being in the opposite direction to thatobserved outside London (increased deprivation asso-ciated with increased odds of initiation). This perhapshighlights the complex relationships between ethnicity,socioeconomic status and breastfeeding behaviour. BMEpopulations tend to cluster in more deprived neighbour-hoods. Women from non-White backgrounds are morelikely to breastfeed. In general, mothers from lowersocioeconomic backgrounds are less likely to breastfeed.There is evidence that this latter trend cannot be gener-alised to mothers from non-White backgrounds.17
Several studies have found that the effects of depriv-ation,17 socioeconomic status19 and income22 are negli-gible when looking at breastfeeding among certainminority ethnic groups. Outside London, both depriv-ation and area level ethnicity remained independentpredictors of breastfeeding even after adjusting for theother. Within London, the effect of one appeared to beattenuated by the other, except when looking at exclu-sive breastfeeding, which was not independently asso-ciated with either.Our analysis was designed to explain the variation in
breastfeeding between PCTs. Only a handful of PCTsreported breastfeeding figures substantially above orbelow the proportions predicted by our models. Themajority of outliers were PCTs with observed proportionshigher than expected based on the national averagehaving adjusted for sociodemographic factors, thoughtwo PCTs did report breastfeeding initiation as beinglower than predicted and one PCT had a lower thanexpected proportion of any breastfeeding at 6–8 weeks.
ImplicationsOur results demonstrate that while the area-based breast-feeding rates vary enormously, much of this variation isexplained by the sociodemographic profile of the area.Currently, breastfeeding data provided at the PCT levelfor comparative purposes are unadjusted38 and mayresult in a misleading assessment of local performance.Adjusted breastfeeding figures as reported in this studymay be used to identify areas with higher or lower thanexpected rates of breastfeeding. For those performingabove expected levels, there may be lessons to be learntfrom examining local service provision.
The sociodemographic context within which a breast-feeding service is implemented or evaluated is clearlyimportant.39 A ‘one size fits all’ approach to breastfeed-ing support is unlikely to demonstrate a strong effect atthe population level over and above the ‘backgroundnoise’ of such strong sociodemographic effects.Interventions which are tailored to the needs of a par-ticular setting are more likely to be effective,40 particu-larly those that follow local needs assessment. Ourfindings can be used to help inform the primary focusof an intervention, for example, whether the emphasisshould be on breastfeeding initiation, duration or exclu-sivity or a combination of these outcomes.40 The size ofeffects observed in our study may also inform estimatesof the likely effects of breastfeeding interventions in atrial or other setting. In situations where the requiredtrial size is too large to be feasible, other forms of evalu-ation, such as case studies of high performing PCTs, arelikely to be a more suitable approach.In the new (post-April 2013) National Health Service
structure in England, it is uncertain which organisationswill be responsible for commissioning breastfeeding ser-vices. However, our results will be relevant to whicheverlocal structures take over this function, particularly giventhat many of the geographical areas presented here willbe recognisable in the new structure. Although mostPCTs are performing at the level expected given thecurrent trends, the overall breastfeeding rates are stilllow and fall short of the UK recommendations formothers to breastfeed exclusively for the first 6 monthsof life.
CONCLUSIONOur results confirm the importance of sociodemo-graphic indicators of breastfeeding, and provide evi-dence that these indicators explain much of theheterogeneity between PCTs in terms of the proportionof mothers breastfeeding. However, there is little roomfor complacency; while some areas in England now havehigh rates of breastfeeding initiation, almost all have lowrates of continuation, particularly of exclusive breastfeed-ing. In order to maximise the likelihood of success,interventions designed to increase breastfeeding at thearea level will need to be tailored to the sociodemo-graphic context, and monitoring and assessment of area-based rates will need to take these factors into account.
Contributors MAQ and JJK conceived the study and all authors contributedto the design of the study. MAQ and LLO designed and conducted theanalysis. All authors were involved in the interpretation of the data. LLO andMAQ wrote the initial draft of the manuscript, and all authors contributed torevising consecutive drafts. All authors approved the final version of themanuscript. All authors had full access to all the data in the study and cantake responsibility for the integrity of the data and the accuracy of the dataanalysis. MAQ and LLO are the guarantors for the study.
Funding This paper reports on an independent study which is funded by thePolicy Research Programme in the Department of Health (Policy ResearchUnit in Maternal Health and Care, reference no. 108/0001). The viewsexpressed are not necessarily those of the department. The funder had no
10 Oakley LL, Renfrew MJ, Kurinczuk JJ, et al. BMJ Open 2013;3:e002765. doi:10.1136/bmjopen-2013-002765
Factors associated with breastfeeding: an analysis by English primary care trust

role in: the design and conduct of the study; the analysis and interpretation ofthe data, as well as the drafting of the paper and decision to submit the paperfor publication.
Competing interests None.
Provenance and peer review Not commissioned; externally peer reviewed.
Data sharing statement Observed and predicted breastfeeding rates by PCTare provided as Supplementary Data. For further information please contactthe corresponding author.
REFERENCES1. Ip S, Chung M, Raman G, et al. Breastfeeding and maternal and
infant health outcomes in developed countries. Rockville, MD:Agency for Healthcare Research and Quality, 2007. Evidence report/technology assessment 2009;153.
2. Renfrew MJ, Pokhrel S, Quigley M, et al. Preventing disease andsaving resources: the potential contribution of increasingbreastfeeding rates in the UK. London: UNICEF, 2012.
3. Quigley MA, Cumberland P, Cowden JM, et al. How protective isbreast feeding against diarrhoeal disease in infants in 1990sEngland? A case-control study. Arch Dis Child 2006;91:245–50.
4. Quigley MA, Kelly YJ, Sacker A. Breastfeeding and hospitalizationfor diarrheal and respiratory infection in the United KingdomMillennium Cohort Study. Pediatrics 2007;119:e837–42.
5. Fisk CM, Crozier SR, Inskip HM, et al. Breastfeeding and reportedmorbidity during infancy: findings from the Southampton Women’sSurvey. Matern Child Nutr 2011;7:61–70.
6. Henderson G, Craig S, Brocklehurst P, et al. Enteral feedingregimens and necrotising enterocolitis in preterm infants: amulticentre case–control study. Arch Dise Childhood 2009;94:F120–F23.
7. Collaborative Group on Hormonal Factors in Breast Cancer Möller T,Olsson H, Ranstam J, et al. Breast cancer and breastfeeding:collaborative reanalysis of individual data from 47 epidemiologicalstudies in 30 countries, including 50,302 women with breast cancerand 96,973 women without the disease. Lancet 2002;360:187–95.
8. Horta BL, Bahl B, Martines JC, et al. Evidence on the long-termeffects of breastfeeding. Geneva: WHO, 2007.
9. Quigley MA, Hockley C, Carson C, et al. Breastfeeding is associatedwith improved child cognitive development: a population-basedcohort study. J Pediatr 2012;160:25–32.
10. Scientific Advisory Committee on Nutrition (SACN), Subgroup onMaternal and Child Nutrition (SMCN). Paper for discussion:introduction of solid foods, agenda item: 3. 2003. SMCN/03/08., 2008.
11. McAndrew F, Thompson J, Fellows L, et al. (2012). Infant feedingsurvey 2010. Leeds: Health and Social Care Information Centre,2012.
12. Cattaneo A, Burmaz T, Arendt M, et al. Protection, promotion andsupport of breast-feeding in Europe: progress from 2002 to 2007.Public Health Nutr 2010;13:751–9.
13. Department of Health. Improvement, expansion, reform – the nextthree year: priorities and planning framework 2003–2006. London:Department of Health, 2002.
14. HM Government. PSA Delivery Agreement 12: improve the healthand wellbeing of children and young people. London: HMSO, 2007.
15. Department of Health. Improving outcomes and supportingtransparency. Part 1: a public health outcomes framework forEngland, 2013–2016. London: Department of Health, 2012.
16. Agboado G, Michel E, Jackson E, et al. Factors associated withbreastfeeding cessation in nursing mothers in a peer supportprogramme in Eastern Lancashire. BMC Pediatr 2010;10:3.
17. Baker D, Garrow A, Shiels C. Inequalities in immunisation andbreast feeding in an ethnically diverse urban area: cross-sectionalstudy in Manchester, UK. J Epidemiol Community Health2011;65:346–52.
18. Dennis CL. Breastfeeding initiation and duration: a 1990–2000 literature review. J Obstetr Gynecol Neonatal Nurs2002;31:12–32.
19. Griffiths LJ, Tate AR. Do early infant feeding practices vary bymaternal ethnic group? Public Health Nutr 2007;10:957–64.
20. Griffiths LJ, Tate AR, Dezateux C, Group tMCSCH. The contributionof parental and community ethnicity to breastfeeding practices:evidence from the Millennium Cohort Study. Int J Epidemiol2005;34:1378–86.
21. Kelly Y, Watt R. Breast-feeding initiation and exclusive duration at6 months by social class—results from the Millennium Cohort Study.Public Health Nutr 2005;8:417–21.
22. Kelly YJ, Watt RG, Nazroo JY. Racial/ethnic differences inbreastfeeding initiation and continuation in the United Kingdom andcomparison with findings in the United States. Pediatrics 2006;118:e1428–35.
23. Matijasevich A, Victora CG, Lawlor DA, et al. Association ofsocioeconomic position with maternal pregnancy and infant healthoutcomes in birth cohort studies from Brazil and the UK. J EpidemiolCommunity Health 2012;66:127–35.
24. Mclnnes R, Love J, Stone D. Independent predictors of breastfeedingintention in a disadvantaged population of pregnant women. BMCPublic Health 2001;1:10.
25. Brown AE, Raynor P, Benton D, et al. Indices of Multiple Deprivationpredict breastfeeding duration in England and Wales. Eur J PublicHealth 2010;20:231–5.
26. McMillan B, Conner M, Woolridge M, et al. Predicting breastfeedingin women living in areas of economic hardship: explanatory role ofthe theory of planned behaviour. Psychol Health 2008;23:767–88.
27. Skafida V. The relative importance of social class and maternaleducation for breast-feeding initiation. Public Health Nutr2009;12:2285–92.
28. Turcksin R, Bel S, Galjaard S, et al. Maternal obesity andbreastfeeding intention, initiation, intensity and duration: a systematicreview. Matern Child Nutr 2012: doi: 10.1111/j.1740–8709.2012.00439.x
29. Freemantle N, Wood J, Griffin C, et al. What factors predictdifferences in infant and perinatal mortality in primary care trusts inEngland? A prognostic model. BMJ 2009;339:2892.
30. Department of Health. Statistical releases on breastfeeding, smokingand obesity: Department of Health, 2012.
31. McLennan D, Barnes H, Noble M, et al. The English indices ofdeprivation 2010. London: Department for Communities and LocalGovernment, 2011.
32. Office of National Statistics. Population estimates for ethnic group(experimental) Mid-2009, 2011.
33. Child and Maternal Health Observatory. Child and Maternal HealthObservatory (ChiMat), http://atlas.chimat.org.uk/IAS/advanceddataviews/(accessed Nov 2012).
34. Health and Social Care Information Centre. Hospital EpisodeStatistics: How good is HES ethnic coding and where do theproblems lie? (Revised for the 2009–2010 HES Data Year). Leeds:Health and Social Care Information Centre, 2011.
35. Hawkins SS, Lamb K, Cole TJ, et al. Influence of moving to the UKon maternal health behaviours: prospective cohort study. BMJ2008;336:1052–5.
36. Bolling K, Grant C, Hamlyn B, et al. Infant feeding survey 2005.London: The Information Centre for Health and Social Care, 2007.
37. Thomas M, Avery V. Infant feeding in Asian families: early feedingpractices and growth. London: The Stationery Office, 1997.
38. RightCare. NHS Atlas of Variation: Child Health (Online InstantAtlasVersion), http://www.sepho.org.uk/extras/maps/NHSatlasChildHealth/atlas.html (accessed Nov 2012).
39. Hoddinott P, Seyara R, Marais D. Global evidence synthesis and UKidiosyncrasy: why have recent UK trials had no significant effects onbreastfeeding rates? Matern Child Nutr 2011;7:221–7.
40. Dyson L, Renfrew MJ, McFadden A, et al. Policy and public healthrecommendations to promote the initiation and duration ofbreast-feeding in developed country settings. Public Health Nutr2010;13:137–44.
Oakley LL, Renfrew MJ, Kurinczuk JJ, et al. BMJ Open 2013;3:e002765. doi:10.1136/bmjopen-2013-002765 11
Factors associated with breastfeeding: an analysis by English primary care trust
Copyright © 2022 FDOKUMEN