Effectiveness of Early Postpartum Follow-up on Breastfeeding ...

8
Maria Iacovou Institute for Social and Economic Research University of Essex
Almudena Sevilla-Sanz University of Oxford
No. 2010-4013 December 2010
ISE
R W
orking Paper S
eriesw
ww
.iser.essex.ac.uk
The Effect of Breastfeeding on Children’s Cognitive Development
Non-Technical Summary
This paper examines the effect of breastfeeding on children´s cognitive outcomes, as measured by test
scores in reading, writing and mathematics measured at ages 5, 7, 11, and 14.
Breastfeeding is an issue of considerable importance for policy in the UK. Breastfeeding rates are
relatively low in the UK compared to elsewhere in the developed world: the World Health Organization
recommends breastfeeding exclusively for six months and alongside solid foods for two years, but in the
UK, barely one in three infants is exclusively breastfed during the first four months of life.
The links between breastfeeding and positive health outcomes in children are well known. There is
also a well-documented relationship between breastfeeding and better cognitive outcomes. However, a
difficulty arises in studying this relationship. Because breastfeeding is more likely to be practiced by
mothers whose characteristics (higher social class, higher IQ, higher levels of human capital, etc.) favour
more positive outcomes for their children, it is not clear whether the relationship between breastfeeding
and better cognitive outcomes is causal (breastfeeding causes children to do better) or whether it arises
merely because mothers who breastfeed are likely to have more successful children anyway.
Several statistical approaches exist which are able to deal with this issue of causality. However, it is
not always easy to implement these approaches in the study of breastfeeding (for example, there would be
obvious problems with ethics and compliance in implementing a randomized controlled trial).
In this paper we use propensity score matching (PSM), a statistical technique that involves “twinning”
each breastfed baby with one or more babies who were not breastfed, but who in all other observable
respects are similar to the breastfed baby. We “twin” babies on a huge range of characteristics: their sex,
gestational age, birthweight; their mother’s age and marital status; both parents’ job status and education;
characteristics of their home and their neighbourhood; and many more characteristics. Crucially, we also
use parents’ attitudes to breastfeeding as measured before birth, to twin babies. Comparing the test scores
of groups of children matched in this way, we are effectively estimating the causal effect of breastfeeding.
We implement the PSM technique using data from the Avon Longitudinal Study of Parents and Children
(ALSPAC), an exceptionally rich data set covering children born in the early 1990s in the Bristol area.
We find that breastfeeding does have a causal effect on children’s cognitive outcomes. The “raw”
difference between children who were and were not breastfed at four weeks of age is large, at a little over
one third of a standard deviation. Most of this difference may be explained by maternal characteristics.
However, even after controlling for these, a statistically significant difference remains. This is smaller, at
a little over one tenth of a standard deviation. However, it is statistically significant across English, maths
and science scores, and it persists at least until age fourteen; indeed, there is some evidence that the effect
tends to grow over time.

1
The Effect of Breastfeeding on Children’s Cognitive Development∗∗∗∗
Maria Iacovou, University of Essex and
Almudena Sevilla-Sanz, University of Oxford
Abstract
This paper uses Propensity Score Matching to investigate the causal effect of breastfeeding on
children’s cognitive development. There is a strong association between breastfeeding and cognitive
outcomes; however, it is notoriously difficult to establish whether this is causal, or whether it arises
because mothers who breastfeed tend to be those whose children would do better anyway. Using PSM,
we find that breastfeeding for four weeks has a positive and significant effect on test scores, in the order
of one tenth of a standard deviation. Thus, interventions which increase breastfeeding rates may improve
not only children’s health, but also their cognitive skills.
JEL: J12, Z13 Keywords: Breastfeeding, Cognitive Outcomes, Child Development, ALSPAC Maria Iacovou Almudena Sevilla-Sanz Institute for Social and Economic Research Department of Economics and University of Essex Centre for Time Use Research Colchester, CO4 3SQ (UK) University of Oxford [email protected] Manor Rd, Oxford OX1 3UQ (UK) [email protected]
This version: December 2010
∗ This paper has benefited from comments provided by participants at the British Society of Population Studies and at the 5th conference of Epidemiological Longitudinal Studies in Europe; from our colleagues at ISER, particularly Emilia del Bono and Birgitta Rabe. This work was funded by the ESRC under grant RES-062-23-1693. We are extremely grateful to all the families who took part in this study, the midwives for their help in recruiting them, and the whole ALSPAC team, which includes interviewers, computer and laboratory technicians, clerical workers, research scientists, volunteers, managers, receptionists and nurses. The UK Medical Research Council (Grant Ref: 74882); the Wellcome Trust (Grant Ref: 076467) and the University of Bristol provide core support for ALSPAC. This publication is the work of the authors and they will serve as guarantors for the contents of this paper.

1
The most valuable of all capital is that invested in human beings; and of that
capital the most precious part is the result of the care and influence of the mother.
Alfred Marshall (1890), Paragraph VI.IV.11.
1 Introduction
Recent research shows a significant impact of behavioural and psycho-social outcomes on earnings
and education (Duncan and Dunifon 1998; Bowles et al. 2001; Heckman et al. 2006; Mueller and Plug
2006). Differences in children’s cognitive development emerge at early ages (Illsey 2002; Feinstein
2003), and the importance of timely parental investments (pre-natal as well as post-natal) is increasingly
recognized as a major factor in fostering child development (Carneiro and Heckman 2003; Del Bono et al.
2008). This paper looks at the effect of breastfeeding on children´s cognitive outcomes. This is a topic of
considerable importance for policy in the UK: the World Health Organization recommends breastfeeding
exclusively for six months and alongside solid foods for two years, but in the UK, barely one in three
infants is exclusively breastfed during the first four months of life. Given the increasing recognition of the
importance of very early interventions in children’s development and later outcomes; and given the huge
social gradient in breastfeeding rates, with the most privileged mothers currently being many times more
likely to breastfeed than the least privileged mothers, breastfeeding may well be a significant route for the
intergenerational transmission of human capital. A fuller understanding of the effects of breastfeeding on
aspects of child development is therefore crucial for an understanding of the intergenerational
transmission of inequality, and for policy-making aimed at reducing inequality.
There is a well-established association between breastfeeding and a range of positive health outcomes
in children, such as a lower incidence of asthma, middle ear and urinary tract infections (Dyson et al.
2006). A smaller body of research also shows breastfeeding to be related to better gross motor
development (Sacker et al. 2006), and improved cognitive ability (Anderson et al. 1999). Other potential
effects of breastfeeding, such as cognitive outcomes of the type investigate here, are much less well
researched. This is partly because it is extremely difficult to identify whether the observed relationships
are causal, as opposed to arising because breastfeeding is more likely to be practiced by mothers whose
characteristics (higher social class, higher IQ, higher levels of human capital, etc.) favor more positive
outcomes. For ethical and practical reasons, the implementation of randomized trials is usually not an
option in this area of research (although experiments which randomize the provision of facilities to
promote breastfeeding are feasible, as discussed by Kramer et al. 2001 and Kramer et al. 2008). Usually,
researchers have attempted to address issues of causality studying sibling pairs, using changes in the
maternity leave legislation, or using emergency cesarean section as instruments (Der et al. 2006; Baker
2
and Milligan 2007). However, the extent of the true causal effect of breastfeeding on the favourable
outcomes with which it is frequently associated remains an open question.
We address the question of causality by making use of propensity score matching (PSM), a technique
developed to establish the causality behind observed relationships. It involves “twinning” each breastfed
baby with one or more babies who were not breastfed, but who in all other observable respects are similar
to the breastfed baby. In this way, we effectively simulate an experiment by creating matched “treatment”
and “control” samples, composed respectively of women who do and who do not breastfeed, but who are
identical in every other observable respect (Rosenbaum and Rubin 1984).
PSM rests on the assumption that the important factors affecting an individual’s choice to breastfeed
are observable, and there is no significant selection on unobservables1. This “conditional independence”
or “unconfoundedness” assumption is a strong one, and we assess its validity by undertaking sensitivity
analysis using a bounding approach similar to that proposed by Rosembaum (2002). In fact, the very rich
data we use mean that a high proportion of the propensity to breastfeed is explained by observable
factors; the fact that we are able to implement matching to a very high standard means that the risk of bias
caused by unobservable heterogeneity is low. PSM and the sensitivity analysis we use are discussed in
detail in Section 3 of this paper.
The data we use come from the Avon Longitudinal Study of Parents and Children (ALSPAC).
ALSPAC contains a particularly rich set of variables on infant feeding, from which we may establish the
duration of breastfeeding and of exclusive breastfeeding; the stage at which formula milk, animal milks
and solid foods were introduced; and the types of supplementary foods which were introduced. However,
the feature of ALSPAC which make this data particularly attractive for the implementation of PSM is the
fact that parents were interviewed several times prior to the birth of their children, and data collected on
their attitudes to breastfeeding, whether they themselves had been breastfed as babies, and their intentions
in relation to the feeding of their own children. The data are discussed in Section 2.
We find that breastfeeding has an important effect on a child’s cognitive outcomes. This effect is
statistically significant and is relatively large, at around one twentieth of a standard deviation at age five,
and on average a little over one tenth thereafter. It persists over time, and is common across all the
outcome variables we examine. PSM estimates tend to be slightly lower than OLS estimates controlling
1 Thus, PSM differs importantly from Instrumental Variable methods, which rely on the assumption that
unobservables are important and difficult to control for regardless of how precise the information on the individual and her environment is. IV is often difficult to implement in the study of breastfeeding, due to a lack of suitable instruments.

3
for the same set of background variables. This suggests that not taking into account the selection effect of
breastfeeding may overestimate the actual returns to breastfeeding, but in this case only very slightly.
This paper significantly contributes to a growing literature on the effect of breastfeeding on children´s
outcomes in three ways. First, unlike most previous observational research, we use PSM to provide
further evidence on the causal effect of breastfeeding on children’s cognitive. Second, by examining
issues of heterogeneity, – that is, whether some mothers and babies (grouped by socio-economic status or
birthweight, for example) stand to benefit more than others from breastfeeding, our work adds to most
existing studies on breastfeeding which rely on small sample sizes and are therefore unable to do this
effectively. Third, we determine the duration of effect of breastfeeding by using a longitudinal data set
where outcomes are observed at ages 5, 7, 11, and 14.
This paper is organized as follows. The data are discussed in Section 2. PSM and the sensitivity
analysis we use are discussed in detail in Section 3 of this paper. Baseline results and robustness checks
are discussed in Section 4. Section 5 explores heterogeneity effects, and Section 6 concludes.
2 Data and descriptive statistics
The Avon Longitudinal Survey of Parents and Children (ALSPAC) is a longitudinal study of
around 12,000 children born in the Avon area in the early 1990s (Golding et al. 2001; Gregg et al. 2005).
Mothers were recruited into the sample at the point at which they first reported their pregnancy to their
doctors. Data were collected at four points during pregnancy and at several points following birth – from
both parents, from the child him/herself, and from the child’s teacher and school. Topic areas covered
include physical and mental health, socioeconomic status, and child development; school-level data and
children’s test results are available via merged records. Ethical approval for this study was obtained from
the ALSPAC Law and Ethics Committee and the Local Research Ethics Committees.
2.1 Sample
For our analysis, we consider a sample of those children in the “core sample” of ALSPAC. This
sample consists of 14,541 pregnancies that resulted in 14,676 known fetuses of which 14,062 were live
births and 13,988 were alive at 1 year. This is the number of pregnancies for which the mother enrolled in
the ALSPAC study and had either returned at least one questionnaire or attended a “Children in Focus”
clinic by 19/07/99. Out of the 14,541 core pregnancies, all but 69 had known birth outcome. Of the
remaining 14,472 pregnancies, 195 were twin, 3 were triplet and 1 was quadruplet. For reasons of
confidentiality data on the 13 triplet and quadruplet children were not available for analysis.

4
2.2 Outcome variables
The outcome variables used in this paper are Standard Attainment Test (SATs) scores2 at ages 7,
11 and 143, and the results of school entry tests at age 5. All scores are standardized to have mean zero
and standard deviation 1; thus, all the results we present may be interpreted as proportions of a standard
error.
In the UK, children generally start school in the September following their fourth birthday, and
move up a school year every September. During the years when the ALSPAC cohort were in school,
pupils’ progress was monitored by compulsory SATs tests, administered at the end of each of the “Key
Stages” in schools (See Table 1). When the ALSPAC cohort entered school there were no national
compulsory entry assessments. However, the four Local Education Authorities covering the former Avon
area (Bristol, South Gloucestershire, Bath & North East Somerset and North Somerset) all used the same
entry assessment scheme, which was used by 80% of the local state schools.
Table 1: Structure of UK schools and testing procedures Class Age Key Stage Tests -- 3 - 4 -- Reception 4 – 5 Foundation Local entry assessments Year 1 5 - 6 -- Year 2 6 – 7 1 National tests and tasks in English and Maths Year 3 7 - 8 -- Year 4 8 – 9 -- Year 5 9 - 10 -- Year 6 10 – 11 2 National tests in English, Maths and Science Year 7 11 - 12 -- Year 8 12 - 13 -- Year 9 13 – 14 3 National tests in English, Maths and Science Year 10 14 - 15 Some children take GCSEs Year 11 15 – 16 4 Most children take GCSEs, GNVQs etc.
Source: Department for Children, Schools and Families (DCSF) at http://www.dfes.gov.uk/
The entry-level assessment covers eight areas. We focus on those which form the required
element of the tests (language, reading, writing and mathematics); optional areas include social skills,
problem solving, large motor skills and small motor skills. The stage achieved by each child in each area
is recorded on a scale of 2 (least advanced) to 7 (most advanced). The KS1 battery consists of tasks in
2 Scores were matched to ALSPAC data from the National Pupil Database (NPD), a central repository for pupil level educational data established in 2002, which assigns every pupil in England a Unique Pupil Number (UPN). 3 SATs are also taken at age 16. However, we do not consider these in this paper, since not all the children in our sample took the same national test at this point.

5
reading, reading comprehension, writing, spelling and mathematics. Tests at the later Key Stages consist
of tasks in English, Maths and Science.
2.3 Breastfeeding variables
For the purposes of this paper, a feature of particular interest in ALSPAC is the very detailed
information it contains on breastfeeding. Before their babies are born, both parents are asked about their
attitudes to breastfeeding; whether they had been breastfed themselves; and about their intended feeding
method for the baby in its first week, its first month, and its first four months. At intervals following their
child’s birth, mothers are asked how they are feeding their babies, including the stages at which infant
formula and solid foods were introduced. From this, we are able to compute the duration of exclusive
breastfeeding; the duration of breastfeeding; and to identify babies who were fed supplementary foods
generally considered to be unsuitable (for example, coffee, coca-cola and chocolate).
Figure 1: Percentage of babies breastfed (in weeks after child is born)
Source: ALSPAC Data, core sample.
Figure 1 shows how breastfeeding rates vary with the age of babies. Almost three-quarters of the
mothers in this sample initiate breastfeeding (defined as putting the baby to the breast at least once).
However, by four weeks only a little over half of all mothers are still breastfeeding at all, and fewer than
0
10
20
30
40
50
60
70
80
0 4 8 12 16 20 24 28 32 36 40 44 48 52
Baby's age in weeks
Any breastfeeding
Exclusive breastfeeding
6
one third are still breastfeeding exclusively. By 4 months (18 weeks), only about one third of mothers are
breastfeeding at all, and hardly any are breastfeeding exclusively.
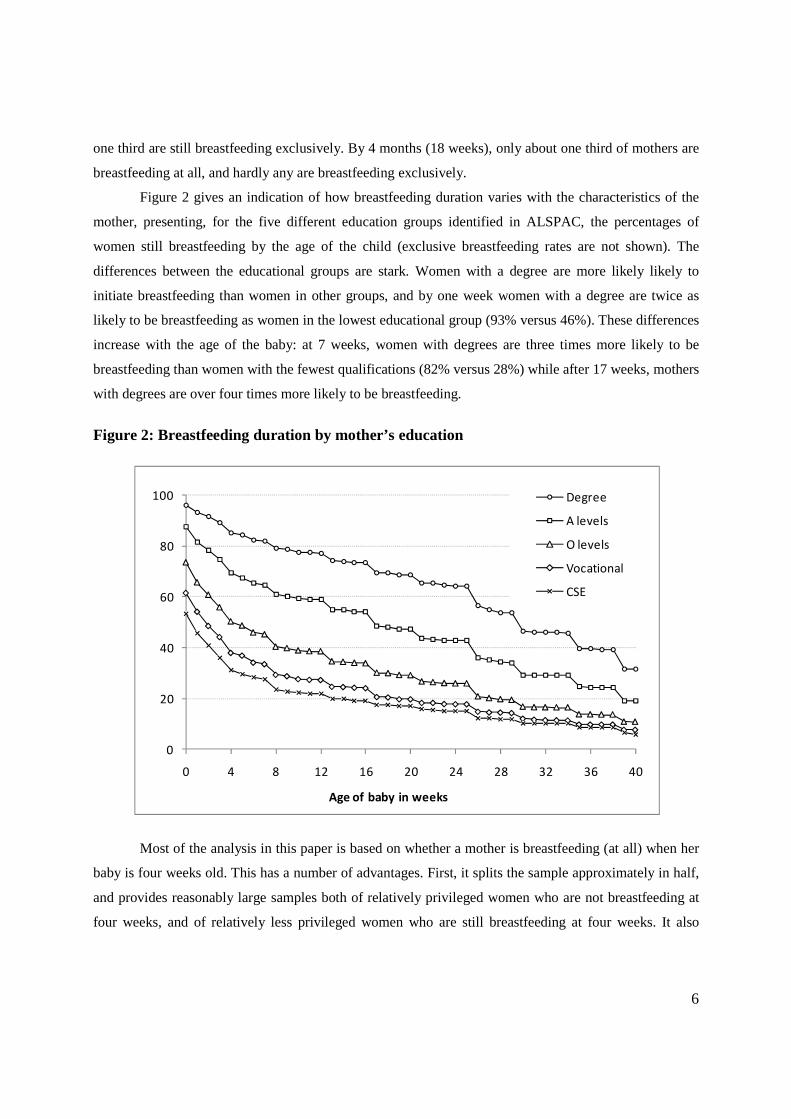
Figure 2 gives an indication of how breastfeeding duration varies with the characteristics of the
mother, presenting, for the five different education groups identified in ALSPAC, the percentages of
women still breastfeeding by the age of the child (exclusive breastfeeding rates are not shown). The
differences between the educational groups are stark. Women with a degree are more likely likely to
initiate breastfeeding than women in other groups, and by one week women with a degree are twice as
likely to be breastfeeding as women in the lowest educational group (93% versus 46%). These differences
increase with the age of the baby: at 7 weeks, women with degrees are three times more likely to be
breastfeeding than women with the fewest qualifications (82% versus 28%) while after 17 weeks, mothers
with degrees are over four times more likely to be breastfeeding.
Figure 2: Breastfeeding duration by mother’s education
Most of the analysis in this paper is based on whether a mother is breastfeeding (at all) when her
baby is four weeks old. This has a number of advantages. First, it splits the sample approximately in half,
and provides reasonably large samples both of relatively privileged women who are not breastfeeding at
four weeks, and of relatively less privileged women who are still breastfeeding at four weeks. It also
0
20
40
60
80
100
0 4 8 12 16 20 24 28 32 36 40
Age of baby in weeks
Degree
A levels
O levels
Vocational
CSE

7
largely circumvents the issue of solid food, as only a tiny percentage of babies are given solid food before
four weeks old.
Figure 3 shows the relationship between breastfeeding and academic outcomes at age 14. The
three lines on the graph represent test scores in English, Maths and Science; each arises from the Lowess
local smoothing procedure. In each of the three areas, the relationship between breastfeeding and higher
scores is clear. The relationship is most marked for English, where babies who were not breastfed at all go
on to score around one third of a standard deviation below average at age 14, while those who were
breastfed for a year go on to score well over half a standard deviation higher. Thus, the raw difference
between the outcomes of a child who was never breastfed, and a child who was breastfed for over a year,
is in the order of a whole standard deviation. Differences in the other subjects are less stark but still large:
in Maths, the difference is around 0.8 of a standard deviation, while in science it is 0.4 of a standard
deviation.
Figure 3: Test scores at age 14 by breastfeeding duration: raw relationships
Given what we know from Figure 2 about the relationship between breastfeeding durations and
maternal characteristics, it is clearly not the case that the association between breastfeeding and cognitive
outcomes is entirely causal; in fact, it is likely that most of the relationship is not causal. What this paper
is trying to establish is: is any of the relationship causal, and if so, how much?
-.4-.2
0.2
.4.6
Mea
n te
st s
core
, sta
ndar
dize
d
0 4 8 12 16 20 24 28 32 36 40 44 48 52 56 60Age of baby in weeks
English Maths Science

8
2.4 Other control variables
ALSPAC also contains an extremely rich set of background variables (see Table A in Appendix
A for a precise definition of all variables). Table 2 presents the mean and standard errors for each of these
variables by breastfeeding status. In general, mothers who do not breastfeed when their babies are 4
weeks old have generally worse pregnancy outcomes, worse health, belong to lower socio-economic
groups, are more likely to be in a non-marital relationship, have worse parenting practices. As mentioned
before, mothers and fathers of children who are breastfed have higher educational attainments. In
particular, parents of breastfed babies are more likely to have a university degree or A-levels than parents
of babies who were not breastfed at 4 weeks. Mothers who breastfeed when the baby is 4 weeks old are
more likely to work in the labor force when their babies are 18 and 21 weeks respectively. Interestingly
however, there does not seem to be a significant difference in terms of the hours of formal childcare when
the child is 21 weeks between mothers who breastfeed and who do not breastfeed.

9
Table 2: descriptive statistics
3 Empirical Strategy: Propensity Score Matching
We use propensity score matching to estimate the effect of breastfeeding on children’s outcomes,
and to establish the extent to which the relationship between breastfeeding and children’s outcomes is
causal, that is, how far children’s outcomes are the result of breastfeeding, rather than arising from
heterogeneity or selection. The problem is that the decision to either breastfeed or not cannot be
considered exogenous with respect to children’s outcomes: it is related to maternal characteristics, which
are themselves related to child outcomes. Previous studies using multivariate regression analysis do not
Cigarettes at 32w C-section Female Birth weight Gestation in weeks Mother's age at birthNo breastfeeding 3.21 0.12 0.48 3,366.42 39.32 27.02 (0.078) (0.004) (0.007) (17.006) (0.185) (0.159)Breastfeeding 1.27 0.10 0.49 3,443.19 39.52 29.45 (0.070) (0.004) (0.007) (15.866) (0.173) (0.149)N 11,402.00 11,761.00 14,146.00 13,901.00 14,619.00 14,663.00
Cannabis occasionally Cannabis often Alcohol occasionally Alcohol often Mother bad healthNo breastfeeding 0.02 0.01 0.99 0.00 1.82 (0.002) (0.001) (0.003) (0.001) (0.012)Breastfeeding 0.03 0.01 0.99 0.01 1.72 (0.002) (0.001) (0.003) (0.001) (0.011)N 11,310.00 11,310.00 9,884.00 9,884.00 12,146.00
Own house Private Rented Number of Rooms Neighbourhoold qual. Mother in CareNo breastfeeding 0.67 0.07 1.45 7.98 0.04 (0.006) (0.004) (0.014) (0.049) (0.002)Breastfeeding 0.83 0.07 1.72 8.29 0.02 (0.006) (0.003) (0.013) (0.045) (0.002)N 13,448.00 13,448.00 13,413.00 12,994.00 12,037.00
Mother cohabiting Mother married No breastfeeding 0.24 0.04 (0.006) (0.002)Breastfeeding 0.17 0.02 (0.005) (0.002)N 13,564.00 13,564.00
Father Degree Father A-levels Father O-levels Father vocational Father CESNo breastfeeding 0.09 0.28 0.26 0.12 0.25 (0.006) (0.007) (0.007) (0.004) (0.006)Breastfeeding 0.29 0.30 0.22 0.07 0.11 (0.005) (0.006) (0.006) (0.004) (0.005)N 10,772.00 10,772.00 10,772.00 10,772.00 10,772.00
Mother degree Mother A-levels Mother O-levels Mother vocational Mother CESNo breastfeeding 0.05 0.17 0.42 0.14 0.22 (0.005) (0.006) (0.007) (0.004) (0.005)Breastfeeding 0.21 0.30 0.34 0.07 0.08 (0.004) (0.005) (0.006) (0.004) (0.005)N 11,710.00 11,710.00 11,710.00 11,710.00 11,710.00
Mother work 18w Mother will work Hours care at 21wMother hours worked 21mNo breastfeeding 0.57 0.00 24.95 6.34 (0.007) (0.000) (0.371) (0.149)Breastfeeding 0.66 0.00 24.74 8.65 (0.007) (0.000) (0.328) (0.139)N 11,716.00 470.00 10,533.00 14,663.00
Smack at 3y Shout at 3y Read at 18m Father read at 18mNo breastfeeding 2.87 4.13 3.47 2.47 (0.020) (0.020) (0.016) (0.020)Breastfeeding 2.70 4.08 3.63 2.73 (0.017) (0.017) (0.014) (0.018)N 9,453.00 9,453.00 11,056.00 10,497.00
Mother Breastfed Father Breastfed Mother Breastfeeding Father Breastfeeding Mother intention to Attitudes Attitudes breastfeed 4w
No breastfeeding 0.46 0.59 14.32 14.39 0.38 (0.008) (0.010) (0.070) (0.081) (0.006)Breastfeeding 0.67 0.72 17.57 16.45 0.90 (0.007) (0.009) (0.063) (0.072) (0.005)N 10,496.00 6,207.00 12,158.00 9,634.00 11,995.00
Work and Intention to Work
Parenting Practices
Breastfeeding Attitutdes and Intentions
Pregnancy
Health
Socio-Economic Variables
Marital Status
Father's Education
Mother's Education

10
take into account this possible endogeneity, and if the decision to breastfeed is indeed endogenous, they
will generate biased estimates.
A standard approach to this problem is to implement an Instrumental Variables specification, utilising
as instruments variables that are correlated with the endogenous variable (here, whether the baby is
breastfed), but independent of the error term. However, it is difficult to find valid and powerful
instruments in our application. We therefore take the alternative approach of implementing propensity
score matching (PSM) techniques, which are described below; we complement the analysis with
sensitivity checks with respect to deviations from the conditional independence assumption following a
bounding approach similar to that proposed by Rosembaum (2002).
We implement the propensity score matching procedure using the psmatch2 and pstest modules in
STATA (Leuven and Sianesi 2003); the sensitivity testing is implemented using the mhbounds module in
STATA.
3.1 The principles behind Propensity Score Matching
Our interest lies in estimating the effect of breastfeeding on child outcomes, net of other observed
factors which influence these outcomes. Ideally, we would like to compare the outcomes of children who
were breastfed, with the outcomes of children who were not breastfed (the ‘‘counterfactual’’ situation).
The problem is, of course, that for any given individual the two scenarios are mutually exclusive,
preventing a direct comparison between the two. PSM techniques were developed as a means of
generating an approximation to the counterfactual situation (Rosenbaum and Rubin 1983). In simple
terms, the application of this method for our case is as follows:
A ‘‘treatment’’ is defined, which in this case is having been exclusively breastfed during the first
four weeks since birth. Children are divided into two groups:
• Di = 1, those who undertook the ‘‘treatment’’ (i.e., who were breastfed)
• Di = 0, a ‘‘control’’ group (those who were not breastfed)
Each child in the ‘‘treatment’’ group is then paired with one or more children in the ‘‘control’’ group,
who are as similar as possible in terms of a range of observable characteristics measured prior, during,
and after the event, and the difference between groups in the child’s outcome variable of interest
(cognitive or non-cognitive outcome) is measured. If the differences in characteristics between the
‘‘treatment’’ and ‘‘control’’ groups are captured by the observable covariates, then matching methods
yield an unbiased estimate of the average impact of breastfeeding on the treated (i.e. those who actually
were breastfed).

11
Matching is implemented in the following way. From the data, each child is assigned a
probability of falling into the treatment group, conditional on a set of covariates X. This probability is
estimated using a probit regression. This conditional probability is referred to as the individual’s
‘‘propensity score’’. The propensity score for individual i is defined as:
P(Xi)= Pr(Di= 1|Xi) (1)
where P(Xi) is the propensity score, and Xi is the vector of explanatory variables measured at time t, prior
to the first four weeks since birth (when our breastfeeding variable is recorded). Rosenbaum and Rubin
(1983) showed that conditioning on this propensity score is equivalent to conditioning directly on the set
of background variables X. In particular, if exposure to treatment is random within each cell as defined by
Xi, it will also be random within cells defined by the propensity score variable P(Xi). This is commonly
referred to as conditional independence or strong ignorability.
3.2 The Matching Procedure
At the matching stage, individuals in the treated and control groups are paired according to their
propensity scores. There are several different algorithms by which individuals may be matched: these are
explained in Becker and Ichino (2002), Smith and Todd (2005) and Caliendo and Kopeinig (2005). We
use the ‘‘nearest neighbour’’ algorithm, whereby each individual in the treatment group is matched with
the individual(s) in the control group whose propensity score(s) are closest to his or her own. Rather than
use a single nearest neighbour, we work with an average of the individual’s five nearest neighbours, in
order to reduce the variance of our estimates.4 In order to exclude poor ‘‘matches’’, we impose the
restriction (a “caliper”) that all matched pairs must have propensity scores within 0.00025 of each other:
individuals in the treatment group without a sufficiently near neighbour are excluded from the sample.
The set of observations which remain in the sample after the matching procedure is called the
common support. The matching procedure we use results in approximately 35% of otherwise valid
observations being removed from the sample. Intuitively, this may be thought of as removing from the
sample all those breastfeeding mothers who do not have anyone in the non-breastfeeding group
sufficiently similar in characteristics to them; members of the non-breastfeeding group will not appear in
the analysis unless they are sufficiently similar (and more similar than other non-breastfeeding mothers)
to a breastfeeding mother.
4 In all PSM algorithms, there is a trade-off between bias and variance. We found that nearest neighbour methods gave the best reduction in bias. Increasing the number of neighbours reduces the variance of estimates (since more information is used), but increases bias (since the mean quality of the matches will be lower). In this analysis, we found that using five neighbours gave the most acceptable balance between reduced variance and increased bias.

12
In our analysis, matching is carried out using the following variables: the child’s sex; his or her
age relative to others in the same cohort; the baby’s birth weight, gestation and mode of delivery (vaginal
or caesarean section); the mother’s age at birth; the parents’ marital status; the education levels of both
parents, housing tenure, the size of the home, neighbourhood characteristics, whether the mother had been
in care as a child, the mother’s health, whether mother had smoked during pregnancy; the mother’s use of
cannabis and alcohol; mother’s labour market participation and future labour market intentions; the
father’s employment; whether the child spent time in non-maternal care and for how long; aspect of
parenting (how frequently the parents read to the child, and smack, or shout at the child). Additionally –
and importantly – we match on whether the mother and father had been breastfed themselves as babies;
on their attitudes towards breastfeeding, measured prenatally; and of their stated intentions over how their
child would be fed, again recorded prenatally. A precise definition of these variables, together with
summary statistics, can be found in the Appendix.
After the matching process, we check that a ‘‘balancing property’’ holds for the matched sample:
i.e. that each of the observable covariates within the treatment group has the same average value within
the matched control group. Equality of the first moments does not imply equality of the entire distribution
of covariates, but for binary variables—and most of the covariates used here are of this type—there is no
need to compare higher order moments.
3.3 Evaluation Parameters
Propensity score matching generates several evaluation parameters. In this section, we explain
two such parameters: the average treatment effect on the treated (ATT) and the average treatment effect
on the untreated (ATU).
We may think of an outcome Y, defined under two observed or hypothetical scenarios: Y0, which
is the outcome in the case that the young person receives the treatment, and Y1, which is the outcome in
the case that he or she does not receive the treatment.
Outcome if breastfed Outcome if not breastfed
Treatment group (leavers) Y1|D = 1 (observed) Y0|D = 1 (unobserved)
Control group (stayers) Y1 | D = 0 (unobserved) Y0|D = 0 (observed)
We are interested in the effect of the ‘‘treatment’’ on both the treatment and the control groups.
For the treatment group, this effect is termed ATT (average treatment effect on the treated) and measures
the difference between the average outcome measure for babies who were breastfed, and the average
outcome measure for the same group under the hypothetical scenario that they had not been breastfed.

ATT = E(Yi,1|Di =1)
However, the second argument in Eq. 2 is not observed, so we
of Y0 over the matched sample of children who were not breastfed, estimating
ATT = E(Yi,1|Di =1
Similarly, we may estimate the average treatment effect on the control
ATU = E(Yi,1|Di =1, i
This measure refers to the group who did not breastfed, and estimates the difference between the
average outcome measure in (a) the hypothetical case that they were breastfed, and (b) the actual case in
which they were not breastfed. Note that Eq. 4 is ide
different common support (denoted
‘‘matchable’’ members of the treatment group, plus the controls which are chosen to
whereas the common support for ATU
those members of the treatment group which are chosen to match them.
Under the assumption of homogene
results. However, as Heckman et al. (1997) have shown, treatment effects are rarely homogeneous.
therefore report both sets of estimates
4 Results: breastfeeding and cognitive outcomes
We begin this section by presenting results from Ordinary
against which to compare our PSM results.
5 Psmatch2 generates both ATT and ATU estimates in the same step. However, in order to allow the common support to vary between the two parameters, we as not having been breastfed during the calculated in the first set of estimates, and this way we are able to parameters, and to verify that the balancing property holds for our estimates of AT
=1) -E(Yi,0|Di =1)
However, the second argument in Eq. 2 is not observed, so we replace it with the observed values
of Y0 over the matched sample of children who were not breastfed, estimating
=1, i ) - E(Yi,0|Di =1, i )
Similarly, we may estimate the average treatment effect on the control (untreated)
=1, i ) - E(Yi,0|Di =1, i )
This measure refers to the group who did not breastfed, and estimates the difference between the
average outcome measure in (a) the hypothetical case that they were breastfed, and (b) the actual case in
which they were not breastfed. Note that Eq. 4 is identical to Eq. 3, except that it is defined over a
support (denoted instead of ). The common support for ATT consists of all
‘‘matchable’’ members of the treatment group, plus the controls which are chosen to
ereas the common support for ATU consists of all ‘‘matchable’’ members of the control group, plus
those members of the treatment group which are chosen to match them.
Under the assumption of homogeneous treatment effect ATT and ATU
results. However, as Heckman et al. (1997) have shown, treatment effects are rarely homogeneous.
therefore report both sets of estimates5.
Results: breastfeeding and cognitive outcomes
We begin this section by presenting results from Ordinary Least Squares regressions, as a benchmark
against which to compare our PSM results.
Psmatch2 generates both ATT and ATU estimates in the same step. However, in order to allow the common
support to vary between the two parameters, we implement a second set of estimates where the trebreastfed during the first four weeks of life. Here, the estimated ATT is equivalent to the AT
calculated in the first set of estimates, and this way we are able to allow the common support to vary between the verify that the balancing property holds for our estimates of ATU as well as ATT.
13
(2)
replace it with the observed values
(3)
(untreated) group
(4)
This measure refers to the group who did not breastfed, and estimates the difference between the
average outcome measure in (a) the hypothetical case that they were breastfed, and (b) the actual case in
ntical to Eq. 3, except that it is defined over a
). The common support for ATT consists of all
‘‘matchable’’ members of the treatment group, plus the controls which are chosen to match them,
consists of all ‘‘matchable’’ members of the control group, plus
ous treatment effect ATT and ATU should give the same
results. However, as Heckman et al. (1997) have shown, treatment effects are rarely homogeneous. We
Least Squares regressions, as a benchmark
Psmatch2 generates both ATT and ATU estimates in the same step. However, in order to allow the common implement a second set of estimates where the treatment is defined
of life. Here, the estimated ATT is equivalent to the ATU allow the common support to vary between the
as well as ATT.

14
4.1 OLS Results
Table 3 presents estimates of the relationship between breastfeeding and test scores from OLS
regressions. Three specifications are presented. Each controls for whether the child was breastfed or not at
four weeks of age. The first specification includes very few additional controls – only the child’s sex and
his or her age at the time of taking the test. The second specification adds in a range of variables
indicating parental education, while the third specification controls for the full set of variables described
in Section 3. Standard errors are in parentheses, and significance is shown by stars.
Table 3: OLS regressions: coefficients on breastfeeding
Specification
1
Specification
2
Specification
3
En
try
Le
ve
l Reading 0.312***
(0.022)
0.140 ***
(0.022)
0.102 ***
(0.026)
Writing 0.212***
(0.021)
0.077 **
(0.022)
0.052
(0.027)
Maths 0.286***
(0.021)
0.106 ***
(0.022)
0.041
(0.026)
Ke
y S
tag
e 1
Reading 0.197***
(0.025)
0.091 **
(0.026)
0.057
(0.031)
Writing 0.338***
(0.020)
0.130 ***
(0.020)
0.072 **
(0.023)
Maths 0.332***
(0.020)
0.141 ***
(0.020)
0.112 ***
(0.024)
Ke
y S
tag
e 2
English 0.402***
(0.019)
0.141 ***
(0.019)
0.088 ***
(0.022)
Maths 0.392***
(0.019)
0.143 ***
(0.019)
0.122 ***
(0.023)
Science 0.443***
(0.019)
0.190 ***
(0.019)
0.126 ***
(0.023)
Ke
y S
tag
e 3
English 0.437***
(0.021)
0.175 ***
(0.020)
0.139 ***
(0.024)
Maths 0.354***
(0.021)
0.149 ***
(0.022)
0.114 ***
(0.026)
Science 0.231***
(0.021)
0.120 ***
(0.022)
0.117 ***
(0.027)
Source: ALSPAC core sample. Standard errors in parentheses. Significance denoted by asterisks: * = 5%, ** = 1%, *** = 0.1%
Estimates in the first specification (essentially the raw relationship, controlling only for the child’s
sex and age at testing) indicate that breastfeeding is associated with test scores higher by about one third
of a standard deviation, with coefficients ranging from 0.197 (Reading, KS1) to 0.443 (Science, KS2). As

15
soon as parental education is controlled for (Specification 2) these estimates drop sharply, to
approximately one third of their original size. Estimates now range from 0.077 (Writing, entry level) to
0.190 (Science, KS2). As we would expect, controlling for additional factors reduces the estimates still
further – but in fact, not by very much. A case in point is the coefficient on English at KS3, which falls
from 0.437 to 0.175 between Specifications 1 and 2, but only to 0.139 in Specification 3. This suggests
that a very large amount of the heterogeneity between breastfeeding and non-breastfeeding families is
captured by parental education, with all the other controls together (including attitudes to breastfeeding
and intention to breastfeed) capturing only a small proportion after education is controlled for. The
estimates in the third specification are of the order of 10 per cent of a standard deviation; most of the
estimates remain statistically significant, although some estimates in the early years are not.
Because of the relationship between maternal characteristics and the likelihood of breastfeeding, we
cannot claim that these estimates represent a causal effect: they may simply arise from the endogeneity of
the breastfeeding decision. We now present PSM estimates.
4.2 PSM Estimates
Table 4 presents estimates of ATTs obtained via PSM techniques, as explained in the previous
section, and compares them to the OLS estimates obtained depicted in Table 3. These PSM estimates are
analogous to the first set of figures, in that they represent the improvement in abilities associated with
breastfeeding during the first four weeks of a child’s life. However, the PSM results control for the
mother’s selection into breastfeeding, i.e., for the fact that more able mothers (who are more likely to also
have more able children) are also the ones who are more likely to breastfeed. Therefore, the difference
between the OLS and PSM results gives an indication of the size of the selection effect.
The PSM estimates of the ATT are essentially the same as the OLS coefficients with a large set of
control variables. In general the significance levels are a little lower, which may be due to the fact that the
PSM estimates are run on the smaller sample of the common support. However, the estimated effects are
still significant at all ages after school entry level, confirming our previous result that controlling for a
wide range of factors, children breastfed for four weeks or more do better than children breastfed for less
than four weeks by about one tenth of a standard deviation (slightly less at younger ages, and slightly
more at older ages). The use of the PSM technique to control for heterogeneity suggests that these
differences are likely to be causal.
The third column in Table 4 presents results from the ATU. Differences between ATT and ATU
would suggest that breastfeeding had different effects on the group of babies who are currently likely to
be breastfed, and the group of babies not currently likely to be breastfed. In fact, the ATT and ATU
estimates are rather similar, suggesting that to the extent that breastfeeding does have a causal effect on

16
cognitive outcomes, that effect does not differ on average between children whose mothers are and are
not likely to breastfeed them.
Table 4: Comparing OLS and PSM coefficients
OLS PSM: ATT PSM: ATU
En
try
Le
ve
l Reading 0.102 ***
(0.026)
0.101 *
(0.046)
0.152 **
(0.044)
Writing 0.052
(0.027)
0.042
(0.043)
0.077
(0.042)
Maths 0.041
(0.026)
0.062
(0.043)
0.091 *
(0.043)
Ke
y S
tag
e 1
Reading 0.057
(0.031)
0.154 **
(0.050)
0.111 *
(0.052)
Writing 0.072 **
(0.023)
0.097 **
(0.038)
0.080 *
(0.038)
Maths 0.112 ***
(0.024)
0.108 **
(0.038)
0.135 ***
(0.038)
Ke
y S
tag
e 2
English 0.088 ***
(0.022)
0.129 ***
(0.036)
0.127 ***
(0.035)
Maths 0.122 ***
(0.023)
0.159 *
(0.036)
0.108 **
(0.035)
Science 0.126 ***
(0.023)
0.080 *
(0.036)
0.114 **
(0.035)
Ke
y S
tag
e 3
English 0.139 ***
(0.024)
0.133 **
(0.041)
0.178 ***
(0.040)
Maths 0.114 ***
(0.026)
0.119 **
(0.039)
0.124 **
(0.040)
Science 0.117 ***
(0.027)
0.118 **
(0.039)
0.112 **
(0.039)
Source: ALSPAC core sample. Standard errors in parentheses. Significance denoted by asterisks: * = 5%, ** = 1%, *** = 0.1%
5 Conclusion
This paper aims to rigorously disentangle the effects of breastfeeding from the effects of mother´s
characteristics and other unobservables in determining children´s cognitive and non-cognitive outcomes.
Using a very rich longitudinal data, ALSPAC, we implement a PSM technique to pin down the causal
effect of breastfeeding on children´s cognitive outcomes. We find statistically significant effects of
breastfeeding at all ages after school entry level. PSM estimates of the ATT are essentially the same as
the OLS coefficients when a large set of observed variables is controlled for, suggesting that children
breastfed for four weeks or more do better than children breastfed for less than four weeks by about one
tenth of a standard deviation (slightly less at younger ages, and slightly more at older ages). We also fail
to find any differences between the ATT and ATU estimates, suggesting that to the extent that

17
breastfeeding does have a causal effect on cognitive outcomes, that effect does not differ on average
between children whose mothers are and are not likely to breastfeed them. Further investigation of
heterogeneity among mothers and children is however needed.
Although we view our results as strong evidence that mother´s socio-economic background cannot
entirely explain the observed effect of breastfeeding on children´s cognitive outputs, we acknowledge that
unobserved heterogeneity remains an issue. For example, determinants of children´s cognitive outcomes
not considered in our analysis include the mother’s IQ. We note however that the richness of the data
allows us to control for observed heterogeneity in a very precise way. Furthermore, we find that a very
large amount of the heterogeneity between breastfeeding and non-breastfeeding families is captured by
parental education, with all the other controls together (including attitudes to breastfeeding and intention
to breastfeed) capturing only a small proportion after education is controlled for.
Our results can provide insights into the short term and long term effects of breastfeeding. The
relevance of this research to policy is clear. The World Health Organisation recommends exclusive
breastfeeding during the first six months, and the continuation of breastfeeding alongside solid foods for
two years (World Health Organisation 2003). The UK Department of Health has identified breastfeeding
promotion as a key strategy in reducing inequalities in health, and has funded several initiatives and
projects which aim to increase breastfeeding rates, particularly among women from disadvantaged groups
(De0partment of Health 2003). Given the huge social gradient in breastfeeding rates, with the most
privileged mothers currently being many times more likely to breastfeed than the least privileged mothers,
our results show that breastfeeding may well be a significant route for the intergenerational transmission
of human capital, and for policy-making aimed at reducing inequality.

18
References Auestad N.,et al., (2003) Visual, cognitive, and language assessments at 39 months: A follow-up
study of children fed formulas containing long-chain polyunsaturated fatty acids to 1 year of age, Pediatrics, Vol.112, Issue 3, pp.177-183
Anderson J.W., Johnstone B. M., Remley D.T .,(1999) Breast-feeding and cognitive development: a meta-analysis, American Journal of Clinical Nutrition, Vol.70, Issue 4 pp.525-535
Baker, M. and K. Milligan (2007): “Maternal employment, breastfeeding, and health: Evidence from maternity leave mandates”, NBER Working Paper 13188. NBER, Cambridge: Mass.
Bowles, S., Gintis, H. and M. Osborne (2001): “The determinants of earnings: A behavioural approach”, Journal of Economic Literature, vol. 39(4): 1137-1176
Broadfoot, M., Britten, J., Tappin, D. M. and J. M. MacKenzie (2005): “The Baby Friendly Hospital Initiative and breast feeding rates in Scotland', Archives of Disease in Childhood. Fetal and neonatal edition, 90(2): F114-116
Caicedo et. al.,(2010) Violent delinquency in a Brazilian birth cohort: the roles of breast feeding, early poverty and demographic factors, Paediatric and Perinatal Epidemiology, Vol.24. Issue I, pp.12-23
Carneiro, P. and J. Heckman (2003): “Human capital policy”, IZA Discussion Paper n. 821. IZA: Bonn
Caspi, A., Williams B., Kim-Cohen, J. et al. (2007): “Moderation of breastfeeding effects on the IQ by genetic variation in fatty acid metabolism”, Proceedings of the National Academy of Sciences, 5 November
Cohen, R., Mrtek, M.B. and R.G. Mrtek (1995): “Comparison of maternal absenteeism and infant illness rates among breast-feeding and formula-feeding women in two corporations”, American Journal of Health Promotion, vol. 10(2): 148-153
Cunha, F. and J. Heckman (2008): “Formulating, identifying and estimating the technology of cognitive and noncognitive skill formation”, forthcoming in Journal of Human Resources
Del Bono, E., Ermisch, J. F. And M. Francesconi (2008): “Intra-family resource allocations: A dynamic model of children’s birth weight”, mimeo. University of Essex: Colchester
Dennis, C.L. (2003): “Cost burden of postnatal depression significant in the UK”, PharmacoEconomics and Outcomes News, vol. 1(399): 7-7(1)
Denny K., Doyle O.,(2010) The causal effect of breastfeeding on children’s cognitive development: A quasi-experimental design, University College Dublin WP10/05
Department of Health (2003): Infant Feeding Initiative. A report evaluating the breastfeeding practice projects 1999-2002. Department of Health, TSO: London
Der, G., Batty, G. D. and I. J. Deary (2006): “Effect of breast feeding on intelligence in children: prospective study, sibling pairs analysis, and meta-analysis”, British Medical Journal, vol. 333(7575): 945-xx.

19
Dey, M. S. and C. J. Flinn (2005): “An equilibrium model of health insurance provision and wage determination”, Econometrica, vol. 73 (2): 571-627
DiGirolamo, A. M., Grummer-Strawn, L. M. and S. Fein (2001): “Maternity care practices: Implications for breastfeeding”, Birth, vol. 28(1): 94-100
Duncan, G. and R. Dunifon (1998): “Soft skills and long-run labor market success”, Research in Labor Economics, vol.17: 123-150
Dyson, L., Renfrew, M., McFadden, A., et al. (2006): Promotion of breastfeeding initiation and duration. Evidence into practice briefing. National Health Service, National Institute for Health and Clinical Excellence: London
Evenhouse E., Reilly S., (2005) Improved estimates of the benefits of breastfeeding using sibling comparisons to reduce selection bias, Health Services Research Vol.40, Issue 6 pp. 1781-1802
Feinstein, L. (2003): “Inequality in the early cognitive development of British children in the 1970 cohort”, Economica, vol. 70: 73-98
Fergusson D. M., Woodward L.J.,(1999)Breast feeding and later psychosocial adjustment , PAEDIATRIC AND PERINATAL EPIDEMIOLOGY, Vol.13, Issue 2, pp.144-157
Golding, J., Pembrey, M., Jones, R. and the ALSPAC Study Team (2001): “ALSPAC-The Avon Longitudinal Study of Parents and Children”, Paediatric & Perinatal Epidemiology, vol. 15: 74-87
Gregg, P. Washbrook, E., Propper, C., and S. Burgess (2005): “The effects of a mother's return to work decision on child development in the UK”, Economic Journal, vol. 115(501): F48-F80
Hansen, K. (2008): Millennium Cohort Study first, second and third surveys, A guide to the datasets. Third edition, Kirstine Hansen (ed.) with contributions from Jon Johnson, Heather Joshi, Lisa Calderwood, Elizabeth Jones, John MacDonald, Peter Shepherd, Kate Smith and the Millennium Cohort Team. Centre for Longitudinal Studies, Institute of Education, University of London: London
Health Promotion Agency for Northern Ireland (2006): Promoting breastfeeding for mothers returning to work. Health Promotion Agency for Northern Ireland: Belfast
Heckman, J., Stixrud, J. and U. Sergio (2006): “Effects of cognitive and noncognitive abilities on labor market outcomes and social behavior”, Journal of Labor Economics, vol. 24(3): 411-482
Henderson J.J., Evans S.F. and J.A. Straton (2003): “Impact of postnatal depression on breastfeeding duration”, Birth, vol. 30(3): 175-80
Hoorwood L. J., Fergusson D. M., (1998) Breastfeeding and Later Cognitive and Academic Outcomes, Paediatrics, Vol.101, Issue1, p. e9
Horowitz J.A. and J. Goodman (2004): “A longitudinal study of maternal postpartum depression symptoms”, Research and Theory for Nursing Practice, vol.18 (2-3):149-63
Illsley, R. (2002): “A city’s schools: From inequality of input to inequality of outcome”, Oxford Review of Education, vol. 28: 427-445

20
Ip, S., Chung, M., Raman, G., et al. (2007): “Breastfeeding and maternal and infant health outcomes in developed countries”, Agency for Healthcare Research and Quality Publication n. 07-E007
Josefsson A. and G. Sydsjö (2007): “A follow-up study of postpartum depressed women: recurrent maternal depressive symptoms and child behavior after four years”, Archive of Women’s Mental Health vol. 10(4):141-5
Julvez et. al. (2006) Attention behaviour and hyperactivity at age 4 and duration of breast-feeding, Acta Paediatrica Vol.96, Issue 6, pp. 842–847
Kelly, Y. and R. Watt (2005): “Breast feeding initiation and exclusive duration at 6 months by social class: Results from the Millennium Cohort Study”, Public Health Nutrition, vol.8: 417-421
Kendall-Tackett, K. (2007): “A new paradigm for depression in new mothers: the central role of inflammation and how breastfeeding and anti-inflammatory treatments protect maternal mental health”, International Breastfeeding Journal, vol. 2(6)
Kosmala-Anderson, J. and L. M. Wallace (2006): “Breastfeeding works: The role of employers in supporting women who wish to breastfeed and work in four organizations in England”, Journal of Public Health, vol. 28(3): 183-191
Knapp, M., McDaid, D., Evers, S., et al. (2008): Cost-effectiveness and mental health, MHEEN II Policy Briefing 2. Personal Social Services Research Unit: London
Kramer M.S.,(2008), Effects of prolonged and exclusive breastfeeding on child behavior and maternal adjustment: Evidence from a large randomized trial. Pediatrics 2008, Vol.121 No.3, pp.e435-e440.
Kramer, M. S., Chalmers, B., Hodnett, E.D. et al. (2001): “Promotion of Breastfeeding Intervention Trial (PROBIT). A randomized trial in the republic of Belarus”, Journal of the American Medical Association, vol. 285(4): 413-420
Lanting et. al.,(1994) Neurological differences between 9-year-old children fed breast-milk or formula-milk as babies , The Lancet, Vol. 344, Issue 8933, 1994, pp. 1319-1322
E. Leuven and B. Sianesi. (2003). "PSMATCH2: Stata module to perform full Mahalanobis and propensity score matching, common support graphing, and covariate imbalance testing". http://ideas.repec.org/c/boc/bocode/s432001.html
Marshall, Alfred (1980). Principles of Economics. Macmillan.
Maternity Alliance (1997): Breastfeeding and Work. Facing the management challenge. The Maternity Alliance: London
Merewood, A., Mehta, S. D., Chamberlain, L. B., et al. (2005): “Breastfeeding rates in US Baby-Friendly Hospitals: Results of a national survey”, Pediatrics, vol. 116(3): 628-634
Merten, S., Dratva, J. and U. Ackermann-Liebrich (2005): “Do Baby-Friendly hospitals influence breastfeeding duration on a national level?”, Pediatrics, vol. 116(5): e702-708
Montgomery et. al. (2006) Breast feeding and resilience against psychosocial Stress, Archives of Disease in Childhood, Vol. 91, pp.990-994

21
Mortensen et. al., (2002) The Association Between Duration of Breastfeeding and Adult Intelligence, The Journal of the American Medical Association, Vol.287, pp.2365-2371
Mueller, G. and E. Plug (2006): “Estimating the effect of personality on male-female earnings”, Industrial and Labor Relations Review, vol. 60(1): 3-22
Niegel et al.,(2008) Difficult temperament, breastfeeding, and their mutual prospective effects: the Norwegian Mother and Child Cohort Study, J Dev Behav Pediatr. Vol. 29(6), pp. 458-562
Oddy W. H., et. al. ( 2010) The Long-Term Effects of Breastfeeding on Child and Adolescent Mental Health: A Pregnancy Cohort Study Followed for 14 Years , Journal of Pediatrics, Vol. 156 Issue 4, pp. 568-574
Oddy, W. H. (2006): “Fatty acid nutrition, immune and mental health development from infancy through childhood', in J. D. Huang (ed.) Frontiers in Nutrition Research. Nova Science Publishers
Oyer, P. (2005): “Salary or benefits?”, NBER Working Paper n. 11817. NBER, Cambridge: Mass.
Patel, R. R., Liebling, R. E. and D. J. Murphy (2003): “Effect of operative delivery in the second stage of labor on breastfeeding success”, Birth, vol. 30(4): 255-260
Pérez-Escamilla, R., Maulén-Radovan, I. and K. G. Dewey (1996): “The association between cesarean delivery and breast-feeding outcomes among Mexican women”, American Journal of Public Health, vol. 86(6): 832-836
Philipp, B. L., Merewood, A., Miller, L. W., et al (2001): “Baby-Friendly Hospital Initiative improves breastfeeding initiation rates in a US hospital setting”, Pediatrics, vol. 108(3): 677-681
Pincus, H. A. and A.R. Pettit (2001): “The societal costs of chronic major depression”, Journal of Clinical Psychiatry, vol. 62(6): 5-9
Quinn,P. J. et. al. (2001) The effect of breastfeeding on child development at 5 years: A cohort study, Journal of Paediatrics and Child Health, Vol. 37, Issue 5, pp. 465-469
Robinson M., et al.,(2008) Pre- and postnatal influences on preschool mental health: a large-scale cohort study , Journal of Child Psychology and Psychiatry Vol. 49, Issue 10, pp. 1118-1128
Rosenbaum, P. and D. Rubin (1984): “Reducing bias in observational studies using subclassification on the propensity score”, Journal of the American Statistical Association, vol. 125: 305-353
Rowe-Murray, H. J. and J. R. W. Fisher (2002): “Baby Friendly hospital practices: Cesarean section is a persistent barrier to early initiation of breastfeeding”, Birth, vol. 29 124-131
Sacker et al., (2006) Breastfeeding and Developmental Delay: Findings From the Millennium Cohort Study, Pediatrics Vol.118, Issue 3, pp. e682-689
Seimyr L., Edhborg M and W. Lundh (2004): “In the shadow of maternal depressed mood: experiences of parenthood during the first year after childbirth”, Journal of Psychosomatic Obstetrics and Gynecology, vol. 25(1): 23-34

22
World Health Organization (2003): Global strategy for infant and young child feeding. World Health Organization: Geneva
Worobey J., (1998) Feeding method and motor activity in 3-month-old human infants, Journal of Perceptual and Motor Skills, Vol. 86(3 Pt 1), pp.883-95

23
Appendix A
Table A.1 List of variables used in the analysis
Outcome Variables Entry assessment
Language Reading Writing Mathematics Social skills Problem solving Large motor Small motor
Key Stage 1 Reading Comprehension Writing Spelling Mathematics
Key Stage 2 and 3 English Consists of a writing tasks, a reading tasks, and a spelling task. The writing tasks
is made up of a longer task (45 minutes, max. 30 marks) and a shorter task (30 minutes, max. 16 marks). The spelling task is assessed as part of the shorter task (max 4 marks). The reading task is made up of a reading paper (1hr 15 min, max 32 marks) and a Shakespeare paper (45 min, max 18 marks).
Mathematics Paper 1 (a non-calculator paper) (1hr) (60 marks), a paper 2 (a calculator paper) (1hr) (60 marks), and a mental mathematics test (20mins) (30 marks).
Sciences 2 papers of 1hr each.
Control Variables: Breastfeeding variables:
Main control: A dummy variable (feed4wany ) that takes value 1 if the child was given any breast milk at week 4 after birth. Attitudes and intentions: An indicator variable (M_bf) that takes value one if the mother/father was breastfed as a baby, a variable indicating breastfeeding attitudes of the mother and father (M_bfatt), a dummy variable (M_intend_bf4w) that takes value one if the mother/father has intentions to breasfeed at 1 month after the birth,
Age at the time of the test: Four variables (tstEage, tst1age tst2age tst3age) that indicate the age of the child (in months) at which he or she sited the test.
Socio-demographic variables (at or during pregnancy): A dummy that takes value 1 if the child is a female (fem), two dummies for house tenure (tenure_own and tenure_rent) that take value 1 if the mother owned the house or rented the house during pregnancy, the number of living rooms in the house during pregnancy (rooms), neighborhood indicators with higher values indicating a better neighborhood (neigh_q), three dummies (mastat) indicating the marital status of the mother at the time of pregnancy (married, cohabiting, or separated/divorce), 5 dummies (M_ed and F_ed) indicating the mother’s and

24
father’s education level (CSE, Vocational, O level, A level, degree), indicator variable that takes value 1 if the mother is in local authority care (M_care), an indicator variable (M_work18w) that takes value 1 if the mother was working at 18 weeks of the pregnancy, an indicator variable (M_willw*) that takes value 1 if the mother intends to work after birth, a variable (M_hrsw) indicating the mother’s number of hours worked when the child is 21 months old, a variable indicating the number of hours the child is in care at 21 months of age (hrscare).
Pregnancy and delivery information: Indicator taking value one if the mother is in bad health status (M_badh), mother’s age at birth (M_age_b), number of cigarettes a day (measured at 23 weeks of pregnancy, M_ncigs_AN32w), an indicatore variable (M_csec*) that takes value 1 if the mother had a cesarean section, a dummy variable indicating whether the mother took cannabis during pregnancy (cann), and a variable indicating whether the mother took alcohol during pregnancy (alcoh).
Parenting styles: Two variables taking values from 0 to 4 indicating the umber of times the mother/father reads to the child at the age of 18 months (M_read18m and F_read18m), two variables (smack and shout) measured when the child is 3 years of age that captures the frequency in which the child is smacked (1 never, 2 rarely, 3 once a month, 4 once a week, and 5 daily).
Copyright © 2022 FDOKUMEN