Factors affecting on-line estimation of diastereomer composition using Raman spectroscopy
6
FACTORS AFFECTING ON-LINE ESTIMATION OF DIASTEREOMER COMPOSITION USING RAMAN SPECTROSCOPY Sze-Wing Wong a , Christos Georgakis a, * , Gregory Botsaris a , Kostas Saranteas b , and Roger Bakale b a System Research Institute for Chemical & Biological Processes and Department of Chemical & Biological Engineering, Tufts University, Medford MA, USA b Chemical Process Research and Development, Sepracor Inc., Marlborough MA, USA Abstract: This paper addresses the estimation of fractional composition of two diastereomers during crystallization. The estimation is obtained through a Partial Least Square (PLS) model that utilizes on-line Raman spectroscopy and additional process information such as temperature and slurry density. Several PLS models are developed that incorporate conditions that either neglect or account for variability in the additional process variables. It is argued that the model that incorporates both temperature and slurry density is the most accurate. Copyright © 2005 IFAC Keywords: Calibration; Prediction Method; Regression Analysis; and Spectra Correlation * Corresponding author. Tel.: 617-627-2573; Fax: 617-627-3991 E-mail address: [email protected] 1. INTRODUCTION The manufacturing of pharmaceuticals often involves separation of enantiomers, which are chiral molecules that are mirror images of each other. Since the physical properties of both enantiomers (R = right handed and S = left handed) are the same, a traditional separation method such as crystallization by seeding is feasible but it becomes very sensitive to the experimental conditions (Qian and Botsaris, 1997). Thus, the pharmaceutical industry usually relies on achiral synthesis of the enantiopure product or reacts the enantiomers free base with another chiral acid to produce different diastereomers. A diastereomer is a molecule that has more than two chiral centres. The resulting diastereomers have different physical properties such as solubility and often crystallize into different crystal structures. With these differences, crystallization can effectively separate the desired product with very high purity. With strict government regulation in place, the purity of the final product is of crucial importance. Thus, the capability of on-line monitoring the optical purity of the crystals will help to develop a robust crystallization procedure. The on-line Raman spectroscopy is suitable in this application since Raman can detect the lattice vibrations corresponding to the translatory and rotatory motion of the entire molecule within the lattice structure of the crystal (Ferraro, 1971). As a result, Raman spectroscopy is capable in differentiating similar molecules with different crystal lattice structure. Several authors have demonstrated the ability of monitoring the changing compositions of two different crystals on-line during a solvent- mediated polymorphic transformation with Raman (Berglund, et al., 2000; Glennon, et al., 2003; Ono, et al., 2004; Myerson, et al., 2005). In addition, chemometric techniques can be applied to the Raman spectra to detect slight peak shifts and to remove noise from the signals (Falcon and Berglund, 2004; Rades, et al., 2002; Starbuck, et al., 2002). The use of fiber optic to collect data through an immersion probe allows analysis of solid phase composition in real-time. However, the Raman intensity of the solids depends on the amounts of the inelastic scattering of the solids detected by the analyzer within the detection zone. As a result, the relative Raman intensity corresponding to the diastereomers in the slurry will be impacted by a number of solid-state factors. Several authors have suggested that Raman intensity with respect to different polymorphs may be a function of particle size and shape (Glennon, et al., 2003 and Wang, et. al., 2002). This is based on the assumption that Raman signals primarily come from the surface of the crystals. Additionally, slurry density may be another solid-state factor since the number of crystals inside the detection zone will influence the Raman intensity of the solids. In theory, the Raman spectrum will change according to the amount of solvent and solids detected, and thus,
-
Upload
independent -
Category
Documents
-
view
4 -
download
0
Transcript of Factors affecting on-line estimation of diastereomer composition using Raman spectroscopy
FACTORS AFFECTING ON-LINE ESTIMATION OF DIASTEREOMER COMPOSITION USING RAMAN SPECTROSCOPY
Sze-Wing Wong a, Christos Georgakis a, *, Gregory Botsaris a, Kostas Saranteas b, and Roger Bakale b
a System Research Institute for Chemical & Biological Processes and Department of Chemical & Biological Engineering, Tufts University, Medford MA, USA
b Chemical Process Research and Development, Sepracor Inc., Marlborough MA, USA
Abstract: This paper addresses the estimation of fractional composition of two diastereomers during crystallization. The estimation is obtained through a Partial Least Square (PLS) model that utilizes on-line Raman spectroscopy and additional process information such as temperature and slurry density. Several PLS models are developed that incorporate conditions that either neglect or account for variability in the additional process variables. It is argued that the model that incorporates both temperature and slurry density is the most accurate. Copyright © 2005 IFAC Keywords: Calibration; Prediction Method; Regression Analysis; and Spectra Correlation
* Corresponding author. Tel.: 617-627-2573; Fax: 617-627-3991 E-mail address: [email protected]
1. INTRODUCTION The manufacturing of pharmaceuticals often involves separation of enantiomers, which are chiral molecules that are mirror images of each other. Since the physical properties of both enantiomers (R = right handed and S = left handed) are the same, a traditional separation method such as crystallization by seeding is feasible but it becomes very sensitive to the experimental conditions (Qian and Botsaris, 1997). Thus, the pharmaceutical industry usually relies on achiral synthesis of the enantiopure product or reacts the enantiomers free base with another chiral acid to produce different diastereomers. A diastereomer is a molecule that has more than two chiral centres. The resulting diastereomers have different physical properties such as solubility and often crystallize into different crystal structures. With these differences, crystallization can effectively separate the desired product with very high purity. With strict government regulation in place, the purity of the final product is of crucial importance. Thus, the capability of on-line monitoring the optical purity of the crystals will help to develop a robust crystallization procedure. The on-line Raman spectroscopy is suitable in this application since Raman can detect the lattice vibrations corresponding to the translatory and rotatory motion of the entire molecule within the lattice structure of the crystal (Ferraro, 1971). As a result, Raman spectroscopy is capable in differentiating
similar molecules with different crystal lattice structure. Several authors have demonstrated the ability of monitoring the changing compositions of two different crystals on-line during a solvent-mediated polymorphic transformation with Raman (Berglund, et al., 2000; Glennon, et al., 2003; Ono, et al., 2004; Myerson, et al., 2005). In addition, chemometric techniques can be applied to the Raman spectra to detect slight peak shifts and to remove noise from the signals (Falcon and Berglund, 2004; Rades, et al., 2002; Starbuck, et al., 2002). The use of fiber optic to collect data through an immersion probe allows analysis of solid phase composition in real-time. However, the Raman intensity of the solids depends on the amounts of the inelastic scattering of the solids detected by the analyzer within the detection zone. As a result, the relative Raman intensity corresponding to the diastereomers in the slurry will be impacted by a number of solid-state factors. Several authors have suggested that Raman intensity with respect to different polymorphs may be a function of particle size and shape (Glennon, et al., 2003 and Wang, et. al., 2002). This is based on the assumption that Raman signals primarily come from the surface of the crystals. Additionally, slurry density may be another solid-state factor since the number of crystals inside the detection zone will influence the Raman intensity of the solids. In theory, the Raman spectrum will change according to the amount of solvent and solids detected, and thus,
slurry density should be in direct proportion to Raman signal intensity of the solid phase. In the present work, we examine whether the information provided by Raman spectroscopy is sufficient or needs to be complemented by additional process measurements in order to provide an accurate estimation, through a Partial Least Square (PLS) model, of the solid composition of one of the two diastereomers involved in the production of an active pharmaceutical ingredient, denoted here as compound A. The selection of factors was based on the cooling crystallization procedure of compound A. Since the changing temperature, slurry density, and percent composition of the diastereomers in solid phase would affect the peak position and peak intensity accordingly, those were selected as the three factors. Partial Least Square regression (PLS) was used to quantify the composition of the diastereomers mixture.
2. EXPERIMENTAL SECTION
2.1. Materials HPLC grade solvents were used as received from commercial suppliers without further purification. The starting materials (racemic free base of compound A and a chiral acid, denoted here as D) that met the specifications defined by Sepracor Inc. were used as received from qualified suppliers without further purification. Sepracor Inc. provided all of the materials.
2.2. Preparation of Pure S-D Diastereomer Racemic free base of compound A was reacted with D (a chiral acid) in solvent and the solution was heated and held at 5 degrees above the saturated temperature to allow for complete dissolution. The solution was then slowly cooled and seeded with 2% by weight of the S-D diastereomer at the specified seeding temperature. The seeded slurry was cooled to a target isolation temperature. It was then followed by a filtration and drying step. The end product was analyzed by a chiral HPLC method resulted in optical purity of at least 97%. 2.3. Preparation of Pure R-D Diastereomer The preparation of pure R-D diastereomer first involved purifying R enantiomer from the racemic free base of compound A. The pure R enantiomer would then react with D to form the R-D diastereomer. For the purification step, racemic free base of compound A was reacted with a chiral acid, denoted as L, in solvent and the solution was heated and held at 5 degrees above the saturated temperature to allow for complete dissolution. The
solution was then slowly cooled and seeded with 2% by weight of the R-L diastereomer at a specified seeding temperature. The seeded slurry was cooled to a target isolation temperature. It was then followed by a filtration and drying step. The pure R-D diastereomer was produced by first letting the dry R-L crystal to go through a free baseing step to obtain pure R enantiomer. The pure R enantiomer would then react with D and crystallized to form R-D diastereomer. The product was analyzed by a chiral HPLC method resulted in optical purity greater than 98%. 2.4. Raman Spectroscopy A RamanRxn1™ analyzer (Kaiser Optical System, Inc.) coupled with an immersion fiber optic probe was used for the in-situ measurements. Raman spectra were recorded using NIR excitation radiation at 785nm and the spectroscopy incorporates the TE-cooled CCD detector technology. All collected spectra were averaged over five accumulations collected over 8 seconds each. Raman spectra were analyzed using either PLS_Toolbox 3.5 by Eigenvector Research, Inc. (Manson, WA) or the Unscrambler Chemometrics Software from Camo Inc. (Trondheim, Norway). 2.5. Calibration Experiments In order to obtain spectra of known amount of solid in suspension (slurry density) and percent composition of the S-D diastereomer in solid phase, the solution was first pre-saturated with respect to both diastereomers at specified temperature (Table 1). The saturated solution was prepared by adding excess amounts of racemic free base of compound A and D in the solvent system and heated until dissolution. After nucleation occurred upon cooling, the slurry was under constant stirring for two hours to ensure it reached equilibrium at the specified temperature and finished by a filtration step. The saturated solution was kept in a jacketed round-bottom flask to maintain constant temperature. Spectra of the standards were obtained of each pure diastereomers and of different binary mixture (from 0% to 100% of S-D) in the saturated solution. The spectra were collected at different temperatures (from 0oC to 40oC) and have different slurry densities (from 13.3 g/L to 80 g/L) that were within the range of the crystallization procedure. A total of 65 standards were used with varying condition (Table 1) and they were divided into two groups -- training and testing groups. 55 standards were selected and used to construct the model while the remaining 10 standards were used to test the accuracy of the model. The 10 standards from the testing group were randomly selected to cover the whole experimental space. The Raman probe was
inserted top-down into the 15mL vial and all the spectra were collected under constant stirring with magnetic stir bar to suspense the slurry.
Table 1 Experimental Condition for Standards
Fixed Variable
Fixed Variable
Changing Variable
# of samples
20 0C 13.3 g/L 0-100 % S-D 16 40 0C 13.3g/L 0-100 % S-D 6 30 0C 13.3g/L 0-100 % S-D 6 10 0C 13.3g/L 0-100 % S-D 6 0 0C 13.3g/L 0-100 % S-D 8 0 0C 33.3g/L 80-95 % S-D 4 0 0C 20g/L 70-100 % S-D 4 15 0C 26.7g/L 50-100 % S-D 3 15 0C 40g/L 65-85 % S-D 3 15 0C 53.3g/L 80-100 % S-D 3 5 0C 66.7g/L 75-95 % S-D 3 5 0C 80g/L 80-100 % S-D 3
2.6. Crystallization Experiment 5g of compound A (racemic free base) was reacted with 1.7g of D in 238mL of solvent. The solution was kept in a jacketed round-bottom flask under constant stirring and the jacket was connected to a temperature-controlled chiller. The Raman probe was inserted at a 45-degree angle into the reaction flask and spectra were collected at 1-minute intervals. The solution was first heated to 40 0C and held for 20 minutes to allow for complete dissolution. It was then cooled at a rate of 5 0C/min to 0 0C and the temperature remained constant for four hours. After nucleation occurred, samples of the slurry were drawn for HPLC analysis until the end of experiment. A total of six samples were drawn throughout the experiment. The collected samples were first filtered and the mother liquor was sent for HPLC analysis for solute concentration and percent composition of the diastereomers in solution phase. The wet cake did not go through solvent wash to avoid dissolution of the crystals during the wash. The cake was then weighted and vacuum dry at 40 0C for overnight. The dry cake was again weighted and the solid contents sent for HPLC analysis for percent composition of the diastereomers in solid phase. Since the evaporated solvent contained residual diastereomers in the solution phase, the amount of solute in the evaporated solvent was calculated with the weight difference of the cakes and multiple by the concentration of solute in solution from HPLC analysis. The percent composition of the S-D diastereomer was then corrected with the residual solute from the solution phase. 2.7. Data Pre-treatment Data pre-treatment using first derivative was performed to correct any scattering effect from the
crystals. The first derivative of all the spectra was computed with the Savitzky-Golay method using second-degree polynomial fit and 11 points window (Madden, 1978). The data matrix of the three PLS models composed of different combinations of measurements such as the entire Raman spectrum (spectrum range: 75cm-1 to 3300cm-1), temperature, and/or slurry density as shown in Equation 1-3. The percent composition of the diastereomers was the independent variable of the PLS model. D1 = [Spectra] (1) D2 = [Temperature Spectra] (2) D3 = [Temperature Slurry Density Spectra] (3)
In order to compare the contribution of each factor equally, temperature (T), slurry density (D), percent composition (%), and spectra (S) were first scaled to have zero mean and variance of one as shown in Equation 4-8.
( )4ˆ~
T
ii
TTT
σ−
= ( )5ˆ~
D
ii
DDDσ−
=
( )6%%
%%
~
σ−
= ii ( )7
ˆ~
S
ii
SSSσ−
=
( )( )8ˆ
n
dwwfS
i∫=
Where the scaled values (~T , , % , and ) were
subtracted by the average of all the standards (
~D
~ ~S
T , , , and ) and divided by the standard
deviation (σ). However, the spectra data was scaled slightly different in which is the average of the area under curve of all spectra (Eq. 8) and
D
S
% S
S
σ is the standard deviation of the area under curve of all spectra. It should be noted that fi(w) is the spectrum function with respect to w denote as the wave number.
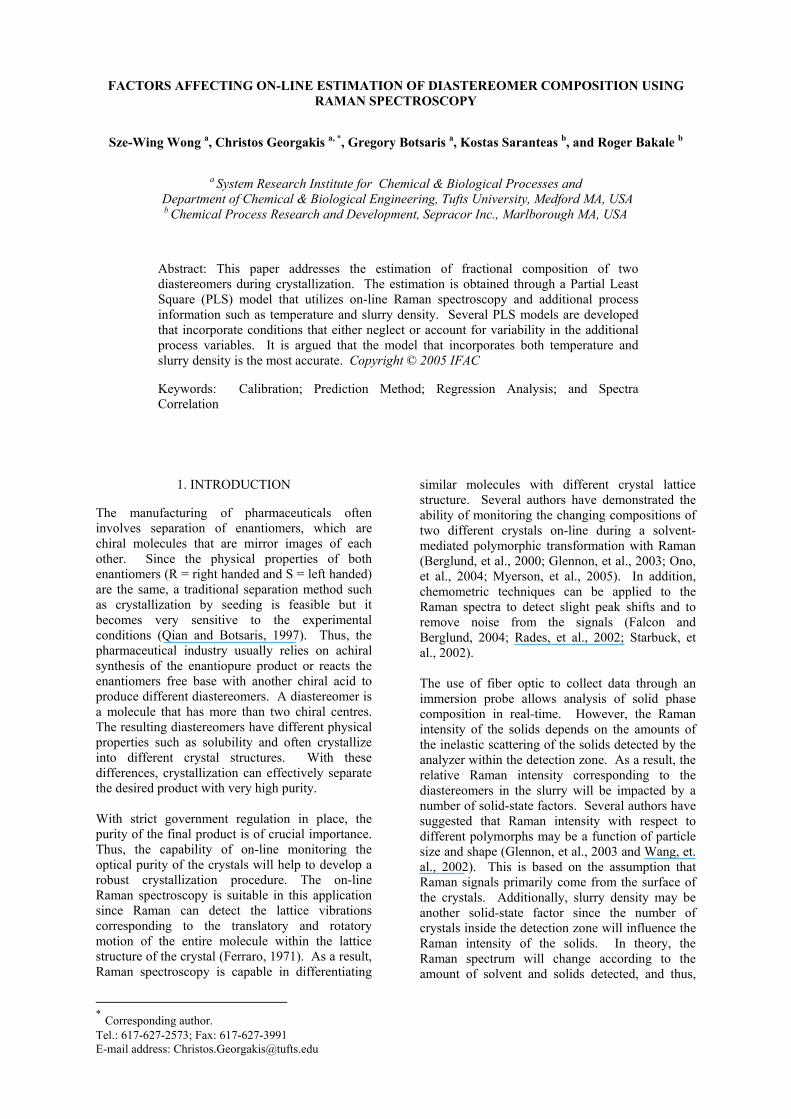
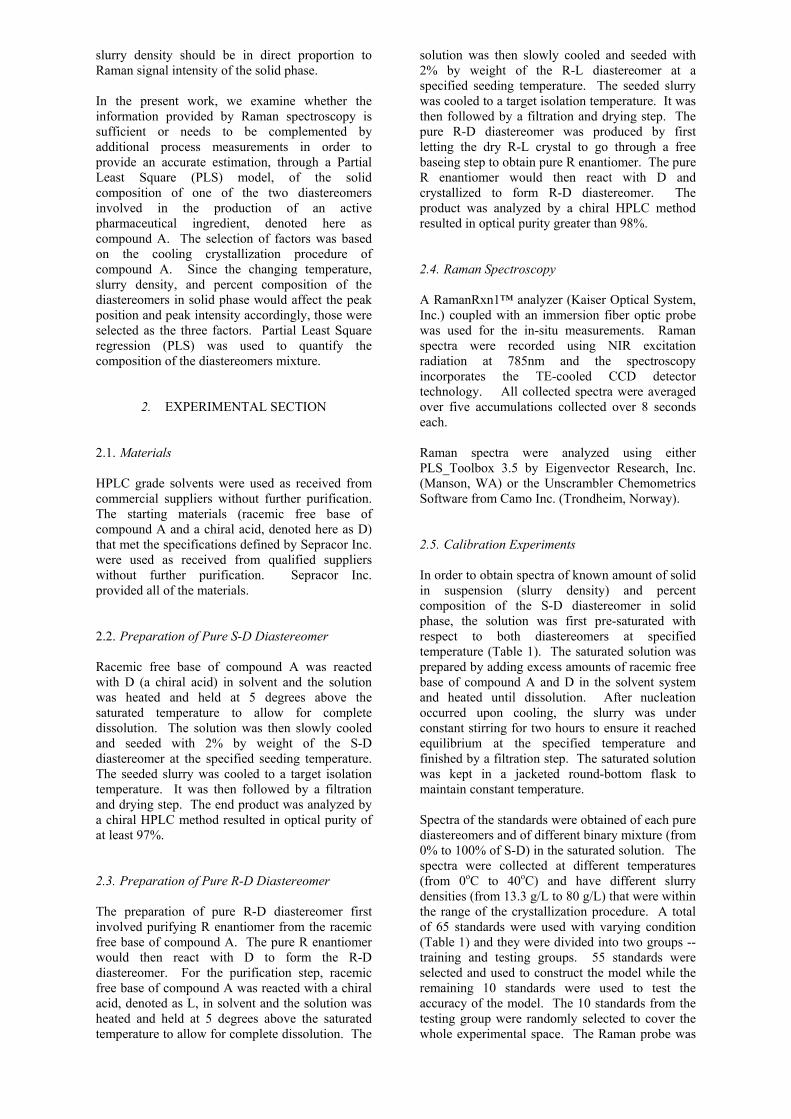
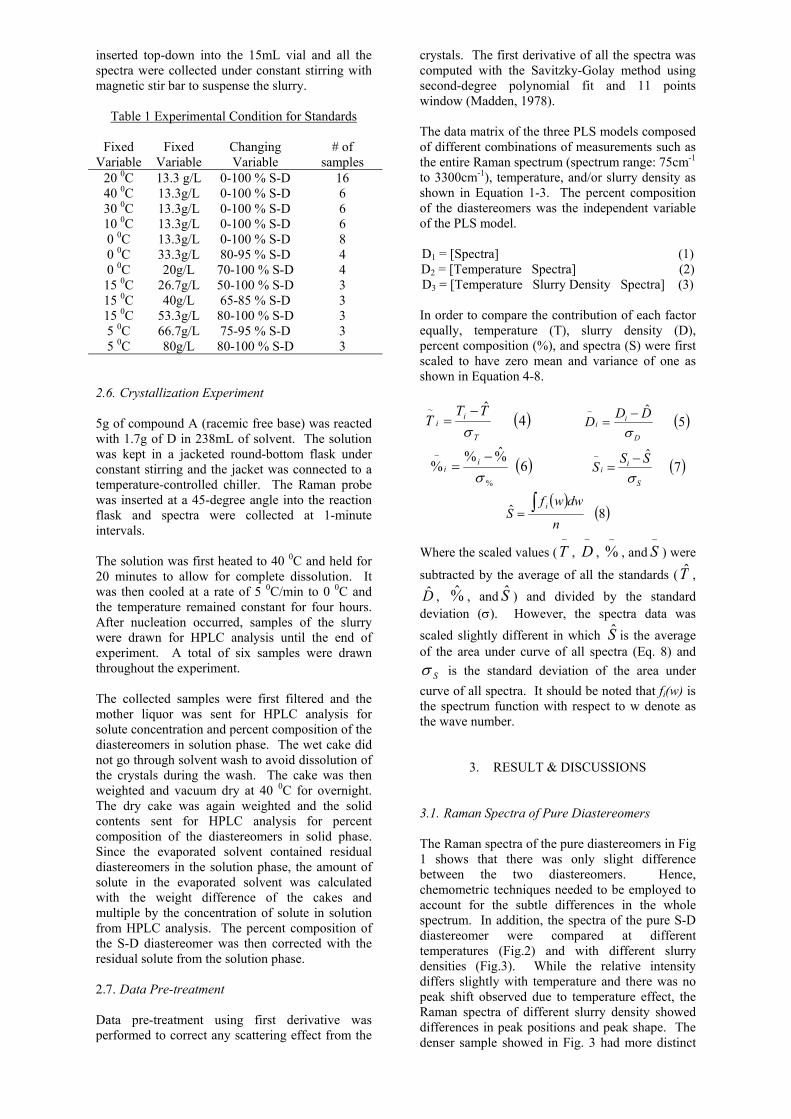
3. RESULT & DISCUSSIONS 3.1. Raman Spectra of Pure Diastereomers The Raman spectra of the pure diastereomers in Fig 1 shows that there was only slight difference between the two diastereomers. Hence, chemometric techniques needed to be employed to account for the subtle differences in the whole spectrum. In addition, the spectra of the pure S-D diastereomer were compared at different temperatures (Fig.2) and with different slurry densities (Fig.3). While the relative intensity differs slightly with temperature and there was no peak shift observed due to temperature effect, the Raman spectra of different slurry density showed differences in peak positions and peak shape. The denser sample showed in Fig. 3 had more distinct
shape peaks that resembled Raman spectrum of pure solid. It was an indication that the Raman analyzer detected higher amount of solids in the slurry.
Fig. 1. Raman Spectra of pure R-D and S-D at the
same temperature and slurry density. The circled regions of spectra are the slight difference between the diastereomers.
Fig. 2. Raman Spectra of pure S-D with the same
slurry density and different temperature
Fig. 3. Raman Spectra of pure S-D with different
slurry density. 3.2. PLS Calibration Model Three PLS models were developed to investigate whether additional process measurements (i.e. temperature and slurry density) would improve the accuracy of the estimation model. Each of the PLS models used the same training set that incorporate conditions that either neglect or account for
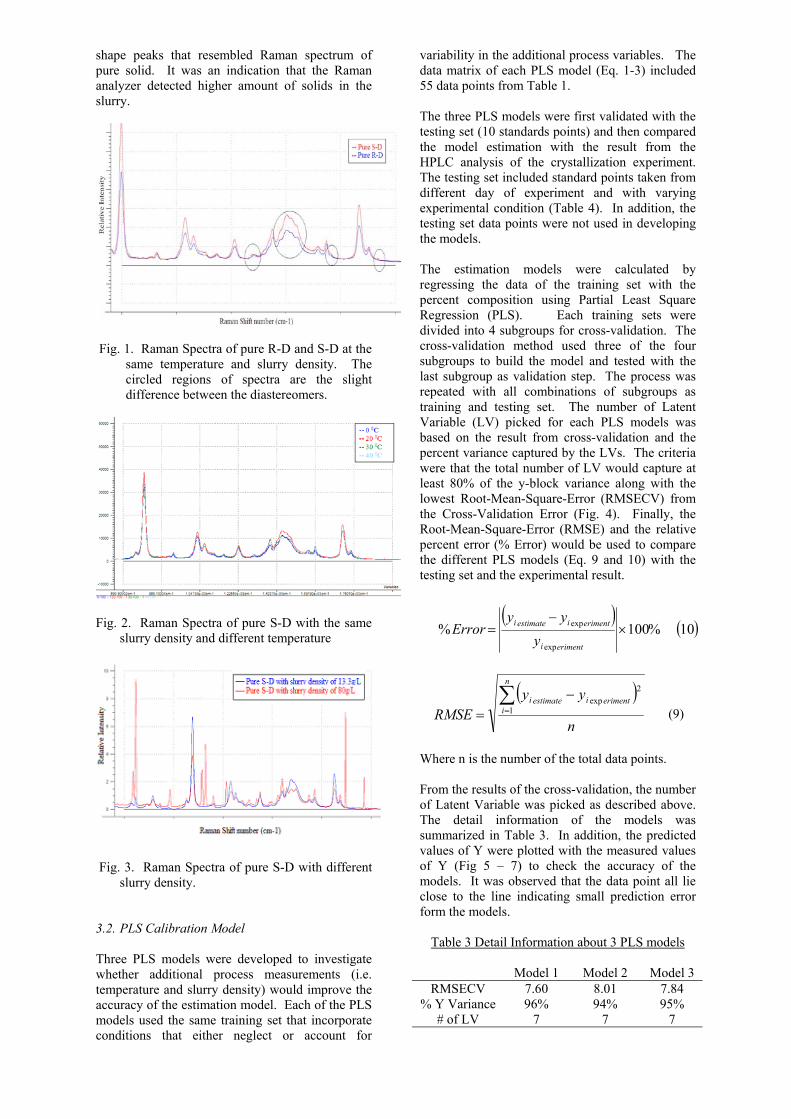
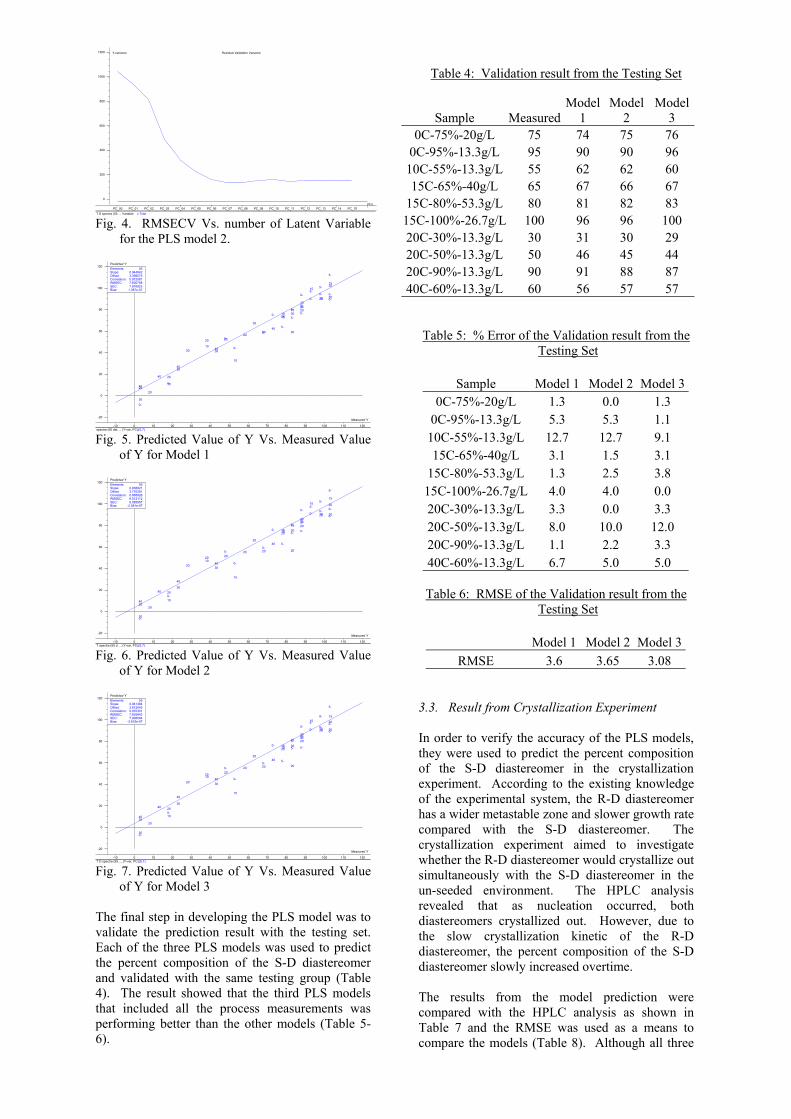
variability in the additional process variables. The data matrix of each PLS model (Eq. 1-3) included 55 data points from Table 1. The three PLS models were first validated with the testing set (10 standards points) and then compared the model estimation with the result from the HPLC analysis of the crystallization experiment. The testing set included standard points taken from different day of experiment and with varying experimental condition (Table 4). In addition, the testing set data points were not used in developing the models. The estimation models were calculated by regressing the data of the training set with the percent composition using Partial Least Square Regression (PLS). Each training sets were divided into 4 subgroups for cross-validation. The cross-validation method used three of the four subgroups to build the model and tested with the last subgroup as validation step. The process was repeated with all combinations of subgroups as training and testing set. The number of Latent Variable (LV) picked for each PLS models was based on the result from cross-validation and the percent variance captured by the LVs. The criteria were that the total number of LV would capture at least 80% of the y-block variance along with the lowest Root-Mean-Square-Error (RMSECV) from the Cross-Validation Error (Fig. 4). Finally, the Root-Mean-Square-Error (RMSE) and the relative percent error (% Error) would be used to compare the different PLS models (Eq. 9 and 10) with the testing set and the experimental result.
( )( )10%100%
exp
exp ×−
=erimenti
erimentiestimatei
yyy
Error
( )n
yyRMSE
n
ierimentiestimatei∑
=
−= 1
2exp
(9)
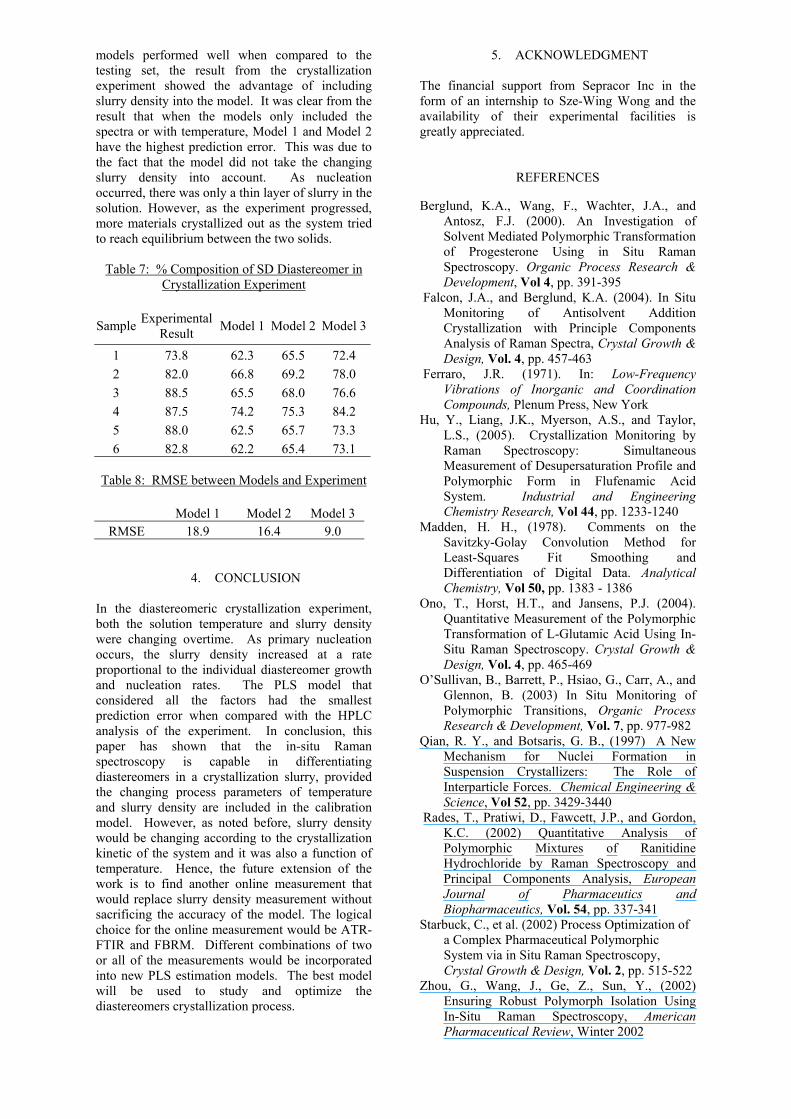
Where n is the number of the total data points. From the results of the cross-validation, the number of Latent Variable was picked as described above. The detail information of the models was summarized in Table 3. In addition, the predicted values of Y were plotted with the measured values of Y (Fig 5 – 7) to check the accuracy of the models. It was observed that the data point all lie close to the line indicating small prediction error form the models.
Table 3 Detail Information about 3 PLS models
Model 1 Model 2 Model 3 RMSECV 7.60 8.01 7.84
% Y Variance 96% 94% 95% # of LV 7 7 7
0
200
400
600
800
1000
1200
PC_00 PC_01 PC_02 PC_03 PC_04 PC_05 PC_06 PC_07 PC_08 PC_09 PC_10 PC_11 PC_12 PC_13 PC_14 PC_15PCs
Y-variance Residual Validation Variance
Table 4: Validation result from the Testing Set
T D spectra (55…, Variable: v.Total
Fig. 4. RMSECV Vs. number of Latent Variable for the PLS model 2.
-20
0
20
40
60
80
100
120
-10 0 10 20 30 40 50 60 70 80 90 100 110 120
40
0-
0-
0-
0-
0-
0-
0-0-0-
0-0-
0-
0-0-
5-
5-
5-
5-
5-
5-
10
10
10
1010
15
15
1515
15
15
2020
20
20
20 2020
20
20
20
20
20
20
30
30
30
30
30
30
40
40
40
40
Elements:Slope:Offset:Correlation:RMSEC:SEC:Bias:
550.9449423.3985750.9720817.6007687.670823
1.387e-07
Measured Y
Predicted Y
Sample Measured Model
1 Model
2 Model
3 0C-75%-20g/L 75 74 75 76
0C-95%-13.3g/L 95 90 90 96 10C-55%-13.3g/L 55 62 62 60 15C-65%-40g/L 65 67 66 67
15C-80%-53.3g/L 80 81 82 83 15C-100%-26.7g/L 100 96 96 100 20C-30%-13.3g/L 30 31 30 29 20C-50%-13.3g/L 50 46 45 44 20C-90%-13.3g/L 90 91 88 87 40C-60%-13.3g/L 60 56 57 57
Table 5: % Error of the Validation result from the
Testing Set
Sample Model 1 Model 2 Model 30C-75%-20g/L 1.3 0.0 1.3
0C-95%-13.3g/L 5.3 5.3 1.1 10C-55%-13.3g/L 12.7 12.7 9.1 15C-65%-40g/L 3.1 1.5 3.1
15C-80%-53.3g/L 1.3 2.5 3.8 15C-100%-26.7g/L 4.0 4.0 0.0 20C-30%-13.3g/L 3.3 0.0 3.3 20C-50%-13.3g/L 8.0 10.0 12.0 20C-90%-13.3g/L 1.1 2.2 3.3 40C-60%-13.3g/L 6.7 5.0 5.0
spectra (55 dat…, (Y-var, PC): (S,7)
Fig. 5. Predicted Value of Y Vs. Measured Value of Y for Model 1
-20
0
20
40
60
80
100
120
-10 0 10 20 30 40 50 60 70 80 90 100 110 120 T spectra (55 d…, (Y-var, PC): (S,7)
40
0-
0-
0-
0-
0-
0-
0-0-0-
0-0-
0-0-
0-
5-
5-
5-
5-
5-
5-
10
10
10
1010
15
15
1515
1515
2020
20
20
20 2020 20
20
20
20
20
20
30
30
30
30
30
30
40
40
40
40
Elements:Slope:Offset:Correlation:RMSEC:SEC:Bias:
550.9388213.7763810.9689288.0121128.085957
-2.081e-07
Measured Y
Predicted Y
Table 6: RMSE of the Validation result from the
Testing Set
Model 1 Model 2 Model 3RMSE 3.6 3.65 3.08 Fig. 6. Predicted Value of Y Vs. Measured Value
of Y for Model 2
-20
0
20
40
60
80
100
120
-10 0 10 20 30 40 50 60 70 80 90 100 110 120 T D spectra (55…, (Y-var, PC): (S,7)
40
0-
0-
0-
0-
0-
0-
0-
0-0-
0-0-
0-0-
0-
5-
5-
5-
5-
5-
5-
10
10
10
1010
15
15
1515
1515
2020
20
20
2020
20 20
20
20
20
20
20
30
30
30
30
30
30
40
40
40
40
Elements:Slope:Offset:Correlation:RMSEC:SEC:Bias:
550.9414843.6120450.9703017.8358437.908064
-3.815e-07
Measured Y
Predicted Y
3.3. Result from Crystallization Experiment In order to verify the accuracy of the PLS models, they were used to predict the percent composition of the S-D diastereomer in the crystallization experiment. According to the existing knowledge of the experimental system, the R-D diastereomer has a wider metastable zone and slower growth rate compared with the S-D diastereomer. The crystallization experiment aimed to investigate whether the R-D diastereomer would crystallize out simultaneously with the S-D diastereomer in the un-seeded environment. The HPLC analysis revealed that as nucleation occurred, both diastereomers crystallized out. However, due to the slow crystallization kinetic of the R-D diastereomer, the percent composition of the S-D diastereomer slowly increased overtime.
Fig. 7. Predicted Value of Y Vs. Measured Value of Y for Model 3
The final step in developing the PLS model was to validate the prediction result with the testing set. Each of the three PLS models was used to predict the percent composition of the S-D diastereomer and validated with the same testing group (Table 4). The result showed that the third PLS models that included all the process measurements was performing better than the other models (Table 5-6).
The results from the model prediction were compared with the HPLC analysis as shown in Table 7 and the RMSE was used as a means to compare the models (Table 8). Although all three
5. ACKNOWLEDGMENT models performed well when compared to the testing set, the result from the crystallization experiment showed the advantage of including slurry density into the model. It was clear from the result that when the models only included the spectra or with temperature, Model 1 and Model 2 have the highest prediction error. This was due to the fact that the model did not take the changing slurry density into account. As nucleation occurred, there was only a thin layer of slurry in the solution. However, as the experiment progressed, more materials crystallized out as the system tried to reach equilibrium between the two solids.
The financial support from Sepracor Inc in the form of an internship to Sze-Wing Wong and the availability of their experimental facilities is greatly appreciated.
REFERENCES Berglund, K.A., Wang, F., Wachter, J.A., and
Antosz, F.J. (2000). An Investigation of Solvent Mediated Polymorphic Transformation of Progesterone Using in Situ Raman Spectroscopy. Organic Process Research & Development, Vol 4, pp. 391-395
Table 7: % Composition of SD Diastereomer in
Crystallization Experiment Falcon, J.A., and Berglund, K.A. (2004). In Situ
Monitoring of Antisolvent Addition Crystallization with Principle Components Analysis of Raman Spectra, Crystal Growth & Design, Vol. 4, pp. 457-463
Sample Experimental Result Model 1 Model 2 Model 3
1 73.8 62.3 65.5 72.4 2 82.0 66.8 69.2 78.0 3 88.5 65.5 68.0 76.6 4 87.5 74.2 75.3 84.2 5 88.0 62.5 65.7 73.3 6 82.8 62.2 65.4 73.1
Ferraro, J.R. (1971). In: Low-Frequency Vibrations of Inorganic and Coordination Compounds, Plenum Press, New York
Hu, Y., Liang, J.K., Myerson, A.S., and Taylor, L.S., (2005). Crystallization Monitoring by Raman Spectroscopy: Simultaneous Measurement of Desupersaturation Profile and Polymorphic Form in Flufenamic Acid System. Industrial and Engineering Chemistry Research, Vol 44, pp. 1233-1240
Table 8: RMSE between Models and Experiment
Model 1 Model 2 Model 3
RMSE 18.9 16.4 9.0 Madden, H. H., (1978). Comments on the Savitzky-Golay Convolution Method for Least-Squares Fit Smoothing and Differentiation of Digital Data. Analytical Chemistry, Vol 50, pp. 1383 - 1386
4. CONCLUSION
Ono, T., Horst, H.T., and Jansens, P.J. (2004). Quantitative Measurement of the Polymorphic Transformation of L-Glutamic Acid Using In-Situ Raman Spectroscopy. Crystal Growth & Design, Vol. 4, pp. 465-469
In the diastereomeric crystallization experiment, both the solution temperature and slurry density were changing overtime. As primary nucleation occurs, the slurry density increased at a rate proportional to the individual diastereomer growth and nucleation rates. The PLS model that considered all the factors had the smallest prediction error when compared with the HPLC analysis of the experiment. In conclusion, this paper has shown that the in-situ Raman spectroscopy is capable in differentiating diastereomers in a crystallization slurry, provided the changing process parameters of temperature and slurry density are included in the calibration model. However, as noted before, slurry density would be changing according to the crystallization kinetic of the system and it was also a function of temperature. Hence, the future extension of the work is to find another online measurement that would replace slurry density measurement without sacrificing the accuracy of the model. The logical choice for the online measurement would be ATR-FTIR and FBRM. Different combinations of two or all of the measurements would be incorporated into new PLS estimation models. The best model will be used to study and optimize the diastereomers crystallization process.
O’Sullivan, B., Barrett, P., Hsiao, G., Carr, A., and Glennon, B. (2003) In Situ Monitoring of Polymorphic Transitions, Organic Process Research & Development, Vol. 7, pp. 977-982
Qian, R. Y., and Botsaris, G. B., (1997) A New Mechanism for Nuclei Formation in Suspension Crystallizers: The Role of Interparticle Forces. Chemical Engineering & Science, Vol 52, pp. 3429-3440
Rades, T., Pratiwi, D., Fawcett, J.P., and Gordon, K.C. (2002) Quantitative Analysis of Polymorphic Mixtures of Ranitidine Hydrochloride by Raman Spectroscopy and Principal Components Analysis, European Journal of Pharmaceutics and Biopharmaceutics, Vol. 54, pp. 337-341
Starbuck, C., et al. (2002) Process Optimization of a Complex Pharmaceutical Polymorphic System via in Situ Raman Spectroscopy, Crystal Growth & Design, Vol. 2, pp. 515-522
Zhou, G., Wang, J., Ge, Z., Sun, Y., (2002) Ensuring Robust Polymorph Isolation Using In-Situ Raman Spectroscopy, American Pharmaceutical Review, Winter 2002