High-performance dispersive Raman and absorption spectroscopy as tools for drug identification
10
High-performance dispersive Raman and absorption spectroscopy as tools for drug identification Olga Pawluczyk*, Sam Andrey, Paul Nogas, Andrew Roy, Romuald Pawluczyk P&P Optica Inc., 330 Gage Avenue, Kitchener, ON, Canada N2M 5C6 ABSTRACT Due to increasing availability of pharmaceuticals from many sources, a need is growing to quickly and efficiently analyze substances in terms of the consistency and accuracy of their chemical composition. Differences in chemical composition occur at very low concentrations, so that highly sensitive analytical methods become crucial. Recent progress in dispersive spectroscopy with the use of 2-dimensional detector arrays, permits for signal integration along a long (up to 12 mm long) entrance slit of a spectrometer, thereby increasing signal to noise ratio and improving the ability to detect small concentration changes. This is achieved with a non-scanning, non-destructive system. Two different methods using P&P Optica high performance spectrometers were used. High performance optical dispersion Raman and high performance optical absorption spectroscopy were employed to differentiate various acetaminophen-containing drugs, such as Tylenol™ and other generic brands, which differ in their ingredients. A 785 nm excitation wavelength was used in Raman measurements and strong Raman signals were observed in the spectral range 300-1800 cm -1 . Measurements with the absorption spectrometer were performed in the wavelength range 620-1020 nm. Both Raman and absorption techniques used transmission light spectrometers with volume phase holographic gratings and provided sufficient spectral differences, often structural, allowing for drug differentiation. Keywords: pharmaceutical inspection, quality control, Raman spectroscopy, absorption spectroscopy, high performance spectrometers, dispersive optical spectrometers, volume phase holographic gratings 1. INTRODUCTION High performance, dispersive optical spectrometers may be used for a variety of applications which are not typically considered as standard for non-scanning, Visible and NIR dispersive spectrometers. These new applications such as inspection of pharmaceutical compounds have not been the domain of optical dispersive systems for a variety of reasons. First, spectroscopy in the visible to NIR regions does not permit direct identification of absorption peaks, but instead shows very broad overtones that require very sensitive systems and significant processing for appropriate identification of compounds. Second, the spectra collected in this region tend to have dual information not only based on the chemical composition of compounds, but also on some of the physical properties of the substances under investigation. 1 Finally, dispersive systems were often disregarded in favor of scanning grating or Fourier Transform systems since higher SNR and spectral resolution could be obtained. 2 However, scanning systems, including Fourier Transform spectrometer are not well suited for applications where systems are quickly changing, such as biomedical applications on live tissue, or measurements of non homogenous mixtures. Improvements in optical design, significantly better diffraction gratings as well as improvements to detector technology and processing power are enabling dispersive visible and NIR spectrometers to achieve greater ability to distinguish small differences in composition of materials 3 . One application of this technology is the testing of pharmaceuticals for consistency and fraud detection. In the preliminary results shown in this work, the authors have used high performance, dispersive optical spectrometers to differentiate among a set of acetaminophen containing drugs such as various tablets under the Tylenol™ brand and other, generic brands. Table 1 shows the exact tablets tested for this analysis. Both broadband spectroscopy and Raman spectroscopy at 785 nm excitation were used to differentiate the available drugs and to determine the efficacy of high performance dispersive spectrometers for detecting small differences between manufacturers, batches or types of medications. *[email protected]; phone 1 519 576 0007; www.ppo.ca Imaging, Manipulation, and Analysis of Biomolecules, Cells, and Tissues VII, edited by Daniel L. Farkas, Dan V. Nicolau, Robert C. Leif, Proc. of SPIE Vol. 7182, 71820M · © 2009 SPIE · CCC code: 1605-7422/09/$18 · doi: 10.1117/12.809112 Proc. of SPIE Vol. 7182 71820M-1
-
Upload
independent -
Category
Documents
-
view
4 -
download
0
Transcript of High-performance dispersive Raman and absorption spectroscopy as tools for drug identification

High-performance dispersive Raman and absorption spectroscopy as tools for drug identification
Olga Pawluczyk*, Sam Andrey, Paul Nogas, Andrew Roy, Romuald Pawluczyk P&P Optica Inc., 330 Gage Avenue, Kitchener, ON, Canada N2M 5C6
ABSTRACT
Due to increasing availability of pharmaceuticals from many sources, a need is growing to quickly and efficiently analyze substances in terms of the consistency and accuracy of their chemical composition. Differences in chemical composition occur at very low concentrations, so that highly sensitive analytical methods become crucial. Recent progress in dispersive spectroscopy with the use of 2-dimensional detector arrays, permits for signal integration along a long (up to 12 mm long) entrance slit of a spectrometer, thereby increasing signal to noise ratio and improving the ability to detect small concentration changes. This is achieved with a non-scanning, non-destructive system. Two different methods using P&P Optica high performance spectrometers were used. High performance optical dispersion Raman and high performance optical absorption spectroscopy were employed to differentiate various acetaminophen-containing drugs, such as Tylenol™ and other generic brands, which differ in their ingredients. A 785 nm excitation wavelength was used in Raman measurements and strong Raman signals were observed in the spectral range 300-1800 cm-1. Measurements with the absorption spectrometer were performed in the wavelength range 620-1020 nm. Both Raman and absorption techniques used transmission light spectrometers with volume phase holographic gratings and provided sufficient spectral differences, often structural, allowing for drug differentiation.
Keywords: pharmaceutical inspection, quality control, Raman spectroscopy, absorption spectroscopy, high performance spectrometers, dispersive optical spectrometers, volume phase holographic gratings
1. INTRODUCTION High performance, dispersive optical spectrometers may be used for a variety of applications which are not typically considered as standard for non-scanning, Visible and NIR dispersive spectrometers. These new applications such as inspection of pharmaceutical compounds have not been the domain of optical dispersive systems for a variety of reasons. First, spectroscopy in the visible to NIR regions does not permit direct identification of absorption peaks, but instead shows very broad overtones that require very sensitive systems and significant processing for appropriate identification of compounds. Second, the spectra collected in this region tend to have dual information not only based on the chemical composition of compounds, but also on some of the physical properties of the substances under investigation. 1 Finally, dispersive systems were often disregarded in favor of scanning grating or Fourier Transform systems since higher SNR and spectral resolution could be obtained.2 However, scanning systems, including Fourier Transform spectrometer are not well suited for applications where systems are quickly changing, such as biomedical applications on live tissue, or measurements of non homogenous mixtures.
Improvements in optical design, significantly better diffraction gratings as well as improvements to detector technology and processing power are enabling dispersive visible and NIR spectrometers to achieve greater ability to distinguish small differences in composition of materials 3. One application of this technology is the testing of pharmaceuticals for consistency and fraud detection. In the preliminary results shown in this work, the authors have used high performance, dispersive optical spectrometers to differentiate among a set of acetaminophen containing drugs such as various tablets under the Tylenol™ brand and other, generic brands. Table 1 shows the exact tablets tested for this analysis. Both broadband spectroscopy and Raman spectroscopy at 785 nm excitation were used to differentiate the available drugs and to determine the efficacy of high performance dispersive spectrometers for detecting small differences between manufacturers, batches or types of medications.
*[email protected]; phone 1 519 576 0007; www.ppo.ca
Imaging, Manipulation, and Analysis of Biomolecules, Cells, and Tissues VII, edited by Daniel L. Farkas, Dan V. Nicolau,Robert C. Leif, Proc. of SPIE Vol. 7182, 71820M · © 2009 SPIE · CCC code: 1605-7422/09/$18 · doi: 10.1117/12.809112
Proc. of SPIE Vol. 7182 71820M-1
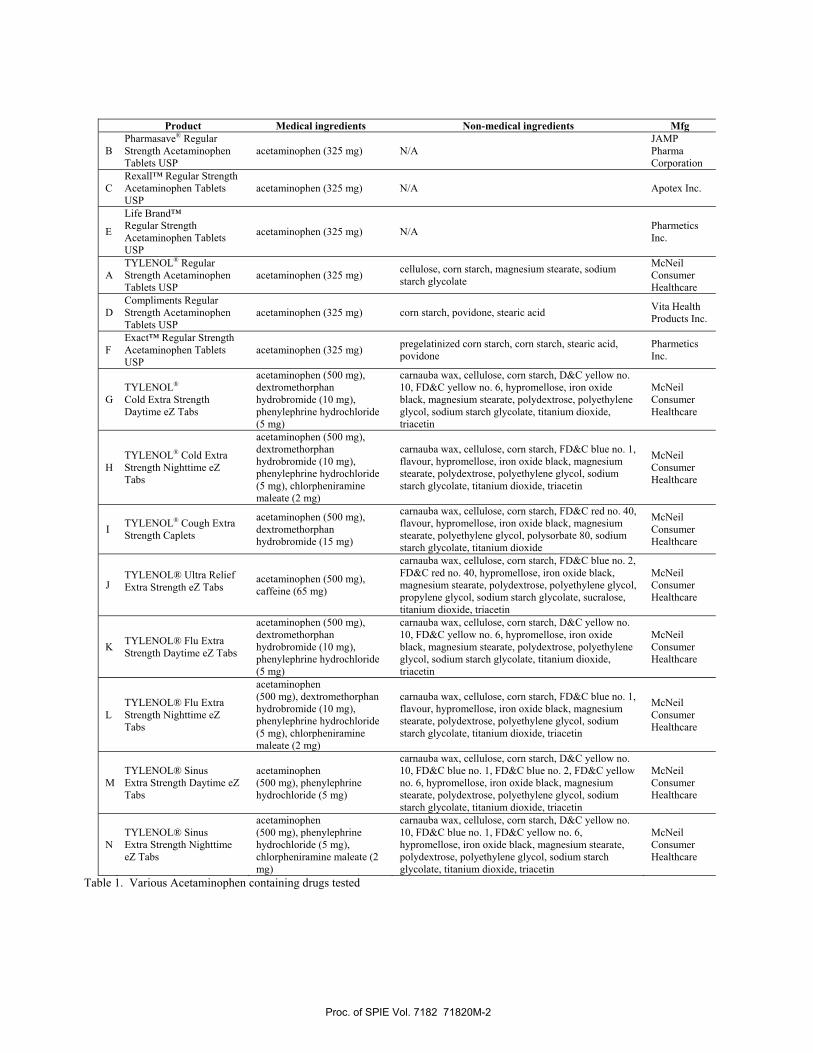
Table 1. Various Acetaminophen containing drugs tested
Product Medical ingredients Non-medical ingredients Mfg
B Pharmasave® Regular Strength Acetaminophen Tablets USP
acetaminophen (325 mg) N/A JAMP Pharma Corporation
C Rexall™ Regular Strength Acetaminophen Tablets USP
acetaminophen (325 mg) N/A Apotex Inc.
E
Life Brand™ Regular Strength Acetaminophen Tablets USP
acetaminophen (325 mg) N/A Pharmetics Inc.
A TYLENOL® Regular Strength Acetaminophen Tablets USP
acetaminophen (325 mg) cellulose, corn starch, magnesium stearate, sodium starch glycolate
McNeil Consumer Healthcare
D Compliments Regular Strength Acetaminophen Tablets USP
acetaminophen (325 mg) corn starch, povidone, stearic acid Vita Health Products Inc.
F Exact™ Regular Strength Acetaminophen Tablets USP
acetaminophen (325 mg) pregelatinized corn starch, corn starch, stearic acid, povidone
Pharmetics Inc.
G TYLENOL® Cold Extra Strength Daytime eZ Tabs
acetaminophen (500 mg), dextromethorphan hydrobromide (10 mg), phenylephrine hydrochloride (5 mg)
carnauba wax, cellulose, corn starch, D&C yellow no. 10, FD&C yellow no. 6, hypromellose, iron oxide black, magnesium stearate, polydextrose, polyethylene glycol, sodium starch glycolate, titanium dioxide, triacetin
McNeil Consumer Healthcare
H TYLENOL® Cold Extra Strength Nighttime eZ Tabs
acetaminophen (500 mg), dextromethorphan hydrobromide (10 mg), phenylephrine hydrochloride (5 mg), chlorpheniramine maleate (2 mg)
carnauba wax, cellulose, corn starch, FD&C blue no. 1, flavour, hypromellose, iron oxide black, magnesium stearate, polydextrose, polyethylene glycol, sodium starch glycolate, titanium dioxide, triacetin
McNeil Consumer Healthcare
I TYLENOL® Cough Extra Strength Caplets
acetaminophen (500 mg), dextromethorphan hydrobromide (15 mg)
carnauba wax, cellulose, corn starch, FD&C red no. 40, flavour, hypromellose, iron oxide black, magnesium stearate, polyethylene glycol, polysorbate 80, sodium starch glycolate, titanium dioxide
McNeil Consumer Healthcare
J TYLENOL® Ultra Relief Extra Strength eZ Tabs
acetaminophen (500 mg), caffeine (65 mg)
carnauba wax, cellulose, corn starch, FD&C blue no. 2, FD&C red no. 40, hypromellose, iron oxide black, magnesium stearate, polydextrose, polyethylene glycol, propylene glycol, sodium starch glycolate, sucralose, titanium dioxide, triacetin
McNeil Consumer Healthcare
K TYLENOL® Flu Extra Strength Daytime eZ Tabs
acetaminophen (500 mg), dextromethorphan hydrobromide (10 mg), phenylephrine hydrochloride (5 mg)
carnauba wax, cellulose, corn starch, D&C yellow no. 10, FD&C yellow no. 6, hypromellose, iron oxide black, magnesium stearate, polydextrose, polyethylene glycol, sodium starch glycolate, titanium dioxide, triacetin
McNeil Consumer Healthcare
L TYLENOL® Flu Extra Strength Nighttime eZ Tabs
acetaminophen (500 mg), dextromethorphan hydrobromide (10 mg), phenylephrine hydrochloride (5 mg), chlorpheniramine maleate (2 mg)
carnauba wax, cellulose, corn starch, FD&C blue no. 1, flavour, hypromellose, iron oxide black, magnesium stearate, polydextrose, polyethylene glycol, sodium starch glycolate, titanium dioxide, triacetin
McNeil Consumer Healthcare
M TYLENOL® Sinus Extra Strength Daytime eZ Tabs
acetaminophen (500 mg), phenylephrine hydrochloride (5 mg)
carnauba wax, cellulose, corn starch, D&C yellow no. 10, FD&C blue no. 1, FD&C blue no. 2, FD&C yellow no. 6, hypromellose, iron oxide black, magnesium stearate, polydextrose, polyethylene glycol, sodium starch glycolate, titanium dioxide, triacetin
McNeil Consumer Healthcare
N TYLENOL® Sinus Extra Strength Nighttime eZ Tabs
acetaminophen (500 mg), phenylephrine hydrochloride (5 mg), chlorpheniramine maleate (2 mg)
carnauba wax, cellulose, corn starch, D&C yellow no. 10, FD&C blue no. 1, FD&C yellow no. 6, hypromellose, iron oxide black, magnesium stearate, polydextrose, polyethylene glycol, sodium starch glycolate, titanium dioxide, triacetin
McNeil Consumer Healthcare
Proc. of SPIE Vol. 7182 71820M-2
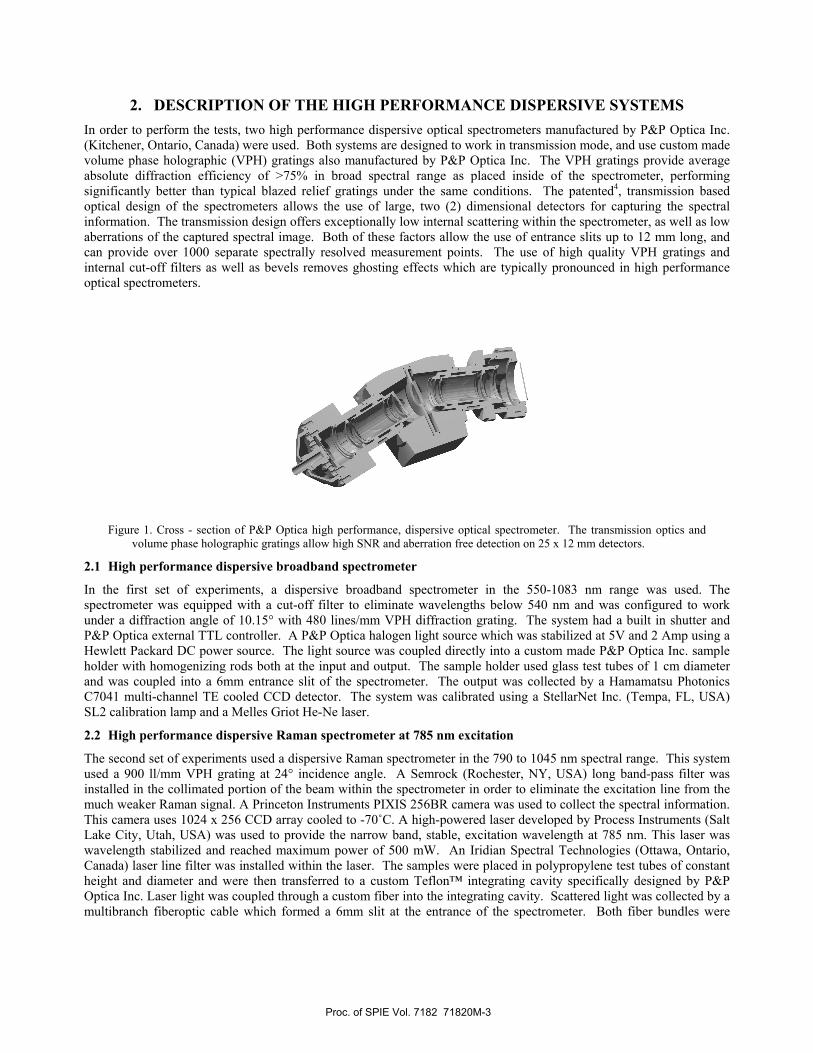
2. DESCRIPTION OF THE HIGH PERFORMANCE DISPERSIVE SYSTEMS In order to perform the tests, two high performance dispersive optical spectrometers manufactured by P&P Optica Inc. (Kitchener, Ontario, Canada) were used. Both systems are designed to work in transmission mode, and use custom made volume phase holographic (VPH) gratings also manufactured by P&P Optica Inc. The VPH gratings provide average absolute diffraction efficiency of >75% in broad spectral range as placed inside of the spectrometer, performing significantly better than typical blazed relief gratings under the same conditions. The patented4, transmission based optical design of the spectrometers allows the use of large, two (2) dimensional detectors for capturing the spectral information. The transmission design offers exceptionally low internal scattering within the spectrometer, as well as low aberrations of the captured spectral image. Both of these factors allow the use of entrance slits up to 12 mm long, and can provide over 1000 separate spectrally resolved measurement points. The use of high quality VPH gratings and internal cut-off filters as well as bevels removes ghosting effects which are typically pronounced in high performance optical spectrometers.
Figure 1. Cross - section of P&P Optica high performance, dispersive optical spectrometer. The transmission optics and
volume phase holographic gratings allow high SNR and aberration free detection on 25 x 12 mm detectors.
2.1 High performance dispersive broadband spectrometer
In the first set of experiments, a dispersive broadband spectrometer in the 550-1083 nm range was used. The spectrometer was equipped with a cut-off filter to eliminate wavelengths below 540 nm and was configured to work under a diffraction angle of 10.15° with 480 lines/mm VPH diffraction grating. The system had a built in shutter and P&P Optica external TTL controller. A P&P Optica halogen light source which was stabilized at 5V and 2 Amp using a Hewlett Packard DC power source. The light source was coupled directly into a custom made P&P Optica Inc. sample holder with homogenizing rods both at the input and output. The sample holder used glass test tubes of 1 cm diameter and was coupled into a 6mm entrance slit of the spectrometer. The output was collected by a Hamamatsu Photonics C7041 multi-channel TE cooled CCD detector. The system was calibrated using a StellarNet Inc. (Tempa, FL, USA) SL2 calibration lamp and a Melles Griot He-Ne laser.
2.2 High performance dispersive Raman spectrometer at 785 nm excitation
The second set of experiments used a dispersive Raman spectrometer in the 790 to 1045 nm spectral range. This system used a 900 ll/mm VPH grating at 24° incidence angle. A Semrock (Rochester, NY, USA) long band-pass filter was installed in the collimated portion of the beam within the spectrometer in order to eliminate the excitation line from the much weaker Raman signal. A Princeton Instruments PIXIS 256BR camera was used to collect the spectral information. This camera uses 1024 x 256 CCD array cooled to -70˚C. A high-powered laser developed by Process Instruments (Salt Lake City, Utah, USA) was used to provide the narrow band, stable, excitation wavelength at 785 nm. This laser was wavelength stabilized and reached maximum power of 500 mW. An Iridian Spectral Technologies (Ottawa, Ontario, Canada) laser line filter was installed within the laser. The samples were placed in polypropylene test tubes of constant height and diameter and were then transferred to a custom Teflon™ integrating cavity specifically designed by P&P Optica Inc. Laser light was coupled through a custom fiber into the integrating cavity. Scattered light was collected by a multibranch fiberoptic cable which formed a 6mm slit at the entrance of the spectrometer. Both fiber bundles were
Proc. of SPIE Vol. 7182 71820M-3
custom made by FiberTech Optica (Kitchener, Ontario, Canada). Data acquisition was controlled through Princeton Instruments Winspec/32. All data processing and Raman spectra extraction was custom developed by P&P Optica and performed with GPL licence mathematical software Octave (www.octave.org).
3. EXPERIMENTS 3.1 Sample preparation
In order to perform the analysis, a variety of acetaminophen containing samples were acquired as illustrated in Table 1. The coating of all tablets was scraped and the uncoated pills were ground into fine powder. Since NIR spectroscopy is very sensitive to water content, all powdered samples were dried in 110°C oven until there was no detectable change the sample’s mass, and then placed in a desiccator for additional 48 hours prior to measurements. The powders were placed either in glass test tubes for the broadband spectral measurement, or in polypropylene test tubes for the Raman spectral measurement.
Samples A to F had only one active ingredient, but varied in the non-medical ingredients such as the presence of corn starch, cellulose and others. Samples G-N all had acetaminophen, but also various other medical ingredients such as caffeine, phenylephrine hydrochloride and others. The G-N samples also had more non-medical ingredients and fillers.
3.2 Broadband measurement
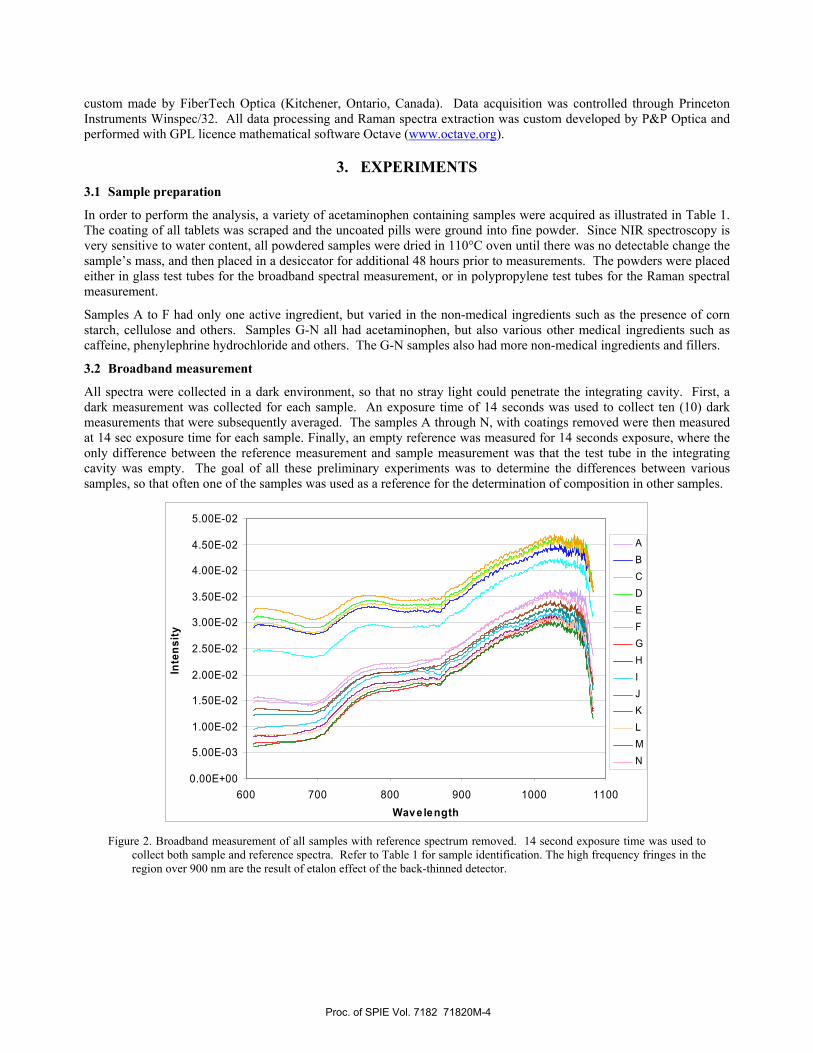
All spectra were collected in a dark environment, so that no stray light could penetrate the integrating cavity. First, a dark measurement was collected for each sample. An exposure time of 14 seconds was used to collect ten (10) dark measurements that were subsequently averaged. The samples A through N, with coatings removed were then measured at 14 sec exposure time for each sample. Finally, an empty reference was measured for 14 seconds exposure, where the only difference between the reference measurement and sample measurement was that the test tube in the integrating cavity was empty. The goal of all these preliminary experiments was to determine the differences between various samples, so that often one of the samples was used as a reference for the determination of composition in other samples.
0.00E+00
5.00E-03
1.00E-02
1.50E-02
2.00E-02
2.50E-02
3.00E-02
3.50E-02
4.00E-02
4.50E-02
5.00E-02
600 700 800 900 1000 1100Wavelength
Inte
nsity
ABCDEFGHIJKLMN
Figure 2. Broadband measurement of all samples with reference spectrum removed. 14 second exposure time was used to
collect both sample and reference spectra. Refer to Table 1 for sample identification. The high frequency fringes in the region over 900 nm are the result of etalon effect of the back-thinned detector.
Proc. of SPIE Vol. 7182 71820M-4
3.3 Broadband measurement analysis
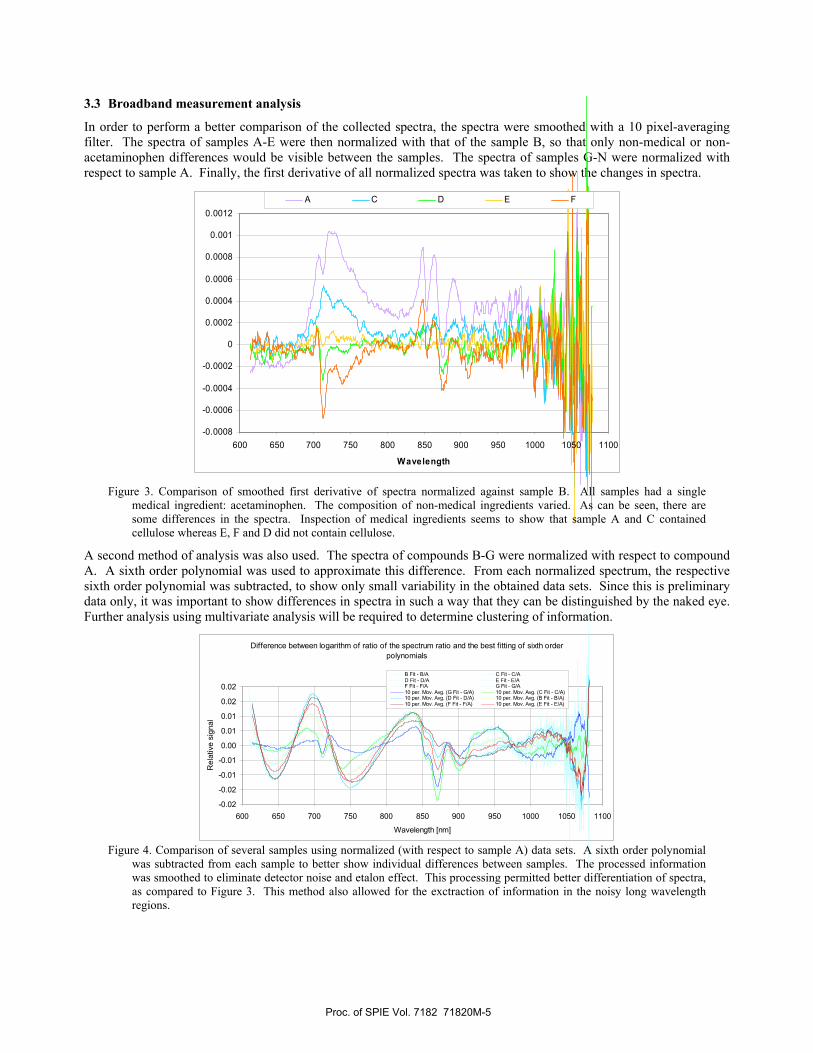
In order to perform a better comparison of the collected spectra, the spectra were smoothed with a 10 pixel-averaging filter. The spectra of samples A-E were then normalized with that of the sample B, so that only non-medical or non-acetaminophen differences would be visible between the samples. The spectra of samples G-N were normalized with respect to sample A. Finally, the first derivative of all normalized spectra was taken to show the changes in spectra.
-0.0008
-0.0006
-0.0004
-0.0002
0
0.0002
0.0004
0.0006
0.0008
0.001
0.0012
600 650 700 750 800 850 900 950 1000 1050 1100
Wavelength
A C D E F
Figure 3. Comparison of smoothed first derivative of spectra normalized against sample B. All samples had a single
medical ingredient: acetaminophen. The composition of non-medical ingredients varied. As can be seen, there are some differences in the spectra. Inspection of medical ingredients seems to show that sample A and C contained cellulose whereas E, F and D did not contain cellulose.
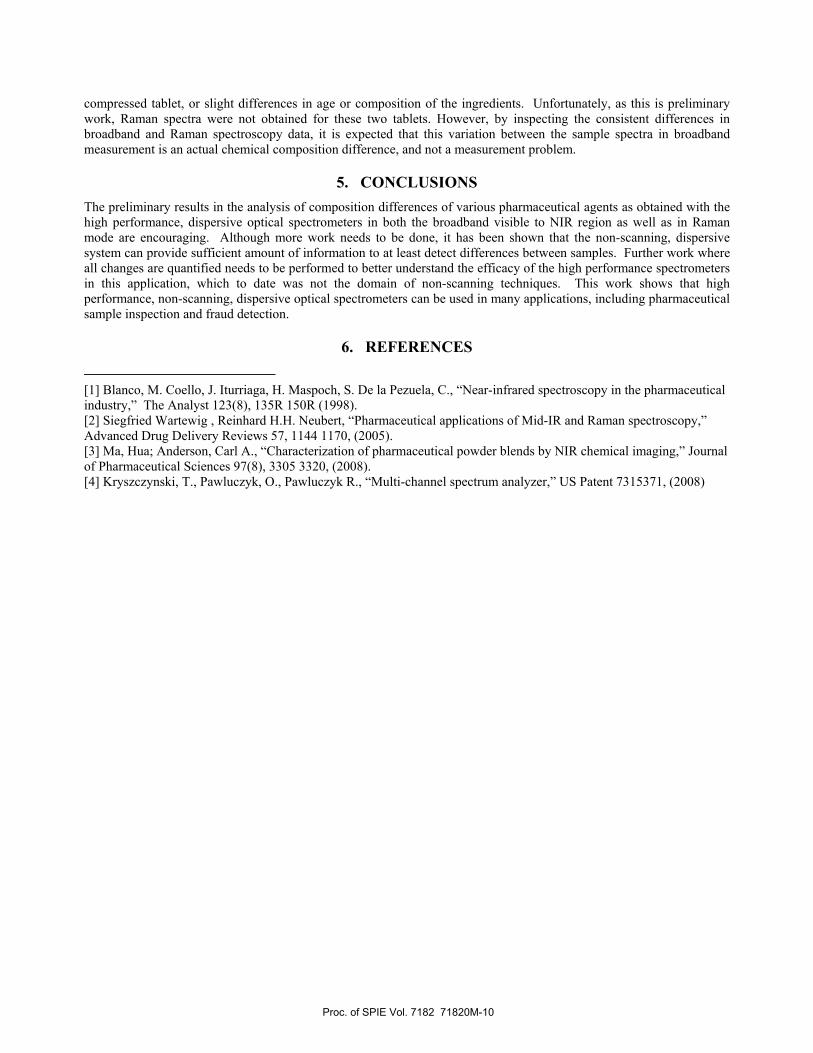
A second method of analysis was also used. The spectra of compounds B-G were normalized with respect to compound A. A sixth order polynomial was used to approximate this difference. From each normalized spectrum, the respective sixth order polynomial was subtracted, to show only small variability in the obtained data sets. Since this is preliminary data only, it was important to show differences in spectra in such a way that they can be distinguished by the naked eye. Further analysis using multivariate analysis will be required to determine clustering of information.
Difference between logarithm of ratio of the spectrum ratio and the best fitting of sixth order polynomials
-0.02
-0.02
-0.01
-0.01
0.00
0.01
0.01
0.02
0.02
600 650 700 750 800 850 900 950 1000 1050 1100
Wavelength [nm]
Rel
ativ
e si
gnal
B Fit - B/A C Fit - C/AD Fit - D/A E Fit - E/AF Fit - F/A G Fit - G/A10 per. Mov. Avg. (G Fit - G/A) 10 per. Mov. Avg. (C Fit - C/A)10 per. Mov. Avg. (D Fit - D/A) 10 per. Mov. Avg. (B Fit - B/A)10 per. Mov. Avg. (F Fit - F/A) 10 per. Mov. Avg. (E Fit - E/A)
Figure 4. Comparison of several samples using normalized (with respect to sample A) data sets. A sixth order polynomial
was subtracted from each sample to better show individual differences between samples. The processed information was smoothed to eliminate detector noise and etalon effect. This processing permitted better differentiation of spectra, as compared to Figure 3. This method also allowed for the exctraction of information in the noisy long wavelength regions.
Proc. of SPIE Vol. 7182 71820M-5

As seen in Figure 2, the spectra of samples A-F are quite similar. These samples all contained only acetaminophen as the active ingredient and varied only in the presence of various fillers such as cellulose, corn starch and others. Further investigation of the first order derivative, as in Figure 3 of the spectra shows that small differences are present and seem to indicate these composition differences.
-0.0035
-0.0025
-0.0015
-0.0005
0.0005
0.0015
0.0025
600 650 700 750 800 850 900 950 1000 1050 1100
Wavelength
-0.001
-0.0005
0
0.0005
0.001
0.0015
0.002
0.0025
0.003GHMN
Figure 5. Comparison of smoothed first derivative of spectra normalized against sample A. Sample G and H varied by the
presence of chlorpheniramine maleate in sample H, as well as the presence of different dyes. On the other hand, samples M and N varied only by the presence of chlorpheniramine maleate. The elevated peaks around 650-700nm in samples H and N seem to indicate that this difference could be explained by the presence of chlorpheniramine maleate.
-0.0045
-0.0035
-0.0025
-0.0015
-0.0005
0.0005
0.0015
0.0025
0.0035
600 650 700 750 800 850 900 950 1000 1050 1100
Wavelength
-0.002
-0.001
0
0.001
0.002
0.003
0.004
0.005
G K
H L
Figure 6. Comparison of smoothed first derivative of spectra normalized against sample A. Although samples H and L are
supposed to be identical by the manufacturer’s ingredient list, we were surprised to see that there is a significant difference between the spectra, which at this moment cannot be explained. The ingredient list of these two medications is identical, yet some minute differences in the spectra seem to indicate that some ingredients are different, and based on Figure 5, this might actually mean that sample H has chlorpheniramine maleate, which is not present in sample L. More analysis of these samples has to be performed to identify the reason for the spectral differences.
Proc. of SPIE Vol. 7182 71820M-6

Although the broadband analysis shown here does show differences between samples, it is impossible to determine the reasons for these differences without more advanced chemometric analysis. The composition changes of the multiple tablets tested are reflected in the broadband spectra, but it is difficult to determine the exact quantitative differences. On the other hand, Raman spectroscopy tends to provide better composition specific response. Since the P&P Optica high performance, dispersive optical spectrometers can function in both broadband and Raman modes, equivalent Raman spectroscopy analysis was performed on the available acetaminophen containing compounds.
3.4 Raman measurement
The Raman signals from samples were collected in a completely dark room. Three 2D images obtained with 10 sec exposure were averaged for each measurement. Three types of measurements were done. First, a dark current measurement was performed with the spectrometer shutter closed and laser off. Second, a reference spectrum was obtained from the integrating cavity and an empty polypropylene test tube. Finally, each sample was placed in a polypropylene tube and measured. All samples were prepared by removing the pill coatings, grinding the pills into powder and then drying the sample until mass of the sample was constant. The conditions within the laboratory were kept relatively constant. However, changes in the excitation wavelength were noticeable from day to day, especially as the temperature of the room changed by 1°C. The drift of the laser was close to 1 cm-1, this drift had to be taken into consideration when reference signal was subtracted from the sample spectra. Due to time constraints, only samples A to J were analyzed with Raman spectroscopy.
3.5 Raman measurement analysis
The collection of Raman signal was somewhat more complicated than the broadband measurements. Since a Teflon™ integrating cavity was used to collect the Raman signal from the samples, a very strong underlying signal from the integrating cavity was present in all measurements. In order to extract the weaker Raman signals from the sample, in-house algorithms had to be developed in GPL software Octave. Furthermore, a subtraction of the baseline signal (fluorescence, background and any other effects) had to be removed from each measurement before reference subtraction could be performed. An example of a baseline removal is shown in Figure 7. The baseline was obtained by manually selecting the same pixels in all data sets, all of which corresponded to local minima in the spectra. These minima were then used to determine a best baseline fit by using a piece-wise cubic hermite interpolating polynomial.
Sample Of Baseline Removal
-10000
0
10000
20000
30000
40000
50000
60000
70000
0500100015002000250030003500
Raman Shift (cm-1)
Inte
nsity
Figure 7. Example of reference spectrum along with subtraction of dark noise, fluorescence and baseline signal. The
spectrum at the bottom of the plot (with no underlying baseline) was used for all subsequent steps of the analysis.
The second part of the analysis of Raman spectra was to subtract the flat reference signal from the flat sample spectra. The reference spectrum was normalized to one of the strongest Teflon Raman peaks in the signal. The sample signal spectra were normalized to one of three stable peaks within the spectra. The ratio of all major peaks was calculated for all sample spectra. It was assumed that if several peaks within the spectra have similar ratios across all samples these
Proc. of SPIE Vol. 7182 71820M-7

ratios correspond to compounds which are the same in all samples. One of the stronger peaks within these ratio groups was then selected as a normalization peak.
Raman Spectra of Samples
-0.05
-0.03
-0.01
0.01
0.03
0.05
0.07
0.09
2704706708701070127014701670
Raman Shift (cm-1)
Inte
nsity
(a.u
.)
A-ref B-ref C-ref D-ref E-ref F-ref Figure 8. Examples of processed Raman spectra for various samples. The negative peaks occur where strong Teflon peaks
were used to normalize the reference spectrum which was subsequently subtracted from the samples. The plot illustrates a subset of the Raman spectra within a smaller Raman shift range to better show differences between samples. Samples B, C, D, E and F all are generic acetaminophen tablets, all with a single active ingredient. Sample A is the brand name Tylenol™ tablet, and as can be seen from the Raman spectra, this sample has the most significant difference in Raman spectra as compared to the other generic drugs.
Raman Spectra of Samples
-0.05
-0.03
-0.01
0.01
0.03
0.05
0.07
0.09
2704706708701070127014701670
Raman Shift (cm-1)
Inte
nsity
(a.u
.)
B-ref H-ref J-ref
Figure 9. Comparison of Raman spectra of samples B, H and J. These samples vary the most in the ingredient list, and therefore the strongest Raman signal differences should be expected. As seen from the plot, various features vary significantly between samples.
Proc. of SPIE Vol. 7182 71820M-8

Comparison of Raman sample spectra with sample B signal subtracted
-0.05
-0.04
-0.03
-0.02
-0.01
0
0.01
0.02
0.03
2704706708701070127014701670
Raman Shift (cm-1)
Inte
nsity
(a.u
.)
H-B J-B Figure 10. Comparison of sample spectra with sample B spectrum subtracted. The samples B, H and J are most
significantly different from each other based on the list of ingredients. Subtraction of the base generic acetaminophen spectra (sample B) shows the differences between samples.
Comparison of samples normalized to sample B
-0.05
-0.04
-0.03
-0.02
-0.01
0
0.01
0.02
0.03
2704706708701070127014701670
Raman Shift (cm-1)A-B C-B D-B E-B F-B
Figure 11. Comparison of Raman spectra of several samples normalized to sample B. Similar trends as in broadband spectroscopy measurements in Figure 3 are seen, where samples E and F are quite different from samples A, C and D.
4. RESULTS AND DISCUSSION Although preliminary, the results from the analysis of acetaminophen samples with broadband NIR as well as Raman spectroscopy show that these two methods using non-scanning, high performance dispersive spectrometers can be used in the analysis of pharmaceuticals. The tablets which differ in their list of ingredients show significant differences in the obtained spectra. This trend is observed in both measurement methods, as can be illustrated by Figure 3 and Figure 11. These two plots were obtained by comparing the same set of samples, while subtracting a baseline spectrum of sample B from all the subsequent samples. Samples A and C are quite similar in both the broadband and Raman measurement, while samples D, E and F tend to form a second, distinct group.
The broadband spectroscopy of samples H and L, which according to their ingredient list are identical, shows the strength of the method in the inspection of pharmaceuticals. Although it is difficult at this time to explain what ingredient causes significant differences in the broadband spectra of these two samples, it is obvious that some aspect of the two tablets is different. This could be caused by such differences as higher concentration of one filler, a more
Proc. of SPIE Vol. 7182 71820M-9
compressed tablet, or slight differences in age or composition of the ingredients. Unfortunately, as this is preliminary work, Raman spectra were not obtained for these two tablets. However, by inspecting the consistent differences in broadband and Raman spectroscopy data, it is expected that this variation between the sample spectra in broadband measurement is an actual chemical composition difference, and not a measurement problem.
5. CONCLUSIONS The preliminary results in the analysis of composition differences of various pharmaceutical agents as obtained with the high performance, dispersive optical spectrometers in both the broadband visible to NIR region as well as in Raman mode are encouraging. Although more work needs to be done, it has been shown that the non-scanning, dispersive system can provide sufficient amount of information to at least detect differences between samples. Further work where all changes are quantified needs to be performed to better understand the efficacy of the high performance spectrometers in this application, which to date was not the domain of non-scanning techniques. This work shows that high performance, non-scanning, dispersive optical spectrometers can be used in many applications, including pharmaceutical sample inspection and fraud detection.
6. REFERENCES [1] Blanco, M. Coello, J. Iturriaga, H. Maspoch, S. De la Pezuela, C., “Near-infrared spectroscopy in the pharmaceutical industry,” The Analyst 123(8), 135R 150R (1998). [2] Siegfried Wartewig , Reinhard H.H. Neubert, “Pharmaceutical applications of Mid-IR and Raman spectroscopy,” Advanced Drug Delivery Reviews 57, 1144 1170, (2005). [3] Ma, Hua; Anderson, Carl A., “Characterization of pharmaceutical powder blends by NIR chemical imaging,” Journal of Pharmaceutical Sciences 97(8), 3305 3320, (2008). [4] Kryszczynski, T., Pawluczyk, O., Pawluczyk R., “Multi-channel spectrum analyzer,” US Patent 7315371, (2008)
Proc. of SPIE Vol. 7182 71820M-10