
Confocal Raman Microscopy; Applications in Tissue ... - CORE
Upload
independentCategory
view
3download
0
Application of Surface-Enhanced Raman Spectroscopyfor Detection of Beta Amyloid Using Nanoshells
Hope T. Beier & Christopher B. Cowan & I-Hsien Chou &
James Pallikal & James E. Henry & Melodie E. Benford &
Joseph B. Jackson & Theresa A. Good & Gerard L. Coté
Received: 20 February 2007 /Accepted: 27 April 2007 /Published online: 6 June 2007# Springer Science + Business Media, LLC 2007
Abstract Currently, no methods exist for the definitivediagnosis of AD premortem. β-amyloid, the primarycomponent of the senile plaques found in patients with thisdisease, is believed to play a role in its neurotoxicity. Weare developing a nanoshell substrate, functionalized withsialic acid residues to mimic neuron cell surfaces, for thesurface-enhanced Raman detection of β-amyloid. It is ourhope that this sensing mechanism will be able to detect thetoxic form of β-amyloid, with structural and concentrationinformation, to aid in the diagnosis of AD and provideinsight into the relationship between β-amyloid and diseaseprogression. We have been successfully able to function-alize the nanoshells with the sialic acid residues to allow forthe specific binding of β-amyloid to the substrate. We havealso shown that a surface-enhanced Raman spectroscopyresponse using nanoshells is stable and concentration-dependent with detection into the picomolar range.
Keywords Surface-enhanced Raman spectroscopy . SERS .
Raman spectroscopy . Nanoshells .β-amyloid . Alzheimer’sdisease . Congo red . Self-assembled monolayer
Introduction
Since Alois Alzheimer first discovered the pathology of thedisease bearing his appellation in 1906, the number ofpeople diagnosed with Alzheimer’s disease (AD) has beenon the rise [1]. Alzheimer’s disease, a neurodegenerativedisease and the most common cause of dementia, affects4.5 million people according to the 2000 US census [2].Due to various factors, such as longer life expectancy, theaging of the Baby boomers, and the subsequent increase ofthe number of people in the oldest age group (>65), theincidence of AD is expected to triple to 13.2 million by theyear 2050 [2–5]. The economic impact of AD is staggering.With an annual cost of over $100 billion per year, AD is thethird most costly disease in the USA after heart disease andcancer [6]. In recent years, there has been great interest andprogress made in the development of molecular levelstrategies to target steps in the pathogenesis of AD [7–18], with the expectation that even a modest delay of onsetof AD of as little as 5 years would result in a 50% reductionin the number of AD patients [19]. However, if these newmolecular therapeutics are to be successfully applied, adefinitive premortem diagnosis of AD is necessary.
Premortem diagnosis of AD is only probable and is basedon in vivo imaging of the brain with magnetic resonanceimaging or functional positron emission tomography, alongwith tests of cognitive and psychological function [20–22].Alzheimer’s disease can only be diagnosed definitively byidentifying extracellular amyloid plaques composed ofamyloid-β (Aβ) and neurofibrillary tangles, which consist
Plasmonics (2007) 2:55–64DOI 10.1007/s11468-007-9027-x
H. T. Beier (*) : I.-H. Chou :M. E. Benford :G. L. CotéDepartment of Biomedical Engineering, Texas A&M University,337 Zachry Engineering Center, 3120 TAMU,College Station, TX 77843-3120, USAe-mail: [email protected]
C. B. Cowan : J. Pallikal : J. E. Henry : T. A. GoodDepartment of Chemical & Biochemical Engineering,University of Maryland Baltimore County,Baltimore, MD, USA
J. B. JacksonNanospectra Biosciences, Inc.,Houston, TX, USA
Present address:J. E. HenryDepartment of Chemical Engineering, Louisiana State University,Baton Rouge, LA, USA
of tau proteins, in postmortem central nervous system tissue[5, 23–30]. The main constituent of the neuritic plaques isthe 39–43 amino acid peptide, β-amyloid (Aβ). Thepresence of neurofibrillary tangles in the absence of neuriticplaques indicates the pathogenesis of other, less commonneurodegenerative diseases. On the same note, neuriticplaques, in the absence of neurofibrillary tangles, can befound in brains with no detectable neuritic dystrophy; theseare known as diffuse, or preamyloid, plaques. These diffuseplaques can develop 20 years before the person showssymptoms of dystrophic neurons [3, 5, 24, 27]. For manypatients, it is difficult to determine cognitively whether thepatient has AD or only mild cognitive impairment, a diseasewhich may progress to AD or remain as a benign form ofnormal aging [23, 26, 30].
With the goal of developing a means of diagnosing ADpremortem, many groups are looking into the detection ofthe two proteins, tau and Aβ, that are associated with thedisease postmortem. While it is not certain that levels ofthese proteins will correlate with AD, it is speculated that ameans of detecting structure-specific forms of Aβ incerebral spinal fluid (CSF) may be used as a biomarkerfor AD. Soluble oligomers of Aβ act as ligands on the cellmembrane, consequently earning the name Aβ-deriveddiffusible ligand (ADDL), triggering a cascade of eventsthat many hypothesize brings about neuritic dystrophy andneuronal death. ADDLs specifically have high-affinitybinding with gangliosides containing multiple sialic acidresidues. Studies show that intermediate oligomer forms ofthe Aβ protein such as ADDLs, rather than monomeric orfibril forms, disrupt learning and behavior and are morelikely to be the cause of the disease toxicity [5, 7, 24, 27–29, 31–36]. Some research groups are looking into thedetection of ADDLs through the use of antibodies specificto this protein. Haes et al. have instituted the use oflocalized surface plasmon resonance nanosensors to detectanti-ADDL antibodies and ADDLs [37, 38]. This approachwas able to determine the concentration of ADDLs in thediseased brain to be around 1 pM, with a larger concentra-tion of ADDLs in the CSF of AD patients as compared tonon-AD patients. Georganopoulou et al. used bio-barcodetechnology for the specific detection of ADDLs in CSF[39]. This approach was able to detect ADDLs into thefemtomolar range and was important in demonstrating thecorrelation of elevated ADDL levels with AD. However,these two approaches were specific only to ADDLs, oneform of the many oligomeric forms of Aβ that could beindicative of AD. Development of a sensor platform thatenables the rapid and selective detection of ADDLs alongwith other Aβ oligomers and fibril species that maycontribute to AD pathology would be a valuable tool inthe study of AD and the development of premortemdiagnostics for this disease.
The Raman spectrum is considered a useful tool fordetection of bioanalytes because it provides an opticalfingerprint of the molecules in question. Traditional Ramanspectroscopy, however, is an ineffective tool for bioanalytedetection, especially at trace concentrations, because arelatively low number of photons are Raman, or inelasti-cally, scattered as compared to the number of photons thatare Rayleigh, or elastically, scattered. To overcome thisproblem, the use of surface-enhanced Raman spectroscopy(SERS) has been instituted. SERS provides significantenhancement of the Raman intensity, on the order of 106 to1014 times, through electromagnetic field enhancement andchemical enhancement that increases the Raman crosssection of the individual molecule when the molecule ofinterest is close to a roughened metal [40–46]. Theseenhancement factors are considered to represent the SERSsignal at a Raman-scattered frequency υS in Eq. 1 [45, 46].
PSERS υSð Þ ¼ N 0σRadsI υLð Þ A υLð Þj j2 A υSð Þj j2 ð1Þ
In this equation, N′ is the number of molecules involvedin the SERS process, σR
ads represents the increased Ramancross section of the adsorbed Raman-active molecules, andI υLð Þ is the intensity of the excitation source. A υLð Þj j2 andA υSð Þj j2 are the electromagnetic enhancement factors at theexcitation and Raman-scattered frequencies, respectively.Using the approximation of a small sphere of radius r witha complex dielectric constant ɛ(ν) in a surrounding mediumwith a dielectric constant of ɛ0, the enhancement can beestimated as shown in Eq. 2 to produce the total elec-tromagnetic enhancement given in Eq. 3.
A υð Þj j � " υð Þ � "0" υð Þ þ 2"0
r
r þ d
� �3
ð2Þ
A υLð Þj j2 A υSð Þj j2
� " υLð Þ � "0" υLð Þ þ 2"0
��������2
" υSð Þ � "0" υSð Þ þ 2"0
��������2 r
r þ d
� �12
ð3Þ
In these equations, d is the distance of the analytemolecule from the metal sphere, indicating the very strongspatial dependence of the SERS signal. The enhancement isstrongest when the surface plasmons are in resonance withboth the excitation and Raman-scattered fields, and thisenhancement is dependent, to the fourth power, on the localnanostructure field of the metal. These strong spatial andlocal nanostructure field dependencies may be producingthe small, localized “hot spots” of extremely strongenhancement known to occur with SERS, which give thepotential for trace analyte detection but also make theproduction of reproducible SERS surfaces difficult [45, 46].
56 Plasmonics (2007) 2:55–64
Nanoshells are spherical nanoparticles with a dielectriccore surrounded by a metal shell with plasmon resonancesthat can be adjusted by altering the ratio of the corediameter to the shell diameter [47]. Nanoshells have beenpreviously shown to provide significant SERS enhance-ments of 106–1010 in the near IR by tuning the plasmonresonance to the excitation laser wavelength [48–50].Additionally, by controlling the geometry of the nanoshells,the SERS enhancement for a layer of nonresonant mole-cules bound to the surface of the nanoshells can becontrolled with quantitative agreement between theoreticaland experimental results [48]. Solutions of nanoshells arelimited by significant reabsorption of the backscatteredSERS signal by other nanoshells, which limits the observedSERS enhancement [49]. Thus, it is desired that thenanoshells be deposited onto a substrate to allow for largerSERS enhancements due to the simplified collectiongeometry. The intensity of the Raman signal from thesenanoshell substrates has been shown to have a lineardependence on the density of nanoshells, indicating thatthe observed SERS signal is dependent on the resonance ofsingle nanoshells with little contribution from aggregates. Itis theorized that the interparticle forces between the nano-shells are very strong, resulting in the nanoparticles beingeither more than a particle radius apart or in direct contact.This direct contact between the nanoshells likely does notallow for the deposition of the adsorbate molecules betweenthe nanoshells. This response is in opposition to theresponse from solid nanoparticles where the observedSERS signal was minimal until the nanoparticles began toform aggregates on the film [51]. Thus, unlike aggregatesof solid nanoparticles where the enhancement is derivedfrom uncontrolled aggregates of particles that produce “hotspots” for SERS enhancement [52], the SERS enhancementfrom the nanoshells is not dependent on these “hot spots.”This feature allows for a uniform substrate where the SERSenhancement can be determined to be a function of thenumber of the molecules bound to the substrate, not as afunction of the degree of enhancement in that one location.
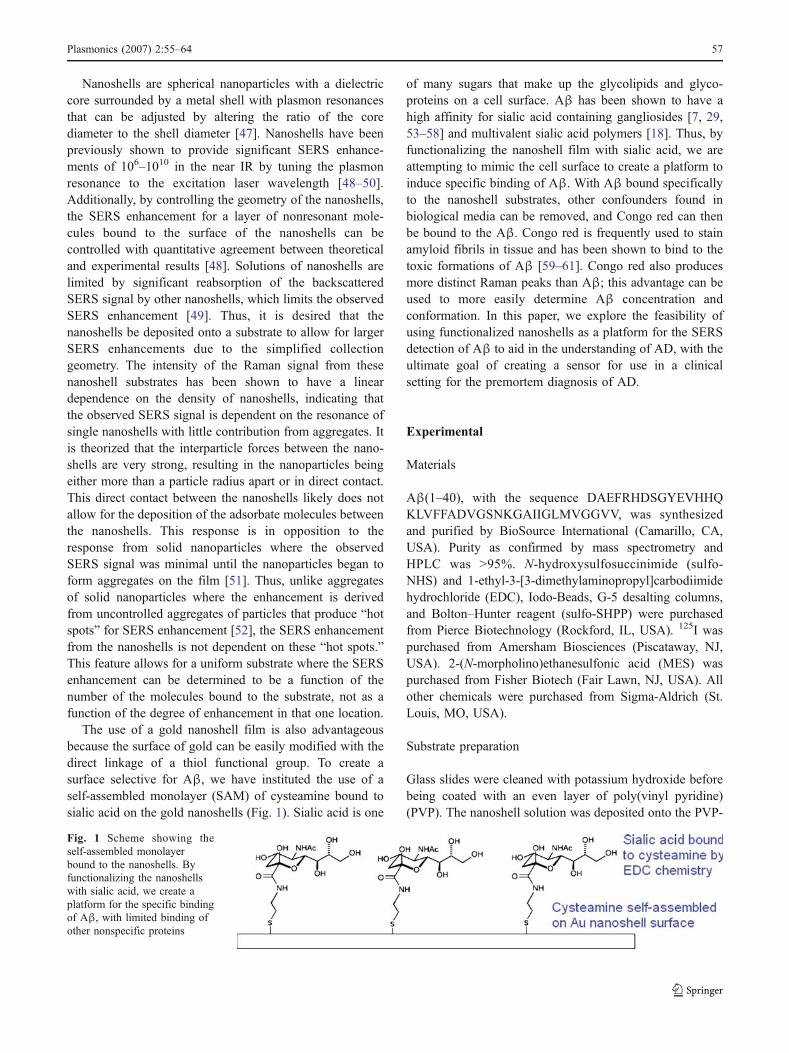
The use of a gold nanoshell film is also advantageousbecause the surface of gold can be easily modified with thedirect linkage of a thiol functional group. To create asurface selective for Aβ, we have instituted the use of aself-assembled monolayer (SAM) of cysteamine bound tosialic acid on the gold nanoshells (Fig. 1). Sialic acid is one
of many sugars that make up the glycolipids and glyco-proteins on a cell surface. Aβ has been shown to have ahigh affinity for sialic acid containing gangliosides [7, 29,53–58] and multivalent sialic acid polymers [18]. Thus, byfunctionalizing the nanoshell film with sialic acid, we areattempting to mimic the cell surface to create a platform toinduce specific binding of Aβ. With Aβ bound specificallyto the nanoshell substrates, other confounders found inbiological media can be removed, and Congo red can thenbe bound to the Aβ. Congo red is frequently used to stainamyloid fibrils in tissue and has been shown to bind to thetoxic formations of Aβ [59–61]. Congo red also producesmore distinct Raman peaks than Aβ; this advantage can beused to more easily determine Aβ concentration andconformation. In this paper, we explore the feasibility ofusing functionalized nanoshells as a platform for the SERSdetection of Aβ to aid in the understanding of AD, with theultimate goal of creating a sensor for use in a clinicalsetting for the premortem diagnosis of AD.
Experimental
Materials
Aβ(1–40), with the sequence DAEFRHDSGYEVHHQKLVFFADVGSNKGAIIGLMVGGVV, was synthesizedand purified by BioSource International (Camarillo, CA,USA). Purity as confirmed by mass spectrometry andHPLC was >95%. N-hydroxysulfosuccinimide (sulfo-NHS) and 1-ethyl-3-[3-dimethylaminopropyl]carbodiimidehydrochloride (EDC), Iodo-Beads, G-5 desalting columns,and Bolton–Hunter reagent (sulfo-SHPP) were purchasedfrom Pierce Biotechnology (Rockford, IL, USA). 125I waspurchased from Amersham Biosciences (Piscataway, NJ,USA). 2-(N-morpholino)ethanesulfonic acid (MES) waspurchased from Fisher Biotech (Fair Lawn, NJ, USA). Allother chemicals were purchased from Sigma-Aldrich (St.Louis, MO, USA).
Substrate preparation
Glass slides were cleaned with potassium hydroxide beforebeing coated with an even layer of poly(vinyl pyridine)(PVP). The nanoshell solution was deposited onto the PVP-
Fig. 1 Scheme showing theself-assembled monolayerbound to the nanoshells. Byfunctionalizing the nanoshellswith sialic acid, we create aplatform for the specific bindingof Aβ, with limited binding ofother nonspecific proteins
Plasmonics (2007) 2:55–64 57
modified slides and allowed to bind for 3 h. The nanoshellswere engineered to maximize the Raman response for a785-nm laser excitation in an air environment. The nano-shells have a core radius of ~94 nm, with ~18-nm-thickgold shells. These dimensions were determined by com-paring the measured absorbance to Mie scattering calcu-lations, and verified by dynamic light scattering. To increasethe reflectance of the slides to increase the grazing angleFourier transform infrared (FTIR) and SERS signals, vapordeposition was used to coat the glass slides with a thin layerof gold prior to PVP deposition.
Nanoshell slides were then prepared for modification bycleaning the slides in a hydrogen peroxide solution for 1.5 hbefore drying under a gentle N2 stream. A solution of 1 mMsialic acid, 1 mM cysteamine, 10 mM sulfo-NHS, and4 mM EDC was prepared in a 0.1-M MES buffer. The pHwas adjusted to 5.0 and the solution was allowed to reactfor 6 h, while being mixed, to ensure proper attachment ofthe sialic acid to the amine terminal of the cysteamine.Then, 500 μL of the reacted solution was pipetted overthe gold nanoshell surface. The thiol functional groups ofthe cysteamine bound spontaneously to the gold surfaceof the nanoshells to create a uniform, self-assembledmonolayer (Fig. 1).
Determination of binding affinity (KAβ) and surfacesaturation (Nsat)
Binding affinity of Aβ to the surfaces was estimated fromequilibrium binding isotherms performed using radioiodin-ated Aβ [18]. Aβ(1–40) was radioiodinated via a modifiedBolton Hunter method to preferentially label at the Nterminus of the peptide. One hundred nanomoles of sulfo-SHPP was iodinated with 200 μCi of 125I using theIodoBead catalyst for 15 min at pH 8.0 borate buffer in avolume of 140 μL. After removal of the catalyst, 2 nmol(100 μL) of freshly prepared Aβ(1–40) (in water) wasadded and allowed to react to the iodinated sulfo-SHPP for3 h at 4°C. The resulting condensation product was sepa-rated from free 125I using a G-5 desalting column, employ-ing phosphate buffer as the eluent. The trichloroacetic acidprecipitatable activity was determined to be >90%. Noattempt was made to remove unlabeled peptide fromlabeled peptide.
Aprotinin and lysozyme were iodinated directly withoutusing sulfo-SHPP. Two Iodobeads were added to 100 μLPBS, to which 100 μCi 125I (10 μL) was added. Threehundred ninety microliters of either 1 mg/mL of lysozymeor 0.5 mg/mL of aprotinin was incubated in the presence of125I and Iodobeads for 10 min. Iodinated protein wasseparated from free 125I using G-5 desalting columns.
Binding assays were carried out by incubating 125I-labeled protein of different concentrations directly with
sialic acid-modified surfaces at room temperature for 2 h.Tween-20 was also added at a final concentration of 0.1%to block nonspecific binding. Thereafter, free protein wasremoved from that bound to the surface by directlypipetting the solution from the surface. Bound protein wasrecovered from the surface by gently rubbing a 1-cm2 areaof the surface with a cotton swab. Activities of the freeprotein and bound protein (now attached to the cotton swab)were measured using a Wallac MicroBeta TriLux microplateliquid scintillation counter (Perkin Elmer, Wellesley, MA,USA). Binding constants were determined from these resul-tant equilibrium binding isotherms by fitting a Langmuirisotherm (Eq. 4) to the data using a nonlinear least squaresregression algorithm (KaleidaGraph 3.6, Synergy Software,Reading, PA, USA).
Nbound ¼ Aβ½ �freeNsat
KAβ þ Aβ½ �freeð4Þ
where Nbound is the picomoles of Aβ bound to the surface;KAβ is the equilibrium dissociation coefficient of Aβwith thesurface; [Aβ]free is the concentration of Aβ in solution atequilibrium; and Nsat is the picomoles of Aβ on surface atsaturation conditions. The amount of Aβ bound to thesurface was normalized by the amount of surface area towhich the Aβ bound. Surface area was estimated as the areacovered by nanoshells but did not include an estimate ofany additional surface area from the nanoshell surfaces.
SERS experiments
Aβwas dissolved in DMSO to a concentration of 10 mg/mL,aliquoted into microcentrifuge tubes containing 5 μL ofsolution and stored in a −80°C freezer until use. Ninety fivemicroliters of 0.1 M PBS (pH 7.4) was added to the Aβ tocreate a 0.5-mg/mL (115 μM) solution. The Aβ was thenstirred on a rotary stirrer for 24 h at room temperature toform a mixture of oligomers and fibrils before beingstepwise diluted to the concentrations of interest. Thirtymicroliters of Aβ was added to nanoshell surfaces andgiven 30–45 min to bind before being rinsed 3× with PBSand 1× with deionized water. The slides were then driedwith a gentle stream of N2. Congo red at a concentration of120 μM in PBS was added to the slides and allowed to bindfor 20 min before the slides were rinsed and dried as before.
The SERS analysis was performed on a RenishawSystem 1000 Raman Spectrometer (Wotton-under-Edge,UK) coupled to a Leica DMLM microscope (Wetzlar,Germany). A 785-nm GaAlAs diode laser (SDL modelXC30) was used as the excitation laser. A 10× objectivelens was used to deliver 14.5 mW to the sample with anapproximate 10-μm spot size. A 20× objective lens wasalso used, which delivered 6.22 mW to the sample with an
58 Plasmonics (2007) 2:55–64
approximate 5-μm spot size. Raman scans were taken atrandom locations on the modified nanoshells surfaces andwere integrated for 15 or 30 s over the range of 1,623–1,110 cm−1.
Results and discussion
FTIR characterization—cysteamine and EDC chemistry
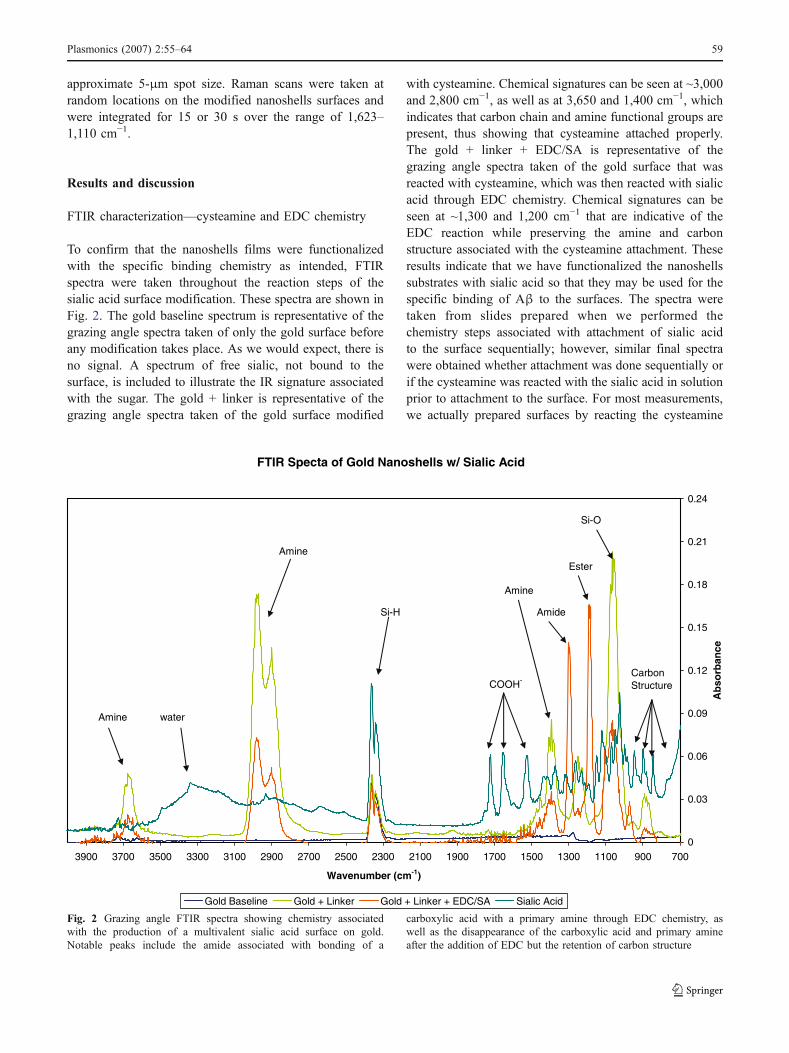
To confirm that the nanoshells films were functionalizedwith the specific binding chemistry as intended, FTIRspectra were taken throughout the reaction steps of thesialic acid surface modification. These spectra are shown inFig. 2. The gold baseline spectrum is representative of thegrazing angle spectra taken of only the gold surface beforeany modification takes place. As we would expect, there isno signal. A spectrum of free sialic, not bound to thesurface, is included to illustrate the IR signature associatedwith the sugar. The gold + linker is representative of thegrazing angle spectra taken of the gold surface modified
with cysteamine. Chemical signatures can be seen at ~3,000and 2,800 cm−1, as well as at 3,650 and 1,400 cm−1, whichindicates that carbon chain and amine functional groups arepresent, thus showing that cysteamine attached properly.The gold + linker + EDC/SA is representative of thegrazing angle spectra taken of the gold surface that wasreacted with cysteamine, which was then reacted with sialicacid through EDC chemistry. Chemical signatures can beseen at ~1,300 and 1,200 cm−1 that are indicative of theEDC reaction while preserving the amine and carbonstructure associated with the cysteamine attachment. Theseresults indicate that we have functionalized the nanoshellssubstrates with sialic acid so that they may be used for thespecific binding of Aβ to the surfaces. The spectra weretaken from slides prepared when we performed thechemistry steps associated with attachment of sialic acidto the surface sequentially; however, similar final spectrawere obtained whether attachment was done sequentially orif the cysteamine was reacted with the sialic acid in solutionprior to attachment to the surface. For most measurements,we actually prepared surfaces by reacting the cysteamine
FTIR Specta of Gold Nanoshells w/ Sialic Acid
0
0.03
0.06
0.09
0.12
0.15
0.18
0.21
0.24
700900110013001500170019002100230025002700290031003300350037003900
Wavenumber (cm-1)
Ab
sorb
ance
Gold Baseline Gold + Linker Gold + Linker + EDC/SA Sialic Acid
Amine water
Amine
Si-H
COOH-
Amine
Amide
Ester
Si-O
CarbonStructure
Fig. 2 Grazing angle FTIR spectra showing chemistry associatedwith the production of a multivalent sialic acid surface on gold.Notable peaks include the amide associated with bonding of a
carboxylic acid with a primary amine through EDC chemistry, aswell as the disappearance of the carboxylic acid and primary amineafter the addition of EDC but the retention of carbon structure
Plasmonics (2007) 2:55–64 59
and sialic acid in solution prior to attachment to thenanoshell surface, as these surfaces had fewer defects andless nonspecific Congo red binding.
Determination of binding affinity (KAβ) and surfacesaturation (Nsat)
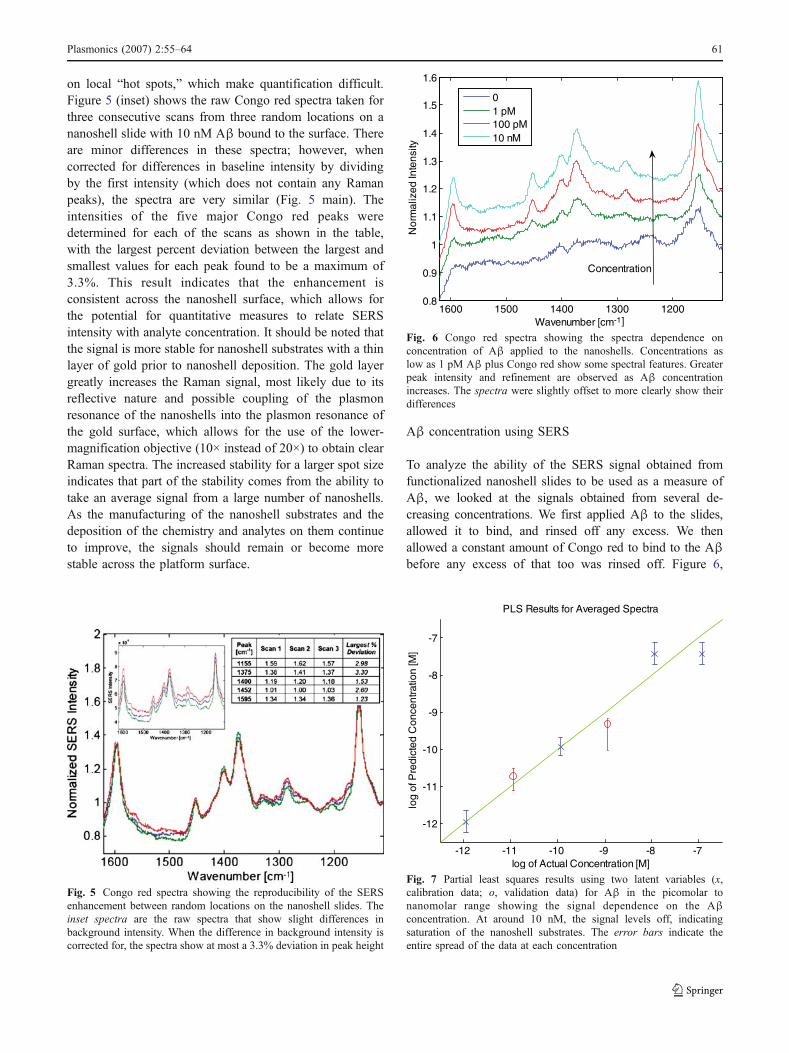
Figure 3 shows a representative binding isotherm for Aβbinding to the nanoshell substrates. The maximum bindingof beta amyloid to the gold was estimated to be 0.7±0.3 pmol/cm2 of area of the slide coated with nanoshells,and the equilibrium dissociation constant of the Aβ withthe surfaces was 14±8 nM. Two other proteins, lysozyme,which is known to form fibrils, and aprotinin, a small β-sheet protein, did not exhibit significant binding to thesubstrates. The Aβ binding affinity to sialic acid-modifiedsurfaces is comparable to that of Aβ to sialic acid-modifieddendrimers [18] and at least an order of magnitude greaterthan that measured for Aβ with the sialic acid containingglycolipids of cell membranes [7]. These results aresignificant in that they show that the Aβ is bindingspecifically to the sialic acid-modified nanoshell surfacesand that other proteins that form structures similar to Aβ donot bind appreciably under the same conditions.
Determination of SERS enhancement
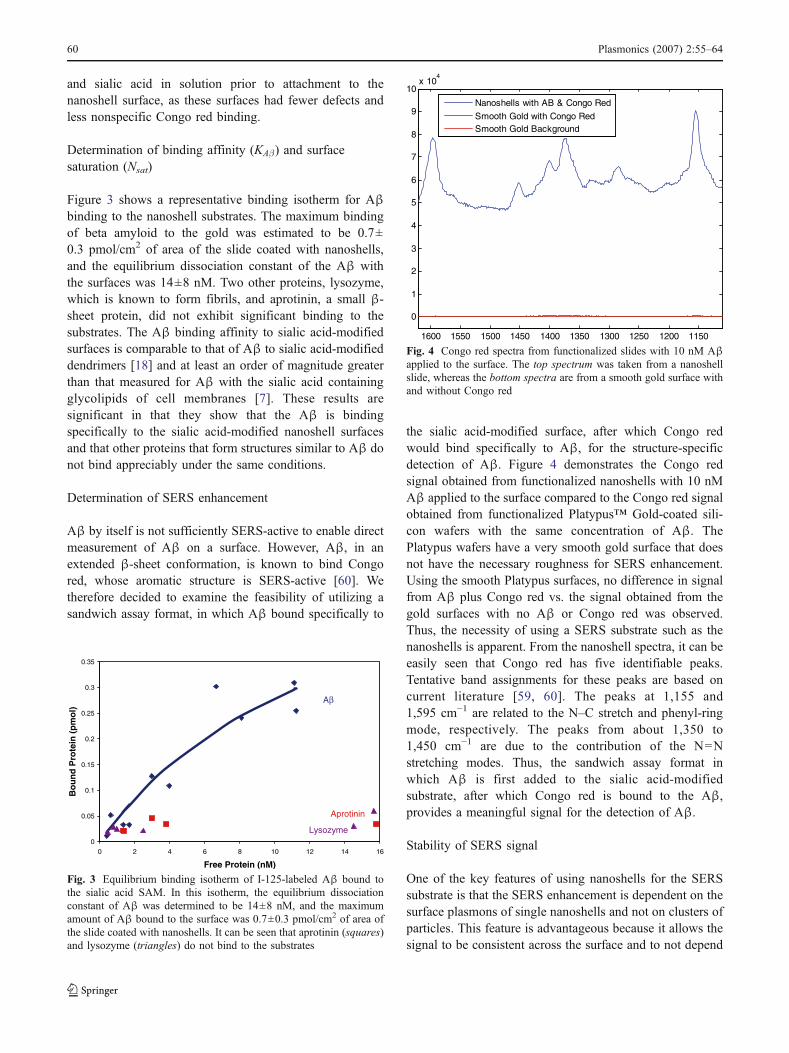
Aβ by itself is not sufficiently SERS-active to enable directmeasurement of Aβ on a surface. However, Aβ, in anextended β-sheet conformation, is known to bind Congored, whose aromatic structure is SERS-active [60]. Wetherefore decided to examine the feasibility of utilizing asandwich assay format, in which Aβ bound specifically to
the sialic acid-modified surface, after which Congo redwould bind specifically to Aβ, for the structure-specificdetection of Aβ. Figure 4 demonstrates the Congo redsignal obtained from functionalized nanoshells with 10 nMAβ applied to the surface compared to the Congo red signalobtained from functionalized Platypus™ Gold-coated sili-con wafers with the same concentration of Aβ. ThePlatypus wafers have a very smooth gold surface that doesnot have the necessary roughness for SERS enhancement.Using the smooth Platypus surfaces, no difference in signalfrom Aβ plus Congo red vs. the signal obtained from thegold surfaces with no Aβ or Congo red was observed.Thus, the necessity of using a SERS substrate such as thenanoshells is apparent. From the nanoshell spectra, it can beeasily seen that Congo red has five identifiable peaks.Tentative band assignments for these peaks are based oncurrent literature [59, 60]. The peaks at 1,155 and1,595 cm−1 are related to the N–C stretch and phenyl-ringmode, respectively. The peaks from about 1,350 to1,450 cm−1 are due to the contribution of the N=Nstretching modes. Thus, the sandwich assay format inwhich Aβ is first added to the sialic acid-modifiedsubstrate, after which Congo red is bound to the Aβ,provides a meaningful signal for the detection of Aβ.
Stability of SERS signal
One of the key features of using nanoshells for the SERSsubstrate is that the SERS enhancement is dependent on thesurface plasmons of single nanoshells and not on clusters ofparticles. This feature is advantageous because it allows thesignal to be consistent across the surface and to not depend
0
0.05
0.1
0.15
0.2
0.25
0.3
0.35
0 2 4 6 8 10 12 14 16
Free Protein (nM)
Bo
un
d P
rote
in (
pm
ol)
Aβ
Lysozyme
Aprotinin
Fig. 3 Equilibrium binding isotherm of I-125-labeled Aβ bound tothe sialic acid SAM. In this isotherm, the equilibrium dissociationconstant of Aβ was determined to be 14±8 nM, and the maximumamount of Aβ bound to the surface was 0.7±0.3 pmol/cm2 of area ofthe slide coated with nanoshells. It can be seen that aprotinin (squares)and lysozyme (triangles) do not bind to the substrates
1150120012501300135014001450150015501600
0
1
2
3
4
5
6
7
8
9
10x 10
4
Nanoshells with AB & Congo Red
Smooth Gold with Congo RedSmooth Gold Background
Fig. 4 Congo red spectra from functionalized slides with 10 nM Aβapplied to the surface. The top spectrum was taken from a nanoshellslide, whereas the bottom spectra are from a smooth gold surface withand without Congo red
60 Plasmonics (2007) 2:55–64
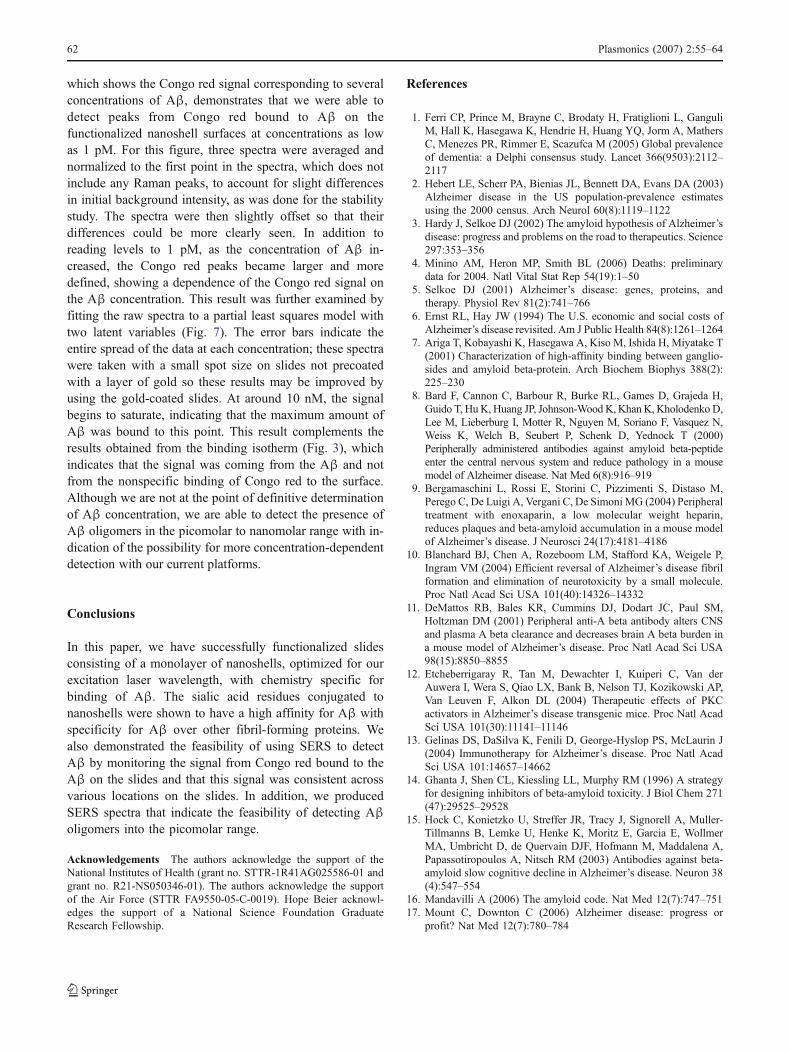
on local “hot spots,” which make quantification difficult.Figure 5 (inset) shows the raw Congo red spectra taken forthree consecutive scans from three random locations on ananoshell slide with 10 nM Aβ bound to the surface. Thereare minor differences in these spectra; however, whencorrected for differences in baseline intensity by dividingby the first intensity (which does not contain any Ramanpeaks), the spectra are very similar (Fig. 5 main). Theintensities of the five major Congo red peaks weredetermined for each of the scans as shown in the table,with the largest percent deviation between the largest andsmallest values for each peak found to be a maximum of3.3%. This result indicates that the enhancement isconsistent across the nanoshell surface, which allows forthe potential for quantitative measures to relate SERSintensity with analyte concentration. It should be noted thatthe signal is more stable for nanoshell substrates with a thinlayer of gold prior to nanoshell deposition. The gold layergreatly increases the Raman signal, most likely due to itsreflective nature and possible coupling of the plasmonresonance of the nanoshells into the plasmon resonance ofthe gold surface, which allows for the use of the lower-magnification objective (10× instead of 20×) to obtain clearRaman spectra. The increased stability for a larger spot sizeindicates that part of the stability comes from the ability totake an average signal from a large number of nanoshells.As the manufacturing of the nanoshell substrates and thedeposition of the chemistry and analytes on them continueto improve, the signals should remain or become morestable across the platform surface.
Aβ concentration using SERS
To analyze the ability of the SERS signal obtained fromfunctionalized nanoshell slides to be used as a measure ofAβ, we looked at the signals obtained from several de-creasing concentrations. We first applied Aβ to the slides,allowed it to bind, and rinsed off any excess. We thenallowed a constant amount of Congo red to bind to the Aβbefore any excess of that too was rinsed off. Figure 6,
Fig. 5 Congo red spectra showing the reproducibility of the SERSenhancement between random locations on the nanoshell slides. Theinset spectra are the raw spectra that show slight differences inbackground intensity. When the difference in background intensity iscorrected for, the spectra show at most a 3.3% deviation in peak height
120013001400150016000.8
0.9
1
1.1
1.2
1.3
1.4
1.5
1.6
Wavenumber [cm-1
Nor
mal
ized
Inte
nsity
01 pM100 pM10 nM
Concentration
]
Fig. 6 Congo red spectra showing the spectra dependence onconcentration of Aβ applied to the nanoshells. Concentrations aslow as 1 pM Aβ plus Congo red show some spectral features. Greaterpeak intensity and refinement are observed as Aβ concentrationincreases. The spectra were slightly offset to more clearly show theirdifferences
-12 -11 -10 -9 -8 -7
-12
-11
-10
-9
-8
-7
log of Actual Concentration [M]
log
of P
redi
cted
Con
cent
ratio
n [M
]
PLS Results for Averaged Spectra
Fig. 7 Partial least squares results using two latent variables (x,calibration data; o, validation data) for Aβ in the picomolar tonanomolar range showing the signal dependence on the Aβconcentration. At around 10 nM, the signal levels off, indicatingsaturation of the nanoshell substrates. The error bars indicate theentire spread of the data at each concentration
Plasmonics (2007) 2:55–64 61
which shows the Congo red signal corresponding to severalconcentrations of Aβ, demonstrates that we were able todetect peaks from Congo red bound to Aβ on thefunctionalized nanoshell surfaces at concentrations as lowas 1 pM. For this figure, three spectra were averaged andnormalized to the first point in the spectra, which does notinclude any Raman peaks, to account for slight differencesin initial background intensity, as was done for the stabilitystudy. The spectra were then slightly offset so that theirdifferences could be more clearly seen. In addition toreading levels to 1 pM, as the concentration of Aβ in-creased, the Congo red peaks became larger and moredefined, showing a dependence of the Congo red signal onthe Aβ concentration. This result was further examined byfitting the raw spectra to a partial least squares model withtwo latent variables (Fig. 7). The error bars indicate theentire spread of the data at each concentration; these spectrawere taken with a small spot size on slides not precoatedwith a layer of gold so these results may be improved byusing the gold-coated slides. At around 10 nM, the signalbegins to saturate, indicating that the maximum amount ofAβ was bound to this point. This result complements theresults obtained from the binding isotherm (Fig. 3), whichindicates that the signal was coming from the Aβ and notfrom the nonspecific binding of Congo red to the surface.Although we are not at the point of definitive determinationof Aβ concentration, we are able to detect the presence ofAβ oligomers in the picomolar to nanomolar range with in-dication of the possibility for more concentration-dependentdetection with our current platforms.
Conclusions
In this paper, we have successfully functionalized slidesconsisting of a monolayer of nanoshells, optimized for ourexcitation laser wavelength, with chemistry specific forbinding of Aβ. The sialic acid residues conjugated tonanoshells were shown to have a high affinity for Aβ withspecificity for Aβ over other fibril-forming proteins. Wealso demonstrated the feasibility of using SERS to detectAβ by monitoring the signal from Congo red bound to theAβ on the slides and that this signal was consistent acrossvarious locations on the slides. In addition, we producedSERS spectra that indicate the feasibility of detecting Aβoligomers into the picomolar range.
Acknowledgements The authors acknowledge the support of theNational Institutes of Health (grant no. STTR-1R41AG025586-01 andgrant no. R21-NS050346-01). The authors acknowledge the supportof the Air Force (STTR FA9550-05-C-0019). Hope Beier acknowl-edges the support of a National Science Foundation GraduateResearch Fellowship.
References
1. Ferri CP, Prince M, Brayne C, Brodaty H, Fratiglioni L, GanguliM, Hall K, Hasegawa K, Hendrie H, Huang YQ, Jorm A, MathersC, Menezes PR, Rimmer E, Scazufca M (2005) Global prevalenceof dementia: a Delphi consensus study. Lancet 366(9503):2112–2117
2. Hebert LE, Scherr PA, Bienias JL, Bennett DA, Evans DA (2003)Alzheimer disease in the US population-prevalence estimatesusing the 2000 census. Arch Neurol 60(8):1119–1122
3. Hardy J, Selkoe DJ (2002) The amyloid hypothesis of Alzheimer’sdisease: progress and problems on the road to therapeutics. Science297:353–356
4. Minino AM, Heron MP, Smith BL (2006) Deaths: preliminarydata for 2004. Natl Vital Stat Rep 54(19):1–50
5. Selkoe DJ (2001) Alzheimer’s disease: genes, proteins, andtherapy. Physiol Rev 81(2):741–766
6. Ernst RL, Hay JW (1994) The U.S. economic and social costs ofAlzheimer’s disease revisited. Am J Public Health 84(8):1261–1264
7. Ariga T, Kobayashi K, Hasegawa A, Kiso M, Ishida H, Miyatake T(2001) Characterization of high-affinity binding between ganglio-sides and amyloid beta-protein. Arch Biochem Biophys 388(2):225–230
8. Bard F, Cannon C, Barbour R, Burke RL, Games D, Grajeda H,Guido T, HuK, Huang JP, Johnson-WoodK, Khan K, Kholodenko D,Lee M, Lieberburg I, Motter R, Nguyen M, Soriano F, Vasquez N,Weiss K, Welch B, Seubert P, Schenk D, Yednock T (2000)Peripherally administered antibodies against amyloid beta-peptideenter the central nervous system and reduce pathology in a mousemodel of Alzheimer disease. Nat Med 6(8):916–919
9. Bergamaschini L, Rossi E, Storini C, Pizzimenti S, Distaso M,Perego C, De Luigi A, Vergani C, De Simoni MG (2004) Peripheraltreatment with enoxaparin, a low molecular weight heparin,reduces plaques and beta-amyloid accumulation in a mouse modelof Alzheimer’s disease. J Neurosci 24(17):4181–4186
10. Blanchard BJ, Chen A, Rozeboom LM, Stafford KA, Weigele P,Ingram VM (2004) Efficient reversal of Alzheimer’s disease fibrilformation and elimination of neurotoxicity by a small molecule.Proc Natl Acad Sci USA 101(40):14326–14332
11. DeMattos RB, Bales KR, Cummins DJ, Dodart JC, Paul SM,Holtzman DM (2001) Peripheral anti-A beta antibody alters CNSand plasma A beta clearance and decreases brain A beta burden ina mouse model of Alzheimer’s disease. Proc Natl Acad Sci USA98(15):8850–8855
12. Etcheberrigaray R, Tan M, Dewachter I, Kuiperi C, Van derAuwera I, Wera S, Qiao LX, Bank B, Nelson TJ, Kozikowski AP,Van Leuven F, Alkon DL (2004) Therapeutic effects of PKCactivators in Alzheimer’s disease transgenic mice. Proc Natl AcadSci USA 101(30):11141–11146
13. Gelinas DS, DaSilva K, Fenili D, George-Hyslop PS, McLaurin J(2004) Immunotherapy for Alzheimer’s disease. Proc Natl AcadSci USA 101:14657–14662
14. Ghanta J, Shen CL, Kiessling LL, Murphy RM (1996) A strategyfor designing inhibitors of beta-amyloid toxicity. J Biol Chem 271(47):29525–29528
15. Hock C, Konietzko U, Streffer JR, Tracy J, Signorell A, Muller-Tillmanns B, Lemke U, Henke K, Moritz E, Garcia E, WollmerMA, Umbricht D, de Quervain DJF, Hofmann M, Maddalena A,Papassotiropoulos A, Nitsch RM (2003) Antibodies against beta-amyloid slow cognitive decline in Alzheimer’s disease. Neuron 38(4):547–554
16. Mandavilli A (2006) The amyloid code. Nat Med 12(7):747–75117. Mount C, Downton C (2006) Alzheimer disease: progress or
profit? Nat Med 12(7):780–784
62 Plasmonics (2007) 2:55–64
18. Patel D, Henry J, Good T (2006) Attenuation of beta-amyloidinduced toxicity by sialic acid-conjugated dendrimeric polymers.Biochim Biophys Acta 1760(12):1802–1809
19. Brookmeyer R, Gray S, Kawas C (1998) Projections of Alz-heimer’s disease in the United States and the public health impact ofdelaying disease onset. Am J Public Health 88(9):1337–1342
20. Davis PC, Gray L, Albert M, Wilkinson W, Hughes J, Heyman A,Gado M, Kumar AJ, Destian S, Lee C, Duvall E, Kido D, NelsonMJ, Bello J, Weathers S, Jolesz F, Kikinis R, Brooks M (1992)The consortium to establish a registry for Alzheimers-disease(Cerad) .3. Reliability of a standardized Mri evaluation ofAlzheimers-disease. Neurology 42(9):1676–1680
21. Duara R, Grady C, Haxby J, Sundaram M, Cutler NR, Heston L,Moore A, Schlageter N, Larson S, Rapoport SI (1986) Positronemission tomography in Alzheimers-disease. Neurology 36(7):879–887
22. Haxby JV, Grady CL, Duara R, Schlageter N, Berg G, RapoportSI (1986) Neocortical metabolic abnormalities precede non-memory cognitive defects in early Alzheimers-type dementia.Arch Neurol 43(9):882–885
23. Blennow K (2004) CSF biomarkers for mild cognitive impair-ment. J Intern Med 256:224–234
24. Mattson MP, Mark RJ, Furukawa K, Bruce AJ (1997) Disruptionof brain cell ion homeostasis in Alzheimer’s disease by oxyradicals, and signaling pathways that protect therefrom. Chem ResToxicol 10(5):507–517
25. Rapport M, Dawson HN, Binder LI, Vitek MP, Ferreira A (2002)Tau is essential to β-amyloid-induced neurotoxicity. Proc NatlAcad Sci USA 99:6364–6369
26. Small GW (2002) Brain-imaging surrogate markers for detection andprevention of age-relatedmemory loss. JMol Neurosci 19(1–2):17–21
27. Varadarajan S, Yatin S, Aksenova M, Butterfield DA (2000)Review: Alzheimer’s amyloid β-peptide-associated free radicaloxidative stress and neurotoxicity. J Struct Biol 130:184–208
28. Walsh DM, Klyubin I, Fadeeva JV, Rowan MJ, Selkoe DJ (2002)Amyloid-beta oligomers: their production, toxicity and therapeuticinhibition. Biochem Soc Trans 30:552–557
29. Wang SSS, Rymer DL, Good TA (2001) Reduction in cholesteroland sialic acid content protects cells from the toxic effects of beta-amyloid peptides. J Biol Chem 276(45):42027–42034
30. Zetterberg H, Wahnlund L-O, Blennow K (2003) Cerebrospinalfluid markers for prediction of Alzheimer’s disease. Neurosci Lett352:67–69
31. Cleary JP, Walsh DM, Hofmeister JJ, Shankar GM, KuskowskiMA, Selkoe DJ, Ashe KH (2005) Natural oligomers of theamyloid-protein specifically disrupt cognitive function. NatNeurosci 8(1):79–84
32. Gong Y, Chang L, Viola KL, Lacor PN, Lambert MP, Finch CE,Krafft GA, Klein WL (2003) Alzheimer’s disease-affected brain:presence of oligomeric Aβ ligands (ADDLs) suggests a molecularbasis for reversible memory loss. Proc Natl Acad Sci USA 100(18):10417–10422
33. Hardy J, Selkoe DJ (2002) Medicine—the amyloid hypothesis ofAlzheimer’s disease: progress and problems on the road totherapeutics. Science 297(5580):353–356
34. Lee S, Fernandez EJ, Good TA (2007) Role of aggregationconditions in structure, stability, and toxicity of intermediates inthe Aβ fibril formation pathway. Protein Sci 16(4):723–732
35. Lorenzo A, Yankner BA (1994) Beta-amyloid neurotoxicityrequires fibril formation and is inhibited by Congo red. Proc NatlAcad Sci USA 91(25):12243–12247
36. Selkoe DJ, Schenk D (2003) Alzheimer’s disease: molecularunderstanding predicts amyloid-based therapeutics. Annu RevPharmacol Toxicol 43:545–584
37. Haes AJ, Chang L, Klein WL, Van Duyne RP (2005) Detection ofa biomarker for Alzheimer’s disease from synthetic and clinicalsamples using a nanoscale optical biosensor. J Am Chem Soc 127(7):2264–2271
38. Haes AJ, Hall WP, Chang L, Klein WL, Van Duyne RP (2004) Alocalized surface plasmon resonance biosensor: first steps towardan assay for Alzheimer’s disease. Nano Lett 4(6):1029–1034
39. Georganopoulou DG, Chang L, Nam JM, Thaxton CS, MufsonEJ, Klein WL, Mirkin CA (2005) Nanoparticle-based detection incerebral spinal fluid of a soluble pathogenic biomarker forAlzheimer’s disease. Proc Natl Acad Sci USA 102(7):2273–2276
40. Kneipp K, Wang Y, Kneipp H, Perelman LT, Itzkan I, Dasari R,Feld MS (1997) Single molecule detection using surface-enhancedRaman scattering (SERS). Phys Rev Lett 78(9):1667–1670
41. Kneipp K, Wang Y, Kneipp H, Itzkan I, Dasari RR, Feld MS(1996) Population pumping of excited vibrational states byspontaneous surface-enhanced Raman scattering. Phys Rev Lett76(14):2444–2447
42. Nie SM, Emery SR (1997) Probing single molecules and singlenanoparticles by surface-enhanced Raman scattering. Science 275(5303):1102–1106
43. Fleischmann M, Hendra PJ, McQuillan AJ (1973) Raman-spectrafrom electrode surfaces. J Chem Soc Chem Commun (3):80–81
44. Jeanmaire DL, Vanduyne RP (1977) Surface raman spectroelec-trochemistry. 1. Heterocyclic, aromatic, and aliphatic-aminesadsorbed on anodized silver electrode. J Electroanal Chem 84(1):1–20
45. Baker GA, Moore DS (2005) Progress in plasmonic engineeringof surface-enhanced Raman-scattering substrates toward ultra-trace analysis. Anal Bioanal Chem 382(8):1751–1770
46. Kneipp K, Kneipp H, Itzkan I, Dasari RR, Feld MS (2002)Surface-enhanced Raman scattering and biophysics. J PhysCondens Matter 14(18):R597–R624
47. Oldenburg SJ, Jackson JB, Westcott SL, Halas NJ (1999) Infraredextinction properties of gold nanoshells. Appl Phys Lett 75(19):2897–2899
48. Jackson JB, Halas NJ (2003) Controlling the surface enhancedRaman effect on nanoshells in a film geometry. Abstr Pap AmChem Soc 225:U447
49. Jackson JB, Halas NJ (2004) Surface-enhanced Raman scatteringon tunable plasmonic nanoparticle substrates. Proc Natl Acad SciUSA 101(52):17930–17935
50. Oldenburg SJ, Westcott SL, Averitt RD, Halas NJ (1999) Surfaceenhanced Raman scattering in the near infrared using metalnanoshell substrates. J Chem Phys 111(10):4729–4735
51. Zhu ZH, Zhu T, Liu ZF (2004) Raman scattering enhancementcontributed from individual gold nanoparticles and interparticlecoupling. Nanotechnology 15(3):357–364
52. Li KR, Stockman MI, Bergman DJ (2003) Self-similar chain ofmetal nanospheres as an efficient nanolens. Phys Rev Lett 91(22)
53. ChooSmith LP, GarzonRodriguez W, Glabe CG, Surewicz WK(1997) Acceleration of amyloid fibril formation by specificbinding of A beta-(1–40) peptide to ganglioside-containingmembrane vesicles. J Biol Chem 272(37):22987–22990
54. Kakio A, Nishimoto S, Yanagisawa K, Kozutsumi Y, Matsuzaki K(2001) Cholesterol-dependent formation of GM1 ganglioside-bound amyloid beta-protein, an endogenous seed for Alzheimeramyloid. J Biol Chem 276(27):24985–24990
55. Kakio A, Yano Y, Takai D, Kuroda Y, Matsumoto O, KozutsumiY, Matsuzaki K (2004) Interaction between amyloid beta-proteinaggregates and membranes. J Pept Sci 10(10):612–621
56. Matsuzaki K, Horikiri C (1999) Interactions of amyloid beta-peptide (1–40) with ganglioside-containing membranes. Biochem-istry 38(13):4137–4142
Plasmonics (2007) 2:55–64 63

57. Wakabayashi M, Okada T, Kozutsumi Y,Matsuzaki K (2005) GM1ganglioside-mediated accumulation of amyloid beta-protein on cellmembranes. Biochem Biophys Res Commun 328(4):1019–1023
58. Williamson MP, Suzuki Y, Bourne NT, Asakura T (2006) Bindingof amyloid beta-peptide to ganglioside micelles is dependent onhistidine-13. Biochem J 397:483–490
59. Iconomidou VA, Chryssikos GD, Gionis V, Hoenger A, Hamodrakas
SJ (2003) FT-Raman spectroscopy as diagnostic tool of Congo redbinding to amyloids. Biopolymers 72(3):185–192
60. Miura T, Yamamiya C, Sasaki M, Suzuki K, Takeuchi H (2002) Bind-ingmode of Congo red to Alzheimer’s amyloid beta-peptide studied byUV Raman spectroscopy. J Raman Spectrosc 33(7):530–535
61. Khurana R, Uversky VN, Nielsen L, Fink AL (2001) Is Congo redan amyloid-specific dye? J Biol Chem 276(25):22715–22721
64 Plasmonics (2007) 2:55–64
Copyright © 2022 FDOKUMEN