Extreme rainfall events in southern sweden: where does the moisture come from?
12
Tellus (2010), 62A, 605–616 C 2010 The Authors Tellus A C 2010 International Meteorological Institute in Stockholm Printed in Singapore. All rights reserved TELLUS Extreme rainfall events in southern Sweden: where does the moisture come from? By MALIN GUSTAFSSON ∗ ,DAVID RAYNER andDELIANG CHEN, Department of Earth Sciences, University of Gothenburg, PO Box 460, 405 30 Gothenburg, Sweden (Manuscript received 23 September 2009; in final form 11 March 2010) ABSTRACT The atmospheric transport of moisture leading to extreme summer precipitation events in southern Sweden was investigated using a Lagrangian trajectory model. Surprisingly, we found that the trajectories crossed continental Europe and the Baltic Sea before arriving over Sweden; they did not arrive directly from the North Sea. Such transport pathways were not seen for a control sample of non-extreme rainfall events. We then used a new source region identification technique to investigate the hypothesis that Europe and the Baltic are important sources of the moisture that is rained out in the extreme events. Although the results varied between events, we found that this is indeed the case. Our results establish the atmospheric transport patterns that are apparently a pre-requisite for extreme rainfall events to occur in southern Sweden, and further suggest regional moisture availability may also play a key role. 1. Introduction 1.1. Extreme precipitation events in Sweden Flooding caused by widespread, heavy rainfall can result in lost lives, damage to property and infrastructure and cause severe socio-economic disruption. For an extreme precipitation event to occur, a number of factors must occur in combination. Unless there is sufficient moisture available for convective thunderstorm activity to develop due to solar heating, sufficient quantities of moisture must be advected into the region before an uplift mechanism initiates precipitation. Moisture advection in turn requires that a suitable region of evaporation (a source region) exist, from which moisture can be transported. If any of these components is absent—no source region, wrong transport path or no uplift—then extreme precipitation cannot occur. Serious floods do occur in Sweden. After a dry period in the 1970s, Sweden has been subjected to a series of floods in the last 15 years (Lindstr¨ om and Bergstr¨ om, 2004) with floods in 1993, 1995, 1998 and two events in 2000. An emerging concern in Sweden is that extensive regulation of rivers for hydro-power has caused society to be over-confident with respect to flood risk, as demonstrated by development on land that previously was regularly flooded (R¨ addningsverket, 2000). After the rainfall in 2000, the water level in the large Lake V¨ anern reached the highest level since it was regulated in 1938 (Lindstr¨ om and ∗ Corresponding author. e-mail: [email protected] DOI: 10.1111/j.1600-0870.2010.00456.x Bergstr¨ om, 2004), and it was subsequently decided to lower the Lake’s water level. Increases in the frequency or severity of extreme rainfall under climate change conditions would require significant adaptation measures in Sweden. It is difficult to make concrete statements about whether this is likely to happen, however, because the critical factors that lead to extreme events in Sweden are not known. Climatological studies show that frontal activity is im- portant for extreme precipitation under non-cyclonic conditions (Hellstr¨ om and Malmgren, 2004), but extreme precipitation in Sweden occurs predominantly under cyclonic atmospheric cir- culation types (Hellstr¨ om, 2005). The discriminatory power of the latter observation is limited, however, because the cyclonic type is the most frequently observed type over southern Sweden (Linderson et al., 2004). Hellstr¨ om (2005) also found that extreme events tended to be favoured by southerly winds, and weaker westerly winds. She hypothesized that weaker westerly winds may promote extreme events by allowing rain-producing systems to persist for longer times, or that the Baltic Sea may be an important source region for the moisture that rains out in the events. However, detailed information about atmospheric moisture transport and source regions is required to investigate such hypotheses, which cannot be provided by climatological studies. The purpose of our paper is to address this deficiency. 1.2. Atmospheric water vapour transport It is important to realize that the transport of water vapour in the atmosphere (Newell et al., 1992), and the source–receptor Tellus 62A (2010), 5 605 PUBLISHED BY THE INTERNATIONAL METEOROLOGICAL INSTITUTE IN STOCKHOLM SERIES A DYNAMIC METEOROLOGY AND OCEANOGRAPHY
Transcript of Extreme rainfall events in southern sweden: where does the moisture come from?

Tellus (2010), 62A, 605–616 C© 2010 The AuthorsTellus A C© 2010 International Meteorological Institute in Stockholm
Printed in Singapore. All rights reserved
T E L L U S
Extreme rainfall events in southern Sweden: wheredoes the moisture come from?
By M A LIN G U STA FSSO N∗, DAV ID R AY N ER and D ELIA N G C H EN , Department of Earth Sciences,University of Gothenburg, PO Box 460, 405 30 Gothenburg, Sweden
(Manuscript received 23 September 2009; in final form 11 March 2010)
A B S T R A C TThe atmospheric transport of moisture leading to extreme summer precipitation events in southern Sweden wasinvestigated using a Lagrangian trajectory model. Surprisingly, we found that the trajectories crossed continentalEurope and the Baltic Sea before arriving over Sweden; they did not arrive directly from the North Sea. Such transportpathways were not seen for a control sample of non-extreme rainfall events. We then used a new source regionidentification technique to investigate the hypothesis that Europe and the Baltic are important sources of the moisturethat is rained out in the extreme events. Although the results varied between events, we found that this is indeed thecase. Our results establish the atmospheric transport patterns that are apparently a pre-requisite for extreme rainfallevents to occur in southern Sweden, and further suggest regional moisture availability may also play a key role.
1. Introduction
1.1. Extreme precipitation events in Sweden
Flooding caused by widespread, heavy rainfall can result in lostlives, damage to property and infrastructure and cause severesocio-economic disruption. For an extreme precipitation eventto occur, a number of factors must occur in combination. Unlessthere is sufficient moisture available for convective thunderstormactivity to develop due to solar heating, sufficient quantitiesof moisture must be advected into the region before an upliftmechanism initiates precipitation. Moisture advection in turnrequires that a suitable region of evaporation (a source region)exist, from which moisture can be transported. If any of thesecomponents is absent—no source region, wrong transport pathor no uplift—then extreme precipitation cannot occur.
Serious floods do occur in Sweden. After a dry period in the1970s, Sweden has been subjected to a series of floods in thelast 15 years (Lindstrom and Bergstrom, 2004) with floods in1993, 1995, 1998 and two events in 2000. An emerging concernin Sweden is that extensive regulation of rivers for hydro-powerhas caused society to be over-confident with respect to flood risk,as demonstrated by development on land that previously wasregularly flooded (Raddningsverket, 2000). After the rainfallin 2000, the water level in the large Lake Vanern reached thehighest level since it was regulated in 1938 (Lindstrom and
∗Corresponding author.e-mail: [email protected]: 10.1111/j.1600-0870.2010.00456.x
Bergstrom, 2004), and it was subsequently decided to lower theLake’s water level.
Increases in the frequency or severity of extreme rainfall underclimate change conditions would require significant adaptationmeasures in Sweden. It is difficult to make concrete statementsabout whether this is likely to happen, however, because thecritical factors that lead to extreme events in Sweden are notknown. Climatological studies show that frontal activity is im-portant for extreme precipitation under non-cyclonic conditions(Hellstrom and Malmgren, 2004), but extreme precipitation inSweden occurs predominantly under cyclonic atmospheric cir-culation types (Hellstrom, 2005). The discriminatory power ofthe latter observation is limited, however, because the cyclonictype is the most frequently observed type over southern Sweden(Linderson et al., 2004).
Hellstrom (2005) also found that extreme events tended to befavoured by southerly winds, and weaker westerly winds. Shehypothesized that weaker westerly winds may promote extremeevents by allowing rain-producing systems to persist for longertimes, or that the Baltic Sea may be an important source regionfor the moisture that rains out in the events. However, detailedinformation about atmospheric moisture transport and sourceregions is required to investigate such hypotheses, which cannotbe provided by climatological studies. The purpose of our paperis to address this deficiency.
1.2. Atmospheric water vapour transport
It is important to realize that the transport of water vapour inthe atmosphere (Newell et al., 1992), and the source–receptor
Tellus 62A (2010), 5 605
P U B L I S H E D B Y T H E I N T E R N A T I O N A L M E T E O R O L O G I C A L I N S T I T U T E I N S T O C K H O L M
SERIES ADYNAMIC METEOROLOGYAND OCEANOGRAPHY

606 M. GUSTAFSSON ET AL.
relationship between regions of evaporation and precipitation, isstill poorly understood. The water vapour lost during a precip-itation event may have evaporated from a water surface, comefrom biomass transpiration or even from evaporation of fallinghydrometeors, and may have a local origin or have been trans-ported thousands of kilometres (Trenberth et al., 2003). Accord-ing to Trenberth (1998), less than a third of the water rained outin extratropical storm systems had been evaporated locally—rather, most of the moisture is transported in to the storm sys-tem from outside sources. Eckhardt et al. (2004) showed thatextratropical cyclones with strongly developed warm conveyorbelts—moist airstreams which rise from the boundary layer tothe upper troposphere ahead of the surface cold front—are re-sponsible for much of the poleward moisture transport by extra-tropical cyclones. Finally, the ratio of moisture originating fromlocal versus distant sources differs considerably between sea-sons (Trenberth, 1999); in winter, local moisture availability islow and hence large-scale transport is most important, whereasthe recycling of precipitation increase in importance in summer.
There are several possible ways to estimate the moisturesource regions that contribute to extreme events, and the trans-port paths involved. For instance, if a sample of the rainwater isavailable the oxygen and hydrogen isotopic ratios could be mea-sured and compared with an estimate for the assumed sourceregion (e.g. Weyhenmeyer et al., 2002). This technique has asignificant drawback as it requires an analysis of a rain sample,hence making it impossible to examine past events for whichno samples are available. Another method is to simulate precip-itation events using a general circulation model (GCM) basedon the Eulerian equation. For example, Keil et al. (1999) anal-ysed the moisture transport during an extreme precipitation eventin the Czech Republic and southern Poland in the summer of1997 by re-running a high-resolution forecast model over a lim-ited area. Bosilovich and Schubert (2002) further developed thismethod by including constituent tracers of local water vapoursources into the simulation.
1.3. Lagrangian trajectory modelling
Trajectory modelling is a Lagrangian alternative to the Euleriantracer approach. The trajectory of a very small parcel of air (orparticle) is calculated by solving Lagragne’s equation, which isthe same as finding the path that minimizes the integral of the La-grangian over time (Stohl, 1998). The trajectory approach reliessolely on analysed wind field data. Lagrangian models providean efficient way to calculate the dispersion of pollutants or tracersfrom—or the advection towards—a single location. For simpleanalyses, Lagrangian models without numerical diffusion can beused. A further practical consideration is that Eularian modelsgenerally require that emission sources be defined at a resolu-tion comparable to the computational grid, whereas Lagrangianmodels can use emissions sources with any resolution (Draxlerand Hess, 1998). For the past few decades, trajectory models
such as The Hybrid Single-Particle Lagrangian Integrated Tra-jectory (HYSPLIT, Draxler and Rolph, 2003) and FLEXTRA(Stohl et al., 1995) have frequently been used to analyse thetransport path of atmospheric constituents such as air pollutants,greenhouse gases or radioactive constituents from the source tothe receptor site (e.g. Stohl et al., 2003; Tang et al., 2009). Themodel is usually run backwards in time to determine the sourceof the species of interest (Stohl et al., 1995).
Trajectory modelling allows air parcels to be tracked back-wards in time from an extreme precipitation event, and so canprovide information about the transport paths involved. Changesin the physical properties of the air parcel can also be calculated;in particular, changes in the moisture content provide an esti-mate of where the source region evaporation occurred. Thistechnique is well established, and can provide detailed infor-mation about the moisture source regions and transport pathsleading to extreme events. For example, James et al. (2004) usedLagrangian trajectory modelling to determine that, for a floodingevent in Germany on the 11–13 August 2002, during the earlystages of the episode the main moisture source region was theMediterranean, whereas towards the end of the event the prin-cipal source of moisture was evaporation from the land surfacein Eastern Europe and the Black Sea. A similar approach wasused by Stohl et al. (2008), who analysed an episode of veryheavy precipitation in western Norway which resulted in loss oflife and severe infrastructural damage. They were able to showthat the episode was triggered by two tropical hurricanes thathad transitioned into extra-tropical cyclones. These generated aso-called atmospheric moisture conveyer belt—a large streamof moist air—which in this case extended over more than 40◦
of latitude and across the North Atlantic. Trajectory modellinghas also been used to trace the path of moisture from the tropo-sphere to the stratosphere (Jackson et al., 1998), and to simulateAntarctic snow pit records (Helsen et al., 2006).
There are several other case studies that identify moisturesource regions associated with severe precipitation events (e.g.Massacand et al., 1998; Reale et al., 2001). Single-case studiessuch as these may give an insight into specific events, but the lackof replication makes it difficult to make any general conclusions.To do this, one must analyse a larger number of extreme eventsin one region, and try to identify any patterns.
In this study, we have analysed 21 extreme precipitation eventsfrom southern Sweden using trajectory modelling. An ensem-ble of trajectory paths was calculated for each event. We ini-tially examined the trajectories quantitatively, and found thatmany air parcels associated with precipitation were transportedacross Europe and the Baltic Sea. This pattern was not seen inthe trajectories that contributed to rainfall in a control-group ofnon-extreme events. We then hypothesized that the reason suchtrajectory paths are associated with extreme events is that localmoisture uptake in these regions plays an important role. To testthis hypothesis, we devised a novel source region identificationsystem based on changes in specific humidity along trajectories.
Tellus 62A (2010), 5

RAINFALL EVENTS IN SOUTHERN SWEDEN 607
This enabled us to define the geographic extent of the sourceregion for each extreme event using the ensemble of trajectorypaths, and to determine the relative importance of long and shortdistance moisture transport.
2. Precipitation data and the HYSPLITtrajectory model
Precipitation occurs throughout the year in Sweden, mainly asa result of the characteristic atmospheric westerly flow and theclose proximity to the Atlantic Ocean. However, the summer sea-son usually experiences more intense precipitation that any otherseason—approximately 85% of the heavy precipitation eventsoccur during this period (Alexandersson and Vedin, 2005)—sowe restricted our study to June to August.
The region of interest (hereafter referred to as the “targetregion”) was centred on 15◦ longitude and 57.5◦ latitude, witha size of 3.75◦ longitude and 2.5◦ latitude (Fig. 1). This regionwas selected due to its relatively uniform precipitation patternsand topography, making it likely that the moisture precipitatedhere originates from similar sources. The west coast of Swedenwas excluded as it has a quite different precipitation pattern
Fig. 1. Map of the study area. The target region in southern Sweden ismarked with a square. The raster shows average summer(June–July–August) precipitation, 1961–1990, from the E-OBS dataset (Haylock et al., 2008).
(Alexandersson, 2006). The target region consists mostly of hilland lowland terrain, with a maximum elevation of 377 m abovesea level.
2.1. Extreme precipitation events
Rainfall intensity in Sweden is lower than in many parts of theworld, with annual-average 1-day maximum precipitation gen-erally between 25 and 40 mm (Achberger and Chen, 2006). TheSwedish Meteorological and Hydrological Institutes (SMHI) de-fine an extreme precipitation event to be 40 mm of rain in the24 hr, because above this limit there is an increasing risk offlooding of rivers and landslides (Alexandersson, 2006). In ourstudy, we used daily (24 hr totals recorded at 0700 local time)observed data from SMHI stations to identify the extreme events.For a day to be classified as an extreme precipitation event, werequired that at least five SMHI stations recorded extreme pre-cipitation within the target region. The latter criterion selectsagainst localized extreme events that result from convective ac-tivity. Our criteria yielded 21 extreme precipitation events inthe target region in the period 1961–2004, which are listed inTable 1. The spatial distribution of the extreme events is shownin Appendix S1 in Supporting Information.
2.1.1. Non-extreme precipitation events. During the courseof this study it became clear that we required not only a sample ofextreme precipitation events, but also a sample of non-extremeprecipitation events to use as a control-group with which theextreme events could be compared. Although there are clearly avery large number of days with non-extreme rainfall, many havevery different atmospheric conditions to days where extremerainfall occurs, and so any comparison might be meaningless.What we needed was a sample of days where conditions weresimilar to those typical of extreme precipitation events, but noextreme precipitation occurred.
As noted in Introduction, Hellstrom (2005) found that ex-treme precipitation in Sweden occurs predominantly under cy-clonic atmospheric circulation types. Thus, we used the Lambatmospheric classification system (Lamb 1950; Chen 2000) toderive a control sample. The Lamb system classifies days into27 classes using geostrophic wind and vorticity derived fromMSLP surfaces (see Chen 2000 for details). We calculated Lambclasses for southern Sweden for all days 1961 to 2004 usingthe NCEP/NCAR reanalysis data set (Kalnay et al., 1996). Wegrouped the classes into three main categories: cyclonic (“C”),anticyclonic (“A”), and directional (“D”). The classes for theday of each extreme event, and the 2 days preceding, are shownin Table 1.
Twelve of the extreme events occurred on a day with a cy-clonic weather class over the target region, and six of theseevents had persistent cyclonic circulation in the days leadingup to the event. Further, the three events with the highest num-ber of stations recording extreme rainfall are among the sixwith persistent cyclonic weather type (Table 1). Thus, it appears
Tellus 62A (2010), 5

608 M. GUSTAFSSON ET AL.
Table 1. Extreme precipitation events
Event date Lamb weather class No. stations
Day of the event 1 day prior 2 days prior
1 August 1961 C A A 514 August 1969 D (E) D (SE) A 718 August 1970 D (SE) D (SE) A (AS) 57 August 1971 D (W) D (SW) D (SW) 713 July 1972 D (N) D (N) D (NW) 1526 July 1972 C C C 63 August 1977 D (SE) A A 726 August 1979 C C (E) D (SW) 1016 July 1980 C C C 1023 June 1984 C D (W) D (SW) 824 July 1986 C C D (SW) 916 June 1987 C C C (SE) 2323 August 1987 C D (W) D (SW) 514 July 1988 D (SE) A A (SW) 619 July 1988 C C C 1928 June 1991 C C C 611 July 1993 D (S) D (S) D (SW) 1818 August 1994 D (SE) A (S) A 715 July 1995 D (SE) D (SE) C 69 July 1996 C (NE) C C 2414 July 1999 C D (S) A 5
Columns 2–4 show the Lamb classes (Lamb 1950; Chen 2000) for southernSweden for the day of the extreme event and the 2 previous days. The main Lambclasses used are C, cyclonic; A, anticyclonic; D, directional flow, with thewind-direction show in parentheses for directional and hybrid classes. The finalcolumn indicates how many stations inside the target region recorded extremeprecipitation (40 mm 24 hr−1 or more) during the day of the event. Events withcyclonic weather class on the day of the even and 2 days prior are shown in bold.
persistent cyclonic circulation represents favourable condi-tions for extreme rainfall in southern Sweden in summer(June–August).
A sample of 10 non-extreme summer precipitation eventswas then selected as a control for the extreme events. The non-extreme events had a minimum of three consecutive days ofcyclonic-type weather over the target region leading up to theevent, but no precipitation measurement for the whole periodcould be above 40 mm 24 hr−1, and for the day of the non-extreme rainfall event all values were less than 15 mm 24 hr−1.In addition, an extreme precipitation event could not occur in thethree days that followed the non-extreme event. Ten events thatfulfilled these criteria were randomly selected from the period1961 to 2004, and are listed in Table 2.
2.2. Trajectory Model—HYSPLIT
The Hybrid Single-Particle Lagrangian Integrated Trajectory(HYSPLIT) 4.0 model (Draxler, 2003) was used to produceback-trajectories. HYSPLIT was run with meteorological anal-ysed fields from the ERA40 project from the European Cen-
tre for Medium-Range Weather Forecasts (ECMWF). The me-teorological fields that we used had been interpolated fromERA40’s native resolution onto a 0.5◦ horizontal resolutiongrid with 23 vertical pressure levels extending between 1 and1000 hPa.
Backwards trajectory modelling is very sensitive to initialconditions, and particles “released” at slightly different times orlocations may result in very different trajectories. This can betrue even if the locations of the different release points corre-spond to the same grid cell/level in the gridded meteorologicalwind fields. Thus, trajectory analysis typically involves an en-semble of particles released at different locations, and HYSPLITcan calculate multiple back-trajectories simultaneously. We useda release grid with 10 × 12 horizontal coordinates on 30 verticallevels (giving a total of 3600 release points) to get a good rep-resentation of the transport pathways into the target region. Thevertical levels were distributed according to atmospheric pres-sure, with the first level at 10 m above ground level (agl) and thetop at 10 420 m agl. From each of the points in the release grida trajectory was started and run backwards in time for 192 hr(8 days). The 8-day integration time was chosen because James
Tellus 62A (2010), 5

RAINFALL EVENTS IN SOUTHERN SWEDEN 609
Table 2. Non-extreme precipitation events
Event date Lamb weather class
Day of the event 1 day prior 2 days prior
28 June 2000 C C C26 June 1997 C C C17 June 1993 C C (W) C (NW)19 July 1991 C C (W) C12 June 1990 C (NE) C C8 June 1989 C C C25 August 1986 C C C19 July 1981 C C C12 August 1979 C C C
Columns 2–4 show the Lamb classes for southern Sweden for theday of the extreme event and the 2 previous days, as per Table 1.No precipitation measurement was above 40 mm 24 hr−1 for thewhole 3-day period, and for the day of the non-extreme rainfallevent all values were less than 15 mm 24 hr−1.
et al. (2004) concluded that an 8-day time domain was sufficientto determine the source of moisture contributing to precipitationin Europe. In addition, because the integration period of the ob-servational data was 24 hr, a new set of trajectories were startedevery third hour, so generating eight sets of trajectories for eachrelease point for each event. The trajectory calculations wererestricted to the Northern Hemisphere.
Changes in specific humidity, expressed as grams of watervapour per kilogram of air (including water vapour), were takento indicate precipitation and evaporation from the air parcel as itmoves along its trajectory. Specific humidity is independent oftemperature and pressure, and hence it does not change if an airparcel rises to a lower pressure level without losing or gainingwater vapour.
3. Experiment 1: qualitative trajectory analysis
3.1. Trajectory paths and vertical profiles
Our first analysis was to qualitatively examine the trajectoryensembles, to identify any similarities in the transport path-ways. The very large number of trajectory paths calculatedfor each event precludes displaying all paths. Instead, the 100trajectories which lost the largest amount of specific humid-ity within the target region were selected to represent the tra-jectories that were likely to have contributed to significantrain inside the target region. These are referred to as ‘raintrajectories’.
The rain trajectories for the extreme event on 11 July 1996are shown, as an example, in Fig. 2. The rain trajectories for anon-extreme event 19 July 1991 are shown in Fig. 3. The pathsand vertical profiles for the rain trajectories for all the events areshown Appendix S2 in Supporting Information.
9 July 1996
180 160 140 120 100 80 60 40 20 00
500010000
Alt
itud
e (m
)
Travel Time (h)
2 4 6 8 10 12 14
Fig. 2. Rain trajectories (the sub-set of 100trajectories with the highest loss of specifichumidity inside the target region) for theextreme precipitation event on the 9 July1996. Colour indicates the specific humidityin g kg−1. The upper panel shows thehorizontal location of the trajectories and thelower the altitude of the trajectories as afunction of time. The time axis shows thetrajectory travel time in real-world-time:although the trajectory is calculated withtime running backwards (right-to-left), inreal-world-time the air parcel begins at –180hr and arrives at the target at 0 hr. The targetregion is marked with a blue square.
Tellus 62A (2010), 5

610 M. GUSTAFSSON ET AL.
19 July 1991
180 160 140 120 100 80 60 40 20 00
20004000
Alt
itud
e (m
)
Travel Time (h)
2 3 4 5 6 7 8 9 10 11
Fig. 3. Rain trajectories (the subset of 100trajectories with the highest loss of specifichumidity inside the target region) for thenon-extreme rain event 19 July 1991. SeeFig. 2 for further details.
3.2. Discussion
The general vertical profile of the rain trajectories for extremeevents is that they come close to the ground, usually within thelast 3 days, and then ascend rapidly, losing specific humidityjust before arriving at their individual end points. Referring tothe example event in Fig. 2, a large portion of the rain trajec-tories start out 8 days prior to the event at a range of altitudesbetween 0 and 7000 m, and as time moves forward many raintrajectories increase in altitude and lose specific humidity. Butapproximately 3 days before the event the rain trajectories start tolose altitude and increase specific humidity as they come closerto the surface. One day prior to the event, the rain trajectoriesbegin to ascend again and specific humidity decreases. This up-lift associated with the target region rainfall is clearly displayedby nearly all the rain trajectories. The rain trajectories typicallyhave an end point with an altitude above 1000 m and up to10 000 m.
The vertical profiles of the rain trajectories for the non-extreme events show these trajectories are often confined tolower altitudes, and have lower end points, than for the extremeevents. This is clear from Fig. 3. Some of the rain trajectories fornon-extreme events also descend from the upper Troposphere inthe week prior to the event.
A detailed investigation of the physical mechanisms thatcause particular trajectory pathways to be followed for particular
events is beyond the scope of this paper. Many of extreme pre-cipitation events, and all the non-extreme events, are associatedwith cyclonic weather classes, so it is likely that in many casesthe final ascent of the rain trajectories represents the Warm Con-veyer Belt component of an extratopical cyclone. Given this, itis tempting to associate the descending path followed by manyof the trajectories with the Dry Intrusion component, which de-scends behind the cold front (Browning, 1997). However, wecaution against over-interpreting the descending part of the tra-jectory path, because in many cases the rain trajectories ascendfrom with the atmospheric boundary layer; we do not realisti-cally expect that HYSPLIT can accurately trace the path of airparcels through the boundary layer. The trajectory paths may bebest viewed as reflecting the large-scale synoptic patterns, ratherthan the actual paths of “rain-producing” trajectories.
The horizontal profiles of the rain trajectories for the extremeevents are more varied, and in many cases more than one domi-nant transport pathway can be identified. The most striking ob-servation is that, despite the westerly flow that characterizes theregion, none of the events are dominated by rain trajectories thatcome directly in from the North Atlantic and across the NorthSea. For 13 of the 21 events, rain trajectories do originate in theNorth Atlantic or the North Sea, but then follow anti-clockwisepathways in over the British Isles or North Sea, then pass overthe northern European continental margin before crossing theBaltic Sea to arrive at the target area from the south or the east.
Tellus 62A (2010), 5

RAINFALL EVENTS IN SOUTHERN SWEDEN 611
This profile is shown in Fig. 2. A second major category ofevents have rain trajectories which begin the 8-day trajectorycalculation in Eastern Europe, for example 14 August 1969 and18 August 1970 and 3 August 1977. A further grouping of tra-jectories, shown in events 26 July 1972, 15 July 1995 and 14July 1999 cross the Swedish-Norwegian mountains and followan anti-clockwise path over the continent before again crossingthe Baltic to the target region. Of course, in addition to thesegeneral patterns, there are air parcels that have been transportedfrom regions as far away as the west coast of United States dur-ing the 8-day period, and others have only been transported fromcentral Europe.
The rain trajectories for the non-extreme events show sys-tematically different horizontal transport patterns to the extremeprecipitation events. The trajectories approach the target regionfrom the west, north-west or even the north: they do not crosscontinental Europe or the main basins of the Baltic Sea. Thus,even though our control sample of non-extreme precipitationevents was small, the transport patterns were clearly distinctfrom those shown by the extreme events. This result led us tohypothesise that atmospheric transport over the European conti-nent and the Baltic Sea is an important pre-condition for extremeprecipitation in southern Sweden.
The observation that air parcels which precipitate during ex-treme precipitation events in southern Sweden appear to betransported over Europe and the Baltic, rather than coming di-rectly in from the North Sea, is intriguing. There seems noobvious reason why such pathways should result in more mois-ture being transported from oceanic source regions, nor whythey should result in more powerful uplift over the target region.Thus, we are led back to the hypothesis of Hellstrom (2005) thatregional moisture sources play a significant role in the forma-tion of extreme events in southern Sweden. Indeed, we observethat for most of the extreme events, the specific humidity ofair parcels that have been transported from the North Atlanticis usually quite low (≤4 g kg−1) when they reach the Euro-pean continent. This hypothesis is investigated in the followingsection.
4. Experiment 2: moisture source regionanalysis
4.1. A technique to identifying the source region
Displaying the specific humidity along the trajectories gives anindication of where moisture has been gained or lost. This indi-cated qualitatively that the rain trajectories (the 100 trajectorieswhich lost the largest amount of specific humidity within the tar-get region) gained significant moisture over the Baltic Sea andland surface of the European continent. However, visualizing allthe information from all trajectories in this manner is impossi-ble, and in addition we would like a more quantitative analysis.Using a formal definition of the ‘source region’, and transferringthe data to a regular grid, proved to be a much more informativetechnique for identifying the geographic regions where trajecto-ries gain the most moisture.
A trajectory that runs for 8 days may pick up and lose specifichumidity several times before reaching the target region. There-fore, it is important to identify the last cycle of humidity uptake,prior to the final loss in the target region. To determine this re-gion, some rules had to be devised. In this study, the trajectory‘source region’ was defined as follows: the specific humidityvalues for each trajectory at the release point (time 0) were usedas a threshold value (Fig. 4). For trajectories where rainfall isoccurring in the target region, the specific humidity must havefallen from the time the trajectory entered the target region; withtime running backwards, we say that humidity increases awayfrom the release point. Then, the point where the specific hu-midity falls below the threshold value again for the first timewas identified as the starting point of the source region. Themaximum specific humidity value between the starting point ofthe source region and the release point was identified as the endof the source region. This definition gives an amount of humid-ity uptake corresponding to the loss at the end of the trajectory,although note that not all the loss will occur in the target region.
To extract and visualize the information, hourly changes inspecific humidity were calculated for the sections of the trajec-tories that were identified as source regions, and the data were
Time (h)
Threshold
Spe
cifi
c H
umid
ity
(g/k
g)
Target Region Source Region
7
8
9
10
11
12
0 10 20 30 40 50 60
Fig. 4. Illustration of the source regionidentification rules using an exampletrajectory. The specific humidity (SH) valueat the release point (time = 0 hr) is used as athreshold (8.7 g kg−1), which defines thestart of the source region (time = 32 hr). Themaximum specific humidity value betweenthe release point and the start of the sourceregion (Max SH = 11g kg−1) defines the endof the source region (time = 15 hr). Thetarget region extent is defined independently(Fig. 1). Note that some of the specifichumidity gained in the source region is lostbefore the trajectory enters the target region.
Tellus 62A (2010), 5

612 M. GUSTAFSSON ET AL.
transferred on to a regular latitude–longitude grid. The hourlychanges in specific humidity for all points within each grid cellwere summed to give a single value for each grid cell, whichwas then weighted to reflect the area of the cell. The final re-sult is a grid which shows where the moisture content of theair mass increases for the trajectories that precipitated during aprecipitation event.
Using this definition there are, broadly speaking, three factorswhich may cause a grid cell to be identified as a strong sourceregion. Trajectories may quickly gain a large quantity of mois-ture, indicating strong evaporation. But even if evaporation islower, if a large number of trajectories pass over the cell thenit will be an important source of moisture. The same is true iftrajectories gain moisture over a cell over an extended period.
Using this definition of a source region, there will, however,be some trajectories that lose specific humidity inside the targetregion but which do not have a defined source region within the8-day time domain. This is the case where the moisture contentalong the entire trajectory length remains above the thresholdin the target area arrival point. This means that it is uncertain ifthe moisture lost inside the target region from such trajectorieshas been picked up within the 8-day time domain or earlier.To examine the importance of the moisture transport from suchtrajectories, the percentage of specific humidity lost within thetarget region that could be accounted for by trajectories withdefined source regions was calculated. Overall, 92% (varyingbetween 74% and 100% for the different events) of the moisturelost in the target region comes from trajectories that have a sourceregion within the 8-day time domain. The high percentage ofmoisture accounted suggests that the time domain of 8 days iscertainly sufficient for this study, although a shorter time domain
may have given a similar percentage. It should also be mentionedthat the amount of specific humidity gained inside the identifiedsource regions greatly exceeds, by approximately five times,the total loss inside the target; the excess is rained out as thetrajectories approach the target region.
The gridded source region for the extreme event 9 July 1996(Fig. 2) is shown in Fig. 5, and the source region for the non-extreme event 19 July 1991 (Fig. 3) is shown in Fig. 6. Thesource regions for all extreme events and non-extreme eventsare shown in Appendices S3 and S4, respectively, in SupportingInformation.
4.2. Source regions for extreme events
No two individual events show exactly the same pattern, but theBaltic Sea and continental Europe are clearly important sourcesof moisture. Some events show very strong increases in specifichumidity over small areas, for instance the event on the 18August 1994 and the event on the 18 August 1970 (Figs. S3rand S3c) which showed strong uptake over the southeast BalticSea. Other events showed much less clear patterns with morewide spread source regions, for example on the 11 July 1993(Fig. S3q) the identified source regions are spread over centralEurope all the way down to the Mediterranean, and althoughan increase occurred over the southern part of the Baltic Seait is not as strong as for most of the other events. There arealso a few events, for example on the 13 July 1972 (Fig. S3e),that gained specific humidity over the central part of Sweden.The events of the 26 August 1979 and the 13 July 1972 (Figs.S3h and S3e) have strong source regions within the Gulf ofBothnia.
Fig. 5. Source regions for the extremeprecipitation event 9 July 1996. Colour scaleshow the accumulated hourly changes inspecific humidity for the sections oftrajectories identified as source regions foreach grid cell (g kg−1).
Tellus 62A (2010), 5

RAINFALL EVENTS IN SOUTHERN SWEDEN 613
Fig. 6. Source regions for the non-extremeprecipitation event 19 July 1991. Colourscale show the accumulated hourly changesin specific humidity for the sections oftrajectories identified as source regions foreach grid cell (g kg−1).
The patchy patterns of source regions, which can be seen inthe individual events, should be treated with caution as they maybe a result of the fluctuations in specific humidity along the tra-jectories. Even if there is a general uptake along the part of atrajectory defined as the source region, the change between 1 hrand the next may be negative. If the occurrences of specific hu-midity loss coincide geographically for many of the trajectories,then the grid cells representing that region will show a consid-erable loss in specific humidity, indicating that it is probablyraining there. For many of the grid cells, the sum of changes inspecific humidity is close to zero.
4.3. Source regions for non-extreme precipitation events
The gridded source regions for the non-extreme events areclearly different from the extreme events, both in the amountof moisture uptake and the spatial distribution. The patternsof source regions for the non-extreme events are much morecoherent than for the extreme events, and the general specifichumidity uptake is less per grid cell. For the non-extreme events,the regions of strong humidity uptake are all located close to thetarget region, mostly around the west coast of Sweden, Denmarkand over the North Sea. There is only one event—8 June 1989(Fig. S4e)—where there is substantial moisture uptake over theEuropean continent.
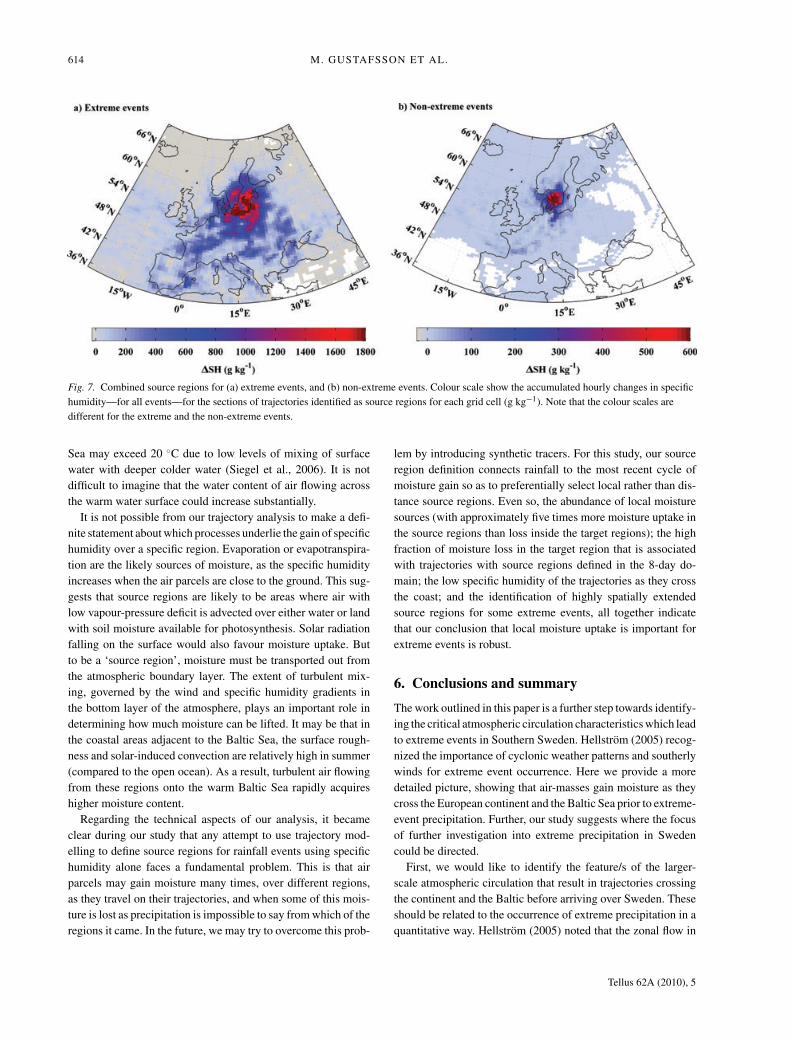
The difference between the source regions of the extremeand non-extreme events is seen most clearly by comparing thecombined source regions for the extreme events and the non-extreme events, as in Fig. 7. The combined source regions ofthe extreme events showed a strong uptake of moisture over thesouthern half of the Baltic Sea and the coastal land areas of
Poland, Kaliningrad, Lithuania and Latvian, a region where thenon-extreme events showed low moisture uptake. For the non-extreme events, the Swedish west coast is the most importantsource of moisture. There were very little uptake over the BalticSea and or over central and eastern Europe.
5. Discussion
The rain trajectory paths we calculated for extreme precipitationevents consistently passed over the European continent and theBaltic Sea, whereas the rain trajectory paths of the non-extremerainfall events often did not. This establishes an important char-acteristic of the atmospheric circulation regime in the lead-up toextreme precipitation events in Southern Sweden.
Our source-region analysis showed that the Baltic Sea andcoastal land areas bordering the south-east part of the Baltic Seaare the important source regions for the moisture which rainsout as extreme precipitation events over southern Sweden. Theimportance of ‘precipitation recycling’, local evaporation feed-ing into storm systems over the same region, has recently beenhighlighted for European regions (Bisselink and Dolman, 2009).Schar et al. (1999) performed month-long climate model sim-ulations which showed that summer rainfall levels over Europewere strongly influenced by soil moisture content via associatedevapotranspiration. Our results suggest that ‘regional precipita-tion recycling’ is an important source of moisture for extremeevents in Southern Sweden.
Except for Hellstrom (2005), the Baltic Sea has not beenrecognized as an important source of evaporation for extremerainfall in Sweden. On reflection, this seems an oversight. Thesummer sea surface temperatures in coastal areas of the Baltic
Tellus 62A (2010), 5
614 M. GUSTAFSSON ET AL.
Fig. 7. Combined source regions for (a) extreme events, and (b) non-extreme events. Colour scale show the accumulated hourly changes in specifichumidity—for all events—for the sections of trajectories identified as source regions for each grid cell (g kg−1). Note that the colour scales aredifferent for the extreme and the non-extreme events.
Sea may exceed 20 ◦C due to low levels of mixing of surfacewater with deeper colder water (Siegel et al., 2006). It is notdifficult to imagine that the water content of air flowing acrossthe warm water surface could increase substantially.
It is not possible from our trajectory analysis to make a defi-nite statement about which processes underlie the gain of specifichumidity over a specific region. Evaporation or evapotranspira-tion are the likely sources of moisture, as the specific humidityincreases when the air parcels are close to the ground. This sug-gests that source regions are likely to be areas where air withlow vapour-pressure deficit is advected over either water or landwith soil moisture available for photosynthesis. Solar radiationfalling on the surface would also favour moisture uptake. Butto be a ‘source region’, moisture must be transported out fromthe atmospheric boundary layer. The extent of turbulent mix-ing, governed by the wind and specific humidity gradients inthe bottom layer of the atmosphere, plays an important role indetermining how much moisture can be lifted. It may be that inthe coastal areas adjacent to the Baltic Sea, the surface rough-ness and solar-induced convection are relatively high in summer(compared to the open ocean). As a result, turbulent air flowingfrom these regions onto the warm Baltic Sea rapidly acquireshigher moisture content.
Regarding the technical aspects of our analysis, it becameclear during our study that any attempt to use trajectory mod-elling to define source regions for rainfall events using specifichumidity alone faces a fundamental problem. This is that airparcels may gain moisture many times, over different regions,as they travel on their trajectories, and when some of this mois-ture is lost as precipitation is impossible to say from which of theregions it came. In the future, we may try to overcome this prob-
lem by introducing synthetic tracers. For this study, our sourceregion definition connects rainfall to the most recent cycle ofmoisture gain so as to preferentially select local rather than dis-tance source regions. Even so, the abundance of local moisturesources (with approximately five times more moisture uptake inthe source regions than loss inside the target regions); the highfraction of moisture loss in the target region that is associatedwith trajectories with source regions defined in the 8-day do-main; the low specific humidity of the trajectories as they crossthe coast; and the identification of highly spatially extendedsource regions for some extreme events, all together indicatethat our conclusion that local moisture uptake is important forextreme events is robust.
6. Conclusions and summary
The work outlined in this paper is a further step towards identify-ing the critical atmospheric circulation characteristics which leadto extreme events in Southern Sweden. Hellstrom (2005) recog-nized the importance of cyclonic weather patterns and southerlywinds for extreme event occurrence. Here we provide a moredetailed picture, showing that air-masses gain moisture as theycross the European continent and the Baltic Sea prior to extreme-event precipitation. Further, our study suggests where the focusof further investigation into extreme precipitation in Swedencould be directed.
First, we would like to identify the feature/s of the larger-scale atmospheric circulation that result in trajectories crossingthe continent and the Baltic before arriving over Sweden. Theseshould be related to the occurrence of extreme precipitation in aquantitative way. Hellstrom (2005) noted that the zonal flow in
Tellus 62A (2010), 5

RAINFALL EVENTS IN SOUTHERN SWEDEN 615
the region is modulated by ridging over western Russia or Fin-land during extreme events. The trajectory patterns describedin this paper are consistent with these observations, especiallythe dominant pattern where trajectories follow an anti-clockwisepathway over the British Isles, over the northern European con-tinental margin and then north across the Baltic Sea.
Secondly, atmospheric and land/sea-surface conditions couldbe compared across extreme and non-extreme rainfall eventswhich have similar trajectory profiles. The sample of non-extreme events selected here on the basis of persistent cyclonicLamb weather type proved to have very different trajectoriescompared to extreme events with the same weather type classi-fication. Although this is an interesting result, to examine (forexample) the role of Baltic Sea temperature or European soilmoisture on extreme events will require a set of extreme andnon-extreme events with comparable trajectories. Identifyingevents based on blocking or ridging activity may prove to be aneffective way of selecting events with a coherent set of trajecto-ries which can be used for such studies.
In summary, trajectory modelling proved to be a usefulmethod for describing the transport of moisture to extreme sum-mer precipitation in Southern Sweden, and identifying the loca-tion of the associated moisture sources. Trajectories contributingto precipitation during extreme events crossed the Baltic Sea orcontinental Europe before arriving over Sweden, whereas trajec-tories contributing to precipitation during non-extreme eventsdid not. The change in specific humidity along the trajecto-ries allowed the moisture source regions to be identified, whichdemonstrated that regional moisture sources around the southernBaltic Sea are important in the formation of extreme precipita-tion. These results provide a further step towards identifyingthe critical atmospheric circulation characteristics which lead toextreme events in Southern Sweden, which is in turn necessaryfor assessing the risk posed by such events, both now and underthe future climate.
7. Acknowledgments
The authors are gratefully acknowledge NOAA Air ResourcesLaboratory (ARL) for the providing the HYSPLIT model;the European Centre for Medium-Range Weather Forecasts(ECMWF) for providing the ERA-40 reanalysis datasets; theNOAA/OAR/ESRL PSD, Boulder, Colorado, USA, for provid-ing the NCEP Reanalysis data; and Alex Walther, University ofGothenburg, for assisting with the Lamb weather class data. Theauthors thank the three anonymous referees for their comments,which significantly improved this paper.
References
Alexandersson, H. 2006. Climate Change, a comparison of temperature
and precipitation between 1991–2005 and 1961–1990. In: SMHI in-formation sheet no. 29. (in Swedish), Direkt offset AB, Norrkoping,Sweden.
Alexandersson, H. and Vedin, H. 2005. Extreme Precipitation
1900–2004. In: SMHI information sheet no. 4. (in Swedish), Direktoffset AB, Norrkoping, Sweden.
Achberger, C. and Chen, D. 2006. Trend of extreme precipitation inSweden and Norway during 1961–2004. Research Report C72, ISSN1400-383X, Earth Sciences Centre, Goteborg University, Gothenburg,Sweden, 58.
Bisselink, B. and Dolman, A.H. 2009. Recycling of moisture in Europe:contribution of evaporation to variability in very wet and dry years.Hydrol. Earth Syst. Sci. Discuss. 6, 3301–3333.
Bosilovich, M.G. and Schubert, S.D. 2002. Water vapor tracers as diag-nostics of the regional hydrological cycle. J. Hydrometeor. 3,149–165.
Browning, K.A. 1997. The dry intrusion perspective of extra-tropicalcyclone development. Meteorol. Appl. 4, 317–324.
Chen, D. 2000. A monthly circulation climatology for Sweden and itsapplication to a winter temperature case study. Int. J. Climatol. 20,1067–1076.
Draxler, R.R. and Hess, G.D. 1998. An overview of the HYSPLIT_4modeling system for trajectories, dispersion, and deposition. Aust.
Meteor. Mag. 47, 295–308.Draxler, R.R. and Rolph, G.D. 2003. HYSPLIT (Hybrid Single-Particle
Lagragnian Integrated Trajectory), Model access via NOAA ARLREADY Website NOAA Air Resources Laboratory, Silver Spring,www.arl.noaa.gov/ready/hysplit4.html
Draxler, R.R. 2003. Evaluation of an ensemble dispersion calculation.J. Appl. Meterol. 42, 308–317.
Eckhardt, S., Stohl, A., Wernli, H., James, P., Forster, C. and co-authors.2004. A 15-year climatology of warm conveyor belts. J. Clim. 17,218– 237.
Haylock, M.R., Hofstra, N., Klein Tank, A.M.G., Klok, E.J., Jones,P.D. and co-authors. 2008. A European daily high-resolution grid-ded dataset of surface temperature and precipitation. J. Geophys. Res
(Atmos.), 113, D20119, doi:10.1029/2008JD10201.Hellstrom, C. and Malmgren, B. 2004. Spatial analysis of ex-
treme precipitation in Sweden 1961–2000. Ambio. 33, 187–192.
Hellstrom, C. 2005. Atmospheric conditions during extreme and non-extreme precipitation events in Sweden. Int. J. Climatol. 25, 631–648.
Helsen, M.M., van de Wal, R.S.W., van den Broeke, M.R., Masson-Delmotte, V., Meijer, H.A.J. and co-authors. 2006. Modeling theisotopic composition of Antarctic snow using backward trajectories:Simulation of snow pit records. J. Geophys. Res. 111, 1–19.
Jackson, D.R., Driscoll, S.J., Highwood, E.J., Harries, J.E. and RussellIII, J.M. 1998. Troposphere to stratosphere transport at low latitudesas studied using HALOE observations of water vapour 1992–1997.Q. J. R. Meteorol. Soc. 124, 169–192.
James, P., Stohl, A., Spichtinger, N., Eckhardt, S. and Foster, C. 2004.Climatological aspects of the extreme European rainfall of August2002 and a trajectory methods for estimating the associated evapora-tive source regions. Nat. Hazards Earth Syst. Sci. 4, 733–746.
Keil, C., Volkert, H. and Majewski, D. 1999. The Oder flood in July 1997:transport routes of precipitable water diagnosed with an operationalforecast model. Geophys. Res. Lett. 26, 235–238.
Kalnay, E., Kanamitsu, M., Kistler, R., Collins, W., Deaven, D. and co-authors. 1996. The NCEP/NCAR 40-Year Re-analysis Project. Bull.Amer. Meteor. Soc., 77, 437–471.
Lamb, H.H. 1950. Types and spells of weather around the year in theBritish Isles. Q. J. R. Meteorol. Soc. 76, 393–438.
Tellus 62A (2010), 5

616 M. GUSTAFSSON ET AL.
Linderson, M.L., Achberger, C. and Chen, D. 2004. Statistical down-scaling and scenario construction of precipitation in Scania, southernSweden. Nordic Hydrol. 35, 261–278.
Lindstrom, G. and Bergstrom, S. 2004. Runoff trends in Sweden1807–2002. Hydrol. Sci. J. 49, 69–84.
Massacand, A.C., Wernli, H. and Davies, H.C. 1998. Heavy precipitationon the Alpine southside: an upper level precursor. Geophys. Res. Lett.
25,1435–1438Newell, R.E., Newell, N.E., Zhu, Y. and Scott, C. 1992. Tropospheric
rivers?—A pilot study. Geophys. Res. Lett. 19, 2401–2404.Reale, O., Feudale, L. and Turato, B. 2001. Evaporative moisture sources
during a sequence of floods in the Mediterranean region. Geophys.
Res. Lett. 28, 2085–2088.Raddningsverket 2000. Oversvamning. Document R00 – 222/00,
Raddningsverket, Karlstad (in Swedish).Siegel, H., Gerth, M. and Tschersich, G. 2006. Sea surface temperature
development of the Baltic Sea in the period 1990–2004. Oceanologia48, 119–131.
Schar, C., Luthi, D., Beyerle, U. and Heise, E. 1999. The soil precipita-tion feedback: a process study with a regional climate model. J. Clim.12, 722–741.
Stohl, A. 1998. Computation, accuracy and applications of trajectories– a review and bibliography. Atmos. Environ. 32, 947–966.
Stohl, A., Wotawa, G., Seibert, P. and Kromp-Kolb, H. 1995. Interpo-lation errors in wind fields as a function of spatial and temporal res-olution and their impact on different types of kinematic trajectories.J. Appl. Meteor. 34, 2149–2165.
Stohl, A., Forster, C., Eckhardt, S., Spichtinger, N., Huntrieser, H.and co-authors 2003. A backward modeling study of intercontinen-tal pollution transport using aircraft measurements. J. Geophys. Res.
108(D12), ACH 8-1–ACH 8-18.Stohl, A., Forster, C. and Sodemann, H. 2008. Remote sources of water
vapor forming precipitation on the Norwegian west coast at 60◦N atale of hurricanes and an atmospheric river. J. Geophys. Res. 113,D05102, doi:10.1029/2007JD009006.
Tang, L., Karlsson, P.E., Gu, Y., Chen, D. and Grennfelt, P. 2009. Syn-optic weather types and long-range transport patterns for ozone pre-cursors during high-ozone events in southern Sweden. Ambio, 38,459–464.
Trenberth, K.E. 1998. Atmospheric moisture residence times and cy-cling: implications for rainfall rates with climate change. Clim.
Change 39, 667–694.Trenberth, K.E. 1999. Atmospheric moisture recycling: role of advection
and local evaporation. J. Clim. 12, 1368–1381.Trenberth, K.E., Dai, A., Rasmussen, R.M. and Parsons, D.B. 2003.
The Changing character of precipitation. Bull. Am. Meteorol. Soc. 84,1205–1217.
Weyhenmeyer, C.E., Burns, S.J., Waber, H.N. and Macumber, P.G. 2002.Isotope study of moisture sources, recharge areas, and groundwaterflow paths within the eastern Batinah coastal plain, Sultanate of Oman.Water Resour. Res. 38(10), 1184, doi:10.1029/2000WR000149.
Supporting information
Additional Supporting Information may be found in the onlineversion of this article:
Appendix S1. Stations experiencing extreme events.Appendix S2. The paths and vertical profiles for the rain-resulting trajectories for all events.Appendix S3. Gridded source regions for extreme events.Appendix S4. Gridded source regions for extreme events.
Please note: Wiley-Blackwell are not responsible for the contentor functionality of any supporting materials supplied by theauthors. Any queries (other than missing material) should bedirected to the corresponding author for the article.
Tellus 62A (2010), 5