Extreme Dependence Between Crude Oil and Stock Markets ...
23
Received October 17, 2016 Accepted as Economics Discussion Paper October 27, 2016 Published November 14, 2016 © Author(s) 2016. Licensed under the Creative Commons License - Attribution 4.0 International (CC BY 4.0) Discussion Paper No. 2016-46 | November 14, 2016 | http://www.economics-ejournal.org/economics/discussionpapers/2016-46 Extreme Dependence Between Crude Oil and Stock Markets in Asia-Pacific Regions: Evidence from Quantile Regression Huiming Zhu, Hui Huang, Cheng Peng, and Yan Yang Abstract This paper investigates the extreme dependence between the Asia-Pacific stock markets and the international crude oil market by applying the quantile regression theory and using daily data from January 4th, 2000 to July 4th, 2016. The authors obtain a more detailed result on the degree and structure of the dependence, and furthermore, the results present an asymmetric and heterogeneous dependence. Moreover, the dependence increases dramatically after a structural break point, meaning a crisis. Additionally, the authors observe a more significant dependence at the lower tails than the upper tails. They demonstrate the positive relationship at low quantiles, which is evidence of positive dependence in recessions or bearish markets. JEL E44 Q43 Keywords Extreme dependence, Crude oil, Asia-Pacific stock market, Quantile regression, Structural breaks Authors Huiming Zhu, Hunan University, [email protected] Hui Huang, Hunan University Cheng Peng, Hunan University Yan Yang, Hunan University Citation Huiming Zhu, Hui Huang, Cheng Peng, and Yan Yang (2016). Extreme Dependence Between Crude Oil and Stock Markets in Asia-Pacific Regions: Evidence from Quantile Regression. Economics Discussion Papers, No 2016-46, Kiel Institute for the World Economy. http://www.economics-ejournal.org/economics/discussionpapers/2016-46
-
Upload
khangminh22 -
Category
Documents
-
view
2 -
download
0
Transcript of Extreme Dependence Between Crude Oil and Stock Markets ...
Received October 17, 2016 Accepted as Economics Discussion Paper October 27, 2016 Published November 14, 2016
© Author(s) 2016. Licensed under the Creative Commons License - Attribution 4.0 International (CC BY 4.0)
Discussion PaperNo. 2016-46 | November 14, 2016 | http://www.economics-ejournal.org/economics/discussionpapers/2016-46
Extreme Dependence Between Crude Oil and StockMarkets in Asia-Pacific Regions: Evidence fromQuantile Regression
Huiming Zhu, Hui Huang, Cheng Peng, and Yan Yang
AbstractThis paper investigates the extreme dependence between the Asia-Pacific stock markets and theinternational crude oil market by applying the quantile regression theory and using daily datafrom January 4th, 2000 to July 4th, 2016. The authors obtain a more detailed result on thedegree and structure of the dependence, and furthermore, the results present an asymmetric andheterogeneous dependence. Moreover, the dependence increases dramatically after a structuralbreak point, meaning a crisis. Additionally, the authors observe a more significant dependence atthe lower tails than the upper tails. They demonstrate the positive relationship at low quantiles,which is evidence of positive dependence in recessions or bearish markets.
JEL E44 Q43Keywords Extreme dependence, Crude oil, Asia-Pacific stock market, Quantile regression,Structural breaks
AuthorsHuiming Zhu, Hunan University, [email protected] Huang, Hunan UniversityCheng Peng, Hunan UniversityYan Yang, Hunan University
Citation Huiming Zhu, Hui Huang, Cheng Peng, and Yan Yang (2016). Extreme Dependence Between Crude Oil andStock Markets in Asia-Pacific Regions: Evidence from Quantile Regression. Economics Discussion Papers, No 2016-46,Kiel Institute for the World Economy. http://www.economics-ejournal.org/economics/discussionpapers/2016-46
1
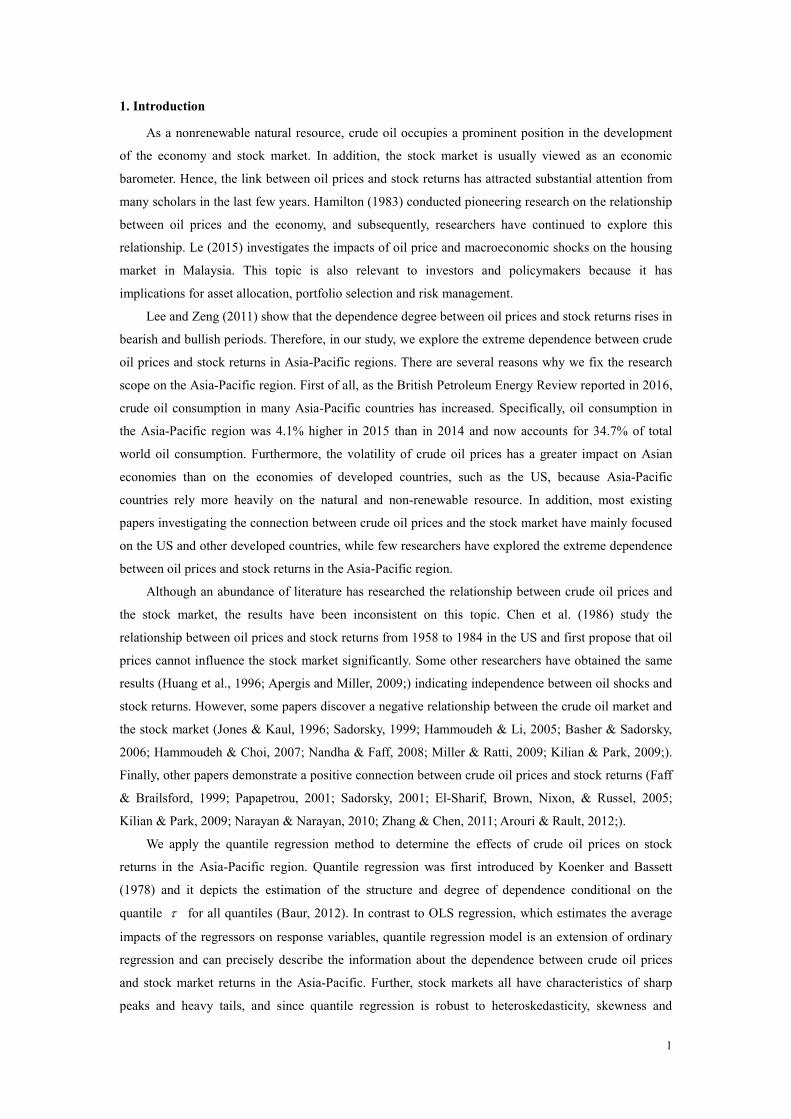
1. Introduction
As a nonrenewable natural resource, crude oil occupies a prominent position in the development
of the economy and stock market. In addition, the stock market is usually viewed as an economic
barometer. Hence, the link between oil prices and stock returns has attracted substantial attention from
many scholars in the last few years. Hamilton (1983) conducted pioneering research on the relationship
between oil prices and the economy, and subsequently, researchers have continued to explore this
relationship. Le (2015) investigates the impacts of oil price and macroeconomic shocks on the housing
market in Malaysia. This topic is also relevant to investors and policymakers because it has
implications for asset allocation, portfolio selection and risk management.
Lee and Zeng (2011) show that the dependence degree between oil prices and stock returns rises in
bearish and bullish periods. Therefore, in our study, we explore the extreme dependence between crude
oil prices and stock returns in Asia-Pacific regions. There are several reasons why we fix the research
scope on the Asia-Pacific region. First of all, as the British Petroleum Energy Review reported in 2016,
crude oil consumption in many Asia-Pacific countries has increased. Specifically, oil consumption in
the Asia-Pacific region was 4.1% higher in 2015 than in 2014 and now accounts for 34.7% of total
world oil consumption. Furthermore, the volatility of crude oil prices has a greater impact on Asian
economies than on the economies of developed countries, such as the US, because Asia-Pacific
countries rely more heavily on the natural and non-renewable resource. In addition, most existing
papers investigating the connection between crude oil prices and the stock market have mainly focused
on the US and other developed countries, while few researchers have explored the extreme dependence
between oil prices and stock returns in the Asia-Pacific region.
Although an abundance of literature has researched the relationship between crude oil prices and
the stock market, the results have been inconsistent on this topic. Chen et al. (1986) study the
relationship between oil prices and stock returns from 1958 to 1984 in the US and first propose that oil
prices cannot influence the stock market significantly. Some other researchers have obtained the same
results (Huang et al., 1996; Apergis and Miller, 2009;) indicating independence between oil shocks and
stock returns. However, some papers discover a negative relationship between the crude oil market and
the stock market (Jones & Kaul, 1996; Sadorsky, 1999; Hammoudeh & Li, 2005; Basher & Sadorsky,
2006; Hammoudeh & Choi, 2007; Nandha & Faff, 2008; Miller & Ratti, 2009; Kilian & Park, 2009;).
Finally, other papers demonstrate a positive connection between crude oil prices and stock returns (Faff
& Brailsford, 1999; Papapetrou, 2001; Sadorsky, 2001; El-Sharif, Brown, Nixon, & Russel, 2005;
Kilian & Park, 2009; Narayan & Narayan, 2010; Zhang & Chen, 2011; Arouri & Rault, 2012;).
We apply the quantile regression method to determine the effects of crude oil prices on stock
returns in the Asia-Pacific region. Quantile regression was first introduced by Koenker and Bassett
(1978) and it depicts the estimation of the structure and degree of dependence conditional on the
quantile for all quantiles (Baur, 2012). In contrast to OLS regression, which estimates the average
impacts of the regressors on response variables, quantile regression model is an extension of ordinary
regression and can precisely describe the information about the dependence between crude oil prices
and stock market returns in the Asia-Pacific. Further, stock markets all have characteristics of sharp
peaks and heavy tails, and since quantile regression is robust to heteroskedasticity, skewness and

2
leptokurtosis, quantile regression is used broadly to study the dependence between financial variables
(Basset and Chen, 2001; Koenker, 2004; Baur and Schulze, 2005; Chuang et al., 2009; Baur et al., 2011;
Lin, 2013; Mensi et al., 2014).
Bai and Perron (1998) proposed a method for detecting structural breaks. Nevertheless, a great
deal of research has ignored the structural changes resulting from market turmoil or a past financial
crisis. If we do not consider the effects of structural breaks, the results we obtain may be inaccurate.
Recently, scholars have investigated the link between oil prices and stock markets by applying the
quantile regression model with structural breaks (Lee and Zeng, 2011; Li et al., 2012; Ajmi et al., 2014).
Li et al. (2012) argue that structural breaks indicate rare parameter variations arising from changes in
policy regime or infrequent but vital geopolitical events (e.g., subprime crisis). According to Ajmi
(2014), changes in the oil price impact the stock market differently before and after a crisis.
Our research contributes to the current literature in the following ways: First, few studies have
investigated the extreme dependence between crude oil prices and Asia-Pacific stock markets. Second,
whereas previous literature has used VAR or copula methods to analyse the dependence between crude
oil prices and stock markets, we use quantile regression, which is a more flexible method and can
provide a more perfect picture of the distribution. Finally, previous research on Asia-Pacific stock
markets has not considered multiple structural breaks. We explore the extreme dependence between the
two financial variables across different countries considering the distinctive break points in each.
The paper is organized as follows: Section 2 briefly reviews literature. Section 3 explains the data
and methodology used in this paper. Section 4 presents empirical results and a discussion of the
findings. Finally, some conclusions are provided in section 5.
2. Literature Review
A large number of existing studies have found a link between crude oil prices and stock returns.
Kling (1985) apply the vector autoregressive (VAR) to examine the impacts of oil price movements on
the S&P500 and five US industries. Jones et al. (1996) demonstrate the impact of oil price shocks on
the unexpected stock return. Some papers state that oil price variances are vital in accounting for the
changes in aggregate stock returns (Sadorsky, 1999; Papapetrou, 2001; Miller and Ratti, 2009). On the
one hand, Sadorsky (1999) show that the impact of oil prices on the US stock market is negative. On
the other hand, El-Shrif et al. (2005) find a positive connection between the energy market and the
stock market. Furthermore, Nandha and Faff (2008) indicate that oil price and stock market return are
positively correlated in oil-exporting countries. Zhang and Wei (2011) study the relationship between
the international crude oil market and stock market risk in the US, UK, and Japan and find asymmetric
effects. Using sector stock prices and oil prices from January 1991 to May 2009 in the G7 countries,
Lee et al. (2012) find that fluctuations of stock markets in Germany, the US and the UK cause
significant changes to the oil price, although oil price shocks have nearly no effect on the stock returns
of the G7 countries. Wen et al. (2012) use time-varying copulas to explore whether there were
contagion effects between the energy and stock markets during the recent financial crisis. Lee and Ryu
(2013) re-examine the relationship between stock returns and implied volatility by applying a new VAR
approach. Silva et al. (2014) use copula methods to explore tail dependence of financial stocks and
CDS markets. Kang et al. (2016) investigate the effects of oil supply shocks on the US stock market
3
and find a positive impact.
In exploring the relationship between crude oil prices and stock markets, prior research has
focused on developed countries. However, there are still some researchers who have studied this topic
in developing countries, especially those experiencing rapid progress. Papapetrou (2001) suggest that
oil prices impact the Greece stock market significantly. Maghyereh (2004) investigates the dynamic
linkages between crude oil price shocks and stock market returns in 22 emerging economies by
applying the VAR analysis. Hammoudeh and Choi (2007) report that a negative relationship between
crude oil prices and stock markets exists in emerging countries. Cong et al. (2008) first use a VAR
model to research the relationship between the oil price and the stock composite index in China.
Changes in oil prices are found to result in the volatility of stock markets in Brazil, Russia, India and
China (BRIC) (Bhar and Nikolova, 2009). There is evidence that oil prices have a positive impact on
stock returns in Vietnam (Narayan and Narayan, 2010). Li et al. (2012) employ panel cointegration to
investigate the relationship between oil shocks and the Chinese stock market and find a minor positive
effect. Sukcharoen et al. (2014) apply the copula approach to investigate the interdependence of oil
prices and stock market indices in both developed countries and developing countries for the period
spanning January 7, 1982 to December 31, 2007. Jain and Biswal (2016) report the dynamic relation
between global oil prices and the stock market in India.
Few scholars have conducted research on the dependence between crude oil prices and stock
markets in the Asia-Pacific. Nandha and Hammoudeh (2007) determine the sensitivities of stock
markets in 15 Asia-Pacific countries to systematic risk, oil price and the exchange rate by applying an
international factor model. Raheman et al. (2012) examine the effects of oil price fluctuations on stock
returns in Asia-Pacific regions using the VAR method. Zhu et al. (2014) analyse the link between the
crude oil price and Asia-Pacific stock returns using the copula model and find the dynamic dependence
between them. Koh (2016) employ structural vector autoregression (VAR) to explore how oil price
shocks influence Asian stock returns. They infer that an increase in the oil price may be viewed as bad
news only if the source is an oil-market-specific change in demand.
Some empirical research has considered structural breaks resulting from financial crisis or market
chaos. Bai and Perron (2003) propose a method to discover structural breaks in research. Li et al. (2012)
examine the links between oil prices and stock markets in China at the sector level by employing a
panel cointegration test with multiple breaks. Zhu et al. (2015) describes the presence of multiple
structural breaks in the relationship between oil prices and stock returns in various industries.
We use quantile regression aimed at demonstrating the extreme dependence between crude oil
prices and stock markets in Asia-Pacific regions, because very few previous studies have applied
quantile regression to research this relationship. In addition, quantile regression can precisely describe
the relationship between the two variables whether in the upper tail, lower tail or centre of the
conditional distribution of dependent variables. Further, we consider the effects of financial crisis and
test break points in different Asia-Pacific regions.

4
3. Data and Methodology
3.1 Data and descriptive statistics
We use ten daily stock indexes in the Asia-Pacific and crude oil price changes from January 4th,
2000 to July 4th, 2016 due to the availability of data. The period is long enough that we can explore the
dependence between crude oil prices and stock returns by dividing the period into multiple shorter
periods along structural breaks. The ten Asia-Pacific indexes covered are the following: Australia
S&P/ASX 200, Hong Kong Hang Seng Index, India S&P BSE SENSEX, Indonesia Jakarta Composite
Index, Japan Nikkei 225, Korea KOSPI Composite Index, Philippine PSEI, Malaysia FTSE Bursa
Malaysia KLCI, Shanghai SSE Composite Index, and Taiwan TWSE TAIWAN 50. These data are
collected from the website http://finance.yahoo.com. The Cushing, OK WTI Spot Price, which is the
major indicator of international crude oil prices, was obtained from the EIA. Some papers use exchange
rates to convert WTI oil prices into local oil prices. However, the return that we use reduces the impact
of the exchange rate. Therefore, we calculate crude oil price changes as follows:
)ln(ln100 1 tt PPOil , (1)
where tP denotes the oil price at time t . The stock returns are defined in a similar manner. Table 1
presents the descriptive statistics of crude oil price changes and of stock market returns in the different
regions.
5
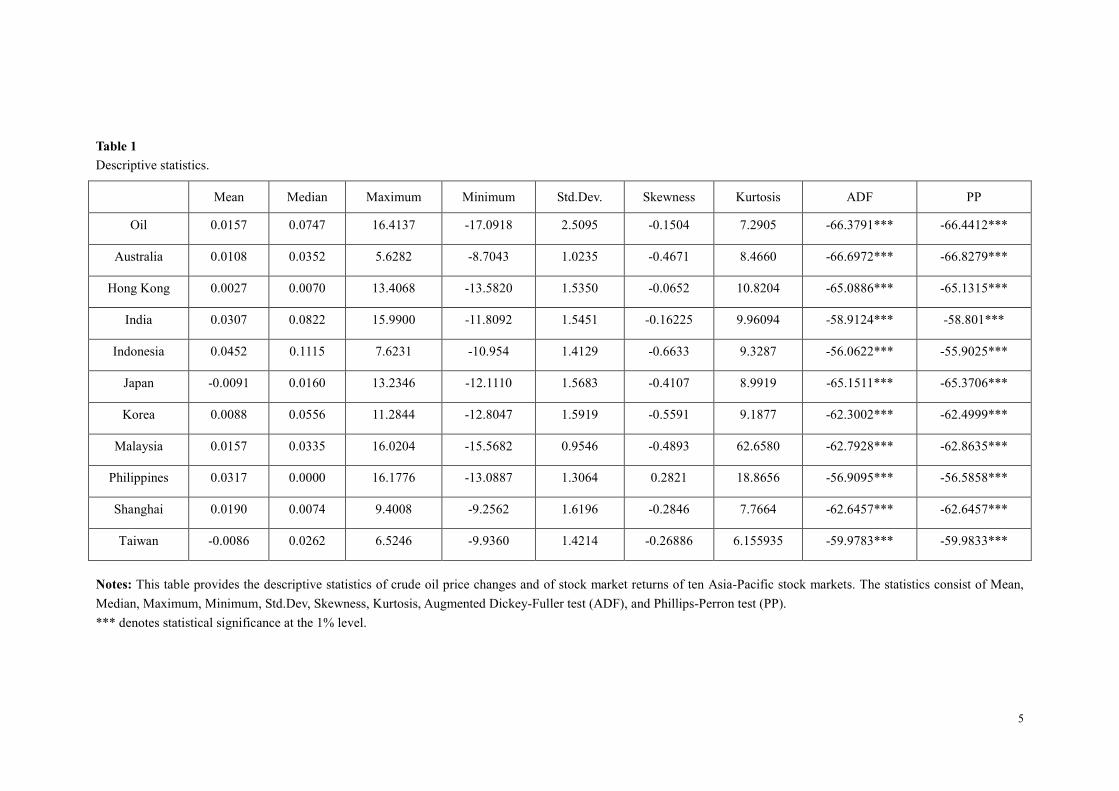
Table 1
Descriptive statistics.
Mean Median Maximum Minimum Std.Dev. Skewness Kurtosis ADF PP
Oil 0.0157 0.0747 16.4137 -17.0918 2.5095 -0.1504 7.2905 -66.3791*** -66.4412***
Australia 0.0108 0.0352 5.6282 -8.7043 1.0235 -0.4671 8.4660 -66.6972*** -66.8279***
Hong Kong 0.0027 0.0070 13.4068 -13.5820 1.5350 -0.0652 10.8204 -65.0886*** -65.1315***
India 0.0307 0.0822 15.9900 -11.8092 1.5451 -0.16225 9.96094 -58.9124*** -58.801***
Indonesia 0.0452 0.1115 7.6231 -10.954 1.4129 -0.6633 9.3287 -56.0622*** -55.9025***
Japan -0.0091 0.0160 13.2346 -12.1110 1.5683 -0.4107 8.9919 -65.1511*** -65.3706***
Korea 0.0088 0.0556 11.2844 -12.8047 1.5919 -0.5591 9.1877 -62.3002*** -62.4999***
Malaysia 0.0157 0.0335 16.0204 -15.5682 0.9546 -0.4893 62.6580 -62.7928*** -62.8635***
Philippines 0.0317 0.0000 16.1776 -13.0887 1.3064 0.2821 18.8656 -56.9095*** -56.5858***
Shanghai 0.0190 0.0074 9.4008 -9.2562 1.6196 -0.2846 7.7664 -62.6457*** -62.6457***
Taiwan -0.0086 0.0262 6.5246 -9.9360 1.4214 -0.26886 6.155935 -59.9783*** -59.9833***
Notes: This table provides the descriptive statistics of crude oil price changes and of stock market returns of ten Asia-Pacific stock markets. The statistics consist of Mean,
Median, Maximum, Minimum, Std.Dev, Skewness, Kurtosis, Augmented Dickey-Fuller test (ADF), and Phillips-Perron test (PP).
*** denotes statistical significance at the 1% level.
6
We focus on the last four statistics. The results show that the Philippine stock market returns are
left skewed, whereas the rest are right skewed. Furthermore, all variables have excessive kurtosis,
indicating that all distributions are non-normal and asymmetric, which is consistent with the
characteristics of sharp peaks and fat tails in stock markets. This observation sufficiently proves the
necessity of studying the impacts of crude oil price on stock market returns at different quantiles. Thus,
we apply the quantile regression approach to investigate the dependence between the crude oil price
and the Asia-Pacific stock markets, an approach that can characterise the degree and structure of
dependence more flexibly and precisely. In contrast, ordinary linear regression is not suitable for our
study of oil prices and the stock market because of its hypothesis that the error term is normally
distributed. Furthermore, through the unit root test, including the Augmented Dickey-Fuller (ADF) test
and Phillips-Perron (PP) test, we can reject the null hypothesis at the 1% significance level. Hence, all
variables proved to be stationary at the 1% significance level through the ADF test and PP test.
3.2 Methodology
Quantile regression is first introduced by Koenker and Bassett (1978) and is widely used to
research the dependence between financial variables. Ordinary least squares (OLS) regression is a
linear model represented as xy ' . It provides the estimation of the conditional mean of the
dependent variable y given the explanatory variables x . However, Binder and Coad (2011) suggest
that OLS regression may result in inexact estimation of relevant parameters or the loss of significant
relationships. Compared with OLS regression, quantile regression presents a more precise picture of a
conditional distribution, which is an expansion of ordinary linear regression. Quantile regression has a
hypothesis that the value of i conditional on the regressors at -th quantile is equal to 0. The basic
quantile regression model is specified as follows:
)('})(|inf{)( || xbFbQ xyxy , (2)
where 10 , )(| xyQ is the -th conditional quantile of y , which is assumed to be linearly
dependent on x . )( denotes the dependence degree. That is to say, the estimation of )( can
show the influence of x on the -th quantile of y . The coefficients of the -th quantile of the
conditional distribution are estimated as:
n
i
ii xy1)(
))('(minarg)(ˆ
(3)
If )(' iii xyu , then the loss function of the segmented quantile is:
)]0([)( iii uIuu , (4)
where )(I is an indicator function. In addition, considering fixed effects that are unknown, we extend
the basic model specification in Eq.(1). The expression for quantile regression with fixed effects is as
follows:
7
)(')()(| ixy xQi
, (5)
where )( denotes the unobserved effect. Specifically, the coefficients of the -th quantile of the
conditional distribution are estimated as follows:
n
i
ii xy1)(),(
))(')((minarg))(ˆ),(ˆ(
(6)
This method divides the residuals into positives and negatives, and also gives the weights of and
1 , so the estimator is robust.
We use the quantile regression model to investigate the extreme dependence between crude oil
prices and the Asia-Pacific stock markets. As is common knowledge, financial data have characteristics
of sharp peaks and fat tails that accord with the results shown in Table 1. As a result, quantile
regression matches the needs of our research and it is robust to heteroskedasticity, skewness and
leptokurosis (Baur et al., 2011). Some prior papers such as those of Broadstock and Cao (2012) and
Moya et al. (2014) note that the dependence degree will be changed by a crisis. Thus, we test for break
points and the results indicate that four regions, Hong Kong, India, Indonesia and Taiwan, have
breakpoints. Because of the existence of multiple structural breaks in the relationship between crude oil
prices and stock returns in the Asia-Pacific, we add dummy variables into our model as follows:
j
n
j
jr DoiloilxQ 1
)()()()|( , (7)
where r represents the stock return of different regions in the Asia-Pacific and oil represents the oil
price changes. We utilise daily data for both the crude oil and stock markets. When the return is from
the period after the eruption of j -th break, the dummy variable jD equals one. In the remaining
cases, the dummy variable is equal to zero. Our model aims to explore the extreme effects that crude oil
prices have on stock returns in ten Asia-Pacific regions. In our model, )( measures the dependence
degree between oil prices and Asia-Pacific stock returns. In other words, the estimation of )(
describes the impacts of the crude oil price on the -th quantile of the stock return. We select three
series of quantiles for our study. The first series, which is defined as the lower tail, consists of three
quantiles (0.01, 0.05, 0.1). Quantile (0.5) represents the middle of the distribution. Lastly, the upper tail
refers to the quantiles (0.9, 0.95, 0.99). In total, seven quantiles are included in our research. If the
parameter )( is significantly positive, we infer that the stock return would increase when the crude
oil price increases and would decrease when the oil price decreases. Further, if the estimated )( is
negative, then oil prices and stock market returns will be inversely related; when the oil price rises, the
stock return would decline, and vice versa. Estimated values of )( j denotes the variation of
dependence arising from the j -th break. Our results confirm that the extreme dependence between oil
prices and stock returns across quantiles differs between normal and crisis periods. The variable j in
our final expression is a segment index, denoting the breakpoints which are definitely viewed as
undiscovered. Bai and Perron (1998) proposed a method for detection of structural breaks. With the

8
breakpoint j , a comparison of the OLS residuals je from one regression for each sub-sample and
the residuals e from the whole model is via:
)(,,,)2/(ˆ'ˆ
ˆ'ˆˆ'ˆknnnnj
knee
eeeeF hhh
jj
jjj
, (8)
where the F -statistic (Andrews, 1993; Andrews and Ploberger, 1994; Andrews et al., 1996) is
specified to test the alternative hypothesis of one break with unknown timing against the null
hypothesis. The null hypothesis is that there is no break point. Subsequently, Bai and Parron (1998,
2003) extend this method to test for 0 vs. L breaks and L vs. L+1 breaks. In order to identify the
number of break points, first it is necessary for us to examine whether there is at least one break on the
basis of maxUD and maxWD tests (Bai and Perron, 1998; Bai and Perron, 2003). Next, we
calculate the precise number of break points by sequential procedure of the ]/)1[(sup LLFT
statistics.
4. Empirical Analysis
4.1 Multiple structural breaks
Our results reveal notable heterogeneity in structural breaks among the different regions studied.
From Table 2, we know that there are four regions that have breakpoints, Hong Kong, India, Indonesia
and Taiwan, while others have no breakpoints. Hong Kong and India both have two breaks, and just
one break exists in Indonesia and Taiwan.
Table 2
Estimation of multiple structural breaks in the relationship between crude oil price and stock returns.
Regions Number of breaks Break dates
Australia 0
Hong Kong 2 2007-7-31, 2012-7-30
India 2 2006-3-24, 2013-8-26
Indonesia 1 2003-4-3
Japan 0
Korea 0
Malaysia 0
Philippines 0
Shanghai 0
Taiwan 1 2003-4-22
Notes: 1.Specification: Method: BREAKLS-Least Squares with Breakpoints; 2.Options: Coefficient
covariance matrix: HAC (Newey-West); (Lag specification: Auto-AIC; Maximum lags:*; Kernel: Bartlett;
Bandwidth method: Newey-West Automatic; Lag selection parameter:*; Offset: 0;) d.f. Adjustment;
Allow error distribution to differ across breaks; Method: Sequential L+1 breaks vs. L; Trimming:15;
Maximum breaks: 5; Significance:0.05.
9
In Hong Kong, the first break, which occurred on July 31st, 2007, may have been caused by the
U.S. sub-prime mortgage crisis that triggered the global financial turmoil in the last half of 2007. The
second breakpoint in Hong Kong appeared on July 30th, 2012. This break may be related to the Hong
Kong Stock Exchange’s acquisition of the London Metal Exchange (LME) in June 2012. In India, the
break on March 24th,2006 may have resulted from the galloping Sensex and the expose of the IPO or
demat scam from 2005 to 2006. The second break in India on August 26th, 2013 resulted from the lack
of formal banking in many rural areas, which gave rise to many Ponzi schemes. Indonesia and Taiwan
had only one break point in April, 2003, which may be related to a sharp increase in crude oil prices in
2003.
4.2 Extreme dependence
The estimation results in Table 3 reveal that the dependence between the stock market and crude
oil prices is dissimilar across different regions. As shown in Table 2, Hong Kong, India, Indonesia and
Taiwan all have breakpoints. In these four regions, we find that almost all the stock markets are not
significantly affected by oil price before the break, while they are sensitive to oil price shocks after the
break. Thus, the dependence degree between stock return and oil price increased significantly after the
recent financial crisis, which is consistent with previous research on the stock market (Wen et al., 2012
and Zhu et al., 2014). The research of Wen indicates that there was a statistically significant rise in
conditional dependence between crude oil and US/Chinese stock markets during the post-crisis period.
According to Zhu et al. (2014), this enhanced dependence between oil prices and stock returns may be
caused by expectations of economic recovery in the Asia Pacific stock markets due to the increased oil
price. Strong economic growth may increase the confidence of investors and the steady appreciation of
currencies in the Asia-Pacifuc region may have significantly driven demand for crude oil, causing the
dependence between oil prices and stocks returns to strengthen in the post-crisis. Chen (2010),
Hamilton (2009) and Guo et al. (2010) find that increasing oil prices caused a dampening of US stock
returns, and conclude that the dependence of oil prices and stock prices returns is markedly decreased
before a crisis. Chen and Lv (2015) investigate the contagion effect and their results indicate the
increasing dependence between the Chinese stock market and the world crude oil market during the
crisis period. The International Energy Agency reports that a rapid recovery of the world economy
results in a sharp increase in energy demand, especially in the Asia Pacific countries. Additionally,
investors are usually more susceptible to bad news and pay less attention to good news from other
markets. Accordingly, the dependence between oil prices and stock returns will strengthen after a break.
Moreover, the rapid development of financial markets means that changes in oil prices are not only
affected by the supply and demand of crude oil but also by the aggregate risk-based preferences for
assets and investment behavior, causing the dependence degree to increase dramatically. Through our
findings above, investors should regard oil prices as an investment signal, especially during a crisis
period, due to the extreme dependence between the stock indices and oil prices.
10
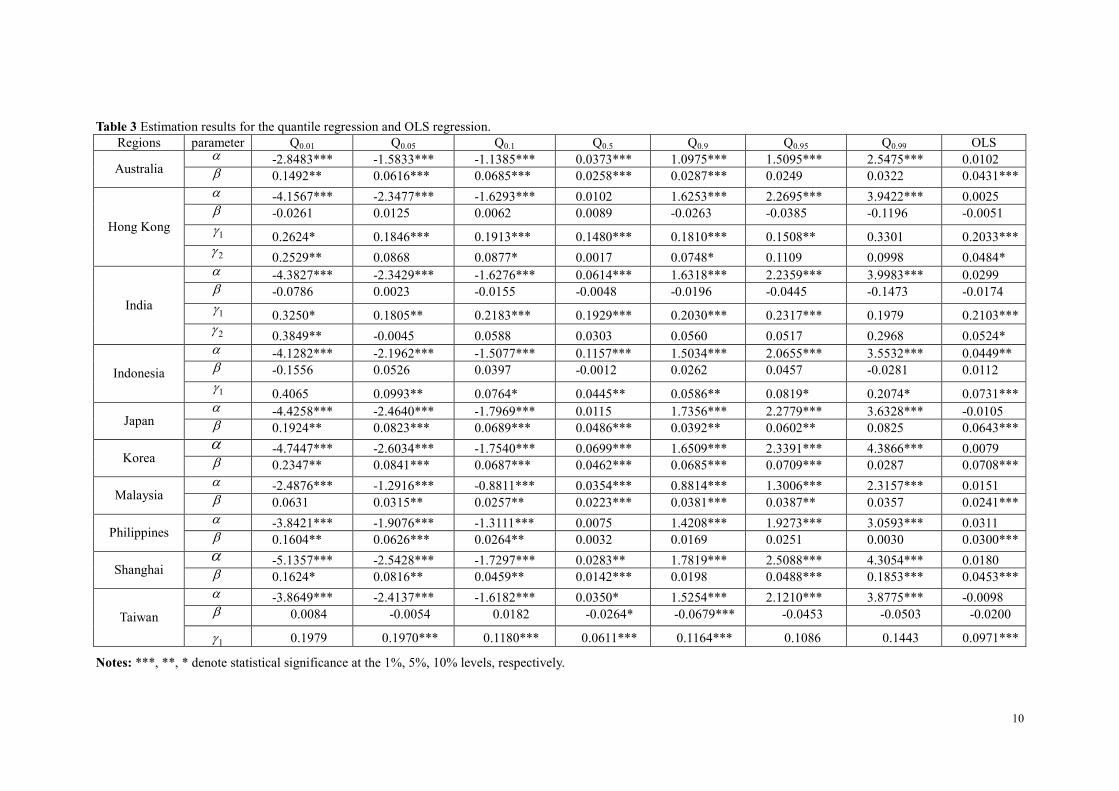
Table 3 Estimation results for the quantile regression and OLS regression. Regions parameter Q0.01 Q0.05 Q0.1 Q0.5 Q0.9 Q0.95 Q0.99 OLS
-2.8483*** -1.5833*** -1.1385*** 0.0373*** 1.0975*** 1.5095*** 2.5475*** 0.0102 Australia 0.1492** 0.0616*** 0.0685*** 0.0258*** 0.0287*** 0.0249 0.0322 0.0431***
-4.1567*** -2.3477*** -1.6293*** 0.0102 1.6253*** 2.2695*** 3.9422*** 0.0025 -0.0261 0.0125 0.0062 0.0089 -0.0263 -0.0385 -0.1196 -0.0051
1 0.2624* 0.1846*** 0.1913*** 0.1480*** 0.1810*** 0.1508** 0.3301 0.2033*** Hong Kong
2 0.2529** 0.0868 0.0877* 0.0017 0.0748* 0.1109 0.0998 0.0484* -4.3827*** -2.3429*** -1.6276*** 0.0614*** 1.6318*** 2.2359*** 3.9983*** 0.0299 -0.0786 0.0023 -0.0155 -0.0048 -0.0196 -0.0445 -0.1473 -0.0174
1 0.3250* 0.1805** 0.2183*** 0.1929*** 0.2030*** 0.2317*** 0.1979 0.2103*** India
2 0.3849** -0.0045 0.0588 0.0303 0.0560 0.0517 0.2968 0.0524* -4.1282*** -2.1962*** -1.5077*** 0.1157*** 1.5034*** 2.0655*** 3.5532*** 0.0449** -0.1556 0.0526 0.0397 -0.0012 0.0262 0.0457 -0.0281 0.0112 Indonesia
1 0.4065 0.0993** 0.0764* 0.0445** 0.0586** 0.0819* 0.2074* 0.0731*** -4.4258*** -2.4640*** -1.7969*** 0.0115 1.7356*** 2.2779*** 3.6328*** -0.0105
Japan 0.1924** 0.0823*** 0.0689*** 0.0486*** 0.0392** 0.0602** 0.0825 0.0643***
-4.7447*** -2.6034*** -1.7540*** 0.0699*** 1.6509*** 2.3391*** 4.3866*** 0.0079 Korea 0.2347** 0.0841*** 0.0687*** 0.0462*** 0.0685*** 0.0709*** 0.0287 0.0708***
-2.4876*** -1.2916*** -0.8811*** 0.0354*** 0.8814*** 1.3006*** 2.3157*** 0.0151 Malaysia 0.0631 0.0315** 0.0257** 0.0223*** 0.0381*** 0.0387** 0.0357 0.0241***
-3.8421*** -1.9076*** -1.3111*** 0.0075 1.4208*** 1.9273*** 3.0593*** 0.0311 Philippines 0.1604** 0.0626*** 0.0264** 0.0032 0.0169 0.0251 0.0030 0.0300***
-5.1357*** -2.5428*** -1.7297*** 0.0283** 1.7819*** 2.5088*** 4.3054*** 0.0180 Shanghai 0.1624* 0.0816** 0.0459** 0.0142*** 0.0198 0.0488*** 0.1853*** 0.0453***
-3.8649*** -2.4137*** -1.6182*** 0.0350* 1.5254*** 2.1210*** 3.8775*** -0.0098 0.0084 -0.0054 0.0182 -0.0264* -0.0679*** -0.0453 -0.0503 -0.0200 Taiwan
1 0.1979 0.1970*** 0.1180*** 0.0611*** 0.1164*** 0.1086 0.1443 0.0971***
Notes: ***, **, * denote statistical significance at the 1%, 5%, 10% levels, respectively.
11
Baur (2013) proposes that quantile regression can present asymmetric and non-linear dependence.
Moreover, the relationship between oil prices and US equities is asymmetric (Sim et al., 2015). Table 3
presents the calculations of extreme dependence levels between crude oil prices and the Asia-Pacific
stock markets. We find an asymmetric property in the upper and lower tails. For instance, in Australia,
the dependence between crude oil prices and stock returns in the lower tails is highly different from that
in the upper tails. Specifically, the extremal dependence is more significant in the lower tails than in the
upper tails. This finding is consistent with the research of Hu (2006), whose result indicates that the
dependence between financial markets is asymmetric and left-tailed. In the energy realm, Lee and Zeng
(2011) explore the asymmetric effect of oil price shocks on the real stock returns of G7 countries, and
this effect is similar to that found in the former study of Chang et al. (2010). The asymmetry of the
dependence indicates that policymakers and investors should take different measures in response to
different changes in oil prices under variational economic conditions.
Quantile regression in Table 3 comprehensively describes information about the dependence
between oil prices and stock market returns. We observe that the values of the parameter estimates at
the 0.5 quantile are close to those of the ordinary least squares regression. In addition, stock market
breaks have different impacts on the dependence between oil prices and stock returns across the four
regions with one or two breaks. The oil prices also affect the dependence to different degrees across the
regions without a break point. We are amazed to find that the extreme dependence parameter estimates
are more significant at low quantiles, which is consistent with the research of Zhu et al. (2016) and Hu
(2006). Hu argues that people paying more attention to negative news than positive news from other
markets results in the asymmetric and left-tailed dependence in financial markets. When crisis
approaches, investors all lose confidence in the future economy following a crisis and realise that bad
news will impact markets more widely (Wen et al., 2012;Basistha and Kurov, 2008). Another possible
reason for the asymmetry is that the herd effect is exacerbated during economic recession (Lao and
Singh, 2011). This explanation is consistent with the conclusion of Wen et al. (2012) that in a tranquil
period, passive market sentiment may cause dispersed market behavior to converge and be more
accordant. Consequently, the extreme dependence of crude oil prices and stock returns is greatly
increased in the lower tails. Policymakers and investors can consider crude oil prices as a vital
economic signal. It is necessary for policymakers and investors to give special attention to crude oil
prices and the Asia-Pacific stock markets during times of economic depression.
The extreme dependence between crude oil prices and stock returns is positive in the lower tail. In
other words, the stock index rises as the crude oil price increases during a recession. A small amount of
literature has affirmed this positive dependence. Kilian and Park (2009) explain the positive
dependence by making use of the business cycle theory. An unexpected global economic expansion,
contributing directly to the unanticipated rise in oil prices, stimulates the stock market. That is to say,
the expansionary shock brings the persistent positive effects of oil prices on stock markets. The
research of Narayan and Narayan (2010) indicates that oil price has a positive and statistically
significant effect on Vietnamese stock returns. Investors’ estimates of future stock market returns
depend on the expectation of oil price fluctuations. Therefore, crude oil prices have a positive effect on
China’s stock returns (Zhang and Chen, 2011). Li (2012) describes several factors causing the positive
12
dependence, including international and domestic events, alternative energy and a leverage effect
existing in stock markets. Hence, in bearish periods, a decrease in the WTI oil price will bring about a
fall in stock market returns. Zhu et al. (2014) show that the dependence between crude oil prices and
Asia-Pacific stock market returns is positive both before the global financial crisis and in the aftermath
of the crisis. The rapid economic growth in Asia-Pacific countries can immensely weaken the negative
effects of oil prices. Chen and Lv (2015) investigate the asymptotic dependence between the crude oil
market and the Chinese stock market and find a significantly positive extremal dependence. In
particular, the state-regulated oil pricing mechanism in countries such as China may lead to the positive
dependence. The aforementioned authors attribute the positive correlation to the co-movements of the
Chinese stock market, the world oil market and the global economic cycle. According to Zhu et al.
(2016), the benefits of diversification are reduced in a recession. In times of economic downturn, risk
diversification becomes less effective due to the increased dependence between oil spot prices and
stock returns. Our findings have significant implications. As an indicator of world economic
development, crude oil prices can be viewed as a vital index for investors and policymakers. Risk
managers can use it to measure risk more accurately. Portfolio managers should focus on the energy
markets when the world economy is deeply depressed. Specifically, when the oil price is rising during
tranquil periods, investors should augment the ratio of their investments in Asia-Pacific stock markets.
On the opposite side, investors should allocate less assets in stocks when the oil price is declining.
13
taus
oil
0.00
0.05
0.10
0.15
0.01 0.05 0.1 0.5 0.9 0.95 0.99
tausoil
0.00
0.05
0.10
0.15
0.20
0.25
0.01 0.05 0.1 0.5 0.9 0.95 0.99
taus
oil
0.00
0.05
0.10
0.15
0.20
0.25
0.01 0.05 0.1 0.5 0.9 0.95 0.99
taus
oil
0.00
0.02
0.04
0.06
0.08
0.10
0.01 0.05 0.1 0.5 0.9 0.95 0.99
Australia Japan Korea Malaysia
taus
oil
-0.2
-0.1
0.0
0.1
0.2
0.01 0.05 0.1 0.5 0.9 0.95 0.99
taus
break1
0.0
0.1
0.2
0.3
0.4
0.01 0.05 0.1 0.5 0.9 0.95 0.99
tausbreak2
-0.2
-0.1
0.0
0.1
0.2
0.3
0.01 0.05 0.1 0.5 0.9 0.95 0.99
taus
oil
0.00
0.05
0.10
0.15
0.20
0.01 0.05 0.1 0.5 0.9 0.95 0.99
Hong Kong(oil) Hong Kong(break1) Hong Kong(break2) Philippines

14
taus
oil
-0.2
-0.1
0.0
0.1
0.2
0.01 0.05 0.1 0.5 0.9 0.95 0.99
taus
break1
0.15
0.20
0.25
0.30
0.35
0.40
0.01 0.05 0.1 0.5 0.9 0.95 0.99
taus
break2
-0.2
0.0
0.2
0.4
0.01 0.05 0.1 0.5 0.9 0.95 0.99
taus
oil
0.00
0.05
0.10
0.15
0.20
0.01 0.05 0.1 0.5 0.9 0.95 0.99
India(oil) India(break1) India(break2) Shanghai
taus
oil
-0.15
-0.10
-0.05
0.00
0.05
0.10
0.01 0.05 0.1 0.5 0.9 0.95 0.99
taus
break1
0.0
0.1
0.2
0.3
0.4
0.01 0.05 0.1 0.5 0.9 0.95 0.99
taus
oil
-0.10
-0.05
0.00
0.05
0.01 0.05 0.1 0.5 0.9 0.95 0.99
taus
break1
0.05
0.10
0.15
0.20
0.25
0.30
0.01 0.05 0.1 0.5 0.9 0.95 0.99
Indonesia(oil) Indonesia(break1) Taiwan(oil) Taiwan (break1)
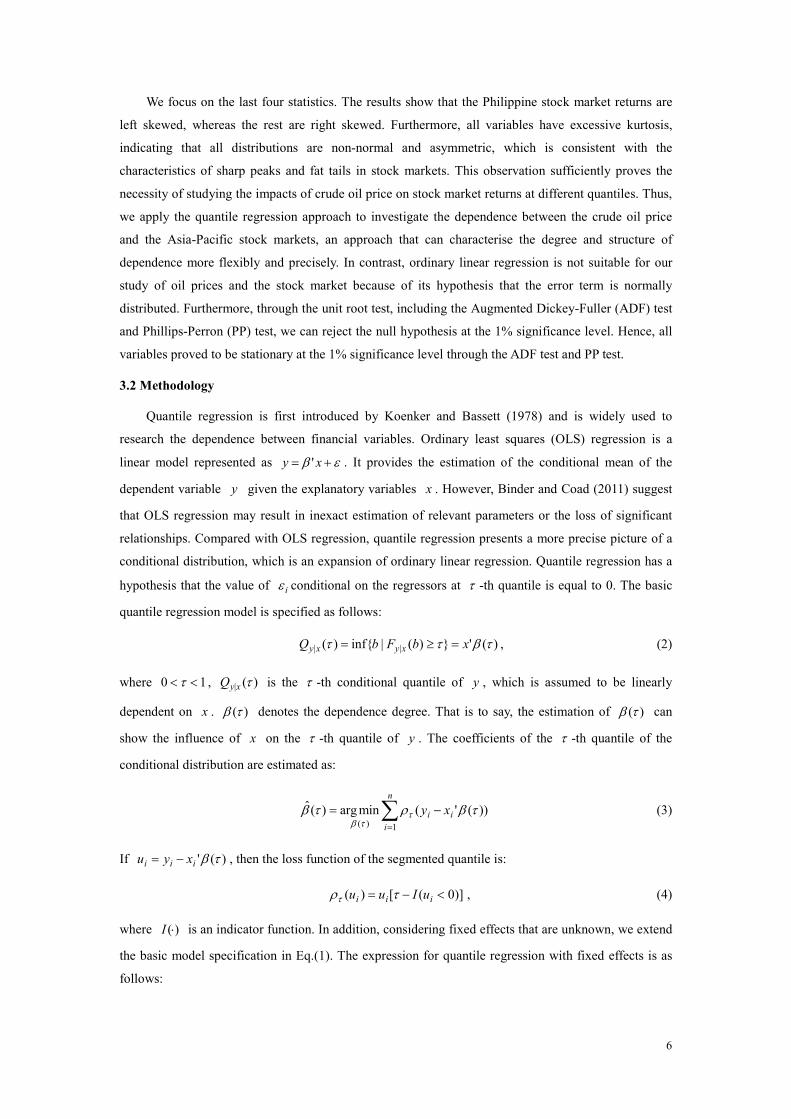
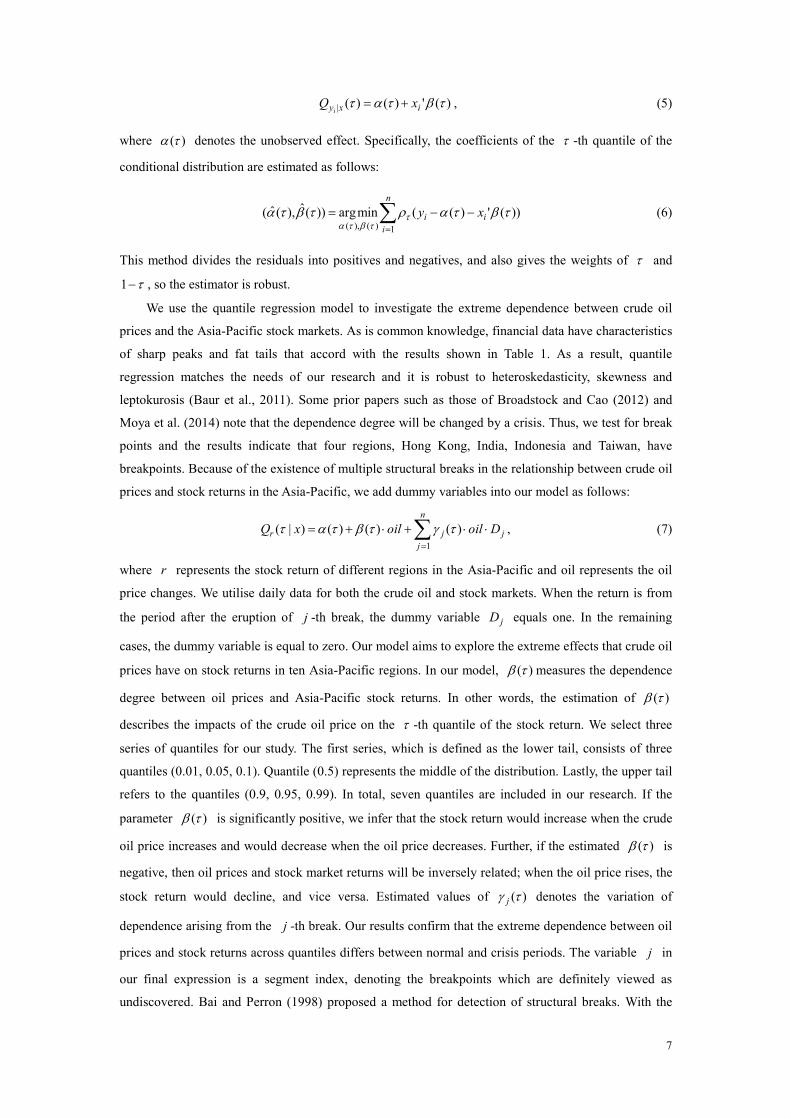
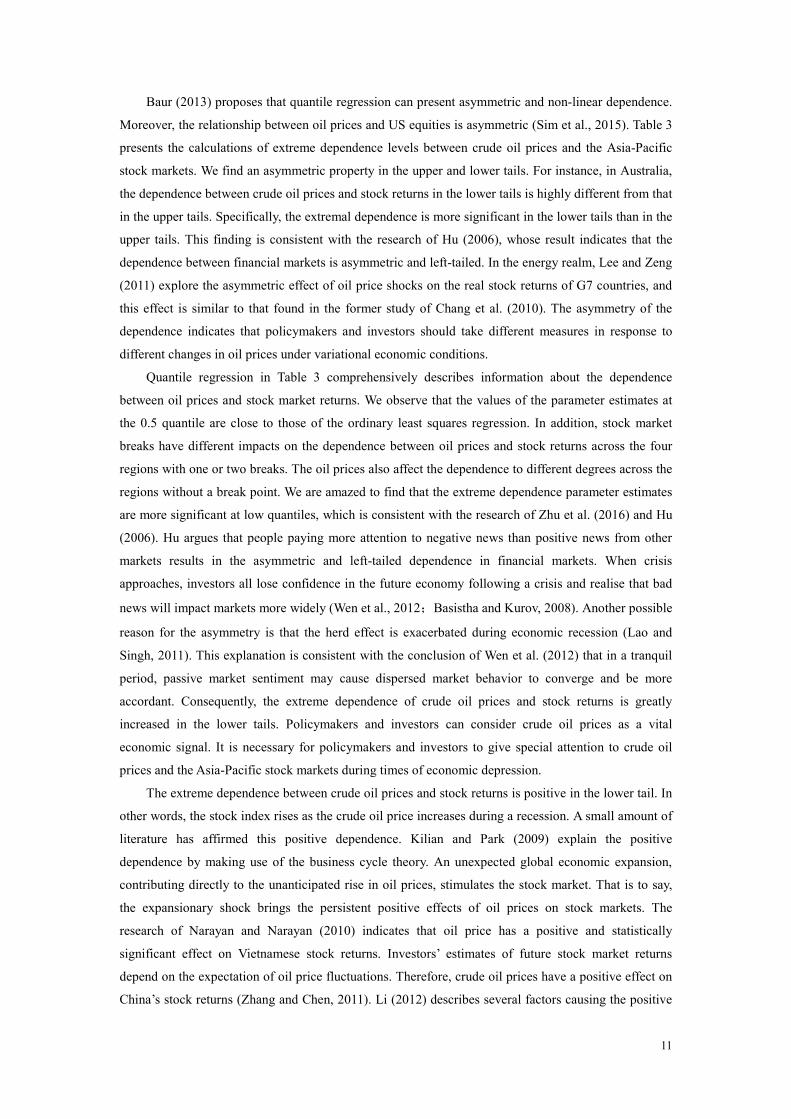
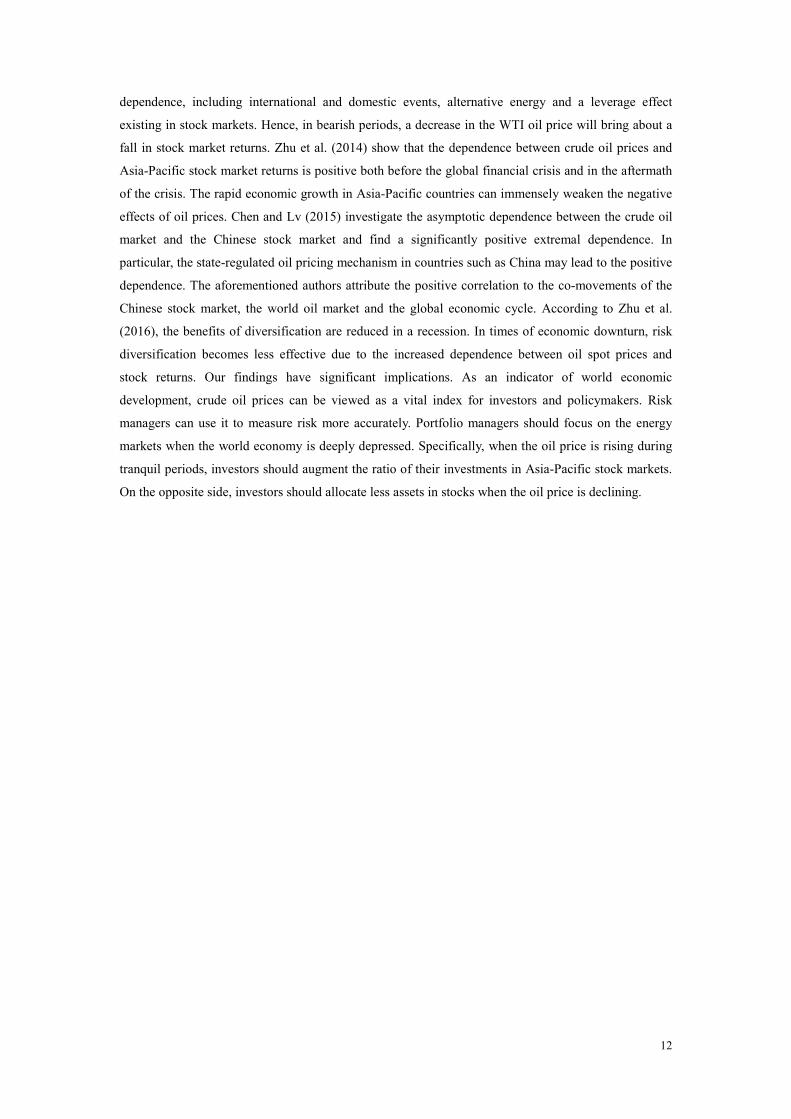
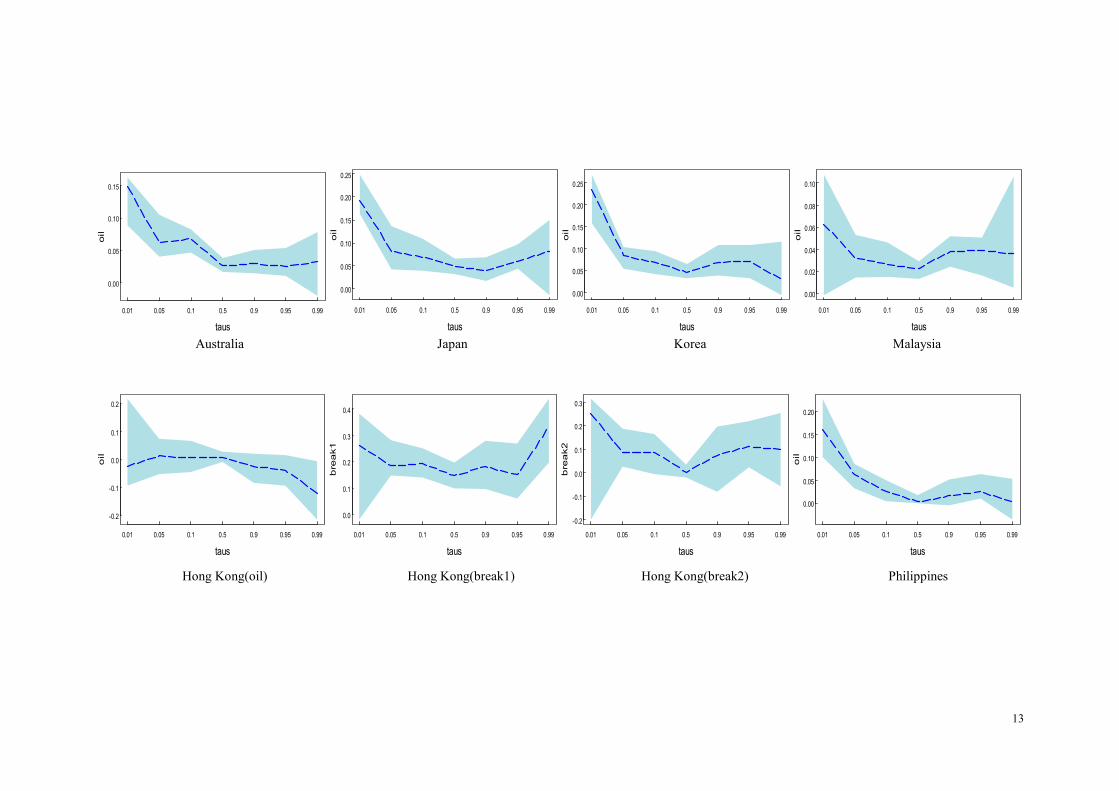
Fig. 1. Dynamic trace of quantile regression coefficients; vertical axes depict coefficient estimates of variables over the stock return distributions; horizontal axes show the
quantiles of the dependent variables; quantile regression error bars correspond to bootstrapped 95% confidence intervals.

15
In Fig. 1, we vividly describe bootstrapped coefficient estimates for the stock market return
distribution of each country with 95% confidence intervals (in shaded area). Fig. 1 presents dynamic
estimates of quantile regression coefficients. Because of the estimation results for different quantiles
from the quantile regression model, a richer picture of the dependence between crude oil prices and
stock markets can be observed. Specifically, estimated coefficients for each stock market vary as
varies. Dynamic traces present heterogeneity and asymmetric effects in the conditional distribution of
different stock market returns. The dependence degree between oil prices and stock returns and changes
to it caused by breaks are not consistent across different percentiles.
5. Conclusions
The degree and structure of dependence between crude oil prices and stock markets is an attractive
topic. Much research on this issue has been conducted in relation to the US and some developed
European countries. However, few studies have explored developing countries, especially in the
Asia-Pacific region. Crude oil consumption in the Asia Pacific region accounted for 34.7% of total
world consumption in 2015 and has been increasing yearly. Hence, we examine the extreme
dependence between crude oil prices and stock returns in the Asia-Pacific.
In this paper, we employ the quantile regression model with multiple structural breaks to study the
dependence between oil prices and stock returns in Asia-Pacific regions from January 4th, 2000 to July
4th, 2016. Our findings show the asymmetric and heterogeneous dependence between the two financial
variables, which suggests that investors and decision makers should take different measures in response
to different economic conditions. The dependence degree between stock returns and oil prices is
significantly increased after a break, and therefore we argue that investors should regard oil prices as an
investment signal, especially during a crisis period, because of the strong dependence between the
stock indices and oil prices. Our results indicate that the extreme dependence between crude oil prices
and stock returns is positive in the lower tail. That is to say, an increase in crude oil prices would cause
stock returns to increase during a recession. This positive relationship can help investors to adjust the
structure of their investment portfolios when the market changes. Specifically, if the oil price is rising,
investors should increase the ratio of their investments in Asia-Pacific stock markets during a down
economy. On the opposite side, it is suggested that investors hold a smaller ratio of assets in stocks
when the oil price is declining. Because of the strong dependence that exists on the downside,
measuring the dependence has significant implications for policymakers, risk managers and investors.
Acknowledgements
This research is partially supported by the National Natural Science Foundation of China under
grants No. 71521061, No. 71431008, and No.71671062.

16
References
Ajmi, A.N., El-montasser, G., Hammoudeh, S., Nguyen, D.K., 2014. Oil prices and MENA stock
markets: new evidence from nonlinear and asymmetric causalities during and after the crisis period.
Applied Economics. 46, 2167–2177.
URL: http://www.tandfonline.com/doi/abs/10.1080/00036846.2014.896987
Andrews, D. W. K., 1993. Tests for parameter instability and structural change with unknown change
point. Econometrica. 61(4), 821-56.
URL: http://www.jstor.org/stable/2951764?origin=crossref&seq=1#page_scan_tab_contents
Andrews, D. W. K., Ploberger, W., 1994. Optimal tests when a nuisance parameter is present only
under the alternative. Econometrica. 62(6), 1383-1414.
URL: http://www.jstor.org/stable/2951753?origin=crossref&seq=1#page_scan_tab_contents
Andrews, D.W., Lee, I., Ploberger, W., 1996. Optimal changepoint tests for normal linear regression.
Journal of Econometrics. 70, 9-38.
URL: http://www.sciencedirect.com/science/article/pii/0304407694016828
Apergis, N., Miller, S., 2009. Do structural oil-market shocks affect stock prices?. Energy Economics.
31(4), 569–575.
URL:http://digitalcommons.uconn.edu/econ_wpapers/200851/?utm_source=digitalcommons.uconn.edu
%2Fecon_wpapers%2F200851&utm_medium=PDF&utm_campaign=PDFCoverPages
Arouri, M., Rault, C., 2012. Oil prices and stock markets in GCC countries: Empirical evidence from
panel analysis. International Journal of Finance and Economics. 17(3), 242–253.
URL: http://onlinelibrary.wiley.com/doi/10.1002/ijfe.443/abstract
Bai, J., Perron, P., 2003. Computation and analysis of multiple structural change models. Journal of
Applied Econometrics. 18(1), 1–22.
URL:http://www.columbia.edu/~jb3064/papers/2003_Computation_and_analysis_of_multiple_structur
al_changes.pdf
Bai, J., Perron, P., 1998. Estimating and Testing Linear Models with Multiple Structural Changes.
Econometrica. 66, 47–78.
URL: http://www.econ.nyu.edu/user/baij/econometrica98.pdf
Basher, S., Sadorsky, P., 2006. Oil price risk and emerging stock markets. Global Finance Journal.
17(2), 224–251.
URL: http://www.sciencedirect.com/science/article/pii/S1044028306000469
Basistha, A., Kurov, A., 2008. Macroeconomic cycles and the stock market’s reaction to monetary
policy. Journal of Banking & Finance. 32(12), 2606-2616.
URL: http://www.sciencedirect.com/science/article/pii/S0378426608001040
Bassett, G., Chen, H., 2001. Portfolio Style: Return-Based Attribution Using Regression Quantiles.
Empirical Economics. 26, 293-305.
URL: http://gib.people.uic.edu/QuanSty4.pdf
Baur, D. G., 2013. The structure and degree of dependence: A quantile regression approach. Journal of
Banking & Finance. 37, 786-798.

17
URL: http://www.sciencedirect.com/science/article/pii/S0378426612003263
Baur, D. G., Dimpfl, T., Jung, R. C., 2012. Stock return autocorrelations revisited: A quantile regression
approach. Journal of Empirical Finance. 19(2), 254-265.
URL: http://www.sciencedirect.com/science/article/pii/S0927539811000971
Baur, D., Schulze, N., 2005. Coexceedances in financial markets—a quantile regression analysis of
contagion. Emerging Markets Review. 6(1), 21-43.
URL: http://www.sciencedirect.com/science/article/pii/S1566014104000731
Bhar, R., Nikolova, B., 2009. Oil Prices and Equity Returns in the BRIC Countries. World Economy.
32(7), 1036-1054.
URL: http://onlinelibrary.wiley.com/doi/10.1111/j.1467-9701.2009.01194.x/full
Binder, M., Coad, A., 2011. From Average Joe's happiness to Miserable Jane and Cheerful John: using
quantile regressions to analyze the full subjective well-being distribution. Journal of Economic
Behavior & Organization. 79, 275–290.
URL: http://www.sciencedirect.com/science/article/pii/S0167268111000692
Broadstock, D. C., Cao, H., Zhang, D., 2012. Oil shocks and their impact on energy related stocks in
China. Energy Economics. 34(6), 1888–1895.
URL: http://www.sciencedirect.com/science/article/pii/S0140988312001788
Chang, C. L., Mcaleer, M., Tansuchat, R., 2010. Analyzing and forecasting volatility spillovers,
asymmetries and hedging in major oil markets. Energy Economics. 32(6), 1445-1455.
URL: http://www.sciencedirect.com/science/article/pii/S0140988310000708
Chen, N. F., Roll, R., Ross, S. A., 1986. Economic Forces and the Stock Market. Journal of Business.
59(3), 383-403.
URL:http://rady.ucsd.edu/faculty/directory/valkanov/pub/classes/mfe/docs/ChenRollRoss_JB_1986.pdf
Chen, Q., Lv, X., 2015. The extreme-value dependence between the crude oil price and Chinese stock
markets. International Review of Economics & Finance. 39, 121-132.
URL: http://www.sciencedirect.com/science/article/pii/S1059056015000593
Chen, S. S., 2010. Do higher oil prices push the stock market into bear territory?. Energy Economics.
32(2), 490-495.
URL: http://www.sciencedirect.com/science/article/pii/S0140988309001534
Chuang, C. C., Kuan, C. M., Lin, H. Y., 2009. Causality in quantiles and dynamic stock return–volume
relations. Journal of Banking & Finance. 33(7), 1351-1360.
URL: http://www.sciencedirect.com/science/article/pii/S0378426609000235
Cong, R.G., Wei, Y.M., Jiao, J.L., et al., 2008. Relationships between oil price shocks and stock market:
An empirical analysis from China. Energy Policy. 36(9), 3544–3553.
URL: http://www.sciencedirect.com/science/article/pii/S030142150800284X
El-Sharif, I., Brown, D., Nixon, B., Russel, A., 2005. Evidence on the nature and extent of the
relationship between oil prices and equity values in the UK. Energy Economics. 27(6), 819–930.
URL: http://www.sciencedirect.com/science/article/pii/S0140988305000836
Faff, R., Brailsford, T., 1999. Oil price risk and the Australian stock market. Journal of Energy Finance
and Development. 4(1), 69–87.
18
URL: http://www.sciencedirect.com/science/article/pii/S1085744399000058
Guo, F., Chen, C. R., Huang, Y. S., 2011. Markets contagion during financial crisis: A regime-switching
approach. International Review of Economics & Finance. 20(1), 95-109.
URL: http://www.sciencedirect.com/science/article/pii/S1059056010000523
Hamilton, J. D., 1983. Oil and the macroeconomy since World War II. Journal of Political Economy.
91(2), 228-48.
URL: http://digidownload.libero.it/rocco.mosconi/Hamilton1983.pdf
Hamilton, J. D., 2009. Causes and Consequences of the Oil Shock of 2007–08. Brookings Papers on
Economic Activity. 2009(1 (Spring)), 215-283.
URL: https://www.brookings.edu/wp-content/uploads/2016/07/2009a_bpea_hamilton-1.pdf
Hammoudeh, S., Choi, K., 2007. Characteristics of permanent and transitory returns in oil-sensitive
emerging stock markets: The case of GCC countries. Journal of International Financial Markets
Institutions and Money. 17(3), 231–245.
URL: http://www.sciencedirect.com/science/article/pii/S1042443105000958
Hammoudeh, S., Li, H., 2005. Oil sensitivity and systematic risk in oil-sensitive stock indices. Journal
of Economics and Business. 57(1), 1–21.
URL: http://www.sciencedirect.com/science/article/pii/S0148619504000748
Hu, L., 2006. Dependence patterns across financial markets: a mixed copula approach. Applied
Financial Economics. 16(10), 717-729.
URL: http://www.tandfonline.com/doi/abs/10.1080/09603100500426515
Huang, R., Masulis, R., Stoll, H., 1996. Energy shocks and financial markets. Journal of Futures
Markets. 16(1), 1–27.
URL:http://onlinelibrary.wiley.com/doi/10.1002/(SICI)1096-9934(199602)16:1%3C1::AID-FUT1%3E
3.0.CO;2-Q/abstract
Jain, A., Biswal, P. C., 2016. Dynamic linkages among oil price, gold price, exchange rate, and stock
market in India. Resources Policy. 49, 179-185.
URL: http://www.sciencedirect.com/science/article/pii/S0301420716301374
Kling, J. L., 1985. Oil price shocks and stock market behavior. Journal of Portfolio Management. 12,
34-39.
URL: http://www.iijournals.com/doi/abs/10.3905/jpm.1985.409034
Jones, C., Kaul, G., 1996. Oil and the stock markets. The Journal of Finance. 51(2), 463–491.
URL: http://onlinelibrary.wiley.com/doi/10.1111/j.1540-6261.1996.tb02691.x/abstract
Kang, W., Ratti, R. A., Vespignani, J., 2016. The impact of oil price shocks on the U.S. stock market: A
note on the roles of U.S. and non-U.S. oil production. Economics Letters. 145, 176-181.
URL: http://www.sciencedirect.com/science/article/pii/S0165176516302105
Kilian, L., & Park, C., 2009. The impact of oil price shocks on the U.S. stock market. International
Economic Review. 50(4), 1267–1287.
URL: http://onlinelibrary.wiley.com/doi/10.1111/j.1468-2354.2009.00568.x/abstract
Koenker, R., 2004. Quantile regression for longitudinal data. Journal of Multivariate Analysis. 91(1),
74-89.
19
URL: http://www.sciencedirect.com/science/article/pii/S0047259X04001113
Koenker, R., Bassett, G., 1978. Regression quantiles. Econometrica. 46(1), 33-50.
URL: http://web.stanford.edu/~doubleh/otherpapers/koenker.pdf
Koh, W. C., 2016. How do oil supply and demand shocks affect Asian stock markets?.
Macroeconomics & Finance in Emerging Market Economies. 2016, 1-18.
URL: http://www.tandfonline.com/doi/full/10.1080/17520843.2015.1135819
Lao, P., Singh, H., 2011. Herding behaviour in the Chinese and Indian stock markets. Journal of Asian
Economics. 22(6), 495-506.
URL: http://www.sciencedirect.com/science/article/pii/S1049007811000777
Le, T. H., 2015. Do Soaring Global Oil Prices Heat up the Housing Market? Evidence from Malaysia.
Economics-The Open-Access, Open-Assessment E-Journal. 9 (2015-27): 1-30.
URL: http://www.economics-ejournal.org/economics/journalarticles/2015-27
Lee, B. S., Ryu, D., 2013. Stock Returns and Implied Volatility: A New VAR Approach.
Economics-The Open-Access, Open-Assessment E-Journal. 7 (2013-3): 1-20.
URL: http://www.economics-ejournal.org/economics/journalarticles/2013-3
Lee, B.J., Yang, C.W., Huang, B.N., 2012. Oil price movements and stock markets revisited: A case of
sector stock price indexes in the G-7 countries. Energy Economics. 34, 1284–1300.
URL: http://www.sciencedirect.com/science/article/pii/S0140988312001107
Lee, C. C., Zeng, J. H., 2011. The impact of oil price shocks on stock market activities: Asymmetric
effect with quantile regression. Mathematics & Computers in Simulation. 81(9), 1910-1920.
URL: http://www.sciencedirect.com/science/article/pii/S0378475411000838
Li, S.F., Zhu, H.M., Yu, K., 2012. Oil prices and stock market in China: A sector analysis using panel
cointegration with multiple breaks. Energy Economics. 34(6), 1951–1958.
URL: http://www.sciencedirect.com/science/article/pii/S0140988312001971
Lin, H. Y., 2013. Dynamic Stock Return-Volume Relation: Evidence from Emerging Asian Markets.
Bulletin of Economic Research. 65(65), 178-193.
URL: http://onlinelibrary.wiley.com/doi/10.1111/j.1467-8586.2011.00428.x/epdf
Maghyereh, A., 2004. Oil Price Shocks and Emerging Stock Markets: A Generalized VAR Approach.
International Journal of Applied Econometrics and Quantitative Studies. 1(2), 27-40.
URL: http://www.usc.es/economet/reviews/ijaeqs122.pdf
Mensi, W., Hammoudeh, S., Reboredo, J. C., et al., 2014. Do global factors impact BRICS stock
markets? A quantile regression approach. Emerging Markets Review. 19(2), 1–17.
URL: http://www.sciencedirect.com/science/article/pii/S156601411400017X
Miller, J.I., Ratti, R., 2009. Crude oil and stock markets: stability, instability and bubbles. Energy
Economics. 31(4), 559–568.
URL: http://www.sciencedirect.com/science/article/pii/S0140988309000206
Moya-Martínez, P., Ferrer-Lapeña, R., Escribano-Sotos, F., 2014. Oil price risk in the Spanish stock
market: An industry perspective. Economic Modelling. 37(574), 280-290.
URL: http://www.sciencedirect.com/science/article/pii/S0264999313004975
Nandha, M., Faff, R., 2008. Does oil move equity prices? A global view. Energy Economics. 30(3),

20
986–997.
URL: http://www.sciencedirect.com/science/article/pii/S0140988307001132
Nandha, M., Hammoudeh, S., 2007. Systematic risk, and oil price and exchange rate sensitivities in
Asia-Pacific stock markets. Research in International Business & Finance. 21(2), 326-341.
URL: http://www.sciencedirect.com/science/article/pii/S0275531906000481
Narayan, P. K., Narayan, S., 2010. Modelling the impact of oil prices on Vietnam's stock prices.
Applied energy. 87(1), 356–361.
URL: http://www.sciencedirect.com/science/article/pii/S0306261909002323
Papapetrou, E., 2001. Oil price shocks, stock market, economic activity and employment in Greece.
Energy Economics. 23, 511–532.
URL: http://www.sciencedirect.com/science/article/pii/S0140988301000780
Raheman, A., Sohail, M. K., Noreen, U., et al., 2012. Oil Prices Fluctuations and Stock Returns-A
Study on Asia Pacific Countries. American Journal of Scientific Research. 43(2012), 97-106.
URL: http://s3.amazonaws.com/zanran_storage/www.eurojournals.com/ContentPages/2541063454.pdf
Sadorsky, P., 1999. Oil price shocks and stock market activity. Energy Economics. 21(5), 449–469.
URL: http://www.sciencedirect.com/science/article/pii/S0140988399000201
Sadorsky, P., 2001. Risk factors in stocks returns of Canadian oil and gas companies. Energy
Economics. 23(1), 17–28.
URL: http://www.sciencedirect.com/science/article/pii/S0140988300000724
Silva, P. P., Rebelo, P., Afonso, C., 2014. Tail dependence of financial stocks and CDS markets:
Evidence using copula methods and simulation-based inference. Economics-The Open-Access,
Open-Assessment E-Journal. 8 (2014-39): 1-27.
URL: http://www.economics-ejournal.org/economics/journalarticles/2014-39
Sim, N., Zhou, H., 2015. Oil prices, US stock return, and the dependence between their quantiles.
Journal of Banking & Finance. 55, 1-8.
URL: http://www.sciencedirect.com/science/article/pii/S0378426615000217
Sukcharoen, K., Zohrabyan, T., Leatham, D., et al., 2014. Interdependence of oil prices and stock
market indices: A copula approach. Energy Economics. 44(C), 331-339.
URL: http://www.sciencedirect.com/science/article/pii/S0140988314000966
Wen, X., Wei, Y., Huang, D., 2012. Measuring contagion between energy market and stock market
during financial crisis: A copula approach. Energy Economics, 34(5), 1435-1446.
URL: http://www.sciencedirect.com/science/article/pii/S0140988312001302
Zhang, C., Chen, X., 2011. The impact of global oil price shocks on China’s stock returns: Evidence
from the ARJI(-ht)-EGARCH model. Energy. 36(11), 6627-6633.
URL: http://www.sciencedirect.com/science/article/pii/S0360544211005925
Zhang, Y. J., Wei, Y. M., 2011. The dynamic influence of advanced stock market risk on international
crude oil returns: an empirical analysis. Quantitative Finance. 11(7), 967-978.
URL: http://www.tandfonline.com/doi/full/10.1080/14697688.2010.538712
Zhu, H. M., Li, R., Li, S., 2014. Modelling dynamic dependence between crude oil prices and
Asia-Pacific stock market returns. International Review of Economics & Finance. 29(1), 208–223.
21
URL: http://www.sciencedirect.com/science/article/pii/S1059056013000506
Zhu, H., Guo, Y., You, W., 2015. An empirical research of crude oil price changes and stock market in
China: evidence from the structural breaks and quantile regression. Applied Economics. 47(56),
6055-6074.
URL: http://www.tandfonline.com/doi/full/10.1080/00036846.2015.1064076
Zhu, H., Guo, Y., You, W., et al., 2016. The heterogeneity dependence between crude oil price changes
and industry stock market returns in China: Evidence from a quantile regression approach. Energy
Economics. 55, 30-41.
URL: http://www.sciencedirect.com/science/article/pii/S0140988316000463
Please note:
You are most sincerely encouraged to participate in the open assessment of this discussion paper. You can do so by either recommending the paper or by posting your comments.
Please go to:
http://www.economics-ejournal.org/economics/discussionpapers/2016-46
The Editor
© Author(s) 2016. Licensed under the Creative Commons Attribution 3.0.