monthly report on indigenous crude oil - production, import ...
11
Page 1 of 11 Monthly report on indigenous crude oil production, import & processing and production, import & export of petroleum products in the country www.PPAC.gov.in MONTHLY REPORT ON INDIGENOUS CRUDE OIL PRODUCTION, IMPORT AND PROCESSING & PRODUCTION, I MPORT AND EXPORT OF PETROLEUM PRODUCTS July 2020 Petroleum Planning & Analysis Cell (Ministry of Petroleum & Natural Gas)
-
Upload
khangminh22 -
Category
Documents
-
view
0 -
download
0
Transcript of monthly report on indigenous crude oil - production, import ...

Page 1 of 11 Monthly report on indigenous crude oil production, import & processing and production, import & export of petroleum products in the country www.PPAC.gov.in
MONTHLY REPORT ON INDIGENOUS CRUDE OIL
PRODUCTION, IMPORT AND PROCESSING
&
PRODUCTION, IMPORT AND EXPORT OF PETROLEUM
PRODUCTS
July 2020
Petroleum Planning & Analysis Cell
(Ministry of Petroleum & Natural Gas)

Page 2 of 11 Monthly report on indigenous crude oil production, import & processing and production, import & export of petroleum products in the country www.PPAC.gov.in
1. In this monthly report, indigenous crude oil production, imports and processing as
well as production and imports/exports of petroleum products by oil companies are
analyzed to assess the domestic availability of petroleum products in the country.
Highlights
• Indigenous crude oil and condensate production during July 2020 and April – July 2020
was lower by 4.9% and 6.1% respectively as compared to the corresponding period of the
previous year.
• Crude oil processed in refineries during July 2020 was 17.7 MMT, which was 18.8% lower
than July 2019. On cumulative basis total crude oil processed was 66.3 MMT which was
lower by 21.3% during April – July 2020 as compared to April – July 2019.
• Production of petroleum products saw a de-growth of 13.9% and 17.1% respectively
during July 2020 and April – July 2020 over the corresponding period of the previous year.
• Crude oil imports decreased by 36.5% and 23.6% during July 2020 and April - July 2020
respectively as compared to the corresponding period of the previous year.
• POL products imports increased by 46.2% and 7.9% during July 2020 and April - July 2020
respectively as compared to the corresponding period of the previous year. Increase in
POL products imports during April - July 2020 was due to increase in imports of LPG, Fuel
Oil (FO) and Bitumen.
• Exports of POL products decreased by 22.7% during July 2020 and increased by 2.7%
during April - July 2020 as compared to the corresponding period of the previous year.
Increase in POL products exports during April - July 2020 was due to increase in exports
of high-speed diesel (HSD), fuel oil, petcoke/CBFS and LOBS/lube oil etc.

Page 3 of 11 Monthly report on indigenous crude oil production, import & processing and production, import & export of petroleum products in the country www.PPAC.gov.in

Page 4 of 11 Monthly report on indigenous crude oil production, import & processing and production, import & export of petroleum products in the country www.PPAC.gov.in
2. Indigenous crude oil and condensate production
• The percentage share of PSU upstream companies and PSC fields in overall crude oil
and condensate production during April – July 2020 (P) is shown in figure-1 below:
Figure-1; Percentage share in crude oil and condensate production; April – July 2020 (P)
• The comparison of percentage share of ONGC, OIL and PSC fields in total crude oil
and condensate production during April – July 2020 and April – July 2019 is shown
in figure-2 below:
75.7
24.3
PSU PSC Fields
9.8
62.6
27.6
2019-20
9.7
66
24.3
2020-21(P)
OIL
ONGC
PSC FIELDS
Figure-2; Percentage share in crude oil production; April – July
Page 5 of 11 Monthly report on indigenous crude oil production, import & processing and production, import & export of petroleum products in the country www.PPAC.gov.in
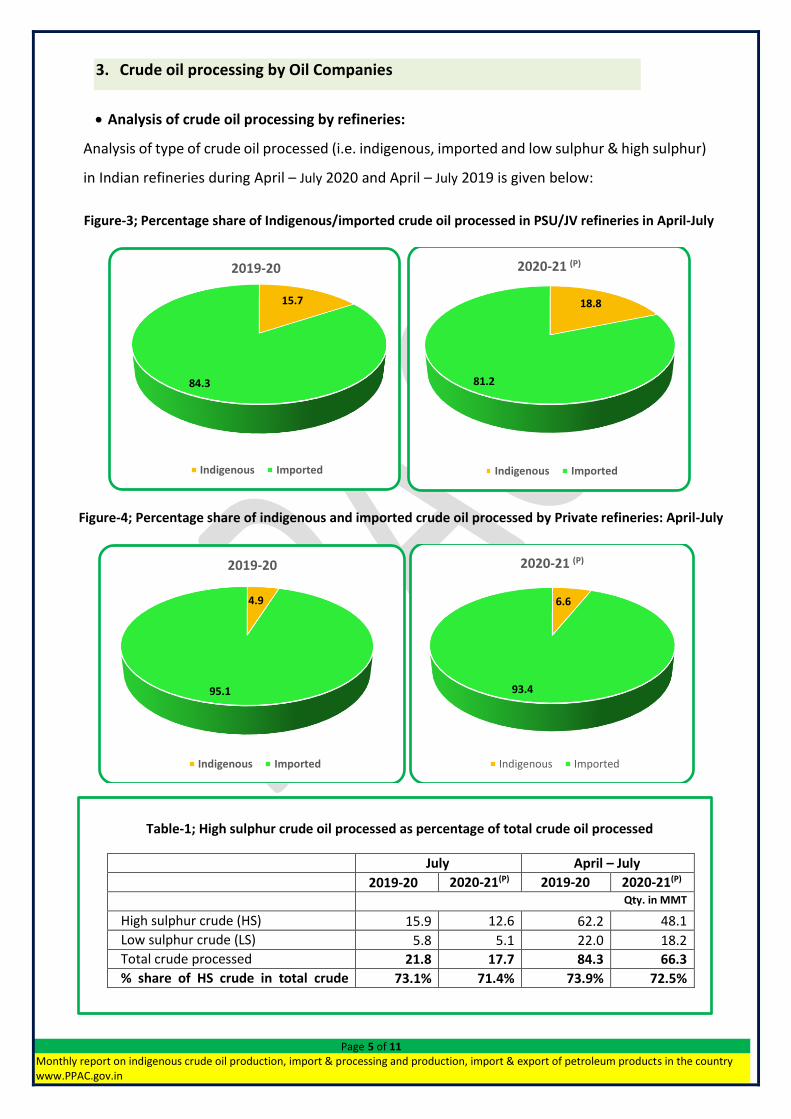
3. Crude oil processing by Oil Companies
• Analysis of crude oil processing by refineries:
Analysis of type of crude oil processed (i.e. indigenous, imported and low sulphur & high sulphur)
in Indian refineries during April – July 2020 and April – July 2019 is given below:
Figure-3; Percentage share of Indigenous/imported crude oil processed in PSU/JV refineries in April-July
Figure-4; Percentage share of indigenous and imported crude oil processed by Private refineries: April-July
15.7
84.3
2019-20
Indigenous Imported
18.8
81.2
2020-21 (P)
Indigenous Imported
4.9
95.1
2019-20
Indigenous Imported
6.6
93.4
2020-21 (P)
Indigenous Imported
Table-1; High sulphur crude oil processed as percentage of total crude oil processed
July April – July 2019-20 2020-21(P) 2019-20 2020-21(P) Qty. in MMT
High sulphur crude (HS) 15.9 12.6 62.2 48.1
Low sulphur crude (LS) 5.8 5.1 22.0 18.2
Total crude processed 21.8 17.7 84.3 66.3
% share of HS crude in total crude processed
73.1% 71.4% 73.9% 72.5%

Page 6 of 11 Monthly report on indigenous crude oil production, import & processing and production, import & export of petroleum products in the country www.PPAC.gov.in
4. Production of Petroleum Products
Details of production of petroleum products by refineries and fractionators during July
2020(P) are given in Table-2.
Table-2; Production of petroleum products
(Thousand Metric Tonnes)
Products July 2020 (P)
LPG 948
Naphtha 1508
MS 2918
ATF 467
SKO 261
HSD 8532
LDO 75
Lubes 94
FO 651
LSHS 25
Bitumen 281
RPC (Pet-coke) 1013
Others 2615
Total 19387 Note: (P): Provisional. Source: Oil Companies * Others include products like Propylene, solvents (Hexane, Benzene, Toluene, Xylene and Specialty
solvents), Reformate, Mineral Turpentine Oil, Carbon Black Feedstock, Waxes, Sulphur etc.
LPG: Liquefied petroleum gas, MS: Motor spirit, ATF: Aviation turbine fuel; SKO: Superior kerosene oil, HSD: High speed diesel;
Figure-5; Product wise production of POL products by refineries and fractionators: April – July 2020 (P)
3.8
10.2
5.9
1.7
0.9
30.5
0.2
0.3
3.0
1.2
4.0
9.7
0.0 5.0 10.0 15.0 20.0 25.0 30.0 35.0
LPG
MS
NAPHTHA
ATF
SKO
HSD
LDO
LUBES
FO/LSHS
BITUMEN
PET COKE
OTHERS
Production of petroleum product 2020-21(P)
MMT

Page 7 of 11 Monthly report on indigenous crude oil production, import & processing and production, import & export of petroleum products in the country www.PPAC.gov.in
The percentage share of various products in total POL production during April – July 2020
is shown in figure-6 below:
Figure-6; Percentage share of POL products in production; April - July 2020 (P)
LPG, 5.4
NAPHTHA, 8.3
MS , 14.3
ATF, 2.4
SKO, 1.2
HSD , 42.8
LDO, 0.3
LUBES, 0.4
FO/LSHS, 4.2
BITUMEN, 1.7
PETCOKE, 5.6
OTHERS, 13.5

Page 8 of 11 Monthly report on indigenous crude oil production, import & processing and production, import & export of petroleum products in the country www.PPAC.gov.in

Page 9 of 11 Monthly report on indigenous crude oil production, import & processing and production, import & export of petroleum products in the country www.PPAC.gov.in
5.a Import of Crude oil
Details of import of crude oil given in Table-3 below:
Table-3; Import of Crude oil
(Thousand Metric Tonnes)
Import July(P) April - July(P)
CRUDE OIL 12336 57172
• Crude oil imports decreased by 36.5% and 23.6% during July 2020 and April
- July 2020 respectively as compared to the corresponding period of the
previous year.
• Crude oil imports from OPEC countries decreased to 73.9% of total imports
during April to July 2020 as compared to 78.0% during April to July 2019.
Africa, 11.7Asia, 1.7
Eurasia, 5.4
Middle East, 61.6
North America, 13.2
South America, 6.3
Figure 7: Region wise percentage share(%) of crude oi l dur ing Apr i l to July 2020 (P)

Page 10 of 11 Monthly report on indigenous crude oil production, import & processing and production, import & export of petroleum products in the country www.PPAC.gov.in
5.b Import Petroleum Products
Details of import of petroleum products given in Table-4 below:
• Imports made due to deficit in production viz. LPG and Lubes/LOBS accounted for 40.6% share of total POL products import during April – July 2020 as compared to 37.3% during April – July 2019.
• Import of petcoke accounted for 23.6% of the total POL imports during April – July 2020. The entire quantity was imported by private importers and mainly by cement industry.
LPG, 35.3
MS, 0.5
NAPHTHA, 3.5
ATF, 0.00
HSD, 2.1LOBS/ LUBE OIL, 5.3FUEL OIL, 18.8
BITUMEN, 3.7
PETCOKE, 23.6
OTHERS, 7.3
Figure 8: Percentage share of petroleum products in imports: Apr i l to July 2020 (P)
Table-4; Import of Petroleum products
(Thousand Metric Tonnes)
Product July(P) April - July(P) LPG 998 5104
MS/ Petrol 38 73
NAPHTHA 132 499
ATF 0 0
HSD 138 299
LOBS/LUBE OIL 193 764
FUEL OIL 1222 2714
BITUMEN 135 541
PETCOKE 854 3415
OTHERS$ 360 1049
TOTAL IMPORTS 4069 14457
"Notes: (P): Provisional. Source: Oil Companies & DGCIS
# April – July 2020 private import (POL) quantity prorated on the basis of April 2019 – March 2020 actual data provided by DGCIS.
$ Others include SKO, Paraffin wax, Petroleum Jelly, Aviation Gas, MTBE, Reformate etc.

Page 11 of 11 Monthly report on indigenous crude oil production, import & processing and production, import & export of petroleum products in the country www.PPAC.gov.in
5.c Export of Petroleum Products
Details of export of petroleum products given in Table-5 below:
• Exports of POL products decreased by 22.7% during July 2020 and increased by 2.7%
during April - July 2020 as compared to the corresponding period of the previous year.
Increase in POL products exports during April - July 2020 was due to increase in exports
of high-speed diesel (HSD), fuel oil, petcoke/CBFS and LOBS/lube oil etc.
LPG, 0.6
MS, 20.1NAPHTHA, 10.3
ATF, 6.1
SKO, 0.01
HSD, 51.4 LOBS/ LUBE OIL, 0.1
FUEL OIL, 3.2
PET COKE/CBFS, 2.8OTHERS, 5.5
Figure 9: Percentage share of petroleum products in export: April to July 2020 (P)
Table-5 Export of major Petroleum products
(Thousand Metric Tonnes)
Product July(P) April - July(P) LPG 31 129
MS 1012 4038
Naphtha 299 2064
ATF 225 1223
SKO 2 2
HSD 2058 10341
LDO 0 0
LOBS/LUBE OIL 3 11
FUEL OIL 78 642
BITUMEN 0 0
PETCOKE 54 562
VGO 0 0
OTHERS# 159 1109
TOTAL EXPORT 3921 20122
Note: (P): Provisional. Source: Oil Companies # Other include Benzene, Hexane, MTO, Paraffin wax, Polypropylene, Sulphur etc. LPG: Liquified petroleum gas, MS: Motor spirit, ATF: Aviation turbine fuel; SKO: Superior kerosene oil, HSD: High speed diesel, LDO: Light diesel oil, VGO: Vacuum gas oil, MTO: Mineral turpentine oil