Extrapolation and spectral estimation with iterative weighted norm modification
10
842 IEEE TRANSACTIONS ON SIGNAL PROCESSING, VOL. 39, NO. 4, APRIL 1991 Extrapolation and Spectral Estimation with Iterative Weighted Norm Modification Sergio D. Cabrera, Member, IEEE, and Thomas W. Parks, Fellow, IEEE Abstract-An algorithm is developed to define, from the data samples themselves, a frequency weighted norm to use in minimum weighted norm extrapolation. Normally, the weight would be chosen to incor- porate apriori knowledge of the bandwidth and shape of the spectrum of the signal to be estimated. The iterative procedure developed in this paper uses a periodogram spectrum estimate obtained from some sam- ples of the signal estimatelextrapolation found at one iteration to define the weight that is used to estimate at the next iteration. This algorithm usually converges in less than 10 iterations to an extrapolation which is characterized as a nonparametric frequency-stationary extension of the data. The technique presented here is similar but more versatile than the Papoulis-Chamzas adaptive extrapolation procedure since it is not re- stricted to narrow-band signals. The frequency resolution and extrap- olation length are controlled by the length of a time-domain window used to obtain smooth spectral estimates between iterations. Examples are provided to illustrate the use of the algorithm for interpolation/ extrapolation. These examples give comparable results to nonadaptive extrapolation methods without the need for apriori knowledge. For the spectral estimation example of Kay and Marple, it provides compara- ble resolution to the parametric methods with more accurate values of the relative strengths of the narrow-band components. I. INTRODUCTION AND PRELIMINARIES A. Recent Work in Band-Limited Signal Extrapolation HE band-limited signal extrapolation algorithm of Papoulis T and Gerchberg [2], [3] provides a method for recovering a band-limited continuous-time signal, which is given only in a finite interval, if its bandwidth is known. It is shown in [2] that the signal x( t) can be recovered exactly, for all time t, after an infinite number of iterations of the now celebrated Papoulis- Gerchberg algorithm. If we only have access to a finite number of equally spaced samples, the problem has no unique solution and can be dealt with in discrete time without the need for it- erative algorithms. A minimum norm criterion is used in [4] to obtain a unique answer. Alternatively, the problem can be posed as the optimal recovery of an arbitrary linear functional of a band-limited discrete-time signal of bounded energy using a minmax criterion [5], [6]. The solution is to evaluate the linear functional of the minimum energy, band-limited signal that goes through the data. The minimum energy signal is therefore considered to be the conventional solution to this problem. Many theoretical and practical issues have been resolved for this problem in [7]-[lo] Manuscript received October 18, 1988; revised April 26, 1990. This work was supported in part by NSF Grant ECS 83-14006 and by ONR Grant NO0014-88-KO091. An early version of this paper was presented at ICASSP 85, Tampa, FL, March 1985. S. D. Cabrera is with the Department of Electrical and Computer Engi- neering, Pennsylvania State University, University Park, PA 16802. T. W. Parks is with the School of Electrical Engineering, Cornel1 Uni- versity, Ithaca, NY 14853. IEEE Log Number 9042258. for both the continuous- and the discrete-time cases. One ex- tension, the so called discrete-discrete case [9], will be used in this paper. Use of the discrete Fourier transform (DFT) for the frequency domain transform provides exact results for fi- nite-duration sequences. A band-limited time-concentrated extrapolation procedure described in [5] provides for estimation in a more restricted sig- nal subspace spanned by a finite set of prolate spheroidal se- quences [ 1 ll. Better estimates are obtained for signals which are time-concentrated in a region centered at the given data sample locations. Recently, this has been generalized in [12] to a time-domain weighting function to incorporate a priori time- domain energy concentrationldistribution information. The use of a frequency weighted norm of the form: has been used in [13] and [14], where the frequency domain nonnegative weight Q( f) is given. In this case, the minimum norm extrapolation that goes through the data is denoted the PDFT in [ 141 and has frequency content that is similar in shape to Q( f ). This allows for useful incorporation of a priori fre- quency domain shape information [ 151. Additional interpreta- tion and justification of this approach is that it amounts to an approximate Weiner filtering estimation [ 161. Finally, simul- taneous incorporation of both time-domain energy concentra- tion information and frequency domain shape information is de- scribed in [12]. When the available samples have additive noise, one ap- proach is to apply regularization [17] by minimizing a linear combination of the signal’s norm and a term that measures the deviation of the estimated samples from the given data. The case of noisy data is dealt with in [4] and [5] directly in the context of band-limited extrapolation. Another approach to achieve noise rejection is singular value decomposition (SVD) with appropriate elimination of singular values. This is done in [18], where a method is described to decide how many singular values to keep, and the resulting lack of sensitivity to additive noise on the data is demonstrated. Other applications of SVD to the band-limited extrapolation problem are included in [19]. B. Iterative and Adaptive Extrapolation The original iterative Papoulis-Gerchberg (PG) algorithm for band-limited extrapolation, when applied to the discrete-time case, converges to the minimum energy extrapolation [4]. A block diagram of this algorithm is given in Fig. 1 and can be thought of as a numerical procedure for finding the minimum energy extrapolation, which can also be obtained noniteratively 1053-587X/91/0400-0842$01 .OO 0 1991 IEEE
-
Upload
walsallcollege -
Category
Documents
-
view
5 -
download
0
Transcript of Extrapolation and spectral estimation with iterative weighted norm modification

842 IEEE TRANSACTIONS ON SIGNAL PROCESSING, VOL. 39, NO. 4, APRIL 1991
Extrapolation and Spectral Estimation with Iterative Weighted Norm Modification
Sergio D. Cabrera, Member, IEEE, and Thomas W. Parks, Fellow, IEEE
Abstract-An algorithm is developed to define, from the data samples themselves, a frequency weighted norm to use in minimum weighted norm extrapolation. Normally, the weight would be chosen to incor- porate apriori knowledge of the bandwidth and shape of the spectrum of the signal to be estimated. The iterative procedure developed in this paper uses a periodogram spectrum estimate obtained from some sam- ples of the signal estimatelextrapolation found at one iteration to define the weight that is used to estimate at the next iteration. This algorithm usually converges in less than 10 iterations to an extrapolation which is characterized as a nonparametric frequency-stationary extension of the data.
The technique presented here is similar but more versatile than the Papoulis-Chamzas adaptive extrapolation procedure since it is not re- stricted to narrow-band signals. The frequency resolution and extrap- olation length are controlled by the length of a time-domain window used to obtain smooth spectral estimates between iterations. Examples are provided to illustrate the use of the algorithm for interpolation/ extrapolation. These examples give comparable results to nonadaptive extrapolation methods without the need for apriori knowledge. For the spectral estimation example of Kay and Marple, it provides compara- ble resolution to the parametric methods with more accurate values of the relative strengths of the narrow-band components.
I. INTRODUCTION AND PRELIMINARIES
A. Recent Work in Band-Limited Signal Extrapolation HE band-limited signal extrapolation algorithm of Papoulis T and Gerchberg [2], [3] provides a method for recovering a
band-limited continuous-time signal, which is given only in a finite interval, if its bandwidth is known. It is shown in [2] that the signal x( t ) can be recovered exactly, for all time t, after an infinite number of iterations of the now celebrated Papoulis- Gerchberg algorithm. If we only have access to a finite number of equally spaced samples, the problem has no unique solution and can be dealt with in discrete time without the need for it- erative algorithms. A minimum norm criterion is used in [4] to obtain a unique answer. Alternatively, the problem can be posed as the optimal recovery of an arbitrary linear functional of a band-limited discrete-time signal of bounded energy using a minmax criterion [5], [6]. The solution is to evaluate the linear functional of the minimum energy, band-limited signal that goes through the data.
The minimum energy signal is therefore considered to be the conventional solution to this problem. Many theoretical and practical issues have been resolved for this problem in [7]-[lo]
Manuscript received October 18, 1988; revised April 26, 1990. This work was supported in part by NSF Grant ECS 83-14006 and by ONR Grant NO0014-88-KO091. An early version of this paper was presented at ICASSP 85, Tampa, FL, March 1985.
S . D. Cabrera is with the Department of Electrical and Computer Engi- neering, Pennsylvania State University, University Park, PA 16802.
T. W . Parks is with the School of Electrical Engineering, Cornel1 Uni- versity, Ithaca, NY 14853.
IEEE Log Number 9042258.
for both the continuous- and the discrete-time cases. One ex- tension, the so called discrete-discrete case [9], will be used in this paper. Use of the discrete Fourier transform (DFT) for the frequency domain transform provides exact results for fi- nite-duration sequences.
A band-limited time-concentrated extrapolation procedure described in [5] provides for estimation in a more restricted sig- nal subspace spanned by a finite set of prolate spheroidal se- quences [ 1 l l . Better estimates are obtained for signals which are time-concentrated in a region centered at the given data sample locations. Recently, this has been generalized in [12] to a time-domain weighting function to incorporate a priori time- domain energy concentrationldistribution information.
The use of a frequency weighted norm of the form:
has been used in [13] and [14], where the frequency domain nonnegative weight Q ( f ) is given. In this case, the minimum norm extrapolation that goes through the data is denoted the PDFT in [ 141 and has frequency content that is similar in shape to Q ( f ). This allows for useful incorporation of a priori fre- quency domain shape information [ 151. Additional interpreta- tion and justification of this approach is that it amounts to an approximate Weiner filtering estimation [ 161. Finally, simul- taneous incorporation of both time-domain energy concentra- tion information and frequency domain shape information is de- scribed in [12].
When the available samples have additive noise, one ap- proach is to apply regularization [17] by minimizing a linear combination of the signal’s norm and a term that measures the deviation of the estimated samples from the given data. The case of noisy data is dealt with in [4] and [5] directly in the context of band-limited extrapolation.
Another approach to achieve noise rejection is singular value decomposition (SVD) with appropriate elimination of singular values. This is done in [18], where a method is described to decide how many singular values to keep, and the resulting lack of sensitivity to additive noise on the data is demonstrated. Other applications of SVD to the band-limited extrapolation problem are included in [19].
B. Iterative and Adaptive Extrapolation The original iterative Papoulis-Gerchberg (PG) algorithm for
band-limited extrapolation, when applied to the discrete-time case, converges to the minimum energy extrapolation [4]. A block diagram of this algorithm is given in Fig. 1 and can be thought of as a numerical procedure for finding the minimum energy extrapolation, which can also be obtained noniteratively
1053-587X/91/0400-0842$01 .OO 0 1991 IEEE

CABRERA AND PARKS: EXTRAPOLATION AND SPECTRAL ESTIMATION 843
8
I SAMPLES 3- (X(O), x( 1 ), x(2 ),.... x(L- 1) 1
Fig. 1 . Discrete-time Papoulis-Gerchberg iterative band-limited extrapo- lation algorithm.
[4]. The procedure involves operations of Fourier transforma- tion and time replacement, and inherently provides noise rejec- tion when the iteration is truncated [6]. Modifications to achieve faster convergence were suggested in [20] and [4].
Motivated by the application of band-limited extrapolation to the problem of estimation of sinusoids in additive noise, Pa- poulis and Chamzas modified the original PO algorithm in [21]. The idea pursued is to slowly reduce the spectral support at each iteration by thresholding the spectrum from the previous itera- tion. A block diagram of the Papoulis-Chamzas algorithm is shown in Fig. 2, where its relationship to the original PG al- gorithm of Fig. l is readily evident.
One can note that in practice, this algorithm can only be im- plemented with a discrete frequency variable, as done in [21], and that one can only keep or eliminate a discrete frequency support value. Furthermore, relative weighting of components is difficult, resulting sometimes in the loss of small amplitude sinusoids [21]. Finally, since one is only interested in recover- ing the signal which has a small spectral support, noise rejec- tion is essential and this can be done by appropriately termi- nating the iteration.
This algorithm provides motivation to develop other adaptive extrapolation algorithms, such as generalizations which are not restricted in use to narrow-band signals. A weighted frequency- domain norm provides the means to achieve relative weighting of various frequency components. Because minimum norm sig- nals can be obtained directly, satisfactory results can be ex- pected after only a few iterations. Finally, nonparametric spec- tral estimation allows us to obtain useful weight functions from one iteration to the next. These ideas have been incorporated in this paper.
C. Summary and Contribution of this Paper Since implementation details demand the use of finite dura-
tion sequences and the DFT, we will use this framework from the start. In this case, the use of a frequency domain weighted norm requires the use of a DFT-domain weight function. Expressions for the minimum norm solution are then presented using a convenient vector/matrix notation. The similarity be- tween the minimum DFT-domain weighted norm solution and the PDFT [ 131-[ 161 or minimum Fourier transform weighted norm band-limited extrapolation, is briefly illustrated.
Fig. 2. The Papoulis-Chamzas adaptive extrapolation algorithm.
In conventional band-limited extrapolation, the bandwidth is assumed to be known a priori and the quality of the extrapola- tion is heavily dependent on using correct parameters to define it [22]. A weighted norm allows the use of a priori spectral shape information to obtain even better results [15], [12]. An example is given here to motivate the proper use of the weight- ing function to derive an adaptive extrapolation algorithm which is more flexible than the Papoulis-Chamzas method.
The algorithm described here combines a (modified) periodo- gram spectral estimate [23] with a weighted norm extrapolation at each iteration. The main parameter of the algorithm is the length of the window used in the modified periodogram. Expressions for the estimates are given and the computation and implementation details are discussed. The algorithm's use and performance are evaluated for interpolation/extrapolation and as a new nonparametric spectral estimation procedure. Analysis of the algorithm and examples show that higher resolution spec- tral estimates (compared to the periodogram) can be obtained. Better interpolation/extrapolation than that which can be per- formed with conventional band-limited extrapolation methods also results. A major property is that it requires less a priori knowledge of the bandwidth and spectral shape than nonadap- tive methods. The general idea of iterative modification of a weighted norm in an extrapolation problem was initially pro- posed but not developed in [24] and has appeared recently in a signal extrapolation context in [ 11 and [25] .
D. Notation and Problem Set-Up The discrete-time problem of extrapolation involves a se-
quencex(n), n = 0, k l , f 2 , f 3 , * * * ; for which its Fourier transform is defined as
m
~ ( f ) = n = C - m x(n)e-'zxfi.
A band-limited sequence is one which has X ( f ) = 0 except in a spectral support region p ( a subset of [ -0.5, 0.51) which usually consists of a series of intervals. When only a finite num- ber of time samples and their locations are known, we denote these: x ( m l ) , x ( .m2) , x ( m 3 ) , * , x ( m L ) . In Fig. 3 we show the typical situation in a discrete-time, band-limited extrapola- tion problem. Only the known time samples are shown, the rest are to be estimated.

844 IEEE TRANSACTIONS ON SIGNAL PROCESSING, VOL. 39, NO. 4, APRIL 1991 1 x(n> t
t
t
Fig. 3. The band-limited extrapolation problem: the given time samples with known time indices arex(rn, ); i = 1, 2, 3, . . . , L and are located in the interval [ 0, N - 1 1.
If the given samples of interest are included in the range 0 - ( N - 1 ) as shown in Fig. 3, we can settle for estimating these N values using the DFT:
N- I
X ( k ) = c ~ ( n ) e - ' ( ~ " ' ~ ~ ~ ; k = 0, 1 , 2, * - * , N - 1. n=O
~~
A length-N signal will be said to be DFT-limited if its DFT vanishes outside of the support { k , , k2, k3, * * , k J } , which is a subset of [ 0, N - 1 1. An attractive feature of the use of the DFT is the possibility of providing closed form expressions using finite dimensional vectors and matrices.
~
1 lH(k)12
Fig. 4. We define a Hilbert space of DFT-limited sequences with the same support as the weight function I H ( k ) 1' which also defines the weighted norm.
approximations arise: 1) for y E R ( T ) we obtain the minimum norm (MN) solution: 2) for y R ( T ) we obtain the minimum norm least squares (MNLS) solution. In the second case, f has the smallest norm of all possible solutions to T ( x ) = 9 where 9 is the projection of y onto R ( T). Another method of obtaining the MNLS solution is by use of singular value decomposition, see [IS]. In short, when we solve the linear transformation equation T ( x ) = y to obtain the MN or MNLS estimate, the answer is always unique and we can always denote it the Hilbert space generalized inverse solution.
111. A HILBERT SPACE WITH WEIGHTED DFT-DOMAIN NORM
The set of complex length-N sequences having the same DFT support S, as some weighting function 1 H( k ) l 2 is a subspace of CN. Choosing this subspace as the desired Hilbert space X 11. THE HILBERT SPACE GENERALIZED INVERSE
Band-limited extrapolation is a linear inverse problem con- sisting of finding or estimating an element x, of a Hilbert space K , from the value of a linear transformation T. An estimate of
[26] and [13]), is the minimum norm vector f in X which sat- isfies the data. That is, f solves
in which to perform weighted norm extrapolation, we define the weighted inner product:
x from the data y = T ( x ) , which has multiple optimalities (see x: ( k ) x2 ( k ) keSh
II f It = min IIX II T ( x ) = Y
and the transformation Tt, mapping the data vector to this min- imum norm solution, is called the generalized inverse of T [27], and thus f = Tt( y ) with T ( f ) = y . This estimator is linear and it depends on the specific norm associated with the vector space U .
When the data values contain additive errors, the generalized inverse solution may not be desirable, especially if the problem is very sensitive to such errors as is the case in band-limited extrapolation [5]. One can substantially reduce the sensitivity through the procedure of regularization [I71 at the expense of some deviation from the constraint T ( x ) = y . Defining the norm in the vector space Y of the data vector, the regularized solution f satisfies
min { P lt~11' + 11 T ( x ) - Y 11:) X E x
where the parameter p > 0 provides flexibility to trade off among the two terms.
When the linear transformation Tis not onto Y, it is possible that there is no solution satisfying T ( x ) = y. This is the case when y is not in the range of T, denoted R ( T). It is another situation where the regularization solution defined above is use- ful. One can obtain good results in any case by choosing p very small to place most of the weight on the second term. Two good
illustrated by Fig. 4 and where S, is the DFT support containing J DFT index values. To obtain its vectodmatrix form, we de- fine ah( n) as the inverse DFT of \ H ( k ) (' and then the circular convolution filtering matrix
u ~ ( O ) u ~ ( N - 1) u ~ ( N - 2) * * * a h ( 1 )
% ( I ) % ( O ) a,(N - 1) . * a , (2 )
. . . . u ~ ( N - 1) u,(N - 2) * a,(O) -
(2 )
The Moore-Penrose pseudoinverse of Q is denoted Q - and is a DFT filtering matrix corresponding to the DFT equal to 1 / ) H ( k ) I 2 for H ( k ) # 0 ( k E S h ) , and 0 otherwise ( k $ S,) [28]. We then have the inner product in the desired form:
xi,.^^) = z T Q - z z . The data vector y is a complex L-tuple and thus we can use the normed liner space G with Euclidean norm:
Ilvll, = 45. (3 )

CABRERA AND PARKS: EXTRAPOLATION AND SPECTRAL ESTIMATION 845
IV. MINIMUM WEIGHTED NORM ESTIMATION FROM SAMPLES
Suppose we know that x ( n ) belongs to K and we are given - , L. These samples form a the samples x ( mi ), i = 1 , 2, linear transformation y = Tn_ or more explicitly -
4 0 )
x(N - 2)
x(N - 1)
(4)
where each row of Tis a vector of zeros with a ‘$1” in position m i . The problems of interest will involve less DFT support val- ues J than the DFT size N, and similarly a number of given time samples L no greater than J , therefore L 5 J < N is as- sumed.
A. Minimum DFT- Weighted Norm Solution The Hilbert space generalized inverse solution is a length-N
sequence a( n ) . The linear transformation represented by the matrix T is denoted T. The mapping Tt is itself represented by a matrix which, whenever T i s onto C L , is given by (see [12], 1291)
T+ = QT*(TQT*)-’
so that in vector/matrix notation the minimum norm solution is .j = Tty. The matrix G = TQT* is a submatrix of Q and con- sists o f the subset of rows and columns corresponding to the given sample locations, thus
ah(ml - ml)
- m l )
a h ( m l - m Z ) . . a h ( m l - m L )
- m2> * * * ah(mZ - m L )
* * . ah(m3 - mL) . . .
ah(mL - m , ) ah(mL - %) . * a h ( m L - m L )
( 5 ) where all the indices are taken modulo N.
, w L ) E G - ’ y so we can easily see from (2) and (4) that f = QT*w and that it is a linear combination of columns of Q. The optimal estimate is therefore
We can define = col ( wlr w,, * *
L
a ( n ) = C wiah(n - m i ) (6) i = I
and its DFT takes the form
where W ( k ) is the DFT of a sequence which equals wi at the L locations n = mi, and zero elsewhere. We clearly see from (7)
that 8 ( k ) has the samefrequency support as the$lter 1 H ( k ) 1’. If the problem is solved using the Fourier transform and a
norm given by (l) , we obtain the PDFT [14], which takes the form
L
B ( f ) = Q ( f ) c w,e-J2Tfm’
and the region where Q( f ) > 0 defines the spectral support. The two estimators produce similar results as long as the in- verse Fourier transform of Q ( f ) is approximately time limited to N. This will be the case, for sufficiently large N, even if Q ( f ) is chosen as an ideal band-limiting function to produce the conventional band-limited extrapolation [4], [5]. The need for the use of the DFT is readily seen by noting that to form the matrix G in (3, it is necessary to obtain inverse transform val- ues of an arbitrary weight function, which can only be done exactly if the DFT is used.
The regularized solution using the DFT can be shown to take the form:
, = I
= QT*(TQT* + p Z ) - l y (8) ~
when the Euclidean norm of (3) is used to measure the data vector deviation [29]. The estimate has exactly the same form as (6) because the regularization parameter only affects the weights w,. In the rest of this paper, we always compute the regularized solution given by (8) and denote it (for simplicity) the minimum norm solution or estimate. The parameter p is taken as small as possible to allow successful numerical inver- sion of the matrix G .
B. Example: Gap-Filling by Minimum Norm Estimation
In Fig. 5 we show part of a real test signal x ( n ) in the interval -64 5 n 5 64. It has a symmetric, length N = 1024, DFT ~
shown in the relevant range 0-256 in Fig. 6. A set of L = 12 samplesat locations m, = { -15, -14, -13, -12, - 1 1 , -10, 4, 5, 6, 7 , 8, 9 , } , shown in Fig. 5, will be used to illustrate minimum norm estimation with two different weight functions. First we use 1 H ( k ) 1’ = 1 for - 128 -i k -i 128 and zero else- where to essentially obtain the conventional band-limited ex- trapolation with a bandwidth of 0.125 Hz. Fig. 7 shows the true and the estimated DFT magnitude where we can clearly see that the estimate is DFT-limited.
Another estimation is done with a weighted norm that is non- zero in the same range as before but with a shape that is not flat, and thus this is essentially the PDFT [13], [14]. We can see in Fig. 8 a plot of the chosen 1 H ( k ) 1’ and the DFT mag- nitude of the true and estimated signals. We can readily see that the estimate is better than that of Fig. 7 . This is not surprising because the weight function used resembles the true spectrum [15]. From the form of [ l ] , we can see that the minimum norm solution should attempt to match the shape of the weight func- tion which appears in the denominator. This example motivates the search for a way to define the weight from the data since it is usually not available a priori. This is the topic of the next section.
v. ITERATIVE WEIGHTED NORM MODIFICATION IN ESTIMATION FROM SAMPLES
We now describe one possible way to modify the weighted norm from the previous estimate and which produces good re- sults. The procedure is as follows: the data is used to obtain a

846 IEEE TRANSACTIONS ON SIGNAL PROCESSING, VOL. 39, NO. 4, APRIL 1991
.08 I
0
-. 08 -64 0 64
TIMEINDEX n Fig. 5 . A test signal x ( n ) and the available time samples
1 .s
1.c
.s
0 64 2 5
DFT INDEX k Fig. 6. Length 1024 DFT of test signal of Fig. 5 shown in the range
0-256.
1.5
1.0
.5
0 128 256 DFT INDEX k
Fig. 7. DFT of true (test) signal and magnitude DFT of the DFT-limited estimate.
broad-band spectral estimate from a set of data samples; this in turn is used to define the weighted norm to be used for minimum norm estimation; the process is then repeated several times. Some of the estimated data samples are included in the succes- sive spectral estimations to yield different weight functions and, therefore, different signal estimates. This is done until no change
........ X(k)
0 128 256 DFT INDEX k
Fig. 8 . DFT of true signal and magnitude DFT of another estimate ob- tained using the weighted norm shown.
occurs in the estimated samples. The signal at the last iteration becomes the desired extrapolationlestimate.
A. Description of the Algorithm
The general idea is to make the new weight, which appears in the definition of a norm such as that of (1), a function of the previous estimate, e.g.,
Q , ( f ) = F { - & - I ( ~ ) } . (9 ) The procedure chosen for modifying the DFT-domain norm consists of using a nonparametric spectral estimate, P,( f ), corresponding to a finite-duration autocorrelation function,
( n ) . Exact representation of the estimated power spectrum by a DFT weight of the form I H ( k )
We will make the spectrum a modified periodogram [23] so that only the broad shape of the spectrum is kept from the pre- vious iteration and the detail is recovered by the generation of a valid extrapolation using the data sample constraints. This is accomplished through the function W ( k ) in (7) which can be seen to contain the phase of the estimated signal. The modified periodogram involves a windowing operation in the time do- main and thus we define a filter at iteration X as
is possible this way.
h h ( n ) = p ( n ) f , - , ( n ) . (10)
Fig. 9 shows a block diagram of the system described here. In the frequency domain, this equation becomes
(11) P ( k ) 0 2 , - , ( k )
N H , ( k ) =
__ .
where 0 denotes circular convolution. The resulting periodo- gram estimate is proportional to I H A ( k ) 1 2 , but since it is easy to see that scaling of the weight essentially does not change the estimate in (8), we use only I H i ( k ) ( * for simplicity. In the time domain, a circular autocorrelation operation on h x ( n ) is re- quired.
A DFT domain form of the iteration is obtained by substitut- ing (1 1) in (7):
1 ~ i h ( k ) = - P ( k ) o g,.-,(k)l r = l c w ~ ~ ) e - ~ ( 2 r l ~ m ~ k 2 L
. (12) IN
At each iteration, the estimate & ( n ) goes through the given samples and is a valid extrapolation. The window p ( n ) in (10)

CABRERA AVD PARKS: EXTRAPOLATION AND SPECTRAL ESTIMATION 847
GIVEN SAMPLES
{x(ml), x(m2). x(m3),. . . ,x(mL)l
MINIMUM WEIGHTED
EXTRAP.
FREQUENCY/ WEIGHT
FUNCTION
GIVEN SAMPI
{x(ml), x(m2). x(
MINIMUM WEIGHTED
EXTRAP.
FREQUENCY/ WEIGHT
FUNCTION
Fig. 9. Block diagram of the iterative weighted norm modification (IWNM) algorithm presented in this paper.
is chosen to include some nearby estimated time samples as well as the given data. Using a standard positive and even win- dow p e ( n ) [30], we choose p ( n ) = p , ( n - n,) with the shift n, chosen to center the window near the middle of the given data.
B. Length of Signal Extrapolation
The length of p , ( n ) determines the degree of smoothness of the modified periodogram spectrum and also defines the result- ing maximum length of the estimate at all iterations. Suppose that the window is centered at n, and is of length N,, + 1, there- fore,p(n:i # Oforn, - N p / 2 5 n 5 n, + N p / 2 (modulo N ) and so from (lo), the same holds for h , ( n ) . The (circular) au- tocorrelation of h, ( n ) can be nonzero only in the range -Np 5 n 5 N,?, from which we conclude that 2, ( n ) is time-limited to the range
m, - N,, I n 5 mL + N,,. (13)
We note that if the window is not sufficiently short, (13) holds by letting the indices be taken modulo N and the estimate can be of full duration 0 - ( N - 1 ).
C. Implementation and Computational Issues
We start the iteration by making the first filter H , ( k ) equal to a positive constant for all k = 0, 1, 2 , * * . , N - 1. In this case the first estimate is a signal made up of the given samples at n = m, and zero elsewhere, and we call it the zero-padded extrapolation. Next, we obtain a modified periodogram spec- trum estimate, which uses only the given data. This is now the first nonflat weighted norm encountered, which is then used at the second iteration. We note that the selectable items for the algorithm are: the DFT length N , the window p ( n ) , and the vector of data samples y = col { x ( m l ) , x ( m , ) , * . . , x ( m , ) } with the correspondingtime indices m, . The computations per- formed at each iteration can all be described in the time domain and are as follows:
a) Compute the circular autocorrelation:
a h ( n ) = h : ( - n ) 0 h , ( n ) .
b) Form the matrix G with elements:
c) Compute the vector of constants:
d) Form the estimate using the constants and the autocorre- lation:
L
i , ( n ) = C wjX)a , (n - m i ) . i = I
e) Define the next filter:
Savings in the computations can be obtained at intermediate iterations by using the FFT to compute a , ( n ) . In addition, we need only evaluate fA ( n ) for those values of n where the win- dow is nonzero. The matrix G is Toeplitz and Hermitian in the special case where the given samples are consecutively spaced, and therefore a fast algorithm can be used to invert it [30]. A typical useful value for the regularization parameter p is a , (0) x 10-8.
In all the examples that have been done, the estimates stop changing by a significant amount after a small number of iter- ations, approximately 10. We say that the algorithm has con- verged and take the last estimate as the final result. The nonlin- ear nature of the autocorrelation operation involved at each iteration makes a convergence proof difficult. However, it is easy to see that the algorithm cannot easily diverge since all estimates are finite-duration sequences. We therefore choose to stop the algorithm at iteration A' when the energy of { iA, ( n ) - TA,- , ( n ) } is a small percentage (such as 0.1%) of that of f , . ( n ) .
D . Example: Gap-Filling with No A Priori Knowledge
Fig. 10 shows the same test signal and data samples which were used in Section IV-B as well as a Hamming window of length 63, which will be used to test the iterative weighted norm modification (IWNM) algorithm. Estimates for the first 3 iter- ations are shown in Fig. 11 and Fig. 12 in the DFT and time domains, respectively. We see that the correct shape in the DFT domain is obtained quickly. The estimates stop changing after 7 iterations and the results are shown in Figs. 13 and 14.
A comparison with the results of Section IV-B reveals that the performance of the estimator is better than the conventional band-limited extrapolation, which is shown in Fig. 7 and where the bandwidth is assumed to be known. Comparison with the estimate of Fig. 8, where a priori shape information is used, shows equivalent, if not better, results. This is not surprising since in the IWNM algorithm, the spectral shape as well as the signal itself are estimated at each iteration.
E. Spectral Estimation from a Short Data Set
The problem of spectral estimation from a short data record has been studied extensively in the past few years [23], [30], [31]. In brief, given a set of L consecutively spaced data sam- ples, { x ( r n o + l ) , x ( m o + 2 1 , x ( m o + 31, . * * , x ( m o + L ) } , we assume that the signal x ( n ) is a realization of a dis- crete-time wide-sense stationary random process x ( m ) . Its au- tocorrelation is
ru(n) = E { x * ( m ) x ( m + n ) }
where E { } is the expected value operation. The frequency con- tent of x ( m ) is defined by its power spectral density (PSD)

848
....... x(n) x(m,)
IEEE TRANSACTIONS ON SIGNAL PROCESSING, VOL. 39, NO. 4, APRIL 1991
-.08 1 -64 0 64
TIMEINDEX n Fig. 10. Use of the IWNM algorithm on the same problem of Fig. 5 . The length-63 Hamming window used is centered on the data and includes ac- curate nearby estimates.
il=1,2,: 1.0 l-----= .5
0 0 100 200 256
DFT INDEX k Fig. 11. Magnitude DFT of the first 3 iterations obtained in the example
of Fig. 10.
.08
x(mi)
0
-. 08 -64 0 64
TIMEINDEX n Fig. 12. Signal extrapolation for the same 3 iterations shown in Fig. 11.
P, ( f ) which is the Fourier transform of r,, ( n ). One classical PSD estimate is the periodogram [30], [31] which is
........
DET INDEX k Fig. 13. True signal DFT and magnitude DFT of the estimate after con-
vergence at iterations 7 of the IWNM algorithm.
.08
0
-. 08 -v I 0 64
TIMEINDEX n Fig. 14. True signal and extrapolation corresponding to the estimate in
Fig. 13.
The IWNM algorithm can be applied to obtain a higher res- olution nonparametric spectral estimate, by extending the data samples in a way that preserves many of the features of the frequency content which can be inferred from the given sam- ples. Next, we give an interpretation of the results of the IWNM as a frequency stationary extension of the given data samples.
We assume that (12) has converged and therefore that we are at a fixed point of the iteration. We remove the notation indi- cating the iteration number and therefore h ( n ) is a windowed version of the estimate itself:
h ( n ) = f ( n ) p ( n ) . (15)
The estimate is a linear combination of shifted versions of the circular autocorrelation of h ( n )
L
f ( n ) = c wi(h*(n) 0 h ( n - (mo + i))) (16) i = l
which gives a frequency domain expression
where we have assumed that h ( n ) is sufficiently short, so that

CABRERA A N D PARKS: EXTRAPOLATION A N D SPECTRAL ESTIMATION 849
the circular convolution in (16) actually produces a linear con- volution result.
To within the limits of the time-frequency uncertainty, h ( n ) contains the local frequency content of i ( n ) in the neighbor- hood of the given data samples. The squared magnitude Ph ( f ) = I H( f ) 1' is itself a useful spectral estimate obtained from the data samples. From (17), we note that a model for i ( n ) is the output of a filter 1 H ( f ) I * driven by a sequence which is zero except at L locations n = ma + i where it equals w, and thus W ( f ) is a slowly varying function. We conclude that the spectral content of i ( n ) is mostly dependent on the intermediate spectral estimate 1 H( f ) l 2 and that it is a good stationary ex- tension of the data whenever 1 H( f ) 1' is narrow band com- pared to W ( f ). This is true whenever twice the length of the window p ( n ) in (15) is large compared to the data interval L.
The highest possible resolution spectral estimate is obtained by taking the periodogram of the largest possible set of time samples available at the last iteration:
and thus the new spectral estimate is I X ( f ) 1 2 . The absolute amplitude of this spectrum is rather arbitrary and separate nor- malization is necessary.
F. Example: Spectral Estimation
In Fig. 15 we show L = 64 consecutive data samples from a simulation of a random process that is used to illustrate various spectral estimation techniques in [23]. The random process con- sists of 3 sinusoids at 0.1, 0.2, and 0.21 Hz with the first one 20 dB below the other two. Additive colored noise is included in the range 0.2 to 0.5 Hz, see [23]. Fig. 15 also shows other details of the example: a length N = 512 DFT, and a triangular window of length 191 centered at nc = 32. The procedure con- verges after 6 iterations to within 0.1 % in energy.
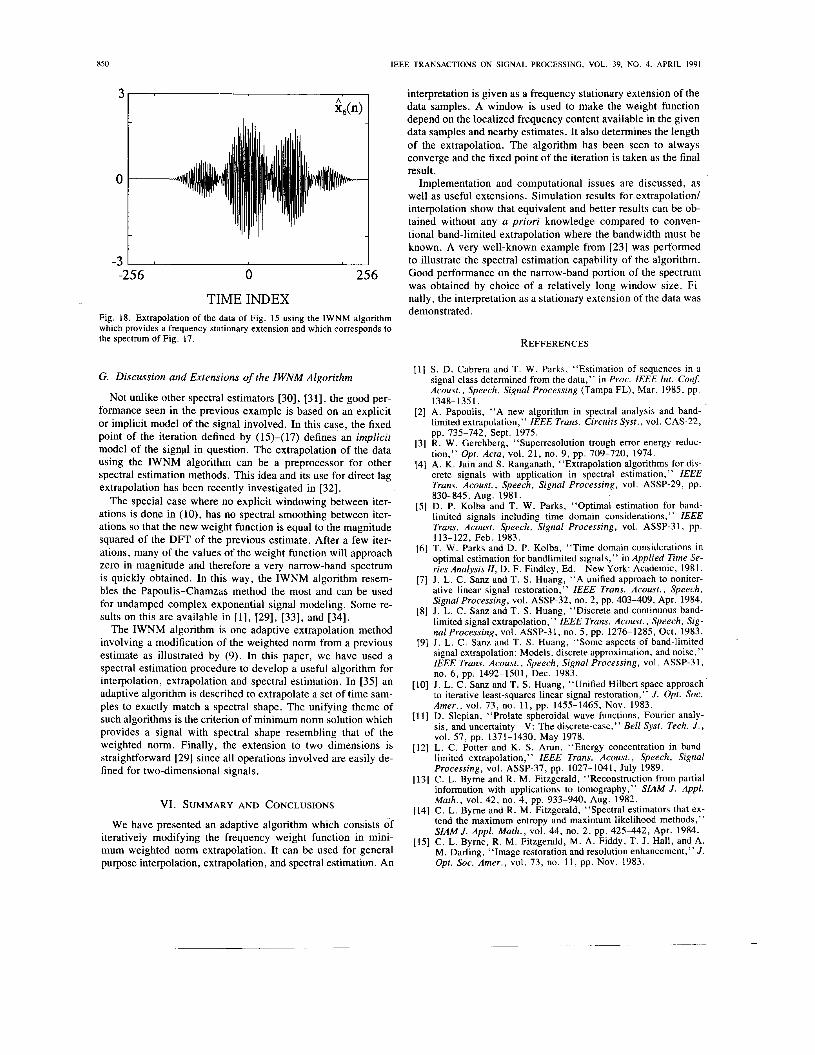
Fig. 16 shows the spectrum estimates for the first two itera- tions on a 80-dB scale. The result of the first iteration is the true periodogram, using only the given data, because it corresponds to the zero-padded extrapolation. Fig. 17 shows the results at the sixth iteration on the same 40-dB scale used in [23]. Visual comparison with the illustrative examples in [23, fig. 16) shows that this method is a high resolution nonparametric spectral es- timator with comparable resolution to that obtained with para- metric methods. Similar problems to those encountered with most other methods appear when estimating the broadband part of the spectrum. The long window used in this example of the IWNM method favors the narrow-band part of the spectrum, nevertheless, the general trend of the broadband part of the spectrum is correct.
The peaks of the spectrum occur at frequencies of 0.0996, 0.1992, and 0.209 Hz which are the closest DFT indices to the true frequencies except for the third sinusoid where it is the next smallest index. The peak values are -19.7, 0, and -0.2464 dB, respectively for the three narrow-band components. These values are comparable to those obtained with the Prony spectral line method of [23, Fig. 16, part (k)], which is a sinusoidal modeling method that does not provide an arbitrary spectrum function. However, the two methods are significantly more ac- curate for characterizing narrow-band components than the par- ametric spectral estimation methods in the form presented in
3
C
-3
window -+ /I,
DFT LENGTH N=512
-256 0 256 TIME INDEX
Fig. 15. The 64 given time samples of the time series used by Kay and Marple in 1231 to illustrate spectral estimation. Also shown is the triangular window used in the IWNM algorithm using a DFT of size 512.
2, -20 w D ;>
E -40 4 '2 -60
-80 0 .1 .2 . 3 .4 .5
NORMALIZED FREQUENCY Fig. 16. The spectral estimates for the first two iterations of the example
of Fig. 15.
NORMALIZED FREQUENCY Fig. 17. The spectral estimate obtained using the IWNM algorithm of this paper after convergence at iteration 6 and shown on the same scale used in [W.
[23]. Finally, Fig. 18 shows the extrapolated data correspond- ing to Fig. 17 and confirms the interpretation as a stationary extension of the data.
850 IEEE TRANSACTIONS ON SIGNAL PROCESSING, VOL. 39, NO. 4, APRIL 1991
0
-3 I -256 0 256
TIME INDEX Fig. 18. Extrapolation of the data of Fig. 15 using the IWNM algorithm which provides a frequency stationary extension and which corresponds to the spectrum of Fig. 17.
G. Discussion and Extensions of the IWNM Algorithm
Not unlike other spectral estimators 1301, 1311, the good per- formance seen in the previous example is based on an explicit or implicit model of the signal involved. In this case, the fixed point of the iteration defined by (15)-(17) defines an implicit model of the signal in question. The extrapolation of the data using the IWNM algorithm can be a preprocessor for other spectral estimation methods. This idea and its use for direct lag extrapolation has been recently investigated in 1321.
The special case where no explicit windowing between iter- ations is done in (lo), has no spectral smoothing between iter- ations so that the new weight function is equal to the magnitude squared of the DFT of the previous estimate. After a few iter- ations, many of the values of the weight function will approach zero in magnitude and therefore a very narrow-band spectrum is quickly obtained. In this way, the IWNM algorithm resem- bles the Papoulis-Chamzas method the most and can be used for undamped complex exponential signal modeling. Some re- sults on this are available in 111, 1291, [331, and 1341.
The IWNM algorithm is one adaptive extrapolation method involving a modification of the weighted norm from a previous estimate as illustrated by (9). In this paper, we have used a spectral estimation procedure to develop a useful algorithm for interpolation, extrapolation and spectral estimation. In [35] an adaptive algorithm is described to extrapolate a set of time sam- ples to exactly match a spectral shape. The unifying theme of such algorithms is the criterion of minimum norm solution which provides a signal with spectral shape resembling that of the weighted norm. Finally, the extension to two dimensions is straightforward [29] since all operations involved are easily de- fined for two-dimensional signals.
VI. SUMMARY AND CONCLUSIONS
We have presented an adaptive algorithm which consists of iteratively modifying the frequency weight function in mini- mum weighted norm extrapolation. It can be used for general purpose interpolation, extrapolation, and spectral estimation. An
interpretation is given as a frequency stationary extension of the data samples. A window is used to make the weight function depend on the localized frequency content available in the given data samples and nearby estimates. It also determines the length of the extrapolation. The algorithm has been seen to always converge and the fixed point of the iteration is taken as the final result.
Implementation and computational issues are discussed, as well as useful extensions. Simulation results for extrapolation/ interpolation show that equivalent and better results can be ob- tained without any a priori knowledge compared to conven- tional band-limited extrapolation where the bandwidth must be known. A very well-known example from [23] was performed to illustrate the spectral estimation capability of the algorithm. Good performance on the narrow-band portion of the spectrum was obtained by choice of a relatively long window size. Fi- nally, the interpretation as a stationary extension of the data was demonstrated.
REFFERENCES
S. D. Cabrera and T. W. Parks, “Estimation of sequences in a signal class determined from the data,” in Proc. IEEE Int. Con$ Acoust., Speech, Signal Processing (Tampa FL), Mar. 1985, pp.
A. Papoulis, “A new algorithm in spectral analysis and band- limited extrapolation,” IEEE Trans. Circuits Syst., vol. CAS-22, pp. 735-742, Sept. 1975. R. W. Gerchberg, “Superresolution trough error energy reduc- tion,” Opt. Acta, vol. 21, no. 9, pp. 709-720, 1974. A. K. Jain and S. Ranganath, “Extrapolation algorithms for dis- crete signals with application in spectral estimation,” ZEEE Trans. Acoust., Speech, Signal Processing, vol. ASSP-29, pp.
D. P. Kolba and T. W. Parks, “Optimal estimation for band- limited signals including time domain considerations,” IEEE Trans. Acoust. Speech, Signal Processing, vol. ASSP-31, pp. 113-122, Feb. 1983. T. W. Parks and D. P. Kolba, “Time domain considerations in optimal estimation for bandlimited signals,” in Applied Time Se- ries Analysis ll, D. F. Findley, Ed. New York: Academic, 1981. J. L. C. Sanz and T. S. Huang, “A unified approach to noniter- ative linear signal restoration,” IEEE Trans. Acoust., Speech, Signal Processing, vol. ASSP-32, no. 2, pp. 403-409, Apr. 1984. J . L. C. Sanz and T. S. Huang, “Discrete and continuous band- limited signal extrapolation,” IEEE Trans. Acoust., Speech, Sig- nal Processing, vol. ASSP-31, no. 5, pp. 1276-1285, Oct. 1983. J. L. C. Sanz and T. S. Huang, “Some aspects of band-limited signal extrapolation: Models, discrete approximation, and noise,” IEEE Trans. Acoust., Speech, Signal Processing, vol. ASSP-3 I , no. 6, pp. 1492-1501, Dec. 1983. J. L. C. Sanz and T. S. Huang, “Unified Hilbert space approach to iterative least-squares linear signal restoration,” J . Opt. Soc. Amer., vol. 73, no. 11, pp. 1455-1465, Nov. 1983. D. Slepian, “Prolate spheroidal wave functions, Fourier analy- sis, and uncertainty-V: The discrete-case,’’ Bell Syst. Tech. J . , vol. 57, pp. 1371-1430, May 1978. L. C. Potter and K. S. Arun, “Energy concentration in band- limited extrapolation,” ZEEE Trans. Acoust. , Speech, Signal Processinp. vol. ASSP-37. OD. 1027-1041, Julv 1989.
1348-1351.
830-845, Aug. 1981.
“I
[13] C. L. Byrne and R. M. Fitz’gkrald, “Reconstruction from partial information with applications to tomography,” SIAM J . Appl. Math., vol. 42, no. 4, pp. 933-940, Aug. 1982.
[14] C. L. Byrne and R. M. Fitzgerald, “Spectral estimators that ex- tend the maximum entropy and maximum likelihood methods,” SZAMJ. Appl. Math., vol. 44, no. 2, pp. 425-442, Apr. 1984.
[15] C. L. Byrne, R. M. Fitzgerald, M. A. Fiddy, T . J. Hall, and A. M. Darling, “Image restoration and resolution enhancement,” J . Opt. Soc. Amer., vol. 73, no. 11, pp. Nov. 1983.

CABRERA AND PARKS: EXTRAPOLATION AND SPECTRAL ESTIMATION 85 1
[16] C. L. Byrne and M. A. Fiddy, “Images as power spectra; Re- construction as a Wiener filter approximation,” Inverse Prob- lems, vol. 4, pp. 399-409, 1988.
[I71 M. Z. Nashed and G. Wahba, “Generalized inverses in repro- ducing kernel spaces: An approach to regularization of linear op- erator equations,” SIAM J. Math. Anal. , vol. 5, no. 6, Nov. 1974.
[I81 B. J. Sullivan and B. Liu, “On the use of singular value decom- position and decimation in discrete-time band-limited signal ex- trapolation, ” IEEE Trans. Acoust., Speech, Signal Processing, vol. ASSP-32, pp. 1201-1212, Dec. 1984.
[I91 H. Lee, Z.-C. Lin, and T. S. Huang, “Performance and limita- tions of discrete band-limited signal extrapolation,” in Proc. IEEE Int. Conf. ASSP (Tokyo, Japan), 1986, pp. 164551648,
[20] C. C. Chamzas, and W. Y. Xu, “An improved version of Pa- poulis-Gerchberg algorithm on band-limited extrapolation,” IEEE Trans. Acoust., Speech, Signal Processing, vol. ASSP-32, no. 2 , pp. 437-440, Apr. 1984.
[21] A. Papoulis and C. Chamzas, “Detection of hidden periodicities by adaptive extrapolation,” IEEE Trans. Acoust. , Speech, Signal Processing, vol. ASSP-27, no. 5, pp. 492-500, Oct. 1979.
[22] K. Stewart, T. S. Durrani, and J. B. Abbiss, “The effects of bandwidth misestimation in bandlimited signal extrapolation,” in Proc. IEEE Int. Conf ASSP (Tampa, FL), Mar. 1985, pp. 1497- 1500
[23] S. M. Kay and S. L. Marple, Jr., “Spectrum analysis-a modern perspective,” Proc. IEEE, vol. 69, no. 11, pp. 1380-1419, Nov. 1981.
[24] C. L. Byrne and R. M. Fitzgerald, “Fourier transform estimation using prior knowledge,” unpublished manuscript.
[25] H. Lee, D. P. Sullivan, and T. S. Huang, “Improvements of discrete bandlimited extrapolation by iterative subspace modifi- cation,” in Proc. IEEE Int. Con$ ASSP (Dallas, TX). Apr. 1987,
[26] A. A. Melkman and C. A. Micchelli, “Optimal estimation of linear operators in Hilbert spaces from inaccurate data,” SIAM J . Nitmer. Anal. , vol. 16, no. 1, pp. 87-105, Feb. 1979.
[27] A. Ben-Israel and T. N. E. Greville, Generalized Inverses: The- ory and Applications.
(281 P. J . Davis, Circulant Matrices. [29] S. D. Cabrera, “Optimal recovery of signals from linear mea-
surements and prior knowledge,” Ph.D. dissertation, Dep. Elec. Comput. Eng., Rice University, Houston, TX, May 1985.
[30] S. Kay, Modern Spectral Estimation: Theory and Application. Englewood Cliffs, NJ: Prentice-Hall, 1988.
[31] S. L. Marple, Jr., Digital Spectral Analysis. Englewood Cliffs, NJ: Prentice-Hall, 1987.
[32] C.-H. Chi, “Autoregressive and sinusoidal spectral estimation based on adaptive extrapolation algorithms,” M.S. thesis, Dep. Elec. Comput. Eng., Pennsylvania State Univ., June 1989.
[33] S. D. Cabrera and C. H. Chi, “Frequency estimation by reduced order adaptive extrapolation,” in Proc. 1989 Johns Hopkins Conf Inform. Sci. Syst. (Baltimore, MD), Mar. 1989.
[34] S. I). Cabrera, J . T . Yang, and C. H. Chi, “Estimation of si- nusoids by adaptive minimum norm extrapolation,” in Proc. Fifrh
pp. 1569-1572.
New York: Wiley, 1974. New York: Wiley, 1979.
ASSP Workshop Spectrum Estimation, Modeling (Rochester,
[35] S . D. Cabrera and C. Chen, “Phase retrieval by optimal weighted norm extrapolation,” in Advances in Communications and Signal Processing, W. A. Porter and S. C. Kak, Eds. Heidelberg: Springer, 1989, pp. 303-314.
NY), Oct. 1990, pp. 35-39.
Sergio D. Cabrera (S’77-M’79) was born in Cananea, Sonora, Mexico, on July 28, 1955. He received the Bachelor of Science degree from the Massachusetts Institute of Technol- ogy, Cambridge, in 1977, the Master of Sci- ence degree from the University of Arizona, Tucson, in 1979, and the Ph.D. degree from Rice University, Houston, TX, in 1985, all in electrical engineering.
From 1979 to 1980, he was a full-time Re- search Assistant in the Digital Image Analysis
Laboratory at the University of Arizona. From 1985 to 1987, he was employed at Anadrill/Schlumberger in Sugar Land, TX, where he worked on signal processing problems for a system of measurements while drilling. Since 1987, he has been Assistant Professor of electrical engineering and a member of the Spatial and Temporal Signal Pro- cessing Center, Pennsylvania State University, University Park. His research interests include signal theory, signal reconstruction, multi- rate signal processing, spectral estimation and modeling, and imple- mentation of signal processing algorithms.
Dr. Cabrera is a member of Tau Beta Pi and Eta Kappa Nu.
Thomas W. Parks (S’66-M’67-SM’79-F’82) received the Ph.D. degree from Cornell Uni- versity.
He joined Rice University, Houston, TX, in 1967, where he was a Professor of Electrical Engineering until 1986. Since 1986 he has been a Professor of Electrical Engineering in the School of Electrical Engineering at Cornell University. He is coauthor of the books DFT/ FFT and Convolution Algorithms and Digital Filter Design (New York: Wiley, 1985 and
1987, respectively). He is also coauthor of two laboratory manuals for digital signal processing laboratories using the TMS32010 and the TMS320C25 (Englewood Cliffs, NJ: Prentice-Hall). His research is in the areas of time-frequency analysis and synthesis of signals, signal reconstruction, array processing for sonar and seismic applications, digital filter design, and neural networks.
Dr. Parks received the Society Award and the Technical Achieve- ment Award of the IEEE Acoustics, Speech, and Signal Processing Society. He has been a member of the Administrative Committee of that society and has been an Associate Editor for the IEEE TRANSAC- TIONS ON ACOUSTICS, SPEECH, AND SIGNAL PROCESSING. He is a recip- ient of the Alexander von Humboldt Foundation Senior Scientist Award and has been a Senior Fulbright Fellow.