Estimating Norm-Referenced Information from a Criterion - ERIC
75
ED 295 972 AUTHOR TITLE PUB DATE NOTE PUB TYPE DOCUMENT RESUME TM 011 778 Schattgen, Sharon F.; Osterl:nd, Steven J. Estimating Norm-Referenced Information from a Criterion- Referenced mest: An Application of the ORT ONLY MODEL. Apr 88 94p.; Paper presented at the Annual Meeting of the National Council on Measurement in Education (New Orleans, LA, April 1988). Reports Evaluative/Feasibility (142) -- Speeches /Conference Papers (150) EDRS PRICE MF01/PC04 Plus Postage. DESCRIPTORS *Criterion Referenced Tests; Elementary Seccadary Education; *Equated Scores; *Estimation (Mathematics); Models; National Norms; *Norm Referenced Tests; Raw Scores; Test Interpretation IDENTIFIERS *ORT ONLY MODEL ABSTRACT An investigation is described of the ORT ONLY MODEL, which is one of four models being used to obtain national norm-referenced and local criterion- or objective-referenced information from a single assessment instrument. Raw scores on a norm-referenced test (NRT) were equated to raw scores on an objective-referenced test (ORT). Resultant equating tables were used to estimate norm-referenced scores for examinees taking only the ORT. Preliminary analyses indicated that corresponding ORT and NRT subject tests were similar in terms of content and statistical properties and that correlation coefficients exceeded the minimum levels for ORT-NRT equating set by Chapter I guidelines. Technical considerations, however, indicate that estimated comparable national percentile ranks should be used cautiously. (SLD) *********************************************************************** Reproductions supplied by EDRS are the best that can be made from the original document. ***********************************************************************
-
Upload
khangminh22 -
Category
Documents
-
view
1 -
download
0
Transcript of Estimating Norm-Referenced Information from a Criterion - ERIC

ED 295 972
AUTHORTITLE
PUB DATENOTE
PUB TYPE
DOCUMENT RESUME
TM 011 778
Schattgen, Sharon F.; Osterl:nd, Steven J.Estimating Norm-Referenced Information from aCriterion- Referenced mest: An Application of the ORTONLY MODEL.Apr 8894p.; Paper presented at the Annual Meeting of theNational Council on Measurement in Education (NewOrleans, LA, April 1988).Reports Evaluative/Feasibility (142) --Speeches /Conference Papers (150)
EDRS PRICE MF01/PC04 Plus Postage.DESCRIPTORS *Criterion Referenced Tests; Elementary Seccadary
Education; *Equated Scores; *Estimation(Mathematics); Models; National Norms; *NormReferenced Tests; Raw Scores; Test Interpretation
IDENTIFIERS *ORT ONLY MODEL
ABSTRACTAn investigation is described of the ORT ONLY MODEL,
which is one of four models being used to obtain nationalnorm-referenced and local criterion- or objective-referencedinformation from a single assessment instrument. Raw scores on anorm-referenced test (NRT) were equated to raw scores on anobjective-referenced test (ORT). Resultant equating tables were usedto estimate norm-referenced scores for examinees taking only the ORT.Preliminary analyses indicated that corresponding ORT and NRT subjecttests were similar in terms of content and statistical properties andthat correlation coefficients exceeded the minimum levels for ORT-NRTequating set by Chapter I guidelines. Technical considerations,however, indicate that estimated comparable national percentile ranksshould be used cautiously. (SLD)
***********************************************************************
Reproductions supplied by EDRS are the best that can be madefrom the original document.
***********************************************************************

Estimating Norm-referenced Information from a Criterion-referenced Test:An Application of the ORT ONLY MODEL
U 8 DEPARTMENT OF EDUCATIONOnce of Educational Research and Improvement
MU AT1ONAL RESOURCES)
INFORMATIONCENTE (ERIC
This document haS been I eproduced asreceived from the person or OrganaatiOnOngmeting It
C Mine( Lhanges have been made to ImprOvereproduction quality
Points& view or opinionsstated in thiS dOCu-ment do not neCeSCanly represent officialOERI position or policy
"PERMISSION TO REPRODUCE THISMATERIAL HAS BEEN GRANTED BY
S, r som-rr4,-A)
TO THE EDUCATIONAL RESOURCESINFORMATION CENTER (ERIC)"
Sharon F. Schattgen
and
Steven J. Osterlind
Center for Educational AssessmentUniversity of Missouri-Columbia
Paper Presented at the Annual Meeting of theNational Council on Measurement in Education
New Orleans, Louisiana, April 1988

ABSTRACT
Estimating Norm-referenced Information from a Criteri,_ eferenr.e.c3 Test:An Application of the ORT ONLY MODEL
Sharon F. Schattgen & Steven J. OsterlindUniversity of Missouri-Columbia
This paper describes an initial investigation of the ORT ONLY MODEL, one offour models currently being used to obtain both national norm-referencedand local criterion- or objective-referenced information from a singleassessment instrument. Using data from a representative sample ofexaminees, raw scores on a norm-referenced test (NRT) were equated to rawscores on a state-developed objective-referenced test (ORT) usingequipercentile procedures. The resultant equating tables w 're used toestimate norm-referenced scores, estimated comparable nat_onal percentileranks, for examinees taking only the ORT. The estimated comparablenational percentile ranks were reported at the individual student levelprimarily for Chapter I purposes. While preliminary analyses indicated thatcorresponding ORT and NRT subject tests were similar in erms of contentand statistical properties and that their correlation coefficients exceeded theminimum levels suggested for ORT-NRT equating by Chapter I guidelines,technical considerations suggested that the estimated comparable nationalpercentile ranks be used cautiously pending further research. The practicalutility of reporting estimated comparable national percentile ranks at theindividual student level is discussed. Strengths of this particular applicationof the ORT ONLY MODEL and recommendations for future research in thisarea are delineated.

Estimating Norm-referenced Information from a Criterion-referenced Test:An Application of the ORT ONLY MODEL
Sharon F. Schattgen and Steven J. OsterlindUniversity of Missouri-Columbia
During recent years, many large scale assessment program, have attempted toobtain both national norm-referenced as well as local criterion- or objective-referenced information irom a single assessment instrument. This is done tominimize the cost of the testing program as well as to reduce the timerequired for testing.
Keene and Holmes (1987) described four models- -the NRT ONLY, the NRT-BASED, the ORT-BASED, and the ORT ONLY--currently being used for thistype of dual purpose testing and offered several recommendations for curtherresearch into the question of "whether the information obtained from thefour models is psychometrically valid and practically useful" (p. 26). Theyspecifically called for investigations of the utility of using the models to reportnorm-referenced interpretations at the individual student level.
This paper describes the initial stage of such an investigation of the ORTONLY MODEL. The procedures used in Missouri to obtain and report norm-referenced data from the state objective-referenced achievement battery andthe methods of presenting these data are delineated. In addition, the practicalutility of the norm-referenced information at the individual student leveland at the aggregate level is discussed. This paper does not present a detailedtechnical analysis of the norm-referenced data, but general findings arediscussed in order to address implications of using the ORT ONLY MODEL.
Models for Obtaining Norm- and Objective-referenced Information
All four models identified by Keene and Holmes (1987) include theadministration of either a nationally normed and standardized achievementtest (NRT) developed by a commercial publisher, an objective-referencedachievement test (ORT) developed locally by a state or a district (or theircontractor), :,r some combination of both. "The models differ with respect tothe amount of customization employed and the design used to produce thenorm-referenced information" (p. 7). A brief description of the four modelsfollows.
The first model consists of administering only a norm-referenced test at oneor more grade levels locally and is called the NRT ONLY MODEL. The

2
content of the NRT matches local objectives; performance is reported for boththe national curriculum and the objectives common to the NRT and the localcurriculum. The NRT ONLY MODEL is cost-effective and efficient in termsof collecting information. However, the objective-referenced informationobtained by using this model is not adequate for anything but ancillaryinformation. Thus it is most appropriately used when norm-referencedrather than local objective-referenced information is emphasized.
The second, the NRT-BASED MODEL, consists of the administration of anationally normed achievement test along with supplemental itemsmeasuring local objectives. The supplemental items may augment thoseincluded in the NRT or they may replace them. The NRT-BASED MODEL,like the NRT ONLY MODEL, is cost-effective, and yields valid normative andobjective-referenced information. It is most often used to enhance localobjectives when the match is minimal between the NRT and the objectives.Extra testing time is required, however, if the supplemental items augmentratter than replace those in the NRT.
The ORT-BASED MODEL, the third design, features an objective-referencedtest used in combination with some portion of a norm-referenced test. Twodesigns can be used to collect the norm-referenced information: (a) arepresentative subset of the NRT items is given to all students, or (b) differentsections of the NRT are given to different groups of students through matrixsampling. The ORT-BASED MODEL is efficient in terms of collecting norm-ref erenced information. In addition, the objectives making up the localcurriculum are those on which local instructional programs are evaluated. Itis expensive, however, in that it involves the development of a completelycustomized testing program. Another drawback is that the norm-referencedinformation is less accurate than that offered by the two models previouslydescribed. Thus such data are usually reported at only the aggregate level.
The ORT ONLY MODEL is the fourth design for generatir.,, national norm-referenced and local objective-referenced information and the one on whichthis paper focuses. This model utilizes a concurrent administration of anNRT and an ORT to a representative sample of the student population. Thescores from the two tests are equated using any one of a number of equatingmethods. The norm-referenced scores are then estimated for the studentpopulation using their objective-referenced scores. Once the equating hasbeen done, only the ORT needs to be administered during subsequentassessments. This makes the model efficient, but it also raises a questionabout the long-term accuracy of the norm-referenced information. Thus thenormative scores are usually reported at the aggregate level. Keene andHolmes (1987) stressed the critical importance of the content match of the twotests and noted the problem of equating two tests of unequal difficulty. Theyconcluded that "any norm-referenced scores computed with the ORT ONLYMODEL must be used with extreme caution" (p. 22).
5

3
Background: Technical and Practical Considerations
Previous Applications of Chapter I A2 Model and ORT ONLY MODEL
The interest in obtaining norm-referenced information from a criterion- orobjective-referenced test can be traced to the 1970s, when educators soughtassessment systems that would yield data required by federally-fundededucational programs, particularly Title I (now Chapter I), and data that couldbe used locally to evaluate curriculum and instruction. Title I officialsdevised the A2 model, which uses norms derived from equating an ORT toan NRT, to meet both needs (Echternacht, 1980). The ORT ONLY MODEL issimilar to the A2 model except that scores are reported at the individualstudent level in the A2 model but at only the aggrec;ate level in the ORTONLY MODEL.
There is not a great body of research on ORT-NRT equating. Of the fewstudies investigating this topic, most were conducted in the context ofChapter I applications of the A2 model. This research has been limited inscope and has not yielded definite findings about whether or how best toobtain NRT data from an ORT.
Roudabush (1975) was one of the earliest to investigate the possibility ofobtaining NRT data from an ORT. He used regression procedures to predictnorm-referenced scores from a prescriptive reading inventory. Roudabushfound over-prediction at the low end and under-prediction at the high end ofthe score distribution and concluded that there was considerable variation inthe accuracy of predicting individual scores.
In a critique of Title I evaluation models, Linn (1978) stated that the NRT andthe ORT used in the A2 design should be "highly correlated" and that theminimum correlation of .60 specified by Title I guidelines was "much toolenient" (p. 12). Linn noted that "under equating conditions much betterthan can generally be expected for Model A2 applications, systematic errorsmay be introduced simply due to the equating" (p. 14). A simulated datastudy led him to conclude that it was inappropriate to use data from one testto establish the expected performance level for another test in the context ofTitle I evaluations.
Fishbein (1978) and Bunch (1982) also pointed out the necessity of a highcorrelation between the NRT and the ORT if the two were equated for Title Iti.ces. Fishbein warned of the potential sources of equating error representedby floor and ceiling effects, while Bunch suggested that the Title I A2 modelyielded "estimates of estimates" (p. 18).

4
Despite these concerns, the focus shifted from whether norm-referencedinformation could be obtained from an ORT to how best to obtain it. Storlie(1979) tried to compare four equating methods--linear, normalized,equipercentile and abbreviated equipercentile--under the Model A2 designbut found that the correlations between the NRT and the ORT were too low(all were less than .60) to justify equating. In a follow-up study withsimulated data, Crane, Prapuolenis, Rice, and Perlman (1981) compared thesame four methods and found that linear equating was generally thepreferred method. They also found that, in general, as the correlationbetween the two tests increased, equating error decreased. Crane et al.concluded that, depending on sample size and equating method, the A2model could be useful if ORT distributions exhibited a relatively normaldistribution.
Several researchers have investigated the use of item response theoryequating procedures for obtaining norm-referenced information from anORT. Both Bauer (1979) and Holmes (1980) used Rasch equating tosuccessfully link criterion-referenced test items to a norm-referencedachievement battery. Bauer's study utilized a state assessment instrument,while Holmes' work focused on a Rasch calibrated item bank. In preparing toimplement the ORT ONLY MODEL, the Texas Education Agency (TEA) (1986)compared Rasch and equipercentile procedures in order to determine whichshould be used to equate the statewide test of minimum skills to a nationallynormed achievement battery. TEA found no difference in the expectednorm-referenced scores produced from the two methods and concluded thatthe two procedures yielded "virtually identical results" (p. 4). Even thoughthere was no clear statistical basis for choosing one equating method overanother, TEA decided to use the Rasch procedure.
These findings taken together suggest that a high correlation between theNRT and the ORT is necessary for a successful equating, but that equatingerror is difficult to avoid. The method of equating is likely to influence theaccuracy of the equated scores, but there is no conclusive evidence from thesestudies suggesting the use of one method over another.
Limitations of Equating NRT and ORT Scores
The limitations of ORT-NRT equating were addressed by Angoff (1984) in adiscussion of equating tests of unequal reliabilities: "When two tests are notinterchangeablefor example when their reliabilities are unequal--their scorescannot be 'equated' in any meaningful way" (p. 101). Angoff noted thatscores from two nonparallel tests can, however, be made "comparable withrespect to a particular group of examinees if their distributions of scores areidentical" (p. 128). Comparability will hold with respect to other groups, butonly if those "groups are drawn from the same population as the group onwhich comparability was originally established" (p. 128).
7

5
Angoff suggested that if the methods of equating parallel test forms areapplied to the problem of obtaining comparable scores (e.g., NRT data from anORT), two questions should be asked:
(1) How similar are the tests for which comparable scores areto be developed?
(2) How appropriate is the group on which the table ofcomparable scores is based when one considers the person orthe group for whom the table is to be used? (p. 139)
According to Angoff, after these questions are answered, the use of thecomparable scores and the nature of the decisions that they would be used tomake should be considered. His comments imply that under certaincircumstances ORT-NRT equating is defensible.
Missouri Application of the ORT ONLY MODEL
Missouri Mastery and Achievement Tests
In 1985, the Missouri General Assembly passed the Excellence in EducationAct, which requires all local school districts in the state to test studentsperiodically with criterion-referenced tests over specific objectives in languagearts, reading, English, mathematics, science, social studies, and civics. Thislaw also requires that a representative sample of students be tested over theseobjectives each year, with the results being reported to the legislature.Objectives were written for grades two through ten and are called the "KeySkills."
The Missouri Mastery and Achievement Tests (MMAT) (Osterlind, 1987)were created especially to measure students' acquisition of the Key Skills. TheMMAT battery consists of objective-referenced tests for grades two throughten in four areas: language arts/reading/English, mathematics, science, andsocial studies/civics. There are at least two equivalent forms for each test.Every effort was made during the development of the MMAT to adhere tothe Standards for Educational and Psychological Testing (AmericanPsychological Association, [APA], 1985) in order to ensure that it would yieldvalid measures of student achievement. Appendix A presents a technicalsummary of the MMAT.
The first administration of the MMAT, using Form A, occurred in the springof 1987 to students in grades three, six, eight, and ten. The firstadministration of the entire battery of tests (Forms B and D) for grades twothrough ten will occur in the spring of 1988.

Decision to Obtain NRT Data from MMAT
The Missouri Department of Elementary and Secondary Education decidedthat the MMAT should yield norm-referenced information as well asobjective-referenced information, so that local districts could save time andmoney by administering only one achievement battery. The primary impetusfor the Department's decision was districts' need to obtain national norm-referenced information in reading, language arts, and mathematics for allstudents to determine eligibility for Chapter I services and on Chapter Iparticipants to evaluate the program. The Department also hoped thatMMAT norm-referenced information, especially when aggregated, mightsatisfy other district needs for NRT data.
If norm-referenced information were not available from the MMAT, districtswould be forced to administer both an NRT and the MMAT at a minimum offour grades. Districts are required to test students over the Key Skills at aminimum of four grades each academic year--two nonconsecutive levelswithin the grade span two through six and two nonconsecutive levels withinthe grade span seven through twelve (Missouri Department ci Elementaryand Secondary Education, 1986). (Many districts plan to go beyond thisrequirement and will administer the MMAT to grades two through ten eachyear.) The limitations and concerns cited previously (e.g., Angoff, 1984; Linn,1978) were carefully considered before this decision was reached, butultimately practical considerations outweighed concerns about possibletechnical problems. It was hoped, however, that by watching out for potentialpitfalls and by heeding Angoff s (1984) comments regarding score derivationand use, norm-referenced information could successfully be obtained fromthe MMAT.
Selection of ORT ONLY MODEL and NRT
TLe Missouri program emphasizes an objective-referenced assessment of theKey Skills and includes but is not limited to collection of data for a sample ofrepresentative students. These features made the ORT ONLY MODEL theappropriate mechanism for obtaining NRT information. Form G of both theIowa Tests of Basic Skills (ITBS) (Hieronymus and Hoover, 1986a) arid theTests of Achievement and Proficiency (TAP) (Scannell, 1986a) were chosen forequating to the MMAT at grades two through eight and at grades nine andten, respectively. The technical characteristics of the ITBS and the TAP aregiven in the Preliminary Technical Summary (Riverside Publishing Co.,1986a).
These two vertically linked NRTs were chosen primarily because theymeasure content similar to the Key Skills, a critical factor in the success of anORT-NRT equating (Keene and Holmes, 1987). For information on the
9

7
content match between the MMAT and the ITBS/TAP; refer to ITBS /TAPCorrelated to Key Skills for Missouri Schools (Riverside Publishing Co.,1986b).
Selection of Equating Method
Equipercentile equating was selected for the Missouri application of the ORTONLY MODEL because it appeared to be the most appropriate method in lightof practical and technical considerations. ITBS/TAP national percentile ranksare derived from raw score tables, so the mcchod selected had to utilize rawscores. Thus, it was not possible to equate using the item response theorytwo-parameter logistic model (which might have been worthy ofconsideration had it been supported in the literature) that was used to deriveMMAT subject scaled scores. (See Appendix A for a description of MMATscores and scaling procedures.) The problem of access to the ITBS/TAP normscould have been overcome by Rasch equating, used successfully by Holmes(1980) and the Texas Education Agency (1586), but then the item responsetheory model used for equating would be different from that used forderiving scaled scores.
Linear equating, which utilizes raw scores, was recommen&d by Crane,Prapuolenis, Rice, & Perlman (1981). This method, however, assumes thatthe only differences between the distributions of the two tests being equatedare the mean and standard deviation (Crocker and Algina, 1986).Equipercentile equating, which also utilizes raw scores, does not make suchan assumption. It is "the only way to ensure equivalent scores when thedistribution shapes are different is to equate by curvilinear (equipercentile)methods" (Angoff, 1984, p. 88). Skaggs and Lissitz (1986), in a study of fourequating methods, found that equipercentile equating was preferable if thepsychometric properties of the two tests being equated were different. Theresults of a 1986 pilot study, in which the ITBS and field test versions of theMMAT were concurrently administered, indicated that the psychometricproperties of the two batteries were in fact different. Thus, equipercentiletquating seemed to be the method that would best fit the data.
Exceptions to ORT ONLY MODEL
If MMAT results are to be used for Chapter I purposes, norm-referencedinformation at the individual student level is needed. In order to improvethe accuracy of individual student NRT scores, the NRT and the ORT will beequated each year rather than only once. Therefore, the Missouri procedurefeatures two exceptions to the ORT ONLY MODEL: (a) NRT score reporting atthe individual student level, and (b) annual recalibration of the NRT scores.

8
Method
Subjects
Approximately 240,000 students in grades 3, 6, 8, and 10 participated in thefirst administration of the MMAT during the spring of 1987. At each of thesefour grade levels, ten percent of the total number of students tested (around6,000 per grade) were selected for inclusion in the representative state sampleusing a stratified random cluster sampling technique. The scores achieved bystudents in the sample were used to report MMAT results to the legislatureand in the equating procedure.
Procedure
A single-group rather than an equivalent-groups design was used for theequating in an attempt to minimize equating error. The students making upthe state sample for grades 3, 6, and 8 were randomly assigned to one of fivegroups. One subject test of the ITBS (either reading, language arts,mathematics, science, or social studies) and the entire MMAT wereadministered to each group. Students in the tenth grade sample wererandomly assigned to one of four groups. One subject test of the TAP (eitherreading, mathematics, science, or social studies) and the entire MMAT wereadministered to each group. The specific subtests making up each ITBS/TAPsubject test are listed in Appendix B.
Counterbalanced administrations were not systematically incorporated intothe procedure because of logistical constraints. It is possible that some degreeof counterbalancing resulted even without such a provision.
Students who took only one of the two corresponding MMAT and ITBS/TAPsubject tests were eliminated from the equating data base. The number ofstudents taking each pair of corresponding subject tests at each grade ispresented in Table 1. These groups exceed the minimum size of 400examinees per test recommended by Brennan and Kolen (1987).
[Insert Table 1 about here]
Equipercentile Equating of Raw Scores
Raw scores on the corresponding MMAT and ITBS/TAP subject tests wereequated using the equipercentile method (Angoff, 1984). An MMAT rawscore was considered equivalent to the ITBS/TAP raw score that had theclosest cumulative frequency in the sample. In the intonst of brevity, tablesof equivalent scores are not presented in this paper but are available from theauthors upon request.
11

9
Equated ITBS/TAP raw scores were converted to national percentile ranksusing conversion tables (Hieronymus and Hoover, 1986b; Scannell, 1986b).These data were then used to estimate percentile ranks for all other studentswho took the MMAT in the spring of 1987. As a result, each examinee's rawscore on an MMAT subject test was used to estimate his/her nationalpercentile rank in that subject.
Characteristics of MMAT and ITBS/TAP Subject Tests
Tables 2 through 6 present test length (number of items), mean, standarddeviation, index of item difficulty (mean "p" value), and estimate ofreliability (Kuder-Richardson 20 or 21) for the raw score distributions ofcorresponding MMAT and ITBS/TAP subject tests.
[Insert Tables 2 through 6 about here]
As would be expected, the raw score distributions of corresponding tests donot exhibit the identical properties called for by Angoff (1984). For example,differences in mean "p" values range from .01 at grades 6 and 10 mathematicsto .22 at grades 3 and 8 social studies.
A number of pairs demonstrate strikingly similar characteristics, especiallymathematics at grades 6, 8, and 10 and science at grade 10. Note in particularthe similarities in item difficulty and reliability in corresponding subject testsof different lengths, such as mathematics and science at grade 10
Figures 1 through 19 graphically show the equating study raw scoredistributions of corresponding MMAT and ITBS/TAP subject tests. Theshapes of the MMAT distributions vary. A few approximate symmetry, suchas language arts at grade 8 and mathematics at grade 10, while skewness isapparent in reading at all four grades. Most of the ITBS/TAP distributionsare, as would be expected, symmetrical. Several MMAT and ITBS/TAP andcorrespondi:g subject tests have remarkably similar distributions, such asmathematics and language arts at grade 6, language arts at grade 8, andmathematics at grade 10.
[Insert Figures 1 through 19 about here]
Scatterplots depicting the relationship of corresponding MMAT andITBS/TAP subject test raw scores are shown in Figures 20 through 38. Somerelationships appear to be linear, such as mathematics at grade 6 and languagearts at grade 8. Most, however, are curvilinear. The scatterplots, as well as thegraphs, indicate ceiling effects on several MMAT subject tests (e.g., reading atgrades 3 and 6 and language arts at grade 3). Floor effects are not apparentfrom the data.
12

10
[Insert Figures 20 through 38 about here]
Pearson product moment coefficients relating corresponding MMAT aidITBS/TAP subject tests are presented in Table 7. These correlations rangefrom .713 to .870; all exceed tile Title I minimum for ORT-NRT equating of.60. In general, the correlations are relatively stable across subjects and acrossgrades. The correlations for Chapter I program subjects -- reading, languagearts, and mathematicsare all quite similar. The correlations for mathematicsat grades 6 and 8 show a slightly higher relationship than those for othersubjects. The lowest correlation is between the science tests at grade .
[Insert Table 7 about here]
It is important to keep in mind that a test cannot correlate more highly withany other score than it correlates with its own true score (Allen and Yen,1979), so the reliabilities of two corresponding subject tests set the upper limitof their correlation coefficient.
Estimated Comparable Percentiles, Not Equated Percentiles
Equating is a term reserved for linking scores on two tests that measure thesame psychological function (Angoff, 1984). As noted, correspondingITBS /TAP and MMAT subject tests measure similar but not identical contentand have similar but not identical psychometric properties. According to theStandards for Educational and Psychological Testing (APA, 1985) this type ofconversion should not be regarded as yielding equated or interchangeableccot.r!s but rather as having been done to achieve comparability.
The procedures used to achieve comparability may be thesame as those used in test equating, but the strict requirementsof test equating will not be satisfied and, therefore, the resultingscores should be called scaled or comparable rather thanequated. (p.32 )
Thus, norm-referenced scores derived tom the MMAT are presented asestimated comparable national percentile ranks rather than as equatedpercentile ranks.
Practical Utility of Estimated Comparable Scores
Accuracy of Estimated Comparable National Percentile Ranks
It was not possible to cross validate the results of the 1987 equating study dueto practical constraints, so the accuracy of the MMAT estimated comparable
11
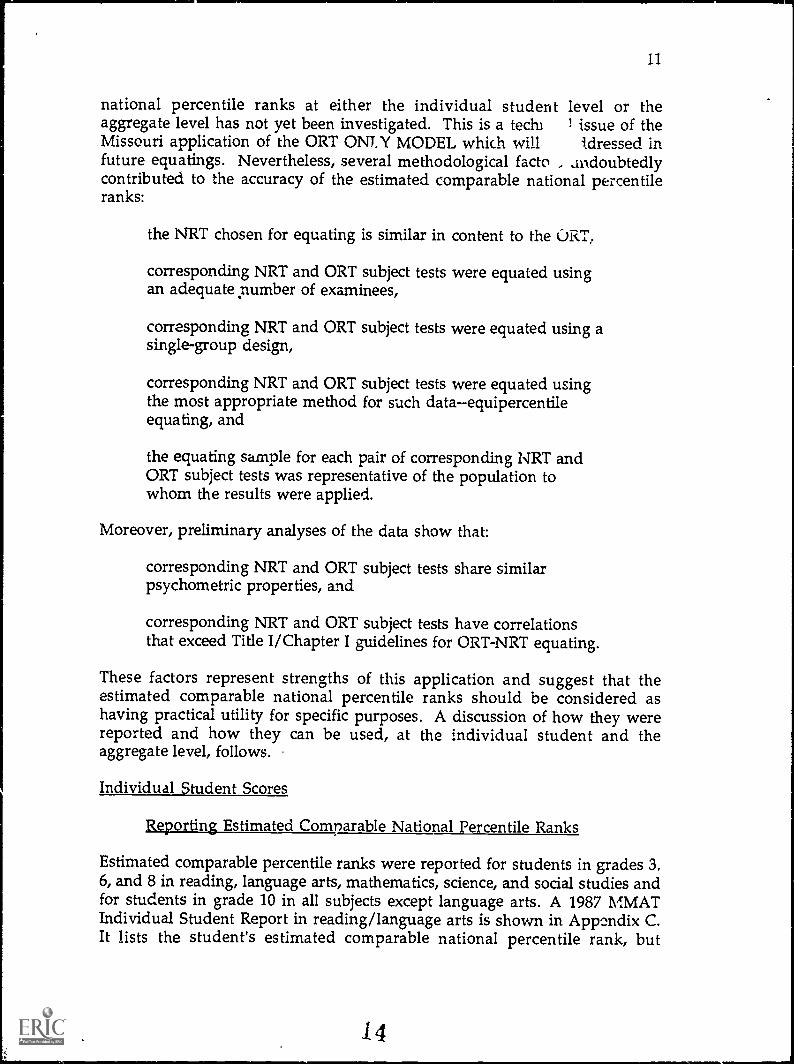
national percentile ranks at either the individual student level or theaggregate level has not yet been investigated. This is a tech) I issue of theMissouri application of the ORT ONLY MODEL which will Idressed infuture equatings. Nevertheless, several methodological facto .. dndoubtedlycontributed to the accuracy of the estimated comparable national percentileranks:
the NRT chosen for equating is similar in content to the ORT,
corresponding NRT and ORT subject tests were equated usingan adequate number of examinees,
corresponding NRT and ORT subject tests were equated using asingle-group design,
corresponding NRT and ORT subject tests were equated usingthe most appropriate method for such dataequipercentileequating, and
the equating sample for each pair of corresponding NRT andORT subject tests was representative of the population towhom the results were applied.
Moreover, preliminary analyses of the data show that:
corresponding NRT and ORT subject tests share similarpsychometric properties, and
corresponding NRT and ORT subject tests have correlationsthat exceed Title I/Chapter I guidelines for ORT-NRT equating.
These factors represent strengths of this application and suggest that theestimated comparable national percentile ranks should be considered ashaving practical utility for specific purposes. A discussion of how they werereported and how they can be used, at the individual student and theaggregate level, follows.
Individual Student Scores
Reporting Estimated Comnarable National Percentile Ranks
Estimated comparable percentile ranks were reported for students in grades 3,6, and 8 in reading, language arts, mathematics, science, and social studies andfor students in grade 10 in all subjects except language arts. A 1987 MMATIndividual Student Report in reading/language arts is shown in Appendix C.It lists the student's estimated comparable national percentile rank, but
14

12
emphasizes objective-referen-ed informationsubject and cluster (a group ofrelated Key Skills) scores and Key Skill mastery data. A student's comparablescores were also listed on his/her 1987 MMAT Student Score Report Label (anadhesive-backed label for a permanent record).
The estimated comparable percentile ranks were used to prepare a specialreport called the MMAT Chapter I Eligibility List. This report lists thestudents in a designated grade that are eligible for Chapter I services in one,two, or all three subjects: reading, mathematics, and language arts. Eachstudent's estimated comparable national percentile rank and itscorresponding normal curve equivalent is listed. Appendix D presents theChapter I eligibility standards for each grade, and Appendix E is a 1987 MMATChapter I Eligibility List.
Using Comparable Scores for Chapter I Purposes
As stated previously, the ORT ONLY MODEL was implemented in Missouriprimarily to enable districts to utilize MMAT results for Chapter I purposes.Thus, estimated comparable national percentile ranks in reading, languagearts, and mathematics are used for determining eligibility for placement inrespective Chapter I programs as well as for program evaluation.
The use of MMAT estimated comparable national percentile ranks forChapter I purposes does not conflict with Angoff's guidelines regarding theuse of comparable scores. Because these scores are obtained from. equatingtwo nonparallel tests, they imply a level of achievement that is relative (orcomparable) from one test to another. For example, the performance of astudent scoring at the 40th percentile on the MMAT is relative to that samelevel of achievement on the ITBS/TAP.
As previously mentioned, floor and ceiling effects can induce error into theequating process (Fishbein, 1978). Floor effects are not apparent in this ORT-NRT equating, although most students in Chapter I programs would notscore so low that floor effects would be a problem. In fact, most eligibilitycutoff scores (see Appendix D) are within the range of the score distributionwhere equating error is likely to be minimal. Ceiling effects are less likely tobe a problem with respect to Chapter I applications than they are for otherpurposes, such as identifying academically talented and gifted students (whichis discussed in the following section).
It is importart to keep in mind that the decision to report individual studentestimated comparable national percentile ranks was based on the need toprovide a mechanism for minimizing testing time and cost at the localdistrict level. The estimated comparable scores are, therefore, reported for theconvenience of MMAT users in need of data for Chapter I applications.However, their validity for such purposes has not yet been empirically
15

13
determined; this will be the focus of further investigations of the Missouriprocedure.
Using Comparable Scores for Gifted Education Program Purposes
There is likely to be more error in estimating comparable scores in the tails ofthe score distribution than in the middle range (Roudabush, 1975). Ceilingeffects, one source of error in the upper tail, were apparent in the MMATdistributions. These effects suggested that the comparable scores should notbe used to identify students for placement in gifted education programs.Subject scaled scores, derived using item response theory (see Appendix A),seemed to be much more approp.iate for such a purpose. Consequently,MMAT users were provided with the state percentile ranks of subject scaledscores for the purpose of identifying academically talented and gifted students.
Using Comparable Scores as Substitutes for NRT Scores
Until their accuracy can be empirically determined, estimated comparablenational percentile ranks should probably not be routinely used as substitutesfor actual NRT scores. Teachers, counselors, and administrators were,therefore, discouraged from treating these scores as if they were equivalent tothose resulting from administration of an NRT. This is in keeping with thedistinction between equated and comparable scores given in the Standards forEducational and Psychological Testing (APA, 1985):
To say that scores have been made comparable is a weaker claimthan to say that they have been equated. Equated scores are meantto be interchangeable, whereas comparable scores are meant to besimilar in a particular sense. (p. 32)
Because estimated comparable national percentile ranks were reported on1987 Individual Student Reports, users tended to put more stock in themthan was appropriate. The norm-referenced information will not bepresented on the 1988 Individual Student Reports in an attempt to minimizemisinterpretation. In 1988, estimated comparable national percentile rankswill only be reported on the Student Score Report Label and the Chapter IEligibility List.
The decision to exclude NRT scores from Individual Student Reports willhopefully eliminate problems resulting from the different methods used toscale MMAT results. Estimated comparable national percentile ranks, as wellas Key Skill mastery results, were obtained using raw scores, while the subjectscaled scores were obtained using a two-parameter item response theorymodel (see Appendix A). The different scales caused some understandableconfusion on the part of MMAT users, because it was possible for twostudents to achieve the same estimated comparable national percentile rank
1' 16

14
but different scaled scores and differeni. Key Skill mastery results in aparticular subject.
Aggregate Scores
MMAT estimated comparable national percentile ranks were not reported atthe aggregate level for the state sample or the population in 1987. Severaldistricts computed median estimated comparable national percentile ranks inorder to report aggregate level data to patrons. Aggregate level comparablescores could probably be used with confidence to assess the standing of groupsof students relative to their national peers.
It will be another year before Chapter I program evaluation data can beanalyzed, because districts are not required to collect it this academic yearwhile making the transition from an NRT to the MMAT.
Summary and Conclusions
The ORT ONLY MODEL provides a mechanism for reporting norm-referenced information from an assessment instrument that emphasizesobjective- or criterion-referenced test information. It eliminates redundanttesting, thereby saving time and money. To truly maximize the efficiency ofthe ORT ONLY MODEL, norm-referenced information is needed at theindividual student level. However, when NRT data are reported forindividual students, several issues need to be considered: (a) the accuracy ofthe individual student scores, (b) the use of appropriate procedures in order tomaximize score accuracy, and (c) the practical utility of individual student andaggregate scores.
The ORT ONLY MODEL is being implemented in Missouri to obtain norm-and objective-referenced information from the newly-developed statewideassessment. Equipercentile equating, using a single-group design, was used toobtain norm-referenced scores from the MMAT for the first time in 1987.Norm-referenced data, referred to as estimated comparable nationalpercentile ranks, were primarily reported at the individual student level andfor Chapter I purposes. Estimated comparable national percentile ranks willbe obtained annually, using the same method and design, to improve theaccuracy of the NRT data.
While it was not possible to cross validate the 1987 MMAT estimatedcomparable national percentile ranks, preliminary analyses showed that thecorresponding MMAT and ITBS/TAP subject tests from which they wereobtained are similar in terms of content and statistical properties. Moreover,correlation coefficients of corresponding subject tests were at acceptable levels
17

15
and the equating sample was representative of the population to whom theresults were applied.
Thus preliminary data analyses, as well as the use of appropriate equatingprocedures, provide support for using the individual student estimatedcomparable scores for Chapter I purposes. Because of ceiling effects,individual student estimated comparable scores should not be used foridentifying academically talented students. They should also not be viewed asequivalent to scores obtained from an NRT.
Applied measurement research is frequently conducted in less than idealcircumstances. The initial stage of this ongoing investigation of the ORTONLY MODEL was conducted in the context of a newly implementedstatewide testing program. Its shortcomings and merits will hopefully bejudged accordingly.
Recommendations for Further Research
There is much to be learned about using the ORT ONLY MODEL, both interms of whether it is a viable model and in terms of how to make certainthat, if it is used, it yields valid results. Future investigations should focus onthe following:
the worth of the ORT ONLY MODEL relative to theother three models,
the appropriateness of equipercentile equating forobtaining comparable scores,
the effects of content and test level on the equatingresults,
the accuracy of comparable scores at the individualstudent level,
the accuracy of student level comparable scores in thelow, middle, and high ranges of the distribution,
the validity of specific uses of comparable scores,
the effects of annual recalibration on the accuracy ofcomparable scores, and
the effects of instruction and, as a result, increasingly skewedORT data, on the accuracy of comparable scores.
! R

16
References
Allen, M. J., & Yen, W. M. (1979). Introduction to measurement theory.Belmont, CA: Wadsworth, Inc.
Angoff, W. H. (1984). Scales, norms, and equivalent scores. Princeton, NJ:Educational Testing Service.
American Psychological Association. (1985). Standards for educational andpsychological testing. Washington, DC: Author.
Bauer, E. A. (1979, April). How minimal is minimal? Paper presented at theannual meeting of the National Council on Measurement in Education,San Francisco. (ERIC Document Reproduction Service No. ED 177 228)
Brennan, R. L., & Ko len, M. J. (1987). Some practical issues in equating.Applied Psychological Measurement, 11_, 279-290.
Bunch, M. B. (1982, March). Using non-normed tests in Title I evaluation.Paper presented at the annual meeting of the National Council onMeasurement in Education, New York. (ERIC Document ReproductionService No. ED 220 492)
Crane, L. R., Prapuclenis, P. G., Rice, W. K., & Perlman, C. (1981). The effectof different e uatin methods on Title I evaluation model A2 NCE amestimates (Contract No. 300-79-0485). Evanston, IL: Educational TestingService.
Crocker, L., & Algina, J. (1986). Introduction to classical and modern testtheory. New York: Holt, Rinehart and Winston.
Echternacht, G. (Ed.). (1980). Measurement aspects of Title I evaluations. SanFrancisco: Jossey-Bass Inc.
Fishbein, R. L. (1978, March). The use of non-normed tests in the ESEA TitleI evaluation and re ortin s stem: Some technical and olio- issues.Paper presented at the annual meeting of the American EducationalResearch Association, Toronto. (ERIC Document Reproduction ServiceNo. ED 159 176)
Hieronymus, A. N., & Hoover, H. D. (1986a). Iowa tests of basic skills.Chicago: Riverside Publishing Co.
17
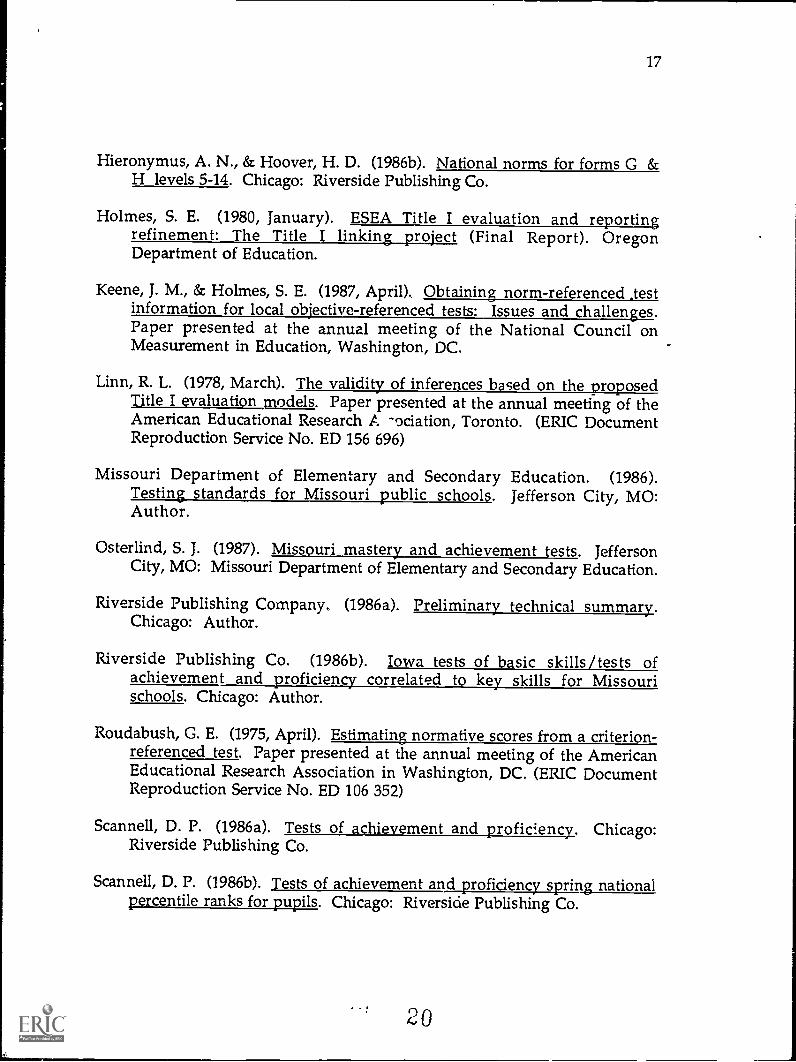
Hieronymus, A. N., & Hoover, H. D. (1986b). National norms for forms G &H levels 5-14. Chicago: Riverside Publishing Co.
Holmes, S. E. (1980, January). ESEA Title I evaluation and reportingrefinement: The Title I linking project (Final Report). OregonDepartment of Education.
Keene, J. M., & Holmes, S. E. (1987, April). Obtaining norm-referenced .testinformation for local objective-referenced tests: Issues and challenges.Paper presented at the annual meeting of the National Council onMeasurement in Education, Washington, DC.
Linn, R. L. (1978, March). The validity of inferences based on the proposedTitle I evaluation models. Paper presented at the annual meeting of theAmerican Educational Research A -ociation, Toronto. (ERIC DocumentReproduction Service No. ED 156 696)
Missouri Department of Elementary and Secondary Education. (1986).Testing standards for Missouri public schools. Jefferson City, MO:Author.
Osterlind, S. j. (1987). Missouri mastery and achievement tests. JeffersonCity, MO: Missouri Department of Elementary and Secondary Education.
Riverside Publishing Company. (1986a). Preliminary technical summary.Chicago: Author.
Riverside Publishing Co. (1986b). Iowa tests of basic skills /tests ofachievement and proficiency correlated to key skills for Missourischools. Chicago: Author.
Roudabush, G. E. (1975, April). Estimating normative scores from a criterion-referenced test. Paper presented at the annual meeting of the AmericanEducational Research Association in Washington, DC. (ERIC DocumentReproduction Service No. ED 106 352)
Scannell, D. P. (1986a). Tests of achievement and proficiency. Chicago:Riverside Publishing Co.
Scannell, D. P. (1986b). Tests of achievement and prpercentile ranks for pupils. Chicago: Riverside Publishing Co.
' !
4,'0

18
Skaggs, G., & Lissitz, R. W. (1986). An exploration of the robustness of fourtest equating models. Applied Psychological Measurement 10 (3), 303-317.
Storlie, T. R. (1979, April). An empirical comparison of Title I NCE gainsestimated with model Al and with model A2. Paper presented at theannual meeting of the American Educational Research Association, SanFrancisco. (ERIC Document Reproduction Service No. ED 200 646)
Texas Education Agency. (1986). Report on providing national comparativedata on the TEAMS test. Austin: Author.
21

719
Table 1
I' Tumber of Examinees Taking Corresponding MMAT and ITES/TAP Subject
Tests
Grade
Subject tests 3 6 8 10
Reading 1511 1327 1256 1463
Language Arts 1439 1245 1202
Mathematics 958 1258 1406 1466
Science 1463 1082 1250 1269
Social Studies 1171 1230 1768 1523
22

20Table 2
Properties of Corresponding Reading Tests
Grade
No. of Items
3ITBS
44
MMAT
52
6ITBS
56
MMAT
52
8ITBS
58
MMAT
60
10TAP
58
MMAT
60
Mean 28.06 40.86 33.77 39.07 33.09 41.95 39.52 44.87
S.D. 9.18 9.79 10.43 8.92 10.97 10.22 10.94 9.56
Mean "P" .64 .79 .61 .75 .57 .70 .69 .75
KR-20 .902 .946 .909 .928 .918 ,942 .915 .940
Note: These data were computed on the raw score distributions of the equating sample.
23

21
Table 3
Properties of Corresponding Language Arts Tests
Grade
No. of Items
3ITBS
119
MMAT
40
ITBS
141
6MMAT
48
8ITBS
148
10MMAT TAP MMAT
56
Mean 76.11 29.84 85.55 27.65 77.20 34.62
S.D. 20.29 7.36 23.09 8.02 22.03 10.30
Mean "P" .64 .75 .61 .58 .52 .62
KR-21 .939 .877 .944 .834 .930 .887
Note: These data were computed on the raw score distributions of the equating sample.
2

22
Table 4
Properties of Corresponding Mathematics Tests
Grade
3 6 8 10ITBS MMAT ITBS MMAT ITBS MMAT TAP MMAT
No. of Items 86 68 109 104 117 100 48 92
Mean 60.04 54.26 68.73 67.27 72.28 59.74 27.59 53.27
S.D. 14.03 11.04 18.70 17.29 21.57 18.01 8.80 16.47
Mean "P" .69 .78 .64 .65 .62 .59 .60 .59
KR-20 .792 .922 .862 .946 .901 .939 .913 .933
Note: These data were computed on the raw score distributions of the equating sample.

23
Table 5
Properties of Correspondin Tests
Grade
No. of Items
3ITBS
38
MMAT
64
6ITBS
43
MMAT
92
8ITBS
45
MMAT
72
10TAP
54
MMAT
80
Mean 20.37 44.69 22.41 51.08 22.41. 39.67 27.73 38.07
S.D. 5.59 9.46 6.50 12.69 6.44 10.05 8.00 10.18
Mean "P" .53 .70 .49 .56 .49 .56 .59 .53
KR-20 .764 .889 .820 .891 .814 .862 .854 .846
Note: These data were computed on the raw score distributions of the equating sample.
26

24Table 6
Properties of Corresponding Social Studies Tests
Grade
No. of Items
3ITBS
38
MMAT
56
6ITBS
43
MMAT
84
8ITBS
45
MMAT
72
10TAP
62
MMAT
100
Mean 18.63 37.0 21.96 58.361 22.13 49.15 43.22 67.76
S.D. 5.32 9.97 6.84 14.47 6.68 12.83 10.52 17.49
Mean "P" .47 .69 .49 .70 .49 .71 .71 .65
KR-20 .756 .909 .821 .935 .856 .932 .914 .950
Note: These data were computed on the raw score distributions of the equating sample.
2''i

25
Table 7
Pearson Product Moment Coefficients for Corresponding ITBS/TAP and
MMAT Subject Tests
Grade
Subject tests 3 6 8 10
Reading .799 .786 .808 .756
Language Arts .799 .781 .792
Mathematics .809 .860 .870 .856
Science .713 .809 .743 .786
Social Studies .759 .800 .789 .843
28

Figures 1 through 19
Raw Score Distributions of Corresponding MMAT and ITBS/TAP SubjectTests
r,
27

Grade 3 Reading28
MIDPOINTMMAT
8
12 ***
16 4***
20 ******
24 *******
28 **********
32 **********
36 ******%**********
40 *************A*******
44 ************************************48
****************************************************i.***********************************
30 60 90 120 150 180 210 240 270 300 330 360 390 420 450 400 510 540 570 600 630 660
FREQUENCY
MIDPOINTOTHER CTTBS)
4
8
12
24
28
36
40
44
****
0414%*****%**4v*%*****
*******************************
46 ******Q0***., *1*************
******************************************
**********4*4****************************************
********************************************0***
**Wit***
20 40 60 80 100 120 140 160 180 200 220 240 263
FREQUENCY

Grade 6 Reading
MIDPOINTMUT
8
12
16
20
24
28
32
36
40
44
48
29
0*
****
***Of**
**********000*
*0***00**********
*00000000000000000000***
*****0**0*********0*0*********
*0000000000000000000000000000000***
**************************************************00***0*
************************************************0**0************************
20 40 60 80 100 120 140 160 180 200 220 240 260 280 300 320 340 360 380
MIDPOINTOTHER CTglrtIliS)
5
10
15
20
25
30
35
40
45
50
15
FREQUENCY
******
4**********00*********00400000*
*************************************************4
*******0******************0****0*****0**********0****0****0***********
***************************************00000000******0****0****0*************
****************************************Y000****0***********************************
*****************0******0****************************000000****0***********************0**
*****************************************************000******14***
************************0******************0*
*******00*
10 20 30 40 50 60 70 80 90 100 110 120 130 140 150 160 170 180 190 200 210 220
FREQUENCY
31

MIDPOINTMAT
10
15
20
25
30
35
40
45
50
55
60
Grade 8 Reading
****
********
***************
**********************
*****************************
**********************************
***VMg*******************************************
*****************************0************************
*****
20 40 60 80 100 120 140 160 180 200 220 240 260
MIDPOINTOTHER (V11315)
10
15
20
25
30
35
40
45
50
55
60
FREQUENCY
*********
****************************4************************
*******************************************************************************
***********************************4 4**********************************w******
***********************************************************************
************************************************A*********************
**************************************************
****************
10 20 30 40 50 60 70 80 90 100 110 120 130 140 150 160 170 180 190
FREQUENCY 32
30

Grade 10 Reading
MIDPOINTMAT
10
15
20
25
30
35
40
45
50
55
60
101*
00****
******0**
********4040$00*
*0 ****0*******0***0**********
***************00**0*00*********00****
000***0***00*******000**0*0*****0000*********000****0
**************************0**00******MW******000X*100******01ON****00*
***10104************************0************************,*****
0*******
20 40 60 80 100 120 140 160 180 200 220 240 260 280 300 ..,20 340
MIDPOINTOTHER (7)P)
10
15
20
25
30
35
40
45
50
55
60
FREQUENCY
0******
000****
*00***********
***************
*00*****0*******************
*100301***0***************************
**************************0*0************0*****
*g***************0**000**********0******00***************W**S*
*************************4*******0*************4*******
0****************0**#
0
20 40 60 80 100 120 140 160 180 200 220 240 260 280 300
FREQUENCY
33
31

Grade 3 Language Arts 32
MIDPOINTMMAT
6 *
9 **
12 ****
15 ******
18
21 **********
24 *************
27 *********************
30 ***************************
33 **********************************
36 ****************************************************************
30 60 90 120 150 180 210 240 270 300 330 360 390 420 450 480
FREQUENCY
MIDPOINTOTHER (XTBS)
20 *
30 *********
40 ****************
SO *******************
60 *****************************
70 ************************************************
80 ************************************************
90 **********************************************************
100 *********************************************
110 *************
120
20 40 60 80 100 120 140 160 180 200 220 240 260 280
FREQUENCY

Grade 6 Language Arts
MIDPOINTMAT
4
8
12
16
20
24
28
32
36
40
44
*14*
*********
**WWW*WWW0WWWW**WWW
************WWW0WWWWW*WWW*******
*************************4*******
****************************************
**********************g********************
**********4************Wg****************
*********************
***WA*
20 40 60 80 100 120 140 160 180 200 220 240
FREQUENCY
MIDPOINTOTHER C ....rt s )
30 ****
40 **********wwwwwx*
SO w*****wwww**wwwwww*************4
60 i*********************************waw*****0*******
70 ***************** ***** *****4104**01.0**:,40*************7*****
80 ***wwwww*************************************40.0******),0****44****,******.***
90 1.0***********00******4!**** ***** **00****************4**********************
100 **************4****************************** ****** * ****** ***********4
110 **************************$************************************
120 Will******************** ***** *************
130 *WWW4*******00*
10 20 30 40 SO 60 70 80 90 100 110 120 130 140 150 160 170 180 190
FREQUENCY
35
33

Arimimmimm.
34Grade 8 Language Arts
MIDPOINTMMAT
5
10
15
20
25
30
35
40
45
50
55
****
**********************
**********************************************
***************************************************************************** *****
*************************************************** ****** ** **************** *******
******************************************
*******************************************************************************
**************************************************************************
***14************************k*************
**********
10 20 30 40 50 60 70 80 90 100 110 120 130 140 150 160 170 100 190
MIDPOINTOTHER cfros)
30
40 ********************-********
50****************X****************************
*************************************** ****** ********************
70
******************************.*******************************************%***80 ******************** *****
*******o*****************m********4******************90
00*****************************************************************100
***04000***********0400***********00 ****** *000000000
110 ********00 ****** ************************
******************
130 ****
....-4.---4.---4.---4.---4.---4---4.---4.---4-4.---4.---f---+---4---4.---*---4.---+---4.--10 20 30 40 50 60 70 80 f0 100 110 120 130 140 150 160 170 180 190
3 6FREQUENCY
FREQUENCY
60
120
4

Grade 3 Mathematics
MIDPOINTNWT
20
25
30
35
40
45
50
55
60
65
0$*
**if
440**
*********
*44****4***0*
**************
*******3434.0***3***********
***************** ***** *0***
****************# ****** *********M***0***
*********** ********* *******************40********0*****
20 40 60 80 100 120 140 160 180 200 220 240 260
MIDPOINTOTUER USES)
16
24
32
40
48
56
64
72
80
88
FREQUENCY
Of******
**********111***
****0************************
Of****************0************0************0*****
ii************0********0*********************************0*****.**4
*************0****************0************0*******0..**0**444***0**************+.4****
10 20 30 40 50 60 70 80 90 100 110 120 130 140 150 160 170 180 190 200 210
FREQUENCY
37
35

36Grade 6 Mathematics
MIDPOINTMMAT
16
24
32
if**
*Of*** ****** *********
40 I*** ****** ******************
48***********************00444*****01**********
56***u.**********************01011***110****
****** )114******4*01****401X0****164 14*********************10***** ********
)110*******1011**1****001.1614*******X***72
*0***************************0********************************************************080
*****************0*********************************4************************
88******0*********************************************04*******
96****************************411i*******
10 20 30 40 50 60 70 80 90 100 110 120 130 140 150 160 170 180 190 200 210
FREQLENCY
MIDPOINTOTHER C2-::1135)
24 *****
32 ***C***************
40 ***0********************Sgs*
48*****************0***41************************40
560****0***************41%***0************************N*******
64***000**********************04*****000**************************0*******
72**************************************04*********0** ****** 0***************
80
0******0000P00******U*0***A************00**************************0********88
************0****100**04*****0*******************0
96 11**11***11**** ********MOOMNIO***10***0****0**04******
104 Of***************
10 20 30 40 50 60 70 80 90 100 110 120 130 140 150 160 170 180 190
FREQUENCY
38

Grade 8 Mathematics
MIDPOINTMMAT
16
24
32
40
48
56
64
72
80
88
96
37
********M*****
*******************N***NN**14*****************
***************************************************************
*********************************M*************************************
********************************************************************************
********4*******************- ************************************************
**************************************************************************************
*******************************************************************
********************************************
*************
10 20 30 40 50 60 70 80 90 100 110 120 130 140 150 160 170 180 190 ZOO 210
MIDPOINTOTHER 1.:.1.1-1:5)
32
40
48
56
64
72
80
88
96
104
112
FREQUENCY
***********************v********
***********************************************
*****************************$***************************************
***A********************************************4***************M**
*****gg**N******************M*M******M***N*******************************44******
**************************************************************************************
*************************************************************************************
********************************************************4***********04****
4*******"14*******************************************************************************
**************************i*************************
************************
10 20 30 40 50 60 70 80 90 100 110 120 130 140 150 160 170 130
FREQUENCY3(3

Grade 10 Mathematics
HIOPCINTHMAT
16
24
32
40
48
56
64
72
50
88
96
as*
*****************N************
*********************************************4**
Of************************************************
101*************************************
ifitit**************************Mit*****
********00************
********
20 40 60 80 100 120 140 160 180 200 220 240
HTDrOINT
OTHER (,17kI>)
4
8
12
16
40
24
28
32
36
40
.44
FREQUENCY
**if**
******4***NO
**************************
*******4**0****4*****************
************************0*****************
**********************************************
********101404******** *****************
***********4*4***********44
WIF*4**41011*****
20 40 60 80 100 120 140 i60 180 200 220 240
FREQUENCY
4 0
38

Grade 3 Science
MIDPOINTMAT
10
15
20
25
30
35
40
45
50
55
60
**
*****
*********
******************
**************************
****************************************
***********************************************************
**************
20 40 60 80 100 120 140 160 180 200 220 240 260 280 300 320 340 360
FREQUENCY
MIDPOINTOTHER a.115'5)
3
6
9
12
15
18
21
24
27
30
33
4,4******0
.400.*4
**************************44***********A0******44*
************A...********************
***** 4* *0 ii*ii *0
**ft
20 40 60 80 100 120 140 160 180 200 220 240 260 280 300
FREQUENCY
41
39

Grade 6 Science
MIDPOINTMAT
8
16
I
24 ******
32 **********************
40 00*00 ****** *******W************W***
48***********************4*********************0*
56************************************************
64***************************************
72 **************
80 *****
88
20 40 60 80 100 120 140 160 180 200 220 240
FREQUENCY
MIDPOINTOTHER 'Z1155)
9
12
15
18
21
24
27
30
33
36
39
********
**** ***** ******************
*********************************************$**********
*************4********************************************
***********************************************************************
********************************************************
*****************4*********************
0**********************
************
0****
10 20 30 40 50 60 70 80 90 100 110 120 130 140 150 160 170 180 190
FREQUENCY
42
40

Grade 8 Science
MIDPOINTMMAT
10
15
20
25
30
35
40
45
50
55
60
41
***
********************
**************************************
**************************************************************************************
*********************************************************************************************
*******f************************************************************************
******************************************************************
********************************
*******************
10 20 30 40 50 60 70 80 90 100 110 120 130 140 150 160 170 180 190 200 210 220 nO
FREQUENCY
MIDPOINTOTHER (VMS)
4
8
12
16
20
24
28
32
36
40
44
* *
*********************************************
**************************************************
*******4*********************************************
*********************************************************************************
of
20 40 60 80 100 120 140 160 180 200 220 240 26G
FREQUENCY

Grade 10 Science 42
MIDPOINTMAT
12
18
24
30
36
42
48
54
60
66
72
0****
0000000****A0000000000000***
0.00000000***********0***000******00000000******00
****0000000000000000***0000000**0***0000000********0*
***************00000*******000***0000000**0*****
004***0****0***0********0***0****00**
0000000000****0******
*******
00*
20 40 60 80 100 120 140 160 180 200 220 240 260
FREQUENCY
MIDPOINTOTHER (I-An
8
12
16
20
24
28
32
36
40
44
48
*
***00001****
00000*******00000000******************
*****00**0*******00000**000***0**********0******0***0********0******0***
0000000**0*****000000****00*******************0**00**0****0**0***0***0*************000*
****00**00****0*****000***000000**000**,*********0000********00****000000***********00*
****00000000000000000**********0***00000************0****000000000**00****000****
0********00*******0000000004*******0******
0000******0******0**
0***
10 20 30 40 50 60 7G 80 90 100 110 120 40140 150 160 170 180 190 200 210
FREQUENCY

43Grade 3 Social Studies
MIDPOINTMMAT
12 ******
16 ******************
20 **********************
24 *****************************
28 *****************************
32 ****************************************
36 *****************************************************************
40**********************************************************************************
44************************************************************4***********
48 **************************************************************************
52 ********************************
10 20 30 40 50 60 70 80 90 100 110 120 130 140 150 160 170 130 190 200
MIDPOINTOTHER (j7n5S)
6
9
12
15
18
21
24
27
30
33
36
FREQUENCY
***
*************
*************************
*************x**************************
************************************************
************************************************
********************************
****************
******
20 40 60 80 100 120 140 160 180 200 220 240
FREQUENCY
45

Grade 6 Social Studies
MIDPOINTMMAT
8
16 *
24 ******
32 ****************
40 ******************
48 *********************************
56 **************************************
64 *******************************************************
72 *****************************************************
80 *************************
88
20 40 60 80 100 120 140 160 180 200 220 240 260
MIDPOINT
OTHER (16,S)
4
8
12
16
20
24
28
32
36
40
44
1
FREQUENCY
*
******
***********************
****************************************
***********************************************s*
*********************************************
*************************
**********
* *
20 40 60 80 100 120 140 160 180 200 220 240
FREQUENCY
46
44

Grade 8 Social Studies
45
MIDPOINTMCAT
12 *
18 *****
24 **************
30 ************************
36***********************************
42***********************************************
48****************************.k*********************
54**************************************0********************
60**********************************************************
66****************************************************
72 *********
MIDPOINT0111ER rrss)
4
8
12
16
20
24
28
32
36
40
44
20 40 60 80 100 120 140 160 180 200 220 240 260 280
FREQUENCY
******
*************************
************************* ***** **************4****************
$444*****************************04**********4444#0************m*********.******
**********************************************************4***********A**
*****************************44,**************************
Of********************************
**************
****
20 40 60 80 100 120 140 160 180 200 220 240 260 280 300 320 340 360 380 400
FREQUENCY 47

Grade 10 Social Studies
MIDPOINTMMAT
16
24 *****
32 **********40 *****************48 101.14141414141414)0**XSSO*0141.*******
56 **********************************64 0******************************************72 0**************0*****************************04*80 *********************0**********************************88 *********************************************96 *******************
20 40 60 80 100 120 140 160 180 200 220 240 260 280
FREQUENCY
MIDPOINTOTHER Crh P
10
15 *00
20 ***0******
25 ****************
30 **************************
35 *****************************
40******************************M********
45**********************0*********010(14******************
50*****W****************************************************00
55N******************************************************
60 ************
20 40 60 80 100 120 140 160 180 200 220 240 260 280 300
FREQUENCY
46

47
Figures 20 through 38
Relationships of Corresponding MMAT and ITBS/TAP Subject Tests

PLOT OF OTHER*1111AT LEGEND: A = 1 01151 B = 2 01351 ETC.
OTHER I
1
44BA43
BBC B42AGEFO41
B AA HE1IGH40ACODED 0 HE39
A A D E 0 1111 .111 F38ABCFJ11 EPQD37
AACDGli 0 J1111C36A A AACACEGCKHIEb35 BABBBAHGFGGCB34 +
A A CBFBGHJELLBOA33 AA D GDiGGIFF 1132 + AD BDAEEEDDIED111113 Aer 31 ABBBAGBAGIOF ACA30A ABAABCGEBGGDOECDA..r. 29 +
A ABCABABCIDCFEAB A28 + A AAA A ACAA CGDEEDF CAB 27 + A BAAAEBABCB CBBAAGACAA26A B A CACD CGCEAO,IBBFS 25 A B A A ABBAABCDFBABB24 AA IIBBABBFEBCACACA23 AA CA A A B B B E E B B BB A C A A A22 A AD C A BAACDEABACBBBB BI) A21 A A AA A BAAE 13 BCABDCB CA AAA20 + A AA A BAA BB B CAAEAB BBAA B19 A A A A B BC BA BB CA BB AABA D18 A ABA B CAA ABBAB AB A A17 AB A BBAAB AfIDDI3 0 B AAAA B BA16 AA B AAAA BAA B AAE CBA AAB A A15 A AAAAAAA B BACBABC AAABDB AA
14 + BA A OBACAAEOBBAAHC AAAADA A AA13 + AA ABAAAADAAA CAA BAB A A C A A A12 4 A A B AA ABBAA A BA A B B A11 A A B A ABA A AA A A AA A10 4 A C BC AAAAA A B A k9 C A A A B A8 A BABA B A A-.. 7 A6 +
A5A
1
1
8 10 12 14 16 113 20 22 24 26 28 30 32 34 36 38 40 42 44 46 48 50 52
1111AT
5I

PLOr OF OTHERNMAT LEGEND: A = 1 OBS, B = 2 OBS, ETC.
OTHER I
I
A55 + A 8 A
1 A AF AAI
13
1
DFCF AB ABCDCCAB
50 + A AI AA
BCCC 1BD()BCE 111 r
I BBFGFGLIIBA A B C ADGGIIBBA
45 iB AFODAGBBB
I A A BEGEDCFAAI AABECHBIFEJGCCB
!!:1 B A A DBDOEFCBCC
40 + A B AAAADDAIIFGCDA...f- I
1
A A B ADBFFGEFCDCBBA BB DAGCDIGILLIIECB
6 1
35 4 A AA A B A B A B B A D E FF DACAAABBD ABFGECCCA
I AA A A A A CBBBAB EBCBAAAAS I A B ABDBEBBEnDEGDEFBBFDAAB1 B A AABF .8 CBECCBABCA
3: + A B C B B C D A V B A D A D D D B B A A1 AA AA AAADAECBA DAAAAC A1 BCBAB AABACICGBGFEFF AAA AAI A A A A A DECBDA C BBBE AAA
25 + B A A A CDBCACB BCBAAC B A AI A AAAABCA CB DBBB C B AI A D A ABCCBE ABCHE DBBC A B1 A A A A B CCCB,tBDEACAAA A
20 + A A A C B ABCABBBBBAI A A AAAA AA A A AI A AA B C OBAGABACDBDCABA A A A1 A A ABBAA A A A
15 * A A B AABCA AAAAAA AI A A A AABB A A AI A ABACB A A A A AI A A A A' A A
10 4 A Ael 1 A
I A A
4- 4- -4 -4- -4- -4- 4- -4' -4- -4- -1- -1- 4- -i -4- -4- -4- -4- 4- -4 -4 -4- -48 10 12 14 16 18 20 22 24 26 28 30 32 34 36 38 40 42 44 46 48 50 52
HUT
5253

MDT OF DTHERxMAT LEGEND: A = 1 MS0 B = 2 OBS/ ETC.
nTHER I
A A AI
B B A A55 + BA A1313'1DBA
I
El* A A A1 A ACCCCGFOBA1 A AED AC A
50 ACBABAF AOCC. 6 JI B CAUAAABI A A A A E 111111 1 11 C D AI A A DOBAABBA
45 4 A BABCCBDBOCABI
C ADCEDDBAAAI B B B AABCAFEEHEGBCAkI AABB BBBBCCB B
40 4 A CACACCCDFDBBCCAI B A ABEADOBBECEDAB
...(-I
1
A A B BBBBEGEDEJIG9DAA A A AAACADAGCBCA
--Ir°35 4 A BAAAB BB GCAEBD AAA
f5I
1 A A B AA C A BBBCABCEBCnB
:AEAGF GJEFGFCEBD: A AAACI B ADAA BBA DACCBE A A C AS 30 + A B ADAA A DD BA AD B BC AA BI A DA CBABBBODBBCCACC BI A A GODCEFBCDEAEF ECA AA AI A BA AA BBBBBBADCA BAEACA A
25 A A AA CBA A ADDBB CBBCA A BI A A AA A AA ABCOCCEC ABABA A A BI A A A B A C C B D F D H E C C E A O C A A A C D A A A1 A A A BABB ACBAABA C A A
20 + A A A AABA ABBB AA B A AI A A B B A A A A D B A A A A A A A A AAA1 B AADAEEBEACB BBD AA A ABA AA AI A A A A AAA C!,A D AA A
15 + A A A AB BA AA A A A1 A A AAB BA ABA AI A A AA AA AC BA A1 A A AA BA A A
10 4 B A1 A AI B1
5 3
1
4- -4- 4- -4 -4 -4.- -4- 4.- -4 -4- -4- -4- 4- 4- -4 -4- -4- -4.- 4- 4- -4. -4- -4- -4- 'r -- -+9 11 13 15 17 19 21 23 25 27 29 31 33 35 37 39 41 43 45 47 49 51 53 55 57 59
TWA T

PLOT OF OTHERNNNAT LEGEND: A = 1 OBS, D = 2 OBS, ETC.
OTHER I
A A AADED1
AA DOBFB55 4
A BA ADEBA AI
A AABB FFBFBC1A
A DEBENE 1 .111CDAI
BB BODGFFLECEDB50 4
A AABBCCENGJFABAB1 AA C COBCGCODEFCDAA1
A A ABBBOFFINFKPIIKKBC1 A A A B DABEADGANAHUDC45 4A A A B B BAADDDEEFFGEB EAA1
A A AA DBBCBFEEFOGEAAGA1 A BBB BAGBEIFCOONBDFICEBB
401
4A 0 C C A F FEFFGCBBCAA AA A B A A ADACABCGEDCACA C.)
0-11
A A A AACACA BBAO BBDBABDAA1 A A A AB CBBFBACDEFFBCAIGCCA AA
fD1 A A A ABBABBBFE DAE BB BA A
1-435 4
A AB OAAAAAD 0 AAB BAA A CD1
A A ABAB OBCCO C AAI
1
AA AABA BAAAAOCEDFCEBOLIAB B B A AA B ABABACAABACC BB B AA P30 4 A A ABBCBCACBA BB CB ABI A A A A A AC DADAA AAA A B
Ot1I A AA ABBABAADCCABBCBBCBAI AAA AAA AD C AA AA BA A25 4
A B A A B A A1 A A A A AABBBA AA A1 A A BAA A CABBA 0 C AA A A1 A AA BAAA ACAAA AA A A20 4 AA A A A B B A A AI A AAA B AB BA AI AA BA BA A C AB A AA A A1 A AA A A15 4 A A A A AA AI
A A A A AA1 A BB A AA BAB B AA A1 A A B AB A10 4 AB A A A
A A1 AA A A
1 AA A A A1
5 4
1
9 11 13 15 17 19 21 23 25 27 29 31 33 35 37 39 41 43 45 47 49 51 53 55 57 59
1111AT
t 6
I:: 7

OTHER I
PLOT OF OTHER341111AT LEGEND: A = 1 OBS s B = 2 DDS, ETC.
A AIA BA110 4
8 8 0 8 E
ACC EF CA A A A HOG IF 11
A A A B A C B I) E F F 11100 4A A A BBC J110K f E
B A A B H C F IF C B FA A AC 130K IPKCE
A A C B I E F 0 11 GAB90 +A CECCAEJF INK LIIDBIA A A BAGEH II E II F B AI
A AB AABBBGDCGIIE IIIE A A AIA A A A A B D D E G B C E F E B A80 a A A ADCF E EGL EFDIIF AI A A AC A C CBBC EDI; 13 1 AI A A BBA A CCBCF F D LEG() 3 A AI
A BA A BAC ED ECBBFIA E A70 4B BBDEADIDDIBGI II CDC AI 0 A A A A B A C D B G A F ACI A A A B E C B B D C O F E EGI1 CDBBAI A A A BA A A GA DC A A A A A60 4 A A A A A A A CGAC A E B C A AI A A B C A A A B A A D A C B A BI A A A A D A A B D G F B B C A A B BI A A A A ABCBA A C B A50 + A B A B C C A B A B B B B A A AI A AC AB AD A AB A ABB AI B B C A D C A A AAACB AI D A A D A A A A A I I A A A A A A A40 4 A A B C A C A B B D C A B
I A A A A A A AI A 9 B A A D E C A B A A B AI B A B B A A A B30 + A C A A A B B A A AB A AI A A B A A AI A A AI A A A20 4
I A A A1
10
5 7 9 11 13 15 17 19 21 23 25 27 29 31 33 35 37 39
MIA T

OTHER I
PLOT OF OTHER*MMAT LEGEND: A = 1 OBS, B = 2 OBS, ETC.
140I
A A A A AI
B A A130
B A A A BA A AI
A A C 11 13 C C B A1
A A ABBDBC1 A A A A A120
A A A A ABBBC131) AA AI AD ACDCD EGCODBCF1
A A A A A A : . A E C E D A D A B110 +A B A A FDDCF CGEDCB A A
1
A A A A B U D I I E C G 1 ( 13 F EAACB A1 A A AAAA CA DCDBBDCDF AC100B A A BBCBDBJEF E DC ADI A A A B BA CCDCFJF IIICCCCI A A A A BB A F AGEGDDF EBBDBA90 +
A B A A B C O A D K A D A E D D A
ABA
I A A AC A EDF ODDCDCCDBCD A 11 A1 A A B A C B D C C C FDEDEDDDC C A A A80 All BB A ABOCII A BE EDEll A ABA AI A A A ADD ADIJDOCEBO F G A BBE A BOAI A A A A B C B C B C B C B ECB AB BA70 A A CCDCDBB A CBA ACBB1 A A C A A D C E D C B E H B F C C B A E A AI A A A B C C A EDC 13 A A C A
()13 BB A60 A B C B A A A A C E B C A C B A A AI A A A ABCCDCDE GA ABB B A A AI A A A C A A C F AD A50 A A A AAAAA C B F A A 4 A AB AI A A A A A B B C B A A A F A A A AI A A C A B A A B A A A A40 + AB A AB 13
I A A A BBB I) If BI A A A A30 A A A AI A A
20
1
1
10
0
1 f- -1- -1 f- -f-6 8 10 12 14 16 18 20 22 24 26 28 30 32 34 36 38 40 42 44 46co
MIIAT

OTHER I
140I
I A
130 A AAAI A A AAI A A AADA B
120 AAA ABBB A A
I A AD AEDDBCAI A AACB BBBA AA
110 a AAB B D CEBEC B AI AA ABACCDBAEFDCFBCCI AA A A DACDFECB D AAA
100 A A B B CADEDCC A B A
I AA A C ABACDFFDIEDCAA A
I A A A A ABBBCCCBD ECACACA90 ACAAA ADDEAACBECBDCAAB B
I AA A BA CBAEEECFHCEDCECE A Afa+
I AA A ABAEAEAEBDBBBEBDABC AA80 + B A A A B BAACBDDEEBDFBCACA A AA A
1 A BAAB DBABBAFCEEDEOFEBEDBAE A
A AABA AFCDGCEDDOCEBBA AAAA A A AI
70 A A CD BCBCBCDDEBCEE A EAB A A A
I A ABBB ADBABOACIDECCCAABDBCBA AI A A ACDBDBADBBEABCBA A
60 A ABA B B BF ACBABBEACDD CA A A
I BAABC CGEADEGDCBC AGABAAAAAI A ADA ABAB BIWA BB
50 + A BB CDBB CBDAACCBA AA ABI AAC AFGACBDACDBA B A A A
I AA BAAC AABABBBABB A AA40 B AEB A A AA
I A BCD AADB ACA BA AAI A A AA A AA
30 AA A A A A
I A A
I A
20I
I
10
I
i
PLOT OF OTHER*11HAT LEGEND: A : 1 OBS, B = 2 OBS, E IC.
o +
G2
8 10 12 14 16 18 20 22 24 26 28 30 32 34 36 38 40 42 44 46 48 50 52 54 56
MIMI
C3

OTHER I
PLOT OF OTHERRIIHAT LEGEND: A = 1 OBS, 11 = 2 OBS, ETC.
BBI B CBDI A A BCEAFI
80 4 AEGCFCCA AACBAFE.F IBCBAAACB,'DICCFB
I AA AACBFCEEBG.EDAI A A BAAAABEBEFGCBCCC
70 4 A B A C ABBBABEIGDBAI A B CACBBCAAGEECDEDCAI A CBAAABCBBCDCEEEAABI BAACABACDDCGCDCDHCE AAI U B A A B A AACHDBABOCABAI All 11 11
60 4 A A A EDEBAEAACI1BBCB BAI A AB CAADACAABBBCBBAAAI A A A AB A CCDHCBBAAABBAAB DBI AA BB BCAADAEABBCCBA AABBA A AI A AAB D BOBABBCCB ABBBBA AAA
50 4 A A ABAAAD U FCDABCACAAABB AI A A BAB U AAAB A ABA A A DAI A BA AABB A AA BBA AA A AA AI A A AAA CAAABA BC AA AA AI A A B A A BA A
40 4
AA ABAAA 8AAAAA BA
I A A AA AB A CBAB A A A A AI A BA A A A B AI A AA BAA A A A A AI A A A A AA A A A A
30 4 A A B A A AAA A AI A A A A A AI B A AI A A A A A AI A AA
20 4 A
I A
I
10 4
I
0 4
C 4
414 16 18 20 22 24 26 28 30 32 34 36 38 40 42 44 46 48 50 52 54 56 58 60 62 64 66 68
fltIAT
C5

PLOT OF OTBERAMBAT LEGEBD1 A = 1 OBS, B = 2 OBS, ETC.
OTHER I
I
110A
I
AA AI
B AA ADAABI
A A AAC AA100
AAA AO BDEABBCBOA4AI
AAAAAAECBA BA OAAAAAI
A ADACABACECECB AA DC ABI
A A AAACBAACCBCCO AAAAPBAA090
AA A BCABCDAEDEABCA A AI AAACABBA ED CCABCD CAI A A A DBADAABBCBBCOCEAA ABABB AI AB B AABCECBACD DA ABCBAAA A
80A A A CADEBBBOBOCOHBAFBAA ABCB A
I A A AC A ADDAABBAAAD CADAA A AI BAAADDCBDBO BBOADEACBEACBB AAI A A A A BAA BEOCCODBOABAACCAA AAAA
70A ABAAADBADAACCOAACOBE CEAA CAABB A A
I AA A A BCCABACCAC DDDOBA B A AA A AAI AAA BACAAEDCDFDAFEDABBPCBDOB A AA AA AI A AA ABBBACACFBAAAAADCA B A A
60 A AAAADBCB ABCABB ACRD AB ABA CAA B AI A BA AC C BDAA B ADBAD BCAD AA AI AA AA BCBACADAB DDABA E.DAACA A A AI A C A AC A BOOLIDABCDAAABA A AB A A A A
50 A A BA AAA A CBAB BABBODAAADAAA A BA AAI A A AABA DC, AB A BDAA C BD B A AI A BAD B13 DA C DB BC BA ADC A A BAI AA ADA AAAAAAA AA B ABA AA
40 A A AB A BBACAAMBA B CAAAA AA 11I BA A A ADA A AI A AAAAAABA AADA A AAA A AI BABBAAA AA A
30 A A CAA ACAA A BI A A AI A AB A BI A
20
I AI
I
10
I
C0n
16 21 26 31 36 41 46 51 56 61 66 71 76 81 86 91 96 101
101AT
67

OTHER 1
1
PLOT OF OTHERINIMAT LEGEND: A = 1 OBS, B = 2 DDS, ETC.
120 +
I
AI
B AI
A AB AA4110 +
AA A AA A DDAB AB ACAA.1
CA ABAACAADCAA AI
C BA CDODDABCCAA AAA AI A A A A ACCA AAA CAAA AABAIA
100 4
AC A B B OCCOCAUFOOCCAB ABI
AA B CAA CBB8BAD EC CAAADI
A A AA AABFCCDGFE CDEEEDCADDO DAI
A A C AA ABCCAADBAACBCA AA A A90 +
AAA A BBDBCAABECBDI CDD CACDAA AI
A B AA ABA BBAB GABAAACB BAAAB AI
A A ABOADCDCADADC AAAC ABAA B B AI A A A AAB CCD BB DAACODDDC AAAA CB A80 +A A A A AAACA BE CBAAACAB BCCD CBAA
AAI A A AAA B DB ACBADB CUB DC B BA A AT I
AA A ABAABCOBOBF ADBAAECCBACA AA A AI
AAB AB ACRD ACABAAAA BABADD B AAA8 70 +A A A A DAAOCFABBAEC ABB DCBABBFA AA A A
I AA A BB EAADDA ACBAA B BB AA A5 1
1
A A AA AAABABBAACCAARDB ncnn C CA B AAAAA C B OBACA BACOIM) A AA A
AA
60 + A A A AA CCCC BODBCCOBAA MUM; B AI A BCAAAAC ABABA ADC AAA A A B AI A A BAADAACA ECCBAADABADB A AAB AI AD BDCB DBAAACA AC AD50 * A A A BACA 1) EOCOFAAAAAA C B A BAA 0 A AI A A AA A A BDCAAABA BA AAAAB A AI B AB F.ACFCACCBACAD A B A A AI A A CBABCA CB BB A A40 + A A CCB ADABABB ABA B DBAAA A AI A D CA A C A DD A AI A A AOKI A BOO AAAAA BA A A AI A A . AABD AA A A
30 + D ADDBCAAA A A A A AI A A AAI B AAAI A
20 +
I
16 21 26 31 36 41 46 51 56 61 66 71 76 81 86 91 96
MAT
C 8

PLOT OF OTIIERWMIIAT LEGEHO: A = 1 OM D = 2 OBS, ETC.
OTHER I
50
1
A BAA1
A AA C A45 4
AA AAB CADAI
A AAAA AAADAI
A A (AMC BADOCBSCD CDI
AA A AA AADDCAAAB AADBOA A40 +A A AABGABACCABCAAADA A
I A BA A A ACIIBBB EBA E A A A1
A A BAAB CCBOCCLUBBACEBABABA ABUI
A ABCDBAABOB EC ACCABC BAB AA A35 +A BABAA AABCDC ABADDB AABABBAA B
1 A A D AADA Cif:III:BAC AB BC A DC A AI A A A B BDBABACBABEFEADDKICDGAGCAEEBADCA A AI A BAA A A DADDBBABCCBAAAAAC BUBC APr 30 +
ABAA B AABA BBAABAACB FDBADDAFCBB A A AI
DAAADADEDAAABOC BBC AA AAABA AA A AA I
AABBAADACADOCCEFOGFEVOINIGECDDEBODA ADAA AI A A A A CA AAABAAAAAEEABBOBECCBBC A B A
p25 + A A DABCBDCBCBACBCAA BB BAB B AI AC DEC DUICECOCCA DAC A AI A A A ACBDCAECEELGEEFCFCMCDBDAAAEA AA A AI A B AB COA BFDDEBCBAIDAA B
20 + AC AC A CACACDCBBAAA A A AI A AB BA BUACEBC AB B DUAD A fr A A .
1 AA CBUDA ABECDDOCODDECCAAFB DA A A AI AA A AADODAC B BCA A
15 + A AU A unnAn ABCAA A AA A AI ADDAAB B CCCBUAA AA AACAI A AADADADA CCABADAAAC ADAAAB A AAI B AAAAAAAAA
10 4 BABAI DAAAA A B AA AI A A AD A AAA A1 A A A
5 +
I AI
1
0 4
16 20 24 28 32 36 40 44 48 52 56 60 64 68 72 76 80 84 88
IIMAT

OTHER
35
34
33 +
32
31
30
29
28
27
26
25
24
23
22
21
20
19
18
17
16
15
14
13
12
11
109
8
7
6
5
4
3
PLOT OF OTHERWHAT LEGEtU): A = 1 ODS, B = 2 OBS, ETC.
A A A A A
AA ABAA A
A A AA A A AAA AB
A B A DBABCCCAAABA A AA AA ACBA DOEDDEBB
A A ABA CABBIAEDB BBA A A AABCJFFCGEGFGFCA
ABB ADAAAC GEFEDEDEDDACA A A A ABBAAFEEIFKCHDCCAAAA
ABEBDJCGJENIFIFBFD.BAAA A ABD ACDHEDHJFJDEEEB AA
A B B D ACAACCOEBFJHKICUBCBB AAA A AABAAABCBAAFBEKHLGHEDEABCCBAA
A A B B BBACCBCCGEGIDGCKGEDE BAAA A AA AAAAB DCDEBFAFIFJFGCCED AA A
A A A CCABACB BFHCDDEECCCBAECAAA A CA BAACCABEFBCEGADCCDDAB BBAAA AA AAAABB E BBCB EBEFFDCACBA AAA
A A A A B ABA BBC ACDDEEAABCBCCAA A A A B AADCCDCBCEGAC A ABBD A
A A A A ABACC DECABAAB AA CA AA A B AACAAAAA BBBBDDAB AA AA
A A A A B DACBBABB AABAAA A AA A A B A A A A B A
A A C C AAABBA A ABA A AAA AAAB A B A A A A AA A A A A D A
13 AB A AA
AA
1 1 1 1 -1 -1 1 4 410 12 14 16 18 20 22 24 26
A
1 1 4 4 4 1 4 1 4 1 1 4 4 4 1 4 4 4 428 30 32 34 36 38 40 42 44 46 48 50 52 54 56 58 60 62 64
MtIAT

PLOT OF OTHERNHHAT LEGEND: A : 1 OBS, B = 2 OBS, ETC.
OTHER I
1
I
I
i
40A39A AA BA38AA A AA378 AAC36
A A AD B A A35 sA A AAAA BAA AAA34A DAD A AAA DCBAA B33
A A A CAA A A32 A B AAB B DC A BB AAA A A A31 sA A A BD CCADBADBAABAA30
29
282726
25
24
2322
21
2019
18
17
16
15
14
13
12
11
10
9
8
7
I
s
s
s
s
AABCCBDBABCAB AA AAA AAAABABB BAEAD ABAAAA AA
A A BA A BA ABCHCCFECB B BAACBADDBBAACDAAAA A
A AAABA AAAUCBCCGBACCE BAAABAAAA AAABDUBBDACCBCGDOFBCBAB
+
s
A AA A8 DBAC EDEBEDD8CCODBBCA A AAB ADDAEBBABDAACCCBAC AD B
sAA A BAABABAACBDAEEDCOCCGCAAAAA AA
A B BUM BCBODACBCEBCA BC As
s
s
A A B AAA C CBUCACCEEDACAFABAA A A AAAAB BCCBA CC DADDC BDEA AA A
B AAAAADEAD BAAACEFA A B AA As A AA BD BDDB ABBADADBOADAAB CA A
A AA A ADBAADGCCCDB A ECBAA AAA4 A C A ABABBCFCADAA AA CFABA B CA
A CA AUBABACBCABAAA BBC A A+ A AAAAB CCABCC BABAAA
B EDDAAAAD A A A AAA AAABAC AAA AA A
A BAA C 8A AA A A
+ A A+ A AI
1
I
I
I
15 19 23 27 31 35 39 43 47 51 55 59 63 67 71 75 79 83 87
IIIIAT

OTHER
414039
1
I
I
I
4
4
PLOT OF OTHER*HHAT LEGEND: A = I OBS, B = 2 OBS, ETC.
A
A
38 A AAA A34' A A A B AB36 A A A A A A A A35 C BABAAAAA A34 4 A A A C1311 BA A A33 A A A ABAABBBA B ABC A32 a A BA ACAAECBAAAAAC AA A31 A B A ACDCA CCE BAA ABA30 + A B ACBECBABEGBBDC AABA29 a CAB GACAFBDBDCE A B B A A28 A AA A CA ACCAADDDBBCBACDC AA27 A A A A BBAC CEGAADACE EEBABB26 a A AB AABAAAABDEABEBDCEBAAABBD B25 A B ABB BAB IFDDEDBECBAB24 + A B ABD FEF FIHDCBBCDBAB A BA23 AB AA ACBABFCECCBED CCDC BA A22 B B A C A A E B B C E A E D C D F F A A A B B C21 + A A AA B A ADIIDBBOBBCEBCBCBA A A20 A A BAAA BC CBAGGDOEJABBAAA C AA19 B A AA BC DADBBCCHCBBEABCACA A18 A A B A A A A O A C BCBECCBBCFBBBB A B A A17 4 AAAAB 8 AFBEECCEBDFIIDOB A AAA AA16 A A A A A C E BEBCFAEFB CBCACA A A15 A A A A B O A A B A A O D C D A A A A C A B A A A A14 4 A A A A BAGC DACDBOEB BA B A13 A A I AAR!) EA ABCA A12 4 A A A A A A B A B A B A AB CB AA A A11 BA A A ':.AABA BB A A A10 4 A AA AA B AB A A9 AA B A A A8 A7 4
6 + A A
5 A1
I
I
4- 6- -4 -4 -4- -4- -4- 4- -4 -i- -4- -4- 4.- -4 -4 -4.- -4- -4- I- -4 -4- -4- -i- -i- -4- 4- -I -410 12 14 16 18 20 22 24 26 28 30 32 34 36 38 40 42 44 46 48 5n 52 54 56 58 60 62 64
tiNAT

elA
P
1
PLOT CF OTHERMIAT LEGEND: A = I OBS, B = 2 OBS, ETC.
OTHFR i49 A48
A47 a B A A46 + BA A A45 a A A B AA44 a A A AA C A B43 A A B BAAA BA B42 a A A ACADBC A AA41 B BA ABC ABDAAA A40 + B A C C CA BAA39 + A AA CB A CAD CA CABAA A38 A A AA AA AAACC UEDA BAAA AAA37 A BA A AD A AAADCAUCAA A A36 +
i, AA AA CA CDBBBBACBBA A35 A A A AF B BBDEAFAEBACB34 A BCAB AAB EAFDC FABBA A A A33 a A A A AC DC CBDDFAAA C C32 + A A B D CDDEFGAGBFBABA31 + AA A A AAeA ABDC ACCCDCHB U A30 + A BAB B B DBBCAI ACCDAC B A29 A A AABDCBE AADEAECCDA C C A28 4 A AAA B AEBBBEBDCDCDBCDA AA A A27 + A AB AAACBBCCEDFAA ADBC A A26 + A A AAB AAGBCAEE ACAFEBABA AA A25 A A AACDBOCADBIIECEABBBADAA A24 C CCEBCBCDAWCBAD A A23 AA CAA ADACCII EDDDBBBBAAA22 a A A AB A BDFBEACFDBCCDA A BBB21 A A BACBBADCBDFEDACAA BBA20 + A AA AAABBCCADEDBCBBCA AA A19 ABA ABBBEDEDCBDA A A A18 A C Al) ACDCCADACCBB AAA17 A ACEAA BA AABBAAA16 DI) AACCACA A B A A15 AA ABBABBBAABAC A A A14 A B A ABDC At.ABA AIi A A BACA BA AA12 + AAA A AC11 A AAA A A10 AA
9 A A
8 A
1
12 14 16 18 20 22 24 26 28 30 32 34 36 38 40 .12 44 46 48 50 52 54 56 58 60 62 64 66 68
I'l 0( 0
MAT

PLOT OF OIHERNMAT LEGEND; A = 1 0135, B = 2 OBS, ETC.
DTHER
35A A34
33 +
A32 + AA A AA31 4
A C A A A30 4A B B A29 4
A A ABAAABAACB28 +A A A U DDCCA27 4
A A A ACABADB EDABB26 + ABAAACFBAFDAB25 4A ACEADEBBDABBB(11- 24 + AAAAA ECAEBBGFEDCABB23 + A A AA AAEDCEHEFIDGCBCC22 4 A A AACBDODCEFCEGHCDB A21 4 A A BABDAABDEGEGEEACCGAAA6 20 4 BAC CBBCDBFFGAIHFHEHK CB19 + A AAAA A AAAEE FBEIGHFAE BACA
:5 18 + AAAA B AB BOB AEDHGCFEFEEBCEDAAA17 4 A BCBBABAAAA FCEGEAAFECCAD CUA16 4 A A A B A CAACBBDBDBEHGFGCCCAA BA15 4 AAA A ABAAABAABAACAGUAFDDEDADAAAA14 * A A AADB BACCAE BUBC CBABBECAABA13 4 A B AAAEABABCBABBBABCCBADB A AAAA12 + A AAAC AA ADAEAAFBABBAADAAC A A11 4 AA AA BB CA ABC ABC A A A10 4 A A AAADAACE AAB A A A A9 4 AA CBAB A AC AABA8 4 A A B A BCAABA A7 + B A C A A A6 + A A B A A5 A A
10 12 14 16 18 20 22 24 26 28 30 32 34 36 38 40 42 44 46 40 50 52 54
MAE
f- 0

17
T6
5
.....
OTHER I
PLOT OF OTHERNMHAT LEGEND: A 7- 1 OBS) B = 2 OBS, ETC.
1
i
41 4A
40 A
39 A A
38 A BA A
37 A A A
36 A AAAD C A
35 A AA DA A LLB
34 A 130DDDAI:2
33 AAA CACECDDA
32 A B A ADDEDAADAAA
31 A A B AEAEEPCCCAA A
30 A ABDADADACDCOCCD A
2928
A AA BCBACDCCCCADBDCACA AA CDDE CDEEDDCUCAAA A
27 A A BAABODCAEDFETOCUCDDL1B A
26 A tAABA A ABAAAA ACCABODDCCDOA CA
25 A BAB A AACDCFEADDDDBFAAA A
24 A A DAAAB A DACDACBACDOCCDA AA AA
23 BB BCCAAB CCHEDD EECACDBA A
22 A A AAA A BACFBIMBDDACDUDBAB A A
21 A A A AB BCABAAADBCABADEDBBB A A A
20 A B A A ADADC CDCBADABBDCDUBBBC A A19 A A A BABB CBACBACCBACDCCCCDA DA AA A
18 A A BABA A AAA AADADADACFCE ABBBBD AB AB AA
17 A AAA AACDAB B CAACDDACAD DACCA DAABAAAAAA A
16 A AA BAAADACB AIWA MC DCABACE AU A A
15 A ADB ADBA A DADDAAA ABABDCA B A
14 A A A DBA AO AA ADADF C BAA A B A
13 A AAAAADAD AC BAB B CBC b A ED A A
/2 A A ADD B CAAAAB A
II AAA DAADDCADAD AAD CD A
10 AA A. C BAA B A B A A CA
9 AAA BBB At A A A
8 A AAA AA AB A A
7 AA6 A A
5 A A
4 A
1
1
i
C
11 15 19 23 27 31 39 43 47 51 55 59 63 G7 71 75 79 83
MMATCN41.
8 -4

PLOT OF OTHERNHHAT LEGEND: A = 1 OBS, B = 2 OBS4 ETC.
OTHER 1
1
1
43
A42
A41 +
40A BAAA39
A BAAA A38
ABAAA 037 ABBAA B36
A ABABEBADA35A A AABBBCDOO A34
ACAAFCA33 4
A A A B B U ECEC AB32A ABAOFFABBIAD31
A A A AABAC CCOFDC AFCA30A A A AC ABCBDFEDBCFBG ECA29A B BBC ABDOCOGCFOF AA28A B A AAABAAABCOJCEIGBFBBC27 A A A A AAAADADBEDCGGGGECGCEBCB26
B A EB 13 0 F 8 DEBBFOGBEDE BC A25 4 AA A ABAAA CBCEEFBBFR 8 DEDFDCECAB24A A 4
C A C A B D B R F A F E C B F D G F H U E A A B A23 A A A B AEBRABAEFfIrEFC 2 OFF AFCFBOB A22 A A B A BECBADACBCBEFEDEBDGHEBCEBAB A A21 + A A AA B CBAABACBABBIBBAAIEEFFG EBC BA A A A20 A A CB BBACABADC AADGHECGFCBBGDDB8 CAA BB A19 A B CAB B A F C D A AHEFDIDFGCCGBDDE AC A18 A AA ABABF A ACBDAFBCEHCCBBODBOF BCBA A A17 + AAA AB ACAB C BEC DEDDDBEBCEF FDB 8 ABD A A16 + A A A A A A B A A A C B 0 13 0 3 AAC 0 0 0 CABBAADBAA A A15 A B CA AD BBAEA BBBGCCEEDCCCDA B A AA 1314 4 AAAA FCCADE BHDBBBBCDEA AB DB A13.A
B A A ACAAA AAEBO AOADCAAABA12
11 ADABBABAAC AA B A A A AB11 + A A A AACAACACA AA A A DA AAA A10 A ACCAB AB A A A A A C A AA A A9 A A B B B A B A A A A8 AB A A A A7 + B A A A6 A A A5 A
11 13 15 17 19 21 23 25 27 29 31 33 35 37 39 41 43 45 47 49 51 53 55 57 59 6! 63 65 67 69 71
HUAI

OTHER 1
1
NOT OF OIHERWHAT LEGLIIU: A = 1 DDS, B : 2 0051 ETC.
A AA A60 4
AAB ABI
A A 1306 ABAADCA1
A A AA BA CFA3BAHACDDEEDAI
A B BB AA CODGECOACEC A55 + AAA A ABCUBAU EDEDOADFCABC AI
B A AA DABECA BADEBGAAACAAAI
A A A A AAAADC ECCDFECHCIHRFIFGCICCADAA AI AABDADCCCAEAB ACAOFFBEAAE DD D50 4
A A A DSDACA ADDAADEGEIGC HADABA AI
AA A AmAA BOMA DCDODDBFFAC CAAI
A A AA AA BA CBUCCECBCBGAFICCGDBCCOCCAAI
A A AA A A AA BCDBADACCODADFAC BA A A45 +A A A AB 0 CBAACCOBOCCD OACCB B AI A AA A AAAB CDPABABBOCD CCAOCABA DA A AI A A AAAA A A AAA ABCBACCHOCABOBCCABACBAEACAAAAB B AI
A AA AABAB C AA AB ACC BCB AB A,( 40A A A DOA AABBAACB CAAAG AEADBA B
A
1
A AA BB ACCCA BDECBA AC A AAAAA I
1
A
AA AA BA DADBACOADA EOBBCDBAAABBAA BAA ABA A AAADBABABCA 13 A B ABAP 35 4-
A A A AA BAAB D AA AA DCAACTIBADA A1A AC AHAB ABCA BAA A AI A AAB AA AOAABC ODAAABBOBAAB CAB A A AI
A A AA A BBABA CA AB AAA A30A A A AAAAABBA A A AAA A AA AAI A AAAD AAA BBABA AAAA BA AI A A BAAAAAADC CABB CBACCECHAAB AA A1 A AB A A B AB25 A A A AA BAA B AA A
I A A AA A BAA B AI B A A AA AAAACAABA ACBAA BA A CAA A A1 AA B AA B AAA A20 A B A A A A A1
i
AA A AAD AA A AB A AAA
1 B A15 A AA A A A
1 A AI A A1
10 4 A1
15 19 23 27 31 35 39 43 47 51 55 59 63 67 71 75 79 83 87 91 95 99
1111AT

r
Appendix A
Missouri Mastery and Achievement Tests
Technical Summary
The Missouri Mastery and Achievement Tests (MMAT) consist of 34 separate objective-referenced tests designed to assess student performance in grades 2 through 10. At all levels butgrade 2, these tests measure learner outcomes, called "Key Skills," in four areas: languagearts/reading/English, mathematics, science, and social studies/civics. Tests for grade 2 arelimited to language arts/reading and mathematics.
Multiple choice items, each with four options, are used on the MMAT. There are threeequivalent forms (A, B, and C) at grades 3, 6, 8, and 10 and two equivalent foams (D and E) atgrades 2, 4, 5, 7, and 9.
Test Development
Every effort was made during the development of the MMAT to ensure that the battery wouldmeet the Standards for Educational and Psychological Testing (American PsychologicalAssociation, 1985). At each step, the guiding principle was that the MMAT must yield reliableand valid measures of student achievement.
Experts in each subject area prepared test content specifications in order to provide a set ofparatheters for measurement of each Key Skill. These specifications were reviewed byelementary, secondary, and college-level teachers. Then a third group of educators used thespecifications as blueprints for item writing. Twice as many items were written as were neededfor the final forms.
Items were subjected to a thorough editing and :'eview process prior to and concurrently withfield testing. After several rounds of editing, each item was reviewed by at least four contentexperts for congruence (consistency) with its respective Key Skill. At the same time,representatives from several groups reviewed items for ethnic, gender, and cultural bias orstereotypifig. Items were field tested on representative samples of Missouri students;approximately 400 students responded to each MMAT item.
The item analysis data yielded by the field trials and the results of the bias and contentreviews were used to select items for the final test forms. To be selected for in( usion an itemmust have been judged to be congruent and free of any content that resulted in stereotyping orbias, as well as have demonstrated acceptable statistical properties.
A common-items equating design was used to ensure that the final forms constructed for eachgrade level were indeed parallel. Forms A, B, and C for grades 3, 6, 8, and 10 were subjected to afield trial during the fall of 1986 in order to obtain information about testing time, to try outadministration procedures, and to verify equivalency of forms within a grade level.
1987 Administration of Form A
Form A was administered in the Spring of 1987 to approximately 240,000 students in grades 3, 6,8 and 10. At each of those four grade levels, about 6,000 students were designated to be part ofthe "state sample"a representative group of Missouri students. A stratified random cluster

68
technique was used to select students for participation in the sample. Their scores were used toreport performance on the Key Skills to the Missouri General Assembly and for varioustechnical analyses.
Scales
Three types of scores are reported for individual students taking the MMAT- Key Skillmastery, a scaled score for each subject and cluster (clusters are natural grouping of Key Skillswithin a subject), and an estimated comparable national percentile rank for each subject.
Key Skill Mastery
Each Key Skill is measured by four items. A student must answer at least three item:, correctlyin order to master the Key Skill.
Subject and Cluster Scaled Scores
Subject and duster scaled scores are derived using item response theory. This type of scalingyields more accurate results than the commonly used number correct scaling (which is based onclassical test theory). The two parameter logistic model, as implemented by BILOG (Mislevyand Bock, 1984), is used to compute subject and cluster scaled scores. A student's scaled scorerepresents the relationship of the student's pattern of responses on the ent:;:? set of items to thespecific characteristics of each item.
The mean and standard deviation of subject and cluster sealed score distributions are 300 and 65respectively; the range is from 40 to 560. Subject scaled scores are computed independently ofcluster scaled scores. A subject scaled score is not, for example, the average of its cluster scaledscores.
Estimated Comparable National Percentile Ranks
Estimated comparable national percentile ranks are based on the performances of students inthe state sample on the MMAT and the Iowa Tests of Basic Skills (II xiS) at grades 3, 6, and 8 orthe Tests of Achievement and Proficiency (TAP) at grade 10. The process used to obtaincomparable scores involves relating the sample's distribution of MMAT raw scores to thesample's distribution of ITBS or TAP raw scores. The comparable national percentile ranksderived from state sample data are then used to estimate comparable percentile ranks for allstudents taking the MMAT.
Each student in grades 3, 6, and 8 receives an estimated comparable national percentile rank inreading/English, language arts, mathematics, science, and social studies. Each tenth gradestudent receives this type of score for all of the above except language arts.
Score Reports
The MMAT is especially flexible as an educational tool because scores are reported through avariety of complementary forms, all appropriate to different educational situations. TheIndividual Student Report presents one student's results for each subject and its associatedclusters as well as Key Skill mastery data. The Pupil List Report is a roster of all students in agrade; it presents Key Skill mastery information for every student. The Grade Level Key SkillReport, the Grade Level Cluster Report, and the Summary Report present aggregate data forKey Skills, clusters, and subjects respectively at the building and district level. The Chapter IEligibility List presents students eligible in reading, language arts, and mathematics forChapter I services.
-) 3

Validity
69
Content validity was built into the MMAT during the development proLess because contentexperts wrote the test content specifications and the test items. In order to further ensure contentvalidity, at least three content Pxperts reviewed each item in order to determine whether itwas congruent with its respective Key Skill. All items selected for the final forms were judgedto be valid Key Skill measures by at least four content experts.
Evidence for the construct validity of the MMAT is currently being collected through factoranalytic and correlational studies. These initial studies are being conducted on the data fromthe Spring 1987 administration of Form A.
Reliability
Several types of estimates of score reliability were computed on the Form A data, includingindices of internal consistency for raw scores, item response theory reliability estimates forsubject and cluster scaled scores, and estimates indicating the reliability of Key Skill masteryclassifications.
Internal consistency estimates (KR-20) of subject raw score reliability range from .846 to .950across grades and subjects, with the median estimate equal to .933. Item response theoryestimates of duster scaled score reliability range from .668 to .955 across grades and subjects,with the median estimate equal to .832. Item response theory estimates of subiPct scaled scorereliability are not yet available, but they are likely to be higher than the ch.ster scorereliability estimates. Raw agreement indices showing the reliability of Key Skill masteryclassifications range from .515 to to .909 across grades and subjects; most indices are between .60and .70.
References
American Psychological Association. (1985). Standards for educational and psychologicaltesting. Washington, DC: Author.
Mislevy, R. J., & Bock, R. D. (1984). BILOG: Item analysis and test scoring with binary logisticmodels. Mooresville, IN: Scientific Software, Inc.
9 0

Appendix B
ITBS/TAP Subtests
70
Grade
2
3-8
9 -10
Reading Language Mathematics Science Social Studies
PicturesSentencesStories
ReadingComprehension
ReadingComprehension
SpellingCapitalizationPunctuationUsage & Expression
SpellingCapitalizationPunctuationUsage & Expression
ConceptsProblemsComputation
ConceptsProblemsComputation
Science Social Studies
Mathematics Science Social Studies

Appendix C
MISSOURI MASTERY AND ACHIEVEMENT TESTSINDIVIDUAL STUDENT REPORT, SPRING 1987
Please turn the cage o'er for an exo anal on of t'ese scores
71
!Name: SAM COLLINS!Building: PLUM RIPE ELEMENTARYDist GOOD SOIL RURAL DISTRICT #1Dist. Ccde997- 789 -3000
Test Date:SPRING 1987
Subject: READING/LANGUAGE ARTSLevel Form:6/A Grade:6
Estimated Comparable
National Percentile Ranking:72 READING
57 LANGUAGE
READING/LANGJAsE ARTS(.:lusters:
READINGLANGUAGE ARTSWRITING
Student s Distract State
Score ,:sverT.de
317 290 300
339 292 300
312 283 300
296 301 300
Ke,y Skiiis:Mastered
B-1 Contextual Word MeaningB-2 New Word MeaningB -4 Synonyms/AntonymsC-1 Story SequenceC-2 Author's PurposeC-3 Fact/OpinionC-4 Cause-effectC-5 Character ComparisonC-6 Main IdeaC-7 SummarizationC-8 Outcome PredictionC-9 Conclusions/GeneralizationsC-I0 Story ElementsC-11 Point of ViewD-2 Maps/Charts/TablesD-5 Appropriate SourcesG-3 Effective WritingG-5 SpellingG-6 Capitalization
f,2
NOTE ....
ecLL S
Not Mastered
C-12 Figurative LanguageD-1 Learning ResourcesD-6 DirectionsG-4 Draft RevisionG-7 Punctuation.
G-8 Grammatical Usage

72
Appendix D
Chapter 1 Eligibility Standards
Grade Percentile Rank
K-3 45
4-6 40
7 36
8 32
9 28
10 24
Note: Students scoring at or below the percentile rank are eligible toreceive Chapter I services.
P es
1

Appendix E73
MISSOURI MASTERY AND ACHIEVEMENT TESTS
ELIGIBLE IN 3 SUBJECTS
CHAPTER 1
READINGPERCENTILE NCE
ELIGIBILITY LIST
LANGUAGEPERCENTILE NCE
MATHPERCENTILE NCE
IEP ADAMS JOHN 1 1 6 17 1 1
ARTHUR CHERYL 10 23 4 13 9 22BRECKINRIDGE JOHN 5 15 21 33 6 17
BURR ALICE 36 43 39 44 14 27IEP CALHOUN JOHN 2 7 I 1 14 27
CLINTON GERRY 5 15 6 17 13 26IEP COLFAX SCHUYLER 1 1 10 23 I 1
DALLAS SUE 8 20 10 23 1 1
FAIRBANKS CHARLES 22 34 21 33 9 22FILMORE MILLIE 14 27 30 39 21 33
GERRY ELBRIDGE 34 41 4 13 13 26HAMLIN HEATHER 18 31 26 37 26 37
HENDRICKS THOMAS 14 27 30 39 21 33HOBART LINDA 27 37 18 31 14 27JEFFERSON THOMAS 10 23 18 31 14 27
JOHNSON ANN it 24 2 7 4 13JOHNSON RICHARD 22 34 10 23 8 20
IEP KING WILMA 2 7 3 11 2 7
MORTON LEVI 18 31 15 28 39 44ROSSEVELT CARRIE 5 15 10 23 9 22
SHERMAN JAMES 11 24 6 17 3 11STEVENSON BETTY 22 34 6 16 6 17
IEP TOMPKINS DANIEL 6 17 1 1 1 1
IEP TYLER MARY 6 17 4 13 11 24VAN BUREN MARTIN 14 27 3 11 1 1