Extension of the Rocchio Classification Method to Multi-modal Categorization of Documents in Social...
14
Extension of the Rocchio Classification Method to Multi-modal Categorization of Documents in Social Media Amin Mantrach and Jean-Michel Renders Yahoo! Research Barcelona ?? , Xerox Research Centre Europe [email protected],[email protected] Abstract. Most of the approaches in multi-view categorization use early fusion, late fusion or co-training strategies. We propose here a novel classification method that is able to efficiently capture the interactions across the different modes. This method is a multi-modal extension of the Rocchio classification algorithm – very popular in the Information Re- trieval community. The extension consists of simultaneously maintaining different “centroid” representations for each class, in particular “cross- media” centroids that correspond to pairs of modes. To classify new data points, different scores are derived from similarity measures between the new data point and these different centroids; a global classification score is finally obtained by suitably aggregating the individual scores. This method outperforms the multi-view logistic regression approach (using either the early fusion or the late fusion strategies) on a social media corpus - namely the ENRON email collection - on two very different categorization tasks (folder classification and recipient prediction). 1 Introduction Multi-modal (or multi-view 1 ) learning has been intensively studied since a long period. It relates to the problem of learning from multiple set of features. As suggested by [1], the multi-modal learning takes its justification from the fact that a high consensus of two independent hypotheses results in a low gener- alization error. These last years, several new methods have been proposed for the semi-supervised and the unsupervised settings (for semi-supervised multi- view learning, see the survey in [2]). However, few has been done in the fully supervised setting. Actually, as pointed out by [3], in a fully supervised setting, multi-modal learning usually performs worse than learning on the union of all modes. In this setting, the standard approaches are the early fusion (EF ) method and the late fusion (LF ) method. The former consists of directly learning from a common ?? This work has been done when the author was with Xerox Research Centre Europe. 1 The multi-view learning has different designations in the literature depending on the communities and the time period. In this paper, “views” and “modes” are considered as synonyms referring to the same concept.
-
Upload
independent -
Category
Documents
-
view
2 -
download
0
Transcript of Extension of the Rocchio Classification Method to Multi-modal Categorization of Documents in Social...

Extension of the Rocchio Classification Methodto Multi-modal Categorization of Documents in
Social Media
Amin Mantrach and Jean-Michel Renders
Yahoo! Research Barcelona??, Xerox Research Centre [email protected],[email protected]
Abstract. Most of the approaches in multi-view categorization use earlyfusion, late fusion or co-training strategies. We propose here a novelclassification method that is able to efficiently capture the interactionsacross the different modes. This method is a multi-modal extension of theRocchio classification algorithm – very popular in the Information Re-trieval community. The extension consists of simultaneously maintainingdifferent “centroid” representations for each class, in particular “cross-media” centroids that correspond to pairs of modes. To classify new datapoints, different scores are derived from similarity measures between thenew data point and these different centroids; a global classification scoreis finally obtained by suitably aggregating the individual scores. Thismethod outperforms the multi-view logistic regression approach (usingeither the early fusion or the late fusion strategies) on a social mediacorpus - namely the ENRON email collection - on two very differentcategorization tasks (folder classification and recipient prediction).
1 Introduction
Multi-modal (or multi-view1) learning has been intensively studied since a longperiod. It relates to the problem of learning from multiple set of features. Assuggested by [1], the multi-modal learning takes its justification from the factthat a high consensus of two independent hypotheses results in a low gener-alization error. These last years, several new methods have been proposed forthe semi-supervised and the unsupervised settings (for semi-supervised multi-view learning, see the survey in [2]). However, few has been done in the fullysupervised setting.
Actually, as pointed out by [3], in a fully supervised setting, multi-modallearning usually performs worse than learning on the union of all modes. In thissetting, the standard approaches are the early fusion (EF ) method and the latefusion (LF ) method. The former consists of directly learning from a common
?? This work has been done when the author was with Xerox Research Centre Europe.1 The multi-view learning has different designations in the literature depending on the
communities and the time period. In this paper, “views” and “modes” are consideredas synonyms referring to the same concept.
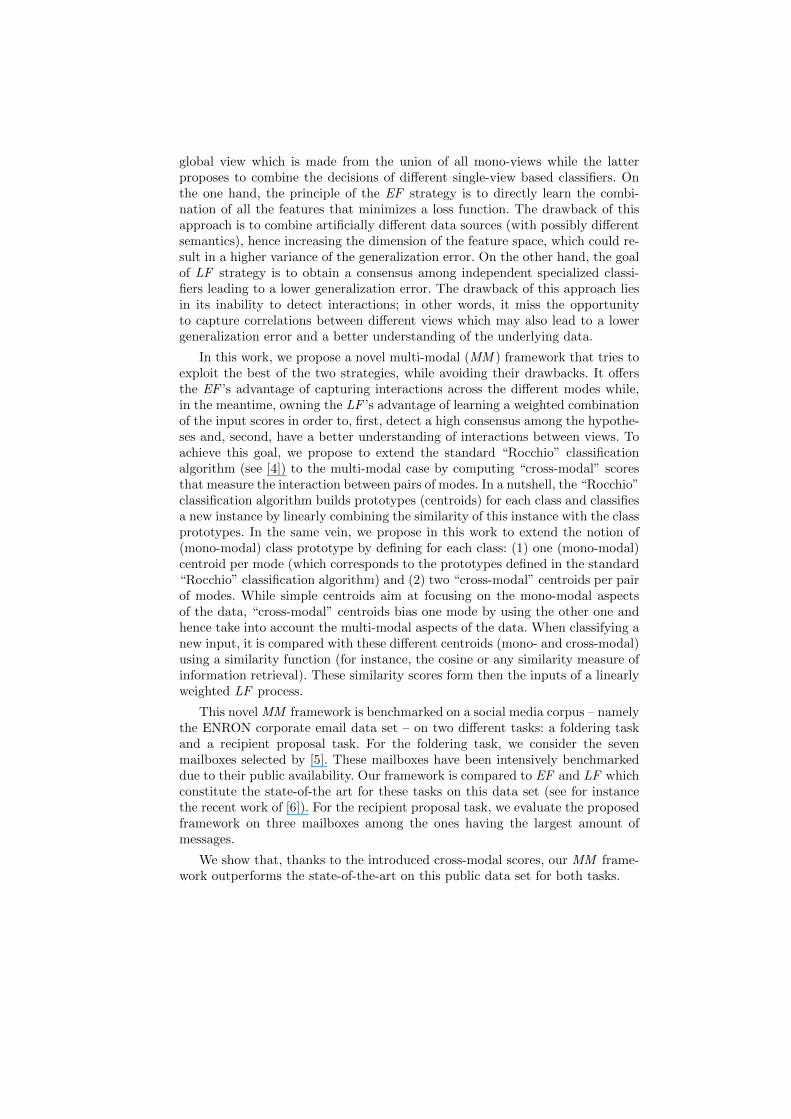
global view which is made from the union of all mono-views while the latterproposes to combine the decisions of different single-view based classifiers. Onthe one hand, the principle of the EF strategy is to directly learn the combi-nation of all the features that minimizes a loss function. The drawback of thisapproach is to combine artificially different data sources (with possibly differentsemantics), hence increasing the dimension of the feature space, which could re-sult in a higher variance of the generalization error. On the other hand, the goalof LF strategy is to obtain a consensus among independent specialized classi-fiers leading to a lower generalization error. The drawback of this approach liesin its inability to detect interactions; in other words, it miss the opportunityto capture correlations between different views which may also lead to a lowergeneralization error and a better understanding of the underlying data.
In this work, we propose a novel multi-modal (MM ) framework that tries toexploit the best of the two strategies, while avoiding their drawbacks. It offersthe EF ’s advantage of capturing interactions across the different modes while,in the meantime, owning the LF ’s advantage of learning a weighted combinationof the input scores in order to, first, detect a high consensus among the hypothe-ses and, second, have a better understanding of interactions between views. Toachieve this goal, we propose to extend the standard “Rocchio” classificationalgorithm (see [4]) to the multi-modal case by computing “cross-modal” scoresthat measure the interaction between pairs of modes. In a nutshell, the “Rocchio”classification algorithm builds prototypes (centroids) for each class and classifiesa new instance by linearly combining the similarity of this instance with the classprototypes. In the same vein, we propose in this work to extend the notion of(mono-modal) class prototype by defining for each class: (1) one (mono-modal)centroid per mode (which corresponds to the prototypes defined in the standard“Rocchio” classification algorithm) and (2) two “cross-modal” centroids per pairof modes. While simple centroids aim at focusing on the mono-modal aspectsof the data, “cross-modal” centroids bias one mode by using the other one andhence take into account the multi-modal aspects of the data. When classifying anew input, it is compared with these different centroids (mono- and cross-modal)using a similarity function (for instance, the cosine or any similarity measure ofinformation retrieval). These similarity scores form then the inputs of a linearlyweighted LF process.
This novel MM framework is benchmarked on a social media corpus – namelythe ENRON corporate email data set – on two different tasks: a foldering taskand a recipient proposal task. For the foldering task, we consider the sevenmailboxes selected by [5]. These mailboxes have been intensively benchmarkeddue to their public availability. Our framework is compared to EF and LF whichconstitute the state-of-the art for these tasks on this data set (see for instancethe recent work of [6]). For the recipient proposal task, we evaluate the proposedframework on three mailboxes among the ones having the largest amount ofmessages.
We show that, thanks to the introduced cross-modal scores, our MM frame-work outperforms the state-of-the-art on this public data set for both tasks.

To summarize, the main contributions of this paper are the following:
– It introduces a new competitive framework which can be used for classifica-tion in case of multi-modal inputs.
– It proposes to compute cross-modal centroids which reflect the multi-modalaspects of the data.
– It shows on various mailboxes of the ENRON data set that the proposedmethod outperforms established methods, i.e. the EF and the LF, on folder-ing and recipient proposal tasks.
2 Problem statement
More concretely, the multi-modal classification problem may be formalized asfollows: We have at our disposal a collection of Nd data instances represented by
M different data matrices X(m) of size Nd × N (m)f , where N
(m)f is the number
of features associated with the mode m ∈ M (the set of modes {1, ...,M}).The vector x
(m)d• denotes the row d of X(m) and x
(m)i,j denotes the entry (i, j) of
the same matrix. X is the matrix obtained by concatenating the different X(m)
matrices in an ascending mode order, i.e. X = [X(1)X(2)...X(|M |)]. The vector
x(•)d• denotes the row d of this matrix.
For learning, we have a set of labeled multi-modal data instances L =
{x(•)d• , yd}, d ∈ [1, Nd], yd ∈ C,x(•)
d• ∈ X . C is the set of the different labels:{c1, ..., c|C|} and X the set of multi-modal data instances.
We want to design a model Mc ∈ M (the set of multi-modal models) foreach class c ∈ C and a multi-modal classification function F : X × M →R. The predicted class of an unlabeled multi-modal point x
(•)u• will be y =
argmaxcF (x(•)u• ,Mc).
One way to solve the problem consists of learning the classification modelsMc’s directly in the feature space which consists of the union of all modes. Inthis case, we are using an early fusion (EF ) approach. However, as suggestedby [7], in order to achieve good performance, each mode should be normalizedseparately before combination. This is mostly to make features comparable withrespect to the range of values across the different modes and features.
Another standard approach consists of learning separately the different clas-sification models Mm
c ’s for each mode m. After learning, the decision functionconsists of a linear combination of the different scores obtained on each modem.
y = argmaxc
∑m
αmc F (x
(m)u• ,M
mc ) (1)
The weights αmc attributed to the different modes for each class are generally
tuned on a independent validation set. This method is called late fusion (LF )as opposed to early fusion. Note that most of the proposed and widely usedlearning to rank systems are based on the linear combination of features [8, 9].
The advantage of the early fusion lies in its ability to capture relations be-tween features across different modes. Furthermore, it avoids the supplementary
task of tuning hyper-parameters needed in the case of a late fusion approach.However, the early fusion suffers from combining artificially into one vector spacemultiple sources having different semantics. Furthermore, the level of sparsitymay change across modes. Indeed, for instance, image features are dense, whilebag-of-words document vectors are sparse and social-media participant vectorsare binary sparse vectors. Another drawback of the early fusion method is to in-crease drastically the dimension of the feature space which results in increasingthe variance of the generalization error. Hence, the late fusion strategy whichconsists of combining different expert models results generally in a lower vari-ance. Its drawback is its inability to capture any possible combination of featuresacross different modalities that may result in a better prediction.
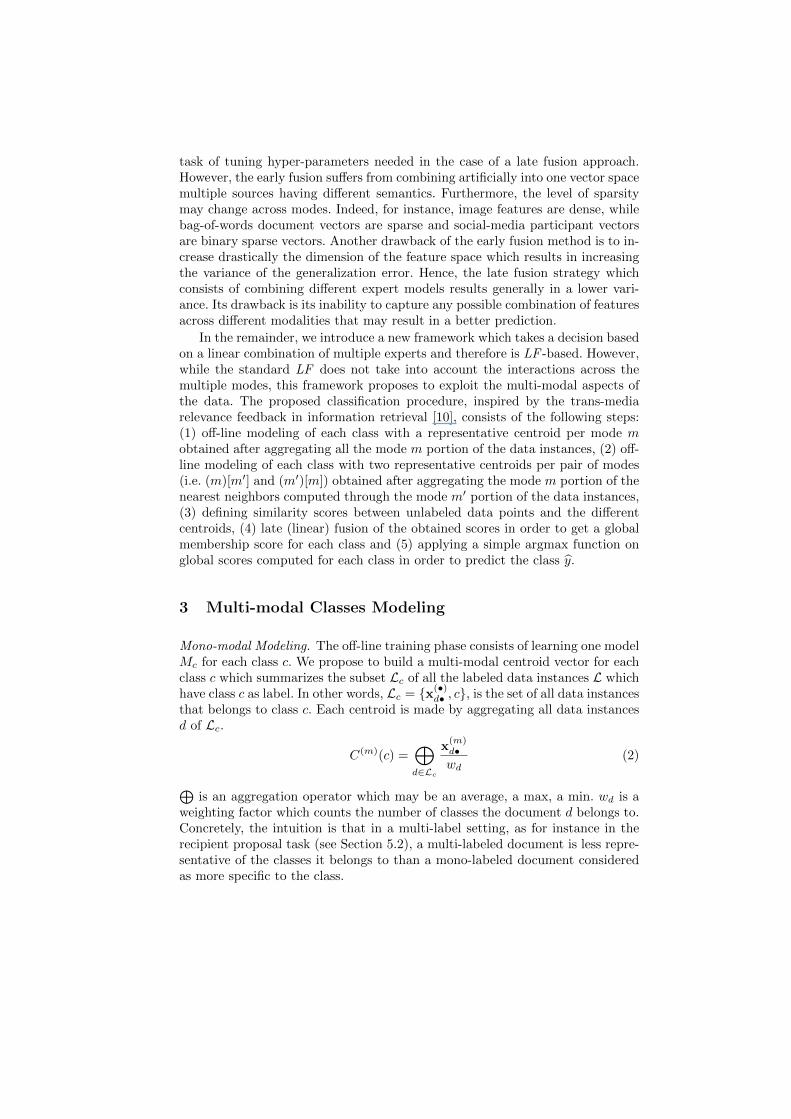
In the remainder, we introduce a new framework which takes a decision basedon a linear combination of multiple experts and therefore is LF -based. However,while the standard LF does not take into account the interactions across themultiple modes, this framework proposes to exploit the multi-modal aspects ofthe data. The proposed classification procedure, inspired by the trans-mediarelevance feedback in information retrieval [10], consists of the following steps:(1) off-line modeling of each class with a representative centroid per mode mobtained after aggregating all the mode m portion of the data instances, (2) off-line modeling of each class with two representative centroids per pair of modes(i.e. (m)[m′] and (m′)[m]) obtained after aggregating the mode m portion of thenearest neighbors computed through the mode m′ portion of the data instances,(3) defining similarity scores between unlabeled data points and the differentcentroids, (4) late (linear) fusion of the obtained scores in order to get a globalmembership score for each class and (5) applying a simple argmax function onglobal scores computed for each class in order to predict the class y.
3 Multi-modal Classes Modeling
Mono-modal Modeling. The off-line training phase consists of learning one modelMc for each class c. We propose to build a multi-modal centroid vector for eachclass c which summarizes the subset Lc of all the labeled data instances L whichhave class c as label. In other words, Lc = {x(•)
d• , c}, is the set of all data instancesthat belongs to class c. Each centroid is made by aggregating all data instancesd of Lc.
C(m)(c) =⊕d∈Lc
x(m)d•wd
(2)
⊕is an aggregation operator which may be an average, a max, a min. wd is a
weighting factor which counts the number of classes the document d belongs to.Concretely, the intuition is that in a multi-label setting, as for instance in therecipient proposal task (see Section 5.2), a multi-labeled document is less repre-sentative of the classes it belongs to than a mono-labeled document consideredas more specific to the class.
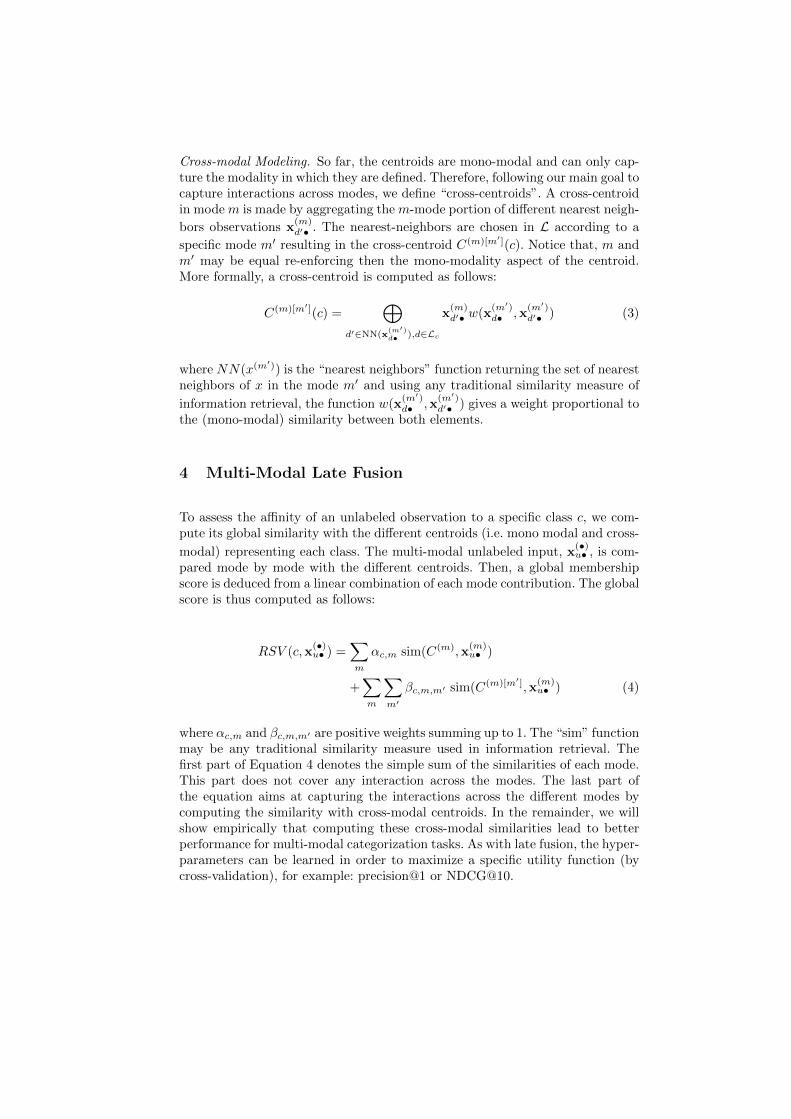
Cross-modal Modeling. So far, the centroids are mono-modal and can only cap-ture the modality in which they are defined. Therefore, following our main goal tocapture interactions across modes, we define “cross-centroids”. A cross-centroidin mode m is made by aggregating the m-mode portion of different nearest neigh-
bors observations x(m)d′• . The nearest-neighbors are chosen in L according to a
specific mode m′ resulting in the cross-centroid C(m)[m′](c). Notice that, m andm′ may be equal re-enforcing then the mono-modality aspect of the centroid.More formally, a cross-centroid is computed as follows:
C(m)[m′](c) =⊕
d′∈NN(x(m′)d• ),d∈Lc
x(m)d′• w(x
(m′)d• ,x
(m′)d′• ) (3)
where NN(x(m′)) is the “nearest neighbors” function returning the set of nearest
neighbors of x in the mode m′ and using any traditional similarity measure of
information retrieval, the function w(x(m′)d• ,x
(m′)d′• ) gives a weight proportional to
the (mono-modal) similarity between both elements.
4 Multi-Modal Late Fusion
To assess the affinity of an unlabeled observation to a specific class c, we com-pute its global similarity with the different centroids (i.e. mono modal and cross-
modal) representing each class. The multi-modal unlabeled input, x(•)u• , is com-
pared mode by mode with the different centroids. Then, a global membershipscore is deduced from a linear combination of each mode contribution. The globalscore is thus computed as follows:
RSV (c,x(•)u• ) =
∑m
αc,m sim(C(m),x(m)u• )
+∑m
∑m′
βc,m,m′ sim(C(m)[m′],x(m)u• ) (4)
where αc,m and βc,m,m′ are positive weights summing up to 1. The “sim” functionmay be any traditional similarity measure used in information retrieval. Thefirst part of Equation 4 denotes the simple sum of the similarities of each mode.This part does not cover any interaction across the modes. The last part ofthe equation aims at capturing the interactions across the different modes bycomputing the similarity with cross-modal centroids. In the remainder, we willshow empirically that computing these cross-modal similarities lead to betterperformance for multi-modal categorization tasks. As with late fusion, the hyper-parameters can be learned in order to maximize a specific utility function (bycross-validation), for example: precision@1 or NDCG@10.
5 Experiments and Discussions
5.1 The ENRON Data Set
The introduced multi-modal (MM ) framework is validated on the ENRON dataset.This dataset consists of a set of vectors and matrices that represent the wholeENRON corpus [see, e.g., 11], after linguistic preprocessing and metadata ex-traction. The linguistic preprocessing consists of removing some particular arte-facts of the collection (for instance some recurrent footers, that have nothing todo with the original collection but indicate how the data were extracted), re-moving headers for emails (From/To/. . . fields), removing numerals and stringsformed with non-alphanumeric characters, lowercasing all characters, removingstopwords as well as words occurring only once in the collection. There are twotypes of documents: documents are either (parent) emails or attachments (anattachment could be a spreadsheet, a power-point presentation, . . . ; the conver-sion to standard plain text is already given by the data provider). The ENRON
collection contains 685,592 documents (455,449 are parent emails, 230,143 areattachments) extracted from 151 different mailboxes. We decided to process theattachments simply by merging their textual content with the content of theparent email, so that we have to deal only with parent emails. For parent emails,we have not only the content information, but also metadata. The metadataconsist of:
– the custodian (i.e. the person who owns the mailbox from which this emailis extracted);
– the location (i.e. the folder decomposition of each mailbox owner);– the date or timestamp;– the Subject field (preprocessed in the same way as standard content text);– the From field;– the To field ;– the CC field.
After preprocessing, we summarize the data by two views for each data point:the textual view and the social view. The textual view consists of a bag-of-wordrepresentation of the aggregation of the “Body” vector, the “Attachment” vectorand “Subject” vector. The social view is a vector in the bag-of-participants spacewhich is the aggregation of the “From” vector, the “To” vector and the “Cc”vector.
For the foldering task, among the 151 available mailboxes, we consider 7mailboxes having a sufficient amount of folders selected in [5]. Furthermore,we removed folders which are not specific to the considered mailbox but whichhave been automatically generated by an email client software. For instance, thefolders “All documents”, “Calendar”, “Sent mail”, “Deleted Items”, “Inbox”,“Sent Items”, “Unread Mail”, “Contacts” and “Drafts” have been discardedfrom the evaluation. Statistics on the seven selected folders are reported in Table1. For the recipient proposal task, we report results for three mailboxes amongthe five having the largest amount of emails in the collection, namely: Vince J.Kaminski, Jeff Dasovich and Tana Jone’s mailboxes.

Mailbox #Folders Total #em Min #em. Max #em. Aver # em/Folder
Beck 60 258 1 27 4.30Farmer 27 1689 1 528 62.56
Kaminski 32 842 1 120 26.31Kitchen 51 4162 1 784 81.61Lokay 14 1837 1 915 131.21
Sanders 20 411 2 181 20.55Williams 21 2043 1 1076 97.29
Table 1. Folders distribution among of the preprocessed mailboxes used for the folder-ing task
5.2 Benchmark Protocol
The proposed model is tested on two different mail management tasks: (1) emailfoldering whose goal is to retrieve the correct folder in which an email should gousing all its information (i.e. textual content and social metadata), (2) recipientproposal whose goal is to automatically propose recipient candidates for a newwritten message based only on the textual part of the email. It is importantto note that the temporal aspect plays here a big role. Indeed, it would begenerally easier to predict the recipient of new emails based on recent poststhan on old ones. This comes from the fact that generally emails are part of aglobal discussion thread. In case of foldering, users may create folders, delete ormove emails after an amount of time, for instance to the “Trash” folder to freememory on the server. We could introduce the temporal aspect in our modelwhen building centroids by weighting the contribution of each message usingthe timestamp meta data. However, in order to compare more fairly with state-of-the-art LR and ER fusion methods we decide to not include the temporalinformation directly into the model. Instead, we decide to make training-testsplits which reflect the sequential aspect of the data such that the comparedmethods are tested on more recent emails than those used during the trainingphase. Hence, we assume that the emails of the collection are sorted by increasingorder of their timestamp.
For the foldering task, we consider training sets composed by 50% of themailbox. After learning, the goal is to predict the folder of the next 10% emailsin the temporal sequence. For example, when considering a training set madefrom the first 50% of the collection (i.e. in terms of timestamp), the test set thenconsists of the emails in the interval 50%-60%. By time-shifting the training andthe test sets by 10%, we may consider training on the emails going from 10% to60% and test on the next 10%, and so on. So that, finally, we define 5 possibletraining and test sets. The different methods require some hyper-parameters tobe set. For this purpose, during each training phase, hyper-parameters are tunedinternally by dividing the 50% training set into 40% internal-training and 10%internal-test. For the recipient proposal task, we consider training sets and testsets made each by 10% of the mailbox. By time-shifting by 10% the training-testsets we define 9 different splits. The first two splits are used as validation set for

Alg. R@1 R@3 R@5 R@10 NDCG@10 NDCGBeck’s mailbox
MM 0.55 +/- 0.15 0.68 +/- 0.12 0.71 +/- 0.08 0.77 +/- 0.11 0.66 +/- 0.11 0.68 +/- 0.10LF 0.42 +/- 0.1 0.57 +/- 0.06 0.62 +/- 0.06 0.70 +/- 0.04 0.56 +/- 0.06 0.60 +/- 0.06EF 0.46 +/- 0.14 0.63 +/- 0.15 0.65 +/- 0.11 0.69 +/- 0.09 0.59 +/- 0.12 0.63 +/- 0.10
Farmer’s mailboxMM 0.68 +/- 0.11 0.82 +/- 0.09 0.87 +/- 0.08 0.89 +/- 0.07 0.79 +/- 0.08 0.81 +/- 0.08LF 0.65 +/- 0.14 0.79 +/- 0.13 0.81 +/- 0.12 0.86+/- 0.09 0.76 +/- 0.12 0.78 +/- 0.11EF 0.68 +/- 0.13 0.77 +/- 0.12 0.81 +/- 0.11 0/85 +/- 0.08 0.76 +/- 0.11 0.78 +/- 0.10
Kaminski’s mailboxMM 0.54 +/- 0.20 0.68 +/- 0.21 0.73 +/- 0.16 0.82 +/- 0.18 0.67 +/- 0.19 0.70 +/-0.18LF 0.44 +/- 0.19 0.61 +/- 0.25 0.67 +/- 0.22 0.77 +/- 0.17 0/60 +/- 0.19 0.63 +/- 0.19EF 0.51 +/- 0.22 0.61 +/- 0.21 0.67 +/- 0.23 0.78 +/- 0.21 0.63 +/- 0.21 0.66 +/- 0.20
Kitchen’s mailboxMM 0.42 +/- 0.13 0.65 +/- 0.07 0.77 +/- 0.07 0.87 +/- 0.08 0.63 +/- 0.09 0.65 +/- 0.08LF 0.41 +/- 0.12 0.65 +/- 0.16 0.75 +/- 0.13 0.81 +/- 0.14 0.61 +/- 0.13 0.64 +/- 0.12EF 0.44 +/- 0.12 0.64 +/- 0.12 0.74 +/- 0.10 0.83 +/- 0.10 0.63 +/- 0.11 0.66 +/- 0/09
Table 2. Table presenting the results for a foldering task averaged on 5 chronologicalordered training-test pairs for the Beck’s, Farmer’s, Kaminski’s and Kitchen’s mail-boxes. The state-of-the art methods late fusion (LF ) and early fusion (EF ) are com-pared with the proposed multi-modal framework. The reported performance measurefor this mono-label classification task are the Recall@1,@5, @10, the NDCG@10 andthe NDCG. The hyper-parameters of each algorithm has been tuned on an independentvalidation set.
tuning the hyper-parameters of the different methods. The remaining splits areused for assessing the performance of the different algorithms.
5.3 Classification models and tuning
The benchmarked classification models are (1) the MM model proposed in thispaper, the (2) EF model and the (3) LF model. For the EF and LF fusionmodels we use a one-vs-rest logistic regression classifier with a l2-norm regu-larization. This provides, after normalization, the posterior probability of eachclass given a test data point. As previously said, the regularization parameter isinternally tuned during training for the foldering task, or tuned on an indepen-dent validation set for the recipient proposal task. For the LF strategy, the bestconvex combination (i.e. achieving the best performance in terms of NDCG@10on a independent data set) of the mono-modal classifiers is kept for the test.
For the MM model, a set of parameters has to be learned for each classcorresponding to the weights given to each centroid by the model. The classparameters are learned using a logistic regression where a positive target (+1)is associated to data points that belongs to the class and negative target (0) forunlabeled points. For classes with less than 30 data points, we use an uniformconvex combination of the weights.
Note that the number of nearest-neighbors used for computing “cross-modal”centroids has been set to 10. The results obtained on 5, 20 and 30 nearest-neighbors lead to the same observations.

Alg. R@1 R@3 R@5 R@10 NDCG@10 NDCGLokay’s mailbox
MM 0.80 +/- 0.04 0.92 +/- 0.05 0.95 +/- 0.04 0.96 +/- 0.04 0.89 +/- 0.04 0.89 +/- 0.04LF 0.77 +/- 0.04 0.90 +/- 0.05 0.94 +/- 0.04 0.96 +/- 0.04 0.87 +/- 0.04 0.87 +/- 0.04EF 0.81 +/- 0.05 0.91 +/- 0.06 0.95 +/- 0.05 0.96 +/- 0.04 0.89 +/- 0.05 0.89 +/- 0.05
Sanders’s mailboxMM 0.82 +/- 0.12 0.86 +/- 0.13 0.88 +/- 0.10 0.92 +/- 0.12 0.86 +/- 0.12 0.87 +/- 0.11LF 0.70 +/- 0.13 0.84 +/- 0.13 0.86 +/- 0.13 0.90 +/- 0.15 0.80 +/- 0.13 0.82 +/- 0.12EF 0.78 +/- 0.14 0.82 +/- 0.14 0.86 +/- 0.16 0.89 +/- 0.15 0.83 +/- 0.14 0.84 +/- 0.13
Williams’s mailboxMM 0.68 +/- 0.34 0.80 +/- 0.38 0.81 +/- 0.38 0.81 +/- 0.36 0.76 +/- 0.36 0.77 +/- 0.33LF 0.74 +/- 0.37 0.80 +/- 0.39 0.81 +/- 0.38 0.81 +/- 0.38 0.78 +/- 0.38 0.79 +/- 0.35EF 0.74 +/- 0.37 0.80 +/- 0.38 0.81 +/- 0.38 0.78 +/- 0.37 0.78 +/- 0.37 0.79 +/- 0.34
Table 3. Table presenting the results for a foldering task averaged on 5 chronologicalordered training-test pairs for the Lokay’s, Sanders’s and Williams’s mailboxes. Thestate-of-the art methods late fusion (LF ) and early fusion (EF ) are compared with theproposed multi-modal framework. The reported performance measure for this mono-label classification task are the Recall@1,@5, @10, the NDCG@10 and the NDCG. Thehyper-parameters of each algorithm has been tuned on an independent validation set.
5.4 Results and discussion
Foldering Task: The obtained results for the MM, EF and LF are reportedin Table 2 and Table 3. The retrieval measure performance are the recall atrank 1 (R@1), the recall at rank 3 (R@3), the recall at rank 5 (R@5) and therecall at rank 10 (R@10), knowing that, for each data point, there is only onerelevant folder. We measure also the normalized discounted cumulative gain,limited to rank 10 (NDCG@10) and on the whole set of folders (NDCG). Thereported scores are the results averaged over the 5 sequential training-test pairs.Clearly, for 4 of the 7 mailboxes (namely: Beck, Farmer, Kaminski and Sanders)the proposed MM framework outperforms the EF and the LF strategies. Thescores in bold mean that the performances are significantly better (verified bya signed test with a p-value < 0.05). Moreover, the EF and LF methods neveroutperforms the MM approach on all the measures simultaneously. Although theLF is generally the preferred approach for a foldering task on this data set (see,e.g. [6]), we observe in our tests that EF is always better or equivalent for all theperformance measures than LF. Hence, we argue that often EF is not correctlyused. Indeed, it is important to normalize independently each view before fusiondue to the semantic difference that may exist between the views. The resultsreported on William’s mailbox have a large variance. This is because, at thesecond time step, new folders have been created by the user for which no emailsor a few were present in the training. In the real world, this realistic case oftenhappen, therefore designing sequential training-test splits is critical in order tofairly assess the performance of the system.
recipient proposal The results are reported for three different mailboxes in Ta-ble 4. The recipient proposal task is a multi-label classification task for whichthe performance are measured using the macroF1 (maF1), the mean averageprecision (MAP) and the NDCG. For the MM framework, we also report the

Model maF1 MAP NDCG
Kaminski’s mailbox
C(text) 0.16 +/- 0.03 0.24 +/- 0.05 0.40 +/- 0.07
C(text)[text] 0.38 +/- 0.06 0.44 +/- 0.09 0.55 +/- 0.11
C(text)[participant] 0.11 +/- 0.02 0.13 +/- 0.03 0.24 +/- 0.04
C(participant) 0.04 +/- 0.01 0.11 +/- 0.01 0.26 +/- 0.04
C(participant)[participant] 0.11 +/- 0.01 0.21 +/- 0.02 0.37 +/- 0.04
C(participant)[text] 0.02 +/- 0.01 0.04 +/- 0.01 0.15 +/- 0.02
αC(text) + (1 − α)C(participant) 0.18 +/- 0.03 0.26 +/- 0.05 0.42 +/- 0.07EF 0.29 +/- 0.16 0.34 +/- 0.18 0.45 +/- 0.19LF 0.30 +/- 0.16 0.35 +/- 0.18 0.46 +/- 0.19RSV 0.40 +/- 0.05 0.46 +/- 0.08 0.57 +/- 0.11
Dasovich’s mailbox
C(text) 0.61 +/- 0.14 0.25 +/- 0.06 0.46 +/- 0.04
C(text)[text] 0.66 +/- 0.14 0.28 +/- 0.06 0.48 +/- 0.07
C(text)[participant] 0.57 +/- 0.14 0.25 +/- 0.03 0.47 +/- 0.02
C(participant) 0.62 +/- 0.08 0.30 +/- 0.04 0.49 +/- 0.03
C(participant)[participant] 0.74 +/- 0.15 0.38 +/- 0.04 0.54 +/- 0.04
C(participant)[text] 0.78 +/- 0.09 0.37 +/- 0.04 0.49 +/- 0.03
αC(text) + (1 − α)C(participant) 0.67 +/- 0.12 0.31 +/- 0.04 0.50 +/- 0.04EF 0.36 +/- 0.06 0.41 +/- 0.06 0.52 +/- 0.06LF 0.37 +/- 0.06 0.41 +/- 0.06 0.52 +/- 0.06RSV 0.79 +/- 0.07 0.40+/- 0.08 0.55+/- 0.06
Jone’s mailbox
C(text) 0.86 +/- 0.06 0.41 +/- 0.07 0.55 +/- 0.05
C(text)[text] 0.90 +/- 0.05 0.45 +/- 0.06 0.56 +/- 0.05
C(text)[participant] 0.83 +/- 0.07 0.39 +/- 0.06 0.54 +/- 0.04
C(participant) 0.80 +/- 0.05 0.40 +/- 0.07 0.55 +/- 0.05
C(participant)[participant] 0.86 +/- 0.07 0.47 +/- 0.06 0.60 +/- 0.04
C(participant)[text] 0.79 +/- 0.04 0.38 +/- 0.06 0.54 +/- 0.05
αC(text) + (1 − α)C(participant) 0.86 +/- 0.04 0.41 +/- 0.06 0.55 +/- 0.04EF 0.46 +/- 0.12 0.50 +/- 0.09 0.59 +/- 0.06LF 0.46 +/- 0.12 0.12 +/- 0.09 0.59 +/- 0.06RSV 0.91 +/- 0.04 0.50 +/- 0.06 0.60 +/- 0.05
Table 4. Averaged performance measures on 7 different time slots of size 10 % (i.e.training size of 10 %) for Kaminski’s, Dasovich’s and Jone’s mailboxes on a recipientproposal task. The state-of-the art methods late fusion (LF ) and early fusion (EF )are compared with the proposed multi-modal framework. The reported performancemeasure for this multi-label classification task are the maF1, the MAP and the NDCG.The hyper-parameters of each algorithm has been tuned on an independent validationset.
results obtained individually by each centroid. Moreover, in addition of report-ing the results obtained by the EF and LF baselines, we also report the resultsobtained by the MM-baseline which consists of using only a combination of themono-modal centroids.( in other words, the combination of the textual centroidand the social centroid : αC(text) + (1 − α)C(participant) ). On the three testedmailboxes, the proposed MM framework outperforms the EF and the LF andthe simple combination of the textual and the social centroids. The scores inbold mean that the performances are significantly better (verified by a signedtest with a p-value < 0.05). Notice that, on the Kaminski’s mailbox, textual cen-troids obtained a better score than the social centroids, while on the Dasovitch’smailbox social centroids obtained a better score than the textual centroids.
6 Related Work
In a fully supervised setting, as pointed out in [3], multi-view learning usuallyperforms worse than learning on the union of all views. Hence, a few has beendone in this field. For instance, [12] proposed a method that combines a two stagelearning (KCCA followed by SVM) into a single optimization termed “SVM-2K”. Others have considered working on a graph representation of the data. Forinstance, [13] exploited hyperlinks between web pages in order to improve tra-ditional classification tasks using only the content. [14] studied the compositionof kernels in order to improve the performance of a soft-margin support vectormachine classifier. [15, 16] used both local text in a document as well as thedistribution of the estimated classes of other documents in its neighborhood,to refine the class distribution of the document being classified. Their frame-work has been tested for the semi-supervised and fully-supervised classificationas well. More recently, [17] proposes to learn the weights of a namely ”supervisedrandom walk” using both the information from the network structure and theattribute data.
In this paper we introduce an extension of the classical Rocchio classificationalgorithm also known as the nearest centroid or nearest prototype classifier (see[18]) to the multi-modal case. An extension of this algorithm using kernel-basedsimilarities has been introduced in [19]. A probabilistic variant of the Rocchioclassifier has been proposed in [20].
7 Conclusions
In this work, we introduced a novel and simple algorithm in order to deal withmulti-modal fully supervised classification. To this purpose, we extended thetraditional Rocchio classification algorithm by defining mono-modal and multi-modal centroids. The introduced framework has the advantage of searching fora high consensus among views using scores reflecting the interactions betweenthe different existing modes. We showed on two different tasks – a folderingtask and recipient prediction task – that the proposed multi-modal frameworkoutperforms state-of-the-art approaches: the early fusion and the late fusion. As

further research, we would like to investigate multi-view learning with latentspaces and interactions between latent variables.

Bibliography
[1] Abney, S.P.: Bootstrapping. In: Proceedings of the 40th Annual Meetingof the Association for Computational Linguistics. (2002) 360–367
[2] Zhu, X.: Semi-supervised learning literature survey. Technical report (2008)
[3] Ruping, S., Scheffer, T.: Learning with multiple views proposal for an icmlworkshop. In: Proceedings of the ICML 2005 Workshop on Learning WithMultiple Views Bonn, Germany, August 11th, 2005. (2005) 1–7
[4] Manning, C., Raghavan, P., Schutze, H.: Introduction to information re-trieval. Cambridge University Press (2008)
[5] R. Bekkerman, A.M., Huang, G.: Automatic categorization of email intofolders: Benchmark experiments on enron and sri corpora. Technical report,University of Massachusetts (2004)
[6] Tam, T., Ferreira, A., Lourenco, A.: Automatic foldering of email messages:A combination approach. In: Proceedings of the European Conference onInformation Retrieval. (2012) 232–243
[7] Liu, T., Xu, J., Qin, T., Xiong, W., Li, H.: Letor: Benchmark dataset forresearch on learning to rank for information retrieval. In: Proceedings ofSIGIR 2007 workshop on learning to rank for information retrieval. (2007)3–10
[8] Xu, J., Li, H.: Adarank: a boosting algorithm for information retrieval. In:Proceedings of the 30th annual international ACM SIGIR conference onResearch and development in information retrieval, ACM (2007) 391–398
[9] Yue, Y., Finley, T., Radlinski, F., Joachims, T.: A support vector methodfor optimizing average precision. In: ACM SIGIR Conference on Researchand Development in Information Retrieval (SIGIR). (2007) 271–278
[10] Clinchant, S., Renders, J.M., Csurka, G.: Trans-media pseudo-relevancefeedback methods in multimedia retrieval. In: CLEF. (2007) 569–576
[11] Klimt, B., Yang, Y.: The enron corpus: A new dataset for email classificationresearch. In: Proceedings of the 15th European Conference on MachineLearning, Pisa, Italy, September 20-24. (2004) 217–226
[12] Farquhar, J.D.R., Hardoon, D.R., Meng, H., Shawe-Taylor, J., Szedmak,S.: Two view learning: Svm-2k, theory and practice. In: Proceedings ofAdvances in Neural Information Processing Systems. (2005) 355–362
[13] Slattery, S., Mitchell, T.: Discovering test set regularities in relational do-mains. In: Proceedings of the 7th international conference on MachineLearning (ICML 2000). (2000) 895–902
[14] Joachims, T., Cristianini, N., Shawe-Taylor, J.: Composite kernels for hy-pertext categorisation. In: Proceedings of the International Conference onMachine Learning (ICML 2001). (2001) 250–257
[15] Chakrabarti, S., Dom, B., Indyk, P.: Enhanced hypertext categorizationusing hyperlinks. In: Proceedings of the 1998 ACM SIGMOD InternationalConference on Management of Data. (1998) 307–318

[16] Oh, H., Myaeng, S., Lee, M.: A practical hypertext catergorization methodusing links and incrementally available class information. In: Proceedingsof the 23rd international ACM conference on Research and Development inInformation Retrieval (SIGIR 2000), ACM (2000) 264–271
[17] Backstrom, L., Leskovec, J.: Supervised random walks: predicting and rec-ommending links in social networks. In: Proceedings of the Forth Inter-national Conference on Web Search and Web Data Mining, WSDM 2011,Hong Kong, China. (2011) 635–644
[18] Tibshirani, R., Hastie, T., Narasimhan, B., Chu, G.: Diagnosis of multiplecancer types by shrunken centroids of gene expression. Proceedings of theNational Academy of Sciences 99(10) (2002) 6567
[19] Scholkopf, B., Smola, A.: Learning with kernels. The MIT Press (2002)[20] Joachims, T.: A probabilistic analysis of the rocchio algorithm with tfidf for
text categorization. In: Proceedings of International Conference on MachineLearning (ICML 1997). (1997) 143–151