Expression of genes related to muscle plasticity after strength and power training regimens
10
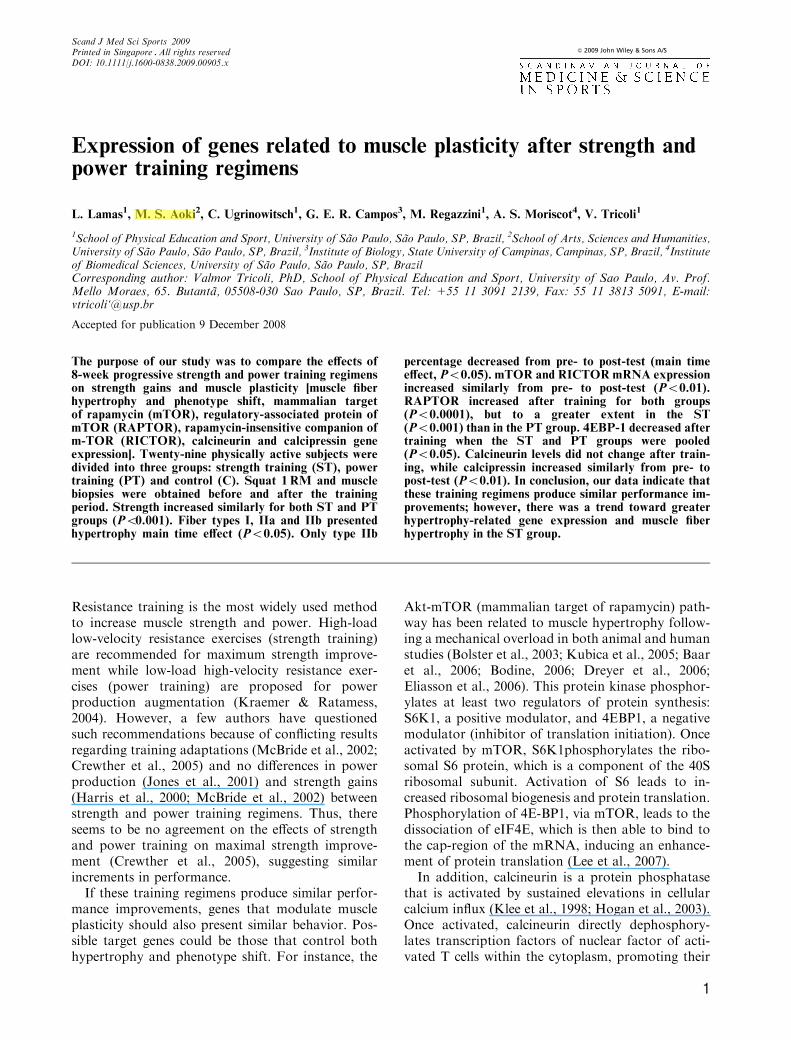
Expression of genes related to muscle plasticity after strength and power training regimens L. Lamas 1 , M. S. Aoki 2 , C. Ugrinowitsch 1 , G. E. R. Campos 3 , M. Regazzini 1 , A. S. Moriscot 4 , V. Tricoli 1 1 School of Physical Education and Sport, University of Sa ˜o Paulo, Sa ˜o Paulo, SP, Brazil, 2 School of Arts, Sciences and Humanities, University of Sa ˜o Paulo, Sa ˜o Paulo, SP, Brazil, 3 Institute of Biology, State University of Campinas, Campinas, SP, Brazil, 4 Institute of Biomedical Sciences, University of Sa ˜o Paulo, Sa ˜o Paulo, SP, Brazil Corresponding author: Valmor Tricoli, PhD, School of Physical Education and Sport, University of Sao Paulo, Av. Prof. Mello Moraes, 65. Butanta ˜, 05508-030 Sao Paulo, SP, Brazil. Tel: 155 11 3091 2139, Fax: 55 11 3813 5091, E-mail: vtricoli‘@usp.br Accepted for publication 9 December 2008 The purpose of our study was to compare the effects of 8-week progressive strength and power training regimens on strength gains and muscle plasticity [muscle fiber hypertrophy and phenotype shift, mammalian target of rapamycin (mTOR), regulatory-associated protein of mTOR (RAPTOR), rapamycin-insensitive companion of m-TOR (RICTOR), calcineurin and calcipressin gene expression]. Twenty-nine physically active subjects were divided into three groups: strength training (ST), power training (PT) and control (C). Squat 1 RM and muscle biopsies were obtained before and after the training period. Strength increased similarly for both ST and PT groups (Po 0.001). Fiber types I, IIa and IIb presented hypertrophy main time effect (Po0.05). Only type IIb percentage decreased from pre- to post-test (main time effect, Po0.05). mTOR and RICTOR mRNA expression increased similarly from pre- to post-test (Po0.01). RAPTOR increased after training for both groups (Po0.0001), but to a greater extent in the ST (Po0.001) than in the PT group. 4EBP-1 decreased after training when the ST and PT groups were pooled (Po0.05). Calcineurin levels did not change after train- ing, while calcipressin increased similarly from pre- to post-test (Po0.01). In conclusion, our data indicate that these training regimens produce similar performance im- provements; however, there was a trend toward greater hypertrophy-related gene expression and muscle fiber hypertrophy in the ST group. Resistance training is the most widely used method to increase muscle strength and power. High-load low-velocity resistance exercises (strength training) are recommended for maximum strength improve- ment while low-load high-velocity resistance exer- cises (power training) are proposed for power production augmentation (Kraemer & Ratamess, 2004). However, a few authors have questioned such recommendations because of conflicting results regarding training adaptations (McBride et al., 2002; Crewther et al., 2005) and no differences in power production (Jones et al., 2001) and strength gains (Harris et al., 2000; McBride et al., 2002) between strength and power training regimens. Thus, there seems to be no agreement on the effects of strength and power training on maximal strength improve- ment (Crewther et al., 2005), suggesting similar increments in performance. If these training regimens produce similar perfor- mance improvements, genes that modulate muscle plasticity should also present similar behavior. Pos- sible target genes could be those that control both hypertrophy and phenotype shift. For instance, the Akt-mTOR (mammalian target of rapamycin) path- way has been related to muscle hypertrophy follow- ing a mechanical overload in both animal and human studies (Bolster et al., 2003; Kubica et al., 2005; Baar et al., 2006; Bodine, 2006; Dreyer et al., 2006; Eliasson et al., 2006). This protein kinase phosphor- ylates at least two regulators of protein synthesis: S6K1, a positive modulator, and 4EBP1, a negative modulator (inhibitor of translation initiation). Once activated by mTOR, S6K1phosphorylates the ribo- somal S6 protein, which is a component of the 40S ribosomal subunit. Activation of S6 leads to in- creased ribosomal biogenesis and protein translation. Phosphorylation of 4E-BP1, via mTOR, leads to the dissociation of eIF4E, which is then able to bind to the cap-region of the mRNA, inducing an enhance- ment of protein translation (Lee et al., 2007). In addition, calcineurin is a protein phosphatase that is activated by sustained elevations in cellular calcium influx (Klee et al., 1998; Hogan et al., 2003). Once activated, calcineurin directly dephosphory- lates transcription factors of nuclear factor of acti- vated T cells within the cytoplasm, promoting their Scand J Med Sci Sports 2009 & 2009 John Wiley & Sons A/S Printed in Singapore . All rights reserved DOI: 10.1111/j.1600-0838.2009.00905.x 1
Transcript of Expression of genes related to muscle plasticity after strength and power training regimens
Expression of genes related to muscle plasticity after strength andpower training regimens
L. Lamas1, M. S. Aoki2, C. Ugrinowitsch1, G. E. R. Campos3, M. Regazzini1, A. S. Moriscot4, V. Tricoli1
1School of Physical Education and Sport, University of Sao Paulo, Sao Paulo, SP, Brazil, 2School of Arts, Sciences and Humanities,University of Sao Paulo, Sao Paulo, SP, Brazil, 3Institute of Biology, State University of Campinas, Campinas, SP, Brazil, 4Instituteof Biomedical Sciences, University of Sao Paulo, Sao Paulo, SP, BrazilCorresponding author: Valmor Tricoli, PhD, School of Physical Education and Sport, University of Sao Paulo, Av. Prof.Mello Moraes, 65. Butanta, 05508-030 Sao Paulo, SP, Brazil. Tel: 155 11 3091 2139, Fax: 55 11 3813 5091, E-mail:vtricoli‘@usp.br
Accepted for publication 9 December 2008
The purpose of our study was to compare the effects of8-week progressive strength and power training regimenson strength gains and muscle plasticity [muscle fiberhypertrophy and phenotype shift, mammalian targetof rapamycin (mTOR), regulatory-associated protein ofmTOR (RAPTOR), rapamycin-insensitive companion ofm-TOR (RICTOR), calcineurin and calcipressin geneexpression]. Twenty-nine physically active subjects weredivided into three groups: strength training (ST), powertraining (PT) and control (C). Squat 1 RM and musclebiopsies were obtained before and after the trainingperiod. Strength increased similarly for both ST and PTgroups (Po0.001). Fiber types I, IIa and IIb presentedhypertrophy main time effect (Po0.05). Only type IIb
percentage decreased from pre- to post-test (main timeeffect, Po0.05). mTOR and RICTOR mRNA expressionincreased similarly from pre- to post-test (Po0.01).RAPTOR increased after training for both groups(Po0.0001), but to a greater extent in the ST(Po0.001) than in the PT group. 4EBP-1 decreased aftertraining when the ST and PT groups were pooled(Po0.05). Calcineurin levels did not change after train-ing, while calcipressin increased similarly from pre- topost-test (Po0.01). In conclusion, our data indicate thatthese training regimens produce similar performance im-provements; however, there was a trend toward greaterhypertrophy-related gene expression and muscle fiberhypertrophy in the ST group.
Resistance training is the most widely used methodto increase muscle strength and power. High-loadlow-velocity resistance exercises (strength training)are recommended for maximum strength improve-ment while low-load high-velocity resistance exer-cises (power training) are proposed for powerproduction augmentation (Kraemer & Ratamess,2004). However, a few authors have questionedsuch recommendations because of conflicting resultsregarding training adaptations (McBride et al., 2002;Crewther et al., 2005) and no differences in powerproduction (Jones et al., 2001) and strength gains(Harris et al., 2000; McBride et al., 2002) betweenstrength and power training regimens. Thus, thereseems to be no agreement on the effects of strengthand power training on maximal strength improve-ment (Crewther et al., 2005), suggesting similarincrements in performance.If these training regimens produce similar perfor-
mance improvements, genes that modulate muscleplasticity should also present similar behavior. Pos-sible target genes could be those that control bothhypertrophy and phenotype shift. For instance, the
Akt-mTOR (mammalian target of rapamycin) path-way has been related to muscle hypertrophy follow-ing a mechanical overload in both animal and humanstudies (Bolster et al., 2003; Kubica et al., 2005; Baaret al., 2006; Bodine, 2006; Dreyer et al., 2006;Eliasson et al., 2006). This protein kinase phosphor-ylates at least two regulators of protein synthesis:S6K1, a positive modulator, and 4EBP1, a negativemodulator (inhibitor of translation initiation). Onceactivated by mTOR, S6K1phosphorylates the ribo-somal S6 protein, which is a component of the 40Sribosomal subunit. Activation of S6 leads to in-creased ribosomal biogenesis and protein translation.Phosphorylation of 4E-BP1, via mTOR, leads to thedissociation of eIF4E, which is then able to bind tothe cap-region of the mRNA, inducing an enhance-ment of protein translation (Lee et al., 2007).In addition, calcineurin is a protein phosphatase
that is activated by sustained elevations in cellularcalcium influx (Klee et al., 1998; Hogan et al., 2003).Once activated, calcineurin directly dephosphory-lates transcription factors of nuclear factor of acti-vated T cells within the cytoplasm, promoting their
Scand J Med Sci Sports 2009& 2009 John Wiley & Sons A/SPrinted in Singapore . All rights reserved
DOI: 10.1111/j.1600-0838.2009.00905.x
1
Saldanha
Highlight

translocation into the nucleus (Hogan et al., 2003). Inthe skeletal muscle, calcineurin promotes cellulardifferentiation and controls fiber-type shift fromfast to slow phenotypes (Chin et al., 1998; Nayaet al., 2000; Parsons et al., 2004).We believe that the genes that control muscle fiber
hypertrophy and phenotype shift seem to be goodcandidates to elucidate the mechanisms responsiblefor the similar performance improvements observedbetween strength and power training regimens. Inaddition, to confirm the hypothesis of similar train-ing adaptations, muscle hypertrophy and fiber phe-notype shift should change accordingly. Thus, the aimof this work was to compare the effect of a strengthand a power training protocol on strength gains,muscle fiber hypertrophy and phenotype shift, aswell as determine the expression of genes related tothe pathways that modulate skeletal muscle plasticity.
MethodsExperimental design
This study was a 3 � 2 repeated measures design, having threegroups [strength training (ST), power training (PT) andcontrol (C)] and time (pre- and post-test) as factors, in whichsubjects performed 1RM squat exercise in the pre- and post-tests, and a muscle biopsy. Figure 1 gives a pictorial view ofthe study design.
Subjects
Twenty-nine physically active male subjects who had at least 2years of previous experience in strength training were re-cruited. However, they were required not to participate inany strength training program for 6 months before the start ofthis study. These subjects were assigned to a ST group (n5 11)(178.7 � 4.3 cm, 75.2 � 7.3 kg and 22.5 � 3.8 years), a PTgroup (n5 11) (177.0 � 5.9 cm, 76.0 � 8.9 kg and 24.2 � 4.1years) or a C group (n5 7) (178.9 � 11.0 cm, 74.1 � 9.6 kgand 24.1 � 2.7 years). Subjects were classified into quartilesaccording to their relative strength in the squat exercise(1RM/body weight) and were randomly assigned to groupsto allow for similar initial conditions between groups. Thestudy was approved by the Institution’s Ethics Committee andall subjects were informed of the inherent risks and benefitsbefore signing an informed consent form.
Strength measurements
Squat 1 RM
Firstly, subjects performed two familiarization sessions tobecome familiar with the strength test. The 1RM squat testwas performed according to standard procedures (Brown &
Weir, 2001). In brief, subjects ran for 5 minutes in a treadmillat 9 km/h, followed by lower limb stretching exercises and twosquat warm-up sets. In the first set, individuals performed fiverepetitions with 50% of the estimated 1RM and, in the secondset, they performed three repetitions with 70% of the esti-mated 1RM, with 3-minute intervals between them. After thesecond warm-up set, subjects rested for 3 minutes. Then, theyhad up to five trials to achieve the 1RM load (e.g. maximumweight that could be lifted once with the proper technique),with a 3-minute interval between trials.
Training regimens
The strength group trained with intensities between 10 and4RM, while the PT group trained with intensities between30% and 60% of 1RM. Both groups were instructed toperform each repetition at the maximum speed. The ST andPT groups trained with a similar number of sets per week.However, the training intensity and the external movementvelocity were different between them. Training intensitiesprogressed through the 8-week period following a periodizedmodel. Table 1 describes the training regimens for bothgroups.
Figure 2 shows the average training intensities of squat1RM during the 8-week training period. In order to assurethat training intensities were different between groups, wecompared them using one-sample t-tests having weekly aver-age power training intensities as reference values. Trainingintensities were different across all training weeks betweengroups (Po0.0001).
Muscle biopsy
Unilateral muscle samples pre- and post-test were taken fromthe midportion of the vastus lateralis of the subjects’ right legusing the percutaneous biopsy technique with suction. Allbiopsies were performed in the morning and the last meal wasa standard breakfast served 2 h before the procedure. Imme-diately after this procedure, the muscle sample was removedfrom the needle and divided into two. The first half wasoriented in the tragacanth gum, immediately frozen in iso-pentane, cooled in liquid nitrogen, and stored to � 80 1C. Thesecond half was frozen in liquid nitrogen. The pre-test biopsywas performed 48 h after the pre-test and approximately 4days before the start of the training period. The post-testbiopsy was performed through an incision adjacent to the pre-test site 48 h after the last training session.
Muscle fiber type and area
To determine the muscle fiber composition, myofibrillaradenosine triphosphatase (mATPase) histochemistry was per-formed using preincubation pH values of 4.3, 4.6 and 10.4(Guth & Samaha, 1969; Brooke & Kaiser, 1970). The frozenmuscle samples were thawed to � 20 1C and serially sectioned.Pre- and post-test transversal sections were assayed simulta-neously for mATPase activity.
Fig. 1. Time line of the study de-sign.
Lamas et al.
2

Section images with different mATPase preparations werecaptured on a computer with the imaging software MetaMorphversion 6.1 (Universal Imaging Corp., West Chester, Pennyslvania, USA). Muscle fiber total number and percentage weredetermined based on staining intensity and with this protocol,six fiber types were distinguished: I, Ic, IIc, IIa, IIab and IIb(Campos et al., 2002). Because the percentages of types Ic, IIcand IIab were very small, we decided to group the muscle fibersfor statistical purposes as follows: type I (I and Ic), type IIa (IIc,IIa and 1/2 IIab) and type IIb (IIb and 1/2 IIab).
Cross-sectional areas of muscle fiber types I, IIa and IIbwere determined using computerized planimetry (Image PROPlus, Media Cyberneticsr, Bethesda, Maryland, USA). Arange of 100–261 and 109–306 fibers were measured persubject for pre- and post-test, respectively.
Gene expression analysis
Reverse transcription
Total cellular RNA was isolated from pre- and post-trainingmuscle samples using the Trizol reagent (Invitrogenr, Carlsbad,California, USA). Total RNA (1mg) was typically used in a re-
action containing oligo dT (500mg/mL), dNTP (10mM each),5 � first-strand buffer, 0.1M dithiothreitol and 200U reversetranscriptase (SuperScript II, Invitrogenr, USA). Reverse tran-scription was performed at 70 1C for 10min, followed by 42 1Cfor 60min and 95 1C for 10min.
Primer design
Primer sets were designed using Primer Express version 2.0software (Applied Biosystemsr, Foster City, California, USA)using sequences accessed through GenBank, and were checkedfor specificity using the Nucleotide-Nucleotide Blast search(Table 2).
Real-time polymerase chain reaction (PCR)
All samples were analyzed in duplicate and the reactionfluorescence was quantified with an ABI Prism 5700 sequencedetector (Applied Biosystemsr) based on the current metho-dology (Bustin, 2002). The amplification analysis was per-formed with an Applied Biosystems sequence detectionsoftware. Results were expressed using the comparative cyclethreshold (Ct) method described in the manufacturer’s UserBulletin no. 2 (Applied Biosystemsr).
The Ct represents the PCR cycle at which an increase ingene reporter fluorescence above a baseline signal can bedetected. For each gene of interest, DCt values were calculatedin all samples as follows: Ct (gene of interest)–Ct (internalcontrol gene). The RPLP0 (ribosomal protein large P0) genewas used as an internal control and, as expected, no changewas observed (Westerbacka et al., 2008).
The calculation of the relative changes in the expressionlevels of one specific gene was performed by subtracting DCt ofthe control group (used as the calibrator) from the corre-sponding DCts from the two experimental groups. The valuesand ranges given were determined as follows: 2�DDCt withDDCt � SEM (SEM is the standard error of the mean DDCt
value; User Bulletin no. 2, Applied Biosystemsr). The finalvalues for samples were reported as a fold difference relative tothe expression of the control (calculated as 2�DDCt ), with thecontrol arbitrarily set to 1.
Fig. 2. Training intensities for the strength training (ST) andthe power training (PT) groups expressed as percentage ofthe squat 1RM (mean � SD).
Table 1. Training regimens for strength training and power training groups*
Monday Wednesday Friday
Training protocol – strength training groupWeek 1 410 410 410
Week 2 210; 38 38; 26 210; 38
Week 3 38; 36 38; 36 38; 36
Week 4 210; 28; 26 210; 28; 26 210; 28; 26
Week 5 18; 36; 34 36; 44 46; 34
Week 6 36; 34 46; 44 46; 44
Week 7 36; 34 36; 34 36; 34
Week 8 26; 24 26; 24 26; 24
Training protocol – power training groupWeek 1 48 (30%) 48 (30%) 48 (30%)Week 2 28 (30%); 38 (40%) 38 (40%); 26 (50%) 28 (30%); 38 (40%)Week 3 38 (40%); 36 (50%) 38 (40%); 36 (50%) 38 (40%); 36 (50%)Week 4 28(30%); 28(40%); 26 (50%) 28(30%); 28(40%); 26 (50%) 28 (30%); 28(40%); 26 (50%)Week 5 28(30%); 38(40%); 26 (50%) 38 (40%); 46 (60%) 38(30%); 26 (50%); 26 (60%)Week 6 38 (30%); 36 (60%) 48 (40%); 46 (50%) 48 (30%); 46 (60%)Week 7 38 (40%); 36 (60%) 28 (40%); 46 (60%) 28 (40%); 46 (60%)Week 8 28 (40%); 26 (50%) 28 (40%); 26 (50%) 28 (40%); 26 (50%)
*210 –number 2 represents the number of sets, while number 10 describes the number of repetitions. Percentage within parentheses indicates the training
load (1 RM%).
Molecular adaptation to resistance training
3

Statistical analysis
A mixed model was performed for each dependent variable,having group and time as fixed factors, and subjects as arandom factor (Ugrinowitsch et al., 2004). Whenever a sig-nificant F-value was obtained, a post-hoc test with a Tukey’sadjustment was performed for multiple comparison purposes.The significance level was set at Po0.05.
Results
Both training groups (i.e. strength and power train-ing) increased 1RM squat from pre- to post-test(effects sizes of 1.8 and 1.3, respectively, Po0.001);however, there was no difference between ST and PT(P40.05). In addition, the ST and PT groups pre-sented greater 1RM values than the control group inthe post-test (Po0.05) (Table 3).With regard to fiber type shift, only IIb fibers
showed a significant time main effect (Po0.05),decreasing its percentage in the post-test measure-ment (Table 4). However, there was a trend toward a
decreased percentage of type IIb fibers in the ST andPT after training (interaction effect, P5 0.087).It should be noted, however, that in the pre-biopsy
samples, the control group had approximately 9%type IIb fibers while the training group had 20% IIbfibers. The number of fibers analyzed was the samefor cross-sectional area measurement and fiber typedetermination (Table 4).Fiber type cross-sectional area presented a signifi-
cant main time effect only. Thus, there was a sig-nificant muscle fiber hypertrophy effect whencomparing the average of ST, PT and C groups’cross-sectional area in the pre- and in the post-test,for type I (Po0.05), type IIa (Po0.05) and type IIb(Po0.0001) fibers (Table 5). Even though there wasno significant interaction effect, because of the highvariability inherent to cross-sectional fiber area mea-surements, there was a tendency toward greatermuscle fiber hypertrophy for the ST on each fibertype percentagewise (15%, 18% and 41% for the STand � 5%, 15% and 19% for the PT, to type I, IIaand IIb, respectively). In fact, the main effects for
Table 3. Maximum strength (squat 1 RM, kg) before and after training for strength, power, and control groups (mean � SEM)
Strength Training Power Training Control
Pre Post Pre Post Pre Post
1 RM (kg) 145.3 � 4.8 178.5 � 5.2*w 147.2 � 4.5 171.6 � 5.3*w 141.4 � 5.5 145.6 � 6.3
*Post-test values greater than pre-test values (Po0.001).wPost-test values greater than control values at the same time point (Po0.05).
Table 2. Sequence of primers used in real-time polymerase chain reaction
Genes Forward Reverse
RPLP0 CGACCTGGAAGTCCAACTAC ATCTGCTGCATCTGCTTGmTOR ACGCAAGTTGAGCTGCTCATC AAGGGCACCAGCCAATATAGCRAPTOR AAGGATGGCACTCAGCGAAT CATTGACGCTCACACTCACGATRICTOR TCTATCCCAAGCACTCTAAGTTTGAA ATGAACATACTCGATGGCACAGA4E-BP1 CAGAGCCACCTGCGCAATA TGTCCATCTCAAACTGTGACTCTTCCalcineurin AGCATGTTTAGCAAACCTTGTGAA CATATTTTGTGGCACATGACAGAACalcipressin CAGACCTTACACATAGGAAGCTCACA TGGAGATGGCATATAAGAGATCATAGTT
Table 4. Fiber type percentage before and after training for strength, power, and control groups (mean � SEM). The values in parentheses refer to the
number of fibers analyzed
Strength Power Control
Pre Post Pre Post Pre Post
Type I 33.9 � 4.6 38.6 � 4.5 41.3 � 3.8 35.1 � 4.3 42.6 � 4.1 48.5 � 2.1(76 � 51) (70 � 46) (54 � 30) (54 � 45) (75 � 23) (88 � 30)
Type IIa 45.4 � 4.5 53.2 � 3.8 38.7 � 4.4 51.4 � 4.1 48.5 � 2.5 42.7 � 2.4(97 � 49) (94 � 46) (56 � 37) (73 � 33) (89 � 37) (77 � 23)
Type IIbw 20.7 � 2.1 8.2 � 2.0 20.0 � 3.2 13.5 � 4.3 8.9 � 2.9 8.8 � 2.8(41 � 19) (14 � 3) (22 � 9) (21 � 9) (19 � 10) (20 � 15)
wPost-test values smaller than pre-test values (time main effect, Po0.05).
Lamas et al.
4

muscle fiber hypertrophy for all fiber types wereproduced mainly by the ST group effect.Gene expression analysis revealed that mTOR
(effect sizes of 2.8 and 2.3 for the ST and PT,respectively) and RICTOR (effect sizes 2.2 and 1.4)mRNA levels increased for both experimental groupsfrom pre- to post-test (Po0.01). There was nodifference in mTOR and RICTOR between the STand the PT in the post-test (P40.05) but they hadhigher expression of these genes than the controlgroup in the post-test [Po0.001, Fig. 3(b) and (c)].Overall, RAPTOR gene expression showed a similarbehavior but the ST presented higher post-test valuesthan the PT [Po0.001, Fig. 3(a)]. However, effectsizes were similar between groups (i.e. 3.0 and 3.1).There was a main time effect for 4EBP-1. In order todetermine whether this main effect was due tochanges in the training groups, the ST and PT groupswere pooled and compared with the control group.The pooled data revealed a decreased 4EBP-1 aftertraining [Po0.05, Fig. 3(d), effect size of � 1.24].
Calcineurin gene expression did not change inresponse to both training regimens. Calcipressinexpression was found to increase for both groupsfrom pre- to post-test (Po0.01) [Fig. 4(a)]. Calci-pressin mRNA level was also increased after bothtraining regimens compared with the control groupin the post-test (Po0.001) [Fig. 4(b)].
Discussion
In this study, we compared the effect of different tworesistance training regimens on maximum strengthgains, muscle fiber hypertrophy and phenotype shiftand determined the expression of the genes involvedin skeletal muscle plasticity. Our main findings were:(1) strength increased similarly between trainingprotocols; (2) fiber cross-sectional area increasedfor both training regimens; however, there was atrend toward greater increases in the ST group; (3)mTOR, RAPTOR and RICTOR gene expression
Table 5. Fiber types cross sectional area (mm2) before and after training for strength, power, and control groups (mean � SEM)
Strength training Power training Control
Pre Post Pre Post Pre Post
Type Iw 5186.4 � 444.0 5968.1 � 516.4 5358.4 � 454.9 5063.4 � 456.4 5567.7 � 521.5 5330.6 � 572.0Type Iia* 5753.2 � 379.4 6820.1 � 373.3 5605.2 � 402.1 6463.0 � 394.7 5911.6 � 521.2 6159.8 � 462.1Type IIb* 4647.9 � 343.8 6569.6 � 364.5 5509.2 � 453.1 6579.6 � 418.8 4946.0 � 465.3 5388.8 � 424.7
wPost-test values greater than pre-test values (time main effect, Po0.05).*Post-test values greater than pre-test values (time main effect, Po0.0001).
Fig. 3. mTOR, RICTOR, RAP-TOR and 4EBP-1 (AU) gene ex-pression (ratio between the mRNAexpression of the gene of interestand the internal standard) for thestrength (ST) and power training(PT) and control (C) groups preand post a 8-week period (meanSEM). aPost-test values greaterthan pre-test values (Po0.0001).bPost-test for the strength and thePT groups greater than the controlgroup (Po0.0001). cPost-test va-lues for the strength group greaterthan the post-test values for thepower group (Po0.001). dPost-test values for the ST and PTpooled greater than the pre-testvalues (Po0.05).
Molecular adaptation to resistance training
5

increased for the ST and PT groups, with a tendencyfor greater values for the ST; (4) 4E-BP1 expressiondecreased after training; (5) percentage type IIb fibersdecreased after the training period for both groups;and (6) calcineurin mRNA did not change, whilecalcipressin mRNA increased for both groups.With respect to strength gains, our findings are in
accordance with previous studies that reported asignificant increase in the maximum strength inboth ST (Harris et al., 2000; Jones et al., 2001) andPT groups (Hakkinen et al., 1985; Kyrolainen et al.,2005). Accordingly, Jones et al. (2001) also observedstrength improvement in the high-intensity strengthgroup compared with the high PT group (16% and11%, respectively), and Moss et al. (1997) describedsimilar maximum strength improvements (ST:15.2 � 4.5% and TP: 10.1 � 5.9%). Likewise, usinga jump training paradigm, Malisoux et al. (2006) andKyrolainen et al. (2005) reported a 12% increase inknee extensors 1RM and an 11% increase in plantarflexors MVIC after 8 and 10 weeks of jumpingtraining, respectively. Interestingly, jump trainingwas as effective as strength and power training inincreasing maximum strength (Jones et al., 2001;Kyrolainen et al., 2005; Malisoux et al., 2006). Ourtraining protocols produced a 22% and 17% increasein maximum strength for the ST and PT groups,respectively. Our training loads were similar to theones used by Jones et al. (2001), who also observedstrength increments after both training regimens.It is well known that strength training produces
muscle fiber hypertrophy, independent of fiber type(McCall et al., 1996; Widrick et al., 2002; Laurentinoet al., 2008). To this effect, Goreham et al. (1999)reported an increase in the mean fiber area afterstrength training. However, only a few studies haveinvestigated muscle hypertrophy after power train-ing. For example, Kyrolainen et al. (2005) observedno muscle hypertrophy after a jumping training.Furthermore, Young and Bilby (1993) did not ob-serve any effect of high-velocity concentric trainingon muscle hypertrophy in subjects performing thesquat exercise with loads of 8–12RM. On the otherhand, Malisoux et al. (2006) reported an average of
25% hypertrophy across the fiber types using thesame training paradigm. In another work, Moss et al.(1997) compared three groups: maximum strength,maximum power and power with a light load andshowed that only the maximum power group hadsignificant hypertrophy (2.8%). In our data, eventhough we only found a time main effect, a tendencytoward a similar hypertrophy increase was observed.Thus, fiber types I, IIa and IIb showed a 15%, 18%and 41% increase in the ST group, respectively, whilethe PT group only showed a � 5%, 15% and 19%hypertrophy increase in these fibers. These resultsallow us to conclude that both training methods wereeffective in producing muscle fiber hypertrophy, witha trend toward greater fiber hypertrophy for the STgroup. Thus, the similar improvements in strengthbetween the ST and the PT group might have beendue to greater neural adaptations produced by thepower training protocol (Kyrolainen et al., 2005).In the skeletal muscle, fiber hypertrophy is pro-
duced by increasing its protein synthesis rate. Inhuman muscle, a bout of resistance exercise increasesthe rate of protein synthesis by � 50% after 4 h, anddoubles after 24 h ( � 115%) (Chesley et al., 1992).Also, it has been demonstrated that the increase inprotein synthesis remains elevated up to 48 h afterresistance exercise (Phillips et al., 1997). In thisscenario, the Akt-mTOR seems to be one of themain pathways involved in the enhancement ofprotein synthesis following a bout of resistance ex-ercise for both animal and human models (Bolsteret al., 2003; Kubica et al., 2005; Baar et al., 2006;Bodine, 2006). In fact, Bolster et al. (2003) reportedthat mTOR signaling is transiently upregulated afteran acute resistance exercise bout in rat skeletalmuscle. Accordingly, Kubica et al. (2005) foundthat exercise stimulated protein synthesis in ratskeletal muscle and, as expected, this response wasprevented by treatment with rapamycin, an inhibitorof the mTOR pathway. In humans, additional stu-dies also corroborate the hypothesis that mTORactivation is involved in the increase of proteinsynthesis after a resistance exercise bout (Dreyeret al., 2006; Eliasson et al., 2006; Fujita et al., 2007).
Fig. 4. Calcineurin and Calcipres-sin (AU) gene expression (ratiobetween the mRNA expression ofthe gene of interest and the inter-nal standard) for the strength andpower training and control groupspre and post a 8-week period(mean � SEM). aPost-test valuesgreater than pre-test values (Po0.001). bPost-test for the strengthand the PT groups greater than thecontrol group (Po0.0001).
Lamas et al.
6

Despite the great concern about acute changesfollowing a resistance exercise bout, there is no infor-mation available regarding the long-term adaptation ofthe mTOR pathway in response to different trainingregimens. Overall, our results demonstrated that bothtraining regimens induce a similar pattern of changesin the mRNA levels of the components of mTORpathway. We observed a similar increase in mTORexpression after both resistance training regimens.Therefore, besides acute activation after an exercisebout, it seems that resistance training modulatesmTOR gene expression during long-term adaptation.mTOR activity relies on the assembly of two
protein complexes identified as TOR complex 1(TORC1) and TOR complex 2 (TORC2). The properconfiguration of the TORC1 complex requires ascaffold protein (RAPTOR – regulatory-associatedprotein of mTOR) that binds mTOR to its substrates(e.g. 4E-BP-1 and S6K1). TORC1 is essential forprotein synthesis and this complex has been impli-cated in tissue growth (Wullschleger et al., 2006). Onthe other hand, little is known about the in vivo roleof TORC2, which comprises at least two essentialmembers: the ‘‘rapamycin-insensitive companion ofmTOR,’’ RICTOR, as well as SAPK-interactingprotein 1, Sin1. Previous in vitro investigations haveimplicated TORC2 in regulating the actin cytoskele-ton (Loewith et al., 2002; Jacinto et al., 2004;Sarbassov et al., 2005).Our results demonstrated an increase in RAPTOR
gene expression after both training regimens; how-ever, ST produced greater increments than PT. Ourstudy is the first to present the RAPTOR mRNAprofile after resistance training protocols. It waspreviously reported that increases in passive tensioninduced by chronic muscle stretching augment RAP-TOR gene expression (Aoki et al., 2006). This increasewas associated with protein accretion and longitudinalgrowth (Aoki et al., 2006). Therefore, it seems thatdifferent loading demands may trigger RAPTOR geneexpression. Thus, it is reasonable to speculate that,besides these acute responses (e.g. increase in mTORphosphorylation), the increase in mTOR and RAP-TOR gene expression after the training period may berelated to an enhancement of this pathway activity,resulting in greater protein synthesis.There is no previous report regarding RICTOR
gene expression in the skeletal muscle after a me-chanical overload. Recent studies have indicatedthat, besides cytoskeleton organization, TORC2also plays a critical role in AKT phosphorylationand may be involved in tissue growth (Sarbassov etal., 2005; Yang et al., 2006). Our results demon-strated that RICTOR gene expression is increased byboth training regimens (strength and power), sug-gesting a similar modulatory effect exerted by thetraining stimulus.
Regarding 4EBP-1 gene expression, we observed amild decrease after 8 weeks of resistance training(both groups pooled together). It is reasonable toexpect that a reduction of 4EBP-1 availability mightenhance protein synthesis, because this binding pro-tein interferes with the recognition of the cap struc-ture and formation of a ribosome-binding site/translation start site selection. A previous studyassessed mRNA 4EBP-1 content in human muscleafter an endurance exercise bout and no changeswere detected (Murphy et al., 2006). Accordingly, inanother study, no changes in the mRNA levels for4EBP-1 were detected after prolonged stretching(Aoki et al., 2006). It seems that mechanical overloadis not a strong modulator of 4EBP-1 gene expression.Taken together, gene expression data regarding
mTOR components reinforce the role of this path-way, not only during an acute exercise bout but alsoduring long-term adaptation.It is well known that resistance training can modify
muscle fiber type composition. The literature usuallydescribes an exercise-induced conversion within thefast fiber population from type IIb to IIa, with asmall increase or no changes in type I fiber percen-tage (Staron et al., 1994; Campos et al., 2002; Harberet al., 2004). Our study showed that only the percen-tage of type IIb fibers significantly decreased frompre- to post-test in the ST ( � 12.5%) and the PT( � 6.5%) groups, while the percentage in type I andIIa fibers remained unchanged. Similar changes infiber type distribution have been reported in thevastus lateralis by other investigators after 8 weeksof resistance training (Staron et al., 1994; Campos etal., 2002). Campos et al. (2002) observed a 12%average decrease in type IIb fibers after a trainingintensity of either 3–5 or 9–11RM. Staron et al.(1994) also found an approximately 12% decrease intype IIb fibers with lower-limb resistance trainingintensity varying from 6–8 to 8–12RM. On the otherhand, Harber et al. (2004) reported no significantchanges in muscle fiber type composition after 10weeks of circuit strength training at an intensityranging from 40% to 60% 1RM. Similarly, Kyro-lainen et al. (2005) did not find any modifications inthe percent mATPase fiber types after 15 weeks ofpower training. It should be emphasized that, similarto our results, these studies observed a tendencytoward an increase in the type IIa muscle fiberpercentage. These fiber type percentage differenceshave been reported previously for human musclesamples as a result of physical training and appar-ently, any training stimulus with sufficient intensityand duration has the ability to trigger the conversionof type IIb to type IIa fibers.Previous studies have demonstrated that the calci-
neurin pathway plays a major role in this sort ofadaptation (Grondard et al., 2008). For instance,
Molecular adaptation to resistance training
7

calcineurin has been shown to stimulate the tran-scription of slow fiber-specific gene promoters (Nayaet al., 2000). Also, the overexpression of calcineurinin the skeletal muscle increases the number of oxida-tive muscle fibers (Naya et al., 2000), whereas knock-out mice for calcineurin have a reduced oxidativefiber content (Parsons et al., 2003). In addition,administration of calcineurin inhibitors decreasesthe expression of the oxidative fiber-type program(Aoki et al., 2006).Our results demonstrated a decrease (main time
effect) in type IIb fibers after both training regimens.Despite the fiber type shift observed, there was nosignificant change in calcineurin gene expressionafter training. Grondard et al. (2008) reported asimilar adaptation pattern related to the fiber typeshift in the rat plantaris after 12 weeks of training.Interestingly, a decrease in plantaris calcineurin con-tent and activity was observed in their study (Gron-dard et al., 2008), and they also demonstrated thatcalcineurin activity increases after a single bout ofexercise. This early acute response may explain thefiber shift toward a slower phenotype (IIb to IIa)during the initial training phase. Therefore, we spec-ulate that calcineurin activity/content may have adifferent modulation during the training time course(i.e. early increase, followed by a decrease).Another explanation for the calcineurin activity
pattern induced by training might be related tomuscle endogenous inhibitors, such as calcipressin(MCIP-1). However, Grondard et al. (2008) showedthat the attenuation of calcineurin activity observedin the plantaris muscle after swimming training wasnot associated with a change in calcipressin mRNAlevels. This response indicates that other mechanismsmay also participate in calcineurin inhibition. In ourstudy, we observed a main time effect related to adecrease in IIb fiber type, despite the slight increasein calcipressin (MCIP-1) mRNA levels.Alternatively, during the initial period of physical
training, the calcineurin pathway could be acutelyactivated to induce fiber conversion (IIbIIa) and thenbe repressed subsequently (Grondard et al., 2008). Infact, our results showed that calcipressin mRNAlevels increased at the end of 8 weeks of training,which may be involved in the attenuation of calci-neurin activity in response to training. Ultimately,the precise role of calcipressin in muscle fiber phe-notype shift remains to be elucidated.
We are aware that changes in mRNA expressiondo not necessarily correlate with variations in proteinexpression. The protein content assessment wouldadd valuable information to the present study andthe lack of these data represents a limitation. Un-fortunately, the amount of muscle sample collecteddid not allow protein content analysis.It is well accepted that the specificity of the
training load is crucial to achieve distinct trainingadaptations. Contrary to that, our data indicatedthat training protocols increased maximum strengthsimilarly. However, we found that muscle fiberhypertrophy, mTOR, RAPTOR and RICTORgene expression presented a trend toward a greaterincrease after ST. As a conclusion, even thoughstrength and power training were designed toachieve distinct specific goals, 8 weeks of ST andPT led to similar performance improvements. Inaddition, it is possible that the tendency towardgreater gene expression and muscle fiber hypertro-phy may induce higher strength gains after longer STtraining periods.
Perspectives
The present study showed that strength and powertraining regimens produced similar performance im-provements. We also found a trend toward greaterhypertrophy-related gene expression and muscle fiberhypertrophy in the strength training group.Our findings suggest a change in the specificity
paradigm because both ST and PT protocols in-creased maximum strength similarly. In order toverify this phenomenon further, it would be impor-tant that future studies provide a longer trainingperiod focusing not only on strength and powertraining-induced changes in performance but alsoon variations in skeletal muscle protein expression.
Key words: mTOR, RAPTOR, RICTOR, 4E-BP1,calcineurin, calcipressin.
Acknowledgements
This study was partially funded by FAPESP (grants 06/52204-5and 06/00302-3) and CNPq (477053/2006-8). We would like tothank Antonio Garcia Soares for the outstanding technicalsupport.
References
Aoki MS, Miyabara EH, Soares AG,Saito ET, Moriscot AS. mTORpathway inhibition attenuatesskeletal muscle growth induced bystretching. Cell Tissue Res 2006: 324:149–156.
Baar K, Nader G, Bodine S. Resistanceexercise, muscle loading/unloading andthe control of muscle mass. EssaysBiochem 2006: 42: 61–74.
Bodine SC. mTOR signaling and themolecular adaptation to resistance
exercise. Med Sci Sports Exerc 2006:38: 1950–1957.
Bolster DR, Kubica N, Crozier SJ,Williamson DL, Farrell PA, KimballSR, Jefferson LS. Immediate responseof mammalian target of rapamycin
Lamas et al.
8

(mTOR)-mediated signalling followingacute resistance exercise in rat skeletalmuscle. J Physiol 2003: 553: 213–220.
Brooke MH, Kaiser KK. Three ‘‘myosinadenosine triphosphatase’’ systems: thenature of their pH lability andsulfhydryl dependence. J HistochemCytochem 1970: 18: 670–672.
Brown LE, Weir JP. ASEP proceduresrecommendation I: accurateassessment of muscular strength andpower. J Exerc Physiologyonline 2001:4: 1–21.
Bustin SA. Quantification of mRNAusing real-time reverse transcriptionPCR (RT-PCR): trends and problems.J Mol Endocrinol 2002: 29: 23–39.
Campos GE, Luecke TJ, Wendeln HK,Toma K, Hagerman FC, Murray TF,Ragg KE, Ratamess NA, Kraemer WJ,Staron RS. Muscular adaptations inresponse to three different resistance-training regimens: specificity ofrepetition maximum training zones.Eur J Appl Physiol 2002: 88: 50–60.
Chesley A, MacDougall JD, TarnopolskyMA, Atkinson SA, Smith K. Changesin human muscle protein synthesis afterresistance exercise. J Appl Physiol1992: 73: 1383–1388.
Chin ER, Olson EN, Richardson JA,Yang Q, Humphries C, Shelton JM,Wu H, Zhu W, Bassel-Duby R,Williams RS. A calcineurin-dependenttranscriptional pathway controlsskeletal muscle fiber type. Genes Dev1998: 12: 2499–2509.
Crewther B, Cronin J, Keogh J. Possiblestimuli for strength and poweradaptation: acute mechanicalresponses. Sports Med 2005: 35:967–989.
Dreyer HC, Fujita S, Cadenas JG,Chinkes DL, Volpi E, Rasmussen BB.Resistance exercise increases AMPKactivity and reduces 4E-BP1phosphorylation and protein synthesisin human skeletal muscle. J Physiol2006: 576: 613–624.
Eliasson J, Elfegoun T, Nilsson J,Kohnke R, Ekblom B, Blomstrand E.Maximal lengthening contractionsincrease p70 S6 kinase phosphorylationin human skeletal muscle in the absenceof nutritional supply. Am J PhysiolEndocrinol Metab 2006: 291: E1197–E1205.
Fujita S, Abe T, Drummond MJ,Cadenas JG, Dreyer HC, Sato Y, VolpiE, Rasmussen BB. Blood flowrestriction during low-intensityresistance exercise increases S6K1phosphorylation and muscle proteinsynthesis. J Appl Physiol 2007: 103:903–910.
Goreham C, Green HJ, Ball-Burnett M,Ranney D. High-resistance trainingand muscle metabolism during
prolonged exercise. Am J Physiol 1999:276: E489–E496.
Grondard C, Biondi O, Pariset C, LopesP, Deforges S, Lecolle S, Gaspera BD,Gallien CL, Chanoine C, CharbonnierF. Exercise-induced modulation ofcalcineurin activity parallels the timecourse of myofibre transitions. J CellPhysiol 2008: 214: 126–135.
Guth L, Samaha FJ. Qualitativedifferences between actomyosinATPase of slow and fast mammalianmuscle. Exp Neurol 1969: 25: 138–152.
Hakkinen K, Alen M, Komi PV. Changesin isometric force- and relaxation-time,electromyographic and muscle fibrecharacteristics of human skeletalmuscle during strength training anddetraining. Acta Physiol Scand 1985:125: 573–585.
Harber MP, Fry AC, Rubin MR, SmithJC, Weiss LW. Skeletal muscle andhormonal adaptations to circuitweight training in untrained men.Scand J Med Sci Sports 2004: 14:176–185.
Harris GR, Stone MH, O’Bryant HS,Proulx CM, Johnson RL. Short-termperformance effects of high power, highforce, or combined weight-trainingmethods. J Strength Cond Res 2000:14: 14–20.
Hogan PG, Chen L, Nardone J, Rao A.Transcriptional regulation by calcium,calcineurin, and NFAT. Genes Dev2003: 17: 2205–2232.
Jacinto E, Loewith R, Schmidt A, Lin S,Ruegg MA, Hall A, Hall MN.Mammalian TOR complex 2 controlsthe actin cytoskeleton and is rapamycininsensitive. Nat Cell Biol 2004: 6: 1122–1128.
Jones K, Bishop P, Hunter G, Fleisig G.The effects of varying resistance-training loads on intermediate- andhigh-velocity-specific adaptations. JStrength Cond Res 2001: 15: 349–356.
Klee CB, Ren H, Wang X. Regulation ofthe calmodulin-stimulated proteinphosphatase, calcineurin. J Biol Chem1998: 273: 13367–13370.
Kraemer WJ, Ratamess NA.Fundamentals of resistance training:progression and exercise prescription.Med Sci Sports Exerc 2004: 36: 674–688.
Kubica N, Bolster DR, Farrell PA,Kimball SR, Jefferson LS. Resistanceexercise increases muscle proteinsynthesis and translation of eukaryoticinitiation factor 2Bepsilon mRNA in amammalian target of rapamycin-dependent manner. J Biol Chem 2005:280: 7570–7580.
Kyrolainen H, Avela J, McBride JM,Koskinen S, Andersen JL, Sipila S,Takala TE, Komi PV. Effects of powertraining on muscle structure and
neuromuscular performance. ScandJ Med Sci Sports 2005: 15: 58–64.
Laurentino G, Ugrinowitsch C, AiharaAY, Fernandes AR, Parcell AC,Ricard M, Tricoli V. Effects of strengthtraining and vascular occlusion. IntJ Sports Med 2008: 29(8): 664–667.
Lee CH, Inoki K, Guan KL. mTORpathway as a target in tissuehypertrophy. Annu Rev PharmacolToxicol 2007: 47: 443–467.
Loewith R, Jacinto E, Wullschleger S,Lorberg A, Crespo JL, Bonenfant D,Oppliger W, Jenoe P, Hall MN. TwoTOR complexes, only one of which israpamycin sensitive, have distinct rolesin cell growth control. Mol Cell 2002:10: 457–468.
Malisoux L, Francaux M, Nielens H,Theisen D. Stretch-shortening cycleexercises: an effective trainingparadigm to enhance power output ofhuman single muscle fibers. J ApplPhysiol 2006: 100: 771–779.
McBride JM, Triplett-McBride T, DavieA, Newton RU. The effect of heavy- vs.light-load jump squats on thedevelopment of strength, power, andspeed. J Strength Cond Res 2002: 16:75–82.
McCall GE, Byrnes WC, Dickinson A,Pattany PM, Fleck SJ. Muscle fiberhypertrophy, hyperplasia, and capillarydensity in college men after resistancetraining. J Appl Physiol 1996: 81:2004–2012.
Moss BM, Refsnes PE, Abildgaard A,Nicolaysen K, Jensen J. Effects ofmaximal effort strength training withdifferent loads on dynamic strength,cross-sectional area, load-power andload-velocity relationships. Eur J ApplPhysiol Occup Physiol 1997: 75:193–199.
Murphy KT, Petersen AC, Goodman C,Gong X, Leppik JA, Garnham AP,Cameron-Smith D, Snow RJ,McKenna MJ. Prolonged submaximalexercise induces isoform-specificNa1-K1-ATPase mRNA and proteinresponses in human skeletal muscle.Am J Physiol Regul Integr CompPhysiol 2006: 290: R414–R424.
Naya FJ, Mercer B, Shelton J,Richardson JA, Williams RS, OlsonEN. Stimulation of slow skeletalmuscle fiber gene expression bycalcineurin in vivo. J Biol Chem 2000:275: 4545–4548.
Parsons SA, Millay DP, Wilkins BJ,Bueno OF, Tsika GL, Neilson JR,Liberatore CM, Yutzey KE, CrabtreeGR, Tsika RW, Molkentin JD.Genetic loss of calcineurin blocksmechanical overload-induced skeletalmuscle fiber type switching but nothypertrophy. J Biol Chem 2004: 279:26192–26200.
Molecular adaptation to resistance training
9

Parsons SA, Wilkins BJ, Bueno OF,Molkentin JD. Altered skeletal musclephenotypes in calcineurin Aalpha andAbeta gene-targeted mice. Mol CellBiol 2003: 23: 4331–4343.
Phillips SM, Tipton KD, Aarsland A,Wolf SE, Wolfe RR. Mixed muscleprotein synthesis and breakdown afterresistance exercise in humans. Am JPhysiol 1997: 273: E99–E107.
Sarbassov DD, Guertin DA, Ali SM,Sabatini DM. Phosphorylation andregulation of Akt/PKB by the rictor–mTOR complex. Science 2005: 307:1098–1101.
Staron RS, Karapondo DL, KraemerWJ, Fry AC, Gordon SE, Falkel JE,Hagerman FC, Hikida RS. Skeletal
muscle adaptations during early phaseof heavy-resistance training in men andwomen. J Appl Physiol 1994: 76: 1247–1255.
Ugrinowitsch C, Fellingham GW, RicardMD. Limitations of ordinary leastsquares models in analyzing repeatedmeasures data. Med Sci Sports Exerc2004: 36: 2144–2148.
Westerbacka J, Corner A, Kolak M,Makkonen J, Turpeinen U, HamstenA, Fisher RM, Yki-Jarvinen H. Insulinregulation of MCP-1 in human adiposetissue of obese and lean women. Am JPhysiol Endocrinol Metab 2008: 294:E841–E845.
Widrick JJ, Stelzer JE, Shoepe TC,Garner DP. Functional properties of
human muscle fibers after short-termresistance exercise training. Am JPhysiol Regul Integr Comp Physiol2002: 283: R408–R416.
Wullschleger S, Loewith R, Hall MN.TOR signaling in growth andmetabolism. Cell 2006: 124: 471–484.
Yang Q, Inoki K, Ikenoue T, Guan KL.Identification of Sin1 as an essentialTORC2 component required forcomplex formation and kinase activity.Genes Dev 2006: 20: 2820–2832.
Young WB, Bilby GE. The effect ofvoluntary effort to influence speed ofcontraction on strength, muscularpower, and hypertrophy develop-ment. J Strength Cond Res 1993: 7:172–178.
Lamas et al.
10