
Proteomic characterization of novel histone post-translational modifications
Upload
khangminh22Category
view
0download
0
Expression and Function of Linker Histone H1X
During Early Embryonic Development of Xenopus
Samantha Griffiths
This thesis is submitted in partial fulfilment of the requirements for the award of
the degree of Doctor of Philosophy of the University of Portsmouth.
September 2019
Institute of Biological & Biomedical Sciences
School of Biological Sciences
University of Portsmouth

i
Declaration
Whilst registered as a candidate for the above degree, I have not been registered for
any other research award. The results and conclusions embodied in this thesis are
the work of the named candidate and have not been submitted for any other
academic award.
S. Griffiths
2019
Word count: 37,516

ii
I. Acknowledgements
My largest thank you is owed to Dr Fiona Myers, my first supervisor. Not only for
allowing me the opportunity to carry out my PhD, but also for her unwavering
belief in me and encouragement throughout my research journey from
undergraduate to postgraduate.
Thank you to the other members of my supervisory team; Prof. Matt Guille, for his
expertise and assistance in Xenopus techniques and Dr Frank Schubert, for his
insightful discussions of phylogeny and instruction in tools for phylogenetic
analysis. I am also appreciative of all of my supervisory team for critical reading
and valuable feedback of draft versions of my thesis.
I would like to thank Dr Sam Robson, who patiently explained the principles of
bioinformatics over many meetings and was instrumental for analysis of ChIP-Seq
data.
Thank you to the staff at the European Xenopus resource centre and to colleagues
past and present in Biophysics for their assistance in any way during my research.
Thank you to members of the Myers lab past and present, especially Billie Dolphin
for her friendship inside and outside of the laboratory.
Special thanks to my Mum, Dad, brother Chris and Nan for their endless love and
support throughout my research studies.
This thesis is in memory of my Gramps, who inspired me to always do my best.

iii
II. Abstract
Histones are important regulators of both chromatin structure and gene regulation.
There are many subtypes of linker histones and, in contrast to core histones, they
are very variable within and between species. Due to this, many linker histones
have not been analysed thoroughly in all species. H1X, also known as H1.10, is the
most recently identified linker histone variant.
The research presented in this thesis was focused on analysing the expression and
function of H1X during embryonic development, using the vertebrate model
organisms Xenopus laevis and Xenopus tropicalis.
The phylogenetic relationship of H1X between species was established by sequence
analysis, revealing that h1fx genes were orthologs in many vertebrate species. A
second h1fx gene, provisionally denoted h1fx.2, was found tandemly located only in
anuran amphibians and coelacanths.
Temporal investigation of the expression of H1X.1 protein was performed by
extraction of proteins from embryos at stages across early embryonic development
and western blot using anti-H1X antibody. It showed that in X. laevis, H1X was
expressed in all stages including the midblastula transition, indicating maternal
stores of H1X in the oocyte. Analysis of h1fx.1 and h1fx.2 messenger RNA showed
differences in expression in and between Xenopus species; most pronounced in
X. laevis, where h1fx.2 mRNA was detected in low levels in only certain stages,
compared to uniform h1fx.1 mRNA detection.
An RNA probe recognising X. tropicalis h1fx.1 was used for wholemount in situ
hybridisation to determine the spatial expression of h1fx.1. The mRNA was
detected in all stages probed, but restricted to the anterior tissues of the embryo,
such as the head, during tailbud stages of embryonic development.

iv
Gene editing by CRISPR-Cas9 to knockout the h1fx.1 gene successfully generated
mosaic X. tropicalis embryos as shown by sequencing, with survival to maturity
briefly shown.
Lastly, crosslinked chromatin immunoprecipitation (ChIP) followed by sequencing
of precipitated DNA was carried out using early and late Xenopus chromatin and
anti-H1X affinity antibody, in the first ChIP-Seq investigating H1X in non-
mammalian cells. Peaks of H1X enrichment were seen in many genomic regions,
and genes identified in both early and late X. laevis samples included genes
encoding histones such as H2A.X and H2B, as well as multiple tRNA genes.
This research contributes to the understanding of the expression and function of
linker histone subtypes. A previously undiscovered isoform of H1X has been
characterised, the importance of H1X for survival and possibly growth has been
shown and initial data about the location of H1X on the genome have been collected.
v
III. Table of contents
Declaration .................................................................................................................. i
I. Acknowledgements ............................................................................... ii
II. Abstract .................................................................................................. iii
III. Table of contents .................................................................................... v
IV. List of Figures ....................................................................................... xii
V. List of Tables ........................................................................................ xvi
VI. Abbreviations ..................................................................................... xvii
1 Introduction ............................................................................................. 1
1.1 Histones .......................................................................................................... 1
1.2 Epigenetic modifications in gene regulation ............................................. 5
1.3 Core Histone Variants ................................................................................... 9
1.3.1 Histone H2A, H2B and H3 variants ........................................................... 9
1.3.2 Histone H4 variants .................................................................................... 11
1.3.3 Functions of core histone variants ............................................................ 11
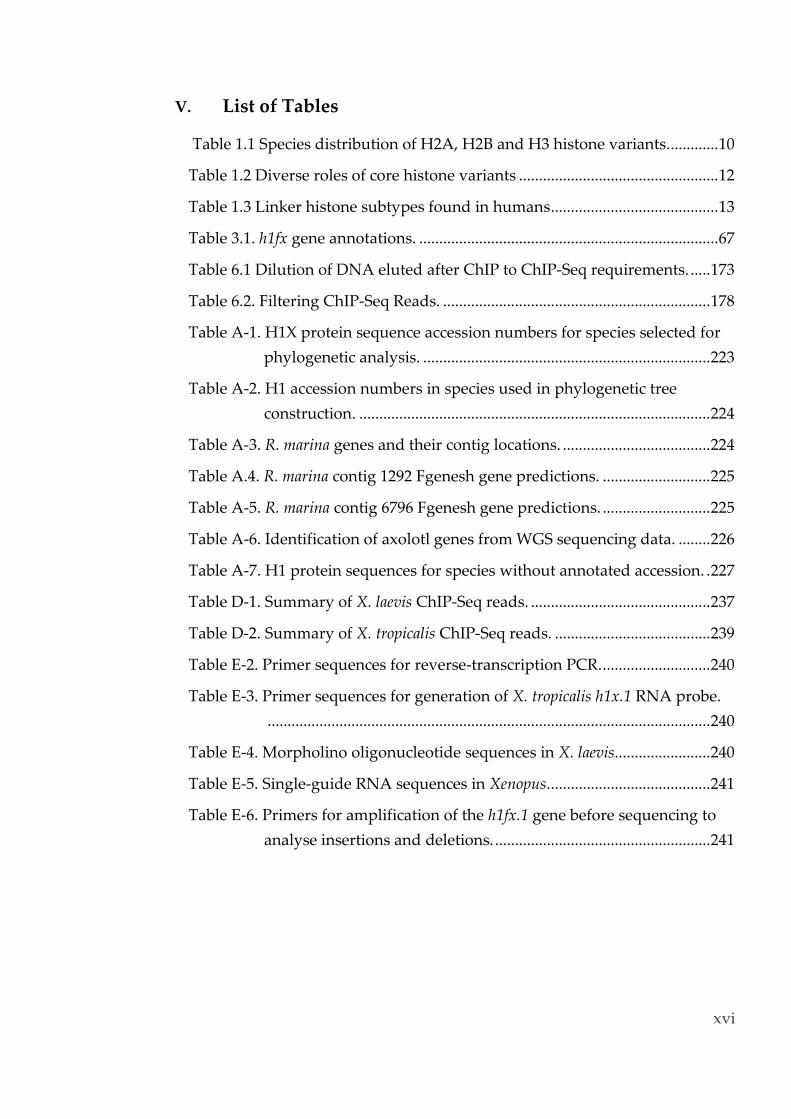
1.4 Linker Histone H1 variants ........................................................................ 13
1.4.1 Role of linker histones in chromatin structure ........................................ 16
1.4.2 Cleavage-stage linker histone subtypes are specific to oogenesis ....... 17
1.4.3 Testis-specific linker histones .................................................................... 18
1.4.4 Role of linker histones in gene regulation ............................................... 19
1.4.5 Role of linker histones in survival ............................................................ 21
1.4.6 Compensation between linker histone subtypes .................................... 22
1.4.7 Role of linker histones in cell differentiation .......................................... 23
1.4.8 The linker histone variant H1X ................................................................. 24
1.5 Studying gene regulation using model organisms ................................. 28
1.6 Aims .............................................................................................................. 28
2 Materials and Methods ........................................................................ 30
2.1 Suppliers ....................................................................................................... 30

vi
2.2 Solutions ....................................................................................................... 30
2.3 Phylogenetic Analysis Techniques ........................................................... 34
2.3.1 Identification of h1fx genes in multiple species ...................................... 34
2.3.2 Multiple sequence alignment .................................................................... 34
2.3.3 Analysis of synteny around h1fx ............................................................... 35
2.3.4 Phylogenetic tree construction .................................................................. 35
2.4 Embryological Techniques ......................................................................... 35
2.4.1 Manipulation of Xenopus embryos ........................................................... 36
2.4.2 Manipulation of Xenopus laevis oocytes ................................................... 36
2.4.3 Calibration of microinjection needle ........................................................ 36
2.4.4 Microinjection of Xenopus embryos and oocytes .................................... 37
2.4.5 Crosslinking embryonic chromatin .......................................................... 37
2.4.6 Sonicating embryonic chromatin .............................................................. 38
2.4.7 Checking the size of sonicated chromatin ............................................... 38
2.4.8 Fixing Xenopus embryos ............................................................................. 38
2.4.9 Rehydration of Xenopus embryos ............................................................. 39
2.4.10 Bleaching Xenopus embryos ....................................................................... 39
2.4.11 Wholemount in situ hybridisation (WISH) .............................................. 39
2.5 Biochemical Techniques ............................................................................. 40
2.5.1 Extraction of total protein from Xenopus embryos ................................. 40
2.5.2 Collection of Xenopus tropicalis tissue types ............................................ 41
2.5.3 Extraction of proteins from Xenopus tropicalis tissues ............................ 41
2.5.4 SDS-polyacrylamide gel electrophoresis (SDS-PAGE) .......................... 41
2.5.5 Western blot ................................................................................................. 42
2.5.6 MemCode stain ............................................................................................ 44
2.6 Molecular Biology Techniques .................................................................. 44
2.6.1 Agarose gel electrophoresis ....................................................................... 44
2.6.2 Extraction of total RNA from Xenopus embryos and tissues ................ 45

vii
2.6.3 Reverse transcription with Superscript IV .............................................. 45
2.6.4 Reverse transcription polymerase chain reaction (RT-PCR) ................ 45
2.6.5 Generation of RNA probes for WISH ...................................................... 46
2.6.6 Ligation into pGEM®-T Easy Vector System I ......................................... 47
2.6.7 Transformation of ligation reactions into chemically competent E. coli
..................................................................................................................... 47
2.6.8 Plasmid DNA purification ......................................................................... 47
2.6.9 Restriction digest of pGEM®-T Easy Vector plasmid DNA ................. 48
2.6.10 Phenol/chloroform extraction .................................................................... 48
2.6.11 Ethanol precipitation .................................................................................. 48
2.6.12 Generation of DIG-labelled RNA by in vitro transcription ................... 49
2.6.13 Removal of DNA from RNA by DNase I treatment .............................. 49
2.7 CRISPR-Cas9 Techniques ........................................................................... 49
2.7.1 Digest of plasmid DNA containing Cas9................................................. 49
2.7.2 Generation of Cas9 RNA ............................................................................ 50
2.7.3 Design of single-guide RNA template for CRISPR-Cas9 ...................... 50
2.7.4 Single-guide RNA template assembly by touchdown PCR .................. 50
2.7.5 Generation of single-guide RNA from template .................................... 52
2.7.6 Removal of DNA from RNA by TurboDNase (Ambion) ...................... 52
2.7.7 DNA extraction from Xenopus embryos .................................................. 52
2.7.8 Detection of CRISPR-Cas9 induced insertions and deletions ............... 53
2.7.9 Ligation into pCR®II cloning vector ......................................................... 53
2.7.10 Restriction dDigest of pCR®II plasmid DNA .......................................... 54
2.7.11 Detection of CRISPR/Cas9 induced mutations by T7 endonuclease I
assay ............................................................................................................ 54
2.8 Antibody purification ................................................................................ 55
2.8.1 Caprylic acid extraction and dialysis ....................................................... 55
2.8.2 Affinity column chromatography ............................................................. 55

viii
2.8.3 Size-exclusion chromatography ................................................................ 55
2.9 Biotinylation and coupling of affinity purified antibody to
streptavidin magnetic beads ...................................................................... 56
2.9.1 Biotinylation of affinity purified antibody .............................................. 56
2.9.2 Blocking NanoLink™ streptavidin magnetic beads .............................. 58
2.9.3 Coupling biotinylated affinity antibody to NanoLink™ streptavidin
beads ........................................................................................................... 58
2.10 Crosslinked Chromatin Immunoprecipitation (xChIP) ......................... 59
2.10.1 Crosslinked chromatin immunoprecipitation (xChIP) .......................... 59
2.10.2 Purification of bound and input samples ................................................ 59
2.10.3 ChIP sequencing (ChIP-Seq) ...................................................................... 60
2.11 Bioinformatic Analysis ............................................................................... 61
3 Phylogenetic analysis of histone H1 subtype H1X .......................... 63
3.1 Introduction .................................................................................................. 63
3.2 Identification of h1fx genes in Xenopus ..................................................... 65
3.2.1 Relationship between H1X and sperm-specific nuclear basic proteins
..................................................................................................................... 69
3.2.2 Other linker histones genes in Xenopus .................................................... 74
3.3 Identification of h1fx genes in representative species ............................ 77
3.3.1 Tandem h1fX genes in other species ......................................................... 81
3.3.2 Analysis of synteny around h1fx genes .................................................... 81
3.3.3 Phylogenetic analysis of H1X proteins .................................................... 89
3.3.4 Phylogenetic analysis of histone H1 proteins ......................................... 96
3.4 Discussion ................................................................................................... 102
3.4.1 Tandem h1fx genes .................................................................................... 102
3.4.2 Synteny is conserved around h1fx genes ............................................... 103
3.4.3 Phylogenetic studies of H1X .................................................................... 105
3.4.4 Phylogenetic studies of H1 Subtypes ..................................................... 106
4 Expression Analysis of h1fx and H1X in Xenopus species ............. 109
ix
4.1 Introduction ................................................................................................ 109
4.1.1 Anti-H1X antibody peptide sequence is specific to H1X.1 in X. laevis
................................................................................................................... 110
4.1.2 Temporal analysis of H1X expression in X. laevis ................................ 111
4.1.3 H1X.1 is expressed throughout embryonic development of X. laevis
................................................................................................................... 112
4.1.4 h1fx.1 mRNA is expressed throughout early development of X. laevis
................................................................................................................... 115
4.1.5 Analysis of the h1fx.2 gene in Xenopus laevis ......................................... 117
4.1.6 Expression of h1fx.2 mRNA during embryonic development of
X. laevis ..................................................................................................... 117
4.2 Temporal analysis of H1X expression in X. tropicalis ........................... 119
4.2.1 An anti-H1X antibody peptide sequence recognises X. tropicalis H1X.1
................................................................................................................... 119
4.2.2 H1X.1 is expressed throughout embryonic development of X. tropicalis
................................................................................................................... 119
4.2.3 h1fx.1 RNA is expressed throughout early development of X. tropicalis
................................................................................................................... 122
4.2.4 Spatial analysis of h1fx.1 expression ....................................................... 124
4.2.5 Whole-mount in-situ hybridisation with h1fx.1 .................................... 124
4.2.6 Analysis of H1X expression in Xenopus tropicalis tissue types ........... 126
4.2.7 Analysis of h1fx.1 mRNA expression in Xenopus tropicalis tissue types
................................................................................................................... 128
4.3 Analysis of h1fx.2 gene expression in Xenopus tropicalis ...................... 130
4.3.1 h1fx.2 mRNA is expressed throughout early development of
X. tropicalis ............................................................................................... 130
4.3.2 X. tropicalis h1fx.2 mRNA is expressed in multiple tissues ................. 132
4.4 Discussion ................................................................................................... 134
4.4.1 H1X.1 is a maternal protein in Xenopus ................................................. 134
4.4.2 h1fx.1 mRNA is expressed throughout embryogenesis of Xenopus ... 135

x
4.4.3 h1fx.1 mRNA localises to anterior regions during late embryogenesis
................................................................................................................... 135
4.4.4 h1fx.2 is expressed during embryonic development of Xenopus ........ 136
4.4.5 H1X is expressed ubiquitously in organ tissue types .......................... 139
5 H1X Depletion Studies in Xenopus laevis and Xenopus tropicalis .. 141
5.1 Introduction ................................................................................................ 141
5.2 Knockdown of protein expression by morpholino oligonucleotides 144
5.3 CRISPR-Cas9 .............................................................................................. 146
5.4 CRISPR in Xenopus .................................................................................... 150
5.4.1 Generation of mosaic X. tropicalis founders with CRISPR-Cas9 RNA
................................................................................................................... 154
5.4.2 Re-design of higher efficiency sgRNAs ................................................. 161
5.4.3 Generation of mosaic X. tropicalis with CRISPR-Cas9 protein ........... 163
5.5 Discussion ................................................................................................... 166
5.5.1 H1X.1 protein was not depleted by morpholino oligonucleotide ..... 166
5.5.2 Genome editing of the h1fx.1 gene in X. tropicalis ................................ 167
5.5.3 X. tropicalis mosaic for h1fx.1 were viable .............................................. 168
6 Genomic Analysis of h1fx.1 by Chromatin Immunoprecipitation
............................................................................................................... 170
6.1 Introduction ................................................................................................ 170
6.2 Chromatin Immunoprecipitation in Xenopus ........................................ 171
6.3 Bioinformatic analysis ............................................................................... 173
6.3.1 Quality control of raw sequence files ..................................................... 173
6.3.2 Trimming raw sequences and additional quality control ................... 175
6.3.3 Mapping trimmed sequences .................................................................. 177
6.3.4 Visualisation and peak finding ............................................................... 179
6.3.5 H1X.1 signal is reduced in late stage Xenopus embryos ...................... 182
6.3.6 Analysis of ChIP efficiency ...................................................................... 184
6.3.7 Identification of genes isolated by H1X ChIP-Seq ................................ 186

xi
6.3.8 Visualisation of peaks with the Integrated Genomic Viewer ............. 191
6.4 Discussion ................................................................................................... 194
6.4.1 H1X is associated with nuclei-acid binding genes in X. laevis ............ 194
6.4.2 Analysis of the ChIP efficiency ............................................................... 196
7 Final discussion and future work ..................................................... 199
7.1 Future work ................................................................................................ 201
8 References ............................................................................................ 203
Appendix A ............................................................................................................ 223
Appendix B ............................................................................................................. 229
Appendix C ............................................................................................................. 231
Appendix D. ........................................................................................................... 236
Appendix E ............................................................................................................. 240
Ethical Review ........................................................................................................ 244

xii
IV. List of Figures
Figure 1.1 Compaction of DNA into chromosomes. ............................................ 2
Figure 1.2 Structure of core and linker histones. ................................................... 4
Figure 1.3 PTMs of core histone N-terminal domains.......................................... 7
Figure 1.4 Effects of remodelling complexes on chromatin. ............................... 8
Figure 1.5 Structural domains of linker histone H1 variants in humans. ....... 15
Figure 2.1 Western blot cassette assembly. .......................................................... 43
Figure 2.2 The chemical structure of ChromaLink™ Biotin. ............................. 57
Figure 3.1 Multiple sequence alignment of X. laevis H1X and X. tropicalis
LOC407914 proteins. ............................................................................ 64
Figure 3.2 Multiple sequence alignment of X. tropicalis H1X reference
sequence and LOC407914 protein. ..................................................... 64
Figure 3.3 Multiple sequence alignment of X. laevis and X. tropicalis H1X
protein reference sequences compared to X. tropicalis LOC407914
and X. laevis LOC10019236. ................................................................. 66
Figure 3.4 Schematic of the h1fx loci in the X. laevis and X. tropicalis genomes.
................................................................................................................. 68
Figure 3.5 Alignment of X. laevis SP1/SP2 sequence, X. laevis H1X.2 and
X. tropicalis H1X.1.................................................................................. 71
Figure 3.6 Comparison of lysine and arginine residues in H1X proteins across
species. .................................................................................................... 73
Figure 3.7 Multiple sequence alignment of X. laevis H1.0 proteins. ................. 74
Figure 3.8 Schematic of the h1f0 gene loci in X. laevis and X. tropicalis. ........... 75
Figure 3.9 Schematic of the chordate lineage of the evolutionary tree. ........... 79
Figure 3.10 Schematic of gene locations across chromosomes or scaffolds
containing the h1fx gene to analyse synteny. .................................... 83
Figure 3.11 Extended h1fx locus for synteny analysis. ....................................... 85
Figure 3.12 Unrooted consensus tree of H1X protein sequences from multiple
species. .................................................................................................... 92

xiii
Figure 3.13 Phylogenetic tree of H1X proteins from species representing
multiple taxonomic groups. ................................................................ 94
Figure 3.14 Consensus unrooted phylogenetic tree of human and Xenopus
histone H1 proteins............................................................................... 98
Figure 3.15 Consensus tree of linker histone H1 subtypes in the vertebrates
human and Xenopus, compared to relatives of chordates. ............ 100
Figure 4.1 Anti-H1X antibody peptide sequence compared to both X. laevis
H1X proteins. ....................................................................................... 110
Figure 4.2 Western blot analysis of H1X.1 and H3 protein expression over a
time-course of early embryonic development of X. laevis. ........... 113
Figure 4.3 Western blot analysis of H1X.1 expression from fertilized egg to
gastrula in X. laevis.............................................................................. 114
Figure 4.4 Expression of h1fx.1 mRNA over early embryonic development of
X. laevis. ................................................................................................ 116
Figure 4.5 Expression of h1fx.2 mRNA during early embryonic development
of X. laevis. ............................................................................................ 118
Figure 4.6 Anti-H1X antibody peptide sequence compared to both
X. tropicalis H1X proteins. .................................................................. 120
Figure 4.7 Western blot analysis of H1X.1 and H3 protein expression over a
time-course of early embryonic development of X. tropicalis. ..... 121
Figure 4.8 Expression of h1fx.1 mRNA over early embryonic development of
X. tropicalis............................................................................................ 123
Figure 4.9 Whole-mount in-situ hybridisation analysis of h1fx.1 expression in
X. tropicalis............................................................................................ 125
Figure 4.10 Western blot analysis of H1X.1 and H3 protein expression in
X. tropicalis tissues. .............................................................................. 127
Figure 4.11 Expression of h1fx.1 mRNA in X. tropicalis tissues. ...................... 129
Figure 4.12 Expression of h1fx.2 mRNA during early embryonic development
of X. tropicalis. ...................................................................................... 131
Figure 4.13 Expression of h1fx.2 mRNA in X. tropicalis tissues. ...................... 133
Figure 4.14 Transcripts per million of X. tropicalis h1fx.1 and h1fx.2 mRNAs
during embryonic development. ...................................................... 138

xiv
Figure 5.1 Timeline of the use of three genetic engineering methods. .......... 143
Figure 5.2 Western blot of H1X Expression in X. laevis Knockdown Embryos.
............................................................................................................... 145
Figure 5.3 Overview of the CRISPR-Cas9 System. ........................................... 148
Figure 5.4 Schematic of the Xenopus h1fx.1 sgRNA sequences and target sites.
............................................................................................................... 150
Figure 5.5 Comparison of CRISPR-Cas9 efficiency in X. laevis and X. tropicalis.
............................................................................................................... 152
Figure 5.6 Sequencing and TIDE analysis of an adult X. tropicalis following
genome editing by CRISPR-Cas9. .................................................... 155
Figure 5.7 Size comparisons of h1fx.1 CRISPR-Cas9, wild-type and other
genetically altered X. tropicalis. ......................................................... 159
Figure 5.8 T7 assay of single embryos after microinjection of re-designed H1X
sgRNAs and Cas9 protein. ................................................................ 162
Figure 5.9 Analysis of h1fx.1 sgRNA.1 efficiency in X. tropicalis tadpoles. ... 165
Figure 6.1 Elution of DNA fragments after chromatin immunoprecipitation
(ChIP). ................................................................................................... 172
Figure 6.2 Quality assessment of X. laevis raw sequences after ChIP-Seq. ... 174
Figure 6.3 Quality assessment of X. laevis sequences after trimming. ........... 176
Figure 6.4 The number of peaks called for each sample by MACS2. ............. 180
Figure 6.5 Distribution of peaks by annotated genomic region. ..................... 181
Figure 6.6 Heatmaps of ChIP signal density. .................................................... 183
Figure 6.7 Efficiency of X. laevis and X. tropicalis ChIP. ................................... 185
Figure 6.8 Peaks intersecting genes in X. laevis and X. tropicalis early and late
samples. ................................................................................................ 187
Figure 6.9 Types of genes identified from peaks in early and late X. laevis
ChIP-Seq. .............................................................................................. 188
Figure 6.10 Visualisation of an X. laevis early and late peak intersecting a
gene on IGV. ........................................................................................ 192
Figure A-1. Alignment of the H2A protein product of the gene in the same
locus as h1fx. ........................................................................................ 228
xv
Figure B-1. Wholemount in situ hybridisation to detect H1X expression in
X. laevis. ................................................................................................ 229
Figure B-2. Expression of odc1 in X. laevis tissues. ............................................ 230
Figure C-1. Injection of morpholino oligonucleotides into oocytes followed
by culture. ............................................................................................ 231
Figure C-2. Comparison of forward and reverse sequencing chromatograms
of an X. tropicalis embryo injected with h1fx.1 sgRNA and Cas9
RNA. ..................................................................................................... 232
Figure C-3. DNA sequencing chromatograms from X. tropicalis toeclips
injected with h1fx.1 sgRNA and Cas9 RNA. ................................... 233
Figure C-4. Subclone sequences of two mature female X. tropicalis injected
with h1fx.1 sgRNA and Cas9 RNA as embryos. ............................. 234
Figure C-5. Surviving number of X. tropicalis embryos injected with h1fx.1
sgRNA and Cas9 RNA. ...................................................................... 235
Figure D-1. Quality assessment of X. tropicalis raw and trimmed sequences.
............................................................................................................... 236
Figure D-2. FastQC report of a flow cell in a high-throughput sequencing
machine. ............................................................................................... 237
Figure E-1. Plasmid map of the pGEM-T Easy Vector (Promega). ................. 242
Figure E-2. Map of the Cas9 plasmid. ................................................................. 242
Figure E-3. pCRII plasmid map. .......................................................................... 243
xvi
V. List of Tables
Table 1.1 Species distribution of H2A, H2B and H3 histone variants............. 10
Table 1.2 Diverse roles of core histone variants .................................................. 12
Table 1.3 Linker histone subtypes found in humans .......................................... 13
Table 3.1. h1fx gene annotations. ........................................................................... 67
Table 6.1 Dilution of DNA eluted after ChIP to ChIP-Seq requirements. ..... 173
Table 6.2. Filtering ChIP-Seq Reads. ................................................................... 178
Table A-1. H1X protein sequence accession numbers for species selected for
phylogenetic analysis. ........................................................................ 223
Table A-2. H1 accession numbers in species used in phylogenetic tree
construction. ........................................................................................ 224
Table A-3. R. marina genes and their contig locations. ..................................... 224
Table A.4. R. marina contig 1292 Fgenesh gene predictions. ........................... 225
Table A-5. R. marina contig 6796 Fgenesh gene predictions. ........................... 225
Table A-6. Identification of axolotl genes from WGS sequencing data. ........ 226
Table A-7. H1 protein sequences for species without annotated accession. . 227
Table D-1. Summary of X. laevis ChIP-Seq reads. ............................................. 237
Table D-2. Summary of X. tropicalis ChIP-Seq reads. ....................................... 239
Table E-2. Primer sequences for reverse-transcription PCR. ........................... 240
Table E-3. Primer sequences for generation of X. tropicalis h1x.1 RNA probe.
............................................................................................................... 240
Table E-4. Morpholino oligonucleotide sequences in X. laevis........................ 240
Table E-5. Single-guide RNA sequences in Xenopus. ........................................ 241
Table E-6. Primers for amplification of the h1fx.1 gene before sequencing to
analyse insertions and deletions. ...................................................... 241

xvii
VI. Abbreviations
Amp: Ampicillin
AP: Alkaline phosphatase
APS: Ammonium persulfate
ATP: Adenosine triphosphate
BLAST: Basic Local Alignment
Search Tool
Cas9: CRISPR-associated protein 9
cDNA: Complementary DNA
ChIP-Seq: chromatin
immunoprecipitation sequencing
CRISPR: Clustered regularly
interspaced short palindromic repeats
CTD: C-terminal domain
C-terminal: Carboxy-terminal
CTP: Cytidine triphosphate
DAB: 3, 3′-Diaminobenzidine
DIG: digoxigenin
DNA: Deoxyribonucleic acid
DNase I: Deoxyribonuclease I
dNTP: Deoxynucleotide triphosphate
DTT: 1, 4-dithiothreitol
EDTA: Ethylenediaminetetraacetic
acid
EXRC: European Xenopus Resource
Centre
GTP: Guanosine triphosphate
H1X: Histone 1, family member X
HRP: Horseradish peroxidase
IgG: Immunoglobulin G
MAB: Maleic acid buffer
MBS: Modified Barth's saline
MBT: Midblastula transition
MMR: Marc's modified Ringer's
MO: Morpholino oligonucleotide
mRNA: Messenger RNA
NTD: N-terminal domain
N-terminal: Amino-terminal
OCM: Oocyte culture medium
odc1: Ornithine decarboxylase 1
PAM: Protospacer adjacent motif
xviii
PBS: Phosphate-buffered saline
PBSTw: PBS tween20
PCR: Polymerase chain reaction
PTM: Post-translational modification
RT-PCR: Reverse transcription PCR
SC: Standard control
SDS: Sodium dodecyl sulphate
SDS-PAGE: sodium dodecyl
sulphate-polyacrylamide gel
electrophoresis
sgRNA: Single guide RNA
SNBP: Sperm specific nuclear basic
protein
TALEN: Transcription activator-like
effector nuclease
TBS: Tris-buffered saline
TEMED: N, N , N', N'-
tetramethylethane-1, 2-diamine
tRNA: Transfer RNA
UTP: Uridine triphosphate
UTR: Untranslated region
WISH: Wholemount in situ
hybridisation
xChIP: Crosslinked chromatin
immunoprecipitation
WGS: whole-genome shotgun
ZFN: Zinc-finger nuclease

1
1 Introduction
This chapter provides a broad background to the research discussed in this thesis,
narrowing to a specific focus as the scope and aims of the research are described.
As context is essential to present a coherent analysis of a protein or gene, a brief
review of chromatin and gene regulation will be discussed, with an emphasis on
the linker histones. Relevant literature on key topics is included to identify gaps in
knowledge and highlight the contribution of the research undertaken. At the end
of this chapter, the aims of the research will be presented.
1.1 Histones
Histone proteins are one of the most well-conserved classes of protein, found in all
domains of life, from the oldest organisms on Earth, single-celled prokaryotes, to
higher eukaryotes such as humans (Kasinsky, Lewis, Dacks, & Ausió, 2001).
The histone proteins are historically known by their association with DNA and their
contribution to chromatin structure. A histone octamer, formed of two copies of
each core histone; H2A, H2B, H3 and H4 wraps 145 to 147 base-pairs (Kornberg,
1974; Luger, Mäder, Richmond, Sargent, & Richmond, 1997) of DNA into
nucleosomes. Nucleosomes are joined by short stretches of unwound linker DNA
and resemble beads or ‘particles on a string’ (Olins & Olins, 1974) (Figure 1.1).
Though genome sizes of eukaryotic organisms vary, in humans at least, histones
enable the approximately two meters of DNA in each cell to be packaged in an
orderly way within the cell nucleus.

2
Figure 1.1 Compaction of DNA into chromosomes.
DNA is wrapped around a core histone octamer, packaged into chromatin and further
compacted into chromosomes. Linker histone H1 sits outside of the nucleosome, binding
to DNA. (Adapted from Tonna, El-Ostra, Cooper and Tikellis (2010); Felsenfeld and
Groudine (2003).

3
The secondary structure of core histones displays a long alpha helix, fringed at each
end by a shorter helix (Figure 1.2A). This motif, conserved between all core
histones, was named the histone fold (Arents, Burlingame, Wang, Love, &
Moudrianakis, 1991). The histone fold domains sit within the nucleosome, whilst
the N-terminal tail domains extend outwards from the nucleosome.
The final member of the histone family is the linker histone, histone H1. It is not
included in the histone octamer, however H1 associates with DNA wrapped around
the nucleosome. The ratio of H1 to nucleosomes is approximately 0.7, determined
in mouse liver (Sirotkin et al., 1995). It binds to the exit and entry of DNA to the
nucleosome and stabilises higher order chromatin structures (Thoma, Koller, &
Klug, 1979). H1 is a lysine-rich protein which differs structurally from core histones
and, in higher eukaryotic organisms, is a tripartite protein, formed of a short
N-terminal domain flanking a globular domain, followed by a C-terminal domain
comprised mainly of basic amino acids (Hartman, Chapman, Moss, & Bradbury,
1977). The globular domain of animal H1 does not share the histone fold
characteristic of core histones; instead, it contains a winged-helix motif (Figure
1.2B). Eubacterial linker histones lack the winged helix motif, as do the linker
histones of some protists (Kasinsky et al., 2001).

4
Figure 1.2 Structure of core and linker histones.
Schematic of histone structure with key domains indicated. Some secondary structures
omitted for clarity. (A) Core histone structure; the histone fold motif consisting of three
alpha-helices is boxed, with the amino acid span of helices numbered below. Unlabelled
boxes show helices outside of the histone fold. Although all core histones have an
N-terminal tail domain, only H2A has a C-terminal tail (dashed lines). (B) H1 structure in
metazoans, with a winged helix motif formed by three helices and a beta-hairpin. The H1
globular domain, spanning amino acids 47 – 116 is outlined on the schematic. Human H1X
structure used to represent H1. (Core histone structure adapted from Cutter and Hayes
(2015) and PDB 1kx3 (Davey, Sargent, Luger, Maeder, & Richmond, 2002). Linker histone
H1 structure adapted from Yamamoto and Horikoshi (1996), UniProtKB Q92522 and PDB
2lso (Eletsky et al., n.d.)).
5
1.2 Epigenetic modifications in gene regulation
The epigenome is a state of, in some cases heritable, changes to DNA that do not
alter the base genetic code (Reviewed by Allis & Jenuwein, 2016; Cavalli & Heard
2019). Study of these changes is known as epigenetics (Reviewed by Goldberg, Allis
& Bernstein, 2007).
As well as compacting DNA, histones are also an important part of the epigenome
and play a role in the epigenetic regulation of genes in several ways.
Firstly, histones can carry post-translational modifications, whereby chemical
groups are added or removed from amino acid residues enzymatically. Core
histones have two functional domains that can be modified, a globular C-terminal
residing within the nucleosome and an N-terminal tail (Figure 1.2). Post-
translational modifications are traditionally associated with the N-terminal tails,
however, where they are suggested to regulate transcription of associated genes
(Reviewed by Bannister & Kouzarides, 2011) (Figure 1.3). Post-translational
modifications have also been identified for linker histones (Sarg et al., 2015;
Wiśniewski, Zougman, Krüger, & Mann, 2007).
Secondly, for genes to be expressed, factors which transcribe them need to have
access to the DNA. Highly packaged DNA is inaccessible, so to overcome this
diverse families of chromatin remodeling complexes change the chromatin
architecture to allow access to genes. The four families in eukaryotes are SWI/SNF
(Switching defective/sucrose non-fermenting), ISWI (Initiation switch), CHD
(chromodomain, helicase, DNA binding) and INO80 (inositol requiring 80). They
all contain a conserved ATPase domain, flanked by family specific domains
(Reviewed by Clapier & Cairns, 2009). These remodeling complexes deposit histone
octamers on DNA after events such as DNA replication and expose sites for DNA
binding proteins by repositioning and ejecting nucleosomes and unwrapping DNA
(Reviewed by Clapier & Cairns, 2009). Chromatin remodeling complexes are also
responsible for altering the composition of individual nucleosomes, by removing

6
histone dimers and substituting the core histones with their variant forms (Clapier
& Cairns, 2009) (Figure 1.4).
Lastly, the sequence of the amino acids in the histone tails is an important
distinguishing mark; histones with the same C-terminal domain but different
N-terminal tail amino acid sequences are known as histone variants. These variants
can replace their canonical versions in a nucleosome, thereby changing its
properties.

7
Figure 1.3 PTMs of core histone N-terminal domains.
Amino acids in the N-terminal tail domains of the core histones are modified by addition
of chemical groups. Only one modification is able to occupy a residue at a time, despite
multiple possible modifications shown above each residues in the diagram. Not all
modifications are shown. Histone fold and C-terminal domains of histones are represented
by boxes. Modifications and residues affected were obtained from Abcam Epigenetic
modifications poster (Kouzarides & Bannister, 2007).

8
Figure 1.4 Effects of remodelling complexes on chromatin.
Chromatin remodeling complexes exhibit a range of effects on chromatin, including sliding
nucleosomes to allow access to DNA or to expose sites for insertion of histone octamers.
Whole histone octamers can also be evicted, or specific histone dimers replaced by variant
histones. Remodeling complexes, histone H1 and histone tails not shown. (Adapted from
Harikumar and Meshorer (2015)).

9
1.3 Core Histone Variants
Expression of histone genes is either only during S-phase of the cell-cycle, termed
replication-dependent, or outside the cell-cycle, termed replication-independent.
Replication-dependent histone genes tend to be clustered together on chromosomes
and have stem-loop features at the 3’ end of their mRNA, (Reviewed by Dominski
& Marzluff, 1999). Variant histones are usually replication-independent, and their
mRNA is polyadenylated (Reviewed by Dominski & Marzluff, 1999).
1.3.1 Histone H2A, H2B and H3 variants
The nomenclature of histone variants has not been standardised, though unified
names have been suggested to identify variants (Talbert et al., 2012). A particular
challenge for systematic naming of histones variants is that they differ in
distribution across species (Table 1.1).

10
Table 1.1 Species distribution of H2A, H2B and H3 histone variants.
1 or 2 denote data sourced from Talbert et al. (2012) and Draizen et al. (2016) respectively.
Core Histone Variants Species Distribution
H2A
H2A.1 Mammals2
H2A.B Mammals1
H2A.L Mammals1
H2A.P Placental mammals2
H2A.W (SPKK motifs) Plants1, 2
H2A.W Mammals1
H2A.X Eukaryotes except nematodes2
H2A.Z1 Eukaryotes1
H2A.Z2 Eukaryotes1
macroH2A1 Animals1
macroH2A2 Animals1
H2B
Testis-specific H2B.1 Mammals1
H2B.W Animals1
H2B.Z Apicomplexa2
SubH2B Mammals1
Sperm H2B
H2BV
Sea urchins2
Trypanosomes1
H3
CenH3 Eukaryotes2
H3.1 Mammals1
H3.2 Animals1
H3.3 Eukaryotes2
H3.5 Hominids2
H3.Y Primates1
H3.X Primates1
TS H3.4 Mammals2

11
1.3.2 Histone H4 variants
To date, no histone H4 proteins with distinct amino acid sequence differences from
the canonical H4 have been identified, suggesting there are no H4 sequence
variants.
However, a replication-independent histone 4 gene named H4r was identified
outside the histone cluster in two Drosophila species, D. melanogaster and D. hydei.
Although this indicates expression outside of DNA replication, the gene encoded a
protein identical to canonical H4 (Akhmanova, Miedema, & Hennig, 1996).
Identification of this gene suggested that a canonical H4 sequence encoded by a
replication-independent gene is needed for assembly of nucleosomes with
replication independent H3 variants (Akhmanova et al., 1996).
1.3.3 Functions of core histone variants
Incorporation of histone variants into nucleosomes may provide specific functions.
As well as gene regulation, histone variants are also involved in DNA repair and
segregation of chromosomes during the cell cycle (Table 1.2).

12
Table 1.2 Diverse roles of core histone variants
Table adapted from Maze, Noh, Soshnev and Allis (2014); Kamakaka and Biggins (2005).
H2A.W data sourced from Yelagandula et al. (2014).
Variant Location Function
H2A.X Throughout
genome DNA repair
H2A.Z Throughout
genome
Gene activation, gene silencing,
chromosome segregation
MacroH2A Inactive X
chromosome Gene silencing
H2A.Bbd Euchromatin Active transcription
H3.3 Throughout
genome
Gene activation, gene silencing,
Chromosome segregation
CENH3 Centromeres Chromosome segregation
H2A.W (SPKK
motifs) Heterochromatin Chromatin condensation
However, roles have not yet been identified for every histone variant, partly due to
the large number discovered. Histone variants can also be post-translationally
modified, however in some instances they carry the same modifications as the
canonical forms where specific residues are conserved (McKittrick, Gafken, Ahmad,
& Henikoff, 2004).
13
1.4 Linker Histone H1 variants
Eleven unique linker histone H1 variants are shared between mammals (Table 1.3),
though linker histone subtypes are also found in vertebrates in general; for example,
birds have an avian erythrocyte-specific linker histone, histone H5.
Table 1.3 Linker histone subtypes found in humans
The eleven currently-described linker histones found in mammals and their alternative
names and human gene symbols. 1 denotes unified names proposed by (Talbert et al.,
2012).
Traditional Name Alternative Names Human Gene Name
H1o, H1.0 H1FV, H1-0, H1.01 H1F0
H1.1 HIST1H1A, H1A, H1F1, H1.11 HIST1H1A
H1.2 HIST1H1C, H1C, H1.21 HIST1H1C
H1.3 H1D; H1F3; H1s-2; H1.31 HIST1H1D
H1.4 H1E; H1F4; H1s-4; H1.41 HIST1H1E
H1.5 H1; H1B; H1F5; H1s-3; H1.51 HIST1H1B
H1t, H1T H1FT; H1.61 HIST1H1T
H1T2 H1.71 H1FNT
H1oo osH1; H1.81 H1FOO
Hils1 H1.91 HILS1
H1X H1x, H1.X, H1.101 H1FX
As the globular domain sequences of H1 subtypes are highly conserved, genes
encoding H1 variants in mammals are suggested to have evolved by gene
duplications and are termed paralogs (Izzo, Kamieniarz, & Schneider, 2008).
Meanwhile, H1 variants that have a high conservation of sequence between two
different species are called orthologs; for example H1e and H1.4, in mouse and
human respectively, are orthologs with 93.6% sequence identity to each other (Izzo
et al., 2008).

14
However, not all histone H1 subtypes are orthologs between species. In fact,
analysis of the diverse eukaryotic sequences of H1 variants revealed that H1-
encoding genes in the same species are as diverse as H1 genes found between
eukaryotic species from different evolutionary kingdoms (Eirín-López, González-
Tizón, Martínez, & Méndez, 2004).
The somatic linker histone subtypes in humans, H1.1, H1.2, H1.3, H1.4 and H1.5 are
expressed only during DNA replication and were found in specific regions in
mammalian nuclei; H1.1, H1.2 and H1.3 in euchromatin and H1.4 and H1.5 in
heterochromatin (Th’ng, Sung, Ye, & Hendzel, 2005). As previously mentioned,
although the human H1s are orthologous to mouse somatic H1 subtypes, some
other vertebrates have different somatic linker histones. For example, somatic H1
subtypes H1A (also known as H1d L), H1B and H1C of African clawed frogs,
Xenopus laevis and Xenopus tropicalis, are not orthologs of mammalian somatic linker
histones.
All vertebrates share somatic linker histone subtypes H1o (H1.0) and H1X (H1.10)
that are expressed independently of DNA replication.
The only organism where two H1.0 encoding genes have been described is X. laevis.
X. laevis has two H1.0 homeologues, also known as H1o-1 and H1o-2 or H1D and
H1E (Risley & Eckhardt, 1981). Recent genome annotation has denoted H1o-1 and
H1o-2 as H1.0.L and H1.0.S respectively, according to the genomic location of the
genes. The proteins encoded by these genes share 89.69% sequence identity and the
sixteen differing residues are distributed throughout the protein sequences
(alignment shown in section 3.2.2). Xenopus H1.0 encoding genes are more similar
to the gene encoding H5, the Avian erythroid-specific linker histone, than the
mammalian H1.0 gene (Brocard, Triebe, Peretti, Doenecke, & Khochbin, 1997).
Some of the linker histone subtypes are very divergent from each other, although
all vertebrate H1 variants comprise of a tripartite structure (Figure 1.5).

15
Figure 1.5 Structural domains of linker histone H1 variants in humans.
The highest number of linker histone H1 variants have been described in mammals, which
as well as sharing somatic and oocyte-specific H1 subtypes with vertebrates, possess
additional mammalian-specific subtypes. Mammalian H1 subtypes represented by human
H1 sequences. Domain lengths from Uniprot. N-terminal (light grey), globular domain
(pink), C-terminal domain (dark grey).

16
1.4.1 Role of linker histones in chromatin structure
The exact binding position of the linker histone H1 on the nucleosome and the role
of H1 in higher order chromatin structures has been debated extensively.
Knockouts of a linker H1 gene in Tetrahymena resulted in an enlarged micronucleus
and mitotic chromosomes were less compacted compared to wild-type (Shen, Yu,
Weir, & Gorovsky, 1995). Mouse embryonic cells lines triply null for H1C, H1D and
H1E showed global changes in chromatin structure, specifically a reduction in the
spacing between nucleosomes; shortening of the linker DNA was expected to alter
the charge balance of the nucleosome (Fan et al., 2005). But despite the changes to
chromatin structure, only a small number of genes were reported to change their
expression patterns and in general more genes were upregulated than
downregulated (Fan et al., 2005).
The C-terminal domain of somatic linker histones is responsible for nucleosome
spacing (Clausell, Happel, Hale, Doenecke, & Beato, 2009) and the different
chromatin binding affinities for chromatin of each H1 subtype (Clausell et al., 2009;
Th’ng et al., 2005). The binding affinities of human somatic H1 subtypes H1.1, H1.2,
H1.3, H1.5, H1.0 and H1X for mononucleosomes were determined by band shift
assays and the chromatin compacting ability measured by Atomic Force
Microscopy of minichromosomes individually incorporating each H1 subtype
(Clausell et al., 2009). H1.0 had an intermediate affinity for chromatin and was
highly compacting, while H1X was found to have a low affinity for chromatin
compared to the other somatic H1 variants, but resulted in highly condensed
chromatin (Clausell et al., 2009). Low minichromosome compacting ability of a
chimeric protein formed from substitution of the normally highly compacting H1.4
CTD with the weakly compacting CTD of H1.2 provided supportive evidence that
the CTD is responsible for the different chromatin compacting abilities of H1
subtypes (Clausell et al., 2009).
17
The influence of the CTD on binding affinity of histone subtypes for nucleosomes
also affects the motility; for example H1.0 has the shortest C-terminal domain but
an intermediate florescent recovery after photobleaching (FRAP) of several minutes,
slower than H1.1 and H1.2, both of which have longer CTDs (Th’ng et al., 2005),
indicating that the mobility of H1.0 is lower than H1.1 and H1.2.
Despite different compaction abilities, none of the somatic H1 subtypes interfered
with ATP-dependent chromatin remodelling of minichromosomes by the Drosophila
remodelling complex NURF and yeast SWI/SNF (Clausell et al., 2009).
Further supporting the specific roles and functions of H1 variants, the linker histone
subtypes are expressed differently.
1.4.2 Cleavage-stage linker histone subtypes are specific to oogenesis
Cleavage-stage histone genes (cs-H1) are only expressed during oogenesis and early
embryogenesis (Marzluff, Sakallah, & Kelkar, 2006). They are not specific to
vertebrates as they also appear in a deuterostome relative of chordate species, the
sea urchin, hinting at a distant evolutionary origin of these proteins (Mandl et al.,
1997).
In mammals the cleavage stage, alternatively called oocyte specific, H1 is named
H1oo (Tanaka, Hennebold, Macfarlane, & Adashi, 2001) and transplantation of a
mouse donor nucleus into an oocyte revealed that this oocyte specific linker histone
swiftly replaced the somatic histones (Teranishi et al., 2004). The Xenopus oocyte
specific linker histone is known as B4, H1M or H1oo (Smith, Dworkin-Rastl &
Dworkin, 1988) and is suggested to be the vertebrate species homolog of sea urchin
cs-H1 (Mandl et al., 1997). Encoded by B4 mRNA (Smith, Dworkin-Rastl &
Dworkin, 1988), the oocyte-specific H1 in Xenopus has also been referred to by the
name H1X on at least two occasions (Ohsumi & Katagiri, 1991; Ohsumi, Katagiri &
Kishimoto, 1993), however the identifier H1X has since been reused for the somatic
H1 subtype, H1X (Yamamoto & Horikoshi, 1996). Xenopus B4 has 54% identity to

18
the globular domain of mammalian H1oo, while H1oo also shares 52% globular
domain similarity with sea urchin cs-H1 (Tanaka et al., 2001).
Oocyte-specific linker histones are replaced by somatic H1s when zygotic
transcription is activated. B4 mRNA was scarcely perceptible by neural stages (NF
stages 17-20 measured) of Xenopus development (Smith, Dworkin-Rastl & Dworkin,
1988), which is between 28 and 33 hours after fertilisation of X. laevis embryos
incubated at 18˚C.
Depletion of B4 protein from egg extract found it did not affect DNA compaction
nor assembly of nuclear structures and concluded that DNA replication could be
initiated in cells depleted of B4 (Dasso, Dimitrov, & Wolffe, 1994). However, in a
separate investigation, depletion of embryonic H1 in Xenopus egg extract was found
to cause several morphological defects to chromosomes as well as chromosome
misalignment during mitosis, both of which could be rescued by addition of linker
histone (Maresca, Freedman, & Heald, 2005).
1.4.3 Testis-specific linker histones
Testis specific H1 subtypes have an expression pattern restricted to the testis. H1t
(Cole, Kandala, & Kistler, 1986; Seyedin & Kistler, 1980), H1T2 (Tanaka et al., 2005)
and Hils1 (Histone linker H1 domain, spermatid-specific 1) (Yan, Ma, Burns, &
Matzuk, 2003) are testis specific variants in mammals.
While H1t homozygous null mice were fertile and underwent normal
spermatogenesis (Lin, Sirotkin, & Skoultchi, 2002), male H1T2 homozygous null
mice, but not heterozygous mutant or female mice, were infertile, with sperm
showing nuclear and morphological defects and reduced motility; the latter
assumed to be a result of the defects in sperm morphology (Tanaka et al., 2005). The
sperm count was lower in H1T2 heterozygous null male mice and the sperm DNA
was less compacted, with lower content of protamine 1 and protamine 2, both
essential for sperm DNA condensation, than that of heterozygous mutant and wild-

19
type male mice (Tanaka et al., 2005). A separate investigation confirmed that the
fertility of H1T2 heterozygous mutant male mice was comparable to the wild type
and that homozygous null H1T2 mice had a reduction in sperm motility and also
sperm counts; however, although their fertility was significantly reduced they were
able to produce small litters of viable pups (Martianov et al., 2005).
There are no data on the impact of the third testis specific H1 variant, the spermatid-
specific Hils1, on fertility. Hils1 shows 37-41% sequence identity of the globular
domain to mouse Hils1, H1t and replication-dependent somatic linker H1 subtypes,
whereas less than 20% globular domain sequence identity is shown to H1.0 and the
oocyte-specific H1 variant H1oo (Yan et al., 2003). The full-length protein sequences
of mouse and human Hils1 protein show 50% identity (Yan et al., 2003); lower than
the 62.9% identity seen between the full length human and mouse H1t protein but
slightly higher than the 48.9% identity between human and mouse H1T2 protein
sequences (not shown). Hils1 mRNA displayed a stage-specific expression pattern
in the testis and the onset and peak of hils1 mRNA expression is earlier than Hils1
protein expression in mice (Yan et al., 2003).
1.4.4 Role of linker histones in gene regulation
In Xenopus, somatic H1 subtypes reach similar amounts to the cleavage stage
histone B4 by the midblastula transition, and have significantly replaced B4 by
neurulation (Dimitrov, Almouzni, Dasso, & Wolffe, 1993).
This replacement of cleavage-stage histones with somatic subtypes may function to
regulate expression of genes during development. For example, expression of
somatic 5S rRNA genes was not affected by overexpression or depletion of H1
(Bouvet, Dimitrov, & Wolffe, 1994), but depletion of H1A enhanced transcription of
oocyte-type 5S rRNA, which is normally repressed in somatic cells, suggesting it is
involved in the repression of this oocyte-type gene, perhaps by altering chromatin
structure (Kandolf, 1994).
20
Gastrulating Xenopus embryos depleted of H1A protein by microinjection of H1A
ribozyme during the first cleavage were still able to accumulate both oocyte and
somatic-type 5S rRNA (Bouvet et al., 1994) and developed normally until the end of
observation at swimming tadpole stage (Kandolf, 1994). In these H1A depleted
embryos, oocyte-type 5S rRNA gene expression could also be triggered by injection
of excess transcription factor TFIIIA mRNA, suggesting that transcription factors
have a greater effect on chromatin lacking H1A, and that restriction of transcription
factor and incorporation of H1A during development may together regulate 5S
rRNA gene expression (Bouvet et al., 1994). The effect of altered amounts of H1 on
the regulation of 5S rRNA genes in the absence of excess TFIIIA was not
investigated due to limits of assay sensitivity (Bouvet et al., 1994). Overexpression
of H1C, the somatic linker at the lowest amount in Xenopus, reduced oocyte 5S
rRNA gene expression while not affecting somatic 5S rRNA levels (Bouvet et al.,
1994). Meanwhile, overexpression of H1.0 but not H1C reduced expression of
several genes, including c-fos, c-myc, cyclin D2 and cdc2 and interrupted the cell
cycle (Brown, Alexander, & Sittman, 1996).
In Tetrahymena, depletion of linker histone showed no effect on protein synthesis
nor on the amount of total RNA compared to wild-type controls, suggesting global
transcription of genes had neither increased nor decreased (Shen & Gorovsky, 1996).
However, evidence was found for H1 as a repressor of ngoA gene basal transcription
and as an activator of CyP gene transcription, suggesting H1 may act in a gene-
specific manner (Shen & Gorovsky, 1996).
A key study into the roles of H1 subtypes in gene regulation used crosslinked
chromatin immunoprecipitation and quantitative real-time PCR to investigate
seven chicken linker histone subtypes; H1.01, H1.02, H1.03, H1.10, H1.11R and
H1.11L and H5 at the chicken β-globin locus in three different chicken cell types
(Trollope, Sapojnikova, Thorne, Crane-Robinson, & Myers, 2010). Subtype-specific
differences were seen in the depletions of linker histone subtypes at globin genes,

21
in some cases regardless of the transcriptional state of the genes. For example, all
four globin genes are inactive in HD24 cells, however the adult globin βA and
embryonic globin βp and βE gene promoters were significantly depleted of four
subtypes, H1.01, H1.10, H1.11L and H1.11R and not the remaining three (Trollope
et al., 2010). All four globin genes are also inactive in cells from 15-day embryo
chicken brain (15DCB); however, the βA 3’-enhancer, a cis-regulatory site, showed
particular depletions of H1.11L and H1.11R (Trollope et al., 2010). Meanwhile, at
adult globin genes βA and βH which are active in 15-day chicken erythrocytes
(15DCE), no depletions of any of the seven H1 subtypes was seen, suggesting that
the presence of linker H1 subtypes does not indicate repression of genes (Trollope
et al., 2010). Heterochromatin is characteristically highly compacted and repressed,
however specific depletions of H1.01, H1.11L and H1.11R were seen at the 16 kb of
heterochromatin adjacent to the chicken globin locus in 15-day chicken
erythrocytes, (15DCE) but not in HD24 or 15DCB cells (Trollope et al., 2010),
supporting a role for linker histones that is not exclusively repressive.
It must be noted that despite the suggested use of H1.10 as an alternative name for
H1X (Table 1.3) (Talbert et al., 2012), chicken H1.10 is a separate linker histone
subtype, and H1X was not included in the research by Trollope et al., (2010).
1.4.5 Role of linker histones in survival
Knockout of linker H1 genes in Tetrahymena, a single-celled eukaryote, did not
adversely affect vegetative growth (Shen et al., 1995). However, depletion of
multiple H1 subtypes in vertebrates has shown that a proportion of subtypes are
essential for vertebrate development and survival (Fan et al., 2003). Loss of three
H1 subtypes, H1C, H1D and H1E (orthologs with human H1.2, H1.3, H1.4)
simultaneously in mice caused embryonic defects and mid-gestational death (Fan
et al., 2003). In contrast, depletion of only H1C and H1E together, a 50% reduction
in adult liver linker histone, did not alter the nucleosome to H1 ratio and mice were
viable and fertile (Fan et al., 2003). In vitro studies found that cell lines of human

22
breast cancer cell depleted of H1.2 were arrested in G1 of the cell cycle and cell death
occurred in cells depleted of H1.4, with both lines showing slower growth profiles
when depleted of either variant, indicating that H1.2 and H1.4 are essential for
normal growth processes in these cells (Sancho, Diani, Beato, & Jordan, 2008).
While depletion of multiple linker histone variants was fatal in vertebrates (Fan et
al., 2003), depletion of single linker histones in vertebrates does not always impact
survival; mice homozygous null for H1.0 were found fertile and viable (Sirotkin et
al., 1995). Individual mice homozygous-null for H1C, H1D or H1E were also fertile
and produced normal offspring, as were crosses of H1.0 homozygous-null mice
with the homozygous-null mice for H1C, H1D or H1E (Fan, Sirotkin, Russell, Ayala,
& Skoultchi, 2001). No phenotype was caused by the double knockout nor were
nucleosomes altered, suggesting that the loss of two H1 subtypes were
compensated for by other linker histone variants (Fan et al., 2001).
1.4.6 Compensation between linker histone subtypes
Although linker histone H1 subtypes exhibit both positive and negative effects on
gene expression (Alami et al., 2003), in some instances the subtypes have been
shown to compensate for each other functionally.
Different H1 subtypes may function to regulate the same genes. Human breast
cancer cell lines each singularly deficient in expression of H1.0, H1.2, H1.3, H1.4 or
H1.5, generated by inducible RNA interference, found that genes affected by
depletion of subtypes H1.0-H1.5 were either specific for that variant or overlapped
between multiple variants (Sancho et al., 2008). Some H1 variants may also have
the same functions as each other, for example, the presence of either mouse H1C or
H1.0 on sperm chromatin was demonstrated to reduce the rate of DNA replication
equally in Xenopus egg extract (Lu, Sittman, Brown, Munshi, & Leno, 1997).
Interestingly, in mouse liver, where H1.0 usually comprises 30% of the linker
histone content, the ratio of linker histone to nucleosome was not reduced by the

23
loss of H1.0 in homozygous H1.0-null mice and the relative quantities of other H1
subtypes were similar in H1.0 homozygous-null and wild-type mice (Sirotkin et al.,
1995). Similarly, H1t depletion in homozygous-null mice did not reduce the ratio
of linker histones to nucleosomes in germ cells, though other H1 subtypes increased
in proportion to potentially compensate (Lin et al., 2002). Individually, H1 subtypes
are not expressed equally, for example the predominant somatic linker histone in
Xenopus is H1A, constituting approximately 95% of the total H1 content, followed
by H1B and with H1C as the smallest constituent (Risley & Eckhardt, 1981).
Although it seems in some cases that other H1 subtypes can compensate for the
functions usually performed by a specific H1 variant, it has been suggested that the
substituted H1 may not be as effective as performing the role as the usual H1 variant
(Lin et al., 2002). As mentioned previously, linker histones have different binding
affinities for chromatin and effects on nucleosome spacing due to sequence
variability of the CTD (Clausell et al., 2009), which could affect chromatin
accessibility if, for example, a high affinity subtype substitutes for a low affinity one.
There is also evidence, determined by mass spectrometry of linker histones from
human cells and mouse spleen, that some linker histone subtypes are modified at
specific residues by PTMs that do not occur in others (Wiśniewski et al., 2007). For
example, certain PTMs at residues within the H1 globular domain which were seen
in H1.2-H1.5 were absent from H1.0, H1.1 and H1X (Wiśniewski et al., 2007), which
could potentially alter transcription. These examples could have impacts on how
genes are regulated by substituted subtypes.
1.4.7 Role of linker histones in cell differentiation
Replication-independent histones are coded by genes that are expressed outside
S-phase of the cell cycle. They include the vertebrate linker histone subtype H1X
(H1.10) and vertebrate differentiation-specific subtype H1.0 (H1o). Also included is
H1d, a differentiation-specific linker histone in sea urchin (Lieber, Angerer,

24
Angerer, & Childs, 2006). It shares nearly 50% sequence homology with vertebrate
H1.0 (Peretti & Khochbin, 1997).
The promoter sequence of the gene encoding the replication-independent histone
H1.0 is highly conserved in vertebrates and all vertebrate H1.0 genes have a
conserved region called the H4 box, named for a region of homology with the
proximal promoter of a gene encoding histone H4 (Peretti & Khochbin, 1997). The
H4 box is also conserved between H1 subtypes in sea urchins, but not conserved in
vertebrate replication-dependent somatic H1 variants, indicating that vertebrate
H1.0 genes are more closely related to sea urchin H1 genes than to other vertebrate
replication-dependent somatic linker histone genes (Peretti & Khochbin, 1997).
In the process of retinoic-acid induced differentiation of human pluripotent
embryonal carcinoma cell line (NT2) into neural lineages, H1.0 and H1X were the
only subtypes to increase in expression, suggestive of roles in cell differentiation
(Terme et al., 2011).
H1.0 was the predominant H1 subtype at the terminal differentiation of embryonic
stem (ES) cells, with H1.0 mRNA constituting up to 45% of the total H1 mRNA
(Terme et al., 2011). H1.2 and H1X were also present in larger amounts compared
to the remaining subtypes with their mRNAs making up 25% of the total H1 mRNA
(Terme et al., 2011). In contrast, there were higher amounts of somatic subtypes
H1.1, H1.3 and H1.5 in human ES and induced pluripotent cells (iPS), but these had
been downregulated at the end of retinoic acid induced differentiation of a NT2 cell
line to the neural cell lineage (Terme et al., 2011), suggesting that H1.0 has a
specialised role in cell differentiation while other somatic histone variants are
required in ES cells and induced pluripotent cells.
1.4.8 The linker histone variant H1X
H1X (H1.10) is the most divergent H1 variant compared to other somatic H1
subtypes in humans, with h1fx mRNA expressed independently of replication and

25
in a range of tissues (Yamamoto & Horikoshi, 1996). H1X is reportedly enriched in
less accessible chromatin (Happel, Schulze, & Doenecke, 2005). Residues in the
globular domain conserved in other human H1 subtypes are also found in human
H1X, as are residues thought to be functionally important for contact with DNA
(Yamamoto & Horikoshi, 1996). The human H1X protein contains less basic and
more acidic amino acids than other main H1 histones and shows 20-30% identity to
known human H1 variants, with the exception of a score of 13.6% to HILS1 (Happel
et al., 2005).
As the C-terminal domain (CTD) of H1X is comprised of a lower number of basic
amino acids than the CTD of H1.0, it has increased mobility but a lower binding
affinity for DNA and for acidic histone chaperone proteins (Okuwaki, Abe,
Hisaoka, & Nagata, 2016). Confirming this, the mobility of H1.0 was increased by
replacement of its CTD with that of H1X, with a glutamine residue in position 73 of
the H1X, but not H1.0, CTD important but not solely responsible, for the differences
in nucleosome affinity and higher mobility between the two H1 subtypes (Okuwaki
et al., 2016).
H1X was up-regulated during retinoic acid-induced differentiation of NT2 cells to
neural lineages (Shahhoseini, Favaedi, Baharvand, Sharma, & Stunnenberg, 2010)
and ChIP analysis detected incorporation of H1X at the regulatory regions of Nanog,
a stemness gene down-regulated at differentiation (Shahhoseini et al., 2010). H1.0
was also previously shown to increase during differentiation of NT2 cells (Terme et
al., 2011). Experiments attempting to induce expression of H1X in a similar way to
H1.0 indicated different regulatory mechanisms for the two variants; treatment of
HeLa cells separately with 5-azacytidine, a DNA methylation inhibitor, or all-trans
retinoic acid increased the amounts of H1.0 (Happel et al., 2005). Conversely none
of these three treatments had any effect on the amount of H1X detected, and sodium
butyrate treatment did not change the amounts of either subtype (Happel et al.,
2005).

26
In contrast to a more homogeneous distribution of other H1 proteins, H1X was
found by indirect immunofluorescence to be spread over the nucleus of cells or
clustered within cell nuclei, (Stoldt, Wenzel, Schulze, Doenecke, & Happel, 2007).
FLAG-H1X constructs partially confirmed the clustered pattern of H1X and DAPI
staining confirmed H1X clusters to be within the nucleoli, however H1X was in
general not found to co-localise with other nucleolar proteins such as fibrillarin and
nucleolin (Stoldt et al., 2007).
H1X localisation to nucleoli did not correlate with expression of E2F-1, a
transcription factor expressed during progression from G1 to S phase, indicating
H1X localisation to nucleoli is earlier in the cell cycle (Stoldt et al., 2007). The
amount of H1X was higher in the nucleoli of cells arrested in G1, compared to S-
phase cells and non-synchronised cells (Stoldt et al., 2007). Cells with nucleoli
containing an even distribution of H1X were also positive for H3 phosphorylated at
Ser10 (pH3(S10). The modified pH3(S10) is low in interphase cells and increases
during G2 of mitosis, demonstrating that H1X was present in G2 phase of cell cycle
(Stoldt et al., 2007). During the mitosis stage of the cell cycle H1X moves from the
nucleoli and is distributed on chromosomes (Takata et al., 2007), suggesting it is
involved in the cell cycle.
Investigation of a possible function for H1X showed that despite its nucleolar
location, it was presumed not to have a role in ribosomal gene transcription, as
double-labelling with an RNA Polymerase I transcription factor showed localisation
at adjacent sites in nucleoli, as opposed to co-localisation (Stoldt et al., 2007).
Reinforcing this, inhibition of RNA polymerase I did not visibly impact the
nucleolar localisation of H1X (Stoldt et al., 2007).
The movements of H1X during the cell cycle are consistent with its requirement for
accurate mitotic progression (Takata et al., 2007). Depletion of H1X in HeLa cells
impaired chromosome alignment at the metaphase plate and caused aberrant
formation of spindle fibres, but did not change the morphology of chromosomes

27
(Takata et al., 2007). Double knockdowns of H1X with AuroraB, a spindle
checkpoint protein, decreased the mitotic index of cells, suggesting spindle
checkpoint activation was the cause of prolonged mitosis in H1X depleted cells
(Takata et al., 2007).
Investigation of H1X during embryonic development by immunohistochemistry on
sections of embryonic and adult mice found that H1X was highly expressed during
gastrulation in all embryonic germ layers between E8.5 and E10.5, with expression
restricting at around E12.5 up to adult, suggesting H1X has a role in cell
differentiation and tissue organization (Ichihara-Tanaka, Kadomatsu, & Kishida,
2017). Quantitative real-time PCR and western blotting both confirmed that H1X
was highly expressed in early stages of embryogenesis and declined during
neuronal development (Ichihara-Tanaka, Kadomatsu, & Kishida, 2017).
Lastly, H1X has also been described as a potential adverse prognostic indicator of
astrocytomas, as decreases in levels of H1X in the brains of patients with astroglial
tumours correlated with increased grade of the tumour (Sepsa et al., 2015).
In conclusion, investigation into published literature regarding H1X, the latest
somatic H1 variant identified in vertebrates, has revealed an emerging role for this
variant in differentiation, development and the cell cycle.
Though chromatin immunoprecipitation experiments (ChIP) have been performed,
there has been no genome-wide analysis by ChIP of H1X in a model organism
during embryogenesis. Studies investigating H1X using antibodies have relied on
FLAG-tagged H1X constructs (Stoldt et al., 2007) or commercial antibodies only
available to mouse and human H1X, limiting studies to human cell lines or mouse
embryos while other vertebrate model organisms are available and much more
suited to ChIP in early development. For the research undertaken in this thesis, an
in-house antibody to Xenopus laevis was utilised, allowing analysis of H1X
expression in a non-mammalian vertebrate model organism.
28
1.5 Studying gene regulation using model organisms
Embryonic development is a period of major changes in gene expression and is ideal
for studies into gene regulation.
Xenopus laevis, the Upland clawed frog and Xenopus tropicalis, the Western or
tropical clawed frog are both model organisms used for studying embryonic
development, as vertebrates all undergo the same essential stages of gastrulation,
neurulation and organogenesis (Gilbert, 2010). Both organisms yield large
quantities of easily manipulatable embryos suitable for depletion of protein
expression by microinjection (Tandon, Showell, Christine, & Conlon, 2012) and are
able to be maintained in laboratory conditions.
However, a genome duplication occurring in X. laevis subsequent to the divergence
of the last common ancestor of X. laevis and X. tropicalis has resulted in an
allotetraploid genome of the former (Session et al., 2016), which is an additional
consideration for genetic studies in this organism.
1.6 Aims
Since linker histone variants are significantly divergent both within and between
species, analysis of the synteny of the gene encoding H1X in vertebrates will be
performed using online databases to test whether the H1X proteins in human,
Xenopus and other vertebrates are orthologs. The phylogenetics of H1X will also be
investigated to establish its relationship to other linker histone subtypes.
Established model organisms, the Upland clawed frog, Xenopus laevis and the
Western clawed frog, Xenopus tropicalis, will be utilised to investigate the spatial and
temporal H1X expression during embryonic development.
Depletion of H1X expression will be achieved using morpholino oligonucleotides
and the gene editing tool CRISPR/Cas9 and morphant embryos analysed
throughout early embryonic development to investigate the role H1X has during
this period.
29
Finally, to determine how affected genes and processes relate to sites where H1X
molecules are found in the genome, specific antibodies to H1X will be used for
biotinylated crosslinked chromatin immunoprecipitation (xChIP) on Xenopus
chromatin. Purified DNA from ChIP experiments will be sequenced and
bioinformatics analysis used to identify regions in the genome where H1X
accumulates.
30
2 Materials and Methods
2.1 Suppliers
Unless otherwise stated, chemicals, reagents and consumables were obtained from
Ambion, Fisher Scientific, GE Healthcare, Invitrogen, Machery-Nagel, National
Diagnostics, New England Biolabs, Promega, Qiagen, Roche, Sigma-Aldrich,
Solulink, Thermo Fisher Scientific and VWR. Oligonucleotides were synthesised by
Thermo Fisher Scientific. Morpholino Oligonucleotides were supplied by
GeneTools LLC., Streptavidin Magnetic Beads and biotinylation reagents were from
Solulink. DNA sequencing was performed by Source BioScience, Beckmann-
Coulter and GeneWiz. ChIP-Sequencing was performed by Theragen Etex.
2.2 Solutions
Alkaline Phosphatase (AP) Buffer: 0.1 M Tris-HCl (pH 9.0), 50 mM MgCl2,
0.1 M NaCl, 0.1% Tween-20.
Antibody Binding and Wash Buffer (1x ABWB): 50 mM Tris-HCl (pH 8.0), 150 mM
NaCl, 0.05% Tween-20.
Antibody Binding and Wash Buffer (2x ABWB): 100 mM Tris-HCl (pH 8.0), 300
mM NaCl, 0.1% Tween-20.
Bleaching Solution: 5% Formamide, 0.5x SSC, 10% H2O2.
ChIP Buffer 1: 50 mM Tris-HCl (pH 8.0), 150 mM NaCl, 0.05% Tween20,
2 mM EDTA, 1 mM DTT, 0.1m M PMSF, 0.1 mM Benzamidine, 0.1% Sodium
Deoxycholate.
ChIP Buffer 2: 50 mM Tris-HCl (pH 8.0), 500 mM NaCl, 0.05% Tween20,
2 mM EDTA, 1 mM DTT, 0.1 mM PMSF, 0.1 mM Benzamidine, 0.1% Sodium
Deoxycholate.

31
ChIP Buffer 3: 50 mM Tris-HCl (pH 8.0), 150 mM NaCl, 0.05% Tween20,
2 mM EDTA, 1 mM DTT, 0.1 mM PMSF, 0.1 mM Benzamidine, 0.1% Sodium
Deoxycholate, 250 mM LiCl.
ChIP Elution Buffer: 0.1 M NaHCO3, 1% SDS.
Coomassie Brilliant Blue Stain: 10% Acetic Acid, 40% Methanol, 0.1% Coomassie
Brilliant Blue Dye.
Denhardt’s Solution: 0.02% BSA, 2% PVP-20, 2% Ficoll-400.
Destain for Coomassie Blue: 10% Acetic Acid, 10% Methanol.
Embryo Extraction Buffer: 10 mM HEPES (pH 8.5), 2 mM MgCl2, 1 mM DTT,
1 mM EDTA, 1 protease inhibitor cocktail tablet (1 in 10 mL).
Hybridisation Buffer: 50% Formamide, 5x SSC, 1 mg/mL tRNA (from E. coli
MRE600), 100 µg/mL Heparin, 1x Denhart’s Solution, 0.1% Tween-20, 5 mM EDTA.
Immunoprecipitation Buffer (IP Buffer): 50 mM Tris-HCl (pH 8.0), 150 mM NaCl,
0.05% Tween20, 2 mM EDTA, 1 mM DTT, 0.1 mM PMSF, 0.1 mM Benzamidine.
LB Agar (Miller): 1% Tryptone, 0.5% Yeast Extract, 1% NaCl, 1.5% Agar.
LB Broth (Miller): 1% Tryptone, 0.5% Yeast Extract, 1% NaCl.
Maleic Acid Buffer (MAB): 100 mM Maleic Acid, 150 mM NaCl (pH 7.5).
MEMFA: 0.1M MOPS (pH 7.4), 2 mM EGTA, 1 mM MgSO4, 3.7% formaldehyde.
Marc’s modified Ringer’s (1x MMR) (pH 7.4): 40 mM KCl, 20 nM MgSO4,
40 Mm CaCl2, 0.1 mM NaCl, 5 mM HEPES.
Modified Barth’s Saline (1x MBS): 88 mM NaCl (pH 7.6), 10 mM HEPES, 1mM
KCl, 1 mM MgSO4, 2.5 mM NaHCO3, 0.82 mM MgSO4.7H2O, 0.33 mM
Ca(NO3)2.2H2O, 0.41 mM CaCl2.6H2O, 100 U/mL Penicillin, 100 µg/mL
Streptomycin Sulphate.

32
Oocyte Culture Medium (OCM) pH 7.6–7.8: 70% Leibovitz’s L-15 medium
(containing L-glutamine), 0.4 mg/mL bovine serum albumin (BSA, fraction V),
100 U/mL Penicillin, 100 µg/mL Streptomycin Sulphate.
Orange G DNA Loading Dye (6x): 0.25% Orange G, 15% Ficoll-400.
PBS–Azide: 1x PBS, 0.02% Sodium Azide.
Phosphate-Buffered Saline (PBS)(1x): 137 mM NaCl, 2.7 mM KCl,
10 mM phosphate buffer.
Phosphate-Buffered Saline with Tween-20 (PBSTw)(1x): 1x Phosphate-buffered
saline (pH 7.4), 0.1% Tween20.
Radioimmunoprecipitation assay buffer (RIPA buffer): 150 mM sodium chloride,
1.0% NP-40, 0.5% sodium deoxycholate, 0.1% SDS (sodium dodecyl sulphate),
50 mM Tris pH 8.0, 1 protease inhibitor cocktail tablet (1 in 10 mL).
Saline-Sodium Citrate (SSC) Buffer (20x): 3 M NaCl, 300 mM Trisodium Citrate
(pH 7.0).
SDS-PAGE Loading Dye (3x): 9% SDS, 15% β-mercaptoethanol, 15% w/v glycerol,
0.03% bromophenol blue, 360 mM Tris-HCl (pH 6.8).
SDS-PAGE Loading Dye (4x): 3% SDS, 5% β-mercaptoethanol, 0.03% bromophenol
blue, 120 mM Tris-HCl (pH 6.8).
SDS-PAGE Resolving Gel Buffer: 1.5 M Tris-HCl (pH 8.8), 0.4% SDS.
SDS-PAGE Resolving Gel (12%): 4 mL acrylamide (30%)/ bis-acrylamide (0.8%)
(37:5:1) (National Diagnostics), 2.5 mL Resolving buffer, 3.5 mL distilled water,
100 µl APS (10%), 10 µl TEMED
SDS-PAGE Running Buffer (10x): 1.92 M Glycine, 250 mM Tris, 1% SDS.
SDS-PAGE Stacking Gel buffer: 0.5 M Tris-HCl (pH 6.8), 0.4% SDS.

33
SDS-PAGE Stacking Gel (4%): 650 µl acrylamide (30%)/ bis-acrylamide (0.8%)
(37:5:1) (National Diagnostics), 1.25 mL Stacking buffer, 3 mL distilled water, 50 µl
APS (10%), 5 µl TEMED
Sonication Buffer: 20 mM Tris-HCl (pH 8.0), 70 mM KCl, 1 mM EDTA, 10%
Glycerol, 5 mM DTT, 0.125% NP40, Protease Inhibitor Cocktail tablet (1 in 10ml).
Tris-Borate-EDTA (TBE) (10x): 1.1 M Tris-HCl (pH8.0), 0.9M Borate, 25mM EDTA.
Tris-Buffered Saline with Tween-20 (TBSTw)(10x): 100 mM Tris-HCl (pH 8.0),
1.5 M NaCl, 0.5% Tween20.
Tris-EDTA (TE): 10 mM Tris-HCl (pH 8.0), 1 mM EDTA.
Western Blot Detection Solution 1: 25 mM Luminol, 0.4 mM p-Coumaric acid,
100 mM Tris-HCl (pH 8.0).
Western Blot Detection Solution 2: 5.4 mM H2O2 (30%).
Western Transfer Buffer: 150 mM glycine, 20 mM Tris, 0.1% SDS, 20% methanol.

34
2.3 Phylogenetic Analysis Techniques
2.3.1 Identification of h1fx genes in multiple species
For species with genomes available on Ensembl Browser 96 (Zerbino et al., 2017)
and The University of California, Santa Cruz (UCSC) Browser (Kent et al., 2002),
BLAST was performed using the globular domain of human H1X, the most
conserved region of the protein, against protein databases (BLASTp). Xenbase
genome browser (Karimi et al., 2018) (http://www.xenbase.org/, RRID:SCR_003280)
was used for obtaining sequences of h1fx genes in Xenopus species, with ExPASy
translate tool (Gasteiger et al., 2003) used to predict a protein sequence from gene
sequences obtained by browsing the genome. Genes in species such as the Tibetan
frog, elephant shark, common wall lizard and platypus were viewed on NCBI
Genome Data Viewer (GDV) to ascertain their location within the genome.
For identification of h1fx in species without annotated genomes, the globular
domain of human H1X protein was used to search translated nucleotide databases
(tblastn), restricting the search to whole-genome shotgun contigs (WGS) databases
on NCBI for each species. Then to find the full-length h1fx gene sequence the
nucleotide range of the BLAST hit was located on the whole genome sequence and
nucleotides flanking the region were selected, translated using ExPASy (Gasteiger
et al., 2003) and the longest open-reading frame selected until the full length H1X
protein sequence had been found. The Histone Variants Database 2.0 (Draizen et
al., 2016) was used to identify the resulting predicted peptide sequence as H1X
proteins.
2.3.2 Multiple sequence alignment
Protein sequences were aligned with Clustal Omega 1.2.4 (Sievers et al., 2011) and
shaded with Boxshade 3.2 (Hofmann & Baron, https://embnet.vital-
it.ch/software/BOX_form.html) to highlight conserved and similar residues.

35
2.3.3 Analysis of synteny around h1fx
Initial analysis of synteny around h1fx between large numbers of species was
performed using Genomicus version 96.01 (Muffato, Louis, Poisnel, & Crollius,
2010) and analysed in more detail by browsing individual genomes where available.
Genes surrounding h1fx for organisms without browsable genomes was deduced
by using gene prediction programs Fgenesh (Salamov & Solovyev, 2000) and
GENSCAN (Burge & Karlin, 1997) on the whole-genome shotgun (WGS) contig on
which BLAST searches had detected h1fx.
2.3.4 Phylogenetic tree construction
H1X protein sequences were aligned with Clustal Omega 1.2.4 (Sievers et al., 2011)
and the alignment was manually amended using the sequence editor BioEdit
version 7.0.5.3 (Hall, 1999). Gaps were then trimmed using the Automated 1
method of the TrimAL alignment trimming utility (Capella-Gutiérrez, Silla-
Martínez, & Gabaldón, 2009) through the Phylemon 2 webserver (Sánchez et al.,
2011). Phylogenetic tree construction was performed by IQ-TREE (Nguyen,
Schmidt, Von Haeseler, & Minh, 2015) used through the webserver W-IQ-TREE
(Trifinopoulos, Nguyen, von Haeseler, & Minh, 2016). ModelFinder was utilised to
select the best estimate of phylogeny (Kalyaanamoorthy, Minh, Wong, von
Haeseler, A., & Jermiin, 2017) and ultrafast bootstrap (Hoang, Chernomor, von
Haeseler, Minh, & Vinh, 2017) used to evaluate the probability of branches. FigTree
version 1.4.4 (Rambaut, 2018) was used to view the consensus trees graphically.
2.4 Embryological Techniques
Research using Xenopus oocytes and embryos complied with the Animals (Scientific
Procedures) Act 1986 and was conducted under project license number 70/7272,
granted by the UK Home Office. Procedures using adult frogs were carried out by
licenced animal technicians in the European Xenopus Resource Centre (EXRC).

36
Tadpoles older than embryonic stage 41, according to staging using The Normal
Table of Xenopus laevis (Nieuwkoop & Faber, 1967), were maintained by animal
technicians in the EXRC.
2.4.1 Manipulation of Xenopus embryos
Embryos from the EXRC were flooded with 0.1x MBS 15 minutes after being
fertilised and left for 10 to 20 minutes to rotate so the dark animal poles were facing
upwards. 0.1x MBS was replaced with 2% cysteine in 0.1x MBS (pH 8) to remove
the jelly coating. Xenopus laevis embryos were gently agitated while in 2% cysteine
to dislodge the eggs from each other. Embryos in cysteine were transferred to 50 mL
tubes and gentle rocked until embryos stacked directly on top of each other with no
jelly coat in-between them. Embryos were then washed five times with 0.1x MBS
and transferred to a clean 90 mm Petri dish. X. laevis and X. tropicalis embryos were
incubated either at 14–23°C or 22–25°C respectively and staged according to
Nieuwkoop and Faber (1967). Before the onset of gastrulation, 1x MBS was always
replaced with 0.1x MBS. Embryos were checked regularly, and dead or unfertilised
embryos were removed. Fresh 0.1x MBS was replaced as required.
2.4.2 Manipulation of Xenopus laevis oocytes
Ovary tissue containing oocytes was either manually defolliculated with forceps
under a microscope or by incubation in 1x MBS containing 62.5 µg/mL Liberase TM
(Roche) with gentle rocking for up to an hour at room temperature. Liberase TM
was removed from defolliculated oocytes by several washes of 1x MBS. After
injection, oocytes were kept at 18°C in 90 mm petri dishes of oocyte culture medium
(OCM), prepared fresh each day.
2.4.3 Calibration of microinjection needle
An injection time of 600 ms was set on a microinjector (Medical Systems Corp.) and
a glass capillary pulled into a needle and held by a micromanipulator (World
Precision Instruments) was cut under nuclease-free water with watchmakers

37
forceps and filled. To calibrate an injection volume of 4 nL, the needle was cut until
a droplet measured two eyepiece graticule units. Needles were also calibrated
using the capillary method, whereby the injection needle was filled with water and
droplets injected into a 30 mm glass capillary tube 10 times for one second each.
The height of the liquid in the capillary tube was used to calculate the injection time
required to deliver the required volume of solution.
2.4.4 Microinjection of Xenopus embryos and oocytes
A 3 µl droplet of the solution to be injected was pipetted onto a piece of parafilm
placed under a microscope, then the needle lowered into it and filled. Oocytes or
embryos were carefully transferred to a nylon grid in a 60 mm petri dish of
3% ficoll/1x MBS. Liquid was removed until oocytes or embryos sat in the grid.
Oocytes or embryos were injected in rows, with occasional injections into the air to
ensure the needle had not become blocked. Once injected, embryos were moved
into fresh dishes of 3% ficoll/1x MBS and incubated at appropriate temperature for
up to four hours, before transferring into large petri dishes of 0.1x MBS. Dead or
unfertilised embryos were removed and X. laevis embryos incubated at 14-23°C
while X. tropicalis embryos were incubated at 23-25°C until the desired
embryological stage. Oocytes were transferred to fresh oocyte culture medium
(OCM) and kept at 18°C.
2.4.5 Crosslinking embryonic chromatin
Embryos at the required stages were transferred to clean glass scintillation vials and
carefully rinsed three times with distilled water. They were incubated in 1%
formaldehyde in nuclease-free water for 30 minutes at room temperature before
quenching in 0.25x MBS or 0.25x MMR containing 125 mM glycine for 30 minutes
at room temperature. Embryos were washed twice for 15 minutes each with 0.25x
MBS or 0.25x MMR. X. laevis embryos were stored in sets of 100 and X. tropicalis
embryos in sets of 200-300 embryos per 1.5 mL tube. Excess liquid was removed,
and tubes frozen at -70°C.

38
2.4.6 Sonicating embryonic chromatin
Crosslinked embryos were thawed on ice and 1 mL fresh, cold, sonication buffer
added. Embryos were homogenised completely using a micro-pestle and cut-off
pipette tip and incubated on ice for 10 minutes. To remove the lipids and yolk,
homogenate was centrifuged for 10 minutes at 14,000 xg, 4°C, supernatant
discarded and lipid residue wiped from the tube sides (Blythe, Reid, Kessler, &
Klein, 2009). 650 µl fresh sonication buffer was added to the dark green pellet and
homogenised using a fresh micro-pestle. The tube was placed into ice water for
cooling and sonicated using a 3 mm diameter microtip probe and ultrasonic
processor (Vibra-CellTM) set to the following conditions:
The size of the sonicated chromatin was checked by taking a sample of the
homogenate (see 2.4.7). Once the bulk of the chromatin was below 500 bp the
homogenate was centrifuged for 5 minutes at 16,000 xg, 4°C and supernatant stored
at -70°C.
2.4.7 Checking the size of sonicated chromatin
A sample of homogenate was centrifuged at 16,000 xg for 5 minutes. A final
concentration of 200 mM NaCl was added to the supernatant and made to 50 µL
with 1x PBS. The crosslinks were reversed at 100°C for 30 minutes. 10 µg RNAse
A was added and incubated at 37°C for 30 minutes. Chromatin was purified by a
PCR Clean-Up Kit (Machery Nagel), 6x orange G added and loaded onto 1% TBE
agarose.
2.4.8 Fixing Xenopus embryos
Embryos at required stages were transferred to glass scintillation vials and fixed in
fresh MEMFA for 30 minutes at room temperature. The MEMFA was replaced with
100% methanol and incubated for 30 minutes at room temperature. The methanol
3.0 seconds ON
9.9 seconds OFF
x 40 cycles, 40% amplitude
39
was replaced with fresh 100% methanol and the embryos stored at room
temperature.
2.4.9 Rehydration of Xenopus embryos
Unless stated otherwise, all washes were performed at room temperature in 1 mL
of solution for five minutes. Embryos fixed in MEMFA and stored in methanol
(see 2.4.8) were rehydrated with one wash each of 75% methanol in PBSTw (or 75%
methanol/PBS), 50% methanol/PBSTw (or 50% methanol/PBS), 25%
methanol/PBSTw (or 25% methanol/PBS) and finally PBSTw (or 1x PBS).
2.4.10 Bleaching Xenopus embryos
1 mL of bleaching solution was added to rehydrated embryos (see 2.4.9) and
embryos placed on a light box for 10–15 minutes. Tubes were rotated occasionally
until the pigment had been removed from the embryos.
2.4.11 Wholemount in situ hybridisation (WISH)
After rehydrating (see 2.4.9) and bleaching embryos (see 2.4.10), unless stated
otherwise, further washes were performed at room temperature in 1 mL of solution
for five minutes.
Three washes of PBSTw were followed by one wash with 0.1 M Triethanolamine,
then by one wash with fresh 0.1 M Triethanolamine with 3 µl of 100% Acetic
Anhydride added. Then a further 3 µl of 100% Acetic Anhydride was added to the
wash solution for five minutes. After two more washes with PBSTw, two washes
with 0.5 mL Hybridisation Buffer were performed for two minutes each.
The wash was replaced with fresh 1 mL Hybridisation Buffer and X. laevis embryos
and X. tropicalis embryos were pre-hybridised for six hours or two hours
respectively at 60°C. Hybridisation buffer was then replaced with the probe diluted
to 500–1000 ng/mL in hybridisation buffer and incubated at 60°C overnight.

40
Washes were performed with 1 mL solution pre-heated to 60°C, with each wash
incubated at 60°C for 10 minutes unless otherwise stated. Probe solutions were
removed and stored at -20°C, then embryos washed with 50% deionised
formamide/5x SSC, 25% deionised formamide/2x SSC, 12.5% deionised
formamide/2x SSC, 2x SSC/0.1% Tween20. A final wash of 0.2x SSC/0.1% Tween20
was incubated on the embryos for 30 minutes. Three washes were then performed
at room temperature with 1 mL PBSTw for 5 minutes each and then with MAB for
10 minutes. The wash was replaced with 1 mL MAB/2% Block. X. laevis and
X. tropicalis embryos were incubated on a rocker at room temperature for five or two
hours respectively.
After blocking, the solution was replaced with 1 mL fresh MAB/2% Block
containing 0.5 µl anti-digoxygenin antibody fragments conjugated to alkaline
phosphatase (1:2000 dilution). Embryos were incubated overnight at 4°C with
gentle rocking.
Excess unbound antibody was removed by five washes of 1 mL MAB at room
temperature on a rocker for one hour each.
Two washes of AP Buffer were performed for 5 minutes each, then embryos
developed with 1 mL BCIP/NBT solution (1 SIGMAFAST™ BCIP®/NBT tablet
dissolved in 10 mL nuclease-free water), or 0.5 mL 100% BM-Purple AP
Precipitating Substrate (Roche) protected from light and incubated at 37°C until
staining had begun. The reaction was stopped by four washes of PBSTw for five
minutes each. Embryos were either photographed immediately in 1x PBS or
dehydrated in methanol and stored at 4°C.
2.5 Biochemical Techniques
2.5.1 Extraction of total protein from Xenopus embryos
Whole Xenopus embryos at the desired stage were collected in 1.5 mL tubes, excess
liquid removed and frozen at -70°C. Xenopus laevis or Xenopus tropicalis embryos

41
were homogenised in 8 µl or 4 µl extraction buffer per embryo respectively. An
equal volume of Freon was added and vortexed for 30 seconds, then centrifuged at
20,080 xg for 10 minutes. The upper phase was taken and 0.5 volumes of 3x SDS-
PAGE Loading Buffer added. Samples were either immediately frozen at -20°C or
boiled at 100°C for 10 minutes before loading on to SDS-PAGE.
2.5.2 Collection of Xenopus tropicalis tissue types
Tissue samples of X. tropicalis kidney, liver, heart, lung and testis were dissected
from animals killed for another experiment, using a Schedule 1 method, by licensed
animal technicians at the EXRC. Tissues pieces of approximately 10 mg were snap
frozen in liquid nitrogen before either storage at -70°C before protein extraction or
processed immediately for extraction of RNA.
2.5.3 Extraction of proteins from Xenopus tropicalis tissues
Tissues were homogenised with a micro-pestle and 300 μl of ice cold RIPA buffer
and then placed on a rotor for two hours at 4°C. The homogenate was centrifuged
for 20 minutes at 13523 xg, 4°C. The supernatant was aliquoted into fresh tubes on
ice, then stored at -20°C. 0.33x volumes of 4x SDS Loading buffer was added to
samples before electrophoresis on 12% SDS-PAGE (see 2.5.4).
2.5.4 SDS-polyacrylamide gel electrophoresis (SDS-PAGE)
Two glass plates for mini-gels (ATTO corporation) were placed atop each other with
a rubber gasket between them. They were clipped together, positioned vertically,
and 6 mL resolving gel solution pipetted between them. A thin layer of 100%
isopropanol was pipetted over the resolving gel to ensure it set in an even line. Once
the gel had set, the isopropanol was rinsed off with distilled water and 2.5 mL of
stacking gel solution pipetted onto the resolving gel. A comb was lowered into the
liquid stacking gel at an angle, ensuring no air bubbles were trapped
underneath. After the stacking gel had set, the gel was either stored at 4°C covered
42
in distilled water overnight or set up in an ATTO mini gel tank filled with 1x SDS
Running Buffer and the comb removed.
Protein samples mixed with 0.5 volumes of 3x SDS-PAGE Loading Buffer or
0.33x volumes of 4x SDS-PAGE Loading Buffer were centrifuged briefly and boiled
at 100°C for 10 minutes before loading into the SDS-PAGE gel. 5 µl broad-range
pre-stained protein ladder (NEB) was also loaded.
Electrophoresis of gels was performed at 65 V until proteins had migrated through
the stacking gel, after which the voltage was increased to 150 V. Electrophoresis
was stopped once the loading buffer had reached approximately 1 cm from the
bottom edge of the gel. The gel was either put into Coomassie Brilliant Blue stain
or transferred to nitrocellulose membrane (see 2.5.5).
2.5.5 Western blot
SDS-PAGE gels containing resolved proteins, (see 2.5.4), were rinsed in western
transfer buffer, along with four sheets of 3M paper, two sponge pads and one sheet
of HyBond-ECL 0.2 µm nitrocellulose membrane (GE Healthcare). Soaked
components were assembled in a sandwich between sides of a western transfer
cassette, as shown in Figure 2.1, with air bubbles rolled out between each layer. The
sandwich was placed in to a tank filled with cold western transfer buffer and
proteins transferred to the membrane at 300 mA for 60-90 minutes.
The sandwich was dismantled after transfer and the nitrocellulose membrane
rinsed several times with distilled water, before MemCode staining (see 2.5.6).
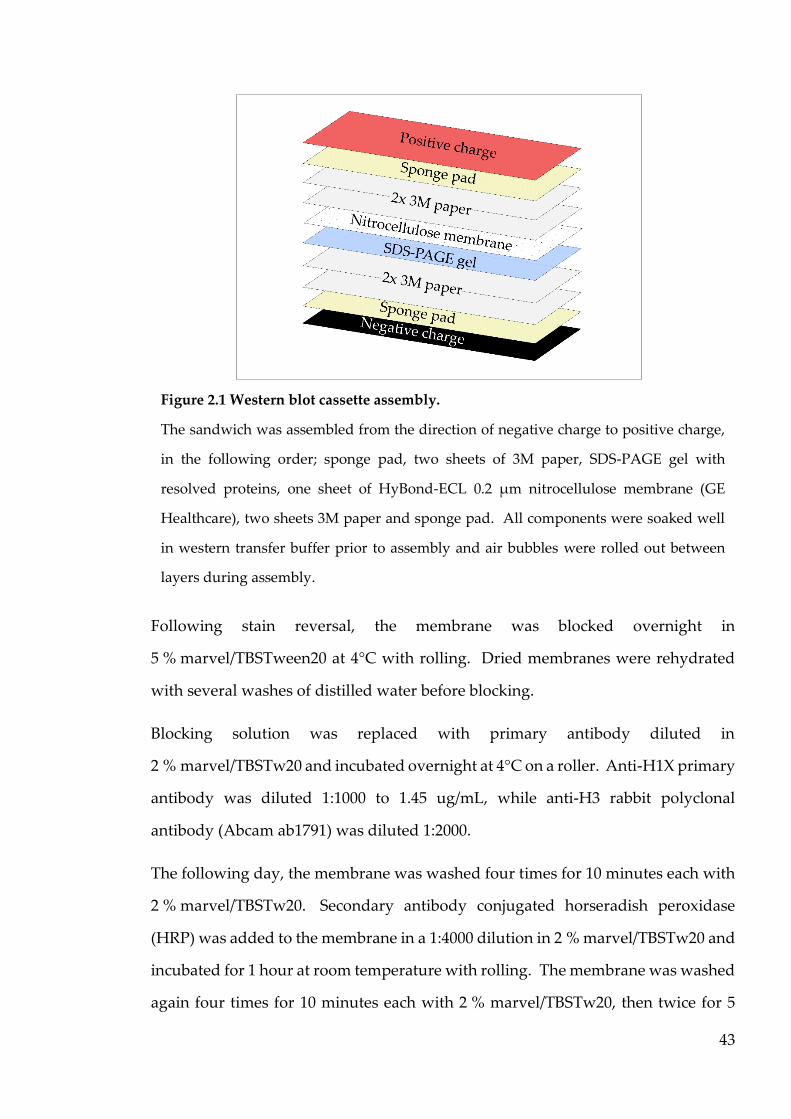
43
Following stain reversal, the membrane was blocked overnight in
5 % marvel/TBSTween20 at 4°C with rolling. Dried membranes were rehydrated
with several washes of distilled water before blocking.
Blocking solution was replaced with primary antibody diluted in
2 % marvel/TBSTw20 and incubated overnight at 4°C on a roller. Anti-H1X primary
antibody was diluted 1:1000 to 1.45 ug/mL, while anti-H3 rabbit polyclonal
antibody (Abcam ab1791) was diluted 1:2000.
The following day, the membrane was washed four times for 10 minutes each with
2 % marvel/TBSTw20. Secondary antibody conjugated horseradish peroxidase
(HRP) was added to the membrane in a 1:4000 dilution in 2 % marvel/TBSTw20 and
incubated for 1 hour at room temperature with rolling. The membrane was washed
again four times for 10 minutes each with 2 % marvel/TBSTw20, then twice for 5
Figure 2.1 Western blot cassette assembly.
The sandwich was assembled from the direction of negative charge to positive charge,
in the following order; sponge pad, two sheets of 3M paper, SDS-PAGE gel with
resolved proteins, one sheet of HyBond-ECL 0.2 µm nitrocellulose membrane (GE
Healthcare), two sheets 3M paper and sponge pad. All components were soaked well
in western transfer buffer prior to assembly and air bubbles were rolled out between
layers during assembly.

44
minutes with TBSTween20 and twice for 10 minutes with 1x PBS. For
chemiluminescence detection, Solutions 1 and 2 were added together over the
membrane, gently agitated for 30 seconds, stood for 30 seconds, then exposed and
photographed using ImageQuant LAS4000 and ImageQuant LAS4000 software,
version 1.2 (GE Healthcare).
2.5.6 MemCode stain
Nitrocellulose membranes after transfer were rinsed three times with distilled
water. They were covered with a thin layer of MemCode reversible blue stain
(Pierce, Thermo Fisher Scientific) and agitated until protein bands stained. The
membrane was rinsed again well with distilled water and MemCode Destain
solution added to remove background staining. A photograph of the membrane
was taken using a G:BOX UV-transilluminator (Syngene) using white
light. Staining was removed by gentle agitation with MemCode Stain Eraser
solution. Finally, the membrane was rinsed several times with distilled water and
either dried between 3M paper for storage or the western blot was continued
(see 2.5.5).
2.6 Molecular Biology Techniques
2.6.1 Agarose gel electrophoresis
For separation of DNA, 1-2 % agarose gels were prepared by weighing an
appropriate amount of agarose powder (Fisher Scientific) into a glass beaker,
mixing with the required volume of 1x TBE (Fisher Scientific) and microwaving for
2-3 minutes. Once cooled, SYBR® Safe DNA Gel Stain (Thermo Fisher Scientific)
was added to a 1x final concentration. The molten gel was poured into a gel casting
tray, combs were added, and left to set. Gels were run in 1x TBE running buffer at
80-120V and visualised using a G:BOX UV-Transilluminator and image captured
using GeneSnap software (Syngene).
45
2.6.2 Extraction of total RNA from Xenopus embryos and tissues
Total RNA was extracted by homogenising 10 thawed embryos or <10mg
snap-frozen tissue with 350 µl TRK Lysis Buffer (VWR) and using the E.Z.N.A Total
RNA Kit 1 (VWR), as per the manufacturer’s instructions. Total RNA was eluted
with 43 µl nuclease-free water. After DNA digestion (see 2.6.13) RNA was purified
with an RNA Clean and Concentrator kit (Zymo Research), following the
manufacturer's instructions. RNA was eluted in 15 µl nuclease-free water and
concentration evaluated by small volume spectrometry, before storing at -70°C.
2.6.3 Reverse transcription with Superscript IV
A reaction containing 1x SuperScript IV Buffer, 0.5 mM dNTP mix, 10 mM DTT,
200 ng Random Hexamer primers (Thermo Fisher Scientific) and 1 Unit RNAse
Inhibitor (Promega) was added to 60–500 ng total RNA and 200 units SuperScript IV
reverse-transcriptase (Thermo Fisher Scientific) and brought to a final volume of
10 µl with nuclease-free water. For a No RNA control, the RNA was substituted
with 2 µl nuclease-free water. For a minus-reverse-transcriptase control to check no
DNA was present in the RNA, the superscript IV reverse-transcriptase was replaced
by nuclease-free water. Reverse-transcription reactions were incubated in a
thermocycler at 55°C for 30 minutes and then either stored at -20°C or proceeded
with to the reverse transcription polymerase chain reaction.
2.6.4 Reverse transcription polymerase chain reaction (RT-PCR)
Following reverse-transcription PCR (see 2.6.3), specific primers were used to
amplify a portion of the cDNA. A reaction was prepared consisting of 1 mM each
forward and reverse primers, 15 µl Platinum Hi-Fi Supermix (Life Technologies)
and 1 µl of cDNA / 1 µl No RNA / 1 µl minus-reverse-transcriptase negative control
reaction. Reactions were made to a final volume of 25 µl with nuclease-free water
and incubated in a thermocycler under the following conditions:

46
95°C – 3 mins
95°C – 1 min
58°C – 1 min
72°C – 1.5 mins
72°C – 5 mins
4°C – HOLD
2.6.5 Generation of RNA probes for WISH
RNA prepared from Xenopus tropicalis embryos collected at stages 7, 9, 11, 14, 22, 25,
37 and 41 (see 2.6.2) was pooled and used as the template for synthesis of cDNA
(see 2.6.3).
A 300–400 bp region of the 3’UTR of the H1X gene was amplified from the cDNA
library and immediately ligated into the pGEM®-T Easy Vector (see 2.6.6). Ligation
reactions were transformed into chemically competent E. coli (see 2.6.7). Individual
colonies were sub-cultured in liquid media, plasmids purified (see 2.6.8) and
digested enzymatically (see 2.6.9). A plasmid with an insert of the correct size was
sent for DNA sequencing to confirm the orientation of the insertion.
Following sequencing, two separate restriction digests were prepared to linearize
the plasmid at either the 3’ or 5’ end whilst retaining the full length insert and either
the T7 or Sp6 promoter sequences. For the antisense probe, 10 µg plasmid DNA
was linearized with 15 U NSiI restriction enzyme (NEB) and 1x Buffer 3.1 (NEB) at
37°C. For sense probe, 10 µg plasmid DNA was linearised with 15 U ApaI
restriction enzyme (NEB) with CutSmart Buffer (NEB) at 25°C. Both digests were
incubated for 2 hours at their respective optimum temperatures.
Linear DNA was purified by DNA Clean and Concentrator Kit (Zymo) according
to the manufacturer's instructions. An in vitro transcription reaction was then
performed (2.5.13).
x35 cycles

47
2.6.6 Ligation into pGEM®-T Easy Vector System I
10 µl ligation reactions containing 5 µl 2x Rapid Ligation Buffer, 50 ng pGEM®-T
Easy Vector, 3 µl fresh PCR product and 3 U T4 DNA Ligase were set up in nuclease-
free water. In a background control ligation, the PCR product was replaced with
nuclease free water. Reactions were incubated overnight at 4°C.
2.6.7 Transformation of ligation reactions into chemically competent E. coli
Ligation reactions (see 2.6.6) were briefly centrifuged and 2 µl transformed into
50 µl of DH5-alpha strain competent E. coli cells. The mixture was flicked gently
and incubated on ice for 20 minutes, before cells were heat-shocked in a water bath
at 42°C for one minute. They were returned to ice for two minutes, then 950 µl room
temperature LB broth (Miller) without selection was added. Transformations were
incubated for one hour at 37°C with shaking at 220 rpm. 100 µl was spread on LB
agar plates containing 100 µg/mL ampicillin as a selection agent. The remaining
culture was centrifuged at 3000 xg for three minutes and 800 µl of the supernatant
discarded. The cell pellet was flicked to resuspend, then 100 µl plated on LB agar
plates containing 100 µg/mL ampicillin. Plates were briefly left to dry and then
incubated at 37°C overnight.
2.6.8 Plasmid DNA purification
Individual colonies were picked from LB agar plates (see 2.6.7) into 5 mL of LB broth
containing 100 µg/mL ampicillin. Cultures were incubated overnight at 37°C with
shaking at 220 rpm before performing a mini-prep (Roche, Machery-Nagel). For a
larger yield of plasmid DNA, after 8 hours the 5 mL culture was diluted 1/1000 into
a flask of LB Broth containing 100 µg/mL ampicillin and incubated for 16 hours at
37°C with shaking at 220 rpm. A midi-prep column purification kit (Qiagen,
Machery-Nagel, Roche) was used according to the manufacturer’s instructions.

48
2.6.9 Restriction digest of pGEM®-T Easy Vector plasmid DNA
To check the presence and orientation of the insert, a double restriction digest was
performed, using EcoRI High Fidelity (NEB) restriction enzyme. 1 µg plasmid
DNA, 20 U restriction enzyme (NEB) and 0.1x volumes CutSmart digest buffer
(NEB) were made to 10 µl with nuclease-free water. Digest reactions were mixed
thoroughly and incubated for one hour at 37°C. 6x Orange G loading dye was
added to digests and whole reaction loaded onto 1% TBE agarose. Clones
containing inserts were selected and diluted to the appropriate concentration before
sending for Sanger DNA sequencing to check the orientation of the insert, using the
T7 priming site integral to pGEM®-T. To linearise the plasmid to allow generation
of RNA, 10 µg plasmid was incubated with 15 U of appropriate restriction enzyme
and 1x digest buffer in a 50 µl reaction for 2 hours at the optimum temperature of
the restriction enzyme.
2.6.10 Phenol/chloroform extraction
An equal volume of phenol:chloroform:isoamyl alcohol (25:24:1) was added to
DNA, vortexed for 30 seconds and centrifuged at 16,000 xg for 5 minutes. The upper
phase was removed into a fresh 1.5 mL tube and an equal volume of
chloroform:isoamyl alcohol (24:1) added. It was vortexed for 30 seconds and
centrifuged at 16,000 xg for 5 minutes, before the upper phase was transferred to a
fresh tube and ethanol precipitated (see 2.6.11).
2.6.11 Ethanol precipitation
To DNA extracted by phenol/chloroform (see 2.6.10), 2.5 volumes 100% ethanol and
0.1 volumes of 3 M sodium acetate (pH 5.0) were added. It was mixed and
incubated overnight at -20°C. The DNA pellet was precipitated by centrifugation
at 16,000 xg for 30 minutes at 4°C. The supernatant was discarded, and DNA pellet
washed with 500 µl 70% ethanol at 16,000 xg for 5 minutes. The DNA pellet was
air-dried for 10 minutes and resuspended in 10 µl nuclease-free water.

49
2.6.12 Generation of DIG-labelled RNA by in vitro transcription
1x transcription (polymerase) buffer, 1x DIG Mix (Roche), 1 U appropriate RNA
polymerase, 1500 ng–2500 ng linearised template DNA (see 2.6.9), 40 U RNAse
inhibitor and 0.1 mM DTT were combined in a 20 µl reaction at room temperature.
It was mixed thoroughly and incubated at 37°C for two hours. The DNA template
was then digested (see 2.6.13). RNA was purified by SIGMASpin column (Sigma)
or G-50 column (GE Healthcare) and stored at -70°C.
2.6.13 Removal of DNA from RNA by DNase I treatment
A 1 µl ‘pre-treatment’ sample was taken and kept separate before digesting DNA
by adding 3 - 4 U DNase I and either 0.1x volumes DNase I Buffer (Thermo Fisher
Scientific) or 0.1x volumes NEB Buffer 2. The reaction was mixed and incubated at
37°C for 30 - 60 minutes. A 1 µl ‘post-treatment’ sample was taken. 2 µl 6x Orange
G was added to both ‘pre’ and ‘post’ samples and the volume made to 10 µl with
nuclease free water before loading onto 1% TBE agarose to check for the presence
of RNA and absence of DNA.
2.7 CRISPR-Cas9 Techniques
2.7.1 Digest of plasmid DNA containing Cas9
Cas9 plasmid was a gift from Yonglong Chen (Addgene plasmid #51307). 10 ng of
plasmid DNA was linearised in a restriction digest consisting of 30 U Not1
restriction enzyme (NEB) and 5 µl NEB Buffer 3.1 (NEB) in a total volume of 50 µl
with nuclease-free water. The restriction digest was incubated at 37°C for 2 hours.
A 1 µl sample was checked on 1% agarose to ensure complete linearisation.
Restriction enzyme was digested by adding 40 µg of proteinase K, 1.5 % v/v SDS
and reaction incubated at 37°C for 30 minutes. Linear DNA was purified by
phenol/chloroform extraction (see 2.6.10) and ethanol precipitation (see 2.6.11).

50
2.7.2 Generation of Cas9 RNA
For generation of Cas9 RNA, 2.5 µg purified linear Cas9 DNA was used as a
template in a 50 µl in vitro transcription reaction containing 1x transcription buffer,
80 U RNasein (Promega), 2.5 mM each ATP, UTP and CTP, 0.5 mM GTP,
10 mM DTT, 80 U SP6 RNA Polymerase and 0.5 mM m7G(5')ppp(5')G RNA Cap
Structure Analog. The reaction was mixed, briefly centrifuged and incubated at
37°C for two hours, after which the DNA template was digested (see 2.6.13). Cas9
RNA was then purified through a SIGMASpin Post-Reaction Purification Column
(Sigma), concentration evaluated by spectrophotometry and stored in appropriate
aliquots at -70°C.
Cas9 RNA was also generated using a mMESSAGE mMACHINE™ SP6
Transcription Kit (Ambion) according to the manufacturer’s instructions. In this
case, the DNA template was removed with TurboDNase (Ambion) (see 2.7.6).
2.7.3 Design of single-guide RNA template for CRISPR-Cas9
A unique nucleotide sequence of 20 bases was manually searched for within the
gene to be targeted by CRISPR-Cas9, with the condition that the sequence be
preceded by a guanine nucleotide and followed by two guanine nucleotides. This
target sequence, corresponding to G-N20-GG, was inserted into a pre-designed
cassette consisting of CRISPR and tracer RNA sequences and the T7 promoter, then
the oligonucleotide was synthesised (Thermo Fisher Scientific). When online tools
became available, candidate single-guide RNAs were designed using CRISPRscan
(www.crisprscan.org).
2.7.4 Single-guide RNA template assembly by touchdown PCR
For generation of the complete sgRNA, the oligonucleotide (see 2.7.3) was used as
the 5’ primer in extension PCR. It was annealed to a common CRISPR sequence,
used as the 3’ oligo, containing the remainder of the RNA backbone.

51
5’ Oligo (CRISPR sequence):
TAATACGACTCACTATAG-N20-GGTTTTAGAGCTAGAAATAGCAAG
3’ oligo (Common CRISPR sequence):
AAAAGCACCGACTCGGTGCCACTTTTTCAAGTTGATAACGGACTAGCCTTA
TTTTAACTTGCTATTTCTAGCTCTAAAAC
The underlined portions of the oligonucleotides above anneal together to generate
the template.
In a 0.2 mL PCR tube, 100 pmol/μl of each 5’ and 3’ primer was assembled into a
reaction with 50 µl PeqGold PCR Master Mix Y (PeqLabs, VWR) and made to 100
µl with nuclease-free water. 5 µl of each sample was taken into a fresh tube and set
aside as a ‘pre-reaction’ sample. The remaining volume was incubated in a
thermocycler under the following conditions:
Touchdown PCR cycle:
94°C – 5 seconds
94°C – 20 minutes
65°C – 20 minutes
68°C – 15 minutes
94°C – 20 minutes
58°C – 20 minutes
68°C – 15 minutes
68°C – 5 seconds
4°C – HOLD
13 cycles
Delta 0.5°C / cycle
30 cycles

52
5 µl annealing-extension product was removed for a ‘post-reaction’ sample. A
suitable amount of 6x Orange G was added to the pre- and post- samples and loaded
onto 2% TBE agarose to check for the presence of a PCR product of approximately
120 bp in the post PCR sample. The remainder of the PCR product was purified
through a PCR Clean-Up Kit (Machery Nagel) according to the manufacturer's
protocol, with the addition of a two-minute incubation of the column after adding
50 µl elution buffer NE (5 mM Tris-HCl, pH 8.5).
2.7.5 Generation of single-guide RNA from template
A transcription reaction was prepared in a 0.2 mL PCR tube, using the T7
MegaScript Kit (Ambion) according to the manufacturer’s instructions, with 8 µl of
the purified single-guide RNA template (see 2.7.4) in a 20 µl reaction. It was
incubated at 37°C for three hours or overnight, then treated with TurboDNase
(Ambion) (see 2.7.6). The single-guide RNA was purified through SIGMASpin
Post-Reaction Purification Columns (Sigma-Aldrich), according to the
manufacturer’s protocol, except for performing centrifugation steps at 2000 xg. The
concentration was evaluated using small-volume spectrometry and sgRNA aliquots
stored at -70°C.
2.7.6 Removal of DNA from RNA by TurboDNase (Ambion)
A 1 μl ‘pre-DNase I’ sample was taken on ice before 2 U TurboDNase (Ambion) was
added to the remainder and incubated at 37°C for 15 minutes. A 1 μl ‘post-DNase I’
sample was taken, and both samples made to 10 µl with nuclease-free water and 6x
Orange G before loading on 2% TBE Agarose (see 2.6.1) to check the DNA template
had been digested.
2.7.7 DNA extraction from Xenopus embryos
DNA from whole embryos or toe-clip samples was extracted using a DNeasy Blood
and Tissue Kit (Qiagen), according to the manufacturer's protocol for DNA

53
extraction from animal tissue. The recommended elution volume was lowered to
50 µl for DNA extraction from X. tropicalis embryos.
2.7.8 Detection of CRISPR-Cas9 induced insertions and deletions
To detect whether changes to the canonical gene sequence due to insertions or
deletions had occurred, upstream and downstream primers were first designed to
amplify a region spanning the CRISPR target site of the gene.
A PCR reaction containing 40 ng–100 ng DNA (see 2.7.7), 12.5 µl PeqGold Hot Start
Mix S (PeqLabs) and 0.4 µM of each upstream and downstream primer was made
to 25 µl with nuclease-free water and run under the following conditions:
95°C – 1 min
95°C – 30 secs
58°C – 30 secs
72°C – 1 min
72°C – 7 mins
4°C – HOLD
PCR products were checked on 1.2% TBE Agarose to ensure correct amplification,
before purification by QIAquick PCR Purification Kit (Qiagen) following the
manufacturer's protocol. PCR Products were made to the required concentration
and sent for DNA sequencing.
2.7.9 Ligation into pCR®II cloning vector
To identify specific insertions or deletions affecting the H1X gene after injection of
CRISPR-Cas9, PCR products from mosaic embryos identified by sequencing were
cloned and then screened by Sanger sequencing. 3 µl freshly amplified PCR
products were ligated into the pCR®II vector, following the TA Cloning®Kit Dual
40 cycles
54
Promoter (pCR®II) protocol according to the manufacturer’s instructions. Ligation
reactions were mixed thoroughly and incubated at 4°C overnight.
2.7.10 Restriction dDigest of pCR®II plasmid DNA
To check for presence of inserts before sequencing clones, a restriction digest was
performed, using internal EcoR1 sites flanking the insertion site. 500 ng plasmid
DNA, 20 U EcoR1 restriction enzyme (NEB) and 0.1 x volumes EcoR1 digest buffer
(NEB) were made to 10 µl with nuclease-free water. Digest reactions were mixed
thoroughly and incubated for one hour at 37°C. 6x Orange G loading dye was
added to digests and whole reaction loaded onto 1% TBE agarose. Clones
containing inserts were selected and diluted to the appropriate concentration before
sending for DNA sequencing using the integrated M13 primer sites.
2.7.11 Detection of CRISPR/Cas9 induced mutations by T7 endonuclease I assay
In a 0.2 mL PCR tube, 5 µL of PCR product (see 2.7.10) was mixed with 0.1x volumes
Buffer 2 (NEB) and made to 19 µl with nuclease-free water. The reaction was
incubated in a thermocycler set to a ramp PCR program:
94°C
85°C
25°C
4°C – HOLD
10 U of T7 endonuclease I (NEB) was added and reactions incubated at 37°C for 15
minutes. The reaction was stopped by addition of 0.05x volumes 0.5 M EDTA.
6x orange G loading dye was added, and reactions loaded on 1.2% TBE agarose to
check for cleavage of products by T7 endonuclease I.
Ramp down at -2°C /s
Ramp down at -0.1°C /s 1 cycle, 5 minutes

55
2.8 Antibody purification
2.8.1 Caprylic acid extraction and dialysis
Two volumes of 60 mM sodium acetate (pH 4.0) were added to one volume of
thawed antiserum. Caprylic acid was added dropwise to a final concentration of
2.5% v/v and stirred at room temperature for 30 minutes. Large serum proteins
were precipitated by centrifugation at 5525 xg until the supernatant was clear. The
cleared supernatant was transferred into a prepared 18/32 size dialysis tube, which
was tied securely and dialysed in 1x PBS overnight at 4°C with stirring.
2.8.2 Affinity column chromatography
Pre-packed columns containing the peptide sequence used to raise the antibody
coupled to CPG glass beads were obtained from Alta-Biosciences. Columns stored
in 1x PBS containing 0.02% sodium azide were equilibrated with three column
volumes of PBS before dialysed IgG (see 2.8.1) was passed down the column three
times. This was followed by 10x bead volumes each of 1x PBS, 0.5 M NaCl/PBS and
lastly 1x PBS again. IgG was eluted by adding 6 mL 3.5 M potassium thiocyanate,
1 mL at a time directly onto the beads. It was immediately loaded onto a G-25
desalting column and the affinity purified antibody was separated from salt by size-
exclusion chromatography (see 2.8.3). Affinity columns were cleaned with 10 bead
volumes of 10 mM HCL followed by 10 bead volumes 1x PBS and stored in 0.02%
sodium azide/PBS, 4°C.
2.8.3 Size-exclusion chromatography
A desalting column composed of G-25 medium sephadex resin in 10 mM sodium
bicarbonate was connected to a pump (Amersham Biosciences Pump 1), UV
spectrophotometer (Pharmacia Biotech LKB-UVicordsII), chart recorder (Kipp &
Zonen) and a fraction collector (Pharmacia Biotech Frac-100) set to collect 4 mL
fractions at 2 mL/minute. Collected fractions were evaluated by spectrophotometry

56
and 100 µg aliquots snap-frozen in liquid nitrogen. Frozen aliquots were
immediately lyophilised overnight and then stored at -20°C.
2.9 Biotinylation and coupling of affinity purified antibody to
streptavidin magnetic beads
2.9.1 Biotinylation of affinity purified antibody
Approximately 300 µg of lyophilised affinity purified antibody (see 2.8.3) was
pooled in 130 µl of 1x Modification Buffer (Solulink). The pooled antibody was
buffer exchanged using Zeba 7K MWCO 0.5 mL desalting columns (Thermo
Scientific), according to instruction in the ChromaLink™ Biotin Protein Labelling
Kit protocol (Solulink). Between the buffer exchanges, the antibody was incubated
with a suitable volume of ChromaLink™ Biotinylation Reagent (Solulink),
determined by the equation:
The solution was mixed well and incubated at 25°C for 120 minutes.
Following incubation, excess reagent was removed by buffer exchanging the
antibody into 1x PBS using Zeba 7K MWCO 0.5 mL desalting columns.

57
For quantification of biotinylation, the absorbance at 280 nm and 354 nm was
measured using a spectrophotometer, as the embedded bis aryl hydrazone
chromophore in the structure of ChromaLink™ biotin could be traced at 354 nm
(Figure 2.2).
The degree of biotin incorporation (molar substitution ratio) was calculated as
follows:
Equation 1. Corrected A280 = A280 – A280 (A354 x 0.23)
Equation 2.
Equation 3.
Equation 4.
Biotinylated antibody was stored at -20°C or coupled immediately to streptavidin
magnetic beads (Solulink).
Figure 2.2 The chemical structure of ChromaLink™ Biotin.
Biotin is joined to bis aryl hydrazine and aromatic succinimidyl ester by a long chain
PEG3 linker. Bis aryl hydrone forms a traceable chromatophore. (Adapted from the
ChromaLink™ Biotin Protein Labeling Kit Technical Manual (Available at
http://www.solulink.com/library)).
58
2.9.2 Blocking NanoLink™ streptavidin magnetic beads
Before coupling to biotinylated antibody, NanoLink™ Streptavidin Magnetic Beads
were blocked according to the user protocol (Solulink). Blocker™ Casein in TBS
(Thermo Fisher Scientific) was passed through a 0.45 µM filter (Satorius) and then
0.1 mM PMSF and 0.1 mM Benzamidine added. 1 mL of this was used to block 100–
120 μl of 10 mg/ml NanoLink™ Streptavidin Magnetic Beads. Beads were
incubated on a rotor for 30 minutes, before washing four times with 1 mL 1x ABWB.
Between washes, beads were captured on the side of the tube using a magnetic
stand to allow the wash solutions to be completely removed and discarded. Blocked
beads were immediately used for coupling to biotinylated IgG.
2.9.3 Coupling biotinylated affinity antibody to NanoLink™ streptavidin beads
Pre-blocked NanoLink™ Streptavidin beads (see 2.9.2) were placed on a magnetic
stand for two minutes to capture the beads and the supernatant removed. This
procedure was repeated for all washes.
120 µg of biotinylated antibody was made to 125 µl with 1x ABWB, if not at that
volume, and evaluated at A280 and A354 by UV-Vis on a Nanodrop 1000
spectrophotometer before adding to the bead pellet, along with 125 µL of 2x ABWB.
Beads were resuspended thoroughly and incubated on a rotator disk (Dynal) for
90–120 minutes. Following the coupling reaction, the bead tube was placed on a
magnetic stand for two minutes and the supernatant removed and retained as S1.
The bead pellet was washed twice with 250 µL 1x ABWB and these two
supernatants combined as S2. The total biotinylated protein recovered in the S1 and
S2 was determined by measuring absorbance at 280 nm and 354 nm by
spectrophotometry and used to quantify the amount of biotinylated antibody
successfully coupled to the Streptavidin beads. The coupled biotinylated antibody
was used immediately for crosslinked chromatin immunoprecipitation (xChIP)
(see 2.10.1).

59
2.10 Crosslinked Chromatin Immunoprecipitation (xChIP)
2.10.1 Crosslinked chromatin immunoprecipitation (xChIP)
After removing 10 µg of chromatin for an input sample, correctly sized crosslinked
chromatin (see 2.4.6) was used in a 1:2 ratio with coupled biotinylated antibody,
according to the amount of antibody determined to be coupled to the NanoLink™
Streptavidin beads (see 2.9.3). The required amount of crosslinked chromatin was
added to the components of IP Buffer and made up to 1 mL. This was added to the
biotinylated antibody coupled to Streptavidin beads and thoroughly mixed. It was
incubated on a rotator disk (Dynal) overnight at 4°C.
After incubation, all washes were performed in 1 mL unless stated otherwise. Beads
were incubated on a magnetic stand for two minutes between washes and
supernatants were retained for analysis.
The IP Buffer and chromatin mixture was removed for the Unbound sample and
beads were suspended in ChIP Buffer 1 and mixed thoroughly. Beads were then
washed with ChIP Buffer 2, followed by ChIP Buffer 3 and lastly 1x TE. The Bound
sample was eluted from the beads by two washes of 80 µL fresh Elution Buffer,
shaking the beads for 15 minutes on a platform shaker at room temperature for each
wash and pooling the supernatants together. The beads were discarded. The
concentrations of the Input, Unbound and Bound samples were evaluated by
spectrophotometry and then stored at -20°C.
2.10.2 Purification of bound and input samples
To reverse crosslinks, a final concentration of 0.2 M NaCl was added to the 10 µg
Input samples and the whole Bound samples, before all samples were made up to a
final volume of 200 µl with 10 mM Tris-HCl, pH 8.0 and incubated at 65°C
overnight.

60
All samples were centrifuged at 2000 xg for 1 minute, then 20 µg RNAse A added.
Following this, samples were incubated for 1.5 hours at 37°C. 10 µg Proteinase K
was added, and samples incubated for 2 hours at 45°C.
After reversal of crosslinks and digestion of RNA and protein, Input samples were
purified by PCR Clean-Up Kit (Machery-Nagel), with the following changes to the
protocol; two washes with 600 µl Buffer NT3 and elution of DNA in 20 µl of elution
buffer NE (5 mM Tris-HCl, pH 8.5).
Bound samples were purified using a ChIP DNA Clean & Concentrator Kit (Zymo
Research). The protocol was modified to raise all centrifugation steps to 16,000 xg
for 30 seconds unless stated otherwise, discarding the wash flow-through after each
spin. Briefly, 1 mL of Binding Buffer was added to the Bound samples, mixed well,
and volume split to load into a Zymo-Spin™ Column in two steps, centrifuging
between loadings. Two washes with 200 µl Wash Buffer were performed, then a
dry spin of the column was performed for 1 minute at 16,000 xg to remove residual
Wash Buffer. The column was placed into a fresh tube, 20 µl Elution Buffer (TE, pH
8.5) added and incubated for 1 minute at room temperature before centrifugation
for 1 minute at 16,000 xg to elute DNA. Concentration of DNA was evaluated by
spectrophotometry and stored at -20°C.
2.10.3 ChIP sequencing (ChIP-Seq)
Input and bound samples were diluted with their respective elution buffers to
between 2 ng/µl and 10 ng/µl in 30 µl. They were sent for library preparation and
ChIP-Sequencing (Theragen Etex, South Korea). 40 million 100 bp paired-end reads
were performed using an Illumina HiSeq 2500 system.

61
2.11 Bioinformatic Analysis
After initial quality control of the ChIP sequencing data with FastQC version 0.11.6
(Andrews, 2018), files were trimmed with Trim Galore version 0.6.0 (Krueger, 2019),
utilising Cutadapt version 2.1 (Martin, 2011).
The trimmed sequencing files were then mapped to X. laevis or X. tropicalis indexed
genomes in their respective pairs by Bowtie2 version 2.3.4.1 (Langmead & Salzberg,
2012). Bowtie2 output files were converted into smaller, binary files and unmapped
reads, reads not properly paired, non-unique reads and low-quality reads were
filtered out using SAMtools version 1.7 (Li et al., 2009).
The Plot Fingerprint utility of Deeptools2 version 3.2.1 (Ramírez et al., 2016) was
used to analyse the efficiency of the ChIPs.
The raw sequencing data was also processed through a pipeline of trimming,
mapping with Bowtie2 and filtering by S. Robson (Senior Research Fellow,
Bioinformatics, University of Portsmouth). Genome annotations and respective
genomes in fasta format for X. laevis and X. tropicalis were provided by S. Robson or
obtained from Xenbase.
Peak finding was performed by S. Robson using Model-based Analysis of ChIP-Seq
(MACS) version 2.1.0 (MACS2) (Zhang et al., 2008). Files of called peaks were
converted to BED format and BEDtools version 2.26.0 (Quinlan & Hall, 2010) used
to find peaks which intersected genes by comparison to the GFF format genome
annotation file. DAVID 6.8 (Huang, Sherman, & Lempicki, 2008, 2009) was used to
cross-reference the Entrez ID numbers from the Xenbase annotations. Domain,
families and gene ontology information was found using UniProt (Consortium,
2018) and InterPro version 75.0 (Mitchell et al., 2019).
Using the Deeptools2 BamCompare utility (Ramírez et al., 2016), the ChIP-Seq
bound signals were normalised to the input signal by taking the Log2Ratio,
generating a single sequence that was visualised as an additional track in IGV. BED

62
format files of called peaks were viewed alongside the normalised sequence data,
genome and annotated gene tracks using Integrated Genomics Viewer (IGV)
(Robinson et al., 2011).

63
3 Phylogenetic analysis of histone H1 subtype H1X
3.1 Introduction
The gene encoding H1X, named histone 1 family member X (h1fx), was originally
described in humans (Yamamoto & Horikoshi, 1996). A proposed histone
nomenclature change suggested H1X be renamed H1.10 (Talbert et al., 2012).
However, as H1 subtypes do not always show orthology between species, in this
chapter linker histone H1 variants in Xenopus were described by their annotations
on X. laevis 9.2 and X. tropicalis 9.1 genome browsers (Xenbase).
A protein which shared 50% homology to human H1X was first isolated from sperm
chromatin in X. laevis and identified by mass spectrometry (Shechter et al., 2009).
This protein matched a sequence previously deposited in the NCBI database,
named H1X (h1fx) (Klein et al., 2002) (GI 2746948, updated to GenBank
AAH41758.1). Proteins isolated from X. laevis pro-nuclei, which represent the early
embryo, also included identification of a second protein, described as H1fx-
provisional (NP_001001233.1) (Supplementary Data) (Shechter et al., 2009).
Interestingly, although isolated from X. laevis pro-nuclei, the former accession
number directs one to an X. tropicalis uncharacterized protein LOC407914.
X. tropicalis LOC407914 and X. laevis H1X share 80.95% identity (Figure 3.1).
However, X. tropicalis LOC407914 is not the X. tropicalis H1X reference sequence
held by NCBI (NP_001016699.1), though the two proteins share 52.41% identity
(Figure 3.2).
Therefore, it was first necessary to investigate the current annotations and
sequences of X. laevis and X. tropicalis h1fx genes and clarify the correct H1X proteins
in these species.

64
Figure 3.1 Multiple sequence alignment of X. laevis H1X and X. tropicalis LOC407914
proteins.
High sequence identity (80.95%) was seen between X. laevis H1X and X. tropicalis
LOC407914 protein sequences. Xtr – X. tropicalis, Xla – X. laevis.
Figure 3.2 Multiple sequence alignment of X. tropicalis H1X reference sequence and
LOC407914 protein.
The X. tropicalis H1X reference sequence and LOC407914 shared 52.41% sequence
identity, mostly around the central globular domains of the proteins. Xtr – X. tropicalis.

65
3.2 Identification of h1fx genes in Xenopus
The H1X reference sequences in the NCBI databases were initially compared to the
annotated sequences obtained from Xenopus genome browsers (Xenbase).
The X. laevis reference sequence (NP_001080265.1) was compared to the annotated
h1fx gene (genome browser version 7.1, Xenbase), where a high amount of
discrepancy was found between them, with the annotated gene not identified as an
H1 protein. A BLAST search with the reference sequence identified the correct gene,
Xenbase was notified and the genome browser annotation was corrected.
The X. tropicalis reference sequence (NP_001016699.1) aligned to the annotated h1fx
gene on the respective genome browser with 100% identity and was deemed correct.
However, although the X. tropicalis H1fx-provisional protein LOC407914
(NP_001001233.1) shared around 50% sequence identity with the annotated
X. tropicalis H1X protein, surprisingly it showed 81.04% identity to X. laevis H1X.
Correspondingly, the X. tropicalis H1X protein (NP_001016699.1) showed higher
similarity to a protein identified as X. laevis LOC10019236 than X. laevis H1X (Joshua
Fortriede (Xenbase curator), personal communication).
Alignment of Xenopus H1X protein reference sequences with X. tropicalis
LOC407914 and X. laevis LOC10019236 revealed a striking similarity between these
four proteins (Figure 3.3).
LOC407914 and LOC10019236 have particularly high similarity to the Xenopus H1X
reference sequences around the globular domain. The former proteins were also
predicted to contain a linker histone domain and belong to the H15 linker histone
superfamily, suggesting these may be additional h1fx genes in these species. The
current gene names annotated on the X. laevis 9.2 and X. tropicalis 9.1 genome
browsers (Xenbase) are given along with gene and protein names proposed in this
chapter (Table 3.1).

66
Figure 3.3 Multiple sequence alignment of X. laevis and X. tropicalis H1X protein
reference sequences compared to X. tropicalis LOC407914 and X. laevis LOC10019236.
(A) The globular domain of H1X is highly conserved in all four proteins (black line).
(B) Percentage sequence identity matrix determined by Clustal O 1.2.4. Xtr –
X. tropicalis, Xla – X. laevis.

67
Most interestingly of all, the genes coding LOC100192369 and H1X proteins are
located next to each other in the X. laevis genome (Figure 3.4A). The X. tropicalis
genes coding the proteins LOC407914 and H1X are also next to each other
(Figure 3.4B).
Species Gene Symbol
Protein Name
Proposed
Gene
Name
Proposed
Protein
Name
X. tropicalis h1fx
H1X h1fx.2 H1X.2
X. tropicalis MGC69473
Uncharacterized
protein
LOC407914
h1fx.1 H1X.1
X. laevis h1fx.S
H1X h1fx.1.S H1X.1
X. laevis LOC100192369
Sperm-specific
nuclear basic
protein 1
h1fx.2.S H1X.2
Table 3.1. h1fx gene annotations.
The current annotations of X. tropicalis and X. laevis h1fx genes and the proteins they
encode, alongside the names proposed in this chapter.
Figure 3.4 Schematic of the h1fx loci in the X. laevis and X. tropicalis genomes.Table
3.1. h1fx gene annotations.
The current annotations of X. tropicalis and X. laevis h1fx genes and the proteins they
encode, alongside the names proposed in this chapter.
Figure 3.4 Schematic of the h1fx loci in the X. laevis and X. tropicalis genomes.
(A) X. laevis only have a single copy of the complete h1fx locus on the S sub-genome,
though chromosome 4S shared other genes with chromosome 4L. The gene encoding
the LOC100192369 protein (blue) neighbours the h1fx gene (green). (B) X. tropicalis
chromosome 04 shares genes with X. laevis chromosomes 4S and 4L. The gene encoding
X. tropicalis protein LOC407914 (blue) is next to the h1fx gene (green). The loci range
shown for African clawed frog (X. laevis) are Chr 4S:129088001-132261000 (3.17 Mb) and
Chr 4L:129084001-132272000 (3.19 Mb), and Western clawed frog (X. tropicalis) Chr
04:124000201-126407200 (2.41 Mb). Non-coding and RNA genes are omitted for clarity.
Figure 3.5 Alignment of X. laevis SP1/SP2 sequence, X. laevis H1X.2 and X. tropicalis
H1X.1.Figure 3.4 Schematic of the h1fx loci in the X. laevis and X. tropicalis
genomes.Table 3.1. h1fx gene annotations.
The current annotations of X. tropicalis and X. laevis h1fx genes and the proteins they
encode, alongside the names proposed in this chapter.
Figure 3.4 Schematic of the h1fx loci in the X. laevis and X. tropicalis genomes.Table
3.1. h1fx gene annotations.
The current annotations of X. tropicalis and X. laevis h1fx genes and the proteins they
encode, alongside the names proposed in this chapter.
Figure 3.4 Schematic of the h1fx loci in the X. laevis and X. tropicalis genomes.

68
Fig
ure
3.4
Sch
emat
ic o
f th
e h
1fx
loci
in
th
e X
. la
evis
an
d X
. tro
pic
ali
s g
eno
mes
.
(A)
X. l
aevi
s o
nly
hav
e a
sin
gle
co
py
of
the
com
ple
te h
1fx
locu
s o
n t
he
S s
ub
-gen
om
e, t
ho
ug
h c
hro
mo
som
e 4S
sh
ared
oth
er g
enes
wit
h c
hro
mo
som
e
4L.
Th
e g
ene
enco
din
g t
he
LO
C10
0192
369
pro
tein
(b
lue)
nei
gh
bo
urs
th
e h1
fx g
ene
(gre
en).
(B
) X
. tro
pica
lis
chro
mo
som
e 04
sh
ares
gen
es w
ith
X. l
aevi
s ch
rom
oso
mes
4S
an
d 4
L.
Th
e g
ene
enco
din
g X
. tro
pica
lis
pro
tein
LO
C40
7914
(b
lue)
is
nex
t to
th
e h1
fx g
ene
(gre
en).
Th
e lo
ci r
ang
e sh
ow
n
for
X.
laev
is a
re C
hr
4S:1
2908
8001
-132
2610
00 (
3.17
Mb
) an
d C
hr
4L:1
2908
400
1-13
2272
000
(3.1
9 M
b);
ran
ge
for
X.
trop
ical
is i
s C
hr
04:1
2400
0201
-
1264
0720
0 (2
.41
Mb
). N
on
-co
din
g a
nd
RN
A g
enes
are
om
itte
d f
or
clar
ity
.

69
X. laevis is allotetraploid, containing two sub-genomes, long (L) and short (S) and
so potentially has four copies of each gene. Not all copies of each gene may function
to code proteins, or conversely, they may code proteins with slight differences in
amino acid residues. The h1fx.S gene however appeared to lack a counterpart on
the L sub-genome, despite the L sub-genome conserving other genes at the h1fx.S
locus such as gata2, rpn1, rab7a, h2afj and copg1 and slc26a6 (Figure 3.4A). To be
certain, the coding sequence of the gene between rab7a.L and h2a.L, named
Xelaev18024001m.g, was translated. It showed only 20.51% and 25.64% sequence
identities to X. laevis H1X.1 and H1X.2 respectively (not shown) and did not identify
as a histone protein during BLAST searches. In addition, tBLASTn searches on
Xenbase with the globular domain of X. laevis H1X.1 protein also failed to find
evidence of a h1fx gene within the L sub-genome. Though a h1fx gene was absent,
X. laevis chromosome 4L showed genes around that locus in common with the
X. tropicalis h1fx loci that were absent from X. laevis chromosome 4S, such as hmces,
and more distant genes in the loci such as kbtbd12, wdr6, dalrd3 and ndurfaf3.
Since the entire h1fx.S loci is only present once in the X. laevis genome, this suggests
that there are only two H1X genes in this species, not four, and that h1fx genes are
tandemly located in X. laevis and X. tropicalis.
However, even though the LOC100192369 protein appears very similar to H1X, as
of X. laevis genome 9.2 it is described as sperm-specific nuclear basic protein 1.
3.2.1 Relationship between H1X and sperm-specific nuclear basic proteins
Sperm-specific nuclear basic proteins (SNBPs) associate with sperm chromatin and
can be broadly separated into three classes, one of which are the protamine-like (PL)
type proteins (Ausio, 1999). The globular domain of PL-type proteins shares some
similarity with the globular domain of linker histones, with additional evidence
indicating that genes coding SNBPs may share a common ancestor with linker
histone genes (Eirín-López, Lewis, Howe, & Ausió, 2006; Eirín-López, Frehlick, &
Ausió, 2006; Lewis et al., 2004).

70
The characterisation of the LOC100192369 gene as SNBP-1 (GenBank EF679788.1)
arose in a study to determine the full amino acid sequence of proteins predicted as
X. laevis sperm proteins 1 and 2 (SP1/SP2). PCR primers were designed using
existing partial sequence information and X. laevis h1fx; amplified cDNA was
cloned, sequenced and the translated protein designated as SP1/SP2 (Frehlick,
Prado, Calestagne-Morelli, & Ausió, 2007). This protein has 100% sequence identity
to LOC100192369, provisionally named X. laevis H1X.2 in this chapter.
Circular dichroism (CD) spectroscopy analysis of SP2 to determine the secondary
structure found similarities to linker histone H5; SP2 had 31.8% alpha helical
content, compared to 20% for H5, in contrast to alpha-helical contents of 15% for
SP3, SP4 and SP5 and 26% for SP6 (Frehlick et al., 2007). In common with H1 linker
histones, a trypsin-resistant winged helix was present in the secondary structure
and due to this, SP2 was placed as a member of the histone H1-related PL-1 family
(Frehlick et al., 2007). However, although the structure and binding affinity for
nucleosomes of SP1/SP2 was compared to H5, it showed the highest similarity to
H1X out of all H1 subtypes, and ran closer to H1 histones than the other sperm-
proteins on AUT-PAGE (Frehlick et al., 2007). Since SP2 shared more identity with
H1X, it would have been interesting to compare these two proteins to each other.
It had been previously suggested that SP2 was processed from a precursor, SP1,
which undergoes N-terminal cleavage at the SPAA*ASP residues to produce SP2
(Frehlick et al., 2007). The sequence sharing the highest identity to X. laevis SP1/SP2
is the protein currently annotated as X. tropicalis H1X (H1X.1).
However, X. tropicalis H1X.1 is missing the suggested SPAA*ASP cleavage site
(Figure 3.5). Additionally, it has been reported that X. tropicalis do not possess SP3
to SP6 (Frehlick et al., 2007).
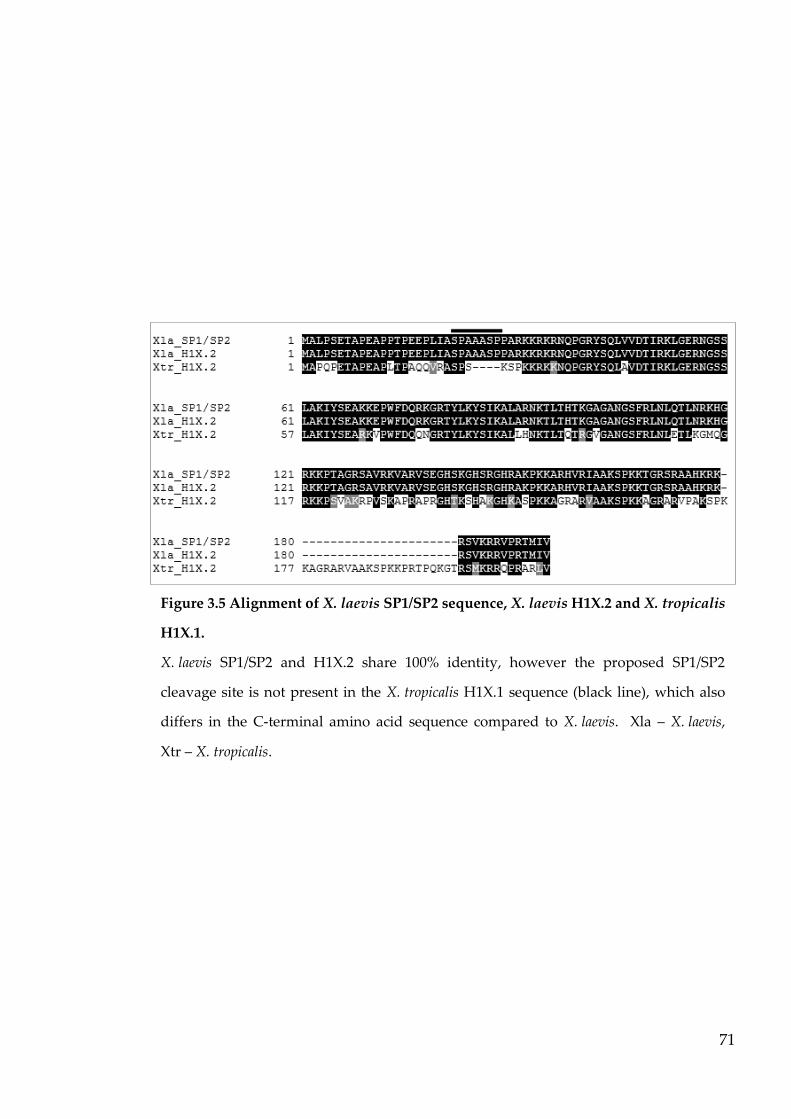
71
Figure 3.5 Alignment of X. laevis SP1/SP2 sequence, X. laevis H1X.2 and X. tropicalis
H1X.1.
X. laevis SP1/SP2 and H1X.2 share 100% identity, however the proposed SP1/SP2
cleavage site is not present in the X. tropicalis H1X.1 sequence (black line), which also
differs in the C-terminal amino acid sequence compared to X. laevis. Xla – X. laevis,
Xtr – X. tropicalis.

72
Lastly, the composition of SP1/SP2 (H1X.2) was analysed and the higher arginine
and lower lysine content than other H1 linker histones used as evidence that
SP1/SP2 belonged in the PL-type family, as SNBPs are generally arginine-rich
(Ausio, 1999; Frehlick et al., 2007). SP2 was composed of 15.6% both arginine and
lysine, while H1X (H1X.1) comprised 4.1% arginine and 21.2% lysine (Frehlick et al.,
2007). However, the former analysis was only of the X. laevis SP2 cleaved from SP1;
analysis of the full-length sequence revealed equal proportions of lysine and
arginine, both comprising 13.5% of the protein (Figure 3.6). Comparing the
proportion of lysine and arginine in H1X proteins of various species (Figure 3.6)
reveals that the ratios are variable between species; for example, zebrafish H1X is
very lysine-rich (30%) while elephant shark H1X is composed of a slightly higher
percentage of arginine than lysine.
Since PL-type sperm proteins and linker histones are likely to have a common
ancestor (Eirín-López, Lewis, Howe, & Ausió, 2006; Eirín-López, Frehlick, & Ausió,
2006; Lewis et al., 2004), it may be that rather than encoding a SNBP, the gene
annotated LOC100192369 actually encodes an undescribed linker histone variant
(H1X.2). H1X has been suggested to support sperm chromatin condensation
(Shechter et al., 2009), which may indicate a closer relationship of H1X with sperm-
specific proteins than other histone variants.
73
Figure 3.6 Comparison of lysine and arginine residues in H1X proteins across species.
The percentages of lysine and arginine residues comprising H1X proteins from various
species were individually determined using ProtParam (Gasteiger et al., 2005) on the
ExPASy server (Gasteiger et al., 2003). The plot is ordered by percentage of lysine. The
proportions of lysine and arginine residues comprising each H1X protein from a range
of species were generally richer in lysine, except for elephant shark H1X; higher in
arginine, and X. laevis H1X.2; containing equal percentages of arginine and lysine
residues.

74
3.2.2 Other linker histones genes in Xenopus
The other somatic histone expressed independently of replication is the
differentiation-specific H1.0. Histone 1 family member 0 (h1f0) genes from the L
and S sub-genomes of X. laevis both code for a protein functioning as the
differentiation-specific subtype H1.0, though the protein sequences have slight
differences in residues (Figure 3.7).
To investigate whether h1f0 and h1fx could be ohnologs, that is, multiple
duplications of an original gene, arising from whole genome duplication, the ten
closest neighbouring genes in each direction from h1f0 were checked for synteny
with the h1fx loci (Figure 3.8).
Figure 3.7 Multiple sequence alignment of X. laevis H1.0 proteins.
(A) H1.0 proteins encoded by genes on the L and S sub-genomes show very high
similarity. (B) Percentage sequence identity matrix of X. laevis H1.0 proteins compared
to human H1.0.
75
Fig
ure
3.8
Sch
emat
ic o
f th
e h
1f0
gen
e lo
ci i
n X
. la
evis
an
d X
. tro
pic
ali
s.
(A)
Th
e X
. lae
vis
h1f0
gen
e ap
pea
red
on
bo
th s
ub
-gen
om
es, o
n c
hro
mo
som
es 4
S a
nd
4L
(g
reen
), w
hic
h a
lso
sh
ared
sim
ilar
su
rro
un
din
g g
enes
(bo
ld t
ext)
. (B
) T
he
X. t
ropi
cali
s h1
f0 (
gre
en)
gen
e lo
ci s
ho
wed
sim
ilar
ity
to
bo
th X
. lae
vis
chro
mo
som
es

76
Although not sharing synteny, the X. laevis h1f0.S gene appears on the same
chromosome as h1fx, with oocyte-specific histone 1 h1foo (B4) between them, all on
chromosome 4S. The latter gene is annotated on both sub-genomes as h1foo.L and
h1foo.S. Despite the absence of a h1fx gene on L sub-genome, h1f0 and h1foo both
have homologs on chromosome 4L. Similarly, the h1foo gene in X. tropicalis is also
between h1f0 and h1fx, on chromosome 04.
Data was not available for accurate comparison of other somatic H1 variant genes;
H1B encoding genes were only annotated on the L sub-genome, with many
surrounding genes undescribed and H1d (H1A) and H1C were not annotated. The
H1d (H1A) and H1B somatic H1 variants in X. tropicalis shared no synteny with
h1fx, and H1C was also not annotated on the genome browser for this species.
The X. laevis histone variant annotated as Hist1H1t or H1B-like was found only on
chromosome 5L, where it appeared to be clustered with other histone genes. In
X. tropicalis, Hist1H1t was annotated as such on two different chromosomes,
chromosome 02 and chromosome 09. Hist1H1t is also described as Histone H1B-
like. Despite the name of Xenopus H1t seeming to correspond to mammal testis-
specific H1t, the proteins are not orthologs and the former is not described on gene
pages as testis-specific. Previous phylogenetic analysis showed Xenopus H1t
clustering with mammalian somatic histones H1.1-H1.5 (Talbert et al., 2012).
Characterising and analysing the function of h1fx genes requires establishing
relationships with the h1fx genes of other species and the arrangement of said genes.
It was therefore timely to conduct phylogenetic studies to explore firstly whether
h1fx genes across species were orthologues and secondly, if any other species had
multiple h1fx genes. The following analysis was focused on identifying h1fx genes
in representative species as well as analysing synteny to identify whether h1fx genes
were orthologues between species. An additional aim was a brief analysis of the
77
relationship between H1X and other histone H1 subtypes in selected species by
constructing a phylogenetic tree.
3.3 Identification of h1fx genes in representative species
A schematic of the evolutionary relationships of chordates was referenced (Figure
3.9) to select representative species with available genome sequencing data
(Appendix A, Table A-1). As two h1fx genes appear in Xenopus, other members of
the order Anura with a sequenced genome were included, as was coelacanth, which
was noted to contain two h1fx genes in tandem, (Joshua Fortriede, personal
communication) and has an annotated genome sequence available on Ensembl.
To be certain the H1X protein was specific to vertebrates (Talbert et al., 2012), it was
searched for in a selection of invertebrates with sequenced genomes. Invertebrates
searched included sea squirts, Ciona intestinalis and Ciona savignyi; common fruit fly,
Drosophila melanogaster; purple sea urchin, Strongylocentrotus purpuratus; a
nematode worm, Caenorhabditis elegans and the common house spider, Parasteatoda
tepidariorum. H1X protein sequences were not found in these invertebrates,
although H1 proteins similar to other vertebrate linker histone subtypes were
found.
A C. elegans protein named Histone H1-like protein 1 (HIL-1) has also been
described as H1.X, with a period (UniProtKB Q18336). However, Wormbase
classified the hil-1 gene as an ortholog of human h1f0 (H1.0). For clarity, alignments
of HIL-1 protein with human histone H1 proteins were performed and the region
around the hil-1 gene analysed for synteny, which confirmed that HIL-1 was not an
orthologue of H1X and showed the highest identity (42%) to human H1.0 (not
shown). Seven other HIL proteins in C. elegans were briefly checked and showed
less than 42% identity to human H1 subtypes including H1oo, H1.0 and H1.2.
For thoroughness, the inferred taxonomic distribution of H1X was viewed on the
Histone Variant Database 2.0 (Draizen et al., 2016). It indicated that there was an
78
invertebrate with H1X, Caligus rogercresseyi, an arthropod commonly known as a
sea louse. The sequence was obtained (ACO10502.1) and found to align with
human H1X. ACO10502.1 was deposited at NCBI in 2009; in 2015 two of the authors
involved deposited whole genome shotgun sequencing of male and female
C. rogercresseyi (GCA_001005385.1). Performing tblastn with the ACO10502.1
protein against these WGS assemblies did not find a match, nor any evidence of a
H1X protein; the only hit was for a protein that was identified by blast as H1.0. This
indicates the protein reference ACO10502.1 is an erroneous record. Protein blast
with the ACO10502.1 sequence returned both 100% identity and 100% query
coverage to salmon H1X (XP_013988287.1).

79
Figure 3.9 Schematic of the chordate lineage of the evolutionary tree.
A schematic was constructed to provide a visual guide of chordate evolutionary
relationships, using the phylum Chordata as a root. Branch lengths are unscaled.
Scientific names are given in italic. (Adapted from the tree of life explorer at
http://www.onezoom.org/ (Rosindell & Harmon, 2012).

80

81
3.3.1 Tandem h1fX genes in other species
The Tibetan frog and cane toad genomes were found to contain two h1fx genes,
likely in tandem. This suggests that tandem h1fx genes are not unique to Xenopus
species.
Coelacanths were also the only other species investigated to have tandem h1fx
genes. They were, however, not the only fish to have two h1fx genes, as in the case
of Asian bonytongue. However, the Asian bonytongue h1fx genes are not on the
same chromosome as each other so cannot be in tandem.
In species with multiple h1fx genes, the h1fx gene closest to rab7a was denoted h1fx.1,
and the h1fx gene closest to h2a named h1fx.2. The encoded proteins were identified
as H1X.1 or H1X.2 respectively. The two h1fx genes of Asian bonytongue both
neighbour rab7a but are on different assemblies. Only one however contains rpn1
in the same locus, and this was denoted H1X.1 (assembly KV410824.1), with the
other named H1X.2 (assembly KV411132.1). Recent assembly to chromosome level
placed H1X.1 on chromosome 22 (Gene ID: 108923334) and H1X.2 on chromosome
2 (Gene ID: 108936969).
3.3.2 Analysis of synteny around h1fx genes
Synteny is important to identify orthologues. Analysis of synteny involves
investigating the genes in the same locus as the gene of interest and comparing the
level of conservation between species.
It was found that the h1fx gene was often surrounded by similar genes in several
species (Figure 3.10), providing strong evidence for the h1fx genes in these species
to be orthologues.
Exploration of the genes in the h1fx loci of species representing different
evolutionary groups predicted that the archetypical h1fx locus of bony jawed
vertebrates contained the genes gata2, rpn1, rab7a, and h2a at the least, as all appear
in the elephant shark, ray-finned fish and tetrapod h1fx loci within the ten

82
neighbouring genes either side. The positions of rpn1, rab7a, h1fx and h2a relative
to each other are also mostly conserved, except in the human h1fx locus. Analysis
of the differences in synteny shows evidence of chromosomal rearrangement; hmces,
copg1 and col7a1 genes are further from h1fx in elephant sharks but are amongst the
closest genes to h1fx in bony vertebrates (Figures 3.10 - 3.11). The positions of some
genes found further from h1fx are also different between elephant sharks and
tetrapod species, though they share more synteny with genes further from h1fx such
as plxna, chchd6, trpa1, mcm2, pox12, abtb1, mgll, kbtbd12, sec61a1 ruvbl1 and eefsec
(Figures 3.10 - 3.11) than ray-finned fish do with either group.

83
Figure 3.10 Schematic of gene locations across chromosomes or scaffolds containing
the h1fx gene to analyse synteny.
Schematics of chromosomes and scaffolds were aligned according to the h1fx gene
position and species ordered by taxonomy. Syntenic genes were colour-coded if they
were shared between three or more species, with other coding genes that did not show
significant synteny between multiple species coloured light grey to preserve areas
where syntenic genes were not consecutive. Flags point in the direction of gene
transcription according to the database record and rectangles without flags indicate
where a gene was deduced from genomic sequence and not genome annotation. RNA
genes, non-coding genes, unprocessed transcripts and pseudogenes were omitted for
clarity. Asterisk denotes a common wall lizard gene annotated as COPG1-like. Gene
encoding human oocyte-specific H1 is marked h1foo. Thick black bars indicate the end
of data.

84

85
Fig
ure
3.1
1 E
xten
ded
h1f
x lo
cus
for
syn
ten
y a
nal
ysi
s.
An
ex
ten
ded
sch
emat
ic o
f th
e h1
fx l
ocu
s o
f m
ult
iple
sp
ecie
s sh
ow
ed t
hat
th
e hm
ces,
cop
g1 a
nd
col
7a1
gen
es, w
hic
h a
pp
ear
nea
rer
the
h1fx
gen
es
in o
ther
sp
ecie
s d
o a
pp
ear
in e
lep
han
t sh
ark
. M
ult
iple
oth
er g
enes
are
als
o c
on
serv
ed
bet
wee
n s
pec
ies,
th
ou
gh
in
dif
fere
nt
arra
ng
emen
ts.
Th
e re
gio
n c
ov
ered
in
Fig
ure
3.1
0 is
co
nd
ense
d (
red
bo
x).
T
he
com
mo
n-w
all
liza
rd s
ho
wed
tw
o n
etri
n–l
ike
gen
es n
ext
to e
ach
oth
er,
rep
rese
nte
d a
s a
sin
gle
gen
e o
n t
he
sch
emat
ic.
Th
ou
gh
ad
dit
ion
al e
xo
ns
wer
e p
red
icte
d f
or
on
e g
ene,
th
e co
ded
pro
tein
s b
oth
ali
gn
wit
h
99.4
% i
den
tity
. A
ster
isk
den
ote
s el
eph
ant
shar
k c
ol7a
1-li
ke g
ene.

86
The incomplete sea lamprey genome sequence meant this species could not be
analysed for synteny. However, genes that appeared near h1fx in other species were
not found in the same locus as each other in the sea lamprey genome. In a similar
situation, rab7a, rpn1, gata2 and h2a genes were each found in different locations in
the hagfish genome. Unable to be found were hmces, copq1 and col7a genes, all of
which indicated the loss of h1fx locus synteny in hagfish and perhaps in both extant
jawless vertebrates.
The gene order of the elephant shark h1fx locus was well conserved in coelacanth
and tetrapod species (Sarcopterygii), though with gene insertions separating gata2
and rpn1, and rpn1 and rab7a. A break between the gata2 gene and the rest of the
conserved h1fx locus is seen also in coelacanth, Tibetan frog, both Xenopus species,
both lizard species and tuatara. This may extend to squamates in general, however
gata2 could not be ascertained to be within the h1fx locus in Burmese python due to
the genome annotation level of the latter.
The h1fx gene of the spotted gar was found by translating the genomic sequence
that aligned to vertebrate h1fx orthologs but has since been annotated on the
genome (XP_006631252.1). Out of the three species of ray-finned fish investigated,
the spotted gar h1fx locus contains genes similar to the h1fx locus of sarcopterygians.
Zebrafish have two gata2 paralogs named gata2a and gata2b (Gillis, St John,
Bowerman, & Schneider, 2009). The gata2 gene in the same locus as h1fx is gata2b.
The gata2a gene was found on a different chromosome, chromosome 11, in the same
locus as the rpn1 gene. The genome of zebrafish around h1fx showed the most
synteny with the other teleost fish in this investigation, Asian bonytongue (Figure
3.9); additionally, these fish did not have h2a present near h1fx. The two h1fx loci of
Asian bonytongue share a small degree of synteny; gata2 and rab7a genes are near
the h1fx genes on both chromosomes, while rpn1 gene appears on KV410824.1, or
chromosome 22, only.

87
The coelacanth h1fx locus showed a high amount of synteny with tetrapods,
particularly with sauropsids such as painted turtles, lizards and tuatara. However,
with two h1fx genes in tandem the coelacanth had the most synteny with anuran
amphibians, particularly Xenopus species.
Of the few genes that were found by browsing the h1fx locus of axolotl (ambMex
3.0.0) and searching WGS data (GenBank: PGSH00000000.1), almost all were well-
conserved with other species. Other genes commonly found in the same locus as
h1fx were not found on similar contigs or in regions of the browsed genome. Unlike
their relatives the anuran amphibians, no evidence of additional h1fx genes were
found in the axolotl genome.
Unfortunately, due to lower genome annotation levels, the Tibetan frog and cane
toad h1fx loci could not be compared to the same standard as Xenopus. However, a
high amount of conservation of the loci containing tandem h1fx genes was seen
between all four anurans included in the analysis. Using WGS data, cane toad genes
identified on the same contig as h1fx were h2a, rab7a, rpn1 and hmces. Although
copg1, col7a1, gata2, slc26a6 and uqcrc1 genes were found, they were each assembled
on different contigs (Appendix A, Table A-3). Other discrepancies in cane toad
found were a prediction of two Rab7a protein sequences which both aligned to
X. tropicalis Rab7a (Appendix A, Table A-4), as well as isoforms of other genes
which appeared in the h1fx locus in other species on a different contigs, such as h2a,
hmces and col7a1. Copg1 proteins were encoded on two contigs; contig 1292 Copg1
was longer, however the end of the protein aligned well to contig 6796 Copg1.
Alignment of the two contigs 1292 and 6796 revealed they shared 40% coverage and
97.13% identity, so they may be partially duplicated entries. However, further
genome assembly and annotation, which is outside the scope of this analysis, is
needed for clarification.
As shown by Figure 3.4A, the Xenopus h1fx locus on chromosome 4S shared genes
with chromosome 4L despite the absence of a h1fx gene on the latter. However,

88
chromosome 4L contained genes that would be expected in the h1fx locus, such as
slc26a6 and hmces. Although X. tropicalis had a high amount of synteny with
X. laevis, due to this the former shared more genes in the h1fx locus with coelacanth.
A high amount of synteny was seen between sauropsids, but with some exceptions;
chicken did not have the col7a1 gene in the locus and dnajb8 was not found in the
python locus, though it may be that this is present but not sequenced. Some
sauropsids also showed unique insertions of different genes into the h1fx locus; for
example, Burmese python between col7a1 and slc26a6 and painted turtle between
copg1 and col7a1.
The anole lizard genome was found to have rab7a and h2a in the same locus; genes
which typically flank h1fx in other species. Scrutiny of the sequence track revealed
there was a gap in the sequence data between rab7a and h2a, where h1fx would be
expected. Supporting the presence of h1fx within this missing data, the recently
sequenced common wall lizard Podarcis muralis, a squamate like the anole lizard,
shared synteny with the anole lizard locus and had the h1fx gene annotated on the
genome (Figure 3.10), as did a third squamate, the Burmese python.
Syntenic genes were also found in the tuatara genome, including h1fx, which was
annotated as a pseudogene on the primary assembly (QEPC01000381.1, Ensembl
96) and was also predicted from Tuatara WGS.
The platypus h1fx locus shared a similar arrangement of genes closer to h1fx in the
locus with lizards and snakes compared to other mammals (Figure 3.10), however
showed loss of synteny further from the h1fx gene (Figure 3.11). Platypus belong to
a group of egg-laying mammals known as monotremes; the only other extant
members are echidna.
Due to the lack of genome annotation and sequence information, synteny of the
wallaby genome was unable to be analysed; there were no gene predictions
surrounding h1fx and the assembly had many gaps. The opossum genome replaced
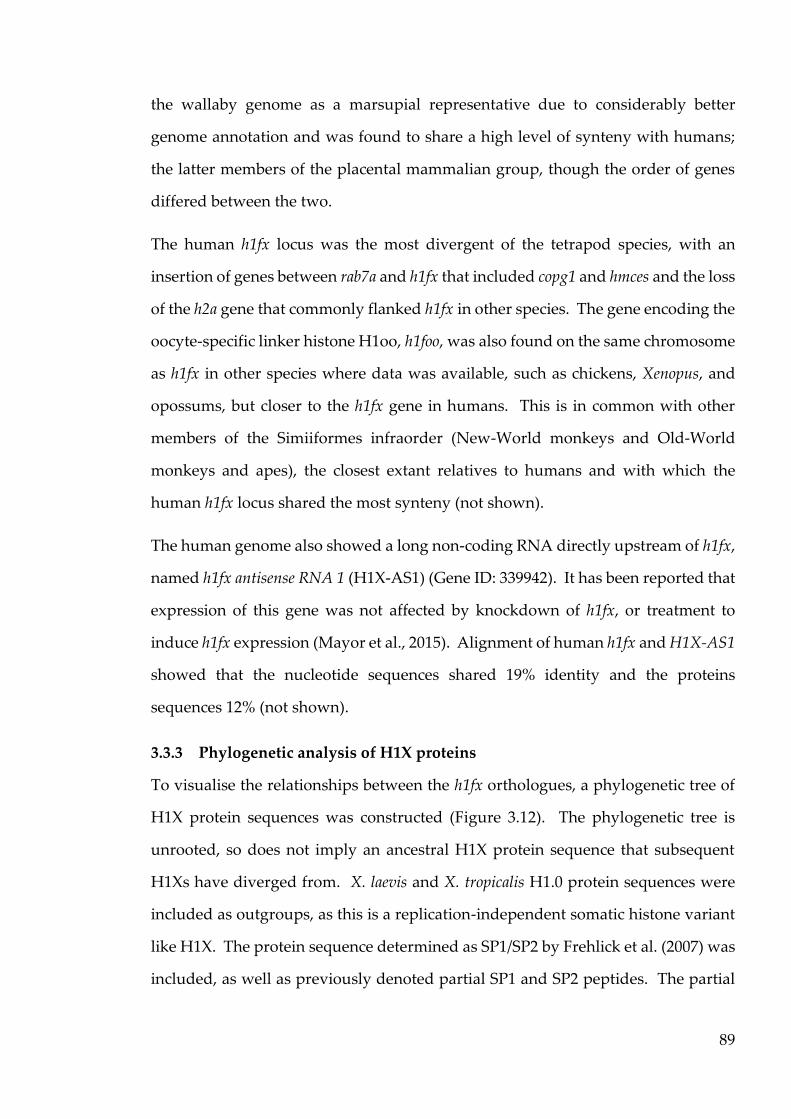
89
the wallaby genome as a marsupial representative due to considerably better
genome annotation and was found to share a high level of synteny with humans;
the latter members of the placental mammalian group, though the order of genes
differed between the two.
The human h1fx locus was the most divergent of the tetrapod species, with an
insertion of genes between rab7a and h1fx that included copg1 and hmces and the loss
of the h2a gene that commonly flanked h1fx in other species. The gene encoding the
oocyte-specific linker histone H1oo, h1foo, was also found on the same chromosome
as h1fx in other species where data was available, such as chickens, Xenopus, and
opossums, but closer to the h1fx gene in humans. This is in common with other
members of the Simiiformes infraorder (New-World monkeys and Old-World
monkeys and apes), the closest extant relatives to humans and with which the
human h1fx locus shared the most synteny (not shown).
The human genome also showed a long non-coding RNA directly upstream of h1fx,
named h1fx antisense RNA 1 (H1X-AS1) (Gene ID: 339942). It has been reported that
expression of this gene was not affected by knockdown of h1fx, or treatment to
induce h1fx expression (Mayor et al., 2015). Alignment of human h1fx and H1X-AS1
showed that the nucleotide sequences shared 19% identity and the proteins
sequences 12% (not shown).
3.3.3 Phylogenetic analysis of H1X proteins
To visualise the relationships between the h1fx orthologues, a phylogenetic tree of
H1X protein sequences was constructed (Figure 3.12). The phylogenetic tree is
unrooted, so does not imply an ancestral H1X protein sequence that subsequent
H1Xs have diverged from. X. laevis and X. tropicalis H1.0 protein sequences were
included as outgroups, as this is a replication-independent somatic histone variant
like H1X. The protein sequence determined as SP1/SP2 by Frehlick et al. (2007) was
included, as well as previously denoted partial SP1 and SP2 peptides. The partial

90
sequences of X. laevis SP3, SP4, SP5 and SP6 were also included, in order to visualise
the relationship to H1X proteins.
H1X protein sequences generally clustered into the taxonomic groups of organisms
with some exceptions (Figure 3.12). Both jawless fish hagfish and lamprey formed
a monophyletic clade, however it was unable to be confirmed if the h1fx genes of
hagfish and lamprey were orthologs as synteny analysis was limited by the genome
annotation level.
The H1X proteins of all amniote species clustered together, as did ray-finned fish.
Within the ray-finned fish group, spotted gar H1X was shown to diverge from the
lineage leading to Asian bonytongue, while zebrafish branched off before from
both.
Anuran H1X proteins were generally placed either branching from other anuran
H1X proteins or in clusters with other anuran H1X proteins. This was not reflected
between amphibians in general, as axolotl H1X was placed on the lineage to
coelacanth and elephant shark.
The H1X.1 and H1X.2 proteins of non-anuran species with two h1fx genes, such as
Asian bonytongue and coelacanth, formed monophyletic clades with each other.
Ultrafast Bootstrap (UFBoot) support values of ≥95% for branches represent a ≥95%
probability that the clade is true. A rooted tree with UFBoot supports (Figure 3.13)
showed that only five of the branches had UFBoot values of ≥95%. These branches
were; clusters of the Xenopus H1.0 proteins, a clade including all of the H1X and
SP3-SP6 proteins separate from H1.0, a clade comprised of X. laevis SP3-SP6 proteins
and a cluster of X. laevis H1X.2 and SP1/SP2 proteins. The cluster of X. laevis H1X.2
with the SP1/SP2 protein sequence also included the SP1 and SP2 partial sequences,
which formed a clade with each other. The cluster of SP3-SP6 partial sequences was
placed branching from a node shared by X. tropicalis H1X.2, with a higher-level
node branching from the clade of X. laevis H1X.2 and SP1/SP2 sequence. However,

91
many of the internal branches of the phylogenetic tree were below the UFBoot
threshold, indicating lower accuracy.
Branches with low UFBoot values included the axolotl H1X, which was indicated to
branch from the lineage leading to elephant shark and then coelacanth. Low
internal branch supports were within amniotes; although marsupial H1X proteins
formed in a clade, as did lepidosaurs, the H1X proteins from chicken and human (a
bird and a mammal) also formed a clade.

92
Figure 3.12 Unrooted consensus tree of H1X protein sequences from multiple species.
Scale bar indicates the number of nucleotide substitutions per codon site, used to
determine branch length. Branches were coloured by taxonomic groups of species
according to the key. The two partial sequences sperm-specific basic nuclear protein 1
(SP1) (Genbank AAB31070.1) and sperm-specific basic nuclear protein 2 (SP2) (Genbank
AAB31071.1) and the full SP1/SP2 protein sequence deduced by Frehlick et al. (2007)
(asterisk) were included, as well as the partial sequences of X. laevis sperm-specific
nuclear basic proteins SP3 (Genbank AAB31072.1), SP4 (Genbank NP_001081230.1), SP5
(Genbank AAB31069.1) and SP6 (Genbank AAB31074.1).

93

94
Figure 3.13 Phylogenetic tree of H1X proteins from species representing multiple
taxonomic groups.
The phylogenetic tree is unrooted though Xenopus H1.0 proteins are drawn at root.
Branch lengths are optimized by maximum likelihood on original alignment. Numbers
denote Ultrafast Bootstrap (UFBoot) support values, where ≥95% support represents
95% probability that the clade is true. Branches with UFBoot values ≥95% are coloured
black, while other branches are grey.
95
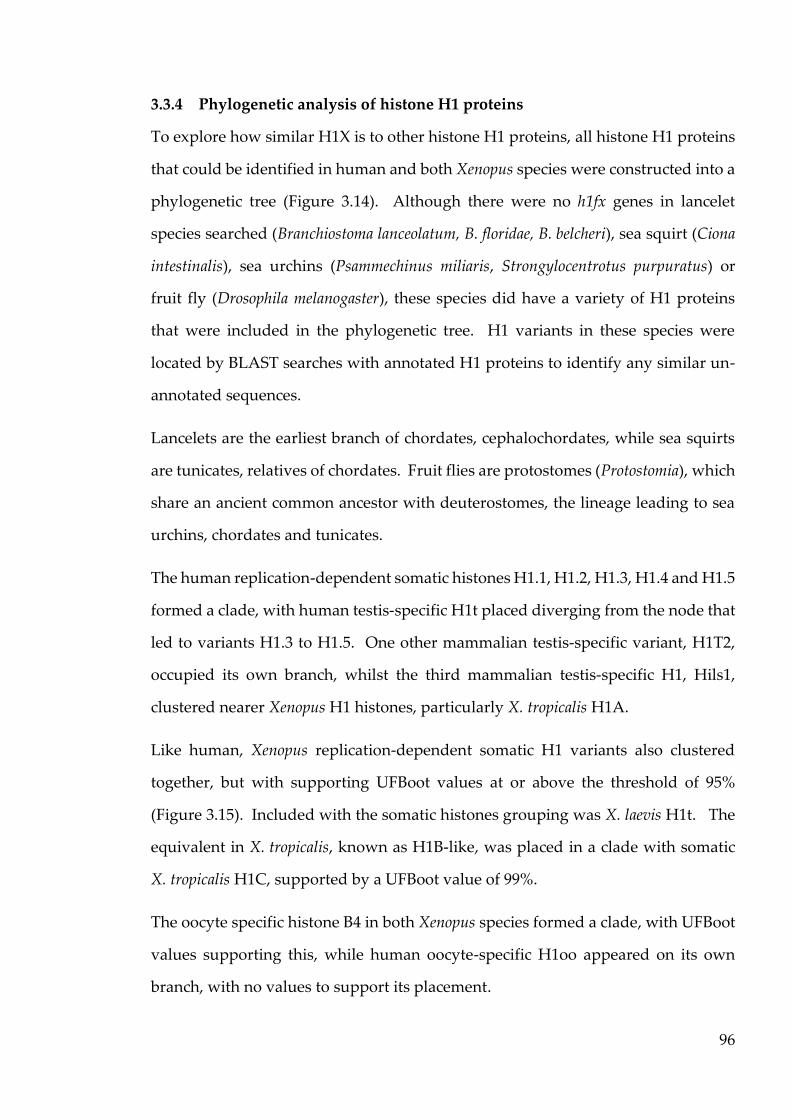
96
3.3.4 Phylogenetic analysis of histone H1 proteins
To explore how similar H1X is to other histone H1 proteins, all histone H1 proteins
that could be identified in human and both Xenopus species were constructed into a
phylogenetic tree (Figure 3.14). Although there were no h1fx genes in lancelet
species searched (Branchiostoma lanceolatum, B. floridae, B. belcheri), sea squirt (Ciona
intestinalis), sea urchins (Psammechinus miliaris, Strongylocentrotus purpuratus) or
fruit fly (Drosophila melanogaster), these species did have a variety of H1 proteins
that were included in the phylogenetic tree. H1 variants in these species were
located by BLAST searches with annotated H1 proteins to identify any similar un-
annotated sequences.
Lancelets are the earliest branch of chordates, cephalochordates, while sea squirts
are tunicates, relatives of chordates. Fruit flies are protostomes (Protostomia), which
share an ancient common ancestor with deuterostomes, the lineage leading to sea
urchins, chordates and tunicates.
The human replication-dependent somatic histones H1.1, H1.2, H1.3, H1.4 and H1.5
formed a clade, with human testis-specific H1t placed diverging from the node that
led to variants H1.3 to H1.5. One other mammalian testis-specific variant, H1T2,
occupied its own branch, whilst the third mammalian testis-specific H1, Hils1,
clustered nearer Xenopus H1 histones, particularly X. tropicalis H1A.
Like human, Xenopus replication-dependent somatic H1 variants also clustered
together, but with supporting UFBoot values at or above the threshold of 95%
(Figure 3.15). Included with the somatic histones grouping was X. laevis H1t. The
equivalent in X. tropicalis, known as H1B-like, was placed in a clade with somatic
X. tropicalis H1C, supported by a UFBoot value of 99%.
The oocyte specific histone B4 in both Xenopus species formed a clade, with UFBoot
values supporting this, while human oocyte-specific H1oo appeared on its own
branch, with no values to support its placement.

97
Clades comprising of human and Xenopus H1 variants formed between H1X
proteins, with X. laevis H1X.1 at the same node as X. tropicalis H1X.1. Xenopus H1X.2
proteins also formed a monophyletic clade.
Differentiation-specific H1.0 proteins also clustered between Xenopus and human,
with Xenopus species H1.0 proteins closest together, both above the UFBoot
threshold. These H1.0 proteins in vertebrates shared a branch node with H1-delta
and H1-delta-like proteins in lancelet and sea urchin and branched from the same
lineage as H1-delta in sea squirt. Two other proteins annotated in sea urchin as
H1.0 and protamine-like also branched before vertebrate H1.0, forming a clade
between them.
A large proportion of H1 and H1-like proteins from two species of lancelets formed
a clade, supported by high UFBoot values, with the exception of lancelet H1-delta,
which was placed in a clade with purple sea urchin H1-delta. Sea squirt H1-delta
was included on branches leading to the aforementioned lineage, which also
included branches to human and Xenopus H1.0 proteins.
Purple sea urchin H1-beta and gamma formed a clade, excepting purple sea urchin
H1-alpha. Cleavage stage H1 of green sea urchins was placed in a clade with sea
squirt H1-beta; however, all of these were all unsupported by UFBoot values.

98
Figure 3.14 Consensus unrooted phylogenetic tree of human and Xenopus histone H1
proteins.
Human and Xenopus H1 variants were aligned with H1 sequences from invertebrates,
from tunicate, lancelet and sea urchin chordate relatives to the more distantly related
fruit fly. Branches were coloured by species as indicated in the key. Branch lengths are
optimized by maximum likelihood on original alignment, with scale bar representing
number of nucleotide substitutions per codon site.

99

100
Figure 3.15 Consensus tree of linker histone H1 subtypes in the vertebrates human
and Xenopus, compared to relatives of chordates.
Fruit fly H1 was drawn at root. Branch lengths are optimized by maximum likelihood
on original alignment. Numbers denote Ultrafast Bootstrap (UFBoot) support values,
where ≥95% support represents 95% probability that the clade is true. Branches with
UFBoot values ≥95% are coloured black, while other branches are grey.
101

102
3.4 Discussion
3.4.1 Tandem h1fx genes
As well as Xenopus, comparing other members of the order Anura revealed that the
Tibetan frog and cane toad both have tandem h1fx genes. This agreed with the
finding of two h1fx genes next to each other in both Xenopus species analysed.
All other tetrapods excluding amphibians are amniotes, in which tandem h1fx genes
were not found, or in the case of anole lizard, even a single h1fx gene was not found,
though since h1fx appeared in other squamates it is likely that sequencing to cover
the gaps in the anole lizard genome will resolve this.
Coelacanth was the only other species investigated to have tandem h1fx genes,
though the H1X proteins shared more similarity with each other than to any H1X
protein coded by h1fx in another species. The two coelacanth H1X proteins also
have matching differences in the globular domain amino acid sequence, a region of
sequence very highly conserved.
As lobe-finned fish, coelacanths and lungfish are the closest extant species of fish to
tetrapod species, although it is lungfish that are more closely related to the Tetrapoda
clade than coelacanths (Amemiya et al., 2013; Brinkmann, Venkatesh, Brenner, &
Meyer, 2004). Unfortunately, the genomic sequence of lungfish is unavailable, as it
would be interesting to see whether there are multiple h1fx genes in this species.
Lastly, multiple h1fx genes, but not in tandem, were found in Asian bonytongue, a
ray-finned, teleost fish. The two h1fx genes on different chromosomes in this species
are likely gene duplications resulting from the predicted teleost-specific 3R whole
genome duplication which occurred millions of years ago (Reviewed by Meyer &
Peer, 2005).
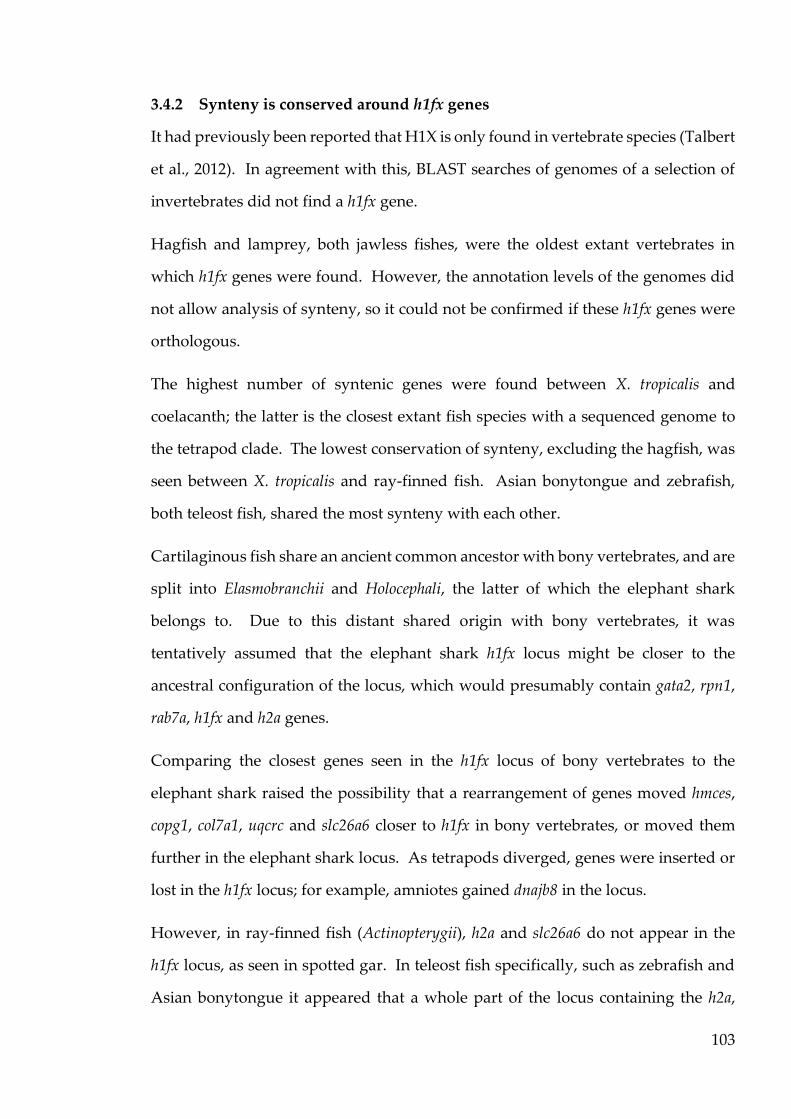
103
3.4.2 Synteny is conserved around h1fx genes
It had previously been reported that H1X is only found in vertebrate species (Talbert
et al., 2012). In agreement with this, BLAST searches of genomes of a selection of
invertebrates did not find a h1fx gene.
Hagfish and lamprey, both jawless fishes, were the oldest extant vertebrates in
which h1fx genes were found. However, the annotation levels of the genomes did
not allow analysis of synteny, so it could not be confirmed if these h1fx genes were
orthologous.
The highest number of syntenic genes were found between X. tropicalis and
coelacanth; the latter is the closest extant fish species with a sequenced genome to
the tetrapod clade. The lowest conservation of synteny, excluding the hagfish, was
seen between X. tropicalis and ray-finned fish. Asian bonytongue and zebrafish,
both teleost fish, shared the most synteny with each other.
Cartilaginous fish share an ancient common ancestor with bony vertebrates, and are
split into Elasmobranchii and Holocephali, the latter of which the elephant shark
belongs to. Due to this distant shared origin with bony vertebrates, it was
tentatively assumed that the elephant shark h1fx locus might be closer to the
ancestral configuration of the locus, which would presumably contain gata2, rpn1,
rab7a, h1fx and h2a genes.
Comparing the closest genes seen in the h1fx locus of bony vertebrates to the
elephant shark raised the possibility that a rearrangement of genes moved hmces,
copg1, col7a1, uqcrc and slc26a6 closer to h1fx in bony vertebrates, or moved them
further in the elephant shark locus. As tetrapods diverged, genes were inserted or
lost in the h1fx locus; for example, amniotes gained dnajb8 in the locus.
However, in ray-finned fish (Actinopterygii), h2a and slc26a6 do not appear in the
h1fx locus, as seen in spotted gar. In teleost fish specifically, such as zebrafish and
Asian bonytongue it appeared that a whole part of the locus containing the h2a,

104
hmces, col7a1, uqcrc and slc26a6 genes had been lost. The large differences between
the sarcopterygian and actinopterygian h1fx loci, and between spotted gar and
teleost fish could in part be due to multiple fish-specific genome duplication events,
which may have reorganised the genomes of these species. Following the discovery
of nearly twice as many hox gene clusters in zebrafish compared to mammals, these
were predicted to have occurred millions of years ago; first before the division of
ray and lobe-finned fish, then in the ray-finned fish lineage before the appearance
of the teleost fish branch (Amores et al., 1998).
While h1fx genes appeared in tandem in X. laevis, this is not due to its allotetraploid
genome as other anurans display this as well. However, genes in the X. tropicalis
h1fx locus, e.g. uqrcr and hmces are on chromosome 4L, instead of 4S with h1fx in
X. laevis. The X. laevis L and S sub-genomes have an unequal pattern of evolution,
with the L sub-genome estimated to share an ancestor with X. tropicalis while the S
sub-genome has been subject to more deletions and rearrangements of genes on
chromosomes (Session et al., 2016), possibly explaining differences between X. laevis
sub-genomes.
Both Asian bonytongue and zebrafish underwent ancestral teleost-specific genome
duplication, though Asian bonytongue has two separate h1fx genes on different
chromosomes, while zebrafish only has a single h1fx gene. The spotted gar has the
same ancestor as teleost fish, but diverged before the genome duplication event
(Amores, Catchen, Ferrara, Fontenot, & Postlethwait, 2011; Hoegg, Brinkmann,
Taylor, & Meyer, 2004). Although zebrafish was subject to the teleost-specific
genome duplication, they may have lost one h1fx gene.
As coelacanth also has tandem h1fx genes, one possibility is that a sarcopterygian
ancestor had tandem h1fx genes that have been lost in all subsequent tetrapods
except Anura. Alternatively, anurans and coelacanths may have gained tandem h1fx
genes separately, as coelacanths are not suspected to be direct ancestors of the
tetrapod lineage.

105
By analysing the synteny of a larger number of species these predictions can be
refined, however this is also dependent on the availability of genome sequencing
annotation data.
3.4.3 Phylogenetic studies of H1X
Phylogenetic analysis of h1fx genes has revealed that they are orthologs in several
species. Additionally, the conservation of syntenic genes indicated that even in
genomes where h1fx is not annotated, further sequencing may find it, such as in the
genome of the anole lizard.
The two largest clades were composed of anuran H1X proteins and amniote H1X
protein sequences. SP1/SP2 formed a monophyletic clade with X. laevis H1X.2,
instead of being part of the clear cluster of the other sperm-nuclear basic proteins
SP3-SP5. This suggests that SP1/SP2 is more related to H1X than to other SNBPs.
Despite the branching of Xenopus H1.0 proteins from anuran H1X in phylogenetic
trees, the two genes do not share synteny in their loci and so are unlikely to be
ohnologs.
The two H1X proteins of coelacanths were placed branching after elephant sharks,
though the former is a bony vertebrate while the latter is in a sister group of
cartilaginous fish and not a direct ancestor of bony vertebrates. Interestingly, both
coelacanth and elephant shark were found to have slow evolution of protein coding
genes within their genomes; coelacanths slower compared to tetrapods (Amemiya
et al., 2013; Austin, Tan, Croft, Hammer, & Gan, 2015), while the elephant shark
genome was proposed to be the slowest evolving genome of a jawed vertebrate
species and thus closer to the ancestral state (Venkatesh et al., 2014).
Some elephant shark protein sequences have homologues with human but not ray-
finned fish proteins, suggesting that several genes in the genomes of ray-finned fish
are evolving at a faster rate than in other vertebrate groups (Venkatesh, Tay,
Dandona, Patil, & Brenner, 2005). Comparisons of evolutionary rates in ray-finned

106
fish, using amino acid substitutions per site from branch lengths of a phylogenetic
tree, revealed that the Asian bonytongue rate of evolution was not equivalent with
other members of the group, suggesting evolutionary rates within the ray-finned
fish group are not homogeneous (Austin et al., 2015). Both H1X sequences in the
Asian bonytongue clustered into a monophyletic group, while zebrafish H1X was
not as closely related to the Asian bonytongue lineage as spotted gar.
Jawless fish also clustered together, though as previously mentioned it could not be
confirmed from synteny whether their h1fx genes were orthologues.
The remaining tetrapods, excepting axolotl, grouped together. These species are
also all amniotes. Within this group, marsupial H1X sequences were monophyletic
and H1X sequences of squamates and Tuatara clustered. However, chicken and
human H1X sequences also formed a clade and generally low UFBoot probabilities
were seen for internal branches, indicating low probabilities these are true clades.
3.4.4 Phylogenetic studies of H1 Subtypes
Brief analysis of H1 subtypes was performed by construction of a phylogenetic tree
including vertebrate H1s, invertebrate chordates such as lancelets and sea squirt
and distant relatives of chordates such as sea urchin and fruit fly.
Linker histones appear in many species and derive from eubacteria, though
eubacterial H1-like proteins lack the globular winged helix domain (Kasinsky et al.,
2001), suggesting that this motif is not an ancestral feature of linker histones. In fact,
there is evidence that appearance of the H1 winged helix motif occurred in two, if
not more, distinct occasions in different lineages during the divergence of
eukaryotic species (Kasinsky et al., 2001). Evolution of linker histones follows a
birth-and-death model, whereby genes that are duplicated either remain within the
genome as new genes or become defective due to mutations or are lost (Eirín-López
et al., 2004; Ponte, Romero, Yero, Suau, & Roque, 2017).

107
Vertebrate h1fx genes were shown to be orthologues by analysis of synteny and H1X
protein sequences reflected this, as clustering was seen between Xenopus and
humans H1Xs on the phylogenetic tree. H1.0 protein sequences from human and
Xenopus also clustered together. However, UFBoot support values for branches
between species were low, so further analysis would be needed to confirm how
histone H1 subtypes are related.
Human somatic replication-dependent histone H1 variants H1.1 to H1.5 did not
cluster with Xenopus somatic subtypes H1A, H1B and H1C (Figure 3.14). Testis-
specific H1 subtypes also did not cluster. Xenopus H1t is most similar to Xenopus
H1B and is not orthologous to human H1t, while Hils1 is a sperm-specific variant
only appearing in mammals (Yan et al., 2003). Only mammals have orthologs of the
three human testis specific H1 variants including H1T2, as well as orthologs of
human H1.1 to H1.5 (Talbert et al., 2012). In humans, somatic histone subtypes H1.1
– H1.5 and testis-specific H1t genes cluster on chromosome 6, with the other main
histone genes (Happel et al., 2005).
The cleavage-stage H1 in sea urchin has been suggested to be a homolog of Xenopus
oocyte-specific B4 (Brandt, Schwager, Rodrigues, & Busslinger, 1997), which was
reflected in the phylogenetic tree (Figure 3.15), where green sea urchin cleavage-
stage H1 clustered with histone B4.
Previous phylogenetic analysis of genes of replication-dependent H1 subtypes
found that they can be as divergent within the same species as they are between
multiple species, with noted exceptions (Eirín-López et al., 2004). Conversely,
clustering of genes encoding H1.0 and H5, the avian H1 differentiation-specific
subtype, showed that these genes may share closer similarity across species than to
other H1 subtypes in the same species (Eirín-López et al., 2004). Analysis by Eirín-
López et al. (2004) included the human gene encoding H1X, (described as H1.X),
which did not cluster on a phylogenetic tree with any other H1 human somatic H1
subtype, instead branching from a node leading to other vertebrate H1 subtypes;

108
this agrees with phylogenetic analysis shown in Figure 3.14, where human H1X
clustered with Xenopus H1X proteins instead of other human somatic H1 proteins.
Alignment of human H1 subtype protein sequences have reported H1X sharing the
most sequence identity with H1.0 (28.4%) and H1.1 (28.5%) (Happel et al., 2005).
There is evidence supporting H1X as a differentiation-specific subtype (Ichihara-
Tanaka et al., 2017; Shahhoseini, Favaedi, Baharvand, Sharma, & Stunnenberg, 2010;
Terme et al., 2011; Yamamoto & Horikoshi, 1996). However, unlike H1X which only
appears in vertebrates, other differentiation-specific H1 subtypes occur in a range
of species; for example, the sea urchin differentiation-specific H1 subtype, H1-delta
(H1D), is expressed throughout development independent of replication (Lieber et
al., 2006). Additionally, in mussel species, H1 subtypes have been found which
show homology to sea urchin H1D and vertebrate H1.0 (Eirín-López, González-
Tizón, Martínez, & Méndez, 2002). H1-delta and H1-delta-like protein sequences
from purple sea urchins, sea squirts and lancelets were seen to cluster with sea
squirt, human and Xenopus differentiation-specific H1.0 (Figure 3.15).
In this chapter, a case has been presented for the protein currently annotated as
SNBP-1 in X. laevis to be a H1 subtype related to H1X, proposed as H1X.2, by
performing synteny analysis of h1fx genes in multiple species. In addition, the genes
encoding these two proteins, provisionally denoted h1fx.1 and h1fx.2, are tandemly
duplicated in anurans. For a more accurate analysis of the relationship between
h1fx genes, analysis of the genomes, once available, of more species from each group
would be helpful; in particularly to identify if any other ray-finned fish have
duplicated h1fx genes like the Asian bonytongue. Constraints caused by the quality
of database information will likely be resolved as assembly and annotation software
improves, along with new sequencing technologies.

109
4 Expression Analysis of h1fx and H1X in Xenopus species
4.1 Introduction
In the previous chapter it was confirmed that H1X orthologs appear in a range of
vertebrate species. However, in coelacanths and anuran amphibians, such as the
widely used Xenopus models, there are two h1fx genes in tandem, each encoding a
different protein.
Considering these two distinct H1X proteins, it was firstly essential to see whether
a previously raised and characterised anti-H1X antibody (Griffiths, 2013)
recognised both H1X.1 and H1X.2 proteins, or whether the peptide sequence used
to raise the antibody was highly specific only to one protein sequence.
Secondly, given the high similarity between H1X.1 in X. laevis and H1X.1 in
X. tropicalis, it was of interest to see whether the antibody raised against X. laevis
H1X.1 would detect H1X.1 in X. tropicalis.
Lastly, after confirming whether only a single protein was recognised by the
anti-H1X antibody, this chapter aimed to analyse the temporal expression of H1X
protein during Xenopus embryonic development by western blot. Specific primers
for each h1fx mRNA were designed to be used in reverse-transcription PCR to
identify and compare the expression of h1fx.1 and h1fx.2 mRNAs.
Spatial analysis of H1X.1 was performed by generation of an RNA probe for use in
wholemount in-situ hybridisation and by probing Xenopus tropicalis tissue types for
H1X protein and h1fx.1 and h1fx.2 mRNA expression.

110
4.1.1 Anti-H1X antibody peptide sequence is specific to H1X.1 in X. laevis
Alignment of the peptide sequence used to raise the in-house X. laevis anti-H1X
antibody with X. laevis H1X.1 and H1X.2 protein sequences showed that the peptide
was a 100% match to H1X.1 (Figure 4.1).
Meanwhile the H1X.2 protein only shared 21% of amino acids with the peptide
sequence. Though the alignment showed two consecutive amino acids matching
between H1X.2 and the beginning of the peptide sequence, the H1X.2 sequence
differed greatly at the end of the peptide sequence. It was therefore not expected
that the anti-H1X antibody would recognise H1X.2.
Figure 4.1 Anti-H1X antibody peptide sequence compared to both X. laevis H1X
proteins.
Sequence alignment of X. laevis H1X.1 and X. laevis H1X.2 proteins showed the H1X
peptide antigen was designed to H1X.1 in a region not well-conserved in H1X.2.
Antibody peptide sequence (green line), globular domain (black line). Xla – X. laevis.

111
4.1.2 Temporal analysis of H1X expression in X. laevis
As no commercial antibody for non-mammalian H1X was available, the in-house
anti-H1X antibody, specific to H1X.1, allowed investigation of H1X.1 protein
throughout embryonic development of X. laevis (Figure 4.2).
Calculation of the molecular weight in kilodaltons (kDa) of H1X.1 and H1X.2
proteins revealed approximately 24 kDa for H1X.1 and 21 kDa for H1X.2. The
H1X.1 protein resolved on gels between the 25 and 32 kDa marker and appeared as
a single, narrow band, as opposed to thick or multiple bands which might suggest
recognition of other proteins. Although by itself this does not confirm specificity,
along with the alignment it strongly supports recognition of only H1X.1 by the
antibody.

112
4.1.3 H1X.1 is expressed throughout embryonic development of X. laevis
Western blot with anti-H1X.1 affinity purified antibody on X. laevis embryo protein
extracts (see section 2.5) detected H1X.1 at stage 6, blastula, throughout embryonic
development up to the latest stage probed, swimming tadpole at stage 41 (Figure
4.2).
Zygotic genes only become transcriptionally active after the midblastula transition
(MBT) (Newport & Kirschner, 1982), therefore the presence of H1X.1 at blastula
stage indicated a store of maternal H1X.1. Probing extracts from X. laevis embryos
from single-cell up to gastrula provided further evidence for a maternal store of
H1X.1 protein, with H1X.1 continuously detected in all stages tested (Figure 4.3).
Anti-H3 antibody (Abcam ab1791) was used as a loading control and showed that
the protein loadings for embryonic stages earlier than stage 41 were relatively
uniform (Figure 4.2). Protein loadings of extracts from single-cell to stage 10 were
mainly consistent with each other, although background signal was higher due to
shortened membrane blocking (Figure 4.3).

113
Figure 4.2 Western blot analysis of H1X.1 and H3 protein expression over a time-
course of early embryonic development of X. laevis.
X. laevis embryos from a single female were collected at embryonic stages 6-41,
according to NF staging. Extracted proteins were separated by 12% SDS-PAGE and
transferred to nitrocellulose membrane. After reversible MemCode staining to show
protein loadings, membranes were probed with (A) in-house anti-H1X affinity purified
antibody at 1:1000 dilution, green arrow or (B) anti-H3 (Abcam ab1791) at 1:2000
dilution, black arrow. Membranes were visualized by chemiluminescence reaction
using a LAS-4000, with exposure times of (A) 5 minutes and (B) 30 seconds.

114
Figure 4.3 Western blot analysis of H1X.1 expression from fertilized egg to gastrula in
X. laevis.
X. laevis embryos from a single female were collected at embryonic stages 1-10, according
to NF staging. Extracted proteins were separated by 12% SDS-PAGE and transferred to
nitrocellulose membrane. After reversible MemCode staining to show protein loadings,
membranes were probed by (A) in-house anti-H1X affinity antibody at 1:1000 dilution,
green arrow or (B) anti-H3 rabbit polyclonal antibody (Abcam) at 1:2000 dilution. The
band at the correct size for H3 is arrowed (black); the membrane was blocked for only
one hour, resulting in the high background. Membranes were visualized by
chemiluminescence reaction using a LAS-4000, with exposure times of (A) 10 minutes
and (B) 1 minute.

115
4.1.4 h1fx.1 mRNA is expressed throughout early development of X. laevis
As well as expression of H1X.1 protein, expression of h1fx.1 mRNA was analysed in
X. laevis. Reverse-transcription PCR was performed with RNA extracted from
stages across embryonic development, followed by specific amplification with
h1fx.1 or ornithine decarboxylase 1 (odc1) primers as a control (see section 2.6).
Multiplex PCR was unsuccessful, so for accurate comparison odc1 and h1fx.1 were
amplified from the same pool of cDNA and PCR products were loaded on the top
and bottom wells of the same agarose gel.
The odc1 band was present in all stages at roughly the same intensity in X. laevis
embryos. The amount of h1fx.1 mRNA in X. laevis appeared to slightly increase
from stage 6 to stage 11, then remain constant throughout the remaining stages
(Figure 4.4).
116
Figure 4.4 Expression of h1fx.1 mRNA over early embryonic development of X. laevis.
cDNA was generated from RNA extracted from a time-course of X. laevis embryos across
early development. Regions of either h1fx.1 (green arrow), amplicon size 671 bp or odc1
(black arrow), amplicon size 228 bp, genes were amplified from the same cDNA pool by
PCR and resolved on 1% TBE agarose stained with Sybrsafe (Thermo Fisher Scientific).
Controls were a sample containing reverse-transcription reagents but no RNA (NO
RNA), a sample with RNA but no reverse-transcriptase (-RT) and PCR reagents but no
cDNA (NTC).
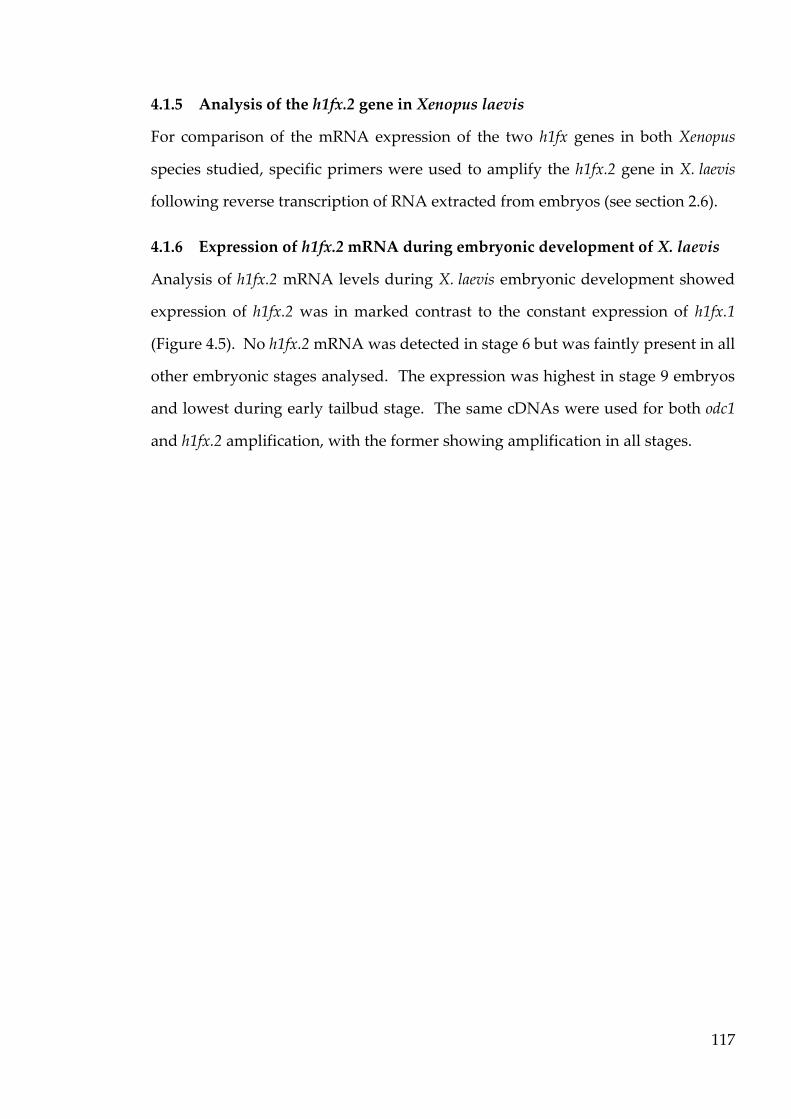
117
4.1.5 Analysis of the h1fx.2 gene in Xenopus laevis
For comparison of the mRNA expression of the two h1fx genes in both Xenopus
species studied, specific primers were used to amplify the h1fx.2 gene in X. laevis
following reverse transcription of RNA extracted from embryos (see section 2.6).
4.1.6 Expression of h1fx.2 mRNA during embryonic development of X. laevis
Analysis of h1fx.2 mRNA levels during X. laevis embryonic development showed
expression of h1fx.2 was in marked contrast to the constant expression of h1fx.1
(Figure 4.5). No h1fx.2 mRNA was detected in stage 6 but was faintly present in all
other embryonic stages analysed. The expression was highest in stage 9 embryos
and lowest during early tailbud stage. The same cDNAs were used for both odc1
and h1fx.2 amplification, with the former showing amplification in all stages.
118
Figure 4.5 Expression of h1fx.2 mRNA during early embryonic development of
X. laevis.
cDNA was generated from RNA extracted from a time-course of X. laevis embryos across
early development and regions of either h1fx.2 (blue arrow), amplicon size 599 bp or odc1
(black arrow), amplicon size 228 bp, genes were amplified from the same cDNA pool by
PCR and resolved on 1% TBE agarose stained with Sybrsafe (Thermo Fisher Scientific).
Embryos were staged according to NF. Controls were a sample containing reverse-
transcription reagents but no RNA (NO RNA), a sample with RNA but no reverse-
transcriptase (-RT) and PCR reagents but no cDNA (NTC).

119
4.2 Temporal analysis of H1X expression in X. tropicalis
4.2.1 An anti-H1X antibody peptide sequence recognises X. tropicalis H1X.1
Sequence alignment also revealed that the X. tropicalis H1X.1 ortholog had a single
amino acid difference near the end of the N-terminal region used to generate the
peptide to raise the antibody (Figure 4.6).
Though there is one amino acid mismatch between the anti-H1X peptide sequence
and X. tropicalis H1X.1, western blotting showed that the X. laevis anti-H1X antibody
recognised a single band of similar size to X. laevis H1X.1 when compared to pre-
stained protein marker. X. tropicalis H1X.1 is predicted to be approximately 26 kDa,
with H1X.2 smaller at 23 kDa.
However, the anti-H1X.1 antibody was not as effective responding to X. tropicalis
H1X.1 protein; generally, exposure of the membranes during chemiluminescence
reactions took longer and protein signals were more variable and less intense. To
compensate, amounts of extracts equivalent to two X. tropicalis embryos were
loaded on SDS-PAGE gels.
4.2.2 H1X.1 is expressed throughout embryonic development of X. tropicalis
Western blot of H1X.1 signal throughout X. tropicalis embryogenesis was fainter in
stages 9, 11, 14, 22 and 25 and more intense in stages 7, 37 and 41 (Figure 4.7).
Though differing from the relatively consistent intensity of X. laevis H1X.1,
X. tropicalis H1X.1 protein was detected in all stages tested like X. laevis.
In case of experimental errors, equal loadings of X. tropicalis proteins on SDS-PAGE
was established with Coomassie staining and complete protein transfer to
nitrocellulose membrane was confirmed by Memcode stain before western blot.
Repetitions of the western blot showed variable or no response to anti-H1X
antibody, possibly caused by sample degradation.
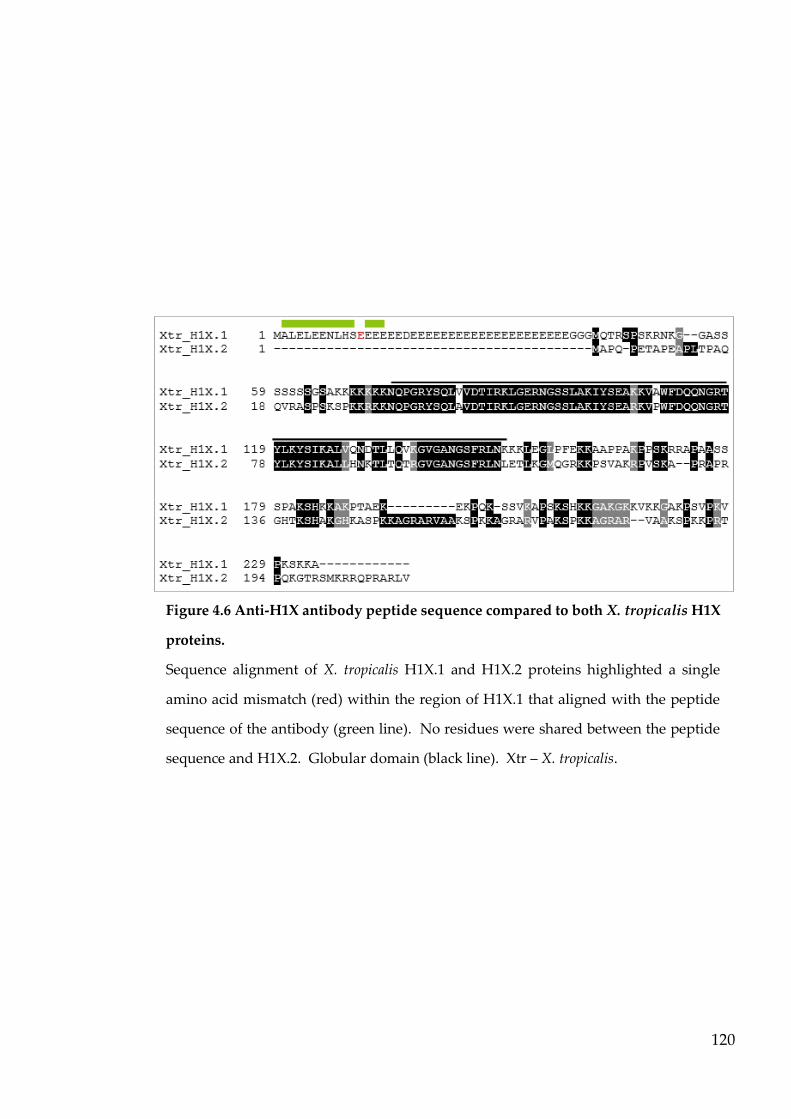
120
Figure 4.6 Anti-H1X antibody peptide sequence compared to both X. tropicalis H1X
proteins.
Sequence alignment of X. tropicalis H1X.1 and H1X.2 proteins highlighted a single
amino acid mismatch (red) within the region of H1X.1 that aligned with the peptide
sequence of the antibody (green line). No residues were shared between the peptide
sequence and H1X.2. Globular domain (black line). Xtr – X. tropicalis.

121
Figure 4.7 Western blot analysis of H1X.1 and H3 protein expression over a time-
course of early embryonic development of X. tropicalis.
X. tropicalis embryos from a single female were collected at embryonic stages 7-41,
according to NF staging. Extracted proteins were separated by 12% SDS-PAGE and
transferred to nitrocellulose membrane. After reversible MemCode staining to show
protein loadings, membranes were probed by (A) in-house anti-H1X affinity antibody at
1:1000 dilution, green arrow or (B) anti-H3 (Abcam ab1791) at 1:2000 dilution, black
arrow. Membranes were visualized by chemiluminescence reaction using a LAS-4000,
with exposure times of (A) 10 minutes and (B) 30 seconds.

122
4.2.3 h1fx.1 RNA is expressed throughout early development of X. tropicalis
X. tropicalis h1fx.1 expression was not detected by RT-PCR in stage 7 embryos
(Figure 4.8). To confirm this was not an error, PCR was repeated twice from the
same cDNA pool and agarose electrophoresis of the PCR products was repeated
three times. The odc1 gene was amplified from the same cDNA pool as h1fx.1 and
showed the presence of a band in stage 7; this proved that the reverse transcription
reaction had been successful. A lower amount of h1fx.1 appeared in stage 9
compared to later stages, with expression at a steady level from stage 11 to stage 41.

123
Figure 4.8 Expression of h1fx.1 mRNA over early embryonic development of
X. tropicalis.
cDNA was generated from RNA extracted from a time-course of X. tropicalis embryos
across early development and regions of either h1fx.1 (green arrow), amplicon size
174 bp or odc1 (black arrow) amplicon size 228 bp genes were amplified from the same
cDNA pool by PCR and resolved on 1% TBE agarose stained with Sybrsafe (Thermo
Fisher Scientific). Embryos were staged according to NF. Controls were a sample
containing reverse-transcription reagents but no RNA (NO RNA), a sample with RNA
but no reverse-transcriptase (-RT) and PCR reagents but no cDNA (NTC).
124
4.2.4 Spatial analysis of h1fx.1 expression
The anti-H1X affinity antibody was highly specific to X. laevis H1X.1 protein in
western blots, however whole-mount immunohistochemistry with anti-H1X and
pre-immune sera on tailbud stage X. laevis embryos was non-specific.
Immunohistochemistry on late tailbud stage X. laevis embryo sections was also
inconclusive.
Therefore, an RNA probe was generated to target h1fx.1 in X. tropicalis for use in
whole-mount in situ hybridisation (WISH) (see section 2.4.11) and to compare with
existing WISH data obtained from X. laevis embryos (Appendix B, Figure B-1)
(Price, 2011).
4.2.5 Whole-mount in-situ hybridisation with h1fx.1
WISH was performed on X. tropicalis embryos at various developmental stages with
the transcribed anti-sense h1fx.1 RNA probe, with the sense RNA used as a control
probe (Figure 4.9).
Dark blue precipitate indicating the presence of h1fx.1 mRNA was scarcely seen in
stage 6 embryos. It was widely abundant in neural stages 16 and 19, then localised
to the anterior of early and late tailbud stage embryos. Intense staining was
apparent in head and eye regions of embryos in stages of later embryonic
development. In contrast, staining in control embryos was fainter and unspecific.
Due to poor survival rates, no gastrula-stage embryos were collected.

125
Figure 4.9 Whole-mount in-situ hybridisation analysis of h1fx.1 expression in
X. tropicalis.
A mixture of X. tropicalis embryos from two different females were collected at
approximately stage 6, 16, 21, 24, 32 and 36 (labels upper right of each image). WISH
was performed, with embryos hybridised with either the anti-sense h1fx.1 probe, or with
the sense probe as a control.

126
4.2.6 Analysis of H1X expression in Xenopus tropicalis tissue types
Tissues from an adult male X. tropicalis were gifted by the European Xenopus
Resource Centre (EXRC) and proteins or RNA extracted (see sections 2.5.2 and
2.6.2). Subsequent analysis of the expression of H1X.1 protein and h1fx.1 and h1fx.2
mRNA respectively was performed.
Proteins extracted from various X. tropicalis tissues were probed with the anti-H1X
affinity antibody (Figure 4.10). H1X.1 protein signal was detected in testis and
heart, with lower signal intensity in liver and none in kidney and lung tissues.
However, the anti-H3 antibody used as a control also showed low signal in kidney
and lung tissue, so low levels of H1X.1 detected could in part be caused by the
difficulty to completely homogenise these tissues during protein extraction. As
previously mentioned, the X. laevis antibody was not optimal on X. tropicalis,
however X. tropicalis was utilised due to availability of tissues.

127
Figure 4.10 Western blot analysis of H1X.1 and H3 protein expression in X. tropicalis
tissues.
Proteins were extracted from X. tropicalis kidney (K), liver (L), heart (H), lung (Lu) and
testis (T) and separated by 12% SDS-PAGE and transferred to nitrocellulose membrane.
After reversible MemCode staining to show loadings, membranes were probed by (A)
in-house anti-H1X affinity antibody at 1:1000 dilution, green arrow or (B) anti-H3
(Abcam ab1791) at 1:2000 dilution, black arrow. Membranes were visualized by
chemiluminescence reaction using a LAS-4000, with exposure times of (A) 10 minutes
and (B) 10 seconds.

128
4.2.7 Analysis of h1fx.1 mRNA expression in Xenopus tropicalis tissue types
In contrast to H1X protein, h1fx.1 expression was detected in all tissues tested
(Figure 4.11). It was highest in lung tissue, but also in testis. The odc1 gene was
used as a control; though this is expressed in most tissues at a low level, it is highly
expressed in ovary and testis in X. laevis (Appendix B, Figure B-2) (Karimi et al.,
2018). Expression data for X. tropicalis odc1 was unavailable.

129
Figure 4.11 Expression of h1fx.1 mRNA in X. tropicalis tissues.
RNA was extracted from X. tropicalis kidney (K), liver (L), heart (H), lung (Lu) and testis
(T) and used to generate cDNA. Regions of either h1fx.1 (green arrow), amplicon size
174 bp or odc1 (black arrow), amplicon size 228 bp, genes were amplified from the same
cDNA pool by PCR, resolved on 1% TBE agarose stained with Sybrsafe (Thermo Fisher
Scientific). Controls were a sample containing reverse-transcription reagents but no
RNA (NO RNA), samples with tissue RNA but no reverse-transcriptase, kidney (-K),
liver (-L), heart and lung (-LuH), testis (-T) and PCR reagents but no cDNA (NTC).

130
4.3 Analysis of h1fx.2 gene expression in Xenopus tropicalis
As performed for X. laevis earlier in this chapter, the expression of the h1fx.2 gene in
X. tropicalis was investigated by reverse-transcription PCR (see section 2.6). The
presence of h1fx.2 mRNA in adult X. tropicalis tissue types was also analysed.
4.3.1 h1fx.2 mRNA is expressed throughout early development of X. tropicalis
The h1fx.2 gene in X. tropicalis was amplified by specific primers from cDNA
generated by reverse transcription of RNA extracted from embryos (Figure 4.12).

131
Figure 4.12 Expression of h1fx.2 mRNA during early embryonic development of
X. tropicalis.
cDNA was generated from RNA extracted from a time-course of X. tropicalis embryos
across early development and regions of either h1fx.2 (blue arrow), amplicon size 221 bp
or odc1 (black arrow), amplicon size 228 bp, genes were amplified from the same cDNA
pool by PCR and resolved on 1% TBE agarose stained with Sybrsafe (Thermo Fisher
Scientific). Embryos were staged according to NF. Controls were a sample containing
reverse-transcription reagents but no RNA (NO RNA), a sample with RNA but no
reverse-transcriptase (-RT) and PCR reagents but no cDNA (NTC).

132
4.3.2 X. tropicalis h1fx.2 mRNA is expressed in multiple tissues
Primers were used to amplify the h1fx.2 gene from X. tropicalis tissue samples, to
compare any specific expression to h1fx.1 (Figure 4.13). Like X. tropicalis h1fx.1,
h1fx.2 was found to be ubiquitous to all tissue types tested at comparable amounts.
The odc1 gene also showed variable expression levels, as mentioned previously.
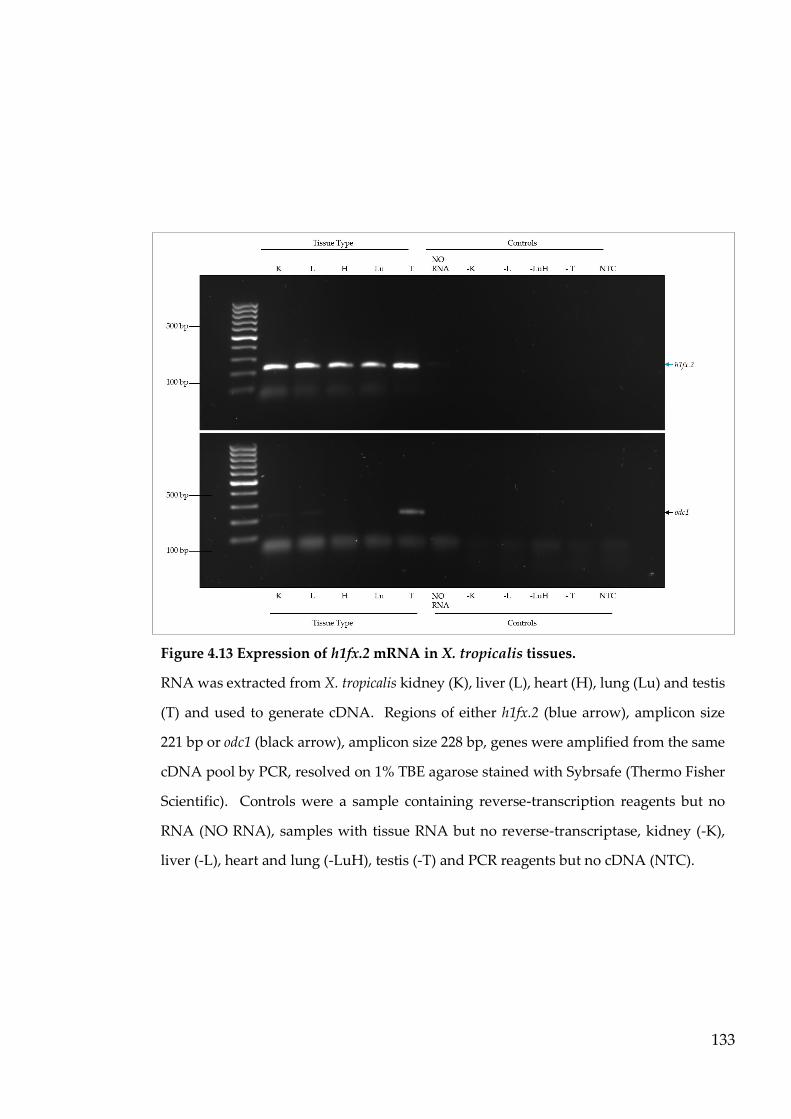
133
Figure 4.13 Expression of h1fx.2 mRNA in X. tropicalis tissues.
RNA was extracted from X. tropicalis kidney (K), liver (L), heart (H), lung (Lu) and testis
(T) and used to generate cDNA. Regions of either h1fx.2 (blue arrow), amplicon size
221 bp or odc1 (black arrow), amplicon size 228 bp, genes were amplified from the same
cDNA pool by PCR, resolved on 1% TBE agarose stained with Sybrsafe (Thermo Fisher
Scientific). Controls were a sample containing reverse-transcription reagents but no
RNA (NO RNA), samples with tissue RNA but no reverse-transcriptase, kidney (-K),
liver (-L), heart and lung (-LuH), testis (-T) and PCR reagents but no cDNA (NTC).

134
4.4 Discussion
4.4.1 H1X.1 is a maternal protein in Xenopus
Previous studies of H1X have mainly been limited to mammalian cell lines, focusing
on the expression of h1fx in single cells. With the in-house anti-H1X.1 antibody, the
expression of H1X.1 in a vertebrate, non-mammalian model organism was
explored.
H1X.1 protein was detected in the earliest stages probed by western blot, stage 6 for
X. laevis and stage 7 for X. tropicalis. Zygotic genes only become transcriptionally
active after the midblastula transition (MBT); twelve cleavages of the embryo (NF
stage 8) (Newport & Kirschner, 1982), though with some exceptions (Skirkanich,
Laxardi, Yang, Kodjabachian, & Klein, 2011). The presence of H1X.1 before the MBT
suggests that Xenopus oocytes contain a maternally inherited store of H1X.1. Whilst
there is evidence for consistent low levels of H1X.1 throughout early embryonic
development, as the intensity of the H1X.1 signal in X. laevis did not appear to
decrease, it is considered that proteins seemingly expressed at stable levels are likely
not degraded, rather than being continuously produced (Peshkin et al., 2015)
At least twice as many X. tropicalis embryos as X. laevis were required for extraction
of sufficient protein for western blots; processing of this greater number of embryos
may have affected the sample quality, contributing to the higher background
staining seen on the X. tropicalis western blot with anti-H1X.1 antibody. As
previously mentioned, the X. laevis anti-H1X.1 antibody was not optimal at
recognising X. tropicalis H1X.1. However, it is also possible that the H1X.1 protein
level in X. tropicalis embryos decreases following the MBT and gastrulation, then
increases during late tailbud stage, as appears in Figure 4.7.
Of histones that have previously been extracted from X. laevis sperm, pronuclei
incubated in egg extract, eggs and erythrocytes, H1X was only isolated in sperm
and pronuclei incubated in egg extract, the latter used to represent early embryos

135
(Shechter et al., 2009). If H1X is a maternal protein, it would be expected to be
present in eggs, however the authors noted that due to constraints they could not
isolate maternal chromatin, only stored, pre-deposition histones (Shechter et al.,
2009).
4.4.2 h1fx.1 mRNA is expressed throughout embryogenesis of Xenopus
In X. laevis, h1fx.1 mRNA was detected at stage 6, before the MBT and beginning of
zygotic transcription, until stage 41, the latest stage tested. The amount of h1fx.1
appeared to increase marginally from stage 6 to stage 11, then remain at a similar
amount in later embryonic stages.
Conversely in X. tropicalis embryos, h1fx.1 mRNA was not detected in a stage before
the MBT, stage 7, only appearing from stage 9, with h1fx.1 increased in stage 11 and
then continuing at the same amount to stage 41. These differ from the abundant
detection of H1X.1 protein seen in early stages of X. laevis and X. tropicalis embryos
by western blots (Figures 4.2 and 4.7). Reported differences in RNA and protein
abundance are discussed further in section 4.4.5.
Though h1fx.1 mRNA was not detected by RT-PCR in stage 7 X. tropicalis embryos
(Figure 4.8), preliminary quantitative real-time PCR data (not shown) indicated a
very low amount of h1fx.1 mRNA in stage 7 X. tropicalis embryos.
The presence, however low, of h1fx.1 mRNA indicated some maternal inheritance,
as zygotic transcription would not have begun until stage 8. Whether this mRNA
is translated into protein in early Xenopus embryos or whether there is a store of
H1X.1, derived from oocyte mRNA during oogenesis, the protein is present in early
embryogenesis from stage 7, as seen from western blot (Figure 4.7).
4.4.3 h1fx.1 mRNA localises to anterior regions during late embryogenesis
Whole-mount in-situ hybridisation found staining of h1fx.1 mRNA in all tested
embryonic stages of X. tropicalis, except for stage 6, where its level may be too low
to detect. Staining of h1fx.1 mRNA was more pronounced in late tailbud stage

136
embryos, within anterior regions such as the head and eye. This agreed with WISH
of h1fx in X. laevis embryos of similar stage (Price, 2011), for which the probe was
specific for h1fx.1 mRNA.
Immunohistochemistry on sections taken during embryonic development of mice
revealed that H1X was present in all germ layers early in embryogenesis, with
higher expression during gastrulation, later limited to the nervous system and
neural cells (Ichihara-Tanaka, Kadomatsu, & Kishida, 2017). The localisation of
H1X expression to neural cells is consistent with Xenopus in situ data (Figure 4.9),
suggesting H1X is highly expressed during gastrulation, correlating with the start
of zygotic transcription, in order for later roles in neural cell differentiation.
4.4.4 h1fx.2 is expressed during embryonic development of Xenopus
The expression of h1fx.2 in X. laevis was significantly different from that of h1fx.1,
with expression of h1fx.2 overall lower overall. It was undetectable in stage 6 and
highest in stage 9, a stage after the MBT. Expression of h1fx.2 in X. tropicalis
meanwhile was higher at the earliest embryonic stages tested, compared to h1fx.1
in this species. This suggests that there are differences within and between species
in the relative amounts of maternal RNA of each h1fx subtype, which could be
investigated further by quantitative real-time PCR methods.
Other quantitative methods such as RNA sequencing data obtained from Xenbase
(Karimi et al., 2018), revealed that the numbers of X. tropicalis h1fx.1 mRNA
transcripts per embryo (TPE) were overall much higher at all embryonic stages
tested than h1fx.2 RNA transcripts per embryo, for example, at stage 10 there were
approximately 2.8 x10⁶ h1fx.1 TPE, compared to 1.9x10⁶ h1fx.2 TPE (Figure 4.14). For
embryos in clutch A, peak expression of h1fx.1 occurred at around stage 14, during
neurulation, and again around stage 21, where embryonic development enters early
tailbud stages. A final smaller peak of expression appeared at stage 25. Embryos
in clutch B were measured for longer, with findings that h1fx.1 mRNA transcripts
per embryo (TPE) reached their highest peak at stage 21, flanked by smaller peaks

137
at stage 14 and 25. The TPE then decreased until rising again from stage 31, late
tailbud, and then plateaued at stage 41-42, at approximately 18x106 transcripts per
embryo.
The numbers of h1fx.2 transcripts per embryo were much lower throughout
embryonic development; approximately six times lower than h1fx.1 at the highest
TPE of both genes in embryos from clutch A. Both clutch A and B peaked for h1fx.2
TPE at stages 11-12; TPE then generally decreased, until a slight rise from stages 35-
36 to stage 42, reaching approximately 1x10⁶ TPE (Figure 4.14).
h1fx.2 transcripts are continuously expressed at a low level after peak expression at
stage 11, compared to high TPE of h1fx.1 (Figure 4.14) and the steep increase in the
number of h1fx.1 TPE during gastrula stages of X. tropicalis may function to rapidly
increase the total amount of H1X protein during gastrulation and into neurulation,
perhaps for roles in cell differentiation.
Unfortunately no annotated RNA sequencing plots were available for either
X. laevis h1fx.1 or h1fx.2, though RNA sequencing track data viewable against the
X. laevis 9.2 genome (Xenbase) showed consistently higher h1fx.1 compared to h1fx.2
mRNA in oocytes, eggs, embryonic tissues and certain stages of embryonic
development tested (Karimi et al., 2018).
In contrast to X. tropicalis, RT-PCR of X. laevis embryos showed a specific increase
in h1fx.2 expression at stage 9 (Figure 4.5) just after the start of zygotic transcription,
contrasting with the uniform expression of h1fx.1 throughout all stages tested. This
increase in expression of only one of the two h1fx genes at a specific stage is similar
in X. laevis and X. tropicalis.
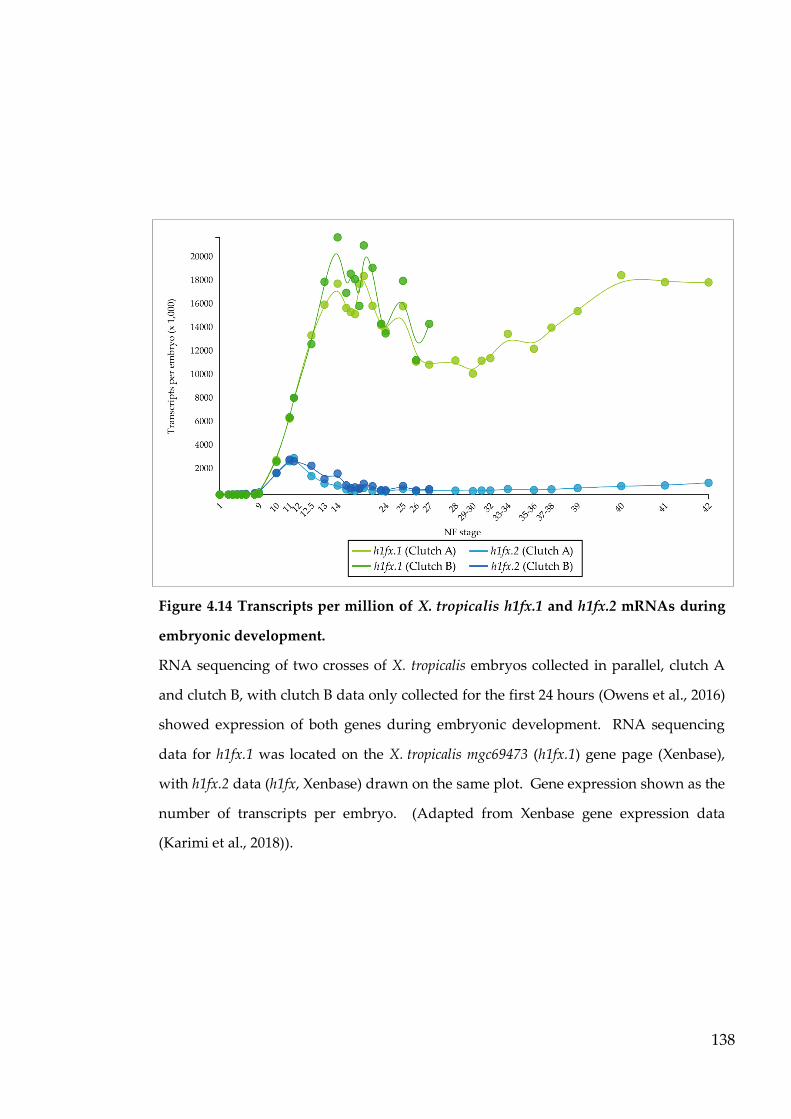
138
Figure 4.14 Transcripts per million of X. tropicalis h1fx.1 and h1fx.2 mRNAs during
embryonic development.
RNA sequencing of two crosses of X. tropicalis embryos collected in parallel, clutch A
and clutch B, with clutch B data only collected for the first 24 hours (Owens et al., 2016)
showed expression of both genes during embryonic development. RNA sequencing
data for h1fx.1 was located on the X. tropicalis mgc69473 (h1fx.1) gene page (Xenbase),
with h1fx.2 data (h1fx, Xenbase) drawn on the same plot. Gene expression shown as the
number of transcripts per embryo. (Adapted from Xenbase gene expression data
(Karimi et al., 2018)).

139
4.4.5 H1X is expressed ubiquitously in organ tissue types
Both h1fx.1 and h1x.2 expression was seen in X. tropicalis heart, kidney, liver, lung
and testis tissue, with h1fx.1 slightly higher in the latter two tissue types compared
to other tissues and h1fx.2 expression relatively high in all tissues.
RNA-sequencing data (Session et al., 2016) viewable against the X. tropicalis 9.1 and
X. laevis 9.2 genomes at Xenbase (Karimi et al., 2018) was utilised to compare h1fx.1
and h1fx.2 mRNA expression in a range of adult tissues, including liver, skin, brain,
heart, kidney, muscle, ovary and testis. Both X. tropicalis h1fx.1 (mgc69473) and
h1fx.2 (h1fx) showed expression in all tissues but skin. Generally, h1fx.1 was present
at higher amounts in tissues except for liver, ovary and testis. X. laevis RNA-
sequencing data was available for all tissues mentioned above, with the addition of
eye, intestine, lung, pancreas, spleen and stomach. Both h1fx.1 and h1fx.2 mRNA
was present in all tissues tested, with h1fx.1 mRNA at a higher amount than h1fx.2,
except for testis where h1fx.2 was at the highest level of all tissues sequenced for
h1fx.2 mRNA. Overall, these findings are similar between X. tropicalis and X. laevis
for tissues tested in both species, with h1fx.1 mRNA generally predominant but
h1fx.2 higher than h1fx.1 in testis tissue of both species. Liver and ovary tissues were
the exceptions; higher in h1fx.2 in X. tropicalis and h1fx.1 in X. laevis.
The ubiquitous expression of h1fx in tissues correlates with other vertebrates such
as mammals, where northern blot analysis found h1fx mRNA present at varying
levels in a range of human tissue types probed, including testis and ovary
(Yamamoto & Horikoshi, 1996).
It has been shown that h1fx.1 is a maternal protein and is not tissue-specific by
analysis in this chapter. While studies have found that the levels of mRNA and
protein expression during Xenopus embryogenesis rarely correlate (Peshkin et al.,
2015), both H1X.1 protein and h1fx.1 mRNA appeared throughout all
developmental stages tested, excepting X. tropicalis stage 7, for which a low relative
expression of h1fx.1 was only seen in quantitative real-time PCR.

140
As no antibody is available to H1X.2 protein, only analysis of h1fx.2 mRNA
expression could be performed. Drastic differences in the expression of X. laevis
h1fx.2 and X. tropicalis h1fx.2 were observed, for example while X. tropicalis h1fx.2
expression was ubiquitous from embryonic stages 7 to 41, X. laevis h1fx.2 expression
was absent from stage 6 and peaked at stage 9, showing much lower expression in
subsequent stages of development.
The expression of h1fx.2 was ubiquitous in X. tropicalis adult tissues tested.
Generation of a probe for h1fx.2 mRNA for use in WISH with X. laevis and
X. tropicalis would be interesting to see if it follows a similar pattern of staining as
h1fx.1 in whole embryos during embryogenesis. Quantitative real-time PCR with
standards of known concentration would also give a more detailed insight into the
changes in the expression of the h1fx genes during Xenopus embryonic development.
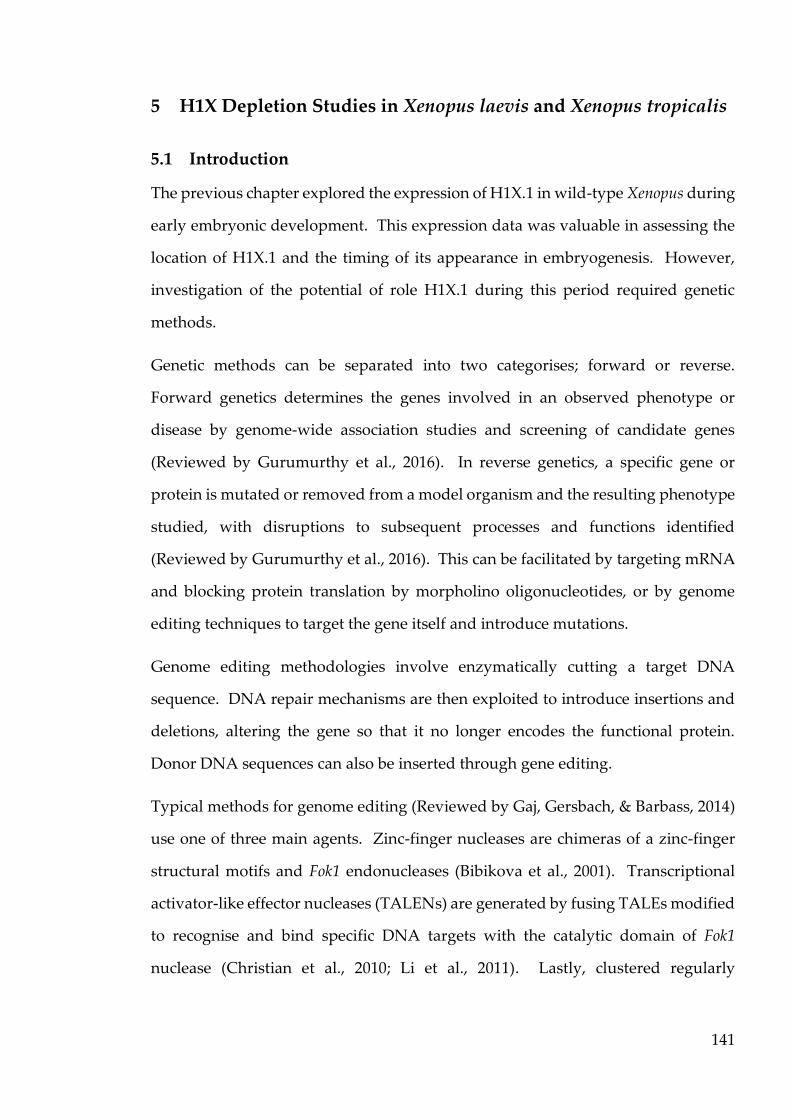
141
5 H1X Depletion Studies in Xenopus laevis and Xenopus tropicalis
5.1 Introduction
The previous chapter explored the expression of H1X.1 in wild-type Xenopus during
early embryonic development. This expression data was valuable in assessing the
location of H1X.1 and the timing of its appearance in embryogenesis. However,
investigation of the potential of role H1X.1 during this period required genetic
methods.
Genetic methods can be separated into two categorises; forward or reverse.
Forward genetics determines the genes involved in an observed phenotype or
disease by genome-wide association studies and screening of candidate genes
(Reviewed by Gurumurthy et al., 2016). In reverse genetics, a specific gene or
protein is mutated or removed from a model organism and the resulting phenotype
studied, with disruptions to subsequent processes and functions identified
(Reviewed by Gurumurthy et al., 2016). This can be facilitated by targeting mRNA
and blocking protein translation by morpholino oligonucleotides, or by genome
editing techniques to target the gene itself and introduce mutations.
Genome editing methodologies involve enzymatically cutting a target DNA
sequence. DNA repair mechanisms are then exploited to introduce insertions and
deletions, altering the gene so that it no longer encodes the functional protein.
Donor DNA sequences can also be inserted through gene editing.
Typical methods for genome editing (Reviewed by Gaj, Gersbach, & Barbass, 2014)
use one of three main agents. Zinc-finger nucleases are chimeras of a zinc-finger
structural motifs and Fok1 endonucleases (Bibikova et al., 2001). Transcriptional
activator-like effector nucleases (TALENs) are generated by fusing TALEs modified
to recognise and bind specific DNA targets with the catalytic domain of Fok1
nuclease (Christian et al., 2010; Li et al., 2011). Lastly, clustered regularly

142
interspaced short palindromic repeats (CRISPR) is paired with CRISPR associated
protein 9 (Cas9) endonuclease (Cong et al., 2013).
Genetic engineering has been performed in a wide-range of species (Figure 5.1). For
instance TALENs have been used to knockout genes in rats (Tesson et al., 2011) and
CRISPR-Cas9 used to disrupt genes in butterflies (Li et al., 2015). The Xenopus
genome has been successfully edited with ZFNs (Young et al., 2011), TALENs (Lei
et al., 2012) and CRISPRs (Shigeta et al., 2016).
In this chapter, firstly an existing morpholino oligonucleotide recognising h1fx.1
mRNA was used to investigate whether H1X.1 protein, as a maternal protein, could
be depleted. The genome editing system CRISPR-Cas9 was also utilised to edit the
h1fx.1 gene, with a view to establishing knockout lines.

143
Fig
ure
5.1
Tim
elin
e o
f th
e u
se o
f th
ree
gen
etic
en
gin
eeri
ng
met
ho
ds.
Zin
c-fi
ng
er n
ucl
ease
s (Z
FN
), t
ran
scri
pti
on
al a
ctiv
ato
r-li
ke
effe
cto
r n
ucl
ease
s (T
AL
EN
s) a
nd
clu
ster
ed r
egu
larl
y i
nte
rsp
aced
sh
ort
pal
ind
rom
ic
rep
eats
(C
RIS
PR
) w
ith
Cas
9 h
ave
all
bee
n u
sed
to
ed
it t
he
gen
om
e o
f X
enop
us,
as
wel
l as
man
y o
ther
sp
ecie
s.
Th
rou
gh
tar
get
ed g
eno
me
edit
ing
, g
enes
can
be
dis
rup
ted
, m
uta
ted
or
alte
red
by
in
sert
ion
of
do
no
r D
NA
seq
uen
ces.
(1
) (B
ibik
ov
a, G
oli
c, G
oli
c, &
Car
roll
, 20
02),
(2)
(B
eum
er,
Bh
atta
char
yy
a, B
ibik
ov
a, T
rau
tman
, &
Car
roll
, 20
06),
(3)
(M
eng
, N
oy
es,
Zh
u,
Law
son
, &
Wo
lfe,
200
8),
(4)
(Yo
un
g e
t al
., 20
11),
(5)
(Cer
mak
et
al.,
2011
), (
6) (
Mil
ler
et a
l.,
2011
), (
7) (
Tes
son
et
al.,
2011
), (
8) (
Hu
ang
et
al.,
2011
), (
9) (
San
der
et
al.,
2012
), (
10)
(Lei
et
al.,
2012
),
(11)
(C
on
g e
t al
., 20
13),
(12
) (M
ali
et a
l.,
2013
), (
13)
(Ch
o,
Kim
, K
im,
& K
im,
2013
), (
14)
(Nak
ayam
a et
al.
, 20
13),
(15
) (H
rusc
ha
et a
l.,
2013
),
(16)
(Ir
ion
, Kra
uss
, & N
uss
lein
-Vo
lhar
d, 2
014)
, (17
) (L
i et
al.
, 201
5), (
18)
(Sh
iget
a et
al.
, 201
6), (
19)
(Fo
gar
ty e
t al
., 20
17),
(20
) (D
eLay
et
al.,
2018
).

144
5.2 Knockdown of protein expression by morpholino oligonucleotides
Morpholino oligonucleotides are short sequences comprised of structurally altered
nucleotides with morpholine rings (Summerton et al., 1997) that bind in a sequence-
specific manner to their target mRNA and block translation into protein (Heasman,
Kofron, & Wylie, 2000).
As shown in Chapter 4, H1X.1 is present from fertilisation throughout embryonic
development of X. laevis, indicating a maternally-derived store of this protein in the
oocyte. Morpholino oligonucleotides have been used effectively in early X. laevis
embryos to block translation of β-catenin mRNA into protein, allowing the existing
maternal β-catenin protein to deplete during embryonic development without being
replaced (Heasman et al., 2000).
As morpholinos reportedly persist until neurula stage (Heasman et al., 2000), they
were used to examine whether blocking translation of h1fx.1 mRNA into new H1X.1
protein in early embryos would result in an overall reduction of H1X.1 once
maternal H1X.1 has been expended during embryogenesis. A morpholino designed
to target the 5’ untranslated region (UTR) and start codon of H1X was microinjected
into fertilised X. laevis oocytes before initial cleavage (see section 2.4.4). A control
sequence morpholino, designed not to have an mRNA target, was injected into
sibling embryos.
Embryos injected with a morpholino targeting h1fx mRNA, siblings with control
morpholino and un-injected sibling embryos were collected at neurulation and
during late tailbud after hatching.
Western blot was performed on total protein extracts (see section 2.5.5) with the in-
house anti-H1X.1 affinity antibody (Figure 5.2).

145
Figure 5.2 Western blot of H1X Expression in X. laevis Knockdown Embryos.
The sequence of the H1X morpholino (A) was designed to target the 5’ UTR and
translation start site of the h1fx.1 mRNA. Fluorescein was added to the 3’ end for
fluorescence detection if injected embryos should need to be discerned. (B, C) Total
proteins were extracted from stage 14 and stage 26 X. laevis embryos following
microinjection with either 32ng H1X or 32ng standard control (SC) morpholino
oligonucleotides and from un-injected siblings at stage 26. Numbered lanes denote
stage 14 embryos injected with (1) SC MO or (2) H1X MO, stage 26 embryos injected
with (3) H1X MO or (4) SC MO and (5) un-injected stage 26 embryos. Membranes were
reversibly stained with MemCode (Pierce) and western blot performed with (B) 1:1000
dilution of anti-H1X antibody, exposed for 10 minutes and (C) 1:2000 dilution of anti-
H3 antibody (Abcam), exposed for 1 minute, as a loading control.

146
There was no obvious decrease in detection of H1X.1 protein in extracts from
embryos injected with the H1X morpholino, when compared to siblings injected
with a standard control morpholino or un-injected. Specificity of the H1X
morpholino sequence in X. laevis was checked by BLAST through Xenbase,
confirming that the only target was h1fx.1, with the morpholino target the 5’ UTR
and translation start site of the h1fx.1 mRNA (Figure 5.2A).
It may be the case that there is a large pool of persistent maternal H1X.1 protein,
masking detection of a knockdown of protein expression on western blot, or that
the morpholino was inefficient. Injections of higher amount of morpholino
oligonucleotides were unable to be performed due to limitations of injection
volumes and the concentration of the pre-diluted MO.
Morpholino oligonucleotides do not degrade mRNA or deplete proteins in oocytes
(Appendix C, Figure C-1), however another type of antisense agent, DNA-oligos,
bind to mRNA and target it for degradation by RNase-H in oocytes (Dash, Lotan,
Knapp, Kandel, & Goelet, 1987). These can be used to deplete maternal transcripts,
with the DNA-oligo then degrading as well.
However, the validity of morpholino oligonucleotide-mediated knockdown studies
had been questioned, as a significant number of zebrafish phenotypes resulting
from knockdown by morpholino oligonucleotide differed compared to knockout by
genome editing of the same gene (Kok et al., 2015). As the CRISPR-Cas9 system
was emerging as a tool for relatively simple gene editing in Xenopus, the h1fx.1 gene
was targeted for gene knockout studies as opposed to protein knockdown by design
of DNA oligonucleotides or further morpholino experiments.
5.3 CRISPR-Cas9
CRISPR-Cas9 is the most recent gene editing technology. It requires an easily-
produced single guide RNA (sgRNA) complementary to the target sequence and
Cas9, a nuclease, to introduce double-strand breaks (DSBs) in the DNA.
147
To make the sgRNA, the target DNA sequence of the gene of interest is inserted into
a cassette comprised of a CRISPR-RNA (crRNA) and trans-activating CRISPR-RNA
(trRNA). A requirement for DNA cleavage with Cas9 is that the target DNA
sequence be followed by the short nucleotide sequence NGG, where N is any
nucleotide. This forms the protospacer adjacent motif (PAM), which enables Cas9
nuclease to localize with the sgRNA at the target DNA sequence (Figure 5.3). Cas9
cuts both strands of DNA approximately three nucleotides upstream of the PAM
sequence, using two nuclease-like domains, RuvC and HNH (Jinek et al., 2012). The
cut DNA is repaired via non-homologous end joining, which introduces insertions
and deletions into the sequence.

148
Figure 5.3 Overview of the CRISPR-Cas9 System.
To generate the complete single-guide RNA template, a 5’ oligo containing the
promotor and the target sequence, followed by a portion of the sgRNA backbone
sequence (A) is annealed to a 3’ oligo (B), which contains the remaining sequence for
the correct sgRNA structure. (C) SgRNA is synthesized from the template by an in-vitro
transcription reaction and co-injected with Cas9 into fertilised embryos. SgRNA and
Cas9 RNA are co-injected into fertilised Xenopus embryos where the protospacer
adjacent motif (PAM) sequence provides recognition between the Cas9 nuclease and the
sgRNA, enabling both sgRNA and Cas9 to localise at the target sequence (D), where
Cas9 cuts both strands of DNA with two nuclease domains. (Adapted from Nakayama
et al., 2013; Charpentier and Doudna, 2013).

149

150
5.4 CRISPR in Xenopus
Most genome editing techniques in Xenopus have been performed in X. tropicalis,
due to the diploid genome of this species; however CRISPR-Cas9 has been
successfully used to disrupt ptf1a/p48, tyrosinase (Wang et al., 2015) and lhx1 genes
(DeLay et al., 2018) in X. laevis.
Two separate single guide RNAs were designed to target sections of the h1fx gene
sequence in X. laevis and X. tropicalis (Figure 5.4). As the h1fx.1 gene has only a
single exon, suitable sgRNA sequences closest to the beginning of the coding
sequence were selected.
Cas9 RNA was generated from linearised plasmid clones (see section 2.7) and co-
injected with the H1X sgRNA into fertilised Xenopus embryos. Embryos were
incubated until tailbud stages, DNA extracted and 400 bp regions spanning the H1X
sgRNA target site from single Xenopus embryos amplified by PCR and Sanger-
sequenced (Figure 5.5).
Figure 5.4 Schematic of the Xenopus h1fx.1 sgRNA sequences and target sites.
Single-guide RNA sequences were designed to target the coding regions of the (A)
X. laevis and (B) X. tropicalis h1fx.1 genes. Cas9 nuclease creates double strand breaks
(DSBs) (red line) approximately 3 bp upstream of the PAM sequence (purple).

151
Of five X. laevis embryos sequenced after injection with h1fx.1 sgRNA and Cas9
RNA, no sequences showed evidence of insertions or deletions (Figure 5.5A). The
sequences of embryos injected with sgRNA and Cas9 were compared with those
injected with Cas9 RNA only using TIDE (Tracking of Indels by Decomposition)
(Brinkman, Chen, Amendola, & van Steensel, 2014) software (Desktop Genetics,
https://www.tide.deskgen.com) (Figure 5.5B). A very low efficiency of insertions
and deletions caused by the X. laevis h1fx.1 sgRNA and Cas9 RNA was modelled by
TIDE, confirming the overall negative result seen from analysis of the sequencing
chromatograms.
Greater success was seen in X. tropicalis embryos injected with h1fx.1 sgRNA and
Cas9 RNA. Half of embryos tested showed subtle disruptions in the sequencing
chromatograms. Cas9 is expected to create double-strand breaks in DNA
approximately three base-pairs upstream of the PAM site (Jinek et al., 2012);
however, peak perturbation appeared approximately 43 bp upstream of the PAM
site, where two short peaks overlapped, in comparison to the uniform peaks of the
control sequence; however this may have been a single-nucleotide polymorphism
(Figure 5.5C). Embryos generated by CRISPR-Cas9 are mosaic, as multiple DNA
molecules in the fertilised embryo are targeted, with non-homologous end joining
to repair DNA after DSBs introducing random insertions and deletions, which are
passed down by cell division (Reviewed by Mehravar, Shirazi, Nazari, & Banan,
2019). As CRISPR must compete with cell division in the early embryo, some DNA
molecules replicate without being affected by CRISPR-Cas9 (Hsu, Lander, & Zhang,
2014).

152
Figure 5.5 Comparison of CRISPR-Cas9 efficiency in X. laevis and X. tropicalis.
No disruption to the h1fx.1 target sequence was seen in X. laevis embryos injected with
400 pg h1fx.1 sgRNA and 2 ng Cas9 RNA, compared to control embryos injected only
with 2 ng Cas9 RNA (A). Analysis of the sequences of injected and control embryos by
TIDE (B) confirmed low CRISPR efficiency, with very few insertion events and nearly
no aberrant sequences. In X. tropicalis embryos injected with 200 pg h1fx.1 sgRNA and
1 ng Cas9 RNA, sequence disruption appeared very subtle (C), with a short overlapping
peak (purple shading) indicating non-homologous end joining had occurred. TIDE
however showed a high efficiency of the h1fx.1 sgRNA and Cas9 (D), with nearly half of
sequences showing insertions, and a higher percentage of aberrant sequences compared
to the control.
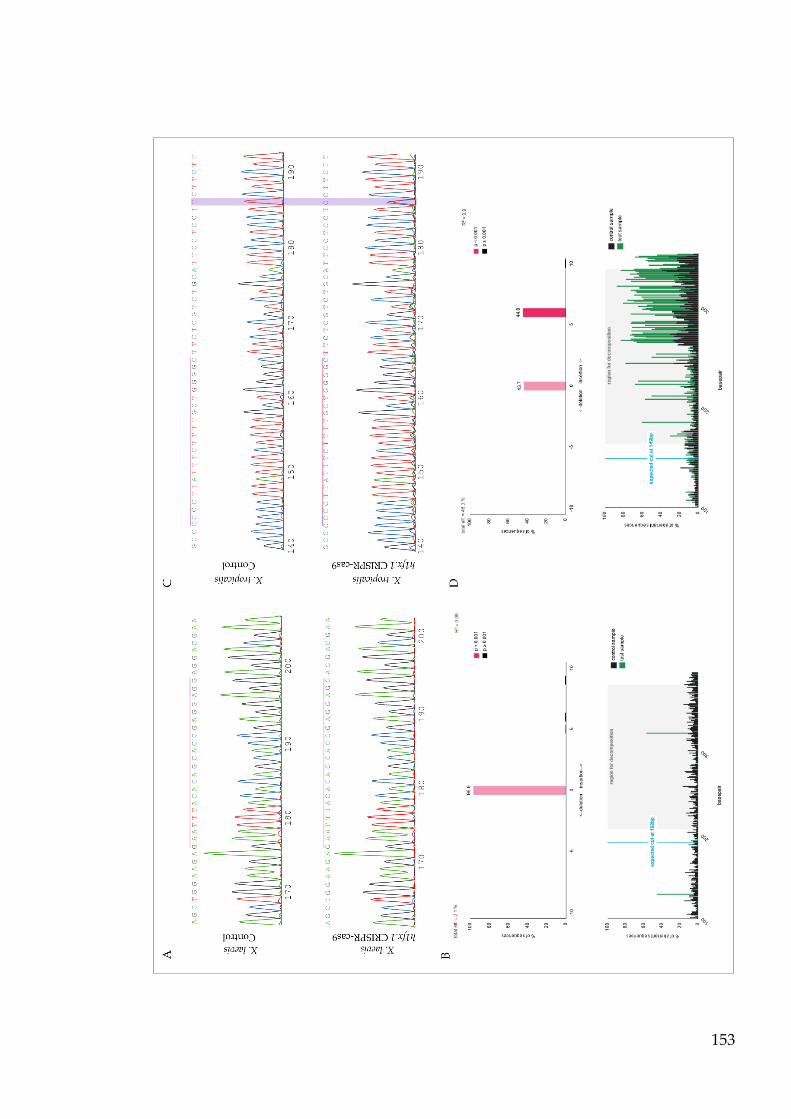
153

154
To confirm the validity of the overlapping peaks, the PCR product was sequenced
from the reverse direction and the chromatogram re-orientated for comparison with
the forward sequence. It revealed many overlapping peaks in the region targeted
by the sgRNA and an insertion or deletion closer to the PAM site, where double-
strand breaks would be expected (Appendix C, Figure C-2). Analysis using TIDE
estimated 46.3% efficiency of the sgRNA and Cas9, with insertions in the h1fx.1
sequence the most abundant result of the genome editing (Figure 5.5D).
The above result indicated that the h1fx.1 sgRNA and Cas9 RNA was suitable for
generating mosaic X. tropicalis embryos, in which a proportion of cells contained
DNA with the h1fx.1 gene disrupted by insertions or deletions. The shorter
generation time of X. tropicalis also enabled creation of h1fx.1 gene knock-out lines,
by breeding CRISPR-injected founders to establish X. tropicalis with the same
insertions or deletions to the h1fx.1 gene.
5.4.1 Generation of mosaic X. tropicalis founders with CRISPR-Cas9 RNA
To compensate for the less than 50% predicted efficiency of the CRISPR, over 100
X. tropicalis embryos were injected with h1fx.1 sgRNA and Cas9 RNA. After
development to embryonic stage 41, X. tropicalis were housed in the European
Xenopus Resource Centre (Portsmouth). Six survived to maturity and were toe-
clipped under anaesthesia by licensed EXRC animal technicians. DNA was
extracted separately from each toeclips and the h1fx.1 gene amplified by PCR and
sequenced (see section 2.7.7).
Half of the X. tropicalis showed disruption to the h1fx.1 target region compared to
controls. The frog assigned as number six showed the most disruption to the DNA
sequence following analysis of the chromatogram (Figure 5.6A).

155
Figure 5.6 Sequencing and TIDE analysis of an adult X. tropicalis following genome
editing by CRISPR-Cas9.
Forward and reverse sequencing of a region of the h1fx.1 gene was performed using
DNA extracted and PCR-amplified from a toeclip of an adult X. tropicalis injected with
200 pg h1fx.1 sgRNA and 1 ng Cas9 RNA as an embryo and compared to a control (A).
The forward sequencing chromatogram showed multiple overlapping peaks from the
sgRNA target site (pink line). Reverse sequencing showed small peaks, suggesting the
sequencing reaction was less successful. Sequencing from an embryo injected only with
Cas9 RNA appeared normal. TIDE analysis estimated lower efficiency than previously
indicated for the sgRNA (B), with a range of different sized deletions and insertions. A
large percentage of aberrant sequences were present compared to the control, with
greater sequence decomposition after the predicted cut site. The PCR product was
subcloned and sequenced to identify individual insertions or deletions (C). All deletions
were of three nucleotides or more (blue highlight), with similar regions of deletion seen
between all clones. Subclones 1 and 3 were identical. Several base changes were seen
(bold) as well as un-called nucleotides (N). Longer portions of the chromatograms
shown in (A) are shown in Appendix C, Figure C-3.

156

157
The chromatogram of the forward sequencing reaction showed multiple
overlapping peaks slightly before, after and throughout the sgRNA target sequence,
however only small single peaks were seen in the complementary reverse
sequencing reaction (Figure 5.6A). No disruptions to peaks were apparent in a
sequence from a control embryo injected only with Cas9 RNA. TIDE analysis
calculated around 19% total efficiency of the CRISPR (Figure 5.6B), nearly 30%
lower than previously indicated (Figure 5.5D). However, a greater range of
insertions and deletions were indicated affecting a smaller percentage of sequences.
To isolate the individual insertion or deletions around the h1fx.1 target sequence,
the PCR-amplified region was subcloned, with nine clones sequenced (see section
2.7.9). Subclone sequences were aligned with the h1fx.1 reference sequence and
sequence from a control embryo injected with Cas9 only (Figure 5.6C).
Nearly 100% of clones showed alterations to the canonical h1fx.1 sequence, with
exception of clone 4, which did not sequence well in the region of interest. Deletions
were the most common, with the same sequence deletion represented in at least two
subclones. Also commonly seen were base changes, which may have been errors in
base-calling by the sequencer or, when compared between the reference sequence,
subclones and control, gene polymorphisms in the population of X. tropicalis used.
Interestingly, frog six also had the slowest growth compared to siblings and a
smaller size at six months of age (Figure 5.7A), though it could not be confirmed
whether this was an effect of the h1fx.1 CRISPR.
Photographs of wildtype and genetically altered (GA) female and male X. tropicalis
were taken for comparison (Figure 5.7B,C), however although efforts were made to
find frogs at a similar age to h1fx.1 CRISPR X. tropicalis, there is variability in
growth. For example, the wildtype female and male (Figure 5.7B), both twelve
months old, metamorphosed approximately seven months after breeding.
However, the genetically altered (GA) female (Figure 5.7B) metamorphosed after
158
approximately four months. Both GA male and female were around eight months
old at the time of photographing. Meanwhile, the X. tropicalis injected with h1fx.1
CRISPR and Cas9 RNA had metamorphosed within six months.
Owing to its small size, the gender of frog six could not be determined and it could
not be bred. Two mature female h1fx.1 CRISPR-injected X. tropicalis remained, both
of which showed disruption in their chromatogram sequences and displayed
deletions in sequences of subclones (Appendix C, Figure C-4). These two females
were naturally mated with wild-type males. Unfortunately, both females perished,
as did their offspring and frog six, shortly after.
Due to space constraints, no control embryos from the experiment, injected with
only Cas9 RNA, were maintained in the EXRC. However, throughout
embryogenesis, slightly less control embryos died than the mosaic h1fx.1 embryos,
measured until stage 41 at which h1fx.1 mosaics were moved to the EXRC
(Appendix C, Figure C-5), where later only six survived past metamorphosis.
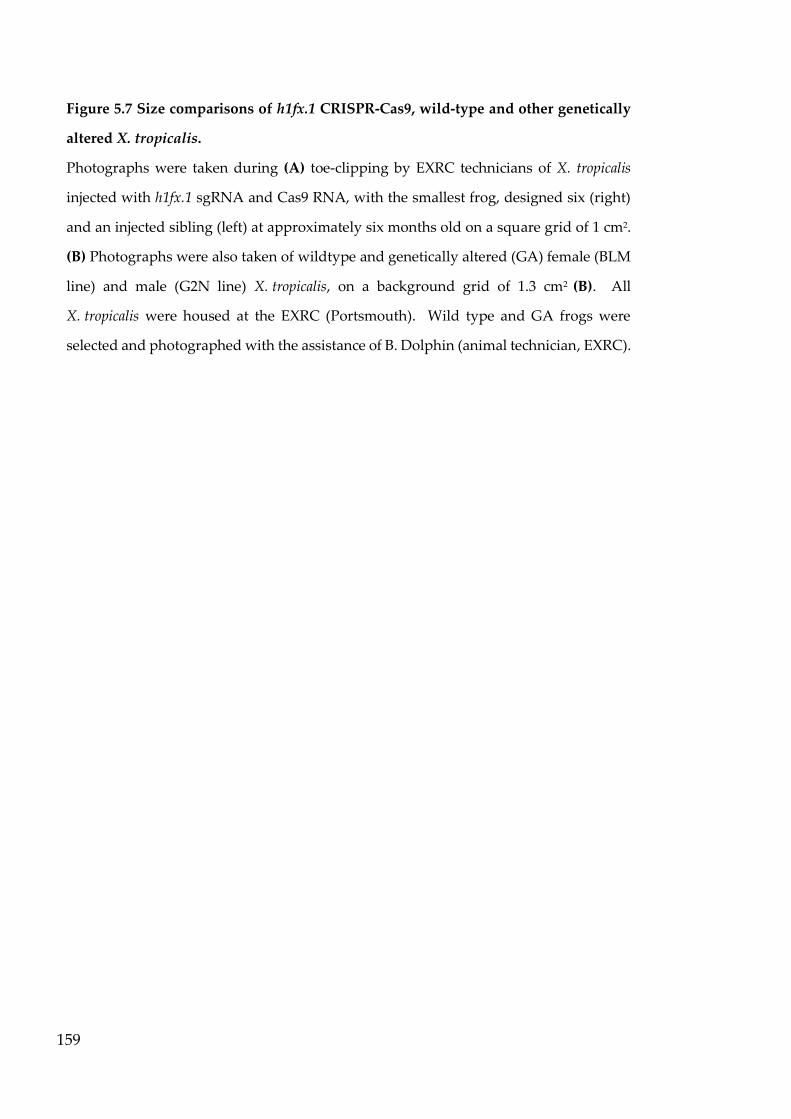
159
Figure 5.7 Size comparisons of h1fx.1 CRISPR-Cas9, wild-type and other genetically
altered X. tropicalis.
Photographs were taken during (A) toe-clipping by EXRC technicians of X. tropicalis
injected with h1fx.1 sgRNA and Cas9 RNA, with the smallest frog, designed six (right)
and an injected sibling (left) at approximately six months old on a square grid of 1 cm2.
(B) Photographs were also taken of wildtype and genetically altered (GA) female (BLM
line) and male (G2N line) X. tropicalis, on a background grid of 1.3 cm2 (B). All
X. tropicalis were housed at the EXRC (Portsmouth). Wild type and GA frogs were
selected and photographed with the assistance of B. Dolphin (animal technician, EXRC).

160

161
5.4.2 Re-design of higher efficiency sgRNAs
No subclones had shown evidence of DSBs within the expected three base-pairs
upstream of the PAM site, and all previously generated X. tropicalis had died. The
efficiency of the existing h1fx.1 sgRNA, predicted by TIDE, also seemed to vary. As
new browser-based online tools had become available for predicting and designing
high-efficiency sgRNA target sequences, two new sgRNA sequences were
generated using CRISPRscan (CRISPRscan.org) (Moreno-Mateos et al., 2015).
Predicted sgRNAs were rejected if they contained many repeats or were near the
end of the h1fx.1 gene and were checked for off-target activity by BLAST.
The quality of X. tropicalis embryos had declined due to a power outage affecting
the parent frogs, so two different concentrations of sgRNA and Cas9 protein were
injected into as many healthy embryos as possible, often using embryos from two
different females. Co-injection of Cas9 protein with sgRNA had widely replaced
Cas9 RNA and required lower concentrations. Control embryos were injected with
Cas9 protein or sgRNA alone.
To assess insertion and deletions following injection, the T7 endonuclease 1
mismatch detection assay was used (see section 2.7.11). Briefly, following DNA
extraction and PCR amplification of the target region, the PCR product is denatured
and re-complexed in a thermocycler, allowing heteroduplexes to form between
products of different lengths caused by insertions or deletions, which T7
endonuclease then cuts (Sentmanat, Peters, Florian, Connelly, & Pruett-Miller,
2018).
The T7 assay was performed to screen separate embryos injected with two
concentrations of each sgRNA and Cas9 protein, along with controls (Figure 5.8).
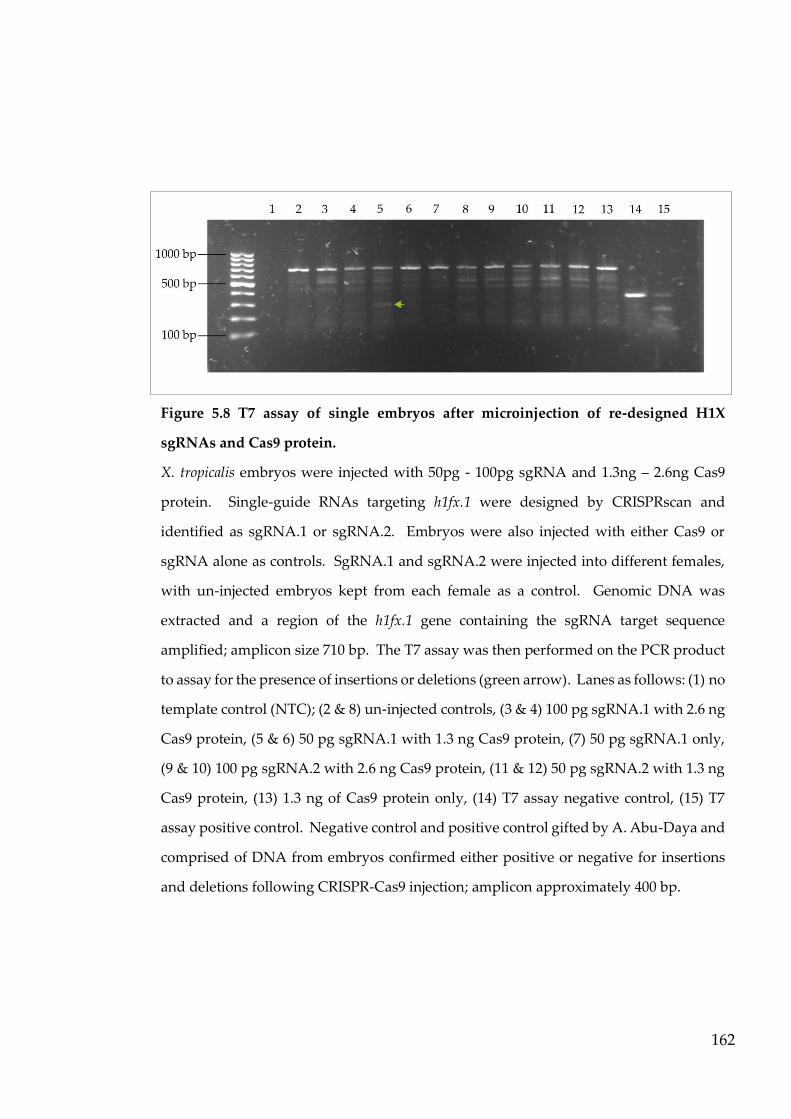
162
Figure 5.8 T7 assay of single embryos after microinjection of re-designed H1X
sgRNAs and Cas9 protein.
X. tropicalis embryos were injected with 50pg - 100pg sgRNA and 1.3ng – 2.6ng Cas9
protein. Single-guide RNAs targeting h1fx.1 were designed by CRISPRscan and
identified as sgRNA.1 or sgRNA.2. Embryos were also injected with either Cas9 or
sgRNA alone as controls. SgRNA.1 and sgRNA.2 were injected into different females,
with un-injected embryos kept from each female as a control. Genomic DNA was
extracted and a region of the h1fx.1 gene containing the sgRNA target sequence
amplified; amplicon size 710 bp. The T7 assay was then performed on the PCR product
to assay for the presence of insertions or deletions (green arrow). Lanes as follows: (1) no
template control (NTC); (2 & 8) un-injected controls, (3 & 4) 100 pg sgRNA.1 with 2.6 ng
Cas9 protein, (5 & 6) 50 pg sgRNA.1 with 1.3 ng Cas9 protein, (7) 50 pg sgRNA.1 only,
(9 & 10) 100 pg sgRNA.2 with 2.6 ng Cas9 protein, (11 & 12) 50 pg sgRNA.2 with 1.3 ng
Cas9 protein, (13) 1.3 ng of Cas9 protein only, (14) T7 assay negative control, (15) T7
assay positive control. Negative control and positive control gifted by A. Abu-Daya and
comprised of DNA from embryos confirmed either positive or negative for insertions
and deletions following CRISPR-Cas9 injection; amplicon approximately 400 bp.

163
Although multiple bands were seen in many samples, only lane 5, from an embryo
injected with 50 pg sgRNA.1 and 1.3 ng Cas9, showed the presence of an extra band
not seen in any controls. However, the extra band was not present in the second
sample from an embryo injected with the same sgRNA and Cas9. This indicated
that it was a moderately effective CRISPR, affecting only one of two embryos, but
at a suitable concentration for generation of h1fx.1 mosaic X. tropicalis.
5.4.3 Generation of mosaic X. tropicalis with CRISPR-Cas9 protein
As X. tropicalis embryos showed general poor fertilisation and survival rates,
multiple attempts were made to inject and develop embryos to maturity. Around
60 embryos were injected with 50 pg sgRNA.1 and 1.3 ng Cas9 protein, as
ascertained to be effective at causing insertions and deletions by the T7 assay. At
embryonic stage 41, approximately 100 un-injected control sibling embryos and 46
surviving CRISPR-injected embryos were transferred to the EXRC.
Unfortunately, the survival rates of even the un-injected controls after stage 41 were
very low, with the final two surviving h1fx.1 sgRNA.1 and Cas9 protein injected
embryos perishing after six months, without metamorphosing. DNA was extracted
from the tails and photographs taken of the tadpoles (Figure 5.9).
A large difference in size was seen, even though both were siblings and around six
months old (Figure 5.9). DNA extracted from the tails was amplified by PCR,
sequenced and then analysed by TIDE as previously described.
A very low efficiency of 0.2% was seen in tadpole A, suggesting it may not have
been affected by the CRISPR (Figure 5.9B). However, CRISPR in tadpole B, the
smaller of the two, was estimated to have 95% efficiency by TIDE, with the
percentages of sequences with deletions or insertions almost equal (Figure 5.9D).
The was a greater percentage of aberrant test sample sequences compared to the
control however, which may suggest the test sample DNA may have been of poorer

164
quality; tadpoles had been in EXRC frozen storage after death and were thawed
before tails could be removed for DNA extraction.

165
Figure 5.9 Analysis of h1fx.1 sgRNA.1 efficiency in X. tropicalis tadpoles.
Two tadpoles injected as embryos with 50 pg h1fx.1 sgRNA.1 and 1.3 ng Cas9 protein
died after approximately six months without metamorphosing. Photographs were
taken against 1.3 cm2 grid (A, B). The larger of the two tadpoles (A) showed no
alterations to the h1f.x gene sequence in DNA extracted from the tail and very low
efficiency of genome editing (C). TIDE analysis of the h1f.x sequence from the smaller
tadpole (B) showed high number of insertions and deletions (D), however the
percentage of aberrant sequences before the after the expected cut site indicated a poor-
quality DNA sequence.
166
5.5 Discussion
5.5.1 H1X.1 protein was not depleted by morpholino oligonucleotide
Initial depletion of H1X.1 protein expression was trialled with a morpholino
oligonucleotide targeting the h1fx.1 mRNA in X. laevis embryos, however H1X.1
protein signal was not decreased in neurula or tailbud stages after injection (Figure
5.2), at which point zygotic transcription had replaced maternal. This suggested
either limited efficiency of the morpholino, or that H1X.1 protein was persistent.
To test the effectiveness of the morpholino, the target gene could be transcribed and
translated with a label in vitro, in the presence of the morpholino oligonucleotide,
then analysed to see if the morpholino decreased the amount of protein translated
compared to a reaction without the morpholino present (Timme-Laragy, Karchner,
& Hahn, 2012). Alternatively, DNA oligonucleotides could be designed to target
and degrade h1fx.1 mRNA in oocytes, followed by maturation of oocytes and
implantation into the ovary of a female frog, in technique known as host transfer
(Houston, 2018; Schneider, Hulstrand, & Houston, 2010). DNA-oligos cannot be
used in fertilised embryos due to toxicity, and a conventional morpholino would
still be needed to deplete mRNA produced by zygotic transcription (Reviewed by
Heasman, 2002).
It is widely known that morpholinos can exhibit off target effects and may require
multiple controls, such as a standard control morpholinos, a second morpholino to
the target mRNA to confirm the phenotype, or rescue of the phenotype by injecting
RNA (Reviewed by Heasman, 2002). There have also been discrepancies reported
between phenotypes of morphant organisms generated by morpholino knockdown
compared to the same organism mutated by genome editing (Kok et al., 2015),
meaning that more rigorous controls for morpholino experiments, such as
generation of a genetic mutant for the gene of interest, are needed.
167
5.5.2 Genome editing of the h1fx.1 gene in X. tropicalis
Recent genome editing systems such as CRISPR-Cas9 are relatively simple to design
and produce compared to previous methods requiring cloning, such as ZFNs and
TALENs. However, sgRNAs also show variably efficiency, for example, X. laevis
h1fx.1 was not highly affected by the sgRNA, unlike X. tropicalis h1fx.1. Sequencing
of DNA from toeclips of X. tropicalis injected with h1fx.1 sgRNA and Cas9 RNA
revealed that all deletions were in multiples of three. This means the sequence was
likely still in-frame and gene activity may not have been greatly affected. The
closest upstream deletions were 61 bp from PAM site, with a deletion in a single
clone appearing approximately 11 bp downstream of the cut site. This supports a
low-efficiency of the CRISPR for cutting at the target site, as no clones with
insertions or deletions within the sgRNA target were found. Additionally, the
repetitive h1fx.1 gene sequence may have been too complex for DNA polymerases
in DNA sequencing reactions. Aligning repetitive sequences with sequence
alignment programs, especially when insertions and deletions were present, was
also subjective.
The design of sgRNA sequences with higher efficacy were improved by
computational tools, compared to manual searches of the h1fx.1 gene for suitable
target sequences. Only two sgRNA sequences were selected, synthesised and tested
in X. tropicalis embryos, from a pool of several sgRNAs predicted by online tools.
The T7 assay was valuable as a simple and cheap assay for detection of insertions
and deletions before sequencing. However, comparisons between methods for
downstream analyses of CRISPR-Cas9 insertions and deletions found discrepancies
between the frequency of non-homologous end joining events indicated by the T7
assay and actual frequency in a pool of cells (Sentmanat et al., 2018). Although
requiring sequencing data, TIDE predicted insertion sizes with higher accuracy and
at comparable efficiency to next-generation sequencing (Sentmanat et al., 2018).

168
In addition to new sgRNA design tools, Cas9 protein became commercially
available, replacing Cas9 RNA. Cas9 RNA was produced by linearization of
plasmid DNA and in vitro transcription, introducing slight inconsistency each
occasion Cas9 RNA was produced. This was not a problem with commercial Cas9,
validated and supplied at a specified concentration. A limitation of injecting Cas9
RNA is that it must be translated before it can edit the genome, however Cas9
protein can localise immediately to the sgRNA. Evidence of DSBs was seen after
microinjection with 50 pg sgRNA and 1.3 ng Cas9 protein (Figure 5.8) and 200 pg
sgRNA with 1 ng Cas9 RNA (Figure 5.6).
5.5.3 X. tropicalis mosaic for h1fx.1 were viable
CRISPR-Cas9 enabled generation of h1fx.1 founder X. tropicalis, however these did
not survive to confirm germ-line transmission of mutations to the h1fx.1 gene. Low
survival rates could be caused by a high efficiency h1fx.1 CRISPR-Cas9 being lethal
to embryos, however this does not explain the low survival rates of un-injected
embryos. Interestingly, one frog (Figure 5.7A) and one tadpole (Figure 5.9B)
generated by two separate h1fx.1 sgRNAs and Cas9 RNA or Cas9 protein were both
unusually small compared to siblings, suggesting H1X.1 may be important for
growth in Xenopus.
Greater numbers of X. tropicalis embryos displaying small size would be needed to
confirm whether h1fx.1 gene disruption is the cause, or whether the phenotype is an
off-target effect of the CRISPR-Cas9.
The only prior data available for h1fx knockout in a model organism was from
breeding of homozygous and heterozygous h1fxtm1.1(KOMP)Vkg knockout mice, at the
International Mouse Phenotyping Consortium (IMPC) database. The database
described that homozygous knockouts were viable but showed significant
phenotypes including increased lean body mass, decreased body fat, a shortened
RR interval (heart rate) and abnormal brain morphology (Dickinson et al., 2016).
Meanwhile, heterozygous knockout mice were viable but showed abnormal spinal

169
cord morphology and an increased circulating sodium level (Dickinson et al., 2016).
In X. tropicalis depleted of H1X, the only observed phenotype in tadpoles was small
size compared to siblings, though at least four embryos injected with h1fx.1
sgRNA.1 and Cas9 protein grew with kinked tails (not shown) and were euthanised
by EXRC animal technicians. The poor survival rates of un-injected embryos
however resulted in difficulty distinguishing actual phenotypes from background.
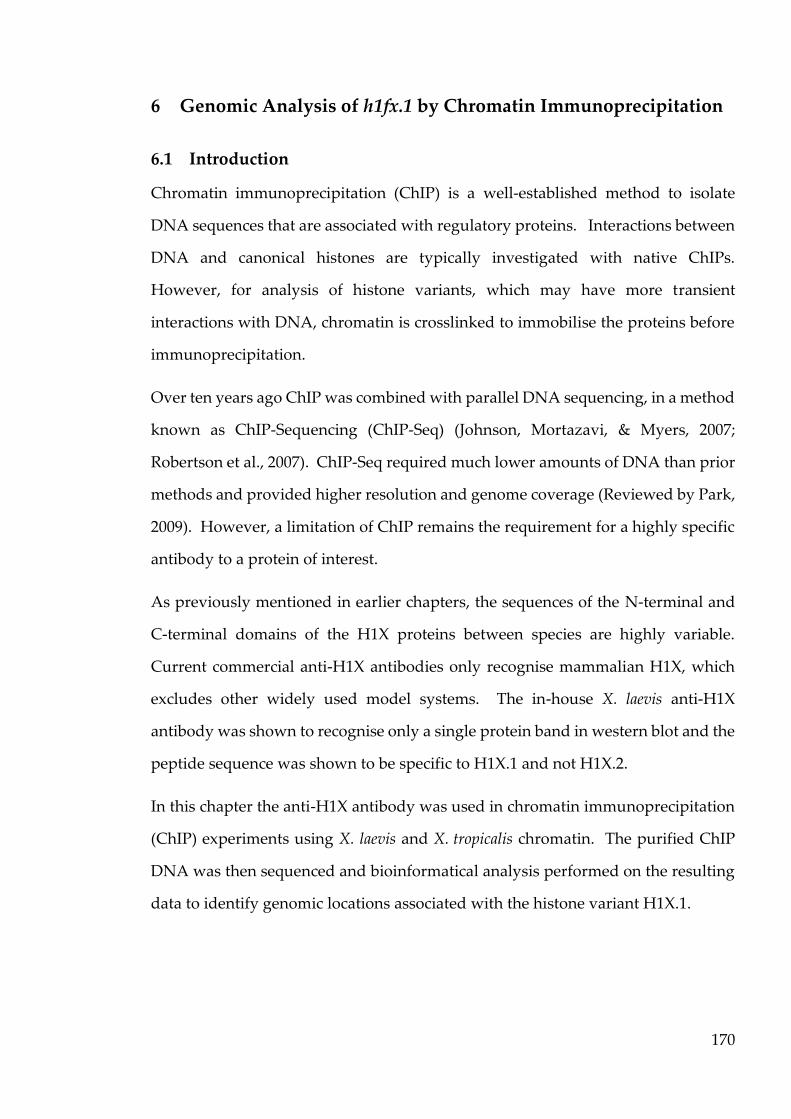
170
6 Genomic Analysis of h1fx.1 by Chromatin Immunoprecipitation
6.1 Introduction
Chromatin immunoprecipitation (ChIP) is a well-established method to isolate
DNA sequences that are associated with regulatory proteins. Interactions between
DNA and canonical histones are typically investigated with native ChIPs.
However, for analysis of histone variants, which may have more transient
interactions with DNA, chromatin is crosslinked to immobilise the proteins before
immunoprecipitation.
Over ten years ago ChIP was combined with parallel DNA sequencing, in a method
known as ChIP-Sequencing (ChIP-Seq) (Johnson, Mortazavi, & Myers, 2007;
Robertson et al., 2007). ChIP-Seq required much lower amounts of DNA than prior
methods and provided higher resolution and genome coverage (Reviewed by Park,
2009). However, a limitation of ChIP remains the requirement for a highly specific
antibody to a protein of interest.
As previously mentioned in earlier chapters, the sequences of the N-terminal and
C-terminal domains of the H1X proteins between species are highly variable.
Current commercial anti-H1X antibodies only recognise mammalian H1X, which
excludes other widely used model systems. The in-house X. laevis anti-H1X
antibody was shown to recognise only a single protein band in western blot and the
peptide sequence was shown to be specific to H1X.1 and not H1X.2.
In this chapter the anti-H1X antibody was used in chromatin immunoprecipitation
(ChIP) experiments using X. laevis and X. tropicalis chromatin. The purified ChIP
DNA was then sequenced and bioinformatical analysis performed on the resulting
data to identify genomic locations associated with the histone variant H1X.1.

171
6.2 Chromatin Immunoprecipitation in Xenopus
An optimised method for extracting and shearing Xenopus crosslinked chromatin,
was utilised to increase the shearing efficiency of sonication, by first removing yolk
proteins and lipids (Blythe et al., 2009). For the ChIP experiments in this chapter,
the anti-H1X affinity purified antibody was coupled to biotin and magnetic beads
coated in streptavidin used to capture antibody-chromatin complexes, instead of
traditional protein G agarose beads. The biotin-streptavidin interaction allows
improved yield of immunoprecipitated material and higher efficiency ChIP washes,
as a magnetic stand is used to separate the bead complexes from solution as
opposed to centrifugation.
Biotinylated, affinity-purified anti-H1X antibodies were used for ChIP experiments
with sheared X. laevis chromatin from early and late embryos; X. laevis stages 11 and
26, X. tropicalis stages 10 and 25. Input, bound and unbound samples were
recovered for each stage (Figure 6.1).

172
All X. laevis and X. tropicalis bound samples and two input samples were diluted in
a range according to sequencing requirements (Table 6.1). Library preparation and
ChIP-Sequencing were performed by Theragen Etex, South Korea.
Figure 6.1 Elution of DNA fragments after chromatin immunoprecipitation (ChIP).
The concentration of purified DNA eluted from ChIP experiments was evaluated by a
NanoDrop1000 spectrophotometer. X. laevis, (A) Input, (B) Late stage bound, (C) Early
stage bound. X. tropicalis, (D) Input, (E) Late stage bound, (F) Early stage bound.

173
Table 6.1 Dilution of DNA eluted after ChIP to ChIP-Seq requirements.
6.3 Bioinformatic analysis
Bioinformatics is the use of computational systems to analyse large amounts of
biological data, such as genome sequencing. Most programs and tools for
bioinformatic analyses are controlled from the command line of an operating
system such as Linux.
Before analysis could begin on the raw sequencing data, it was first practical to
assess the quality of the sequencing data.
6.3.1 Quality control of raw sequence files
FastQC (Andrews, 2018) was used to evaluate the data in each sequencing file. The
early and late sample FastQC reports for were combined for X. laevis (Figure 6.2)
and X. tropicalis (Appendix D, Figure D-1) by MultiQC (Ewels, Magnusson, Lundin,
& Käller, 2016).
Sample Name Sample Concentration
(ng/ul)
Sample Volume
(ul)
X. laevis Input DNA (stage
26) 2.1 30
X. tropicalis Input DNA
(stage 10) 5.0 30
X. laevis stage 26 Bound DNA
(late sample) 2.5 30
X. laevis stage 11 Bound DNA
(early sample) 7.1 30
X. tropicalis stage 25 Bound
DNA (late sample) 3.8 30
X. tropicalis stage 10 Bound
DNA (early sample) 5.7 30

174
Figure 6.2 Quality assessment of X. laevis raw sequences after ChIP-Seq.
MultiQC was used to combine X. laevis individual FastQC reports. (A) sequence count plot.
(B) The mean quality score of each base, indicating good (green), acceptable (amber) or bad
(red). (C) The per-base N content, indicating regions where no base was called.
(D) Sequence duplication levels. (E) The per-base sequence content; each base has a
random chance of appearing. (F) The per-sequence quality score. (G) Adaptor content.
(H) The per-sequence GC content.

175
Around 20 million unique reads were reported for each sample (Figure 6.2A), with
most sequences indicated to have Phred scores above 30 (Figure 6.2B). The Phred
score is a measure of the likelihood that the base was called incorrectly; a score of
30 correlates to a 1 in 1000 chance that the base has been incorrectly called, or a
99.9% accuracy of the base call.
A high amount of sequence duplication can indicate PCR bias, thus less is better for
ChIP-Seq. Figure 6.2D showed only a small amount of read duplication, suggesting
PCR bias was low. Similarly, no spikes were seen in the per-base sequence content
(Figure 6.2E); spikes would indicate bias and un-predictability. The GC content
(Figure 6.2H) followed a normal distribution, showing no rough peaks or spikes
which would have indicated contamination of the sequences with other DNA.
Adapter sequences are short sequences added to the ends of DNA fragments during
library construction prior to sequencing, which contain priming sites for DNA
amplification. This resulted in raw sequencing files having a high adaptor content
(Figure 6.2G).
Also generated by FastQC was a visual representation of all the flow cells in the
sequencer (Appendix D, Figure D-2). These showed a lane effect in all the paired-
end samples in similar patterns. As the affected tiles were concentrated together, it
may have been caused by incomplete washing over the flow cell during sequencing,
or an air-bubble becoming trapped over those lanes. These sequences, as well as
adaptors, were removed during subsequence trimming.
6.3.2 Trimming raw sequences and additional quality control
After initial quality control, all sequencing files including input samples were
trimmed. A second round of quality control assessment with FastQC was
performed on all the trimmed data and the reports combined with MultiQC (Figure
6.3; Appendix D, Figure D-1).

176
Figure 6.3 Quality assessment of X. laevis sequences after trimming.
MultiQC was used to combine X. laevis individual FastQC reports. (A) sequence count
plot. (B) The mean quality score of each base, indicating good (green), acceptable (amber)
or bad (red). (C) The per-base N content, indicating regions where no base was called.
(D) Sequence duplication levels. (E) The per-base sequence content; each base has a
random chance of appearing. (F) The per-sequence quality score. (G) Sequence length
distribution. (H) The per-sequence GC content.

177
Trimming is important firstly for removal of adapter sequences, which can anneal
together and contaminate the sequence data. The trimming program automatically
detected and removed the adaptor sequences used, in this case Illumina TruSeq
adapters. After trimming, no samples were found with adaptor contamination
greater than 0.1%, indicating complete removal. Trimming also removed poor-
quality reads, shown by an increase in the mean quality scores of the remaining
reads (Figure 6.4F). Due to the removal of adapters and low-quality sequences, the
sequence content across all bases was altered but remained proportional between A
and T, C and G. The sequence length distribution was initially uniform; after
removing adaptors sequence length varied, with the highest proportion around 150
bp.
As the sequence data was paired-end and fragments were sequenced in forward
and reverse orientation, each sample had two data files, denoted paired-end 1 and
paired-end 2. Both paired-end files were treated together through trimming so that
any sequences removed in one file would have their corresponding sequence
removed in the other paired-end file, maintaining sequence alignment between both
files.
6.3.3 Mapping trimmed sequences
After mapping the trimmed sequence files in their pairs to their respective genomes,
the reads were filtered (Table 6.2) to remove reads that were unmapped, duplicated
or unpaired (singletons). This resulted in 36,599,964 reads that mapped uniquely,
out of a total of 52,846,846 reads before filtering.

178
Table 6.2. Filtering ChIP-Seq Reads.
Reads mapped by Bowtie2 were compared before and after filtering unmapped and
unpaired reads using SAMtools.
The raw sequencing files were also run through a pipeline of trimming, mapping
and peak calling by S. Robson (Senior Research Fellow, Bioinformatics, University
of Portsmouth) (Appendix D, Tables D-1 and D-2). The paired end reads were
mapped separately and then combined. More stringent filtering methods for
X. laevis early pre-
filtering
X. laevis early post-
filtering
Total reads 52,846,846 36,599,964
Secondary reads 0 0
Supplementary reads 0 0
Duplicate reads 0 0
Mapped reads 48,567,221 (91.90%) 36,599,964 (100.00%)
Reads paired in
sequencing
52,846,846 36,599,964
Read1 26,423,423 18,299,982
Read2 26,423,423 18,299,982
Properly paired reads 46,610,338 (88.20%) 36,599,964 (100.00%)
With itself and mate
mapped
47,641,356 36,599,964
Singletons 925,865 (1.75%) 0
Mate mapped to
different chromosome
484,702 0
Mate mapped to
different chromosome
(mapQ>=5)
318,585 0

179
quality scores resulted in an average of 20 million uniquely mapped reads for each
sample. These sequencing files were used for further analyses.
6.3.4 Visualisation and peak finding
Model-based Analysis of ChIP-Seq (MACS 2.1.0) (Zhang et al., 2008) evaluates
regions of enrichment using an input control sequence and ChIP bound sequence.
Despite a similar number of reads in each sample there were large differences in the
numbers of peaks called (Figure 6.4).
Peaks were also analysed by the annotated genomic region they were called in
(Figure 6.5), to evaluate enrichment in any specific region. One peak was
represented at a single region only and peaks were ranked in the following order;
promoter, immediate downstream, 5’ UTR, 3’ UTR, exon, intron and finally
intergenic regions. The highest percentage of peaks for all samples were in
intergenic regions. The fact that X. laevis early and late samples both show 20% of
peaks at promoters, but that much fewer peaks were called in the late sample
suggests that it is a random pattern and not indicative of specific enrichment of
H1X.1 peaks at promoters.

180
Figure 6.4 The number of peaks called for each sample by MACS2.
Peaks called by MACS2 were counted and plotted for both early and late stage X. laevis
and X. tropicalis embryos.

181
Figure 6.5 Distribution of peaks by annotated genomic region.
The percentage of peaks called by MACS2 were plotted by genomic region using in-
house R scripts by S. Robson for X. laevis and X. tropicalis early and late samples.

182
6.3.5 H1X.1 signal is reduced in late stage Xenopus embryos
The ChIP signals, or enrichments, relative to the centre and 5 kb either side of all
peaks in each dataset after trimming, mapping and filtering were plotted as heat
maps, showing the signal density across genomic loci (Figure 6.6).
Signal intensity for the three samples from each species were normalised to the
highest sample; in X. laevis this was the early sample, which showed strong and
clear signal (Figure 6.6A).
Despite fewer peaks called by MACS2 in the X. laevis late sample overall, there was
ChIP signal, albeit reduced, in the same genomic loci as the X. laevis early sample.
This suggests that enrichments are in similar regions for both early and late samples.
While not all these regions of enrichment were called as peaks by MACS2, as likely
they are below threshold, their presence indicates a reduction in overall signal in
late embryos rather than a lack of signal; the latter would indicate no enrichment,
as seen in the input sample.
A decrease in signal density was also displayed in the late X. tropicalis sample
compared to the early, though not as distinct as for X. laevis and with the presence
of more background and fewer peaks, resulting in rougher plots (Figure 6.6B).

183
Fig
ure
6.6
Hea
tmap
s o
f C
hIP
sig
nal
den
sity
.
All
pea
ks
wer
e al
ign
ed a
t th
eir
cen
tres
to
sh
ow
en
rich
men
ts b
y i
nte
nsi
ty o
f si
gn
al.
Th
e si
gn
al w
as n
orm
alis
ed t
o t
he
sig
nal
of
the
hig
hes
t
sam
ple
fo
r ea
ch s
pec
ies.
(A
) X
. lae
vis
earl
y a
nd
(B
) X
. tro
pica
lis
earl
y.
Th
e h
eatm
ap w
as g
ener
ated
usi
ng
R s
crip
ts b
y S
. Ro
bso
n.
184
6.3.6 Analysis of ChIP efficiency
The efficiency of the ChIPs was calculated and plotted as a fingerprint (Figure 6.7).
The plot fingerprint represents the extent to which the ChIP-Seq bound sample can
be distinguished from the background, by comparison to the ChIP-Seq input
sample. A model input would be depicted by a line close to diagonal, as this
represents that the reads are equally spread throughout the genome without
enrichment, such as in fingerprint plots seen in Supplementary Figure S1 by Gómez-
Díaz, Rivero, Chandre and Corces (2014). For bound samples, a curve with a low
area under it and a sharp rise represents very specific enrichments; as seen in
Supplemental Figure S1A by Kawalek, Bartosik, Glabski and Jagura-Burdzy (2018).
However, the X. laevis early sample signal showed a less defined difference
compared to the input (Figure 6.7A), while the X. laevis late sample was nearly
identical to the input sample on the fingerprint. Both X. tropicalis early and late
samples were of a similar fingerprint (Figure 6.7B), though were less distinguished
from the X. tropicalis input than X. laevis early was from the X. laevis input sample.
This may not always suggest failure of the ChIP experiment but can indicate lower
enrichments and broader peaks that are harder to distinguish from the background
noise, requiring further downstream analysis to separate actual enrichments.

185
Figure 6.7 Efficiency of X. laevis and X. tropicalis ChIP.
The Plot Fingerprint utility of Deeptools was used to assess efficiencies of (A) X. laevis and
(B) X. tropicalis early and late ChIPs.

186
6.3.7 Identification of genes isolated by H1X ChIP-Seq
Due to the high background of the ChIPs, it was most reliable to determine whether
the same genes were isolated in both early and late samples. Peaks in early and late
X. laevis and X. tropicalis samples were compared to the gene annotations of their
respective genomes using Bedtools. Only peaks that intersected genes were
selected. For example, out of a total of twenty-three peaks called by MACS2 for the
X. laevis late sample, ten peaks intersected single genes or clusters of genes.
The genes identified in the early and late samples were then compared to each other,
to identify all genes intersected by peaks conserved in both samples. Twelve genes
were represented in both early and late X. laevis samples, whilst only a single gene
was found in common between X. tropicalis early and late samples (Figure 6.8A).
For comparison, the closest genes to peaks overlapping between early and late were
found by S. Robson, using a different bioinformatics tool (Figure 6.8B). The
different methods of finding peaks overlapping genes is responsible for differences
in the numbers of genes found. Whereas results shown in Figure 6.8A included all
genes intersected by any length of peak, search criteria can be restricted to peaks
overlapping genes by a certain number of base pairs and the peaks proximity to the
closest transcription start site, discussed further in section 6.4.
Between the two tools, five X. laevis genes identified were in common; these were
h2afx.L, trnar-ucg and trnad-guc. The remaining two genes were histone h2b1.1-like,
encoding histone H2B and another tRNA, trnal-caa. The latter two genes were either
upstream of genes identified by bedtools analysis or were one of two overlapped
by the same peak. However, the single gene overlapping between X. tropicalis early
and late differed between the two tools used for analysis.

187
Figure 6.8 Peaks intersecting genes in X. laevis and X. tropicalis early and late samples.
Peaks were reduced to the genes they were associated with and represented by numbers
in early and late circles. The numbers of genes found in both stages were indicated by the
overlap. (A) Bedtools analysis included all genes intersected by any length of peak in both
early and late samples and was performed for X. laevis and X. tropicalis. (B) A different
bioinformatics tool (ChIPpeakAnno) was used by S. Robson to associate each peak to the
nearest gene and identify genes common to early and late samples in X. laevis and
X. tropicalis. Biovenn was used to generate Venn diagrams approximately proportional to
the number of genes indicated within each section (Hulsen, de Vlieg, & Alkema, 2008).

188
Figure 6.9 Types of genes identified from peaks in early and late X. laevis ChIP-Seq.
Genes were grouped broadly by gene ontology into histone, zinc finger-like,
uncharacterised, transfer RNA (trna) and other nucleic acid binding genes. Histone genes
identified were hist1h2bj.L (446588), H2A type 1-like (108704300), h2afx.L (734746) and two
H4 genes (108703479 and 108705162). Zinc finger-like genes included zinc finger protein
789-like (108711339) and oocyte zinc finger protein XlCOF7.1-like (108704246). Two
uncharacterised genes were LOC108705128 (108705128) and MGC115605. Transfer RNAs,
were trnad guc and trnar-ucg. Finally, other nuclei-acid binding genes comprised of
heterogeneous nuclear ribonucleoprotein U (scaffold attachment factor A) S homeolog
(hnrnpu.S)( 399374). NCBI gene ID numbers given in brackets where available.
Histone
5
Zinc finger-like
2
Uncharacterised
2
tRNA
2
Other nucleic-acid
binding
1
189
The PANTHER 14.1 database (Mi, Muruganujan, Ebert, Huang, & Thomas, 2018)
was unable to determine the molecular and biological functions of the list of Xenopus
genes automatically. Owing to the small number of genes, the ontology was
determined manually, and genes were sorted into broad categories (Figure 6.9).
Interestingly, of the twelve genes in common between early and late X. laevis
samples, five belonged to the histone fold super-family. These were core histone
and core histone-like genes encoding H2B, H2A and H4 and a gene encoding a
histone variant of H2A, H2A.X.
The histone variant H2A.X has been implicated in a range of roles (Reviewed by
Turinetto & Giachino, 2015), including DNA recombination and repair, where it is
promptly phosphorylated in response to DNA double-strand breaks (DSBs)
(Rogakou, Pilch, Ann, Ivanova, & William, 1998). Although published ChIP
sequencing of linker histone variants including H1X was available, association of
linker histones with other histone genes was not seen in these data.
Histones were not the only genes identified encoding nuclei-acid binding proteins;
two zinc-finger protein genes and heterogeneous nuclear ribonucleoprotein U, S
homeolog (hnrnpu.S) and were also retrieved, in addition to two transfer RNA
genes.
Of the two zinc finger proteins identified, zinc finger protein 789-like was found to
belong to the Krüppel-associated box (KRAB) family. KRAB-zinc finger proteins
(KRAB-ZFPs) have roles in differentiation, cell metabolism and repression of
transcription, and during early embryogenesis contribute to formation of
heterochromatin (Reviewed by Ecco, Imbeault, & Trono, 2017). However, gene
ontology information specific to X. laevis was unavailable and limited information
for X. tropicalis oocyte zinc finger protein XlCOF7.1-like (K9J7W4) stated only that
it was nucleic acid binding (Consortium, 2018).
190
Heterogeneous nuclear ribonucleoprotein U (hnRNP-U) is also known as scaffold
attachment factor A (SAF-A). Gene ontology data for X. tropicalis hnrnpu (Q28DK6)
states many varied roles, including RNA polymerase II binding, and promoter-
specific chromatin binding (Consortium, 2018). Additionally, hnRNP-U has a role
in role in mitotic spindle assembly, by interacting with the mitotic spindle
regulation complex formed of Aurora-A-TPX2 and recruiting Aurora-A to spindle
microtubules (Ma et al., 2011). It also organises chromatin structures during
interphase (Nozawa et al., 2017) and is phosphorylated in response to DNA double-
stranded breaks (Berglund & Clarke, 2009).
Transfer RNAs (tRNAs), whilst also nuclei-acid binding like other genes identified,
are essential for translation of mRNA into protein. The two tRNAs identified,
trnad-guc and trna-ucg, carry codons for the amino acids valine and serine.
Finally, two uncharacterised genes were found. One uncharacterised gene was
identified as a non-coding RNA, while the other uncharacterized protein-coding
gene shared 70.23% identity to a predicted X. tropicalis uncharacterised C2orf72
homolog (human chromosome 2 open reading frame 72), for which more detailed
data was unavailable.
The single gene with peaks overlapping in early and late X. tropicalis samples
(Figure 6.8A) was Protein-O-mannosyltransferase 1 (pomt1), a constituent of the
endoplasmic reticulum membrane with limited GO annotation (F6YEH0, Q6DIK4)
(Consortium, 2018). Analysis with a different bioinformatics tool also identified a
single gene associated with a peak in both early and late samples (Figure 6.8B),
however this was a different gene than pomt1, named Xetrov90009723m.g which,
although protein coding had no further information available.

191
6.3.8 Visualisation of peaks with the Integrated Genomic Viewer
As shown by the plot fingerprints (Figure 6.7), it was necessary to differentiate
actual signals from background; to this end, early and late bound samples were
normalised to the input signal and viewed as tracks on the Integrated Genomics
Viewer (IGV) (Robinson et al., 2011) alongside called peaks and the mapped and
filtered early, late and input ChIP-Seq data samples. A representative image of a
peak intersecting in both early and late X. laevis samples and overlapping a cluster
of genes is shown in Figure 6.10.
Three of the histone genes identified in section 6.3.6 of this chapter were located in
the same locus, some of which have two RNA transcripts (Figure 6.10). The early
sample coverage was higher, which was clearer after normalising to the input. The
early peak was also slightly broader than the late peak.
MACS2 assigns log10(p values) to called peaks, which are indicators of statistical
significance across the whole data set. The log10(q values) are corrected p-values.
For example, a log10(q value) of 0.1 represents that 10% of the statistically significant
results determined by the log10(p value) are not significant after correction and may
be false-positives. The log10(q values) of peaks called by MACS2 ranged from 0.13
to 3.42 for the X. laevis late sample and 0.029 to 64.03 for the X. laevis early sample.
The log10(q value) of the early peak in Figure 6.11 was 17.85. As 17,201 peaks in total
were called, 3070.38 of these peaks could be expected as false positives. The late
peak log10(q value) equalled 1.09; with 23 peaks called in total, this represented that
0.25 of peaks were false positives.

192
Figure 6.10 Visualisation of an X. laevis early and late peak intersecting a gene on IGV.
With the X. laevis genome and genome annotations (light blue) loaded into the Integrated
Genomics Viewer (IGV), the region of interest was navigated to using the start and end
coordinates of the peak called by MACS2. The coverage of the early (blue) and late (pink)
samples was normalised individually to the input. The tracks below showed the coverage
and reads of the early and late samples before normalisation along with the input.
Coverage represents the amount of sequencing reads that align to a set of nucleotides on
the genome, with more reads equating to a higher the coverage for that region.
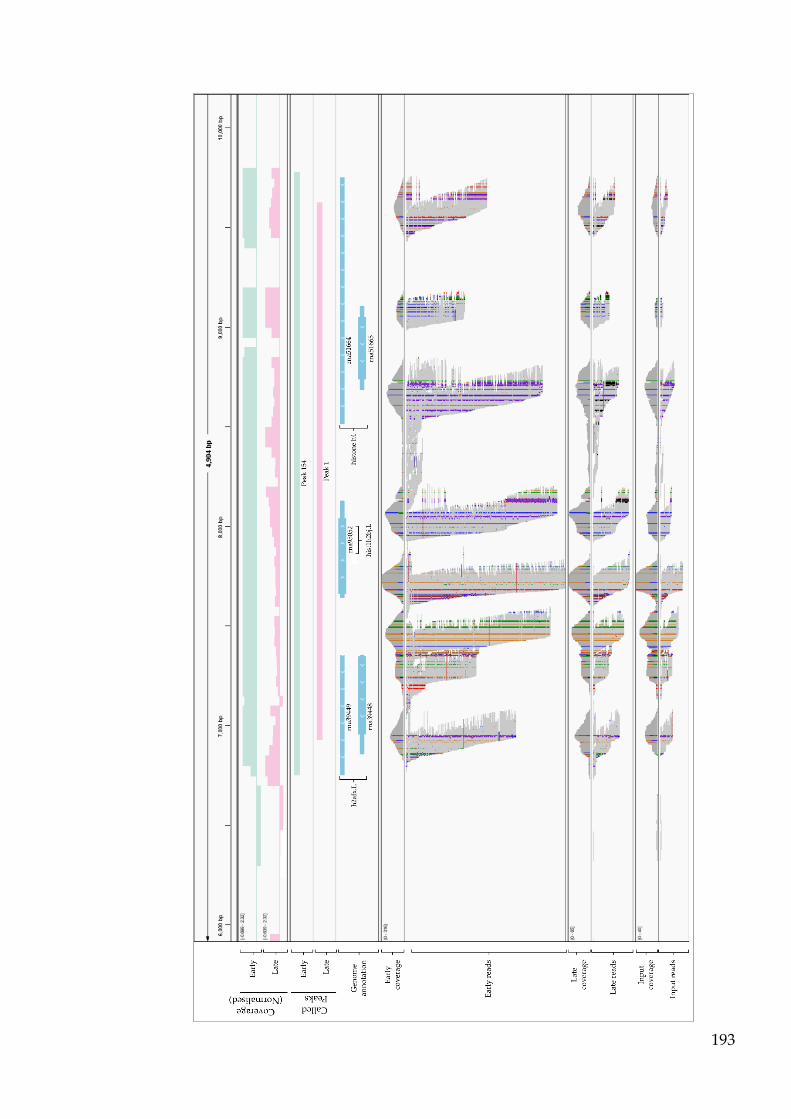
193

194
6.4 Discussion
ChIP-sequences were of good quality after trimming, were not contaminated by
other sequences and were able to be mapped to the respective genomes. The
amount of reads for each sample were similar, however there were large differences
in the numbers of peaks called for each bound sample.
Despite this, Figure 6.6 shows that in X. laevis fewer peaks are called for the late
sample not because of an absence of peaks, but because they are below threshold.
As these below-threshold peaks are in the same regions as peaks called in the
X. laevis early sample, it suggests that H1X.1 is depleted from certain genomic areas
by the late stage of X. laevis, though this cannot be verified without replicates
6.4.1 H1X is associated with nuclei-acid binding genes in X. laevis
Peaks at genes in common between early and late samples were selected for
investigation, as these were deemed more reliable as the samples were independent
from each other. In X. laevis twelve genes were ascertained by bedtools to intersect
peaks in both samples, and in X. tropicalis, one gene (Figure 6.8A). Over 50% of the
X. laevis genes pulled down encoded nuclei acid binding proteins, with most of
these manually identified as histone genes (Figure 6.9).
A second analysis of peaks intersecting genes, using a different tool (Figure 6.8B),
also identified nuclei-acid binding genes associated with H1X peaks in X. laevis,
including genes encoding the core histone H2B and histone variant H2A.X and three
transfer RNA genes.
The difference in the numbers of gene identified by was due to the use of different
tools with differing selection criteria. For example, where peaks overlapped
multiple genes in a cluster (Figure 6.10), either three genes were recorded (Figure
6.8A) or only one gene (Figure 6.8B). Some analysis will preferentially select a single
gene from a cluster, so as not to introduce bias into GO search in case a single peak
covers multiple gene isoforms. As with peak calling, gene identification relative to

195
peaks is subjective to the analysis method. For very large datasets, manual analysis
at every peak is impractical, and methods that sample the single closet gene start
per peak may be preferred for further gene ontology analysis. For the small number
of peaks in the X. laevis late sample and both X. tropicalis samples, every peak
intersecting a gene was manually explored using the integrated genomics viewer to
assess the genes covered.
Published ChIP sequencing studies have focused on comparing two or more linker
histone variants, associating them with genomic regions and limited numbers of
genes. For example, certain H1 subtypes were found to have preferred categories
of genes; genes actively associated with organisation and modification of chromatin
had low H1X content at promoters, while the top 10% of promoters enriched for
H1X included genes with biological roles in neuron development and
differentiation, pattern formation, G-protein and cell signalling and embryonic
organ development (Millán-Ariño et al., 2014). However, although three human
cell lines were tested, only two cell lines showed similar distributions and amounts
of H1.2 and H1X at certain promoters, suggesting cell type-specific differences
(Millán-Ariño et al., 2014). Genes enriched for H1X in X. laevis early and late
chromatin were mainly histone genes, coding for proteins which are involved in
chromatin organisation; while this shows correlation with findings by Millán-Ariño
et al., (2014), in the latter research however, genes with roles in chromatin
organisation were in the bottom 10% of promoters enriched for H1X.
In X. laevis, H1X showed enrichments in all regions of the genome, mostly at
intergenic regions (Figure 6.5).
The dispersal of human somatic linker histone variants throughout the genome was
found to vary by subtype (Millán-Ariño et al., 2014). All H1 variants were related
with gene promoters, coding regions and repetitive DNA and were depleted to
comparable levels at transcription start sites (TSS) of genes and transcription
terminal sites (TSS), with the exception of H1.2 for the latter (Millán-Ariño et al.,

196
2014). Overall, the H1X composition was increased at the coding region of active
genes, with H1X the most abundant H1 variant at exons compared to other H1s
(Mayor et al., 2015).
The other somatic replication-independent subtype H1.0 has also been compared to
H1X in studies; whilst H1X showed slight enrichments at microRNAs and small
nucleolar RNA, enrichment of H1.0, immunoprecipitated as H1.0-HA, correlated
with DNA related to nucleoli (Mayor et al., 2015). Interestingly, the enrichment and
depletion sites of H1X correlated highest of all H1 variants to RNA polymerase II
(RNAPII) binding sites (Mayor et al., 2015). Both replication-independent H1
variants also showed enrichments on chromosomes with higher number of genes
and depletions at chromosomes with lower gene content, with the opposite for H1.2
(Millán-Ariño et al., 2014).
6.4.2 Analysis of the ChIP efficiency
Replicates could not be performed partly due to poor quality embryos, as large
numbers of Xenopus embryos were required per collection for a satisfactory amount
of chromatin, and lack of other resources. Due to prohibitive costs, input samples
from early stage embryos were not sequenced, so earlier bound samples had to be
compared to later stage inputs. This may explain the overlapping plot fingerprints
(Figure 6.7); X. laevis input chromatin was from late stage embryos, possibly why
this sample showed a similar fingerprint to the input, with the early stage
displaying a wider difference. The X. tropicalis input chromatin was also taken from
late stage embryos, however the fingerprints of the early and late samples were
more like each other than the input, indicating a small difference of both bound
samples from the input; however, the X. tropicalis ChIP showed a high amount of
background.
A lack of significant difference between inputs and bounds samples can indicate an
inefficient antibody. Low amounts of DNA were eluted from ChIPs; the antibody
may not have been effective or more starting chromatin may have been required.

197
As discussed in chapter four, the antibody raised against the X. laevis H1X.1
sequence had a single amino acid mismatch to X. tropicalis H1X.1. Although
recognising X. tropicalis protein on western blot, this mismatch may be a reason that
ChIP-Seq of X. tropicalis samples was less successful than for X. laevis ChIP samples,
resulting in fewer peaks called overall and higher background. The X. laevis early
sample showed the greatest success, with many peaks called. As the same antibody
was used in the X. laevis late sample, it lends support to the observed depletion of
H1X at certain genomic locations in late embryogenesis; though replicates would be
needed to confirm this.
Despite the anti-H1X antibody showing specificity on western blots of Xenopus
extract, it may not be highly specific in ChIP under the conditions used in this
research. Further optimisation of the ChIP methodology may be more successful.
As the anti-H1X antibody was already affinity purified, a second option is for more
reads to be performed, however this incurs higher costs to an already expensive
procedure.
An alternative to a specific antibody to a target protein is to generate a tagged
version of that protein, stably express it in the system of study and perform
immunoprecipitation with an antibody to the tag. For example, as only ChIP-grade
antibodies to human H1X and H1.2 were available, Millán-Ariño and colleagues
(2014) immunoprecipitated chromatin from human breast cancer cells expressing
hemagglutinin-tagged H1 variants (HA-tagged H1) with an anti-HA antibody.
Another study used chromatin from mouse embryonic stem cells for which histone
variants H1d and H1c were N-terminally tagged with FLAG or Myc
correspondingly and immuno-precipitated with anti-FLAG or anti-Myc specific
antibodies respectively (Cao et al., 2013). It was shown that flagged-tagged H1d
(h1d-FLAG) was a substitute for endogenous H1d (Cao et al., 2013). However,
tagged versions may not always show the same immunoprecipitation behaviour as
the native protein; although H1.2 had the most distinct genomic distribution of H1

198
variants immunoprecipitated, the HA-tagged version of H1.2 did not correspond
exactly to the endogenous H1.2 pattern (Millán-Ariño et al., 2014).
Likely due to costs, not all ChIPs performed in every organism to analyse the
genomic positions of un-modified histones are sequenced by next generation
sequencing. Due to the lack of data on ChIP-Seq of unmodified histones in Xenopus,
or the abundance of H1X in this genome, it was therefore relatively unknown how
many sequencing reads would result in appropriate coverage, with cost a limiting
factor. To attain sufficient coverage of the Xenopus genome, 20-30 million single-
end reads had been previously suggested for ChIP-Seq (Gentsch, Patrushev, &
Smith, 2015). 40 million paired-end reads were performed for the ChIP-sequencing
in this chapter at the recommendation of S. Robson (Senior Research Fellow,
Bioinformatics, University of Portsmouth) and in-line with services provided by the
sequencing company. However, as reads are not distributed uniformly across the
genome, the coverage is best assessed from a sequenced input sample.
With all of the caveats above, the results of this chapter have shown preliminary
identification of genes, including several histone genes; hist1h2bj.L, h2afx.L and
genes encoding H2A type 1-like and H4, as well as transfer RNA genes and genes
encoding other nucleic acid binding proteins, that are bound by H1X. These results
can be confirmed by replication. This ChIP-Seq analysis therefore provides a good
starting point for design of further ChIP-Seq experiments on unmodified linker
histones in Xenopus.

199
7 Final discussion and future work
The primary aim of this research was to investigate the expression and function of
H1X in Xenopus during early embryonic development; to this end a range of
phylogenetic, embryological, biochemical and molecular techniques were used.
Proteins were extracted from Xenopus embryos and probed with anti-H1X affinity
antibody and RNA amplified with specific primers. The CRISPR-Cas9 gene editing
system was utilised to generate H1X mosaic knockout embryos. Finally, ChIP was
performed with chromatin from Xenopus at early and late stages in embryonic
development and sequenced to identify genes enriched for H1X.
Firstly, as not all linker histone variants showed significant similarity between
vertebrates, it was confirmed by synteny analysis that the h1fx.S gene in Xenopus
was an ortholog of mammalian and other vertebrate h1fx genes. During this
analysis, it was discovered that there were two h1fx genes in tandem in anuran
amphibians including Xenopus, and in coelacanths. The tandem h1fx genes in
Xenopus were provisionally named h1fx.1 and h1fx.2, allowing .S to be appended to
the X. laevis gene names, while proteins were designated H1X.1 and H1X.2. The
H1X subtype investigated in previously published Xenopus research was also
investigated. H1X.2 had previously been identified as a sperm-specific nuclear
basic protein, however, phylogenetic studies showed it was more closely related to
H1X than the other X. laevis sperm-specific proteins and shared a very high
sequence identity with H1X.1.
RT-PCR analysis showed that the expression of both h1fx mRNA subtypes were not
restricted to testis tissue. However, differences in expression of h1fx.1 and h1fx.2
mRNA between X. laevis and X. tropicalis were seen throughout embryonic
development, suggesting organism-specific differences in subtype expression; for
example, expression of h1fx.2 was very specific at gastrulation in X. laevis. In
X. laevis, an antibody recognising H1X.1, but not H1X.2 detected a maternal store of
H1X.1, with protein expressed throughout all stages of embryonic development and

200
in several tissues. Similarly, H1X.1 protein was seen in all tested embryonic stages
during X. tropicalis development, however the signal was fainter in stages 9-25 than
in stages 7, 37 and 41. This may have been due to the X. laevis antibody not
recognising the X. tropicalis H1X.1 protein as efficiently, or a genuine difference in
H1X.1 signal in the latter organism.
CRISPR-Cas9 in Xenopus was only effective in X. tropicalis, however the shorter
generation time of the latter was advantageous for growing injected embryos to
maturity. Survival rates of injected embryos were generally poor and Cas9 was seen
to have very low effectiveness. Assaying for insertions and deletions caused by
CRISPR-Cas9 was difficult however due to the highly repetitive nature of the H1X.1
sequence. It is also likely that higher efficiency H1X.1 knockout in embryos was
lethal and that only very mosaic embryos survived to be assayed. On two occasions
with surviving injected embryos, a smaller size phenotype compared to siblings was
seen, in a late stage tadpole and a frog after metamorphosis.
Database information for homozygous null and heterozygous H1X knockout mice
reports both strains of mice are viable, but show several phenotypes including
increased lean body mass and decreased body fat (Dickinson et al., 2016),
contrasting with the embryonic lethality of seen in h1fx.1 mosaic X. tropicalis
embryos. However, mice, as with all tetrapods excepting anurans, only have a
single h1fx gene, in contrast to X. tropicalis which has two. Furthermore, previous
RNA sequencing (Figure 4.13) indicates different expression patterns for both h1fx
genes in X. tropicalis, particularly sharp increases in h1fx.1 TPE during gastrulation
and neurulation against a low background of h1fx.2 TPE. The low survival observed
in X. tropicalis may be a result of h1fx.2 being unable to compensate for the loss of
h1fx.1 in very mosaic animals.
The anti-H1X affinity antibody was used in ChIP in X. laevis and X. tropicalis,
however it was less successful in X. tropicalis. Genes in common between early and
late embryonic chromatin immunoprecipitated with H1X.1 were identified by

201
ChIP-Seq and bioinformatics analysis as nucleic-acid binding genes, such as
histones and tRNAs.
The indication that certain genomic regions are depleted of H1X.1 in late X. laevis
embryos; stage 26 post-hatching, compared to early; stage 11 gastrula, does not
necessarily conflict with evidence for a role of H1X in cell differentation as found
previously (Ichihara-Tanaka et al., 2017; Millán-Ariño et al., 2014; Shahhoseini et al.,
2010), as H1X.1 may not be required at genomic regions after processes such as
differentiation have taken place. As H1X.1 was the only H1 variant investigated in
the xChIP presented, it could not be ascertained whether the depletion of H1X.1 was
due to its replacement by another H1 subtype.
7.1 Future work
Following the phylogenetic analysis of H1X in chapter three, it would be interesting
to expand studies on the h1fx locus to include more species, particularly lungfish if
genome sequencing data becomes available. As lungfish are the closest related lobe-
finned fish to tetrapods (Amemiya et al., 2013; Brinkmann, Venkatesh, Brenner, &
Meyer, 2004), if lungfish contain two h1fx genes it supports a loss of one h1fx gene
from extant tetrapods, excluding anurans.
Differences seen in the mRNA expression of h1fx.1 and h1fx.2 in both Xenopus
species could also be quantified by quantitative real-time PCR during development,
for more accurate comparison.
The variable survival of embryos following h1fx.1 CRISPR-Cas9 injection showed
that large numbers of embryos need to be injected, to be able to grow X. tropicalis to
maturity and determine whether small size is a valid phenotype caused by h1fx.1
knockout, as well as establishing lines by outbreeding founder frogs mosaic for
h1fx.1. Alternatively, as high levels of H1X.1 mosaicism seem to be lethal, an
alternative method of generating founders is leapfrogging, whereby embryos are
developed to blastula stage after injection of CRISPR-Cas9, then the germ plasm is

202
transplanted into a wild-type blastula; the resulting frogs will carry mutant
primordial germ cells and produce mutant offspring (Blitz, Fish, & Cho, 2016).
ChIP showed more success with X. laevis chromatin than X. tropicalis chromatin.
Due to the considerable expense of ChIP-Sequencing and better specificity of the
anti-H1X.1 antibody in X. laevis, optimisation of ChIP with chromatin from this
species and ChIP-Seq of replicates would be beneficial to confirm the types of genes
enriched for H1X.1.
The research in this thesis, particularly the identification of h1fx.2, generates
opportunities for future work with this subtype. During embryonic development,
h1fx.1 mRNA was visualised by WISH to localise to the anterior of the embryo.
RNA probes recognising h1fx.2 RNA in X. tropicalis and X. laevis could be produced
and used in WISH, to see if the expression follows similar patterns to h1fx.1.
An anti-H1X.2 antibody could also be produced, and affinity purified to visualise
the temporal expression of H1X.2 protein during embryonic development,
particularly to investigate whether it is also present before the midblastula
transition, like H1X.1, and so maternal.
Finally, using online tools to generate effective sgRNA sequences, a sgRNA
targeting h1fx.2 could be injected to produce embryos mosaic for h1fx.2. These could
be established from founders to potentially cross with h1fx.1 mosaic lines, once the
latter have been established.

203
8 References
Akhmanova, A., Miedema, K., & Hennig, W. (1996). Identification and
characterization of the Drosophila histone H4 replacement gene. FEBS Letters,
388(2–3), 219–222. doi:10.1016/0014-5793(96)00551-0
Alami, R., Fan, Y., Pack, S., Sonbuchner, T. M., Besse, A., Lin, Q., … Bouhassira, E. E.
(2003). Mammalian linker-histone subtypes differentially affect gene
expression in vivo. Proceedings of the National Academy of Sciences, 100(10),
5920–5925. doi:10.1073/pnas.0736105100
Allis, C. D., & Jenuwein, T. (2016). The molecular hallmarks of epigenetic control.
Nature Reviews Genetics, 17(8), 487–500. doi: 10.1038/nrg.2016.59.
Amemiya, C. T., Alföldi, J., Lee, A. P., Fan, S., Philippe, H., Maccallum, I., … Lindblad-
Toh, K. (2013). The African coelacanth genome provides insights into tetrapod
evolution. Nature, 496(7445), 311–316. doi:10.1038/nature12027
Amores, A., Catchen, J., Ferrara, A., Fontenot, Q., & Postlethwait, J. H. (2011). Genome
evolution and meiotic maps by massively parallel DNA sequencing: Spotted
gar, an outgroup for the teleost genome duplication. Genetics, 188(4), 799–808.
doi:10.1534/genetics.111.127324
Amores, A., Force, A., Yan, Y. L., Amemiya, C., Fritz, A., Ho, R. K., ... Postlethwait, J.
H. (1998). Zebrafish hox clusters and vertebrate genome evolution. Science,
282(5394), 1711–1714. doi:10.1126/science.282.5394.1711
Andrews, S. (2018). FastQC: A Quality Control tool for High Throughput Sequence
Data (Version 0.11.7). Available online at:
http://www.bioinformatics.babraham.ac.uk/projects/fastqc/
Arents, G., Burlingame, R. W., Wang, B. C., Love, W. E., & Moudrianakis, E. N. (1991).
The nucleosomal core histone octamer at 3.1 A resolution: a tripartite protein
assembly and a left-handed superhelix. Proceedings of the National Academy of
Sciences, 88(22), 10148–10152. doi:10.1073/pnas.88.22.10148
Ausio, J. (1999). Histone H1 and evolution of sperm nuclear basic proteins. Journal of
Biological Chemistry, 274(44), 31115–31118. doi:10.1074/jbc.274.44.31115
Austin, C. M., Tan, M. H., Croft, L. J., Hammer, M. P., & Gan, H. M. (2015). Whole
Genome Sequencing of the Asian Arowana (Scleropages formosus) Provides
Insights into the Evolution of Ray-Finned Fishes. Genome Biology and Evolution,
7(10), 2885–2895. doi:10.1093/gbe/evv186

204
Bannister, A. J., & Kouzarides, T. (2011). Regulation of chromatin by histone
modifications. Cell Research, 21(3), 381–395. doi:10.1038/cr.2011.22
Berglund, F. M., & Clarke, P. R. (2009). hnRNP-U is a specific DNA-dependent protein
kinase substrate phosphorylated in response to DNA double-strand breaks.
Biochemical and Biophysical Research Communications, 381(1), 59–64.
doi:10.1016/j.bbrc.2009.02.019
Beumer, K., Bhattacharyya, G., Bibikova, M., Trautman, J. K., & Carroll, D. (2006).
Efficient gene targeting in Drosophila with zinc-finger nucleases. Genetics,
172(4), 2391–2403. doi:10.1534/genetics.105.052829
Bibikova, M, Golic, M., Golic, K. G., & Carroll, D. (2002). Targeted Chromosomal
Cleavage and Mutagenesis in Drosophila Using Zinc-Finger Nucleases.
Genetics, 161(3), 1169–1175.
Bibikova, M., Carroll, D., Segal, D. J., Trautman, J. K., Smith, J., Kim, Y. -G., &
Chandrasegaran, S. (2001). Stimulation of Homologous Recombination
through Targeted Cleavage by Chimeric Nucleases. Molecular and Cellular
Biology, 21(1), 289–297. doi:10.1128/MCB.21.1.289-297.2001
Blitz, I. L., Fish, M. B., & Cho, K. W. Y. (2016). Leapfrogging: primordial germ cell
transplantation permits recovery of CRISPR/Cas9-induced mutations in
essential genes. Development, 143(15), 2868–2875. doi:10.1242/dev.138057
Blythe, S. A., Reid, C. D., Kessler, D. S., & Klein, P. S. (2009). Chromatin
immunoprecipitation in early Xenopus laevis embryos. Developmental Dynamics,
238(6), 1422–1432. doi:10.1002/dvdy.21931.Chromatin
Bouvet, P., Dimitrov, S., & Wolffe, A. P. (1994). Specific regulation of Xenopus
chromosomal 5S rRNA gene transcription in vivo by histone H1. Genes &
Development, 8(10), 1147–1159. doi:10.1101/gad.8.10.1147
Brandt, W. F., Schwager, S. U., Rodrigues, J. A., & Busslinger, M. (1997). Isolation and
amino acid sequence analysis reveal an ancient evolutionary origin of the
cleavage stage (CS) histones of the sea urchin. European Journal of Biochemistry,
247(3), 784–791. doi:10.1111/j.1432-1033.1997.00784.x
Brinkman, E. K., Chen, T., Amendola, M., & van Steensel, B. (2014). Easy quantitative
assessment of genome editing by sequence trace decomposition. Nucleic Acids
Research, 42(22), e168–e168. doi:10.1093/nar/gku936

205
Brinkmann, H., Venkatesh, B., Brenner, S., & Meyer, A. (2004). Nuclear protein-coding
genes support lungfish and not the coelacanth as the closest living relatives of
land vertebrates. Proceedings of the National Academy of Sciences, 101(14), 4900–
4905. doi:10.1073/pnas.0400609101
Brocard, M. P., Triebe, S., Peretti, M., Doenecke, D., & Khochbin, S. (1997).
Characterization of the two H1°-encoding genes from Xenopus laevis. Gene,
189(1), 127–134. doi:10.1016/S0378-1119(96)00845-1
Brown, D. T., Alexander, B. T., & Sittman, D. B. (1996). Differential effect of H1 variant
overexpression on cell cycle progression and gene expression. Nucleic Acids
Research, 24(3), 486–493. doi:10.1093/nar/24.3.486
Burge, C., & Karlin, S. (1997). Prediction of complete gene structure in human genomic
DNA. Journal of Molecular Biology, 268(1), 78–94. doi:10.1006/jmbi.1997.0951
Cao, K., Lailler, N., Zhang, Y., Kumar, A., Uppal, K., Liu, Z., … Fan, Y. (2013). High-
resolution mapping of h1 linker histone variants in embryonic stem cells. PLoS
Genetics, 9(4), e1003417. doi:10.1371/journal.pgen.1003417
Capella-Gutiérrez, S., Silla-Martínez, J. M., & Gabaldón, T. (2009). trimAl: A tool for
automated alignment trimming in large-scale phylogenetic analyses.
Bioinformatics, 25(15), 1972–1973. doi:10.1093/bioinformatics/btp348
Cavalli, G., & Heard, E. (2019). Advances in epigenetics link genetics to the
environment and disease. Nature, 571(7766), 489–499. doi: 10.1038/s41586-019-
1411-0
Cermak, T., Doyle, E. L., Christian, M., Wang, L., Zhang, Y., Schmidt, C., … Voytas, D.
F. (2011). Efficient design and assembly of custom TALEN and other TAL
effector-based constructs for DNA targeting. Nucleic Acids Research, 39(17),
7879. doi:10.1093/nar/gkr739
Charpentier, E., & Doudna, J. A. (2013). Rewriting a genome. Nature, 495, 50–51.
doi:10.1038/495050a
Cho, S. W., Kim, S., Kim, J. M., & Kim, J.-S. (2013). Targeted genome engineering in
human cells with the Cas9 RNA-guided endonuclease. Nature Biotechnology,
31(3), 230–232. doi:10.1038/nbt.2507
Christian, M., Cermak, T., Doyle, E. L., Schmidt, C., Zhang, F., Hummel, A., … Voytas,
D. F. (2010). Targeting DNA double-strand breaks with TAL effector
nucleases. Genetics, 186(2), 756–761. doi:10.1534/genetics.110.120717

206
Clapier, C. R., & Cairns, B. R. (2009). The biology of chromatin remodeling complexes.
Annual Review of Biochemistry, 78, 273–304.
doi:10.1146/annurev.biochem.77.062706.153223
Clausell, J., Happel, N., Hale, T. K., Doenecke, D., & Beato, M. (2009). Histone H1
subtypes differentially modulate chromatin condensation without preventing
ATP-dependent remodeling by SWI/SNF or NURF. PloS one, 4(10), 1–14.
doi:10.1371/journal.pone.0007243
Cole, K. D., Kandala, J. C., & Kistler, W. S. (1986). Isolation of the gene for the testis-
specific H1 histone variant H1t. Journal of Biological Chemistry, 261(16), 7178–
7183
Cong, L., Ran, F. A., Cox, D., Lin, S., Barretto, R., Habib, N., … Zhang, F. (2013).
Multiplex genome engineering using CRISPR/Cas systems. Science, 339(6121),
819–823. doi:10.1126/science.1231143
Consortium, T. U. (2018). UniProt: a worldwide hub of protein knowledge. Nucleic
Acids Research, 47(D1), D506–D515. doi:10.1093/nar/gky1049
Cutter, A. R., & Hayes, J. J. (2015). A brief review of nucleosome structure. FEBS
Letters, 589(20 Pt A), 2914–2922. doi:10.1016/j.febslet.2015.05.016
Dash, P., Lotan, I., Knapp, M., Kandel, E. R., & Goelet, P. (1987). Selective elimination
of mRNAs in vivo: complementary oligodeoxynucleotides promote RNA
degradation by an RNase H-like activity. Proceedings of the National Academy of
Sciences, 84(22), 7896–7900. doi:10.1073/pnas.84.22.7896
Dasso, M., Dimitrov, S., & Wolffe, A. P. (1994). Nuclear assembly is independent of
linker histones. Proceedings of the National Academy of Sciences, 91(26), 12477–
12481. doi:10.1073/pnas.91.26.12477
Davey, C. A., Sargent, D. F., Luger, K., Maeder, A. W., & Richmond, T. J. (2002).
Solvent mediated interactions in the structure of the nucleosome core particle
at 1.9 Å resolution. Journal of Molecular Biology, 319(5), 1097–1113.
doi:10.1016/S0022-2836(02)00386-8
DeLay, B. D., Corkins, M. E., Hanania, H. L., Salanga, M., Deng, J. M., Sudou, N., …
Miller, R. K. (2018). Tissue-Specific Gene Inactivation in Xenopus laevis:
Knockout of lhx1 in the Kidney with CRISPR/Cas9. Genetics, 208(2), 673–686.
doi:10.1534/genetics.117.300468

207
Dickinson, M. E., Flenniken, A. M., Ji, X., Teboul, L., Wong, M. D., White, J. K., …
Murakami, A. (2016). High-throughput discovery of novel developmental
phenotypes. Nature, 537(7621), 508–514. doi:10.1038/nature19356
Dimitrov, S., Almouzni, G., Dasso, M., & Wolffe, A. P. (1993). Chromatin transitions
during early Xenopus embryogenesis: changes in histone H4 acetylation and in
linker histone type. Developmental Biology, 160(1), 214–227. doi:
10.1006/dbio.1993.1299
Dominski, Z., & Marzluff, W. F. (1999). Formation of the 3’ end of histone mRNA.
Gene, 239(1), 1–14. doi:10.1038/308203a0
Draizen, E. J., Shaytan, A. K., Mariño-Ramírez, L., Talbert, P. B., Landsman, D., &
Panchenko, A. R. (2016). HistoneDB 2.0: A histone database with variants - An
integrated resource to explore histones and their variants. Database, 2016,
baw014. doi:10.1093/database/baw014
Ecco, G., Imbeault, M., & Trono, D. (2017). KRAB Zinc-finger proteins. Development,
144(15), 2719–2729. doi:10.1242/dev.132605
Eirín-López, J M, Lewis, J. D., Howe, L. A., & Ausió, J. (2006). Common phylogenetic
origin of protamine-like (PL) proteins and histone H1: Evidence from bivalve
PL genes. Molecular Biology and Evolution, 23(6), 1304–1317.
doi:10.1093/molbev/msk021
Eirín-López, J. M., Frehlick, L. J., & Ausió, J. (2006). Protamines, in the footsteps of
linker histone evolution. Journal of Biological Chemistry, 281(1), 1–4.
doi:10.1074/jbc.R500018200
Eirín-López, J. M., González-Tizón, A. M., Martínez, A., & Méndez, J. (2002).
Molecular and evolutionary analysis of mussel histone genes (Mytilus spp.):
Possible evidence of an “orphon origin” for H1 histone genes. Journal of
Molecular Evolution, 55(3), 272–283. doi:10.1007/s00239-002-2325-1
Eirín-López, J. M., González-Tizón, A. M., Martínez, A., & Méndez, J. (2004). Birth-
and-death evolution with strong purifying selection in the histone H1
multigene family and the origin of orphon H1 genes. Molecular Biology and
Evolution, 21(10), 1992–2003. doi:10.1093/molbev/msh213
Eletsky, A., Lee, H., Lee, D., Kohan, E., Janjua, H., Xiao, R., … Szyperski, T. (n.d.).
Solution NMR Structure of the Globular Domain of Human Histone H1x,

208
Northeast Structural Genomics Consortium (NESG) Target HR7057A. TO BE
PUBLISHED. doi:10.2210/PDB2LSO/PDB
Ewels, P., Magnusson, M., Lundin, S., & Käller, M. (2016). MultiQC: summarize
analysis results for multiple tools and samples in a single report.
Bioinformatics, 32(19), 3047–3048. doi:10.1093/bioinformatics/btw354
Fan, Y., Nikitina, T., Morin-Kensicki, E. M., Zhao, J., Magnuson, T. R., Woodcook, C.
L., & Skoultchi, A. I. (2003). H1 linker histones are essential for mouse
development and affect nucleosome spacing in vivo. Molecular and Cellular
Biology, 23(13), 4559–4572. doi:10.1128/mcb.23.13.4559–4572.2003
Fan, Y., Nikitina, T., Zhao, J., Fleury, T. J., Bhattacharyya, R., Bouhassira, E. E., …
Skoultchi, A. I. (2005). Histone H1 depletion in mammals alters global
chromatin structure but causes specific changes in gene regulation. Cell,
123(7), 1199–1212. doi:10.1016/j.cell.2005.10.028
Fan, Y., Sirotkin, A., Russell, R. G., Ayala, J. & Skoultchi, A. I. (2001). Individual
Somatic H1 Subtypes Are Dispensable for Mouse Development Even in Mice
Lacking the H10 Replacement Subtype. Molecular and Cellular Biology, 21(23),
7933–7943. doi:10.1128/MCB.21.23.7933
Felsenfeld, G., Groudine, M. (2003). Controlling the double helix. Nature, 421, 448–453.
doi:10.1038/nature01411
Fogarty, N. M. E., McCarthy, A., Snijders, K. E., Powell, B. E., Kubikova, N., Blakeley,
P., … Niakan, K. K. (2017). Genome editing reveals a role for OCT4 in human
embryogenesis. Nature, 550(7674), 67–73. doi:10.1038/nature24033
Frehlick, L. J., Prado, A., Calestagne-Morelli, A., & Ausió, J. (2007). Characterization of
the PL-I-related SP2 protein from Xenopus. Biochemistry, 46(44), 12700–12708.
doi:10.1021/bi701274s
Gaj, T., Gersbach, C. A., & Barbass, C. F., 3rd (2013). ZFN, TALEN and CRISPR/Cas
based methods for genome engineering. Trends in Biotechnology, 31(7), 397–405.
doi:10.1016/j.tibtech.2013.04.004.ZFN
Gasteiger E., Gattiker A., Hoogland C., Ivanyi I., Appel R.D., Bairoch A. (2003).
ExPASy: the proteomics server for in-depth protein knowledge and analysis. Nucleic
Acids Research. 31 (13), 3784–3788. doi: 10.1093/nar/gkg563
Gasteiger E., Hoogland C., Gattiker A., Duvaud S., Wilkins M.R., Appel R.D., Bairoch
A. (2005). Protein Identification and Analysis Tools on the ExPASy Server. In J. M.

209
Walker (Ed.), The Proteomics Protocols Handbook. (pp. 571–607). Humana Press.
Retrieved from https://web.expasy.org/docs/expasy_tools05.pdf
Gentsch, G. E., Patrushev, I., & Smith, J. C. (2015). Genome-wide snapshot of
chromatin regulators and states in Xenopus embryos by ChIP-Seq. Journal of
Visualized Experiments: JoVE, (96), 52535. doi:10.3791/52535
Gilbert, S. F. (2010). Developmental Biology (9th ed.). Sunderland, Massachusetts:
Sinauer Associates, Inc.
Gillis, W. Q., St John, J., Bowerman, B., & Schneider, S. Q. (2009). Whole genome
duplications and expansion of the vertebrate GATA transcription factor gene
family. BMC Evolutionary Biology, 9, 207. doi:10.1186/1471-2148-9-207
Goldberg, A. D., Allis, C. D., & Bernstein, E. (2007). Epigenetics: A Landscape Takes
Shape. Cell, 128(4), 635–638. doi:10.1016/j.cell.2007.02.006
Gómez-Díaz, E., Rivero, A., Chandre, F., & Corces, V. G. (2014). Insights into the
epigenomic landscape of the human malaria vector Anopheles gambiae. Frontiers
in Genetics, 5, 277. doi:10.3389/fgene.2014.00277
Griffiths, S. (2013). The role of histone variants H1X and macroH2A1 in early development of
Xenopus laevis (Unpublished master's thesis). University of Portsmouth. UK.
Gurumurthy, C. B., Grati, M., Ohtsuka, M., Schilit, S. L. P., Quadros, R. M., & Liu, X. Z.
(2016). CRISPR: a versatile tool for both forward and reverse genetics research.
Human Genetics, 135(9), 971–976. doi:10.1007/s00439-016-1704-4
Hall, T. A. (1999). BioEdit: a user-friendly biological sequence alignment editor and
analysis program for Windows 95/98/NT. Nucleic Acids Symposium Series, 41,
95–98.
Happel, N., Schulze, E., & Doenecke, D. (2005). Characterisation of human histone
H1x. Biological Chemistry, 386(6), 541–551. doi:10.1515/BC.2005.064
Harikumar, A., & Meshorer, E. (2015). Chromatin remodeling and bivalent histone
modifications in embryonic stem cells. EMBO Reports, 16(12), 1609–1619.
doi:10.15252/embr.201541011
Hartman, P. G., Chapman, G. E., Moss, T., & Bradbury, E. M. (1977). Studies on the
Role and Mode of Operation of the Very‐Lysine‐Rich Histone H1 in Eukaryote
Chromatin: The Three Structural Regions of the Histone H1 Molecule.

210
European Journal of Biochemistry, 77(1), 45–51. doi:10.1111/j.1432-
1033.1977.tb11639.x
Heasman, J. (2002). Morpholino oligos: making sense of antisense? Developmental
Biology, 243(2), 209–214. doi:10.1006/dbio.2001.0565
Heasman, J., Kofron, M., & Wylie, C. (2000). βCatenin Signaling Activity Dissected in
the Early Xenopus Embryo: A Novel Antisense Approach. Developmental
Biology, 222(1), 124–134. doi:10.1006/dbio.2000.9720
Hoang, D. T., Chernomor, O., von Haeseler, A., Minh, B. Q., & Vinh, L. S. (2017).
UFBoot2: Improving the Ultrafast Bootstrap Approximation. Molecular Biology
and Evolution, 35(2), 518–522. doi:10.1093/molbev/msx281
Hoegg, S., Brinkmann, H., Taylor, J. S., & Meyer, A. (2004). Phylogenetic timing of the
fish-specific genome duplication correlates with the diversification of teleost
fish. Journal of Molecular Evolution, 59(2), 190–203. doi:10.1007/s00239-004-2613-
z
Houston, D. W. (2018). Oocyte Host-Transfer and Maternal mRNA Depletion
Experiments in Xenopus. Cold Spring Harbor Protocols, 2018(10),
pdb.prot096982-pdb.prot096982. doi:10.1101/pdb.prot096982
Hruscha, A., Krawitz, P., Rechenberg, A., Heinrich, V., Hecht, J., Haass, C., & Schmid,
B. (2013). Efficient CRISPR/Cas9 genome editing with low off-target effects in
zebrafish. Development, 140(24), 4982–4987. doi:10.1242/dev.099085
Hsu, P. D., Lander, E. S., & Zhang, F. (2014). Development and applications of
CRISPR-Cas9 for genome engineering. Cell, 157(6), 1262–1278.
doi:10.1016/j.cell.2014.05.010
Huang, D. W., Sherman, B. T., & Lempicki, R. A. (2008). Systematic and integrative
analysis of large gene lists using DAVID bioinformatics resources. Nature
Protocols, 4, 44–57. doi:10.1038/nprot.2008.211
Huang, D. W., Sherman, B. T., & Lempicki, R. A. (2009). Bioinformatics enrichment
tools: paths toward the comprehensive functional analysis of large gene lists.
Nucleic Acids Research, 37(1), 1–13. doi:10.1093/nar/gkn923
Huang, P., Xiao, A., Zhou, M., Zhu, Z., Lin, S., & Zhang, B. (2011). Heritable gene
targeting in zebrafish using customized TALENs. Nature Biotechnology, 29(8),
699–700. doi:10.1038/nbt.1939

211
Hulsen, T., de Vlieg, J., & Alkema, W. (2008). BioVenn – a web application for the
comparison and visualization of biological lists using area-proportional Venn
diagrams. BMC Genomics, 9, 488. doi:10.1186/1471-2164-9-488
Ichihara-Tanaka, K., Kadomatsu, K., & Kishida, S. (2017). Temporally and Spatially
Regulated Expression of the Linker Histone H1fx During Mouse
Development. Journal of Histochemistry and Cytochemistry, 65(9), 513–530.
doi:10.1369/0022155417723914
Irion, U., Krauss, J., & Nusslein-Volhard, C. (2014). Precise and efficient genome
editing in zebrafish using the CRISPR/Cas9 system. Development, 141(24),
4827–4830. doi:10.1242/dev.115584
Izzo, A., Kamieniarz, K., & Schneider, R. (2008). The histone H1 family: specific
members, specific functions? Biological Chemistry, 389(4), 333–343.
doi:10.1515/BC.2008.037
Jinek, M., Chylinski, K., Fonfara, I., Hauer, M., Doudna, J. A., & Charpentier, E. (2012).
A programmable dual-RNA-guided DNA endonuclease in adaptive bacterial
immunity. Science, 337(6096), 816–821. doi:10.1126/science.1225829
Johnson, D. S., Mortazavi, A., & Myers, R. M. (2007). Genome-wide mapping of in vivo
protein-DNA interactions. Science, 316(5830), 1497–1502.
doi:10.1126/science.1141319
Kalyaanamoorthy, S., Minh, B. Q., Wong, T. K. F., von Haeseler, A., & Jermiin, L. S.
(2017). ModelFinder: fast model selection for accurate phylogenetic estimates.
Nature Methods, 14(6), 587–589. doi:10.1038/nmeth.4285
Kamakaka, R. T., & Biggins, S. (2005). Histone variants: deviants? Genes & Development,
19(3), 295–310. doi:10.1101/gad.1272805
Kandolf, H. (1994). The H1A histone variant is an in vivo repressor of oocyte-type 5S
gene transcription in Xenopus laevis embryos. Proceedings of the National
Academy of Sciences, 91(15), 7257–7261. doi:10.1073/pnas.91.15.7257
Karimi, K., Fortriede, J. D., Lotay, V. S., Burns, K. A., Wang, D. Z., Fisher, M. E., …
Vize, P. D. (2018). Xenbase: a genomic, epigenomic and transcriptomic model
organism database. Nucleic Acids Research, 46(D1), D861–D868.
doi:10.1093/nar/gkx936
Kasinsky, H. E., Lewis, J. D., Dacks, J. B., & Ausió, J. (2001). Origin of H1 linker
histones. The FASEB Journal, 15(1), 34–42. doi:10.1096/fj.00-0237rev
212
Kawalek, A., Bartosik, A. A., Glabski, K., & Jagura-Burdzy, G. (2018). Pseudomonas
aeruginosa partitioning protein ParB acts as a nucleoid-associated protein
binding to multiple copies of a parS-related motif. Nucleic Acids Research, 46(9),
4592–4606. doi:10.1093/nar/gky257
Kent, W. J., Sugnet, C. W., Furey, T. S., Roskin, K. M., Pringle, T. H., Zahler, A. M., &
Haussler, D. (2002). The human genome browser at UCSC. Genome Research,
12(6), 996–1006. doi:10.1101/gr.229102
Klein, S. L., Strausberg, R. L., Wagner, L., Pontius, J., Clifton, S. W., & Richardson, P.
(2002). Genetic and genomic tools for Xenopus research: The NIH Xenopus
initiative. Developmental Dynamics, 225(4), 384–391. doi:10.1002/dvdy.10174
Kok, F. O., Shin, M., Ni, C. W., Gupta, A., Grosse, A. S., van Impel, A., … Lawson, N.
D. (2015). Reverse genetic screening reveals poor correlation between
morpholino-induced and mutant phenotypes in zebrafish. Developmental cell,
32(1), 97–108. doi:10.1016/j.devcel.2014.11.018
Kornberg, R. D. (1974). Chromatin Structure: A Repeating Unit of Histones and DNA.
Science, 184(4139), 868–871. doi:10.1126/science.184.4139.868
Krueger, F. (2019). Trim Galore: A wrapper tool around Cutadapt and FastQC to
consistently apply quality and adapter trimming to FastQ files (Version 0.6.0).
[Computer software]. Available online at:
http://www.bioinformatics.babraham.ac.uk/projects/trim_galore/
Langmead, B., & Salzberg, S. L. (2012). Fast gapped-read alignment with Bowtie 2.
Nature Methods, 9(4), 357–359. doi:10.1038/nmeth.1923
Lei, Y., Guo, X., Liu, Y., Cao, Y., Deng, Y., Chen, X., … Zhao, H. (2012). Efficient
targeted gene disruption in Xenopus embryos using engineered transcription
activator-like effector nucleases (TALENs). Proceedings of the National Academy
of Sciences, 109(43), 17484–17489. doi:10.1073/pnas.1215421109
Lewis, J. D., Saperas, N., Song, Y., Zamora, M. J., Chiva, M., & Ausio, J. (2004). Histone
H1 and the origin of protamines. Proceedings of the National Academy of Sciences,
101(12), 4148–4152. doi:10.1073/pnas.0308721101
Li, H., Handsaker, B., Wysoker, A., Fennell, T., Ruan, J., Homer, N., … 1000 Genome
Project Data Processing Subgroup. (2009). The Sequence Alignment/Map
format and SAMtools. Bioinformatics, 25(16), 2078–2079.
doi:10.1093/bioinformatics/btp352
213
Li, T., Huang, S., Jiang, W. Z., Wright, D., Spalding, M. H., Weeks, D. P., & Yang, B.
(2011). TAL nucleases (TALNs): Hybrid proteins composed of TAL effectors
and FokI DNA-cleavage domain. Nucleic Acids Research, 39(1), 359–372.
doi:10.1093/nar/gkq704
Li, X., Fan, D., Zhang, W., Liu, G., Zhang, L., Zhao, L., … Wang, W. (2015). Outbred
genome sequencing and CRISPR/Cas9 gene editing in butterflies. Nature
Communications, 6, 8212, 1–10. doi:10.1038/ncomms9212
Lieber, T., Angerer, L. M., Angerer, R. C., & Childs, G. (2006). A histone H1 protein in
sea urchins is encoded by a poly(A)+ mRNA. Proceedings of the National
Academy of Sciences, 85(12), 4123–4127. doi:10.1073/pnas.85.12.4123
Lin, Q., Sirotkin, A., & Skoultchi, A. I. (2002). Normal Spermatogenesis in Mice
Lacking the Testis-Specific Linker Histone H1t. Molecular and Cellular Biology,
20(6), 2122–2128. doi:10.1128/mcb.20.6.2122-2128.2000
Lu, Z. H., Sittman, D. B., Brown, D. T., Munshi, R., & Leno, G. H. (1997). Histone H1
modulates DNA replication through multiple pathways in Xenopus egg
extract. Journal of Cell Science, 110, 2745–2758.
Luger, K., Mäder, a W., Richmond, R. K., Sargent, D. F., & Richmond, T. J. (1997).
Crystal structure of the nucleosome core particle at 2.8 Å resolution. Nature,
389(6648), 251–260. doi:10.1038/38444
Ma, N., Matsunaga, S., Morimoto, A., Sakashita, G., Urano, T., Uchiyama, S., & Fukui,
K. (2011). The nuclear scaffold protein SAF-A is required for kinetochore-
microtubule attachment and contributes to the targeting of Aurora-A to
mitotic spindles. Journal of Cell Science, 124(3), 394–404. doi:10.1242/jcs.063347
Mali, P., Yang, L., Esvelt, K. M., Aach, J., Guell, M., DiCarlo, J. E., … Church, G. M.
(2013). RNA-guided human genome engineering via Cas9. Science, 339(6121),
823–826. doi:10.1126/science.1232033
Mandl, B., Brandt, W. F., Superti-Furga, G., Graninger, P. G., Birnstiel, M. L., &
Busslinger, M. (1997). The five cleavage-stage (CS) histones of the sea urchin
are encoded by a maternally expressed family of replacement histone genes:
functional equivalence of the CS H1 and frog H1M (B4) proteins. Molecular and
Cellular Biology, 17(3), 1189–1200. doi:10.1128/mcb.17.3.1189

214
Maresca, T. J., Freedman, B. S., & Heald, R. (2005). Histone H1 is essential for mitotic
chromosome architecture and segregation in Xenopus laevis egg extracts. The
Journal of Cell Biology, 169(6), 859–869. doi:10.1083/jcb.200503031
Martianov, I., Brancorsini, S., Catena, R., Gansmuller, A., Kotaja, N., Parvinen, M., …
Davidson, I. (2005). Polar nuclear localization of H1T2, a histone H1 variant,
required for spermatid elongation and DNA condensation during
spermiogenesis. Proceedings of the National Academy of Sciences, 102(8), 2808–
2813. doi:10.1073/pnas.0406060102
Martin, M. (2011). Cutadapt removes adapter sequences from high-throughput
sequencing reads. EMBnet.Journal, 17(1), 10–12. doi:10.14806/ej.17.1.200
Marzluff, W. F., Sakallah, S., & Kelkar, H. (2006). The sea urchin histone gene
complement. Developmental Biology, 300(1), 308–320.
doi:10.1016/j.ydbio.2006.08.067
Mayor, R., Izquierdo-Bouldstridge, A., Millán-Ariño, L., Bustillos, A., Sampaio, C.,
Luque, N., & Jordan, A. (2015). Genome distribution of replication-
independent histone H1 variants shows H1.0 associated with nucleolar
domains and H1X associated with RNA polymerase II-enriched regions.
Journal of Biological Chemistry, 290(12), 7474–7491. doi:10.1074/jbc.M114.617324
Maze, I., Noh, K. -M., Soshnev, A. A, & Allis, C. D. (2014). Every amino acid matters:
essential contributions of histone variants to mammalian development and
disease. Nature Reviews. Genetics, 15(4), 259–271. doi:10.1038/nrg3673
McKittrick, E., Gafken, P. R., Ahmad, K., & Henikoff, S. (2004). Histone H3.3 is
enriched in covalent modifications associated with active chromatin.
Proceedings of the National Academy of Sciences, 101(6), 1525–1530.
doi:10.1073/pnas.0308092100
Mehravar, M., Shirazi, A., Nazari, M., & Banan, M. (2019). Mosaicism in CRISPR/Cas9-
mediated genome editing. Developmental Biology, 445(2), 156–162.
doi:10.1016/j.ydbio.2018.10.008
Meng, X., Noyes, M. B., Zhu, L. J., Lawson, N. D., & Wolfe, S. A. (2008). Targeted gene
inactivation in zebrafish using engineered zinc-finger nucleases. Nature
Biotechnology, 26(6), 695–701. doi:10.1038/nbt1398
Meyer, A., & Peer, Y. Van de. (2005). From 2R to 3R: evidence for a fish‐specific
genome duplication (FSGD). BioEssays, 27(9), 937–945. doi:10.1002/bies.20293
215
Mi, H., Muruganujan, A., Ebert, D., Huang, X., & Thomas, P. D. (2018). PANTHER
version 14: more genomes, a new PANTHER GO-slim and improvements in
enrichment analysis tools. Nucleic Acids Research, 47(D1), D419–D426.
doi:10.1093/nar/gky1038
Millán-Ariño, L., Islam, A. B. M. M. K., Izquierdo-Bouldstridge, A., Mayor, R., Terme,
J. M., Luque, N., … Jordan, A. (2014). Mapping of six somatic linker histone
H1 variants in human breast cancer cells uncovers specific features of H1.2.
Nucleic Acids Research, 42(7), 4474–4493. doi:10.1093/nar/gku079
Miller, J. C., Tan, S., Qiao, G., Barlow, K. A., Wang, J., Xia, D. F., … Rebar, E. J. (2011).
A TALE nuclease architecture for efficient genome editing. Nature
Biotechnology, 29(2), 143–150. doi:10.1038/nbt.1755
Mitchell, A. L., Attwood, T. K., Babbitt, P. C., Blum, M., Bork, P., Bridge, A., … Finn, R.
D. (2019). InterPro in 2019: improving coverage, classification and access to
protein sequence annotations. Nucleic Acids Research, 47(D1), D351–D360.
doi:10.1093/nar/gky1100
Moreno-Mateos, M. A., Vejnar, C. E., Beaudoin, J. -D., Fernandez, J. P., Mis, E. K.,
Khokha, M. K., & Giraldez, A. J. (2015). CRISPRscan: designing highly efficient
sgRNAs for CRISPR-Cas9 targeting in vivo. Nature Methods, 12(10), 982–988.
doi:10.1038/nmeth.3543
Muffato, M., Louis, A., Poisnel, C.-E., & Crollius, H. R. (2010). Genomicus: a database
and a browser to study gene synteny in modern and ancestral genomes.
Bioinformatics, 26(8), 1119–1121. doi:10.1093/bioinformatics/btq079
Nakayama, T., Fish, M. B., Fisher, M., Oomen-Hajagos, J., Thomsen, G. H., & Grainger,
R. M. (2013). Simple and efficient CRISPR/Cas9-mediated targeted
mutagenesis in Xenopus tropicalis. Genesis, 51(12), 835–843.
doi:10.1002/dvg.22720
Newport, J., & Kirschner, M. (1982). A major developmental transition in early
Xenopus embryos: I. characterization and timing of cellular changes at the
midblastula stage. Cell, 30(3), 675–686. doi:10.1016/0092-8674(82)90272-0
Nguyen, L. -T., Schmidt, H. A., Von Haeseler, A., & Minh, B. Q. (2015). IQ-TREE: A
fast and effective stochastic algorithm for estimating maximum-likelihood
phylogenies. Molecular Biology and Evolution, 32(1), 268–274.
doi:10.1093/molbev/msu300
216
Nieuwkoop, P. D., & Faber, J. (1967). Normal table of Xenopus laevis (Daudin) : a
systematical and chronological survey of the development from the fertilized egg till
the end of metamorphosis. Amsterdam: North Holland.
Nozawa, R. S., Boteva, L., Soares, D. C., Naughton, C., Dun, A. R., Buckle, A., …
Gilbert, N. (2017). SAF-A Regulates Interphase Chromosome Structure
through Oligomerization with Chromatin-Associated RNAs. Cell, 169(7), 1214-
1227. doi:10.1016/j.cell.2017.05.029
Ohsumi, K, & Katagiri, C. (1991). Occurrence of H1 subtypes specific to pronuclei and
cleavage-stage cell nuclei of Anuran amphibians. Developmental Biology, 147(1),
110–120. doi:10.1016/s0012-1606(05)80011-9
Ohsumi, K., Katagiri, C., & Kishimoto, T. (1993). Chromosome condensation in
Xenopus mitotic extracts without histone H1. Science, 262(5142), 2033–2035.
doi:10.1126/science.8266099
Okuwaki, M., Abe, M., Hisaoka, M., & Nagata, K. (2016). Regulation of cellular
dynamics and chromosomal binding site preference of linker histones H1.0
and H1.X. Molecular and Cellular Biology, 36(21), 2681–2696.
doi:10.1128/MCB.00200-16
Olins, A. L., & Olins, D. E. (1974). Spheroid Chromatin Units (v Bodies). Science,
183(4122), 330–333. doi:10.1126/science.183.4122.330
Owens, N. D. L., Blitz, I. L., Lane, M. A., Patrushev, I., Overton, J. D., Gilchrist, M. J., …
Khokha, M. K. (2016). Measuring Absolute RNA Copy Numbers at High
Temporal Resolution Reveals Transcriptome Kinetics in Development. Cell
Reports, 14(3), 632–647. doi:10.1016/j.celrep.2015.12.050
Park, P. J. (2009). ChIP–seq: advantages and challenges of a maturing technology.
Nature reviews. Genetics, 10(10), 669. doi:10.1038/nrg2641.ChIP-Seq
Peretti, M., & Khochbin, S. (1997). The evolution of the differentiation-specific histone
H1 gene basal promoter. Journal of Molecular Evolution, 44(2), 128–134.
doi:10.1007/PL00006129
Peshkin, L., Wühr, M., Pearl, E., Haas, W., Freeman, R. M., Jr, Gerhart, J. C., …
Kirschner, M. W. (2015). On the Relationship of Protein and mRNA Dynamics
in Vertebrate Embryonic Development. Developmental Cell, 35(3), 383–394.
doi:10.1016/j.devcel.2015.10.010
217
Ponte, I., Romero, D., Yero, D., Suau, P., & Roque, A. (2017). Complex Evolutionary
History of the Mammalian Histone H1.1–H1.5 Gene Family. Molecular Biology
and Evolution, 34(3), 545-558. doi:10.1093/molbev/msw241
Price, R. J. (2011). The Role of Histone Variants and hnRNPs in Early Xenopus laevis
Development (Unpublished doctoral dissertation). University of Portsmouth. UK.
Quinlan, A. R., & Hall, I. M. (2010). BEDTools: a flexible suite of utilities for comparing
genomic features. Bioinformatics, 26(6), 841–842.
doi:10.1093/bioinformatics/btq033
Rambaut, A. (2018). FigTree: Tree Figure Drawing Tool (Version 1.4.4). [Computer
software]. Available online at: http://tree.bio.ed.ac.uk/
Ramírez, F., Ryan, D. P., Grüning, B., Bhardwaj, V., Kilpert, F., Richter, A. S., …
Manke, T. (2016). deepTools2: a next generation web server for deep-
sequencing data analysis. Nucleic Acids Research, 44(W1), W160–W165.
doi:10.1093/nar/gkw257
Risley, M. S., & Eckhardt, R. A. (1981). H1 histone variants in Xenopus laevis.
Developmental Biology, 84(1), 79–87. doi:10.1016/0012-1606(81)90372-9
Robertson, G., Hirst, M., Bainbridge, M., Bilenky, M., Zhao, Y., Zeng, T., … Jones, S.
(2007). Genome-wide profiles of STAT1 DNA association using chromatin
immunoprecipitation and massively parallel sequencing. Nature Methods, 4(8),
651–657. doi:10.1038/nmeth1068
Robinson, J. T., Thorvaldsdóttir, H., Winckler, W., Guttman, M., Lander, E. S., Getz, G.,
& Mesirov, J. P. (2011). Integrative genomics viewer. Nature Biotechnology,
29(1), 24–26. doi:10.1038/nbt.1754
Rogakou, E. P., Pilch, D. R., Orr, A. H., Ivanova, V. S., & Bonner, W. M. (1998). DNA
Double-stranded Breaks Induce Histone H2AX Phosphorylation on Serine
139*. Journal of Biological Chemistry, 273(10), 5858–5868.
doi:10.1074/jbc.273.10.5858
Rosindell, J., & Harmon, L. J. (2012). OneZoom: A Fractal Explorer for the Tree of Life.
PLoS Biology, 10(10), e1001406. doi:10.1371/journal.pbio.1001406
Salamov, A. A., & Solovyev, V. V. (2000). Ab initio gene finding in Drosophila genomic
DNA. Genome Research, 10(4), 516–522. doi:10.1101/gr.10.4.516
Sánchez, R., Serra, F., Tárraga, J., Medina, I., Carbonell, J., Pulido, L., … Dopazo, H.
(2011). Phylemon 2.0: A suite of web-tools for molecular evolution,

218
phylogenetics, phylogenomics and hypotheses testing. Nucleic Acids Research,
39, 470–474. doi:10.1093/nar/gkr408
Sancho, M., Diani, E., Beato, M., & Jordan, A. (2008). Depletion of human histone H1
variants uncovers specific roles in gene expression and cell growth. PLoS
Genetics, 4(10), e1000227. doi:10.1371/journal.pgen.1000227
Sander, J. D., Cade, L., Khayter, C., Reyon, D., Peterson, R. T., Joung, J. K., & Yeh, J.-R.
J. (2012). Targeted gene disruption in somatic zebrafish cells using engineered
TALENs. Nature Biotechnology, 29(8), 697–698. doi:10.1038/nbt.1934
Sarg, B., Lopez, R., Lindner, H., Ponte, I., Suau, P., & Roque, A. (2015). Identification of
novel post-translational modifications in linker histones from chicken
erythrocytes. Journal of Proteomics, 113, 162–177. doi:10.1016/j.jprot.2014.10.004
Schneider, P. N., Hulstrand, A. M., & Houston, D. W. (2010). Fertilization of Xenopus
oocytes using the host transfer method. Journal of Visualized Experiments : JoVE,
(45), 1864. doi:10.3791/1864
Sentmanat, M. F., Peters, S. T., Florian, C. P., Connelly, J. P., & Pruett-Miller, S. M.
(2018). A Survey of Validation Strategies for CRISPR-Cas9 Editing. Scientific
Reports, 8(1), 1–8. doi:10.1038/s41598-018-19441-8
Sepsa, A., Levidou, G., Gargalionis, A., Adamopoulos, C., Spyropoulou, A.,
Dalagiorgou, G., … Korkolopoulou, P. (2015). Emerging role of linker histone
variant H1x as a biomarker with prognostic value in astrocytic gliomas. A
multivariate analysis including trimethylation of H3K9 and H4K20. PLoS one,
10(1), e0115101. doi:10.1371/journal.pone.0115101
Session, A. M., Uno, Y., Kwon, T., Chapman, J. A., Toyoda, A., Takahashi, S., …
Rokhsar, D. S. (2016). Genome evolution in the allotetraploid frog Xenopus
laevis. Nature, 538(7625), 336–343. doi:10.1038/nature19840
Seyedin, S. M., & Kistler, W. S. (1980). Isolation and characterization of rat testis H1t.
An H1 histone variant associated with spermatogenesis. Journal of Biological
Chemistry, 255(12), 5949–5954.
Shahhoseini, M., Favaedi, R., Baharvand, H., Sharma, V., & Stunnenberg, H. G. (2010).
Evidence for a dynamic role of the linker histone variant H1x during retinoic
acid-induced differentiation of NT2 cells. FEBS Letters, 584(22), 4661–4664.
doi:10.1016/j.febslet.2010.10.041

219
Shechter, D., Nicklay, J. J., Chitta, R. K., Shabanowitz, J., Hunt, D. F., & Allis, C. D.
(2009). Analysis of histones in Xenopus laevis. I. A distinct index of enriched
variants and modifications exists in each cell type and is remodeled during
developmental transitions. Journal of Biological Chemistry, 284(2), 1064–1074.
doi:10.1074/jbc.M807273200
Shen, X., & Gorovsky, M. A. (1996). Linker histone H1 regulates specific gene
expression but not global transcription in vivo. Cell, 86(3), 475–483.
doi:10.1016/S0092-8674(00)80120-8
Shen, X., Yu, L., Weir, J. W., & Gorovsky, M. A. (1995). Linker histones are not
essential and affect chromatin condensation in vivo. Cell, 82(1), 47–56.
doi:10.1016/0092-8674(95)90051-9
Shigeta, M., Sakane, Y., Iida, M., Suzuki, M., Kashiwagi, K., Kashiwagi, A., … Suzuki,
K. T. (2016). Rapid and efficient analysis of gene function using CRISPR-Cas9
in Xenopus tropicalis founders. Genes to Cells, 21(7), 755–771.
doi:10.1111/gtc.12379
Sievers, F., Wilm, A., Dineen, D., Gibson, T. J., Karplus, K., Li, W., … Higgins, D. G.
(2011). Fast, scalable generation of high-quality protein multiple sequence
alignments using Clustal Omega. Molecular Systems Biology, 7(539).
doi:10.1038/msb.2011.75
Sirotkin, A. M., Edelmann, W., Cheng, G., Klein-Szanto, A., Kucherlapati, R., &
Skoultchi, A. I. (1995). Mice develop normally without the H1(0) linker
histone. Proceedings of the National Academy of Sciences, 92(14), 6434–6438.
doi:10.1073/pnas.92.14.6434
Skirkanich, J., Laxardi, G., Yang, J., Kodjabachian, L., & Klein, P. S. (2011). An essential
role for transcription before the MBT in Xenopus laevis. Developmental Biology,
357(2), 478–491. doi:10.1016/j.ydbio.2011.06.010
Smith, R. C., Dworkin-Rastl, E., & Dworkin, M. B. (1988). Expression of a histone H1-
like protein is restricted to early Xenopus development. Genes & Development, 2,
1284–1295. doi:10.1101/gad.2.10.1284
Stoldt, S., Wenzel, D., Schulze, E., Doenecke, D., & Happel, N. (2007). G1 phase-
dependent nucleolar accumulation of human histone H1x. Biology of the Cell,
99(10), 541–552. doi:10.1042/BC20060117

220
Summerton, J., Stein, D., Huang, B., Matthews, P., Weller, D., & Partridge, M. (1997).
Morpholino and Phosphorothioate Antisense Oligomers Compared in Cell-
Free and In-Cell Systems. Antisense & Nucleic Acid Drug Development, 7(2), 63–
70. doi:10.1089/oli.1.1997.7.63
Takata, H., Matsunaga, S., Morimoto, A., Ono-Maniwa, R., Uchiyama, S., & Fukui, K.
(2007). H1.X with different properties from other linker histones is required
for mitotic progression. FEBS Letters, 581(20), 3783–3788.
doi:10.1016/j.febslet.2007.06.076
Talbert, P. B., Ahmad, K., Almouzni, G., Ausiá, J., Berger, F., Bhalla, P. L., … Henikoff,
S. (2012). A unified phylogeny-based nomenclature for histone variants.
Epigenetics and Chromatin, 5(7). doi:10.1186/1756-8935-5-7
Tanaka, H., Iguchi, N., Isotani, A., Kitamura, K., Toyama, Y., Matsuoka, Y., …
Nishimune, Y. (2005). HANP1 / H1T2 , a Novel Histone H1-Like Protein
Involved in Nuclear Formation and Sperm Fertility. Molecular and Cellular
Biology, 25(16), 7107–7119. doi:10.1128/MCB.25.16.7107
Tanaka, M., Hennebold, J. D., Macfarlane, J., & Adashi, E. Y. (2001). A mammalian
oocyte-specific linker histone gene H1oo: homology with the genes for the
oocyte-specific cleavage stage histone (cs-H1) of sea urchin and the B4/H1M
histone of the frog. Development, 128(5), 655–664.
Tandon, P., Showell, C., Christine, K., & Conlon, F. L. (2012). Morpholino injection in
Xenopus. Methods in Molecular Biology, 843, 29–46. doi:10.1007/978-1-61779-523-
7_4
Teranishi, T., Tanaka, M., Kimoto, S., Ono, Y., Miyakoshi, K., Kono, T., & Yoshimura,
Y. (2004). Rapid replacement of somatic linker histones with the oocyte-
specific linker histone H1foo in nuclear transfer. Developmental Biology, 266(1),
76–86. doi:10.1016/j.ydbio.2003.10.004
Terme, J. -M., Sesé, B., Millán-Ariño, L., Mayor, R., Izpisúa Belmonte, J. C., Barrero, M.
J., & Jordan, A. (2011). Histone H1 variants are differentially expressed and
incorporated into chromatin during differentiation and reprogramming to
pluripotency. Journal of Biological Chemistry, 286(41), 35347–35357.
doi:10.1074/jbc.M111.281923
Tesson, L., Usal, C., Ménoret, S., Leung, E., Niles, B. J., Remy, S., … Cost, G. J. (2011).
Knockout rats generated by embryo microinjection of TALENs. Nature
Biotechnology, 29, 695-696. doi:10.1038/nbt.1940

221
Th’ng, J. P. H., Sung, R., Ye, M., & Hendzel, M. J. (2005). H1 family histones in the
nucleus. Control of binding and localization by the C-terminal domain. Journal
of Biological Chemistry, 280(30), 27809–27814. doi:10.1074/jbc.M501627200
Thoma, F., Koller, T., & Klug, A. (1979). Involvement of histone H1 in the organization
of the nucleosome and of the salt-dependent superstructures of chromatin.
Journal of Cell Biology, 83(2 Pt 1), 403–427. doi:10.1083/jcb.83.2.403
Timme-Laragy, A. R., Karchner, S. I., & Hahn, M. E. (2012). Gene knockdown by
morpholino-modified oligonucleotides in the zebrafish (Danio rerio) model:
applications for developmental toxicology. Methods in Molecular Biology, 889,
51–71. doi:10.1007/978-1-61779-867-2_5
Tonna, S., El-Ostra, A., Cooper, M. E., & Tikellis, C. (2010). Metabolic memory and
diabetic nephropathy: potential role for epigenetic mechanisms. Nature
Reviews Nephrology, 6, 332–241. doi:10.1038/nrneph.2010.55
Trifinopoulos, J., Nguyen, L. T., von Haeseler, A., & Minh, B. Q. (2016). W-IQ-TREE: a
fast online phylogenetic tool for maximum likelihood analysis. Nucleic Acids
Research, 44(W1), W232–W235. doi:10.1093/nar/gkw256
Trollope, A. F., Sapojnikova, N., Thorne, A. W., Crane-Robinson, C., & Myers, F. A.
(2010). Linker histone subtypes are not generalized gene repressors. Biochimica
et Biophysica Acta, 1799(9), 642–652. doi:10.1016/j.bbagrm.2010.08.007
Turinetto, V., & Giachino, C. (2015). Multiple facets of histone variant H2AX: a DNA
double-strand-break marker with several biological functions. Nucleic Acids
Research, 43(5), 2489–2498. doi:10.1093/nar/gkv061
Venkatesh, B., Lee, A. P., Ravi, V., Maurya, A. K., Lian, M. M., Swann, J. B., … Warren,
W. C. (2014). Elephant shark genome provides unique insights into
gnathostome evolution. Nature, 505, 174-179. doi:10.1038/nature12826
Venkatesh, B., Tay, A., Dandona, N., Patil, J. G., & Brenner, S. (2005). A compact
cartilaginous fish model genome. Current Biology, 15(3), 82–83.
doi:10.1016/j.cub.2005.01.021
Wang, F., Shi, Z., Cui, Y., Guo, X., Shi, Y.-B., & Chen, Y. (2015). Targeted gene
disruption in Xenopus laevis using CRISPR/Cas9. Cell & Bioscience, 5(15),
doi:10.1186/s13578-015-0006-1
Wiśniewski, J. R., Zougman, A., Krüger, S., & Mann, M. (2007). Mass Spectrometric
Mapping of Linker Histone H1 Variants Reveals Multiple Acetylations,

222
Methylations, and Phosphorylation as Well as Differences between Cell
Culture and Tissue. Molecular & Cellular Proteomics, 6(1), 72–87.
doi:10.1074/mcp.m600255-mcp200
Yamamoto, T., & Horikoshi, M. (1996). Cloning of the cDNA encoding a novel subtype
of histone H1. Gene, 173(2), 281–285. doi:10.1016/0378-1119(96)00020-0
Yan, W., Ma, L., Burns, K. H., & Matzuk, M. M. (2003). HILS1 is a spermatid-specific
linker histone H1-like protein implicated in chromatin remodeling during
mammalian spermiogenesis. Proceedings of the National Academy of Sciences,
100(18), 10546–10551. doi:10.1073/pnas.1837812100
Yelagandula, R., Stroud, H., Holec, S., Zhou, K., Feng, S., Zhong, X., … Berger, F.
(2014). The Histone Variant H2A.W Defines Heterochromatin and Promotes
Chromatin Condensation in Arabidopsis. Cell, 158(1), 98–109.
doi:10.1016/j.cell.2014.06.006
Young, J. J., Cherone, J. M., Doyon, Y., Ankoudinova, I., Faraji, F. M., Lee, A. H., ...
Zeitler, B. (2011). Efficient targeted gene disruption in the soma and germ line
of the frog Xenopus tropicalis using engineered zinc- finger nucleases.
Proceedings of the National Academy of Sciences, 108(17), 7052–7057.
doi:10.1073/pnas.1102030108
Zerbino, D. R., Achuthan, P., Akanni, W., Amode, M. R., Barrell, D., Bhai, J., … Flicek,
P. (2017). Ensembl 2018. Nucleic Acids Research, 46(D1), D754–D761.
doi:10.1093/nar/gkx1098
Zhang, Y., Liu, T., Meyer, C. A., Eeckhoute, J., Johnson, D. S., Bernstein, B. E., … Liu,
X. S. (2008). Model-based analysis of ChIP-Seq (MACS). Genome Biology, 9(9),
R137. doi:10.1186/gb-2008-9-9-r137

223
Appendix A
Table A-1. H1X protein sequence accession numbers for species selected for
phylogenetic analysis.
Common names Scientific name H1X Accession
African clawed frog Xenopus laevis NP_001080265.1,
NP_001131058.1
Anole lizard Anolis carolinensis NA
Asian bonytongue, Asian
Arowana
Scleropages formosus ENSSFOP00015031241,
ENSSFOP00015033207
Axolotl Ambystoma mexicanum AC_02200034483.1
Cane toad, marine toad Rhinella marina NA
Chicken Gallus gallus ENSGALP00000053338
Coelacanth Latimeria chalumnae ENSLACP00000018145,
ENSLACT00000026684.1
Elephant Shark Callorhinchus milii XP_007888543.1
Hagfish Eptatretus burgeri ENSEBUP00000023559
Human Homo sapiens EAW79264.1
Opossum Monodelphis domestica ENSMODT00000010327.2
Painted turtle Chrysemys picta bellii ENSCPBP00000019933
Platypus Ornithorhynchus anatinus ENSOANP00000004947
Python Python bivittatus XP_007421962.1
Spotted gar Lepisosteus oculatus XP_006631252.1
Tibetan Frog, Xizang
Plateau frog
Nanorana parkeri XP_018409451.1,
XP_018409452.1
Western clawed frog,
Tropical clawed frog
Xenopus tropicalis NP_001016699.1,
NP_001001233.1
Tuatara Sphenodon punctatus NA
Wallaby Notamacropus eugenii ENSMEUP00000012488
Zebrafish Danio rerio ENSDARP00000070677

224
Table A-2. H1 accession numbers in species used in phylogenetic tree construction.
Species Protein Accession
D. melanogaster H1 NP_001027286.1
P.miliaris Cleavage-stage H1 AAB48830.1
S.purpuratus H1-alpha NP_999714.1
S.purpuratus H1-gamma NP_999720.1
S.purpuratus H1-delta NP_999722.1
C.intestinalis H1-beta XP_026696021.1
C.intestinalis H1.0 XP_002121210.1
C.intestinalis H1-delta-like XP_009861343.1
C.intestinalis Protamine-like XP_002130983.1
B. floridae H1 XP_002612135.1
B. floridae H1 XP_002595195.1
B. belcheri H1-like XP_019624357.1
B. belcheri H1-delta-like XP_019614881.1
Table A-3. R. marina genes and their contig locations.
Contigs were identified from protein BLAST on whole genome sequencing on the NCBI
databases.
Gene Accession number Contig ID
rpn1
ONZH01026963.1
Ctg1292_RHIMB_RM170330.1292
rab7a Ctg1292_RHIMB_RM170330.1292
h1fx.1 Ctg1292_RHIMB_RM170330.1292
h1fx.2 Ctg1292_RHIMB_RM170330.1292
h2a Ctg1292_RHIMB_RM170330.1292
hmces Ctg1292_RHIMB_RM170330.1292
copg1 ONZH0109901.1 Ctg6796_RHIMB_RM170330.6796
slc26a6 ONZH01022949.1 Ctg16459_RHIMB_RM170330.16459
uqcrc1 ONZH01028511.1 Ctg56_RHIMB_RM170330.56
gata2 ONZH0104089.1 Ctg13950_RHIMB_RM170330.13950
col7a1 ONZH01007248.1 Ctg8935_RHIMB_RM170330.8935

225
Table A.4. R. marina contig 1292 Fgenesh gene predictions.
Identity of the protein products of contigs 1292 were investigated by BLAST.
Genes on contig
Ctg1292
(ONZH01026963.1)
Complete nucleotide range of gene mRNA Strand
rpn1 15164 - 28800 1788 bp minus
rab7a isoform 54726 - 58605 738 bp plus
rab7a 59684 - 63212 315 bp plus
h1fx.1 70282 - 70887 606 bp plus
h1fx.2 75867 - 76391 525 bp plus
h2a 86212 - 86592 381 bp minus
hmces 93541 -106507 861 bp minus
copg1 108723 -117030 1167 bp minus
Table A-5. R. marina contig 6796 Fgenesh gene predictions.
Identity of the protein products of contig 6796 investigated by BLAST.
Genes on contig
ctg6796
(ONZH0109901.1)
Complete nucleotide range of gene mRNA Strand
h2a 5287 - 7556 612 bp minus
hmces 16527 - 18886 474 bp minus
copg1 26402 - 40046 2976 bp minus
coatomer subunit gamma-
1-like
40852 - 49807 1743 bp minus
col7a1-like isoform 59121 - 59883 333 bp minus
col7a1 isoform 62677 - 67289 441bp minus
col7a1 isoform 69204 - 72089 1422 bp minus
col7a1-like isoform 72543 - 78071 795 bp minus
col7a1-like isoform 78362 -115218 3276 bp minus

226
Table A-6. Identification of axolotl genes from WGS sequencing data.
Gene Sequence ID Nucleotide Range
rpn1 PGSH01047846.1 1670994 to 1671456
rab7a
PGSH01090628.1
985438 to 986851
h1fx 791125 to 791517
h2a 681247 to 681555
BMP1 683576 to 683844
BMP1 PGSH01012600.1 1452188 to 1452912
hmces PGSH01090628.1 621221 to 621432
copg1 PGSH01001987.1 36333 to 37933
slc26a6 PGSH01119465.1 2581267 to 2581467
uqcrc1.L PGSH01017561.1 17512 to 17838
uqcrc1.L PGSH01123944.1 48597 to 48798
gata2 PGSH01033998.1 1242367 to 1244661
col7a1 PGSH01119465.1 5421286 to 5422057

227
Table A-7. H1 protein sequences for species without annotated accession.
Name Protein sequence
Spotted Gar H1X
LepOcu1:LG5:51214488:51215133
MAA EVQ ETA PVS VPE EAP AAP EKK PTA ASK
RAK PAG SPA KKR SGK KKN QPG KYS QLV VET
IRK LGE RSG SSL AKI YNE AKK VSW FDQ QNG
RTY LRYSIK ALV QND SLI RVK GTG ANG SFK
LNK KKL DKP ADR RGA GAA KSP AAA AKK
AKK PPE KKA KAK PSPK KKP PQQ QPK APG
AAK KTA KPA KKT AKP VKK PKK ASK PGV PKV
PKA KRA
Sea Lamprey H1X Petromyzon marinus isolate
W1 scaf_00166, whole genome shotgun
sequence
MGT TSL LLL LLV RVA AIT HPP GPP PPV IAA
VVV VVL MSS VEA MDS LEV APA APE LHA EAH
AQD LNV ATR KGK ARK AKV AIK VGV KSS
PAK PPY LAR RRR RRR VAG GKK KKK KKN QPG
KYS RLV IDV IRA LGE RGG SSL ARV YAE ARK
VDW FDQ EHG RTY LKY SVK ALV QND TLL QVK
GTG ANG SFK LNK NKL EKK AAE EKG KSK PPA
PTS SEP VGK KSV VKA EPK ALR GIT EKK KKK
NEQ KQK SLK EKN KKV KHS KKS VKT SVG KSV
SKA IAK GKK PTK VSK SSF YPA KIS ELS YFP
NVW PPR HRN ILL SST RGI VNR SLR ALA QET
NLL VMA FNS PAN KDS TYC ACA DAL LQQ SAK
LFR Y
Cane Toad H1X.1 GenBank:
ONZH01026963.1[Rhinella marina]
MSL ELN LPT TDE EDE GED SPI RSS RRK RGA
AAS TGA SKK KGK KKK NQP GRY SQL VVD TIR
KLG ERN GSS LAK IYS EAK KVS WFD QQN GRT
YLK YSI KAL VQN DTL LQV KGV GAN GSF RLN
KKK LEG GGG PPL KRK QPL PPN LRP KRT TSA
SSS PKK SHK KAK PKK EKP KKS SSP PKK KAG
GKK VKK AAK PSV PKV PKS KKS
Cane Toad H1X.2 GenBank:
ONZH01026963.1[Rhinella marina]
MAP QEV APA SRR TKA AAA AAV AAK KSA
SKK KKN QPG RYS QLV VDT IRK LGE RNG SSL
AKI YGE AKK VSW FDQ QNG RTY LKY SIK ALV
QND TLL QVK GVG ANG SFR LNK KKL EGL AVP
PKK AAP APK PAA KKP AAP KKS PKK AKP APK
KSA K
H1_FLLO01002199.1 Branchiostoma
lanceolatum genome assembly
xfSc0000001,WGS
MED HSV LSS RLK AHP PTT TMI MEA LES LKD
RTG SSV QAI KKY IAT NYK FDV KKM SHF IKR
ALK ALV EKD VIL QVK GTG AFG SFK INV AVR
KAA EKA TKK ARN AAK KAA KKA SKA AEK
ATK KAR EVA EKA SKK AKK AVD KAA KKA
AGK ASK KVK KSA EKA TKK TVK KTA KQA KTP
LVR KAA KPA ASA PAH PST TDM ALD SDC EFD
TFA TDM ALD SDC EFD NFT TDM ALD SDC EFD
TFA TDM ALD SDC EFD TFC NFQ MAL IAK LNY
QID RL
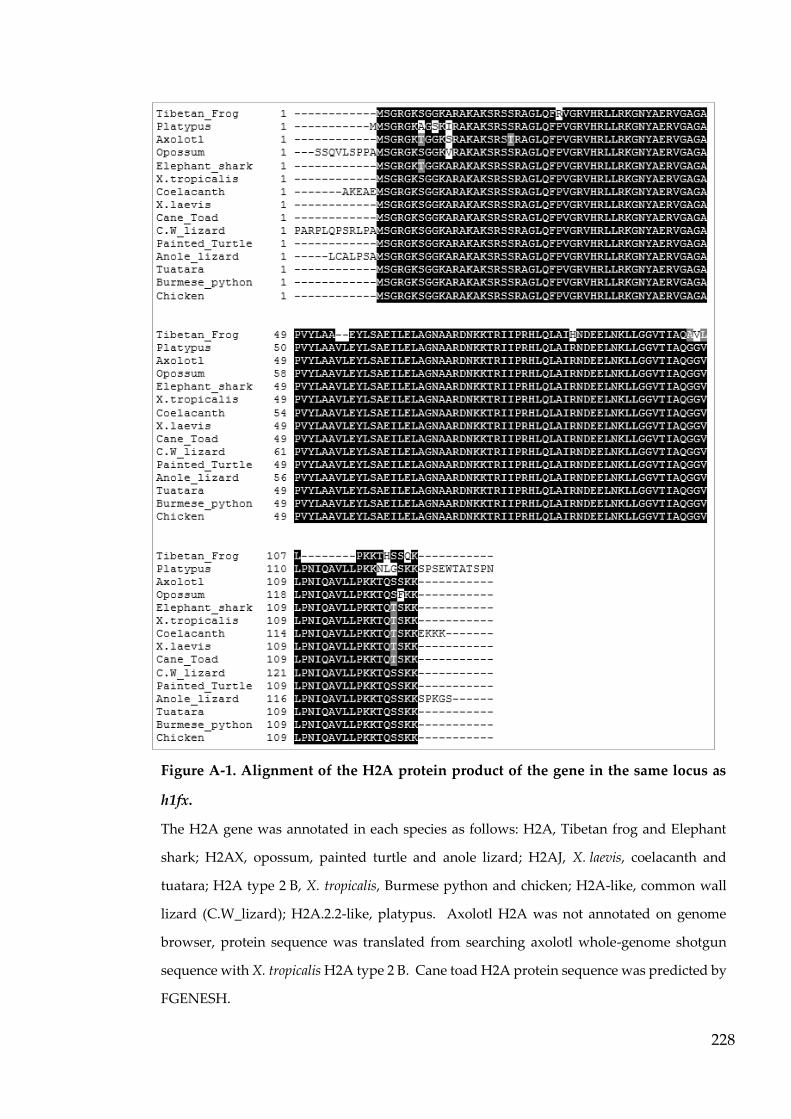
228
Figure A-1. Alignment of the H2A protein product of the gene in the same locus as
h1fx.
The H2A gene was annotated in each species as follows: H2A, Tibetan frog and Elephant
shark; H2AX, opossum, painted turtle and anole lizard; H2AJ, X. laevis, coelacanth and
tuatara; H2A type 2 B, X. tropicalis, Burmese python and chicken; H2A-like, common wall
lizard (C.W_lizard); H2A.2.2-like, platypus. Axolotl H2A was not annotated on genome
browser, protein sequence was translated from searching axolotl whole-genome shotgun
sequence with X. tropicalis H2A type 2 B. Cane toad H2A protein sequence was predicted by
FGENESH.

229
Appendix B
Figure B-1. Wholemount in situ hybridisation to detect H1X expression in X. laevis.
Embryos at stage 9, 11, 16, 22, 28 and 38 were hybridized with anti-sense H1X RNA
probes or control (sense) RNA probes. H1X was detected in stage 9, localising to the
anterior of the embryo as development progressed. Primers used to generate the H1X
probe sequence, forward; ATGGCTCTAGAGCTGGAAGAG and reverse;
CGCTTTCTTGGATTTAGGCG were analysed and found to be specific to h1fx.1.
Adapted from Figure 3.8E by Price (2011).

230
Figure B-2. Expression of odc1 in X. laevis tissues.
Determination of the transcripts per million (TPM) of odc1 expressed in each tissue type
by RNA-sequencing (Session et al., 2016), represented as Log2(TPM). (Adapted from
Xenbase (Karimi et al., 2018)).

231
Appendix C
Figure C-1. Injection of morpholino oligonucleotides into oocytes followed by
culture.
X. laevis oocytes were defolliculated and microinjected with either H1X or Standard
Control (SC) morpholino oligonucleotide. They were briefly left to recover and then
placed into dishes of oocyte culture media at 18ᵒC. Starting from the day of injection
(Day 0), 5 oocytes were collected every 24 hours approximately for 6 days. Proteins
were extracted, separated on 12% SDS-Page and transferred to nitrocellulose
membrane. Membranes were MemCode stained to check the loadings, and then probed
with either in-house anti-H1X antibody (A, B.) or anti-H3 (Abcam) (C, D). Protein levels
remained constant over 6 days of culture, suggesting H1X protein is stable over this
period.
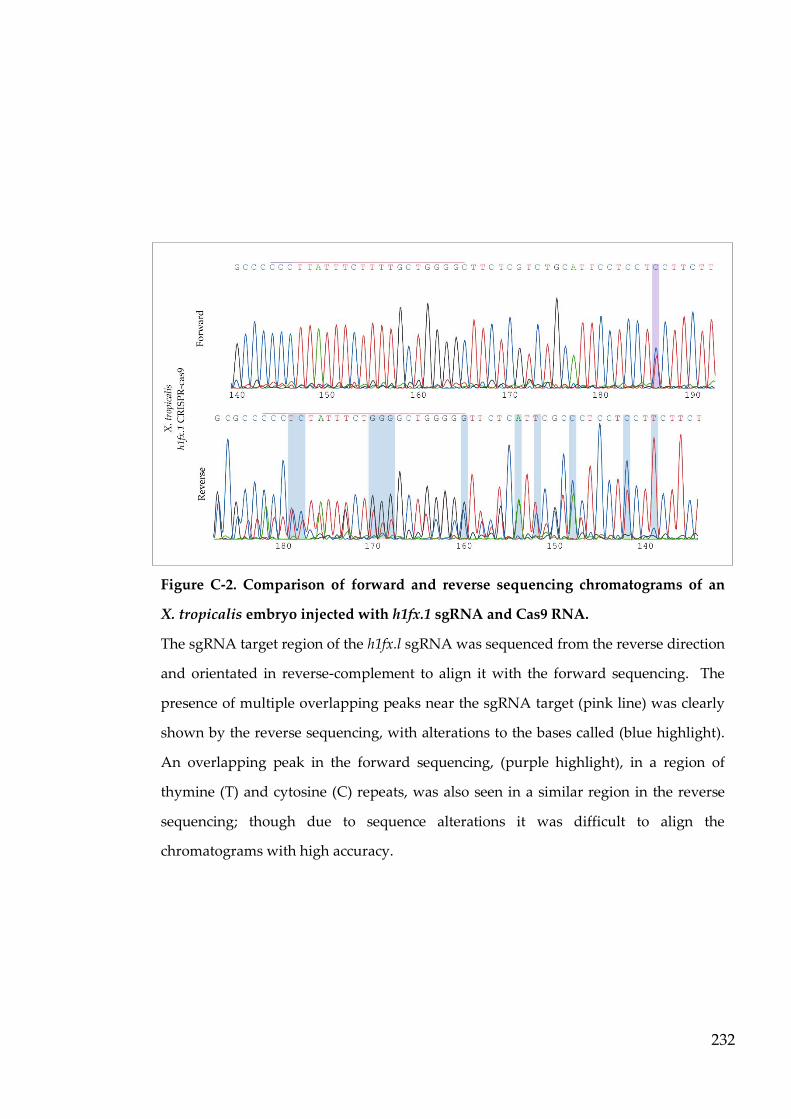
232
Figure C-2. Comparison of forward and reverse sequencing chromatograms of an
X. tropicalis embryo injected with h1fx.1 sgRNA and Cas9 RNA.
The sgRNA target region of the h1fx.l sgRNA was sequenced from the reverse direction
and orientated in reverse-complement to align it with the forward sequencing. The
presence of multiple overlapping peaks near the sgRNA target (pink line) was clearly
shown by the reverse sequencing, with alterations to the bases called (blue highlight).
An overlapping peak in the forward sequencing, (purple highlight), in a region of
thymine (T) and cytosine (C) repeats, was also seen in a similar region in the reverse
sequencing; though due to sequence alterations it was difficult to align the
chromatograms with high accuracy.

233
Fig
ure
C-3
. DN
A s
equ
enci
ng
ch
rom
ato
gra
ms
fro
m X
. tro
pic
ali
s in
ject
ed w
ith
h1f
x.1
sgR
NA
an
d C
as9
RN
A.
Fo
rwar
d a
nd
rev
erse
seq
uen
cin
g o
f a
reg
ion
of
the
h1fx
.1 g
ene
was
per
form
ed u
sin
g D
NA
ex
trac
ted
an
d P
CR
-am
pli
fied
fro
m a
to
ecli
p o
f an
adu
lt X
. tro
pica
lis
inje
cted
wit
h 2
00 p
g h
1fx.
1 sg
RN
A a
nd
1 n
g C
as9
RN
A a
s an
em
bry
o a
nd
co
mp
ared
to
a c
on
tro
l.
Th
e sg
RN
A t
arg
et s
ite
is
ind
icat
ed b
y a
pin
k li
ne,
wit
h t
he
PA
M s
ite
a p
urp
le li
ne.
Th
e fo
rwar
d s
equ
enci
ng
ch
rom
ato
gra
m s
ho
wed
mu
ltip
le o
ver
lap
pin
g p
eak
s ar
ou
nd
the
sgR
NA
tar
get
sit
e, i
ncl
ud
ing
bo
th u
pst
ream
an
d d
ow
nst
ream
of
the
sgR
NA
tar
get
sit
e. T
he
rev
erse
seq
uen
cin
g s
ho
wed
an
ab
rup
t ch
ang
e
of
the
pea
k a
mp
litu
de
to lo
w p
eak
s, s
ug
ges
tin
g t
he
seq
uen
cin
g r
eact
ion
was
less
su
cces
sfu
l, p
oss
ibly
du
e to
th
e re
pet
itiv
e h1
fx.1
gen
e se
qu
ence
,
ho
wev
er s
equ
enci
ng
fro
m a
n e
mb
ryo
in
ject
ed o
nly
wit
h C
as9
RN
A a
pp
eare
d n
orm
al.

234
Figure C-4. Subclone sequences of two mature female X. tropicalis injected with
h1fx.1 sgRNA and Cas9 RNA as embryos.
Deletions of multiples of three (blue highlight) were also seen in two other gene-edited
X. tropicalis, suggesting that the h1fx.1 sequence remained in-frame. No subclones
showed insertions or deletions within the sgRNA target sequence (pink line), instead
deletion sites were (A) 63 bp and (B) 64 bp upstream of the PAM site respectively.
Consistency of deletions between subclones from one frog were seen (A) but not
reflected in the other (B), therefore suggesting deletions and not discrepancies between
the reference sequence and the X. tropicalis population used in the research. Several
base changes were seen (bold), some of which differed from the reference sequence in
all clones and may have been DNA polymorphisms, as well as un-called nucleotides
(N).

235
0
10
20
30
40
50
60
70
80
h1fx.1 sgRNA & Cas9 RNA Cas9 RNA control
Nu
mb
er o
f em
bry
os
Normal Dead
Figure C-5. Surviving number of X. tropicalis embryos injected with h1fx.1 sgRNA
and Cas9 RNA.
Embryos were injected with 200 pg h1fx.1 sgRNA and 1 ng Cas9 RNA, or 1 ng Cas9 RNA
only as a control. The numbers of surviving and dead embryos were counted until stage
41, at which point surviving h1fx.1 sgRNA-injected embryos were moved to the EXRC
to reach maturity. Due to space constraints in the EXRC, control embryos were not
grown up further.

236
Appendix D.
Figure D-1. Quality assessment of X. tropicalis raw and trimmed sequences.
MultiQC was used to combine X. tropicalis individual FastQC reports before trimming; (A)
sequence count plot. (B) The mean quality score of each base. (C) The per-base N content,
indicating regions where no base was called. (D) Sequence duplication levels. (E) The per-
base sequence content; each base has a random chance of appearing. (F) The per-sequence
quality score. (G) Adaptor content. (H) The per-sequence GC content. MultiQC was then
used to combine FastQC reports after trimming; (I) sequence count plot. (J) The mean
quality score of each base, (K) The per-base N content, indicating regions where no base
was called. (L) Sequence duplication levels. (M) The per-base sequence content; each base
has a random chance of appearing. (N) The per-sequence quality score. (O) Sequence
length distribution. (P) The per-sequence GC content.

237
Figure D-2. FastQC report of a flow cell in a high-throughput sequencing machine.
The two paired-end samples generated by FastQC from the X. laevis input sequencing files
were representative of all samples. The flow cell should be a uniform blue; aqua and red
areas indicate incomplete washing. (A) paired-end sample 1, (B) paired-end sample 2.

238
Table D-1. Summary of X. laevis ChIP-Seq reads.
Reads were mapped and filtered by S. Robson.
X. laevis early X. laevis late X. laevis input
Total reads 19,952,396 20,451,659 20,547,466
Secondary reads 12,495 10,578 10,409
Supplementary
reads
0 0 0
Duplicate reads 0 0 0
Mapped reads 19,952,396 (100%) 20,451,695 (100%) 20,547,466 (100%)
Reads paired in
sequencing
19,104,594 19,643,962 19,743,462
Read1 9,552,297 9,821,981 9,871,731
Read2 9,552,297 9,821,981 9,871,731
Properly paired
reads
19,104,594 (100%) 19,643,962 (100%) 19,743,462 (100%)
With itself and
mate mapped
19,104,594 19,643,962 19,743,462
Singletons 0 (0%) 0 (0%) 0 (0%)
Mate mapped to
different
chromosome
0 0 0
Mate mapped to
different
chromosome
(mapQ>=5)
0 0 0
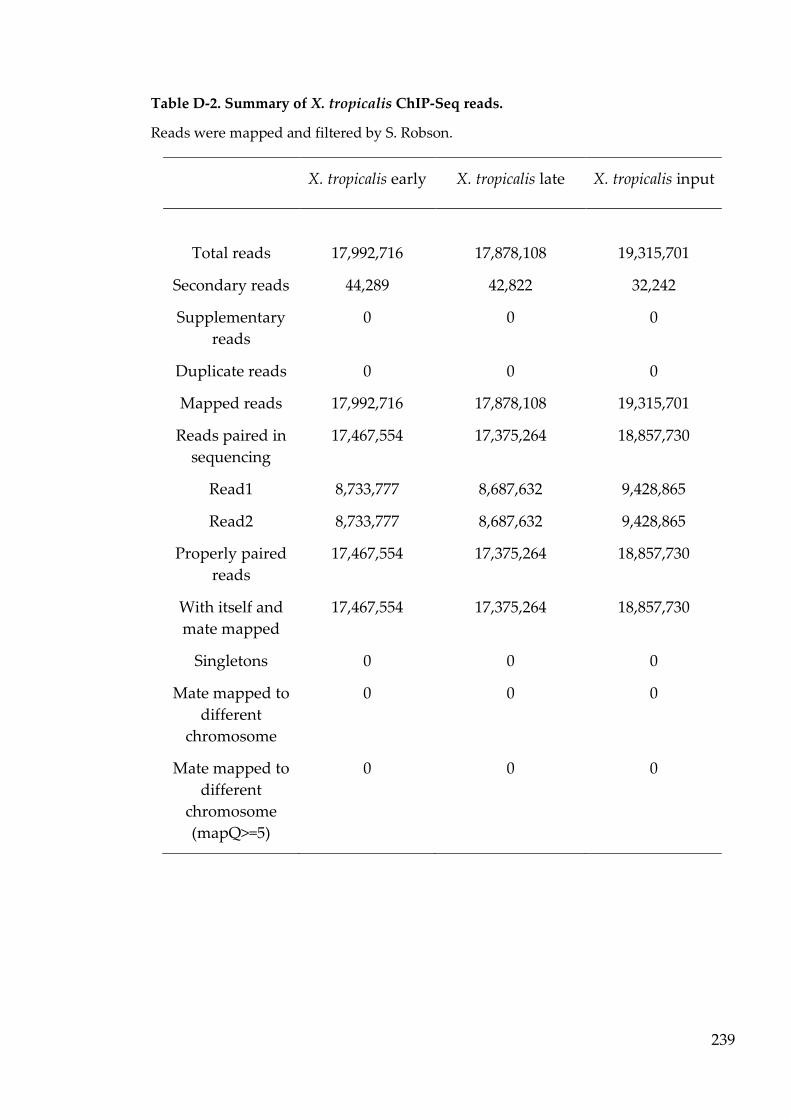
239
Table D-2. Summary of X. tropicalis ChIP-Seq reads.
Reads were mapped and filtered by S. Robson.
X. tropicalis early X. tropicalis late X. tropicalis input
Total reads 17,992,716 17,878,108 19,315,701
Secondary reads 44,289 42,822 32,242
Supplementary
reads
0 0 0
Duplicate reads 0 0 0
Mapped reads 17,992,716 17,878,108 19,315,701
Reads paired in
sequencing
17,467,554 17,375,264 18,857,730
Read1 8,733,777 8,687,632 9,428,865
Read2 8,733,777 8,687,632 9,428,865
Properly paired
reads
17,467,554 17,375,264 18,857,730
With itself and
mate mapped
17,467,554 17,375,264 18,857,730
Singletons 0 0 0
Mate mapped to
different
chromosome
0 0 0
Mate mapped to
different
chromosome
(mapQ>=5)
0 0 0

240
Appendix E
Table E-2. Primer sequences for reverse-transcription PCR.
Forward Primer 5' to 3' Reverse Primer 5' to 3'
X. laevis h1fx.1 CCA TGG GTA TGG CTC TAG
AGC TGG AAG A
AAG CTT TTA CGC TTT CTT
GGA TTTA GGC
X. laevis odc1 CAG CTA GCT GTG GTG TGG CAA CAT GGA AAC TCA
CAC C
X. laevis h1fx.2 GCA ACA TCA CAA TGG CAC
TGC
GCT GCC ACT TTA CAC TAT
CAT G
X. tropicalis h1fx.1 TGG CCA AGA TCT ACA GCG
AA
GCA ACC CCT CAA GCT TCT
TC
X. tropicalis odc1 CAG CTA GCT GTG GTG TTG CAA CAT GGA AAC TTA CAC
C
X. tropicalis h1fx.2 AGA GCC TCC CCT TCA AAG
TC
GTG AGG GTC TTG TTG TGC
AG
Table E-3. Primer sequences for generation of X. tropicalis h1fx.1 RNA probe.
Forward Primer 5' to 3' Reverse Primer 5' to 3'
X. tropicalis h1fx.1 TCCTTTCCATCGGTTCTGCT CGGCACACAACCAGCTATTG
Table E-4. Morpholino oligonucleotide sequences in X. laevis.
Morpholino oligonucleotide sequence 5' to 3'
X. laevis h1fx.1 CTA GAG CCA TGT CAC CGG GTA TCG C 3'
Fluorescein
Standard control CCT CTT ACC TCA GTT ACA ATT TAT A
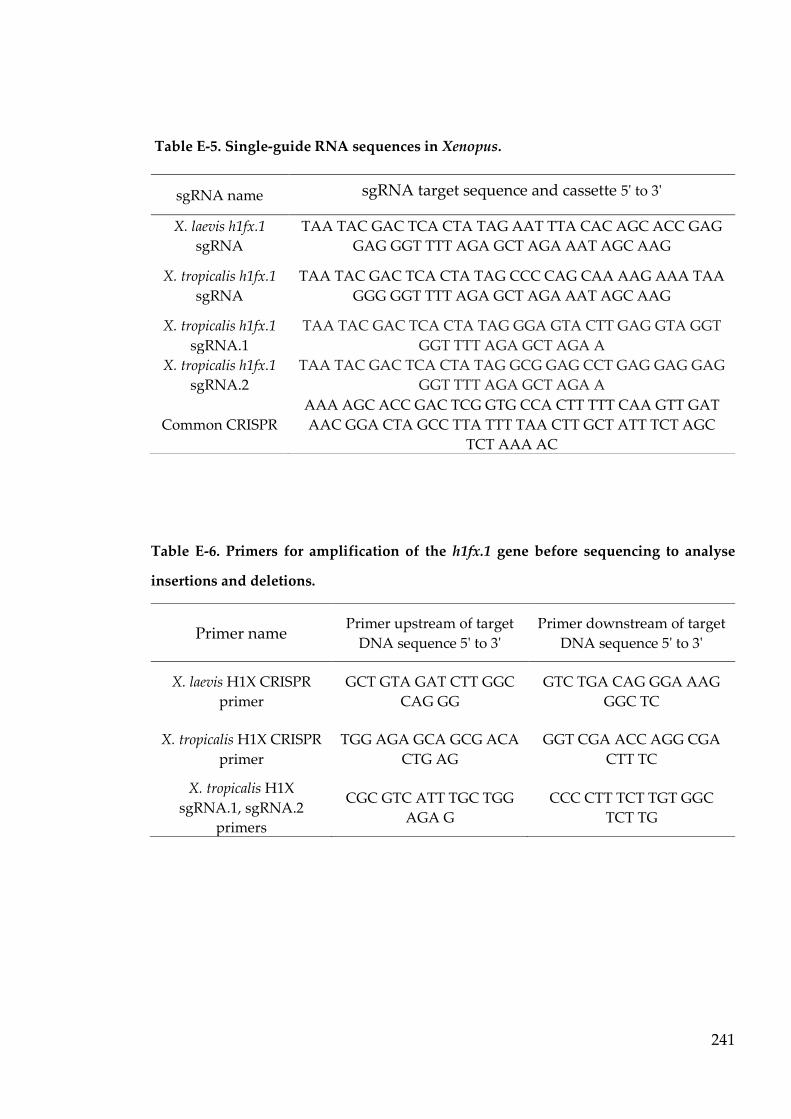
241
Table E-5. Single-guide RNA sequences in Xenopus.
Table E-6. Primers for amplification of the h1fx.1 gene before sequencing to analyse
insertions and deletions.
sgRNA name sgRNA target sequence and cassette 5' to 3'
X. laevis h1fx.1
sgRNA
TAA TAC GAC TCA CTA TAG AAT TTA CAC AGC ACC GAG
GAG GGT TTT AGA GCT AGA AAT AGC AAG
X. tropicalis h1fx.1
sgRNA
TAA TAC GAC TCA CTA TAG CCC CAG CAA AAG AAA TAA
GGG GGT TTT AGA GCT AGA AAT AGC AAG
X. tropicalis h1fx.1
sgRNA.1
TAA TAC GAC TCA CTA TAG GGA GTA CTT GAG GTA GGT
GGT TTT AGA GCT AGA A
X. tropicalis h1fx.1
sgRNA.2
TAA TAC GAC TCA CTA TAG GCG GAG CCT GAG GAG GAG
GGT TTT AGA GCT AGA A
Common CRISPR
AAA AGC ACC GAC TCG GTG CCA CTT TTT CAA GTT GAT
AAC GGA CTA GCC TTA TTT TAA CTT GCT ATT TCT AGC
TCT AAA AC
Primer name Primer upstream of target
DNA sequence 5' to 3'
Primer downstream of target
DNA sequence 5' to 3'
X. laevis H1X CRISPR
primer
GCT GTA GAT CTT GGC
CAG GG
GTC TGA CAG GGA AAG
GGC TC
X. tropicalis H1X CRISPR
primer
TGG AGA GCA GCG ACA
CTG AG
GGT CGA ACC AGG CGA
CTT TC
X. tropicalis H1X
sgRNA.1, sgRNA.2
primers
CGC GTC ATT TGC TGG
AGA G
CCC CTT TCT TGT GGC
TCT TG

242
Figure E-1. Plasmid map of the pGEM-T Easy Vector (Promega).
Figure E-2. Map of the Cas9 plasmid.

243
Figure E-3. pCRII plasmid map.

244
Ethical Review
Copyright © 2022 FDOKUMEN