Exposure to mixtures of organohalogen contaminants and associative interactions with thyroid...
15
Exposure to mixtures of organohalogen contaminants and associative interactions with thyroid hormones in East Greenland polar bears (Ursus maritimus) Gro D. Villanger a, ⁎, Bjørn M. Jenssen a, ⁎, Rita R. Fjeldberg a , Robert J. Letcher b , Derek C.G. Muir c , Maja Kirkegaard d , Christian Sonne d , Rune Dietz d a Department of Biology, Norwegian University of Science and Technology, Trondheim, Norway b Wildlife and Landscape Science Directorate, Science and Technology Branch, Environment Canada, National Wildlife Research Centre, Carleton University, Ottawa, Canada c Aquatic Ecosystem Protection Research Division, Environment Canada, Burlington, Canada d Department of Arctic Environment, National Environmental Research Institute, Aarhus University, Roskilde, Denmark abstract article info Article history: Received 7 September 2010 Accepted 20 January 2011 Available online 23 February 2011 Keywords: Arctic Combined effects Endocrine disruption Marine mammals Organohalogen contaminants Thyroid hormones We investigated the multivariate relationships between adipose tissue residue levels of 48 individual organohalogen contaminants (OHCs) and circulating thyroid hormone (TH) levels in polar bears (Ursus maritimus) from East Greenland (1999–2001, n = 62), using projection to latent structure (PLS) regression for four groupings of polar bears; subadults (SubA), adult females with cubs (AdF_N), adult females without cubs (AdF_S) and adult males (AdM). In the resulting significant PLS models for SubA, AdF_N and AdF_S, some OHCs were especially important in explaining variations in circulating TH levels: polybrominated diphenylether (PBDE)-99, PBDE-100, PBDE-153, polychlorinated biphenyl (PCB)-52, PCB-118, cis-nonachlor, trans-nonachlor, trichlorobenzene (TCB) and pentachlorobenzene (QCB), and both negative and positive relationships with THs were found. In addition, the models revealed that DDTs had a positive influence on total 3,5,3′-triiodothyronine (TT3) in AdF_S, and that a group of 17 higher chlorinated ortho-PCBs had a positive influence on total 3,5,3′,5′-tetraiodothyronine (thyroxine, TT4) in AdF_N. TH levels in AdM seemed less influenced by OHCs because of non-significant PLS models. TH levels were also influenced by biological factors such as age, sex, body size, lipid content of adipose tissue and sampling date. When controlling for biological variables, the major relationships from the PLS models for SubA, AdF_N and AdF_S were found significant in partial correlations. The most important OHCs that influenced TH levels in the significant PLS models may potentially act through similar mechanisms on the hypothalamic–pituitary–thyroid (HPT) axis, suggesting that both combined effects by dose and response addition and perhaps synergistic potentiation may be a possibility in these polar bears. Statistical associations are not evidence per se of biological cause– effect relationships. Still, the results of the present study indicate that OHCs may affect circulating TH levels in East Greenland polar bears, adding to the “weight of evidence” suggesting that OHCs might interfere with thyroid homeostasis in polar bears. © 2011 Elsevier Ltd. All rights reserved. 1. Introduction Chronic low-level exposure to endocrine disrupting chemicals (EDCs) may cause detrimental effects on development, behaviour, fertility and survival in wildlife species (Colborn et al., 1993; Crisp et al., 1998; Lintelmann et al., 2003). EDCs and global climate changes are among the currently important anthropogenic stressors to arctic wildlife and ecosystems. EDCs may affect an individual's ability to adapt to ongoing climate-related changes in the Arctic (Jenssen, 2006). Many anthropogenic organohalogen contaminants (OHCs), including polychlorinated biphenyls (PCBs), polybrominated diphe- nylethers (PBDEs), and organochlorine pesticides (OCPs) such as DDTs, have been shown to have endocrine disruptive activity (Colborn et al., 1993; Crisp et al., 1998; Goodhead and Tyler, 2009). Common characteristics define these compounds as persistent organic pollutants as they are subjected to long-range transport to the Arctic where marine food web biomagnification results in high levels in lipid-rich tissues of top predators, such as the polar bear (Ursus maritimus)(Letcher et al., 2009, 2010; Sørmo et al., 2006; Thomann, 1989). Female polar bears, as with other mammals, transfer OHCs through the placenta to the foetus and through lipid-rich milk when lactating their cubs (Lie et al., 2000; Polischuk et al., 1995, 2002). The toxic properties of OHCs have raised serious concerns for health, reproduction, and survival in polar bears, especially in areas with high contamination loads such as the Svalbard and East Greenland regions Environment International 37 (2011) 694–708 ⁎ Corresponding authors at: Department of Biology, University of Science and Technology (NTNU), N-7491 Trondheim, Norway. Tel.: + 47 73596090; fax: + 47 73596100. E-mail addresses: [email protected] (G.D. Villanger), [email protected] (B.M. Jenssen). 0160-4120/$ – see front matter © 2011 Elsevier Ltd. All rights reserved. doi:10.1016/j.envint.2011.01.012 Contents lists available at ScienceDirect Environment International journal homepage: www.elsevier.com/locate/envint
Transcript of Exposure to mixtures of organohalogen contaminants and associative interactions with thyroid...
Environment International 37 (2011) 694–708
Contents lists available at ScienceDirect
Environment International
j ourna l homepage: www.e lsev ie r.com/ locate /env int
Exposure to mixtures of organohalogen contaminants and associative interactionswith thyroid hormones in East Greenland polar bears (Ursus maritimus)
Gro D. Villanger a,⁎, Bjørn M. Jenssen a,⁎, Rita R. Fjeldberg a, Robert J. Letcher b, Derek C.G. Muir c,Maja Kirkegaard d, Christian Sonne d, Rune Dietz d
a Department of Biology, Norwegian University of Science and Technology, Trondheim, Norwayb Wildlife and Landscape Science Directorate, Science and Technology Branch, Environment Canada, National Wildlife Research Centre, Carleton University, Ottawa, Canadac Aquatic Ecosystem Protection Research Division, Environment Canada, Burlington, Canadad Department of Arctic Environment, National Environmental Research Institute, Aarhus University, Roskilde, Denmark
⁎ Corresponding authors at: Department of BiologTechnology (NTNU), N-7491 Trondheim, Norway. Te73596100.
E-mail addresses: [email protected] (G.D. [email protected] (B.M. Jenssen).
0160-4120/$ – see front matter © 2011 Elsevier Ltd. Aldoi:10.1016/j.envint.2011.01.012
a b s t r a c t
a r t i c l e i n f oArticle history:Received 7 September 2010Accepted 20 January 2011Available online 23 February 2011
Keywords:ArcticCombined effectsEndocrine disruptionMarine mammalsOrganohalogen contaminantsThyroid hormones
We investigated the multivariate relationships between adipose tissue residue levels of 48 individualorganohalogen contaminants (OHCs) and circulating thyroid hormone (TH) levels in polar bears (Ursusmaritimus) from East Greenland (1999–2001, n=62), using projection to latent structure (PLS) regression forfour groupings of polar bears; subadults (SubA), adult females with cubs (AdF_N), adult females without cubs(AdF_S) and adult males (AdM). In the resulting significant PLS models for SubA, AdF_N and AdF_S, someOHCs were especially important in explaining variations in circulating TH levels: polybrominateddiphenylether (PBDE)-99, PBDE-100, PBDE-153, polychlorinated biphenyl (PCB)-52, PCB-118, cis-nonachlor,trans-nonachlor, trichlorobenzene (TCB) and pentachlorobenzene (QCB), and both negative and positiverelationships with THs were found. In addition, the models revealed that DDTs had a positive influence ontotal 3,5,3′-triiodothyronine (TT3) in AdF_S, and that a group of 17 higher chlorinated ortho-PCBs had apositive influence on total 3,5,3′,5′-tetraiodothyronine (thyroxine, TT4) in AdF_N. TH levels in AdM seemedless influenced by OHCs because of non-significant PLS models. TH levels were also influenced by biologicalfactors such as age, sex, body size, lipid content of adipose tissue and sampling date. When controlling forbiological variables, the major relationships from the PLS models for SubA, AdF_N and AdF_S were foundsignificant in partial correlations. The most important OHCs that influenced TH levels in the significant PLSmodels may potentially act through similar mechanisms on the hypothalamic–pituitary–thyroid (HPT) axis,suggesting that both combined effects by dose and response addition and perhaps synergistic potentiationmay be a possibility in these polar bears. Statistical associations are not evidence per se of biological cause–effect relationships. Still, the results of the present study indicate that OHCs may affect circulating TH levels inEast Greenland polar bears, adding to the “weight of evidence” suggesting that OHCs might interfere withthyroid homeostasis in polar bears.
y, University of Science andl.: +47 73596090; fax: +47
),
l rights reserved.
© 2011 Elsevier Ltd. All rights reserved.
1. Introduction
Chronic low-level exposure to endocrine disrupting chemicals(EDCs) may cause detrimental effects on development, behaviour,fertility and survival in wildlife species (Colborn et al., 1993; Crisp etal., 1998; Lintelmann et al., 2003). EDCs and global climate changesare among the currently important anthropogenic stressors to arcticwildlife and ecosystems. EDCs may affect an individual's ability toadapt to ongoing climate-related changes in the Arctic (Jenssen,2006). Many anthropogenic organohalogen contaminants (OHCs),
including polychlorinated biphenyls (PCBs), polybrominated diphe-nylethers (PBDEs), and organochlorine pesticides (OCPs) such asDDTs, have been shown to have endocrine disruptive activity(Colborn et al., 1993; Crisp et al., 1998; Goodhead and Tyler, 2009).Common characteristics define these compounds as persistentorganic pollutants as they are subjected to long-range transport tothe Arctic where marine food web biomagnification results in highlevels in lipid-rich tissues of top predators, such as the polar bear(Ursus maritimus) (Letcher et al., 2009, 2010; Sørmo et al., 2006;Thomann, 1989).
Female polar bears, as with other mammals, transfer OHCsthrough the placenta to the foetus and through lipid-rich milk whenlactating their cubs (Lie et al., 2000; Polischuk et al., 1995, 2002). Thetoxic properties of OHCs have raised serious concerns for health,reproduction, and survival in polar bears, especially in areas with highcontamination loads such as the Svalbard and East Greenland regions
695G.D. Villanger et al. / Environment International 37 (2011) 694–708
(Letcher et al., 2010; Sonne, 2010). In these areas, OHCs have beenassociated with a range of detrimental effects in polar bears asreviewed in Letcher et al. (2010) and Sonne (2010); reduced immuneresponse (Lie et al., 2004, 2005), disruption of endocrine and vitaminsystems (Braathen et al., 2004; Haave et al., 2003; Oskam et al., 2003,2004; Sandau, 2000; Skaare et al., 2001), reduced survival of cubs andadult females (Derocher et al., 2003), histopathological lesions inkidneys (Sonne et al., 2006a) and liver (Sonne et al., 2005), reducedsize of sexual organs (Sonne et al., 2006b, 2007), and reduced bonemineral density (Sonne et al., 2004).
One important endocrine target of OHCs is the hypothalamic–pituitary–thyroid (HPT) axis (Brouwer et al., 1998; Howdeshell, 2002;Jugan et al., 2010), which serves to produce and regulate circulatinglevels of the thyroid hormones (THs) 3,5,3′,5′-tetraiodothyronine(thyroxine, T4) and 3,5,3′-triiodothyronine (T3). THs are produced bythe thyroid gland in vertebrates, and are transported in blood, mainlybound to serum proteins like transthyretin (TTR), albumin andthyroxin binding globulin (TBG) in mammals (Hadley, 1996; McNabb,1992; Zoeller et al., 2007a). TTR and albumin are present in polarbears, but their importance as TH transporters is not known (Gutleb etal., 2010; Sandau, 2000; Sandau et al., 2000). THs are essential forsomatic growth and development in vertebrates, especially of thenervous system in the foetuses, in neonates and in juveniles. THs arealso involved in the regulation of metabolism, thermoregulation, andreproduction, and in maintaining the general physiological homeo-stasis (Hadley, 1996; McNabb, 1992; Zoeller et al., 2007a). The thyroiddisruptive effects of OHCs have been documented in experimental invitro and in vivo studies, in human epidemiologic studies and inwildlife studies (Boas et al., 2006; Brouwer et al., 1998; Darnerud,2008; Rolland, 2000; Zoeller et al., 2007b). In polar bears, severalstudies have reported inverse associations between OHCs andcirculatory concentrations of THs (Braathen et al., 2004; Sandau,2000; Skaare et al., 2001). The mechanisms of the TH disruptiveeffects of OHCs and their metabolites can be multiple, and often basedon the structural resemblance of such compounds to T3 and T4. OHCscan act directly on the thyroid gland, interfere with the negative feed-back mechanisms that regulate TH production and secretion, bind toTH-transport proteins in blood (e.g. TTR) thus displacing THs andinfluencing TH homeostasis in the blood, bind to and activate thyroidhormone receptors (TRs) in target tissues thus altering TH-mediatedgene expression, interfere with enzyme systems [iodinases, deiodi-nases, cytochrome P450-dependent enzymes (CYP enzymes), uridindiphosphate glucoronyltransferases (UDPGTs), and sulfontransfer-anses (SULTs)] thus affecting production, conversion of T4 to T3,biotransformation and excretion of THs (Boas et al., 2006; Brouweret al., 1998; Howdeshell, 2002; Langer et al., 2007; Zoeller, 2005).
THs are important for neurodevelopment in young animals and forproper development and function of gonads, and they influencecirculating levels of sex hormones (Cooke et al., 2004; Zoeller et al.,2007a). In humans, thyroid disorders appear more frequently inwomen than in men, and female hypothyroidism can disturbmenstruation, ovulation, and increase the rate of miscarriages(Chiovato et al., 1993; Cooke et al., 2004; Zoeller et al., 2007a). In astudy of polar bears from Svalbard, females seemed to be moresusceptible to thyroid disruptive effects of PCBs than males (Braathenet al., 2004). Maternal hypothyroidism can reduce transfer of THsfrom the mother to her foetus and cause permanent neurocognitivedeficits in infants (Pop et al., 1999, 2003). In humans, even subclinical,maternal hypothyroidism has been associated with reduced neuro-psychological performance in children (Haddow et al., 1999). It hasbeen proposed that neurodevelopmental effects (e.g. cognitivedysfunctions, lowered IQ, slowed mental development, behaviourchanges, reduced motor skills) in children born by mothers with highlevels of OHCs are mediated trough the ability of these contaminantsto disrupt TH homeostasis in sensitive periods of TH-dependent braindevelopment in utero and postnatal juvenile stages (Branchi et al.,
2003; Howdeshell, 2002; Nakajima et al., 2006; Porterfield, 2000;Zoeller and Crofton, 2005; Zoeller et al., 2007a). Some OHCs mightalso directly disturb TH signalling or alter neurotransmitter levels inthe developing brain (Darras, 2008; Gauger et al., 2004; Porterfield,2000).
Wildlife and humans are exposed to and accumulate complexmixtures of environmental contaminants. Thus, the effects of OHCs onthe TH system is most likely dependent on the relative contribution ofsingle TH disruptive compounds in such complex mixtures and theirpotency to affect the HPT axis, in addition to the exposed organism'ssusceptibility (tolerance) to single or combinations of these con-taminants (Alexander, 2008; Konemann and Pieters, 1996; Koppe etal., 2006). Since many OHCs and their metabolites may act throughone or several target-points in the HPT axis, often with overlappingmechanisms, it raises the likelihood of combined effects. In the totalmixture of anthropogenic compounds that humans and wildlife areexposed to, additive effects of individual chemicals with similarmechanisms or responses are likely (dose or response addition). Thecumulative low-dose effects of OHCs on thyroid or other endocrinesystems could in fact be more toxic than one high exposure of a singlecompound (Koppe et al., 2006). Interactive effects (antagonism,synergism or potentiation) caused by certain combinations ofchemicals are also likely (Alexander, 2008; Koppe et al., 2006).Studies on endocrine effects on wildlife has to date mostly assessedthe associations between hormone levels and the sum of tissueresidue levels of major OHC groups (e.g. ΣPCB, ΣDDT). Hence, thevarying toxic potential of individual compounds or combinations isseldom considered.
The associations between TH and OHC levels reported in polarbears from Svalbard (Braathen et al., 2004; Skaare et al., 2001) suggestthat relationships between THs and OHCs could exist in polar bearsfrom East Greenland as well, since concentrations reported in EastGreenland and Svalbard polar bears are equally high (Letcher et al.,2010; Sonne, 2010). The purpose of the present study was toinvestigate if TH levels in polar bears from East Greenland are affectedby complex mixtures of OHCs that they accumulate. This wasinvestigated by assessing relationships of individual OHCs measuredin adipose tissue with circulating TH levels by using multivariatestatistics. Also, confounding factors such as body size, age, sex, andsampling date was included as covariates in the analysis. Therelationships elucidated bymultivariate analysis was further exploredby using univariate statistics.
2. Methods
2.1. Sampling procedures
Tissue sampling and biological measurements of individual polarbears were conducted post mortem by trained, local subsistencehunters in the Scoresby Sound area in central East Greenland (69°00′N to 74°00′N) in January to October 1999–2001. Detailed descriptionsof tissue sampling and biological measurements are given elsewhere(Dietz et al., 2004; Sandala et al., 2004). Briefly, the hunters recordedsex, body length and girth, date, geographical position, and if thefemales were solitary or had cubs. Blood samples were collected(lithium heparin — whole blood) and used for analyses of THs.Freezing caused the blood to completely haemolyse. For the analysesof OHCs, subcutaneous adipose tissue was collected from the chestregion. Blood and adipose samples were frozen at−5 to−20 °C fromthe time of sampling, and then kept at−20 °C until analysis. The thirdincisor tooth (I3) was used for age determination as describedelsewhere (Dietz et al., 1991, 2004). Age was given in years androunded to the nearest half year. The age data were first reported inDietz et al. (2004). Body mass (BM) of the polar bears was calculatedfrom the measured girth and length based on the equation given byDerocher and Wiig (2002).
696 G.D. Villanger et al. / Environment International 37 (2011) 694–708
2.2. Analyses of organohalogen contaminants
The analyses of PCBs and OCPs in subcutaneous adipose tissuewere performed in the former Letcher Labs at the Great Lakes Institutefor Environmental Research (GLIER) and the University of Windsor(Ontario, Canada) (Dietz et al., 2004; Sandala et al., 2004). PBDEswereanalysed at Environment Canada (Burlington, Canada) (Dietz et al.,2007). Procedures involved extraction of adipose tissue, lipiddetermination, clean-up and subsequent quantification by gaschromatography with micro electron capture detection (GC-μECD)for PCBs and OCPs, and by electron capture negative ion (lowresolution) mass spectrometry (ECNI-MS) for PBDEs. Lipid content ofthe adipose samples was determined gravimetrically using a fractionof the extract and expressed as % of total sample weight. The OHCconcentrations were first reported in Dietz et al. (2004, 2007). Theindividual or co-eluted compounds included in the present studywere: PCB-31/28, -42, -44, -49, -52, -60, -64/71, -66/95, -70, -74, -87,-97, -99, -101/84, -105, -110, -118, -128, -129/178, -138, -141, -146,-149, -151, -153, -158, -170/190, -171/202/156, -172, -174, -177,-179, -180, -182/187, -183, -194, -195, -200, -201, -203/196, and -206;PBDE-47, -99, -100, -153, and -155/126; α-, β-, and γ-hexachlor-ocyclohexane (HCH), hexachlorobenzene (HCB), trichlorobenzene(TCB), pentachlorobenzene (QCB), 1,1,1-trichloro-2,2-bis(4-chloro-phenyl)ethane) (p,p′-DDT), 1,1-dichloro-2,2-bis(4-chlorophenyl)eth-ylene), (p,p′-DDE),1,1,dichloro-2,2-bis(4-chlorophenyl) ethane) (p,p′-DDD), oxychlordane, cis-chlordane, trans-chlordane, cis-nonachlor,trans-nonachlor, heptachlor epoxide, dieldrin and octachlorostyrene(OCS). All the OHC concentrations are given in nanograms per gramlipid weight (ng/g l.w.).
2.3. Analyses of thyroid hormones
Polar bear whole blood samples were analysed for total T3 (TT3)and total T4 (TT4) at the Department of Biology, NorwegianUniversity of Science and Technology (NTNU, Trondheim, Norway)using radioimmunoassay (RIA). The preferred matrixes for the
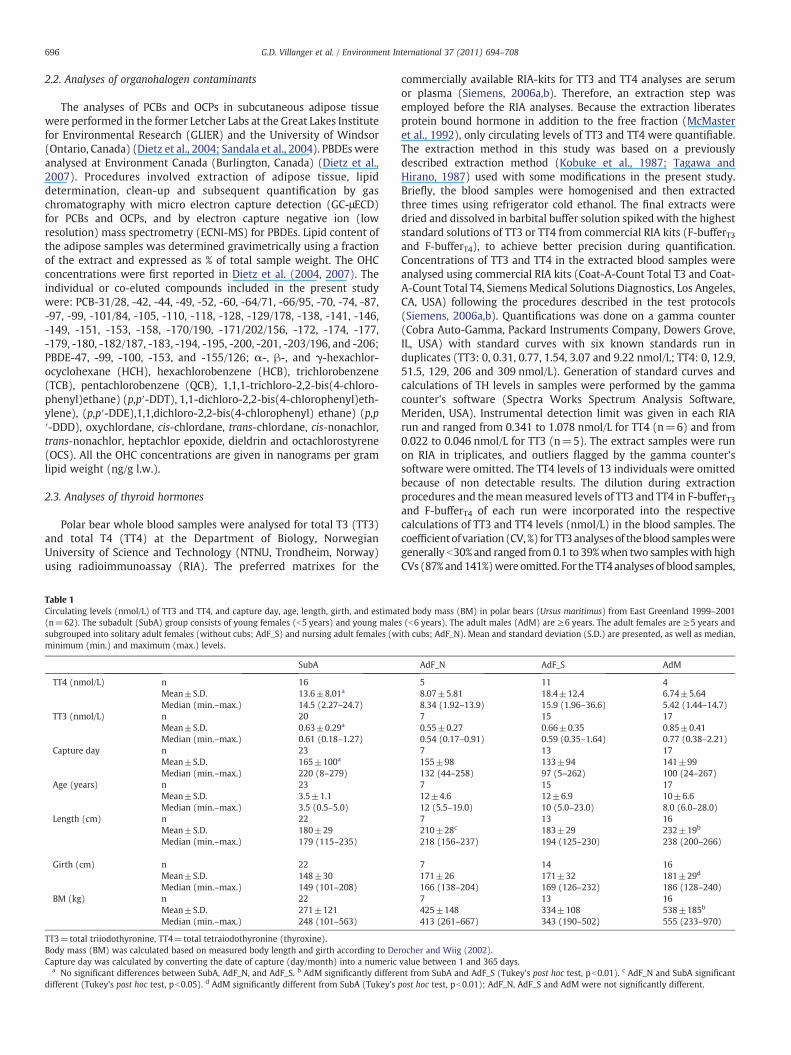
Table 1Circulating levels (nmol/L) of TT3 and TT4, and capture day, age, length, girth, and estimat(n=62). The subadult (SubA) group consists of young females (b5 years) and young malesubgrouped into solitary adult females (without cubs; AdF_S) and nursing adult females (wminimum (min.) and maximum (max.) levels.
SubA
TT4 (nmol/L) n 16Mean±S.D. 13.6±8.01a
Median (min.–max.) 14.5 (2.27–24.7)TT3 (nmol/L) n 20
Mean±S.D. 0.63±0.29a
Median (min.–max.) 0.61 (0.18–1.27)Capture day n 23
Mean±S.D. 165±100a
Median (min.–max.) 220 (8–279)Age (years) n 23
Mean±S.D. 3.5±1.1Median (min.–max.) 3.5 (0.5–5.0)
Length (cm) n 22Mean±S.D. 180±29Median (min.–max.) 179 (115–235)
Girth (cm) n 22Mean±S.D. 148±30Median (min.–max.) 149 (101–208)
BM (kg) n 22Mean±S.D. 271±121Median (min.–max.) 248 (101–563)
TT3=total triiodothyronine, TT4=total tetraiodothyronine (thyroxine).Body mass (BM) was calculated based on measured body length and girth according to DeCapture day was calculated by converting the date of capture (day/month) into a numeric
a No significant differences between SubA, AdF_N, and AdF_S. b AdM significantly differedifferent (Tukey's post hoc test, pb0.05). d AdM significantly different from SubA (Tukey's p
commercially available RIA-kits for TT3 and TT4 analyses are serumor plasma (Siemens, 2006a,b). Therefore, an extraction step wasemployed before the RIA analyses. Because the extraction liberatesprotein bound hormone in addition to the free fraction (McMasteret al., 1992), only circulating levels of TT3 and TT4 were quantifiable.The extraction method in this study was based on a previouslydescribed extraction method (Kobuke et al., 1987; Tagawa andHirano, 1987) used with some modifications in the present study.Briefly, the blood samples were homogenised and then extractedthree times using refrigerator cold ethanol. The final extracts weredried and dissolved in barbital buffer solution spiked with the higheststandard solutions of TT3 or TT4 from commercial RIA kits (F-bufferT3and F-bufferT4), to achieve better precision during quantification.Concentrations of TT3 and TT4 in the extracted blood samples wereanalysed using commercial RIA kits (Coat-A-Count Total T3 and Coat-A-Count Total T4, Siemens Medical Solutions Diagnostics, Los Angeles,CA, USA) following the procedures described in the test protocols(Siemens, 2006a,b). Quantifications was done on a gamma counter(Cobra Auto-Gamma, Packard Instruments Company, Dowers Grove,IL, USA) with standard curves with six known standards run induplicates (TT3: 0, 0.31, 0.77, 1.54, 3.07 and 9.22 nmol/L; TT4: 0, 12.9,51.5, 129, 206 and 309 nmol/L). Generation of standard curves andcalculations of TH levels in samples were performed by the gammacounter's software (Spectra Works Spectrum Analysis Software,Meriden, USA). Instrumental detection limit was given in each RIArun and ranged from 0.341 to 1.078 nmol/L for TT4 (n=6) and from0.022 to 0.046 nmol/L for TT3 (n=5). The extract samples were runon RIA in triplicates, and outliers flagged by the gamma counter'ssoftware were omitted. The TT4 levels of 13 individuals were omittedbecause of non detectable results. The dilution during extractionprocedures and themeanmeasured levels of TT3 and TT4 in F-bufferT3and F-bufferT4 of each run were incorporated into the respectivecalculations of TT3 and TT4 levels (nmol/L) in the blood samples. Thecoefficientof variation (CV, %) for TT3analyses of theblood samplesweregenerally b30% and ranged from0.1 to 39%when two sampleswith highCVs (87%and141%)were omitted. For the TT4 analysesof blood samples,
ed body mass (BM) in polar bears (Ursus maritimus) from East Greenland 1999–2001s (b6 years). The adult males (AdM) are ≥6 years. The adult females are ≥5 years andith cubs; AdF_N). Mean and standard deviation (S.D.) are presented, as well as median,
AdF_N AdF_S AdM
5 11 48.07±5.81 18.4±12.4 6.74±5.648.34 (1.92–13.9) 15.9 (1.96–36.6) 5.42 (1.44–14.7)7 15 170.55±0.27 0.66±0.35 0.85±0.410.54 (0.17–0.91) 0.59 (0.35–1.64) 0.77 (0.38–2.21)7 13 17155±98 133±94 141±99132 (44–258) 97 (5–262) 100 (24–267)7 15 1712±4.6 12±6.9 10±6.612 (5.5–19.0) 10 (5.0–23.0) 8.0 (6.0–28.0)7 13 16210±28c 183±29 232±19b
218 (156–237) 194 (125–230) 238 (200–266)
7 14 16171±26 171±32 181±29d
166 (138–204) 169 (126–232) 186 (128–240)7 13 16425±148 334±108 538±185b
413 (261–667) 343 (190–502) 555 (233–970)
rocher and Wiig (2002).value between 1 and 365 days.nt from SubA and AdF_S (Tukey's post hoc test, pb0.01). c AdF_N and SubA significantost hoc test, pb0.01); AdF_N, AdF_S and AdM were not significantly different.
Table 2Mean and standard deviation (S.D.) of groups sum (Σ) levels (ng/g l.w.) of majororganohalogen contaminants (OHCs)a and lipid content (%) measured in subcutaneousadipose tissue of polar bears (Ursus maritimus) from East Greenland 1999–2001(n=62). The subadult (SubA) group consists of young females (b5 years) and youngmales (b6 years). The adult males (AdM) are ≥6 years. The adult females are ≥5 yearsand subgrouped into solitary adult females (without cubs; AdF_S) and nursing adultfemales (with cubs; AdF_N).
Group
SubA(n=23)
AdF_N(n=7)
AdF_S(n=15)
AdM(n=17)
ΣPCBs Mean 6566 6168 5742 7847S.D. 2981 2632 4479 3406
ΣDDTs Mean 456 327 349 443S.D. 219 110 241 289
ΣPBDEs Mean 67.9 63.0 77.5 69.1S.D. 25.0 18.4 51.6 47.0
ΣCHLs Mean 2268 1582 2082 1327S.D. 1032 496 1825 620
ΣHCHs Mean 192 139 188 233S.D. 69.8 31.5 187 168
ΣCBzs Mean 156 91.7 102 82.9S.D. 86.9 83.2 89.2 41.9
Lipid content(%)
Mean 92.4 92.9 84.3 82.3S.D. 5.94 8.05 23.1 10.1
ΣPCBs includes individual or co-eluted PCB congener number PCB-31/28, -42, -44, -49,-52, -60, -64/71, -66/95, -70, -74, -87, -97, -99, -101/84, -105, -110, -118, -128, -129/178, -138, -141, -146, -149, -151, -153, -158, -170/190, -171/202/156, -172, -174, -177,-179, -180, -182/187, -183, -194, -195, -200, -201, -203/196 and -206.ΣCHLs include oxychlordane, cis-chlordan, trans-chlordane, cis-nonachlor and trans-nonachlor, and heptachlor epoxide.ΣDDTs include p,p′-DDT, p,p′-DDE and p,p′-DDD.ΣHCHs include α-HCH, β-HCH and γ-HCH.ΣCBzs include HCB, QCB and TCB.ΣPBDEs include individual or co-eluted PBDE congener number PBDE-47, -99, -100,-153 and -155/126.
a The OHCs levels and lipid% were first reported in Dietz et al. (2004, 2007).
697G.D. Villanger et al. / Environment International 37 (2011) 694–708
the CVs were generally b35% with a few exceptions of CVs between 35and 93%. These were still accepted because of the low levels of extractedTT4 in these samples (b5 nmol/mL) which makes quantification duringRIA more prone to variations. TT4 results from four polar bear sampleswith high CVs (60–105%) and TT4 levels (11–21 nmol/L) were omittedfrom the study.
To control the inter-assay variation during RIA-analyses weanalysed standard reference material (SRM level 1, 2 and 3;Lyphochek® Immunoassay Plus Control, Bio-Rad Laboratories, LA,USA). For TT4, the inter-CV of SRM was 3.4–5.9% (n=6). For TT3, theinter-CV of SRM was 3.6–4.9% (n=5). This indicated good quality ofthe RIA procedures for both TT3 and TT4 analyses. Intra-assayvariation was investigated by analysing SRM at the beginning andend, and sometimes in the middle of each RIA-run, and by use ofrepeated analyses of F-bufferT3 and F-bufferT4. For TT4, the SRM intra-CV was 3.3–13% (n=5).
Table 3Results of PLS regression models between the response variable Y=TT3 with 55 (56 for Sutissue (ng/g l.w.) and biological data; age, sex (only in SubA), lipid content, BM, girth, lengthmodel was a result of step-wise optimising of the first model (see Section 2.4).
Group First PLS model Final PLS model Final PLS model — validation
PLS components R2X
SubA Significant Significant 3 0.603n=20 (X=56) (X=48)AdF_N Not significant Significant 3 0.714n=7 (X=55) (X=49)AdF_S Not significant Significant 2 0.635n=15 (X=55) (X=42)AdM Not significant Not significant – –
n=17 (X=55)
For F-bufferT4 the intra-CV was 5.1–8.3% (n=6). For TT3, SRMintra-CV ranged from 2.5 to 4.6% (n=3/2) and for the F-bufferT3 intra-CV ranged from 2.9 to 5.9% (n=5).
To control the inter-extraction rounds, we used one polar bearwhole blood sample and SRM as controls, which were subjected toextraction and subsequent RIA analyses. The inter-CV for TT4extraction was 15% (n=4) for the control blood sample and 6.6%(n=5) for SRM, which were all found acceptable. The inter-CV for theTT3 extraction rounds was 12% (n=3) for the control blood sample,which was also acceptable. All over, the precision of the TT3 and TT4extraction and RIA-analyses was acceptable.
Recovery of TT4 was calculated from extracted and unextractedSRM analysed with RIA, and ranged from 87 to 101% (n=4). Norecovery data was available for TT3 extractions. SRM does not fullyrepresent the whole blood matrix, but indicate acceptable quality ofthe extraction procedures in this study.
2.4. Data analyses
Four polar bears had TH levels that were defined as possibleoutliers or extreme values. For three of these individuals, TH levelswere within the physiological range of polar bears (Braathen et al.,2004; Leatherland and Ronald, 1981; Sandau, 2000; Skaare et al.,2001). Thus, only the results from one of these four bears wereremoved from further statistical analyses (AdM, 16 yr:TT3=3.06 nmol/L; TT4=46.4 nmol/L). Also, one individual lackingOHC data was removed from the dataset. The remaining individualpolar bears (n=62) in this study were grouped according to age, sex(Rosing-Asvid et al., 2002) and reproductive status: Subadults (SubA,consisting of subadult females b5 yr and subadult males b6 yr,n=23); Adult males (AdM, consisting of males ≥6 yr, n=17), andnursing adult females (AdF_N, consisting of females ≥5 yr with cubs,n=7) and solitary adult females (AdF_S, consisting of females ≥5 yrwithout cubs, n=15). Because of different number of animalsincluded in the TT3 and TT4 analytical results, as well as missingbiological measurements (date of capture, girth, length) in someindividuals, sample sizes vary accordingly. We did not have sufficientinformation to pair mothers with their cub(s). It was not possible toanatomically determine whether the AdF_S were in gestation, whichmay have influenced TH levels (McNabb, 1992).
The univariate statistical analyses were conducted using SPSS(Version 16, standard version, SPSS Inc., Chicago, IL, USA). The date ofcapture was computed into a numeric value between 1 and 365 days(capture day). The different years of sampling (1999–2001) wereassumed not to influence the OHC data (see Dietz et al., 2004) or THlevels. Thus, OHC and TH data from different years were pooled.Normality of the data was tested using Kolmogorov–Smirnov test fornN50 (all polar bears) and Shapiro–Wilcoxon test for nb50 (age/sexgroups). Levene's test of homogeneity was applied to test the varianceamong the age/sex groups. To achieve normal distributions and
bA) predictor variables (X-variables); PCBs, PBDEs and OCPs in subcutaneous adiposeand capture day in polar bears (Ursus maritimus) from East Greenland 1999–2001. Final
R2Y Q2 Permutation intercept x-axis(R2Y) and y-axis (Q2)
Regression coefficientswith TT3
0.746 0.414 R2Y: 0.701 Fig. 1AQ2: −0.240
0.991 0.840 R2Y: 0.927 Fig. 1BQ2: −0.279
0.704 0.266 R2Y: 0.575 Fig. 1CQ2: −0.103
– – –

Table 4Results of PLS regression models between the response variable Y=TT4 with 55 (56 for SubA) predictor variables (X-variables); PCBs, PBDEs and OCPs in subcutaneous adiposetissue (ng/g l.w.) and biological data; age, sex (only in SubA), lipid content, BM, girth, length and capture day in polar bears (Ursus maritimus) from East Greenland 1999–2001. Finalmodel was a result of step-wise optimising of the first model (see Section 2.4).
Sex/Age group First PLS model Final PLS model Final PLS model — validation
PLS components R2X R2Y Q2 Permutation Intercept x-axis(R2Y) and y-axis (Q2)
Regression coefficientswith TT4
SubA Significant Significant 2 0.680 0.724 0.573 R2Y: 0.521 Fig. 2An=16 (X=56) (X=34) Q2: −0.161AdF_N Significant Significant 1 0.547 0.949 0.828 R2Y: 0.761 Fig. 2Bn=5 (X=55) (X=46) Q2: −0.113AdF_S Not significant Significant 2 0.756 0.673 0.428 R2Y: 0.513, Fig. 2Cn=11 (X=55) (X=21) Q2: −0.078AdM Not significant Not significant – – – – –
n=4 (X=55)
698 G.D. Villanger et al. / Environment International 37 (2011) 694–708
homogeneity of variances among subgroups, TT3 and TT4, age andOHC data were log10-transformed. One-way analyses of variance(ANOVA) with Tukey's post hoc test was used to investigate groupdifferences in TH levels and biological data (BM, girth, length, captureday, lipid content). Pearson correlation (r) and partial correlation (rp)was used to test bivariate relationships. Significance levels were set top≤0.05, and p-values are two-tailed unless otherwise mentioned.
Multivariate analyses of individual OHC concentrations in adiposetissue, circulating levels of TT3 and TT4, as well as biological data wereperformed using the software SIMCA-P+ (Version 12.0, Umetrics AB,Umeå, Sweden). PLS, which stands for projections to latent structures bymeans of partial least squares (Eriksson et al., 2006), was applied tomodel the effects of OHCs and biological variables (predictor, X,variables) on TH levels (response, Y, variables). PLS is a multivariateregression analysis which in an unidirectional manner models therelationships between the X-variables and their simultaneous influenceon the Y-variable(s) (SIMCA, 2008; Wold et al., 2001). PLS regressiondoes not require normality distributions, is less sensitive to outliers andextreme values, and can dealwith datasets consisting of a lower numberof observations (individuals) than variables, as well as multicolinearityamong the variables (Eriksson et al., 2006; SIMCA, 2008; Wold et al.,1984). Thus, we used the data in their original form (not log10-transformed). Amoredetaileddescriptionof thesemultivariatemethodscan be found elsewhere (Eriksson et al., 2006; Wold et al., 2001).
TT3 and TT4 were not inter-correlated (Pearson correlation, r=−0.056, p=0.757, n=33). In fact when using both TT3 and TT4 as Y-variables in a preliminary PLS model (n=62), they showed tendencyto inversely relate to each other. Thus, using both TT3 and TT4 as Y-variables in the same PLS model could mask relationships betweenOHCs and THs. Furthermore, the response to thyroid disruptivecompounds may be influenced by age, sex, and physiological/reproductive status of individuals (Abdelouahab et al., 2008;Gochfeld, 2007; Zoeller et al., 2007a). Hence, we developed eightdifferent PLS models to investigate the effects of the individual OHCsincluded in this study (listed in Section 2.2) and biological variables(age, BM, girth, length, capture day, lipid content, TT3 or TT4 levels1)on TT3 or TT4 levels as separate Y-variables inmodels for each age/sexgroups. Only individuals with TT3 or TT4 levels and OHCs data wereincluded in the respective models. Variables that were missing inN50% of the observations were excluded; PCB-49, 44, 42, 70, 87, 110,151, 149, 105, 141, 179, 158, 174, PBDE-155/126 and γ-HCH. Sex wasincluded as an X-variable only in the SubA PLS models. All variableswere centred and scaled (to variance 1), and significance level was setto 0.05 (SIMCA, 2008). The first (original) PLS model was step-wiseoptimised by removing X-variables with variable importance in theprojection (VIP) values b0.5, as these have low or no importance inexplaining the X-matrix or correlating with the Y-matrix (SIMCA,
1 TT3 and TT4 levels were X-variables in PLS-models with Y=TT4 and Y=TT3,respectively.
2008). The X-variables with the lowest VIP values were thenconsecutively removed from the models. Each time an X-variablewas removed and a new PLS model was created, the explainedvariation in the X-matrix (R2X) and the explained variance (influ-ence) of the X-matrix on the Y-variable (goodness of fit, R2Y) wasevaluated. Because of the risk of over-fitting the X-variables towardthe Y-variable, we also evaluated the goodness of prediction (Q2)obtained by cross-validation, permutation analyses (20 permuta-tions) and observed-versus-predicted analyses for each step. Theprocedure stopped when optimal R2X, R2Y, Q2 with acceptablepermutation validation and observed-versus-predicted analyseswere reached. In cases where the original PLS model were notsignificant, we imposed a model with two PLS components andremoved variables with VIP values that were b0.5. If the new modelstill was not significant, the same stepwise procedure as describedabove was used until a significant and optimal model was reached. If asignificant model was not achieved, it was defined as not significant.
3. Results
3.1. Thyroid hormones, biological data and contaminant levels
The circulating concentrations (nmol/L) of TT3 and TT4, and the biological data ofthe polar bears from East Greenland are shown in Table 1. There were no significantdifferences in TT3 or TT4 concentrations among the groups. There were no agedifferences among AdM, AdF_N and AdF_S. Girth, length and BM differed significantlyamong the four groups (ANOVA: F=4.30, P=0.009, df=58; F=14.11, p=0.0001,df=57; F=11.52, p=0.0001, df=57; respectively). AdM had significantly larger girthas compared to SubA (Tukey's post hoc test; p=0.007), but there were no differences ingirth among AdM, AdF_N and AdF_S. AdMwere significantly longer and had higher BMas compared to AdF_S (Tukey's post hoc test; p=0.0001 and p=0.002, respectively)and SubA (Tukey's post hoc test; p=0.0001 and p=0.0001, respectively). Furthermore,AdF_N were somewhat longer than SubA (Tukey's post hoc test; p=0.047). Nosignificant differences were found for capture day among the groups.
The summed (Σ) concentrations of major groups of OHCs included in this study andlipid content of adipose tissue are presented in Table 2. Investigating levels andpatterns of OHCs is beyond the scope of this study. Dietz et al. (2004, 2007) reportedOHC levels in SubA, AdM and AdF (nursing and solitary together) polar bears from EastGreenland (1999–2001), which included the individuals in the present study. Dietzet al. (2004) found that AdM have the highest levels of ΣPCB, ΣChlorobenzenes(ΣCBzs), ΣDDTs and dieldrin as compared to AdF and SubA, whereas AdF had higherΣHCHs as compared to AdM, and ΣChlordanes (ΣCHLs) were highest in AdF, followedby SubA and lowest in AdM. No differences in ΣPBDE levels were found among thepolar bears groups (Dietz et al., 2007).
3.2. Modelled effects of contaminants and biological variables on thyroid hormone levels
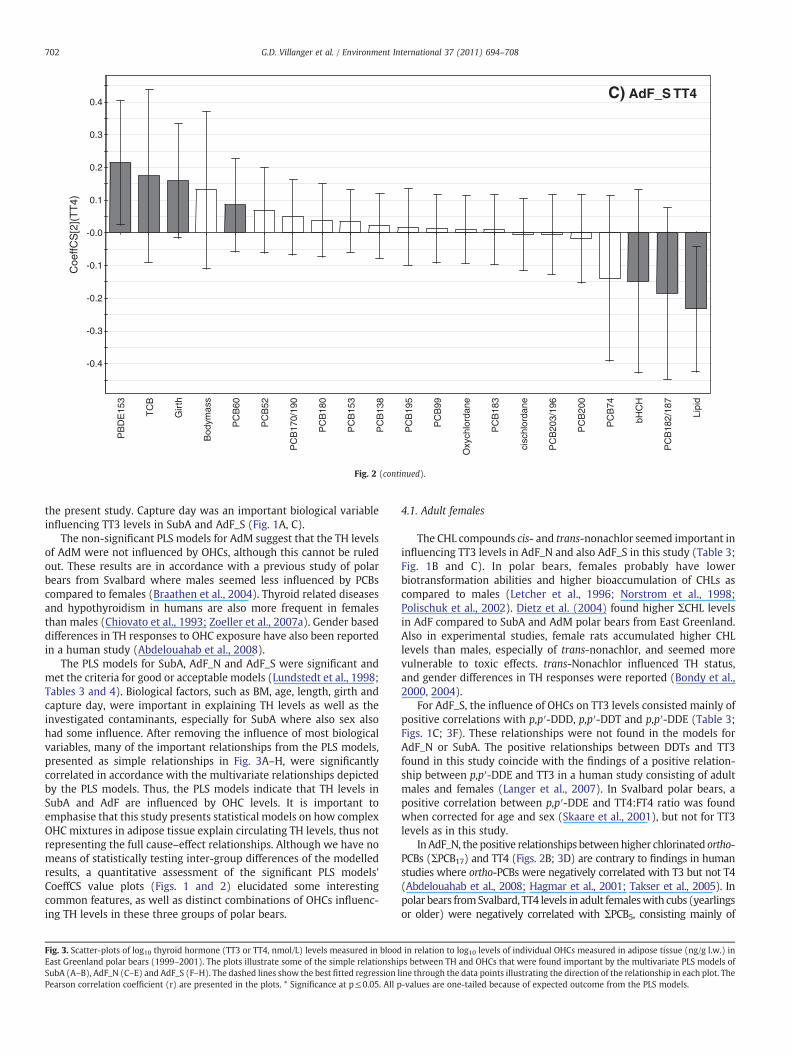
The result of the best-fitted multivariate PLS models are presented in Table 3(Y=TT3) and Table 4 (Y=TT4) with their respective number of PLS components, R2X,R2Y, Q2, and permutation results (x and y intercepts). The PLS modelling gavesignificant models for TT3 and TT4 for SubA, AdF_N and AdF_S, whereas the AdMmodels were non-significant. The significant models had R2X-values and Q2-valuesclose to or above criteria for good or acceptable models with biological field data;R2XN0.7 and Q2N0.4 (Lundstedt et al., 1998). For the significant models we presentcolumn plots with regression coefficient (CoeffCS) values showing the correlationstrength and direction of the regressions between the X-variables and TT3 (Fig. 1A, Band C) or TT4 (Fig. 2A, B and C).
-0.5
-0.4
-0.3
-0.2
-0.1
-0.0
0.1
0.2
0.3
0.4
PC
B64
/71
Sex
(Mal
e)P
CB
31/2
8Le
ngth
PB
DE
99T
CB
aHC
HB
odym
ass
cisn
onac
hlor
PC
B10
1/84
PC
B15
3tr
ansn
onac
hlor
PC
B12
8P
CB
195
PC
B60
PC
B97
Die
ldrin
PC
B13
8pp
DD
EP
CB
99H
epta
clor
epox
ide
bHC
HP
CB
183
PB
DE
47pp
DD
TO
xych
lord
ane
HC
BP
CB
177
PC
B18
0P
CB
146
Age
PC
B12
9/17
8P
CB
182/
187
Gir
thP
CB
200
cisc
hlor
dane
PC
B17
0/19
0P
CB
201
PC
B17
1/20
2/15
6P
CB
206
ppD
DD
PC
B17
2P
CB
74P
CB
194
PB
DE
153
PC
B11
8S
ex(F
emal
e)P
CB
52P
BD
E10
0C
aptu
re d
ay
Coe
ffCS
[3](
TT
3)A) SubA TT3
-0.25
-0.20
-0.15
-0.10
-0.05
-0.00
0.05
0.10
0.15
0.20
0.25
0.30
PB
DE
99T
CB
PC
B66
/95
PB
DE
100
QC
BP
CB
118
cisn
onac
hlor
tran
snon
achl
orP
CB
31/2
8tr
ansc
hlor
dane
PC
B18
2/18
7P
BD
E15
3P
CB
-201
Age
PC
B14
6P
CB
172
PC
B19
4P
CB
203/
196
PC
B20
6P
CB
171/
202/
156
PC
B64
/71
OC
SP
CB
195
PC
B18
3P
CB
129/
178
PC
B17
7pp
DD
DP
CB
138
PC
B20
0P
CB
180
Hep
tacl
orep
oxid
eP
CB
170/
190
PC
B15
3P
CB
99T
T4
cisc
hlor
dane
ppD
DT
HC
BP
CB
97P
CB
60P
CB
128
ppD
DE
Oxy
chlo
rdan
eP
CB
101/
84Le
ngth
Gir
thP
CB
52B
odym
ass
aHC
H
Coe
ffCS
[3](
TT
3)
B) AdF_N TT3
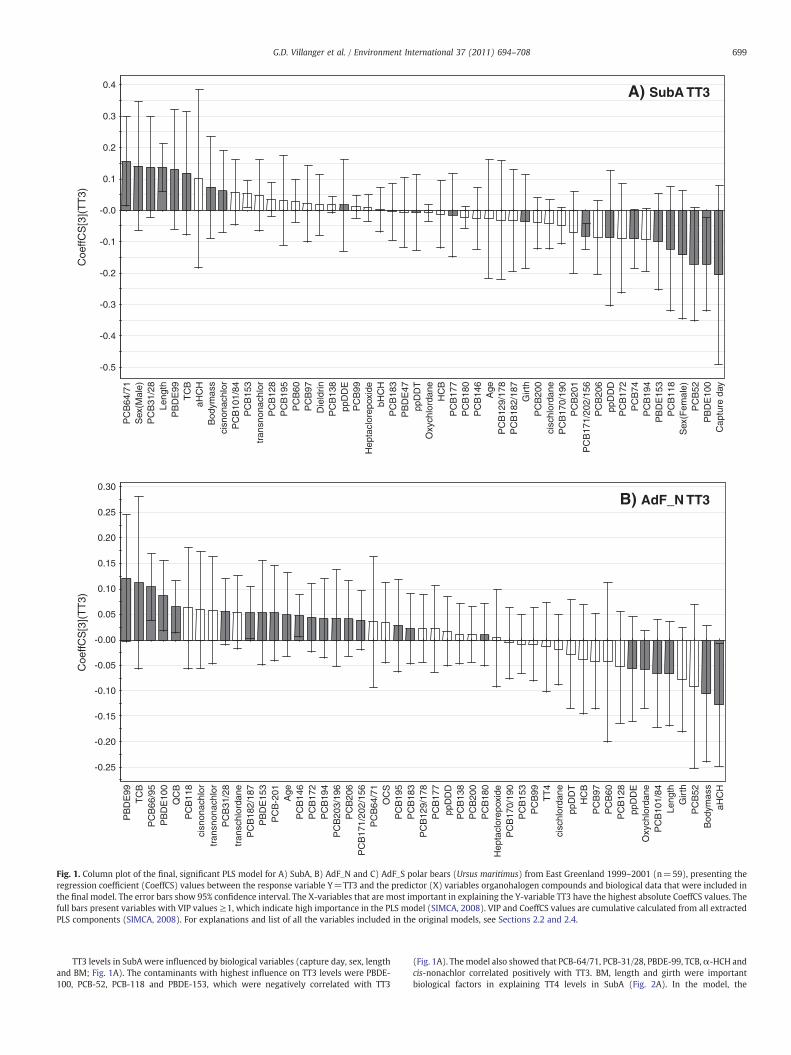
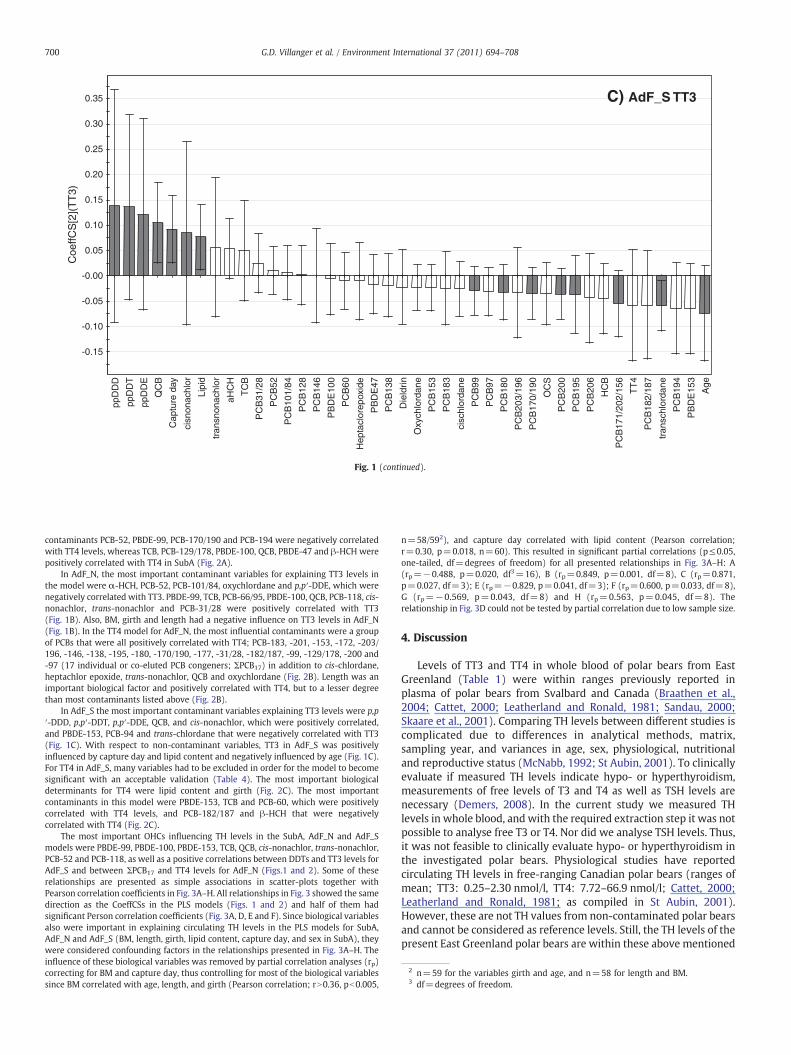
Fig. 1. Column plot of the final, significant PLS model for A) SubA, B) AdF_N and C) AdF_S polar bears (Ursus maritimus) from East Greenland 1999–2001 (n=59), presenting theregression coefficient (CoeffCS) values between the response variable Y=TT3 and the predictor (X) variables organohalogen compounds and biological data that were included inthe final model. The error bars show 95% confidence interval. The X-variables that are most important in explaining the Y-variable TT3 have the highest absolute CoeffCS values. Thefull bars present variables with VIP values ≥1, which indicate high importance in the PLS model (SIMCA, 2008). VIP and CoeffCS values are cumulative calculated from all extractedPLS components (SIMCA, 2008). For explanations and list of all the variables included in the original models, see Sections 2.2 and 2.4.
699G.D. Villanger et al. / Environment International 37 (2011) 694–708
TT3 levels in SubA were influenced by biological variables (capture day, sex, lengthand BM; Fig. 1A). The contaminants with highest influence on TT3 levels were PBDE-100, PCB-52, PCB-118 and PBDE-153, which were negatively correlated with TT3
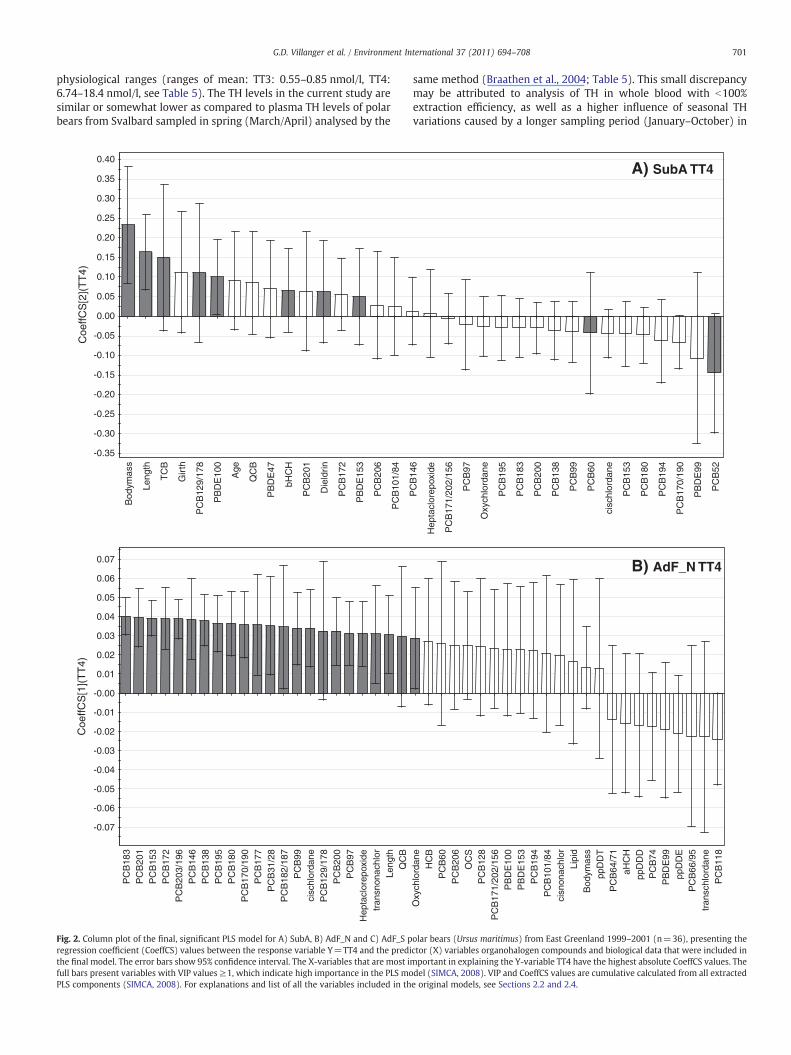
(Fig. 1A). Themodel also showed that PCB-64/71, PCB-31/28, PBDE-99, TCB,α-HCH andcis-nonachlor correlated positively with TT3. BM, length and girth were importantbiological factors in explaining TT4 levels in SubA (Fig. 2A). In the model, the
-0.15
-0.10
-0.05
-0.00
0.05
0.10
0.15
0.20
0.25
0.30
0.35
ppD
DD
ppD
DT
ppD
DE
QC
B
Cap
ture
day
cisn
onac
hlor
Lipi
d
tran
snon
achl
or
aHC
H
TC
B
PC
B31
/28
PC
B52
PC
B10
1/84
PC
B12
8
PC
B14
6
PB
DE
100
PC
B60
Hep
tacl
orep
oxid
e
PB
DE
47
PC
B13
8
Die
ldrin
Oxy
chlo
rdan
e
PC
B15
3
PC
B18
3
cisc
hlor
dane
PC
B99
PC
B97
PC
B18
0
PC
B20
3/19
6
PC
B17
0/19
0
OC
S
PC
B20
0
PC
B19
5
PC
B20
6
HC
B
PC
B17
1/20
2/15
6
TT
4
PC
B18
2/18
7
tran
schl
orda
ne
PC
B19
4
PB
DE
153
Age
Coe
ffCS
[2](
TT
3)
C) AdF_S TT3
Fig. 1 (continued).
2 n=59 for the variables girth and age, and n=58 for length and BM.3 df=degrees of freedom.
700 G.D. Villanger et al. / Environment International 37 (2011) 694–708
contaminants PCB-52, PBDE-99, PCB-170/190 and PCB-194 were negatively correlatedwith TT4 levels, whereas TCB, PCB-129/178, PBDE-100, QCB, PBDE-47 and β-HCH werepositively correlated with TT4 in SubA (Fig. 2A).
In AdF_N, the most important contaminant variables for explaining TT3 levels inthe model were α-HCH, PCB-52, PCB-101/84, oxychlordane and p,p′-DDE, which werenegatively correlated with TT3. PBDE-99, TCB, PCB-66/95, PBDE-100, QCB, PCB-118, cis-nonachlor, trans-nonachlor and PCB-31/28 were positively correlated with TT3(Fig. 1B). Also, BM, girth and length had a negative influence on TT3 levels in AdF_N(Fig. 1B). In the TT4 model for AdF_N, the most influential contaminants were a groupof PCBs that were all positively correlated with TT4; PCB-183, -201, -153, -172, -203/196, -146, -138, -195, -180, -170/190, -177, -31/28, -182/187, -99, -129/178, -200 and-97 (17 individual or co-eluted PCB congeners; ΣPCB17) in addition to cis-chlordane,heptachlor epoxide, trans-nonachlor, QCB and oxychlordane (Fig. 2B). Length was animportant biological factor and positively correlated with TT4, but to a lesser degreethan most contaminants listed above (Fig. 2B).
In AdF_S the most important contaminant variables explaining TT3 levels were p,p′-DDD, p,p′-DDT, p,p′-DDE, QCB, and cis-nonachlor, which were positively correlated,and PBDE-153, PCB-94 and trans-chlordane that were negatively correlated with TT3(Fig. 1C). With respect to non-contaminant variables, TT3 in AdF_S was positivelyinfluenced by capture day and lipid content and negatively influenced by age (Fig. 1C).For TT4 in AdF_S, many variables had to be excluded in order for the model to becomesignificant with an acceptable validation (Table 4). The most important biologicaldeterminants for TT4 were lipid content and girth (Fig. 2C). The most importantcontaminants in this model were PBDE-153, TCB and PCB-60, which were positivelycorrelated with TT4 levels, and PCB-182/187 and β-HCH that were negativelycorrelated with TT4 (Fig. 2C).
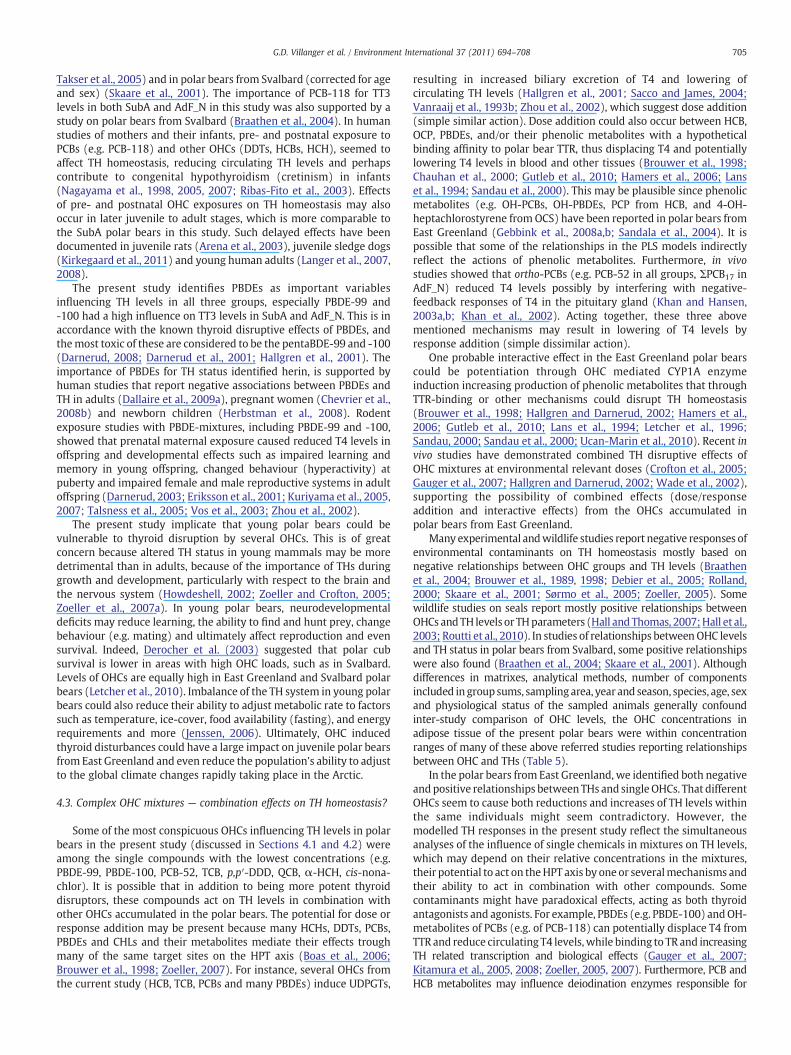
The most important OHCs influencing TH levels in the SubA, AdF_N and AdF_Smodels were PBDE-99, PBDE-100, PBDE-153, TCB, QCB, cis-nonachlor, trans-nonachlor,PCB-52 and PCB-118, as well as a positive correlations between DDTs and TT3 levels forAdF_S and between ΣPCB17 and TT4 levels for AdF_N (Figs.1 and 2). Some of theserelationships are presented as simple associations in scatter-plots together withPearson correlation coefficients in Fig. 3A–H. All relationships in Fig. 3 showed the samedirection as the CoeffCSs in the PLS models (Figs. 1 and 2) and half of them hadsignificant Person correlation coefficients (Fig. 3A, D, E and F). Since biological variablesalso were important in explaining circulating TH levels in the PLS models for SubA,AdF_N and AdF_S (BM, length, girth, lipid content, capture day, and sex in SubA), theywere considered confounding factors in the relationships presented in Fig. 3A–H. Theinfluence of these biological variables was removed by partial correlation analyses (rp)correcting for BM and capture day, thus controlling for most of the biological variablessince BM correlated with age, length, and girth (Pearson correlation; rN0.36, pb0.005,
n=58/592), and capture day correlated with lipid content (Pearson correlation;r=0.30, p=0.018, n=60). This resulted in significant partial correlations (p≤0.05,one-tailed, df=degrees of freedom) for all presented relationships in Fig. 3A–H: A(rp=−0.488, p=0.020, df3=16), B (rp=0.849, p=0.001, df=8), C (rp=0.871,p=0.027, df=3); E (rp=−0.829, p=0.041, df=3); F (rp=0.600, p=0.033, df=8),G (rp=−0.569, p=0.043, df=8) and H (rp=0.563, p=0.045, df=8). Therelationship in Fig. 3D could not be tested by partial correlation due to low sample size.
4. Discussion
Levels of TT3 and TT4 in whole blood of polar bears from EastGreenland (Table 1) were within ranges previously reported inplasma of polar bears from Svalbard and Canada (Braathen et al.,2004; Cattet, 2000; Leatherland and Ronald, 1981; Sandau, 2000;Skaare et al., 2001). Comparing TH levels between different studies iscomplicated due to differences in analytical methods, matrix,sampling year, and variances in age, sex, physiological, nutritionaland reproductive status (McNabb, 1992; St Aubin, 2001). To clinicallyevaluate if measured TH levels indicate hypo- or hyperthyroidism,measurements of free levels of T3 and T4 as well as TSH levels arenecessary (Demers, 2008). In the current study we measured THlevels in whole blood, and with the required extraction step it was notpossible to analyse free T3 or T4. Nor did we analyse TSH levels. Thus,it was not feasible to clinically evaluate hypo- or hyperthyroidism inthe investigated polar bears. Physiological studies have reportedcirculating TH levels in free-ranging Canadian polar bears (ranges ofmean; TT3: 0.25–2.30 nmol/l, TT4: 7.72–66.9 nmol/l; Cattet, 2000;Leatherland and Ronald, 1981; as compiled in St Aubin, 2001).However, these are not TH values from non-contaminated polar bearsand cannot be considered as reference levels. Still, the TH levels of thepresent East Greenland polar bears are within these above mentioned
701G.D. Villanger et al. / Environment International 37 (2011) 694–708
physiological ranges (ranges of mean: TT3: 0.55–0.85 nmol/l, TT4:6.74–18.4 nmol/l, see Table 5). The TH levels in the current study aresimilar or somewhat lower as compared to plasma TH levels of polarbears from Svalbard sampled in spring (March/April) analysed by the
-0.35
-0.30
-0.25
-0.20
-0.15
-0.10
-0.05
0.00
0.05
0.10
0.15
0.20
0.25
0.30
0.35
0.40
Bod
ymas
s
Leng
th
TC
B
Gir
th
PC
B12
9/17
8
PB
DE
100
Age
QC
B
PB
DE
47
bHC
H
PC
B20
1
Die
ldrin
PC
B17
2
PB
DE
153
PC
B20
6
PC
B10
1/84
Coe
ffCS
[2](
TT
4)
-0.07
-0.06
-0.05
-0.04
-0.03
-0.02
-0.01
-0.00
0.01
0.02
0.03
0.04
0.05
0.06
0.07
PC
B18
3P
CB
201
PC
B15
3P
CB
172
PC
B20
3/19
6P
CB
146
PC
B13
8P
CB
195
PC
B18
0P
CB
170/
190
PC
B17
7P
CB
31/2
8P
CB
182/
187
PC
B99
cisc
hlor
dane
PC
B12
9/17
8P
CB
200
PC
B97
Hep
tacl
orep
oxid
etr
ansn
onac
hlor
Leng
thQ
CB
Coe
ffCS
[1](
TT
4)
Fig. 2. Column plot of the final, significant PLS model for A) SubA, B) AdF_N and C) AdF_S pregression coefficient (CoeffCS) values between the response variable Y=TT4 and the predithe final model. The error bars show 95% confidence interval. The X-variables that are most ifull bars present variables with VIP values ≥1, which indicate high importance in the PLS moPLS components (SIMCA, 2008). For explanations and list of all the variables included in th
same method (Braathen et al., 2004; Table 5). This small discrepancymay be attributed to analysis of TH in whole blood with b100%extraction efficiency, as well as a higher influence of seasonal THvariations caused by a longer sampling period (January–October) in
PC
B14
6
Hep
tacl
orep
oxid
e
PC
B17
1/20
2/15
6
PC
B97
Oxy
chlo
rdan
e
PC
B19
5
PC
B18
3
PC
B20
0
PC
B13
8
PC
B99
PC
B60
cisc
hlor
dane
PC
B15
3
PC
B18
0
PC
B19
4
PC
B17
0/19
0
PB
DE
99
PC
B52
A) SubA TT4
Oxy
chlo
rdan
eH
CB
PC
B60
PC
B20
6O
CS
PC
B12
8P
CB
171/
202/
156
PB
DE
100
PB
DE
153
PC
B19
4P
CB
101/
84ci
snon
achl
orLi
pid
Bod
ymas
spp
DD
TP
CB
64/7
1aH
CH
ppD
DD
PC
B74
PB
DE
99pp
DD
EP
CB
66/9
5tr
ansc
hlor
dane
PC
B11
8
B) AdF_N TT4
olar bears (Ursus maritimus) from East Greenland 1999–2001 (n=36), presenting thector (X) variables organohalogen compounds and biological data that were included inmportant in explaining the Y-variable TT4 have the highest absolute CoeffCS values. Thedel (SIMCA, 2008). VIP and CoeffCS values are cumulative calculated from all extractede original models, see Sections 2.2 and 2.4.
-0.4
-0.3
-0.2
-0.1
-0.0
0.1
0.2
0.3
0.4
PB
DE
153
TC
B
Gir
th
Bod
ymas
s
PC
B60
PC
B52
PC
B17
0/19
0
PC
B18
0
PC
B15
3
PC
B13
8
PC
B19
5
PC
B99
Oxy
chlo
rdan
e
PC
B18
3
cisc
hlor
dane
PC
B20
3/19
6
PC
B20
0
PC
B74
bHC
H
PC
B18
2/18
7
Lipi
d
Coe
ffCS
[2](
TT
4)
C) AdF_S TT4
Fig. 2 (continued).
702 G.D. Villanger et al. / Environment International 37 (2011) 694–708
the present study. Capture day was an important biological variableinfluencing TT3 levels in SubA and AdF_S (Fig. 1A, C).
The non-significant PLS models for AdM suggest that the TH levelsof AdM were not influenced by OHCs, although this cannot be ruledout. These results are in accordance with a previous study of polarbears from Svalbard where males seemed less influenced by PCBscompared to females (Braathen et al., 2004). Thyroid related diseasesand hypothyroidism in humans are also more frequent in femalesthan males (Chiovato et al., 1993; Zoeller et al., 2007a). Gender baseddifferences in TH responses to OHC exposure have also been reportedin a human study (Abdelouahab et al., 2008).
The PLS models for SubA, AdF_N and AdF_S were significant andmet the criteria for good or acceptable models (Lundstedt et al., 1998;Tables 3 and 4). Biological factors, such as BM, age, length, girth andcapture day, were important in explaining TH levels as well as theinvestigated contaminants, especially for SubA where also sex alsohad some influence. After removing the influence of most biologicalvariables, many of the important relationships from the PLS models,presented as simple relationships in Fig. 3A–H, were significantlycorrelated in accordance with the multivariate relationships depictedby the PLS models. Thus, the PLS models indicate that TH levels inSubA and AdF are influenced by OHC levels. It is important toemphasise that this study presents statistical models on how complexOHC mixtures in adipose tissue explain circulating TH levels, thus notrepresenting the full cause–effect relationships. Although we have nomeans of statistically testing inter-group differences of the modelledresults, a quantitative assessment of the significant PLS models'CoeffCS value plots (Figs. 1 and 2) elucidated some interestingcommon features, as well as distinct combinations of OHCs influenc-ing TH levels in these three groups of polar bears.
Fig. 3. Scatter-plots of log10 thyroid hormone (TT3 or TT4, nmol/L) levels measured in bloodEast Greenland polar bears (1999–2001). The plots illustrate some of the simple relationshiSubA (A–B), AdF_N (C–E) and AdF_S (F–H). The dashed lines show the best fitted regression lPearson correlation coefficient (r) are presented in the plots. * Significance at p≤0.05. All p
4.1. Adult females
The CHL compounds cis- and trans-nonachlor seemed important ininfluencing TT3 levels in AdF_N and also AdF_S in this study (Table 3;Fig. 1B and C). In polar bears, females probably have lowerbiotransformation abilities and higher bioaccumulation of CHLs ascompared to males (Letcher et al., 1996; Norstrom et al., 1998;Polischuk et al., 2002). Dietz et al. (2004) found higher ΣCHL levelsin AdF compared to SubA and AdM polar bears from East Greenland.Also in experimental studies, female rats accumulated higher CHLlevels than males, especially of trans-nonachlor, and seemed morevulnerable to toxic effects. trans-Nonachlor influenced TH status,and gender differences in TH responses were reported (Bondy et al.,2000, 2004).
For AdF_S, the influence of OHCs on TT3 levels consisted mainly ofpositive correlations with p,p′-DDD, p,p′-DDT and p,p′-DDE (Table 3;Figs. 1C; 3F). These relationships were not found in the models forAdF_N or SubA. The positive relationships between DDTs and TT3found in this study coincide with the findings of a positive relation-ship between p,p′-DDE and TT3 in a human study consisting of adultmales and females (Langer et al., 2007). In Svalbard polar bears, apositive correlation between p,p′-DDE and TT4:FT4 ratio was foundwhen corrected for age and sex (Skaare et al., 2001), but not for TT3levels as in this study.
InAdF_N, the positive relationships betweenhigher chlorinated ortho-PCBs (ΣPCB17) and TT4 (Figs. 2B; 3D) are contrary to findings in humanstudies where ortho-PCBs were negatively correlated with T3 but not T4(Abdelouahab et al., 2008; Hagmar et al., 2001; Takser et al., 2005). Inpolar bears fromSvalbard, TT4 levels in adult femaleswith cubs (yearlingsor older) were negatively correlated with ΣPCB5, consisting mainly of
in relation to log10 levels of individual OHCs measured in adipose tissue (ng/g l.w.) inps between TH and OHCs that were found important by the multivariate PLS models ofine through the data points illustrating the direction of the relationship in each plot. The-values are one-tailed because of expected outcome from the PLS models.

log TT3 (nmol/L)
log
PB
DE
-100
(ng
/g l.
w.)
-0.2
-0.1
0.0
0.1
0.2
0.3
0.4
0.5B) SubA
log TT4 (nmol/L)
log TT3 (nmol/L) log TT4 (nmol/L)
log
TC
B (
ng/g
l.w
.)
1.3
1.4
1.5
1.6
1.7
1.8
1.9A) SubA
C) AdF_N
log
PB
DE
-100
(ng
/g l.
w.)
0.0
0.1
0.1
0.2
0.2
0.3
0.3
0.4
E) AdF_N F) AdF_S
log TT3 (nmol/L)
log
α-H
CH
(ng
/g l.
w.)
1.0
1.2
1.4
1.6
1.8
2.0
D) AdF_N
log
ΣPC
B17
(ng
/g l.
w.)
3.3
3.4
3.5
3.6
3.7
3.8
3.9
4.0
r = -0.493*p = 0.014n = 20
r = 0.455p = 0.069n = 12
log TT3 (nmol/L)
log TT3 (nmol/L) log TT3 (nmol/L)
log
pp-D
DT
(ng
/g l.
w.)
0.6
0.8
1.0
1.2
1.4
1.6
1.8
2.0
2.2
log
PB
DE
-153
(ng
/g l.
w.)
0.4
0.6
0.8
1.0
1.2
1.4
1.6G) AdF_S
log
QC
B (
ng/g
l.w
.)
0.0
0.2
0.4
0.6
0.8
1.0
1.2
1.4
1.6
1.8H) AdF_S
r = 0.937*p = 0.009n = 5
r = 0.624p = 0.067n = 7
r = -0.698*p = 0.044n = 7
r = 0.428p = 0.056n = 16
r=0.475*p=0.037n=15
r = -0.381p = 0.081n = 15
-0.8 -0.6 -0.4 -0.2 0.0 0.2 0.2 0.4 0.6 0.8 1.0 1.2 1.4 1.6
-0.8 -0.7 -0.6 -0.5 -0.4 -0.3 -0.2 -0.1 0.0
-0.8 -0.7 -0.6 -0.5 -0.4 -0.3 -0.2 -0.1 0.0
0.2 0.4 0.6 0.8 1.0 1.2
-0.5 -0.4 -0.3 -0.2 -0.1 0.0 0.1 0.2 0.3
-0.5 -0.4 -0.3 -0.2 -0.1 0.0 0.1 0.2 0.3 -0.5 -0.4 -0.3 -0.2 -0.1 0.0 0.1 0.2 0.3
703G.D. Villanger et al. / Environment International 37 (2011) 694–708
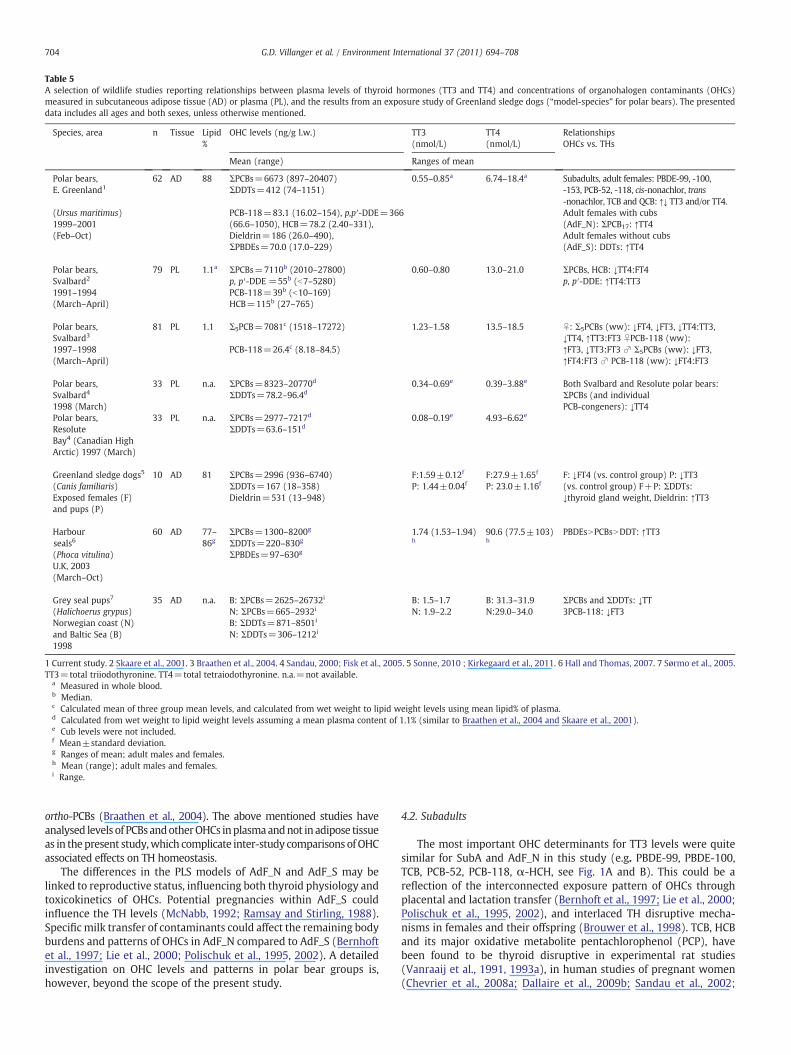
Table 5A selection of wildlife studies reporting relationships between plasma levels of thyroid hormones (TT3 and TT4) and concentrations of organohalogen contaminants (OHCs)measured in subcutaneous adipose tissue (AD) or plasma (PL), and the results from an exposure study of Greenland sledge dogs (“model-species” for polar bears). The presenteddata includes all ages and both sexes, unless otherwise mentioned.
Species, area n Tissue Lipid%
OHC levels (ng/g l.w.) TT3(nmol/L)
TT4(nmol/L)
RelationshipsOHCs vs. THs
Mean (range) Ranges of mean
Polar bears,E. Greenland1
62 AD 88 ΣPCBs=6673 (897–20407)ΣDDTs=412 (74–1151)
0.55–0.85a 6.74–18.4a Subadults, adult females: PBDE-99, -100,-153, PCB-52, -118, cis-nonachlor, trans-nonachlor, TCB and QCB: ↑↓ TT3 and/or TT4.
(Ursus maritimus)1999–2001(Feb–Oct)
PCB-118=83.1 (16.02–154), p,p′-DDE=366(66.6–1050), HCB=78.2 (2.40–331),Dieldrin=186 (26.0–490),ΣPBDEs=70.0 (17.0–229)
Adult females with cubs(AdF_N): ΣPCB17: ↑TT4Adult females without cubs(AdF_S): DDTs: ↑TT4
Polar bears,Svalbard2
1991–1994(March–April)
79 PL 1.1a ΣPCBs=7110b (2010–27800)p, p′-DDE =55b (b7–5280)PCB-118=39b (b10–169)HCB=115b (27–765)
0.60–0.80 13.0–21.0 ΣPCBs, HCB: ↓TT4:FT4p, p′-DDE: ↑TT4:TT3
Polar bears,Svalbard3
1997–1998(March–April)
81 PL 1.1 Σ5PCB=7081c (1518–17272)
PCB-118=26.4c (8.18–84.5)
1.23–1.58 13.5–18.5 ♀: Σ5PCBs (ww): ↓FT4, ↓FT3, ↓TT4:TT3,↓TT4, ↑TT3:FT3 ♀PCB-118 (ww):↑FT3, ↓TT3:FT3 ♂ Σ5PCBs (ww): ↓FT3,↑FT4:FT3 ♂ PCB-118 (ww): ↓FT4:FT3
Polar bears,Svalbard4
1998 (March)
33 PL n.a. ΣPCBs=8323–20770d 0.34–0.69e 0.39–3.88e Both Svalbard and Resolute polar bears:ΣPCBs (and individualPCB-congeners): ↓TT4
ΣDDTs=78.2–96.4d
Polar bears,ResoluteBay4 (Canadian HighArctic) 1997 (March)
33 PL n.a. ΣPCBs=2977–7217d 0.08–0.19e 4.93–6.62e
ΣDDTs=63.6–151d
Greenland sledge dogs5
(Canis familiaris)Exposed females (F)and pups (P)
10 AD 81 ΣPCBs=2996 (936–6740)ΣDDTs=167 (18–358)Dieldrin=531 (13–948)
F:1.59±0.12f
P: 1.44±0.04fF:27.9±1.65f
P: 23.0±1.16fF: ↓FT4 (vs. control group) P: ↓TT3(vs. control group) F+P: ΣDDTs:↓thyroid gland weight, Dieldrin: ↑TT3
Harbourseals6
(Phoca vitulina)
60 AD 77–86g
ΣPCBs=1300–8200g
ΣDDTs=220–830g
ΣPBDEs=97–630g
1.74 (1.53–1.94)h
90.6 (77.5±103)h
PBDEsNPCBsNDDT: ↑TT3
U.K, 2003(March–Oct)
Grey seal pups7
(Halichoerus grypus)35 AD n.a. B: ΣPCBs=2625–26732i
N: ΣPCBs=665–2932iB: 1.5–1.7N: 1.9–2.2
B: 31.3–31.9N:29.0–34.0
ΣPCBs and ΣDDTs: ↓TT3PCB-118: ↓FT3
Norwegian coast (N)and Baltic Sea (B)1998
B: ΣDDTs=871–8501i
N: ΣDDTs=306–1212i
1 Current study. 2 Skaare et al., 2001. 3 Braathen et al., 2004. 4 Sandau, 2000; Fisk et al., 2005. 5 Sonne, 2010 ; Kirkegaard et al., 2011. 6 Hall and Thomas, 2007. 7 Sørmo et al., 2005.TT3=total triiodothyronine. TT4=total tetraiodothyronine. n.a.=not available.
a Measured in whole blood.b Median.c Calculated mean of three group mean levels, and calculated from wet weight to lipid weight levels using mean lipid% of plasma.d Calculated from wet weight to lipid weight levels assuming a mean plasma content of 1.1% (similar to Braathen et al., 2004 and Skaare et al., 2001).e Cub levels were not included.f Mean±standard deviation.g Ranges of mean; adult males and females.h Mean (range); adult males and females.i Range.
704 G.D. Villanger et al. / Environment International 37 (2011) 694–708
ortho-PCBs (Braathen et al., 2004). The above mentioned studies haveanalysed levels of PCBsandotherOHCs inplasmaandnot inadipose tissueas in thepresent study,which complicate inter-study comparisons ofOHCassociated effects on TH homeostasis.
The differences in the PLS models of AdF_N and AdF_S may belinked to reproductive status, influencing both thyroid physiology andtoxicokinetics of OHCs. Potential pregnancies within AdF_S couldinfluence the TH levels (McNabb, 1992; Ramsay and Stirling, 1988).Specific milk transfer of contaminants could affect the remaining bodyburdens and patterns of OHCs in AdF_N compared to AdF_S (Bernhoftet al., 1997; Lie et al., 2000; Polischuk et al., 1995, 2002). A detailedinvestigation on OHC levels and patterns in polar bear groups is,however, beyond the scope of the present study.
4.2. Subadults
The most important OHC determinants for TT3 levels were quitesimilar for SubA and AdF_N in this study (e.g. PBDE-99, PBDE-100,TCB, PCB-52, PCB-118, α-HCH, see Fig. 1A and B). This could be areflection of the interconnected exposure pattern of OHCs throughplacental and lactation transfer (Bernhoft et al., 1997; Lie et al., 2000;Polischuk et al., 1995, 2002), and interlaced TH disruptive mecha-nisms in females and their offspring (Brouwer et al., 1998). TCB, HCBand its major oxidative metabolite pentachlorophenol (PCP), havebeen found to be thyroid disruptive in experimental rat studies(Vanraaij et al., 1991, 1993a), in human studies of pregnant women(Chevrier et al., 2008a; Dallaire et al., 2009b; Sandau et al., 2002;
705G.D. Villanger et al. / Environment International 37 (2011) 694–708
Takser et al., 2005) and in polar bears from Svalbard (corrected for ageand sex) (Skaare et al., 2001). The importance of PCB-118 for TT3levels in both SubA and AdF_N in this study was also supported by astudy on polar bears from Svalbard (Braathen et al., 2004). In humanstudies of mothers and their infants, pre- and postnatal exposure toPCBs (e.g. PCB-118) and other OHCs (DDTs, HCBs, HCH), seemed toaffect TH homeostasis, reducing circulating TH levels and perhapscontribute to congenital hypothyroidism (cretinism) in infants(Nagayama et al., 1998, 2005, 2007; Ribas-Fito et al., 2003). Effectsof pre- and postnatal OHC exposures on TH homeostasis may alsooccur in later juvenile to adult stages, which is more comparable tothe SubA polar bears in this study. Such delayed effects have beendocumented in juvenile rats (Arena et al., 2003), juvenile sledge dogs(Kirkegaard et al., 2011) and young human adults (Langer et al., 2007,2008).
The present study identifies PBDEs as important variablesinfluencing TH levels in all three groups, especially PBDE-99 and-100 had a high influence on TT3 levels in SubA and AdF_N. This is inaccordance with the known thyroid disruptive effects of PBDEs, andthemost toxic of these are considered to be the pentaBDE-99 and -100(Darnerud, 2008; Darnerud et al., 2001; Hallgren et al., 2001). Theimportance of PBDEs for TH status identified herin, is supported byhuman studies that report negative associations between PBDEs andTH in adults (Dallaire et al., 2009a), pregnant women (Chevrier et al.,2008b) and newborn children (Herbstman et al., 2008). Rodentexposure studies with PBDE-mixtures, including PBDE-99 and -100,showed that prenatal maternal exposure caused reduced T4 levels inoffspring and developmental effects such as impaired learning andmemory in young offspring, changed behaviour (hyperactivity) atpuberty and impaired female and male reproductive systems in adultoffspring (Darnerud, 2003; Eriksson et al., 2001; Kuriyama et al., 2005,2007; Talsness et al., 2005; Vos et al., 2003; Zhou et al., 2002).
The present study implicate that young polar bears could bevulnerable to thyroid disruption by several OHCs. This is of greatconcern because altered TH status in young mammals may be moredetrimental than in adults, because of the importance of THs duringgrowth and development, particularly with respect to the brain andthe nervous system (Howdeshell, 2002; Zoeller and Crofton, 2005;Zoeller et al., 2007a). In young polar bears, neurodevelopmentaldeficits may reduce learning, the ability to find and hunt prey, changebehaviour (e.g. mating) and ultimately affect reproduction and evensurvival. Indeed, Derocher et al. (2003) suggested that polar cubsurvival is lower in areas with high OHC loads, such as in Svalbard.Levels of OHCs are equally high in East Greenland and Svalbard polarbears (Letcher et al., 2010). Imbalance of the TH system in young polarbears could also reduce their ability to adjust metabolic rate to factorssuch as temperature, ice-cover, food availability (fasting), and energyrequirements and more (Jenssen, 2006). Ultimately, OHC inducedthyroid disturbances could have a large impact on juvenile polar bearsfrom East Greenland and even reduce the population's ability to adjustto the global climate changes rapidly taking place in the Arctic.
4.3. Complex OHC mixtures — combination effects on TH homeostasis?
Some of the most conspicuous OHCs influencing TH levels in polarbears in the present study (discussed in Sections 4.1 and 4.2) wereamong the single compounds with the lowest concentrations (e.g.PBDE-99, PBDE-100, PCB-52, TCB, p,p′-DDD, QCB, α-HCH, cis-nona-chlor). It is possible that in addition to being more potent thyroiddisruptors, these compounds act on TH levels in combination withother OHCs accumulated in the polar bears. The potential for dose orresponse addition may be present because many HCHs, DDTs, PCBs,PBDEs and CHLs and their metabolites mediate their effects troughmany of the same target sites on the HPT axis (Boas et al., 2006;Brouwer et al., 1998; Zoeller, 2007). For instance, several OHCs fromthe current study (HCB, TCB, PCBs and many PBDEs) induce UDPGTs,
resulting in increased biliary excretion of T4 and lowering ofcirculating TH levels (Hallgren et al., 2001; Sacco and James, 2004;Vanraaij et al., 1993b; Zhou et al., 2002), which suggest dose addition(simple similar action). Dose addition could also occur between HCB,OCP, PBDEs, and/or their phenolic metabolites with a hypotheticalbinding affinity to polar bear TTR, thus displacing T4 and potentiallylowering T4 levels in blood and other tissues (Brouwer et al., 1998;Chauhan et al., 2000; Gutleb et al., 2010; Hamers et al., 2006; Lanset al., 1994; Sandau et al., 2000). This may be plausible since phenolicmetabolites (e.g. OH-PCBs, OH-PBDEs, PCP from HCB, and 4-OH-heptachlorostyrene from OCS) have been reported in polar bears fromEast Greenland (Gebbink et al., 2008a,b; Sandala et al., 2004). It ispossible that some of the relationships in the PLS models indirectlyreflect the actions of phenolic metabolites. Furthermore, in vivostudies showed that ortho-PCBs (e.g. PCB-52 in all groups, ΣPCB17 inAdF_N) reduced T4 levels possibly by interfering with negative-feedback responses of T4 in the pituitary gland (Khan and Hansen,2003a,b; Khan et al., 2002). Acting together, these three abovementioned mechanisms may result in lowering of T4 levels byresponse addition (simple dissimilar action).
One probable interactive effect in the East Greenland polar bearscould be potentiation through OHC mediated CYP1A enzymeinduction increasing production of phenolic metabolites that throughTTR-binding or other mechanisms could disrupt TH homeostasis(Brouwer et al., 1998; Hallgren and Darnerud, 2002; Hamers et al.,2006; Gutleb et al., 2010; Lans et al., 1994; Letcher et al., 1996;Sandau, 2000; Sandau et al., 2000; Ucan-Marin et al., 2010). Recent invivo studies have demonstrated combined TH disruptive effects ofOHC mixtures at environmental relevant doses (Crofton et al., 2005;Gauger et al., 2007; Hallgren and Darnerud, 2002; Wade et al., 2002),supporting the possibility of combined effects (dose/responseaddition and interactive effects) from the OHCs accumulated inpolar bears from East Greenland.
Many experimental andwildlife studies report negative responses ofenvironmental contaminants on TH homeostasis mostly based onnegative relationships between OHC groups and TH levels (Braathenet al., 2004; Brouwer et al., 1989, 1998; Debier et al., 2005; Rolland,2000; Skaare et al., 2001; Sørmo et al., 2005; Zoeller, 2005). Somewildlife studies on seals report mostly positive relationships betweenOHCs andTH levels or THparameters (Hall and Thomas, 2007;Hall et al.,2003; Routti et al., 2010). In studies of relationships betweenOHC levelsand TH status in polar bears from Svalbard, some positive relationshipswere also found (Braathen et al., 2004; Skaare et al., 2001). Althoughdifferences in matrixes, analytical methods, number of componentsincluded in groupsums, sampling area, year and season, species, age, sexand physiological status of the sampled animals generally confoundinter-study comparison of OHC levels, the OHC concentrations inadipose tissue of the present polar bears were within concentrationranges of many of these above referred studies reporting relationshipsbetween OHC and THs (Table 5).
In the polar bears from East Greenland, we identified both negativeandpositive relationships between THs and singleOHCs. That differentOHCs seem to cause both reductions and increases of TH levels withinthe same individuals might seem contradictory. However, themodelled TH responses in the present study reflect the simultaneousanalyses of the influence of single chemicals in mixtures on TH levels,which may depend on their relative concentrations in the mixtures,their potential to act on theHPT axis by one or severalmechanisms andtheir ability to act in combination with other compounds. Somecontaminants might have paradoxical effects, acting as both thyroidantagonists and agonists. For example, PBDEs (e.g. PBDE-100) andOH-metabolites of PCBs (e.g. of PCB-118) can potentially displace T4 fromTTR and reduce circulating T4 levels,while binding to TR and increasingTH related transcription and biological effects (Gauger et al., 2007;Kitamura et al., 2005, 2008; Zoeller, 2005, 2007). Furthermore, PCB andHCB metabolites may influence deiodination enzymes responsible for
706 G.D. Villanger et al. / Environment International 37 (2011) 694–708
conversion of T4 to T3 (Boas et al., 2006; Kato et al., 2004; Meerts et al.,2002; Wade et al., 2002), further adding to the complexity.
Combined and paradoxical effects of different OHCs and theirmetabolites may produce small, variable and unpredictable effects onTH levels, still with potential for detrimental effects on braindevelopment in a manner that is disproportional to the measuredchanges in TH levels (Bansal et al., 2005; Gauger et al., 2007; Zoeller,2005). In addition, some EDCs may show hormetic effects (Calabreseand Baldwin, 2003; Kefford et al., 2008), further complicating theprediction of endocrine responses of mixtures. Consequently, THeffect assessments should not be solely based on an evaluation of THlevels and correlative association with sums of contaminant groups.The results of the present study support the potential complex anddynamic actions of environmental OHC mixtures on TH homeostasis.More effort should be put into assessing endocrine effects of singleor combinations of chemicals in complex mixtures in wildlife, humanand experimental studies.
5. Conclusion
The results of the multivariate regression (PLS) modelling andvalidation by univariate statistics corrected for the influence ofbiological factors, indicate a linkage between TH levels and complexOHC mixtures accumulated in adipose tissue of East Greenland polarbears. The nature of these relationships appears to be complex, andare both positive and negative. Subadult and adult female polar bearsmay seemmore susceptible to potential TH disruption as compared toadult males. In the models, specific combinations of individual OHCsseem to influence the TH levels. However, some compounds appear tobe important for TH levels in the subadult and adult female groups:PBDE-99, PBDE-100, PBDE-153, TCB, QCB, PCB-118, PCB-52, cis-nonachlor and trans-nonachlor. Individual chemicals in the OHCmixtures detected in polar bear adipose tissue could potentially act incombination on the HPT axis and result in additive or even synergisticresponses. Although statistical relationships are not evidence per se ofbiological cause-effect relationships, we suggest that the results of thepresent study add to the “weight-of-evidence” that OHCs may beinterfering with TH homeostasis in polar bears.
Acknowledgements
The present study is part of the International Polar Year (IPY)project BearHealth, and is financed in part by the Norwegian ResearchCouncil, Norwegian University of Science and Technology (NTNU),The Commission for Scientific Research in Greenland, Prince Albert IIFoundation and the Danish DANCEA Programme. There are noconflicts of interest regarding this study. We wish to thank theGreenland hunters, who took the samples often under difficultconditions during their hunting trips for polar bears. Hanne andBirger Sandell, and Jonas Brønlund are thanked for organising thesampling locally. At the University of Windsor, Greg Sandala andWouter Gebbink (former Letcher Labs) and Rodica Lazar (GLIER) areacknowledged for conducting the PCB, OC and PBDE chemicalanalysis. Sigga Joensen (NERI, Roskilde) and Xiaowa Wang (NWRI,Burlington) coordinated sample shipping and handling.We also thankGrethe Stavik Eggen and Jenny Bytingsvik (NTNU) for assistanceduring thyroid hormone analysis and data evaluation.
References
Abdelouahab N, Mergler D, Takser L, Vanier C, St-Jean M, Baldwin M, et al. Genderdifferences in the effects of organochlorines, mercury, and lead on thyroid hormonelevels in lakeside communities of Quebec (Canada). Environ Res 2008;107:380–92.
Alexander J. Combined toxic effects of multiple chemical exposures: opinion of theScientific Steering Committee of the Norwegian Scientific Committee for FoodSafety. Report. Norwegian Scientific Committee for Food Safety, Oslo. pp. 102. url:http://www.vkm.no/dav/15ec300082.pdf 2008 (last accessed 02 Des 2010).
Arena SM, Greeley EH, Halbrook RS, Hansen LG, Segre M. Biological effects of gestationaland lactational PCB exposure in neonatal and juvenile C57BL/6 mice. Arch EnvironContam Toxicol 2003;44:272–80.
Bansal R, You SH, Herzig CT, Zoeller RT. Maternal thyroid hormone increases HESexpression in the fetal rat brain: an effect mimicked by exposure to a mixture ofpolychlorinated biphenyls (PCBs). Brain Res Dev Brain Res 2005;156:13–22.
Bernhoft A, Wiig O, Skaare JU. Organochlorines in polar bears (Ursus maritimus) atSvalbard. Environ Pollut 1997;95:159–75.
Boas M, Feldt-Rasmussen U, Skakkebaek NE, Main KM. Environmental chemicals andthyroid function. Eur J Endocrinol 2006;154:599–611.
Bondy GS, Newsome WH, Armstrong CL, Suzuki CAM, Doucet J, Fernie S, et al. trans-Nonachlor and cis-nonachlor toxicity in Sprague–Dawley rats: comparison withtechnical chlordane. Toxicol Sci 2000;58:386–98.
Bondy G, Curran I, Doucet J, Armstrong C, Coady L, Hierlihy L, et al. Toxicity of trans-nonachlor to Sprague-Dawley rats in a 90-day feeding study. Food Chem Toxicol2004;42:1015–27.
Braathen M, Derocher AE, Wiig O, Sormo EG, Lie E, Skaare JU, et al. Relationshipsbetween PCBs and thyroid hormones and retinol in female and male polar bears.Environ Health Perspect 2004;112:826–33.
Branchi I, Capone F, Alleva E, Costa LG. Polybrominated diphenyl ethers: neurobehavioraleffects following developmental exposure. Neurotoxicology 2003;24:449–62.
Brouwer A, Reijnders PJH, Koeman JH. Polychlorinated biphenyl (PCB)-contaminatedfish induces vitamin A and thyroid-hormone deficiency in the Common Seal (Phocavitulina). Aquat Toxicol 1989;15:99-105.
Brouwer A, Morse DC, Lans MC, Schuur AG, Murk AJ, Klasson-Wehler E, et al.Interactions of persistent environmental organohalogens with the thyroidhormone system: mechanisms and possible consequences for animal and humanhealth. Toxicol Ind Health 1998;14:59–84.
Calabrese EJ, Baldwin LA. Toxicology rethinks its central belief. Nature 2003;421:691–2.Cattet MRL. Biochemical and physiological aspects of obesity, high fat diet and
prolonged fasting in free-ranging polar bears. Veterinary Pathology. Saskatoon,Canada: Doctor of Philosophy. University of Saskatchewan; 2000. p. 153.
Chauhan KR, Kodavanti PRS, McKinney JD. Assessing the role of ortho-substitution onpolychlorinated biphenyl binding to transthyretin, a thyroxine transport protein.Toxicol Appl Pharmacol 2000;162:10–21.
Chevrier J, Eskenazi B, Holland N, Bradman A, Barr DB. Effects of exposure topolychlorinated biphenyls and organochlorine pesticides on thyroid functionduring pregnancy. Am J Epidemiol 2008a;168:298–310.
Chevrier J, Harley K, Bradman A, Sjödin A, Holland N, Fenster L, et al. AssociationsBetween PBDE Body Burden and Thyroid Hormone Levels in Pregnant WomenParticipating in the CHAMACOS Study. Epidemiology 2008b;19 S241–S241.
Chiovato L, Lapi P, Fiore E, TonaccheraM, Pinchera A. Thyroid autoimmunity and femalegender. J Endocrinol Invest 1993;16:384–91.
Colborn T, vom Saal FS, Soto AM. Developmental effects of endocrine-disruptingchemicals in wildlife and humans. Environ Health Perspect 1993;101:378–84.
Cooke PS, Holsberger DR, Witorsch RJ, Sylvester PW, Meredith JM, Treinen KA, et al.Thyroid hormone, glucocorticoids, and prolactin at the nexus of physiology,reproduction, and toxicology. Toxicol Appl Pharmacol 2004;194:309–35.
Crisp TM, Clegg ED, Cooper RL, Wood WP, Anderson DG, Baetcke KP, et al.Environmental endocrine disruption: an effects assessment and analysis. EnvironHealth Perspect 1998;106:11–56.
Crofton KM, Craft ES, Hedge JM, Gennings C, Simmons JE, Carchman RA, et al. Thyroid-hormone-disrupting chemicals: evidence for dose-dependent additivity or syner-gism. Environ Health Perspect 2005;113:1549–54.
Dallaire R, Dewailly E, Pereg D, Dery S, Ayotte P. Thyroid function and plasmaconcentrations of polyhalogenated compounds in Inuit adults. Environ HealthPerspect 2009a;117:1380–6.
Dallaire R, Muckle G, Dewailly E, Jacobson SW, Jacobson JL, Sandanger TM, et al. Thyroidhormone levels of pregnant Inuit women and their infants exposed to environ-mental contaminants. Environ Health Perspect 2009b;117:1014–20.
Darnerud PO. Toxic effects of brominated flame retardants in man and in wildlife.Environ Int 2003;29:841–53.
Darnerud PO. Brominated flame retardants as possible endocrine disrupters. Int JAndrol 2008;31:152–60.
Darnerud PO, Eriksen GS, Johannesson T, Larsen PB, Viluksela M. Polybrominateddiphenyl ethers: occurrence, dietary exposure, and toxicology. Environ HealthPerspect 2001;109:49–68.
Darras VM. Endocrine disrupting polyhalogenated organic pollutants interfere withthyroid hormone signalling in the developing brain. Cerebellum 2008;7:26–37.
Debier C, Ylitalo GM, Weise M, Gulland F, Costa DP, Le Boeuf BJ, et al. PCBs and DDT inthe serum of juvenile California sea lions: associations with vitamins A and E andthyroid hormones. Environ Pollut 2005;134:323–32.
Demers LM. Chapter 41. Thyroid disorders. In: Burtis CA, Ashwood ER, Bruns DE,editors. Tietz fundamentals of clinical chemistry. 6th ed. St. Louis: SaundersElsevier; 2008. p. 766–99.
Derocher AE, Wiig O. Postnatal growth in body length and mass of polar bears (Ursusmaritimus) at Svalbard. J Zool 2002;256:343–9.
Derocher AE, Wolkers H, Colborn T, Schlabach M, Larsen TS, Wiig O. Contaminants inSvalbard polar bear samples archived since 1967 and possible population leveleffects. Sci Total Environ 2003;301:163–74.
Dietz R, Heide-Jørgensen MP, Harkonen T, Teilmann J, Valentin N. Age determination ofEuropean harbor seal, Phoca vitulina L. Sarsia 1991;76:17–21.
Dietz R, Riget FF, Sonne C, Letcher R, Born EW, Muir DCG. Seasonal and temporaltrends in polychlorinated biphenyls and organochlorine pesticides in EastGreenland polar bears (Ursus maritimus), 1990–2001. Sci Total Environ 2004;331:107–24.

707G.D. Villanger et al. / Environment International 37 (2011) 694–708
Dietz R, Riget FF, Sonne C, Letcher RJ, Backus S, Born EW, et al. Age and seasonalvariability of polybrominated diphenyl ethers in free-ranging East Greenland polarbears (Ursus maritimus). Environ Pollut 2007;146:166–73.
Eriksson P, Jakobsson E, Fredriksson A. Brominated flame retardants: a novel class ofdevelopmental neurotoxicants in our environment? Environ Health Perspect 2001;109:903–8.
Eriksson L, Johansson E, Kettaneh-Wold N. Multi- and megavariate data analysis. Part I:basic principles and applications. Umeå: Umetrics; 2006.
Fisk AT, de Wit CA, Wayland M, Kuzyk ZZ, Burgess N, Robert R, et al. An assessment ofthe toxicological significance of anthropogenic contaminants in Canadian arcticwildlife. Sci Total Environ 2005;351:57–93.
Gauger KJ, Kato Y, Haraguchi K, Lehmler HJ, Robertson LW, Bansal R, et al. Polychlorinatedbiphenyls (PCBs) exert thyroid hormone-like effects in the fetal rat brain but do notbind to thyroid hormone receptors. Environ Health Perspect 2004;112:516–23.
Gauger KJ, Giera S, Sharlin DS, Bansal R, Iannacone E, Zoeller RT. Polychlorinatedbiphenyls 105 and 118 form thyroid hormone receptor agonists after cytochromeP4501A1 activation in rat pituitary GH3 cells. Environ Health Perspect 2007;115:1623–30.
Gebbink WA, Sonne C, Dietz R, Kirkegaard M, Born EW, Muir DCG, et al. Target tissueselectivity andburdensof diverse classes of brominated and chlorinated contaminants inpolarbears (Ursusmaritimus) fromEastGreenland. EnvironSci Technol2008a;42:752–9.
Gebbink WA, Sonne C, Dietz R, Kirkegaard M, Riget FF, Born EW, et al. Tissue-specificcongener composition of organohalogen and metabolite contaminants in EastGreenland polar bears (Ursus maritimus). Environ Pollut 2008b;152:621–9.
Gochfeld M. Framework for gender differences in human and animal toxicology.Environ Res 2007;104:4-21.
Goodhead R, Tyler C. Endocrine-disrupting chemicals and their environmental impacts.Organic Pollutants. CRC Press; 2009. p. 265–92.
Gutleb AC, Cenijn P, van Velzen M, Lie E, Ropstad E, Skaare JU, et al. In vitro assayshows that PCB metabolites completely saturate thyroid hormone transportcapacity in blood of wild polar bears (Ursus maritimus). Environ Sci Technol2010;44:3149–54.
Haave M, Ropstad E, Derocher AE, Lie E, Dahl E, Wiig O, et al. Polychlorinated biphenylsand reproductive hormones in female polar bears at Svalbard. Environ HealthPerspect 2003;111:431–6.
Haddow JE, Palomaki GE, Allan WC, Williams JR, Knight GJ, Gagnon J, et al. Maternalthyroid deficiency during pregnancy and subsequent neuropsychological devel-opment of the child. N Engl J Med 1999;341:549–55.
Hadley ME. Chapter 13. Thyroid hormones. In: Hadley ME, editor. Endocrinology. 4thed. Upper Saddle River, NJ: Prentice Hall; 1996. p. 290–337.
Hagmar L, Rylander L, Dyremark E, Klasson-Webler E, Erfurth EM. Plasma concentra-tions of persistent organochlorines in relation to thyrotropin and thyroid hormonelevels in women. Int Arch Occup Environ Health 2001;74:184–8.
Hall AJ, Thomas GO. Polychlorinated biphenyls, DDT, polybrominated diphenylethers, and organic pesticides in United Kingdom harbor seals (Phoca vitulina)— Mixed exposures and thyroid homeostasis. Environ Toxicol Chem 2007;26:851–61.
Hall AJ, Kalantzi OI, Thomas GO. Polybrominated diphenyl ethers (PBDEs) in grey sealsduring their first year of life — are they thyroid hormone endocrine disrupters?Environ Pollut 2003;126:29–37.
Hallgren S, Darnerud PO. Polybrominated diphenyl ethers (PBDEs), polychlorinatedbiphenyls (PCBs) and chlorinated paraffins (CPs) in rats — testing interactions andmechanisms for thyroid hormone effects. Toxicology 2002;177:227–43.
Hallgren S, Sinjari T, Hakansson H, Darnerud PO. Effects of polybrominated diphenylethers (PBDEs) and polychlorinated biphenyls (PCBs) on thyroid hormone andvitamin A levels in rats and mice. Arch Toxicol 2001;75:200–8.
Hamers T, Kamstra JH, Sonneveld E, Murk AJ, Kester MHA, Andersson PL, et al. In vitroprofiling of the endocrine-disrupting potency of brominated flame retardants.Toxicol Sci 2006;92:157–73.
Herbstman JB, Sjödin A, Apelberg BJ, Witter FR, Halden RU, Patterson DG, et al. Birthdelivery mode modifies the associations between prenatal polychlorinatedbiphenyl (PCB) and polybrominated diphenyl ether (PBDE) and neonatal thyroidhormone levels. Environ Health Perspect 2008;116:1376–82.
Howdeshell KL. A model of the development of the brain as a construct of the thyroidsystem. Environ Health Perspect 2002;110(Suppl 3):337–48.
Jenssen BM. Endocrine-disrupting chemicals and climate change: a worst-casecombination for arctic marine mammals and seabirds? Environ Health Perspect2006;114:76–80.
Jugan M-L, Levi Y, Blondeau J-P. Endocrine disruptors and thyroid hormone physiology.Biochem Pharmacol 2010;79:939–47.
Kato Y, Ikushiro S, Haraguchi K, Yamazaki T, Ito Y, Suzuki H, et al. A possible mechanismfor decrease in serum thyroxine level by polychlorinated biphenyls in Wistar andGunn rats. Toxicol Sci 2004;81:309–15.
Kefford BJ, Zalizniak L, Warne MSJ, Nugegoda D. Is the integration of hormesis andessentiality into ecotoxicology now opening Pandora's Box? Environ Pollut 2008;151:516–23.
Khan MA, Hansen LG. Acute effects of ortho-PCB congeners on the hypothalamo-pituitary-thyroid axis. Toxicol Sci 2003a;72:364–5.
Khan MA, Hansen LG. ortho-Substituted polychlorinated biphenyl (PCB) congeners (95or 101) decrease pituitary response to thyrotropin releasing hormone. Toxicol Lett2003b;144:173–82.
Khan MA, Lichtensteiger CA, Faroon O, Mumtaz M, Schaeffer DJ, Hansen LG. Thehypothalamo-pituitary-thyroid (HPT) axis: a target of nonpersistent ortho-substituted PCB congeners. Toxicol Sci 2002;65:52–61.
Kirkegaard M, Sonne C, Dietz R, Letcher RJ, Jensen AL, Hansen S, et al. Alterations inthyroid hormone status in Greenland sledge dogs exposed to whale blubber
contaminated with organohalogen compounds. Ecotoxicol Environ Saf 2011;74:157–63.
Kitamura S, Jinno N, Suzuki T, Sugihara K, Ohta S, Kuroki H, et al. Thyroid hormone-likeand estrogenic activity of hydroxylated PCBs in cell culture. Toxicology 2005;208:377–87.
Kitamura S, Shinohara S, Iwase E, Sugihara K, Uramaru N, Shigematsu H, et al. Affinityfor thyroid hormone and estrogen receptors of hydroxylated polybrominateddiphenyl ethers. J Health Sci 2008;54:607–14.
Kobuke L, Specker JL, Bern HA. Thyroxine content of eggs and larvae of Coho salmon,Oncorhynchus kisutch. J Exp Zool 1987;242:89–94.
Konemann WH, Pieters MN. Confusion of concepts in mixture toxicology. Food ChemToxicol 1996;34:1025–31.
Koppe JG, Bartonova A, Bolte G, Bistrup ML, Busby C, Butter M, et al. Exposure to multipleenvironmental agents and their effect. Acta Paediatr Suppl 2006;95:106–13.
Kuriyama SN, Talsness CE, Grote K, Chahoud I. Developmental exposure to low-dosePBDE-99: effects on male fertility and neurobehavior in rat offspring. EnvironHealth Perspect 2005;113:149–54.
Kuriyama SN, Wanner A, Fidalgo-Neto AA, Talsness CE, Koerner W, Chahoud I.Developmental exposure to low-dose PBDE-99: tissue distribution and thyroidhormone levels. Toxicology 2007;242:80–90.
Langer P, Kocan A, Tajtakova M, Radikova S, Petrik J, Koska J, et al. Possible effects ofpersistent organochlorinated pollutants cocktail on thyroid hormone levels andpituitary-thyroid interrelations. Chemosphere 2007;70:110–8.
Langer P, Kocan A, Tajtakova M, Koska J, Radikova Z, Ksinantova L, et al. Increasedthyroid volume, prevalence of thyroid antibodies and impaired fasting glucose inyoung adults from organochlorine cocktail polluted area: outcome of transgenera-tional transmission? Chemosphere 2008;73:1145–50.
Lans MC, Spiertz C, Brouwer A, Koeman JH. Different competition of thyroxine bindingto transthyretin and thyroxine-binding globulin by hydroxy-PCBs, PCDDs andPCDFs. Eur J Pharmacol 1994;270:129–36.
Leatherland JF, Ronald K. Plasma concentrations of thyroid hormones in a captive andferal polar bear (Ursus maritimus). Comp Biochem Physiol A Comp Physiol 1981;70:575–7.
Letcher RJ, Norstrom RJ, Lin S, Ramsay MA, Bandiera SM. Immunoquantitation andmicrosomal monooxygenase activities of hepatic cytochromes P4501A and P4502Band chlorinated hydrocarbon contaminant levels in polar bear (Ursus maritimus).Toxicol Appl Pharmacol 1996;137:127–40.
Letcher RJ, Gebbink WA, Sonne C, Born EW, McKinney MA, Dietz R. Bioaccumulationand biotransformation of brominated and chlorinated contaminants and theirmetabolites in ringed seals (Pusa hispida) and polar bears (Ursus maritimus) fromEast Greenland. Environ Int 2009;35:1118–24.
Letcher RJ, Bustnes JO, Dietz R, Jenssen BM, Jørgensen EH, Sonne C, et al. Exposure andeffects assessment of persistent organohalogen contaminants in arctic wildlife andfish. Sci Total Environ 2010;408:2995–3043.
Lie E, DerocherA,WiigØ, Skaare JU. Polychlorinated biphenyls inmother/offspring pairs ofpolar bears (Ursus maritimus) at Svalbard. Organohal Comp 2000;49:457–60.
Lie E, Larsen HJS, Larsen S, Johnsen GM, Derocher AE, Lunn NJ, et al. Does highorganochlorine (OC) exposure impair the resistance to infection in polar bears(Ursus maritimus)? Part 1: Effect of OCs on the humoral immunity. J Toxicol EnvironHealth A 2004;67:555–82.
Lie E, Larsen HJS, Larsen S, Johansen GM, Derocher AE, Lunn NJ, et al. Does highorganochlorine (OC) exposure impair the resistance to infection in polar bears(Ursus maritimus)? Part II: Possible effect of OCs on mitogen- and antigen-inducedlymphocyte proliferation. J Toxicol Environ Health A 2005;68:457–84.
Lintelmann J, Katayama A, Kurihara N, Shore L, Wenzel A. Endocrine disruptors in theenvironment (IUPAC Technical Report). Pure Appl Chem 2003;75:631–81.
Lundstedt T, Seifert E, Abramo L, Thelin B, Nystrom A, Pettersen J, et al. Experimentaldesign and optimization. Chemometr Intellig Lab Syst 1998;42:3-40.
McMaster ME, Munkittrick KR, Van Der Kraak GJ. Protocol for measuring circulatinglevels of gonadal sex steroids in fish. Can Tech Rep Fish Aquat Sci 1992;1836:1-29.
McNabb FMA. Thyroid hormones. Englewood Cliffs. N.J.: Prentice Hall; 1992.Meerts IA, Assink Y, Cenijn PH, Van Den Berg JH, Weijers BM, Bergman A, et al. Placental
transfer of a hydroxylated polychlorinated biphenyl and effects on fetal andmaternal thyroid hormone homeostasis in the rat. Toxicol Sci 2002;68:361–71.
Nagayama J, Okamura K, Iida T, Hirakawa H, Matsueda T, Tsuji H, et al. Postnatalexposure to chlorinated dioxins and related chemicals on thyroid hormone statusin Japanese breast-fed infants. Chemosphere 1998;37:1789–93.
Nagayama J, Tsuji H, Iida T, Nakagawa R, Matsueda T, Hirakawa H, et al. Effects ofperinatal exposure to organochlorine pesticides, PCBs and dioxins on lipid weightbasis on immune response and thyroid hormone systems in 10-month-old Japanesinfants. Organohal Comp 2005;67:2418–21.
Nagayama J, Kohno H, Kunisue T, Kataoka K, Shimomura H, Tanabe S, et al.Concentrations of organochlorine pollutants inmothers who gave birth to neonateswith congenital hypothyroidism. Chemosphere 2007;68:972–6.
Nakajima S, Saijo Y, Kato S, Sasaki S, Uno K, Kanagami N, et al. Effects of prenatalexposure to polychlorinated biphenyls and dioxins on mental and motordevelopment in Japanese children at 6 months of age. Environ Health Perspect2006;114:773–8.
Norstrom RJ, Belikov SE, Born EW, Garner GW, Malone B, Olpinski S, et al. Chlorinatedhydrocarbon contaminants in polar bears from eastern Russia, North America,Greenland, and Svalbard: Biomonitoring of Arctic pollution. Arch Environ ContamToxicol 1998;35:354–67.
Oskam IC, Ropstad E, Dahl E, Lie E, Derocher AE, Wiig O, et al. Organochlorines affect themajor androgenic hormone, testosterone, in male polar bears (Ursus maritimus) atSvalbard. J Toxicol Environ Health A 2003;66:2119–39.
708 G.D. Villanger et al. / Environment International 37 (2011) 694–708
Oskam IC, Ropstad E, Lie E, Derocher AE, Wiig O, Dahl E, et al. Organochlorines affect thesteroid hormone cortisol in free-ranging polar bears (Ursus maritimus) at Svalbard,Norway. J Toxicol Environ Health A 2004;67:959–77.
Polischuk SC, Letcher RJ, Norstrom RJ, Ramsay MA. Preliminary results of fasting on thekinetics of organochlorines in polar bears (Ursus maritimus). Sci Total Environ1995;161:465–72.
Polischuk SC, Norstrom RJ, Ramsay MA. Body burdens and tissue concentrations oforganochlorines in polar bears (Ursus maritimus) vary during seasonal fasts.Environ Pollut 2002;118:29–39.
Pop VJ, Kuijpens JL, van Baar AL, Verkerk G, van Son MM, de Vijlder JJ, et al. Lowmaternal free thyroxine concentrations during early pregnancy are associated withimpaired psychomotor development in infancy. Clin Endocrinol Oxf 1999;50:149–55.
Pop VJ, Brouwers EP, Vader HL, Vulsma T, van Baar AL, de Vijlder JJ. Maternalhypothyroxinaemia during early pregnancy and subsequent child development: a3-year follow-up study. Clin Endocrinol Oxf 2003;59:282–8.
Porterfield SP. Thyroidal dysfunction and environmental chemicals — potential impacton brain development. Environ Health Perspect 2000;108(Suppl 3):433–8.
Ramsay MA, Stirling I. Reproductive biology and ecology of female polar bears (Ursusmaritimus). J Zool 1988;214:601–34.
Ribas-Fito N, Sala M, Cardo E, Mazon C, de Muga ME, Verdu A, et al. Organochlorinecompounds and concentrations of thyroid stimulating hormone in newborns.Occup Environ Med 2003;60:301–3.
Rolland RM. A review of chemically-induced alterations in thyroid and vitamin A statusfrom field studies of wildlife and fish. J Wildl Dis 2000;36:615–35.
Rosing-Asvid A, Born EW, Kingsley MCS. Age at sexual maturity of males and timing ofthe mating season of polar bears (Ursus maritimus) in Greenland. Polar Biol2002;25:878–83.
Routti H, Arukwe A, Jenssen BM, Letcher RJ, Nyman M, Backman C, et al. Comparativeendocrine disruptive effects of contaminants in ringed seals (Phoca hispida) fromSvalbard and the Baltic Sea. Comp Biochem Phys C 2010;152:306–12.
Sacco JC, James MO. Glucuronidation in the polar bear (Ursus maritimus). Mar EnvironRes 2004;58:475–9.
Sandala GM, Sonne-Hansen C, Dietz R, Muir DCG, Valters K, Bennett ER, et al.Hydroxylated and methyl sulfone PCB metabolites in adipose and whole blood ofpolar bear (Ursus maritimus) from East Greenland. Sci Total Environ 2004;331:125–41.
Sandau CD. Analytical chemistry of hydroxylated metabolites of PCBs and otherhalogenated phenolic compounds in blood and their relationship to thyroidhormone and retinol homeostasis in humans and polar bears. Doctor of Philosophy.Ottawa, Canada: Carleton University (Canada; 2000. p. 262.
Sandau CD, Meerts I, Letcher RJ, McAlees AJ, Chittim B, Brouwer A, et al. Identification of 4-hydroxyheptachlorostyrene in polar bear plasma and its binding affinity to transthyr-etin: a metabolite of octachlorostyrene? Environ Sci Technol 2000;34:3871–7.
Sandau CD, Ayotte P, Dewailly E, Duffe J, Norstrom RJ. Pentachlorophenol and hydroxylatedpolychlorinated biphenylmetabolites in umbilical cord plasma of neonates from coastalpopulations in Quebec. Environ Health Perspect 2002;110:411–7.
Siemens. Coat-A-Count Total T3 user manual. Siemens Medical Solutions Diagnostics,Los Angeles, CA, USA; 2006a.
Siemens. Coat-A-Count Total T4 user manual. Siemens Medical Solutions Diagnostics,Los Angeles, CA, USA; 2006b.
SIMCA. SIMCA-P+ 12 user guide. UMETRICS, Umeå, Sweden; 2008.Skaare JU, Bernhoft A, Wiig O, Norum KR, Haug E, Eide DM, et al. Relationships between
plasma levels of organochlorines, retinol and thyroid hormones from polar bears(Ursus maritimus) at Svalbard. J Toxicol Environ Health A 2001;62:227–41.
Sonne C. Health effects from long-range transported contaminants in Arctic toppredators: an integrated review based on studies of polar bears and relevant modelspecies. Environ Int 2010;36:461–91.
Sonne C, Dietz R, Born EW, Riget FF, Kirkegaard M, Hyldstrup L, et al. Is bone mineralcomposition disrupted by organochlorines in East Greenland polar bears (Ursusmaritimus)? Environ Health Perspect 2004;112:1711–6.
Sonne C, Dietz R, Leifsson PS, Born EW, Letcher RJ, Kirkegaard M, et al. Do organohalogencontaminants contribute to histopathology in liver from east Greenland polar bears(Ursus maritimus)? Environ Health Perspect 2005;113:1569–74.
Sonne C, Dietz R, Leifsson PS, Born EW, KirkegaardM, Letcher RJ, et al. Are organohalogencontaminants a cofactor in the development of renal lesions in East Greenland polarbears (Ursus maritimus)? Environ Toxicol Chem 2006a;25:1551–7.
Sonne C, Leifsson PS, Dietz R, Born EW, Letcher RJ, Hyldstrup L, et al. Xenoendocrinepollutants may reduce size of sexual organs in East Greenland polar bears (Ursusmaritimus). Environ Sci Technol 2006b;40:5668–74.
Sonne C, Dietz R, Born EW, Riget FF, Leifsson PS, Bechshoft TO, et al. Spatial andtemporal variation in size of polar bear (Ursus maritimus) sexual organs and its usein pollution and climate change studies. Sci Total Environ 2007;387:237–46.
Sørmo EG, Jussi I, Jussi M, BraathenM, Skaare JU, Jenssen BM. Thyroid hormone status ingray seal (Halichoerus grypus) pups from the Baltic Sea and the Atlantic Ocean inrelation to organochlorine pollutants. Environ Toxicol Chem 2005;24:610–6.
Sørmo EG, Salmer MP, Jenssen BM, Hop H, Baek K, Kovacs KM, et al. Biomagnification ofpolybrominated diphenyl ether and hexabromocyclododecane flame retardants inthe polar bear food chain in Svalbard, Norway. Environ Toxicol Chem 2006;25:2502–11.
St Aubin DJ. Chaper 10. Endocrinology. In: Dierauf LA, Gulland F, editors. CRC handbookof marine mammal medicine: health, disease, and rehabilitation. 2nd ed. BocaRaton, FL: CRC Press; 2001. p. 165–92.
Tagawa M, Hirano T. Presence of thyroxine in eggs and changes in its content duringearly development of chum salmon, Oncorhynchus keta. Gen Comp Endocrinol1987;68:129–35.
Takser L, Mergler D, BaldwinM, de Grosbois S, Smargiassi A, Lafond J. Thyroid hormonesin pregnancy in relation to environmental exposure to organochlorine compoundsand mercury. Environ Health Perspect 2005;113:1039–45.
Talsness CE, Shakibaei M, Kuriyama SN, Grande SW, Sterner-Kock A, Schnitker P, et al.Ultrastructural changes observed in rat ovaries following in utero and lactationalexposure to low doses of a polybrominated flame retardant. Toxicol Lett 2005;157:189–202.
Thomann RV. Bioaccumulation model of organic distribution in aquatic food chains.Environ Sci Technol 1989;23:699–707.
Ucan-Marin F, Arukwe A, Mortensen AS, Gabrielsen GW, Letcher RJ. Recombinantalbumin and transthyretin transport proteins from two gull species and human:chlorinated and brominated contaminant binding and thyroid hormones. EnvironSci Technol 2010;44:497–504.
Vanraaij J, Vandenberg KJ, Engel R, Bragt PC, Notten WRF. Effects of hexachlorobenzeneand its metabolies pentachlorophenol and tetrachlorohydroquinone on serumthyroid hormone levels in rats. Toxicology 1991;67:107–16.
Vanraaij J, Frijters CMG, Vandenberg KJ. Hexachlorobenzene induced hypothyroidsm —
involvement of different mechanisms by parent compound and metabolite.Biochem Pharmacol 1993a;46:1385–91.
Vanraaij J, Kaptein E, Visser TJ, Vandenberg KJ. Increased glucoronidation of thyroidhormone in hexachlorobenzene treated rats. Biochem Pharmacol 1993b;45:627–31.
Vos J, Becher G, van den Berg M, de Boer J, Leonards P. Brominated flame retardants andendocrine disruption. Pure Appl Chem 2003;75:2039–46.
Wade MG, Parent S, Finnson KW, Foster W, Younglai E, McMahon A, et al. Thyroidtoxicity due to subchronic exposure to a complex mixture of 16 organochlorines,lead, and cadmium. Toxicol Sci 2002;67:207–18.
Wold S, Ruhe A, Wold H, Dunn WJ. The collinearity problem in linear regression — thePartial Least-Squares (PLS) approach to generalized inverses. SIAM J Sci StatComput 1984;5:735–43.
Wold S, Sjostrom M, Eriksson L. PLS-regression: a basic tool of chemometrics.Chemometr Intellig Lab Syst 2001;58:109–30.
Zhou T, Taylor MM, DeVito MJ, Crofton KA. Developmental exposure to brominateddiphenyl ethers results in thyroid hormone disruption. Toxicol Sci 2002;66:105–16.
Zoeller RT. Environmental chemicals as thyroid hormone analogues: new studiesindicate that thyroid hormone receptors are targets of industrial chemicals? MolCell Endocrinol 2005;242:10–5.
Zoeller RT. Environmental chemicals impacting the thyroid: targets and consequences.Thyroid 2007;17:811–7.
Zoeller RT, Crofton KM. Mode of action: developmental thyroid hormone insufficiency— neurological abnormalities resulting from exposure to propylthiouracil. Crit RevToxicol 2005;35:771–81.
Zoeller RT, Tan SW, Tyl RW. General background on the hypothalamic–pituitary–thyroid (HPT) axis. Crit Rev Toxicol 2007a;37:11–53.
Zoeller RT, Tyl RW, Tan SW. Current and potential rodent screens and tests for thyroidtoxicants. Crit Rev Toxicol 2007b;37:55–95.