Temporal trend of mercury in polar bears (Ursus maritimus) from Svalbard using teeth as a...
20
1 1 2 3 Temporal trend of mercury in polar bears (Ursus maritimus) from 4 Svalbard using teeth as a biomonitoring tissue 5 6 7 8 Aurore Aubail a, b, * , Rune Dietz a, * , Frank Rigét a , Christian Sonne a , Øystein Wiig c , Florence 9 Caurant b 10 11 a National Environmental Research Institute, Aarhus University, Frederiksborgvej 399, P.O. Box 12 358, DK-4000 Roskilde, Denmark 13 14 b Littoral, Environnement et Sociétés (LIENSs), UMR 6250, CNRS-Université de La Rochelle, 2 rue 15 Olympe de Gouges, F-17042 La Rochelle cedex, France 16 17 c Natural History Museum, University of Oslo, P.O. Box 1172 Blindern, NO-0318 Oslo, Norway 18 19 20 21 22 * Corresponding authors: 23 Tel.: +33 (0)546507639; Fax.: +33 (0)546458264/ Tel.: +45 21254035; Fax.: +45 46301914 24 E-mail address: [email protected] /[email protected] 25 26 27 hal-00647260, version 1 - 1 Dec 2011 Author manuscript, published in "Journal of Environmental Monitoring (2012) DOI: 10.1039/C1EM10681C" DOI : 10.1039/C1EM10681C
Transcript of Temporal trend of mercury in polar bears (Ursus maritimus) from Svalbard using teeth as a...
1
1
2
3
Temporal trend of mercury in polar bears (Ursus maritimus) from 4
Svalbard using teeth as a biomonitoring tissue 5
6
7
8
Aurore Aubail a, b, *
, Rune Dietz a, *
, Frank Rigét a, Christian Sonne
a, Øystein Wiig
c, Florence 9
Caurant b 10
11
a National Environmental Research Institute, Aarhus University, Frederiksborgvej 399, P.O. Box 12
358, DK-4000 Roskilde, Denmark 13
14
b Littoral, Environnement et Sociétés (LIENSs), UMR 6250, CNRS-Université de La Rochelle, 2 rue 15
Olympe de Gouges, F-17042 La Rochelle cedex, France 16
17
c Natural History Museum, University of Oslo, P.O. Box 1172 Blindern, NO-0318 Oslo, Norway 18
19
20
21
22
* Corresponding authors: 23
Tel.: +33 (0)546507639; Fax.: +33 (0)546458264/ Tel.: +45 21254035; Fax.: +45 46301914 24
E-mail address: [email protected]/[email protected] 25
26
27
hal-0
0647
260,
ver
sion
1 -
1 D
ec 2
011
Author manuscript, published in "Journal of Environmental Monitoring (2012) DOI: 10.1039/C1EM10681C" DOI : 10.1039/C1EM10681C
2
Abstract 28
We examined the use of mercury (Hg) and nitrogen and carbon stable isotopes in teeth of polar bear 29
(Ursus maritimus) from Svalbard as biotracers of temporal changes in Hg pollution exposure 30
between 1964 and 2003. Teeth were regarded as a good matrix of the Hg exposure, and in total 87 31
teeth of polar bears were analysed. Dental Hg levels ranged from 0.6 to 72.3 ng/g dry weight and 32
increased with age the first 10 years of life. A decreasing time trend in Hg concentrations was 33
observed over the recent four decades while no temporal changes were found in the stable isotope 34
ratios of nitrogen (δ15
N) and carbon (δ13
C). This suggests that the decrease of Hg concentrations 35
over time was more likely due to a lower environmental Hg exposure in this region rather than a 36
shift in the feeding habits of Svalbard polar bears. 37
38
Key words: Hg, carbon, nitrogen, stable isotope, polar bear, tooth, Svalbard, temporal trend39
hal-0
0647
260,
ver
sion
1 -
1 D
ec 2
011

3
Introduction 40
41
Mercury (Hg) is emitted to the atmosphere from both natural and anthropogenic sources around the 42
world. Long-range atmospheric transport represents the major pathway of Hg to the Arctic 43
environment.1,2
However recent evidence show that ocean currents and rivers also contributes 44
significantly to the Arctic Hg pollution.3 Mercury is known to accumulate in organisms and 45
biomagnify up the food chains,4 and has therefore been detected in the body tissues of various 46
Arctic organisms including local Inuit populations.5 47
Bioaccumulation processes in the Arctic fauna are still investigated, and various temporal trends of 48
Hg have been provided within the Arctic Monitoring Assessment Programme.5 Due to its long life 49
span and its top position in the marine Arctic food web, the polar bear (Ursus maritimus) 50
accumulates significant amounts of Hg in its tissues. Mercury in this species has been mostly 51
investigated in soft organs such as liver or kidney,6-11
but also in hair6,12-15
and blood.16
However, 52
from our knowledge there is no information available concerning Hg concentrations in polar bear 53
teeth, though this tissue could provide a good material to assess Hg bioaccumulation in this apex 54
predator. Calcified tissues like teeth are indeed considered to be valuable archives, as they record 55
the individual life history, environment and diet, and therefore could be used in different fields of 56
environmental sciences. 57
Mammalian teeth comprise three anatomical defined tissues: enamel, dentine and cementum. 58
Dentine and cementum are composed of both organic (collagen) and mineral (calcium phosphate, 59
i.e. apatite) fractions that grow throughout life; in marine mammals, these two tissues deposit yearly 60
through layers or Growth Layer Groups (GLG). Mercury, once ingested, distributes to all internal 61
organs and tissues via blood stream,17
including to the dentinal increments from blood vessels.18
62
Contrary to soft tissues, the tooth is not remodelled or very little throughout life, and incorporated 63
elements like Hg are thought not to be remobilised.19,20
Thus, the dental tissue is a valuable material 64
concerning life exposure investigations, and has therefore been previously investigated for Hg in 65
rats,21
marine mammals22-25
and humans.19,20
66
Since diet is the main pathway for Hg to enter marine mammals, in addition to the general 67
anthropogenic trends a change in feeding habits would also likely result in variations in Hg 68
exposure, and consequently, in the body concentrations of this metal. Moreover, due to the 69
magnification of this element, a change in Hg levels of an organism may only be seen if that 70
organism feeds on different trophic levels than it used to. The naturally occurring carbon (12
C and 71
13C) and nitrogen (
14N and
15N) stable isotopes ratios have proved to be useful tools for 72
hal-0
0647
260,
ver
sion
1 -
1 D
ec 2
011
4
characterizing the primary production in marine and terrestrial ecosystems and delineating the 73
trophic position of organisms in food webs, respectively.26
Like trace elements, carbon and nitrogen 74
are incorporated in the dental tissue during its growth. Combined to the analysis of Hg, the 75
measurement of the carbon and nitrogen stable isotopes in the teeth will provide valuable 76
information relative to potential changes in feeding habits or habitats for polar bear. The stable 77
isotopic technique is based on the metabolic discrimination between the heavy and the light 78
isotopes. While 13
C/12
C values exhibit few variations through successive trophic levels in the food 79
chains,27
the 15
N/14
N value is significantly and regularly enriched through the food chains with a 80
value found in a consumer’s tissue directly related to the one of its prey, providing thus information 81
on one’s trophic level.28
Usually, the isotopic measurements are carried out on muscle tissues which 82
give access to the feeding ecology from the last weeks or months, whereas performed on teeth, the 83
isotopic data obtained will represent an average dietary estimate over the animal’s lifetime or near 84
to its lifetime,29
erasing any potential shift of diet related to seasonal and physiological stages. 85
Polar bears are known to prey mainly on ringed seals (Pusa hispida) and to a lesser extent on 86
bearded seals (Erignathus barbatus) across the Arctic.30
However, there are some evidences that the 87
ringed seal dominance in polar bear diet differs for example spatially and temporally in the 88
Arctic.31,32
Polar bears feed also on other species such as harp seals (Phoca groenlandica),33
walrus 89
(Odobenus rosmarus),34
beluga whales (Delphinapterus leucas) and narwhal (Monodon 90
monoceros);35
and diet items like seabirds or even reindeers (Rangifer tarandus) have been showed 91
to be consumed by the polar bears in Svalbard.36
Sea ice is used as a platform by polar bears for seal 92
hunt,30
so that the accessibility of their main prey varies throughout the year due to sea ice extension 93
changes. This close relation to the sea ice makes polar bears vulnerable to a warming climate and a 94
relevant indicator of climate change effects on the ecosystem.37
Global warming has resulted in 95
significant declines in total cover and thickness of sea ice over the last decades in the Arctic.38
96
Because of this progressive earlier break-up and later freezing of the Arctic sea ice in some areas, 97
polar bear’s access to seals is thus likely to be reduced resulting in longer periods of fasting and 98
searching for alternative food sources. Stable isotopic measurements were therefore used 99
complementarily with the elemental analysis in this study on polar bears to relate temporal 100
variations of tooth Hg to potential changes in feeding habits for this species. 101
This article presents the Hg concentrations and 15
N/14
N and 13
C/12
C values in teeth of polar bears 102
from Svalbard over the recent four decades. The objectives of this study are to assess the influence 103
of the biological factors (sex and age) on Hg concentrations in teeth and to investigate the temporal 104
pattern of Hg concentrations in Svalbard polar bears between the 1960s and the 2000s in order to 105
evaluate whether the tooth is a good biomonitoring tissue. 106
hal-0
0647
260,
ver
sion
1 -
1 D
ec 2
011
5
107
Materials and methods 108
109
Sampling procedure and preparation 110
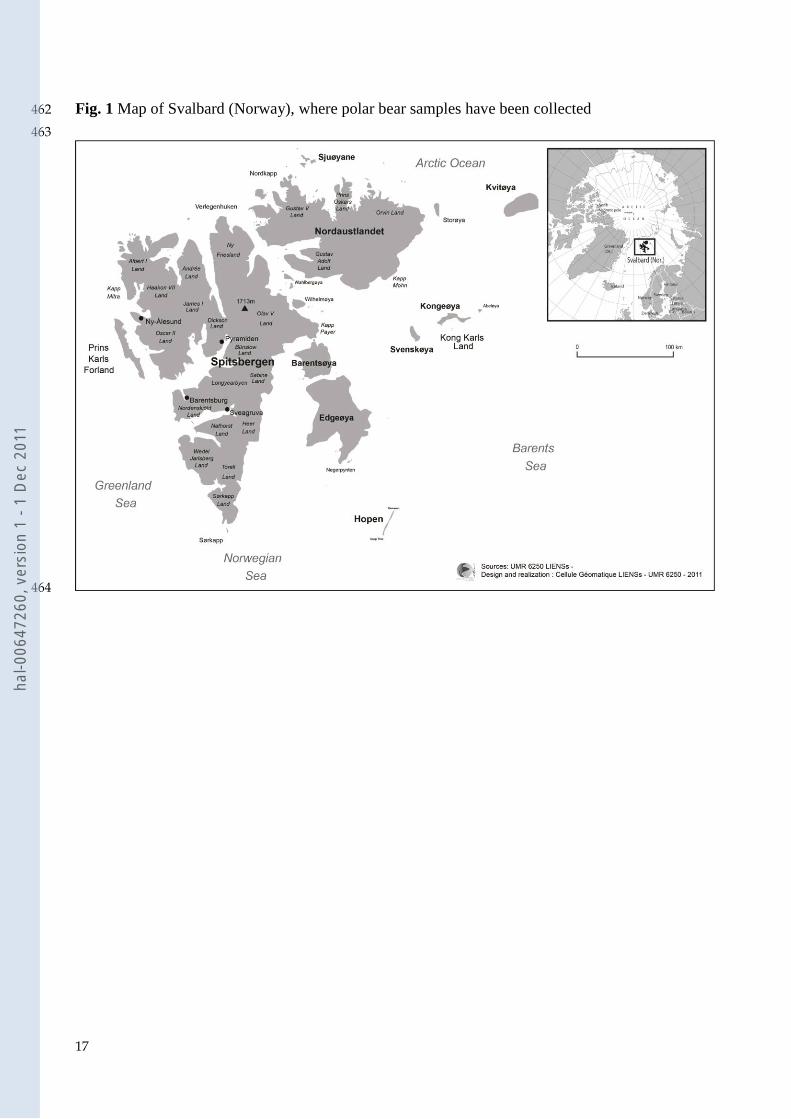
Tooth samples were obtained from 87 polar bear skulls archived at the Natural History Museum, 111
University of Oslo (NHM), Norway. The skulls had been collected in the archipelago of Svalbard 112
(Fig. 1), from 1964 to 2003. An overview of the samples used in statistical analysis is presented in 113
Table 1. 114
The first premolar of the lower mandible had been used for age estimation by counting annual 115
layers in the cementum after decalcification, thin sectioning (14µm), and staining in toluidine blue, 116
as described by Dietz et al.39
The third incisor from the lower right mandible was taken for the Hg 117
and carbon and nitrogen stable isotopes analytical purpose. The extracted tooth was cut in three 118
pieces using a Proxon diamond saw. The upper third incisor was used for the study of Hg content, 119
while the middle part of the tooth was used to the determination of the stable isotopes, and the 120
lower third incisor was kept for further potential investigations (e.g. additional age determination). 121
It is assumed that contrarily to the root, the upper and middle parts of incisors have the same deposit 122
of layers and have been similarly exposed to Hg. 123
Prior to analysis, upper and middle parts of the teeth were cleaned of external materials by abrasion, 124
immersed subsequently in 10% nitric acid for 20s, and rinsed in several ultra-pure Milli-Q water 125
baths. Tooth samples were dried for a minimum of 24h at room temperature, and subsequently 126
stored in cleaned plastic flasks until analysis. 127
128
Analytical procedures and instrumentation for Hg analysis 129
The Hg measurements were performed at the laboratory of the National Environmental Research 130
Institute in Roskilde (NERI), Denmark, using a solid sample atomic absorption spectrometer AMA-131
254 (Advanced Mercury Analyser-254 from LECO, Sweden). The use of this instrument does not 132
require a chemical pre-treatment, which reduces considerably contamination risks and loss of Hg. 133
The analytical process consists of a drying period at 120°C for 50 seconds, prior to a combustion 134
phase at 750°C for 250 seconds, which leads to the desorption of Hg from the samples. 135
Subsequently, the Hg vapour produced is carried by an oxygen flow to a gold amalgamator, and 136
trapped on its surface. Thereafter, the collected Hg is released from the amalgamator by a short 137
heat-up to 900°C, and carried in a pulse through a spectrophotometer, where it is measured by UV 138
absorption. The instrument is described in detail by Hall and Pelchat.40
139
hal-0
0647
260,
ver
sion
1 -
1 D
ec 2
011
6
140
As there is no commercial reference material with a tooth or bone matrix and certified for Hg, a 141
reference material was made from two commercial Standard Reference Materials (SRMs). These 142
were the NIST 1400 Bone ash (National Institute of Standards and Technology, USA) and the 143
DOLT-3 (Dogfish Liver Tissue from the National Research Council of Canada). The Bone ash 144
SRM does not contain any Hg because it has been calcined at high temperatures, but it represents a 145
calcified tissues matrix, while the DOLT-3 contributes with the organic matrix and the certified 146
level of Hg. 147
In order to validate the use of this customised reference material, an intercalibration between two 148
different techniques (AMA-254 and cold-vapour Atomic Absorption Spectrophotometry on a 149
Perkin Elmer FIMS 100) was carried out in NERI, and moreover, an inter laboratory comparison 150
was carried out between NERI and CCA (Centre Commun d’Analyses, University of La Rochelle, 151
France) for the AMA-254 analysis. The results showed a good accuracy (i.e. the recovery measured 152
value/theoretical value) of 102.3% and a relative standard deviation of 6.3% (Table 2). 153
The analytical quality of the Hg measurements by the AMA-254 was ensured by including the 154
customised reference material at the beginning and at the end of the analytical cycle, and by running 155
it every 10 samples. Results of these measurements (n = 13) showed a good precision with a 156
relative standard deviation of 1.6%, and an accuracy of 106.6% of the assigned concentration. 157
NERI participates in the international inter-laboratory comparison exercises conducted by the EEC 158
(QUASIMEME), and the latest 2007 analyses by AMA-254 showed satisfactory results (0 < z < 159
0.5). All data are presented on a dry weight basis (dw) and the detection limit is 0.01 ng. 160
161
Analytical procedures and instrumentation for stable isotope measurements 162
Prior to analysis, tooth samples were crushed into small pieces before being ground into 163
homogenous powder using a ball mill (Retsch MM2000) for 2min at the amplitude of 90. Powder 164
was then stored in small glass flasks. The carbonates of the teeth were removed by digesting the 165
teeth with approximately 1 mL of a 4M-hydrochloric acid solution at 45°C for 48h. Subsequently, 166
the digested contents were taken up in milli-Q ultrapur quality water, and homogenised before 167
freezing to -20°C. Thus, the samples were frozen at -80°C for a short time before freeze drying. 168
Finally, an aliquot of approximately 1.45 mg was taken of each obtained homogenised dried 169
sample, weighted and loaded into tin capsules. 170
Relative abundance of stable isotopes of nitrogen (15
N/14
N) and carbon (13
C/12
C) were determined 171
with an Elemental Analyser connected on-line to an Isotope-Ratio Mass Spectrometer (Isoprime, 172
hal-0
0647
260,
ver
sion
1 -
1 D
ec 2
011
7
Micromass, UK). Stable isotope results are expressed in delta notation (δ), defined as the part per 173
thousand (‰) deviation from a standard material: 174
175
δ 15
N or δ 13
C = [(Rsample / Rstandard) − 1] × 103 176
177
where Rsample and Rstandard are the fractions of heavy to light isotopes in the sample and 178
standard, respectively. The international standards are the atmospheric nitrogen for δ15
N and the Pee 179
Dee Belemnite (PDB) marine fossil limestone formation from South Carolina for δ13
C, and 180
acetanilide was used as the internal laboratory reference material. 181
182
Data treatment 183
Prior to the statistical analyses, the Hg data were log-transformed (base e) to reduce skewness and 184
fit parametric requirements of normal distribution and homogeneity of variances. Shapiro–Wilk test 185
of normality and Bartlett test of homogeneity of variances were applied to test the assumptions of 186
analysis of variance (ANOVA) and linear regression analysis. The assumptions were not fulfilled in 187
few cases due to some high Hg values but ANOVA tests are robust to small deviations of the data 188
from the normal distribution,41
so that the analyses were conducted anyway. 189
Analysis of variance and multiple linear regression analyses were performed to test the influence of 190
sex, age, and year on log-transformed Hg concentrations and stable isotopic values. Only 191
individuals (>4 years old) were used to test the factor sex (n = 49), while only individuals collected 192
from 1964 to 1966 (n = 57) were selected when testing the age effect. The non-parametric test 193
Spearman rank correlation was used to investigate relationships between log-transformed Hg 194
concentrations, δ13
C and δ15
N values. 195
The significance level was set to p = 0.05 and the statistical analyses were performed using the free 196
software R, version 2.1.1.42
197
198
hal-0
0647
260,
ver
sion
1 -
1 D
ec 2
011
8
Results 199
200
Mercury concentrations in relation to age and sex 201
Dental Hg levels were generally low, exhibiting a mean value ± standard deviation (sd) of 6 ± 8.3 202
ng/g dw (Table 3). The highest concentration was found in a female cub (0 year old) from 1964. It 203
was considered as an outlier due to its very high Hg concentration (72.3 ng/g dw), and was 204
consequently excluded from graphs and statistical calculations. 205
Log-transformed Hg concentrations in polar bear teeth were not influenced by gender (one-way 206
ANOVA, F = 3.00, p = 0.09), so data were pooled across sexes in the further data analyses. In 207
contrary, log-transformed Hg concentrations increased significantly with age (Spearman’s 208
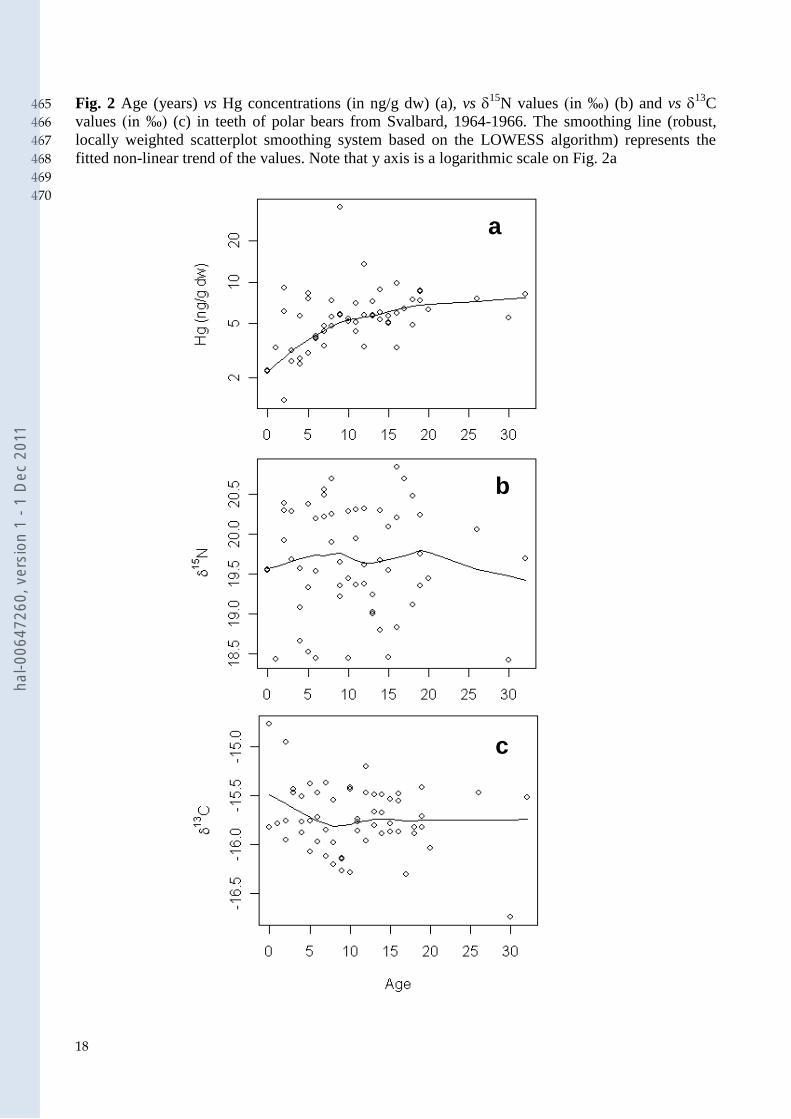
correlation, = 0.50, p < 0.001). A general increase of Hg concentrations in the teeth of polar bears 209
was observed for the first 10 years of life and followed by a plateau phase (Fig. 2a). 210
211
Stable isotopic values in relation to sex, age and Hg concentrations 212
The 15
N and 13
C values ranged from 17.7‰ to 21.8‰ and -17.4‰ to -14.8‰, respectively (Table 213
3). Neither 15
N nor 13
C values in polar bear teeth were influenced by gender (F = 0.01, p = 0.92; 214
F = 0.17, p = 0.68), or correlated with age ( = -0.02, p = 0.90, Fig. 2b and = -0.11, p = 0.42, Fig. 215
2c, respectively); and no relationship was found between log-transformed Hg concentrations and 216
15
N or 13
C values ( = 0.11, p = 0.29 and = 0.01, p = 0.91, respectively) (Table 4). 217
218
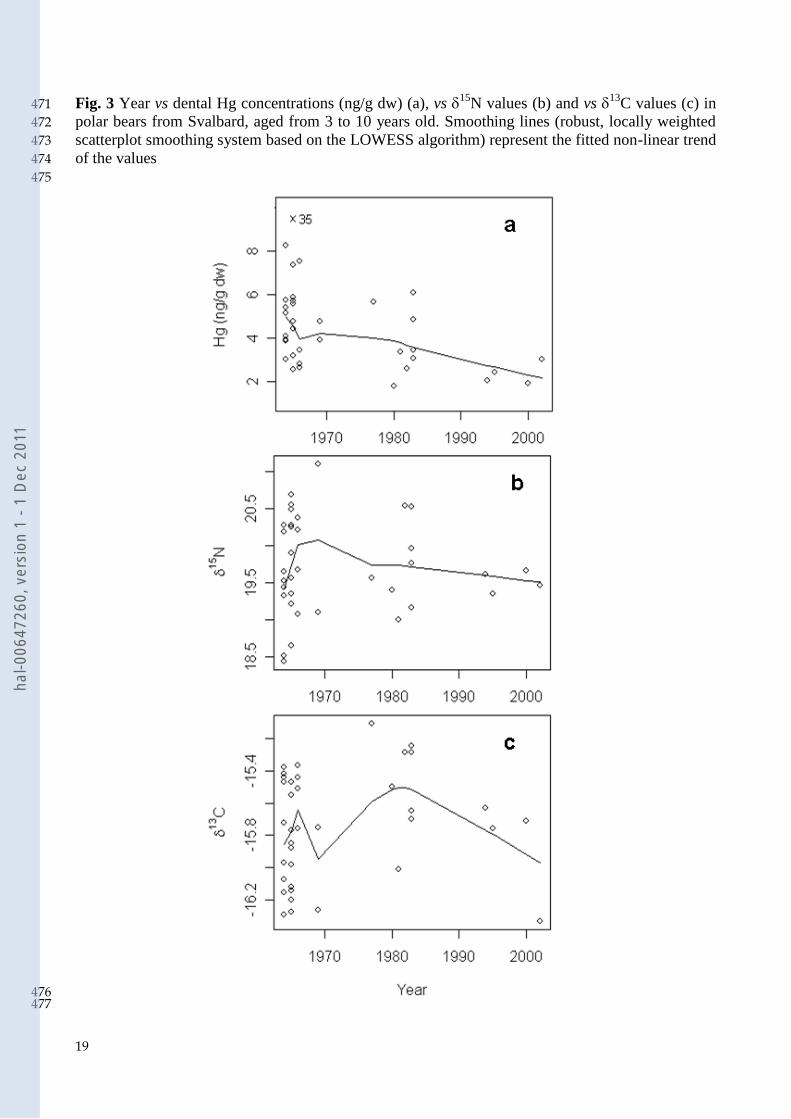
Time trends 219
Sub-adult and adult individuals with age between 3-10 years (n = 37) were selected for the time 220
trend analyses in order to limit the overlap of the periods of life of the animals and in the same time 221
to cover the entire 40 years period. In addition, since polar bear cubs are nursed until their third year 222
of life,43
selecting individuals older than 2 years excludes the animals which have been feeding 223
exclusively on maternal milk. The yearly average age of the sampled individuals (3-10 years) did 224
not follow any time trend (linear regression, F = 0.54, p = 0.47), hence no age normalisation was 225
conducted. However, a significant decreasing trend in Hg concentrations of 2.1% per year was 226
found over the 4 decades period between 1964 and 2003 (F = 9.66, p = 0.004, Fig. 3a), while no 227
significant temporal trend was found for 15
N or 13
C values for the same period (F < 0.01, p = 228
0.94, Fig. 3b and F = 0.42, p = 0.52, Fig. 3c, respectively). 229
230
hal-0
0647
260,
ver
sion
1 -
1 D
ec 2
011
9
Discussion 231
232
Levels of Hg in the teeth 233
Diet is the main pathway for Hg in to the body of marine mammals.44
Thus, the feeding habits 234
mainly determine the Hg primary load of a species. However, another important factor is the 235
excretion routes where hair has been shown to play an important role for pinnipeds or polar bears 236
similar to the one of feathers for birds.45-47
Polar bears, as top predators of the Arctic marine food 237
web, have been shown to accumulate high Hg concentrations (several ppm) in soft tissues7,8,9,10
and 238
fur6,12,13
while Hg concentrations in teeth in our study are about 1000 times lower. These levels are 239
consistent with the levels reported in teeth of other Arctic marine mammals. Thus, Outridge et al.23
240
reported dental Hg concentrations under 2 ng/g dw for modern samples of walrus. A geometric 241
mean (± 2 standard errors) of 4.4 (± 1.7) to 8.6 (± 3.7) ng/g was found in ringed seals of 5-25 years 242
old from Amundsen Gulf in Canada.24
Aubail et al.25
reported dental Hg concentrations (± sd) of 243
2.94 (± 1.99) ng/g in ringed seals from West Greenland and of 5.75 (± 6.20) ng/g in ringed seals 244
from East Greenland. However, dental Hg concentrations measured in polar bears are lower than 245
those found in beluga whales by Outridge et al.23
, who reported a mean Hg concentration (± sd) of 246
98.4 (± 109) ng/g dw for animals 6-26 years old and Hg concentrations ranging from 6.4 (± 13.3) to 247
292.3 (± 36) ng/g in individuals 10-60 years old from the Beaufort Sea.24
A geographical difference 248
in general environmental Hg exposure could likely contribute to this difference, since polar bears 249
from Svalbard and their primary food the ringed seal have been shown to generally exhibit lower 250
Hg concentrations than Canadian or Greenlandic individuals.6,9,48-50
Moreover, it has been shown 251
that during periods of reliable food access, polar bears mainly consume seal blubber,51
which is not 252
exhibiting high Hg contents52
and could therefore result in lower dental Hg levels in polar bears 253
compared to beluga whales. However, again the excretion also plays a major role as toothed whales 254
do not have the hair excretion route as the polar bears which results in relatively higher 255
concentrations in e.g. meat and brain.47
256
257
Biological factors 258
Although diet may vary substantially between genders, no difference in Hg concentrations was 259
found between males and females, which fits the lack of difference between males and females 260
previously reported in soft tissues of polar bears.7-9
Contrarily, dental Hg concentrations were 261
correlated with age (Table 4). Polar bears generally exhibit a cumulative pattern of this metal 262
especially in their liver.7-9,11
However, age effects on dental Hg concentrations in Arctic marine 263
hal-0
0647
260,
ver
sion
1 -
1 D
ec 2
011
10
mammals are not consistent in the literature. Outridge et al.22
showed that Hg concentrations in 264
teeth of beluga whales increased with age, while Kinghorn et al.53
did not find a significant age 265
effect in the same species. Outridge et al.24
observed a positive correlation between age and Hg 266
concentrations in teeth of ringed seals, while Aubail et al.25
did find a significant decrease of the 267
dental Hg concentrations the first years of life for Greenland ringed seals; this trend was explained 268
by early maternal transfer of Hg to pre- and postnatal individuals. Indeed, since ringed seals acquire 269
their permanent dentition at the foetal stage,54
the prenatal transfer of Hg may represent an 270
important source of Hg for the dental tissues mineralised under the foetal stage, compared to the 271
postnatal Hg incorporated from diet. In this study, a general increase of Hg concentrations in the 272
teeth of polar bears was observed for the first 10 years of life and was followed by a more constant 273
plateau phase (Fig. 2a). Thus, this trend could be explained by the fact that polar bears, contrarily to 274
ringed seals, would acquire their permanent dentition at the postnatal stage. This results in the 275
progressive accumulation of Hg throughout years with a low intake of Hg from the maternal milk, 276
to greater Hg concentrations with an increasing efficiency of the hunting strategy and thus, amount 277
of prey and Hg ingested. The stabilized levels of Hg observed afterwards may likely be related to 278
the late dentinal occlusion of the tooth. Indeed, the deposition of dentine reduces the pulp area and 279
in some species, the pulp cavity has been shown to occlude at some point of their life with the 280
subsequent suspension of the deposition of dentine55
and likely also elements such as Hg from 281
blood vessels. 282
The highest dental Hg content in our study (72.3 ng/g dw) was displayed by one of the five cubs of 283
the year, whereas the four others exhibited low dental Hg concentrations (from 0.9 to 3.4 ng/g dw). 284
Kenny and Bickel56
reported that a 6 months old polar bear cub still had some deciduous incisors at 285
its age, thus, the hypothesis that the deciduous incisor may actually have been sampled and 286
analysed instead of the permanent one for that yearling cannot be eliminated. The high Hg value 287
displayed by that particular individual could likely correspond to the Hg maternal input during 288
foetal stage, an input which has been shown to be of important contribution for the dental tissues of 289
ringed seals.25
290
Since integration time and process of both isotopic and metallic elements are considered as 291
relatively similar, 15
N or 13
C values have been used to relate Hg concentrations to trophic position 292
or foraging location, respectively. However, Hg concentrations were not correlated with 15
N or 293
13
C values in this study and no age effect was found for 15
N values, which is different from other 294
previous investigations in which high 15
N values were measured in muscle of different marine 295
mammals in the first years of life, relative to dietary inputs from mother’s milk during the period of 296
hal-0
0647
260,
ver
sion
1 -
1 D
ec 2
011
11
suckling.57-59
In those studies, the decrease in nitrogen isotope values reflects ontogenetic changes 297
and is likely to be associated with the period from primarily feeding on milk towards primarily 298
feeding on live prey. Likewise, no age effects were found for 13
C values in our study, whereas 299
cubs of the year were expected to present low 13
C values, in response to depleted 13
C directly 300
derived from maternal milk lipids. 301
302
Time trend 303
Contrary to soft tissues, which are generally degraded over time, dental tissues are well preserved 304
from degradation. In addition, mammal teeth are stored and preserved within jaws in museum 305
collections for decades, and their easy access allow thus to provide long-term time series of data. As 306
biological archives, teeth are thought to reflect the Hg exposure through diet at the time of 307
formation since dental Hg matches blood Hg at the time of formation and mineralisation of the 308
tooth. Therefore, Hg concentrations in teeth reflect an average exposure of the period of life during 309
which the dental tissues have been mineralised.29
Thus, it is worth noticing that the sampling year 310
(in this case equalling death of the animal) does not represent the year of Hg exposure or 311
accumulation for this animal, but terminates a lifetime period of exposure. 312
A decrease in Hg levels over time was found in the teeth of polar bears from Svalbard. The absence 313
of temporal trends in 15
N and 13
C values over the four studied decades did not support the 314
hypothesis of a temporal variation in feeding or foraging habits, but did mostly point towards a 315
reduction in environmental Hg exposure. A temporal decrease in Hg concentrations has been 316
observed previously in polar bear hair from East Greenland between 1973 and 2001. This was 317
explained by reduced general environmental Hg levels attributed to a reduction in Hg emissions 318
from European and North American sources.12
In addition, our results are also in agreement with 319
previous investigations on Hg content in human deciduous teeth from Norway, which described a 320
decreasing time trend of the dental Hg levels from the 1970s to the 1990s likely reflecting a 321
decrease in environmental Hg burden in Norway.60
322
The atmospheric transport is the main pathway for Hg to reach the Arctic region,5 and Svalbard area 323
seems to be under the influence of wind flows from Eastern North America, Europe and Russia.61
324
Mercury emissions have been reported as decreasing substantially from the North American, 325
European and Russian sources in the 1990s, due to a general diminution of industrial activities and 326
consumption of raw materials.62-64
Although the processes between Hg emissions from a source and 327
its accumulation by organisms are long and complex, changes in dental Hg concentrations over time 328
hal-0
0647
260,
ver
sion
1 -
1 D
ec 2
011

12
in Svalbard polar bears are likely to be explained by a decrease in emissions of this metal from 329
remote sources and subsequent transport and delivery by the winds to the Svalbard ecosystem. 330
331
Conclusion 332
Teeth can provide long term elemental and isotopic composition and important knowledge on 333
lifetime dietary and contaminant exposure of the studied animals. However, biological factors like 334
age are important to investigate, when using dental tissues to assess temporal trends of Hg. Indeed, 335
age seems to have a great influence on Hg concentrations and in addition, it seems necessary to 336
determine if the studied species develops its permanent dentition at the foetal or postnatal stage for 337
a better understanding of the relation age-Hg concentrations. In our study, the combined use of the 338
elemental and isotopic measurements allowed to eliminate feeding behavior as a factor of influence 339
on Hg temporal patterns. Thus, the temporal trend observed in the teeth of polar bears from 340
Svalbard over the recent four decades seemed to reflect the decrease in the deposition and 341
subsequent bioaccumulation of Hg in Svalbard ecosystem, following the decrease in Hg emissions 342
to the atmosphere from Europe and North America during the late 20th
century. 343
344
hal-0
0647
260,
ver
sion
1 -
1 D
ec 2
011

13
Acknowledgements 345
We greatly acknowledge Carine Churlaud from the Centre Commun d’Analyses (La Rochelle, 346
France), Gert Asmund, Sigga Joensen and Lene Bruun from the NERI for their valuable input on 347
the Hg analysis, and Pierre Richard, Benoît Lebreton and Gaël Guillou from LIENSs (UMR 6250 348
CNRS-La Rochelle University, France) for their advice and contribution on the stable isotope 349
analysis. We also would like to thank Thea Bechshøft from NERI for her help regarding the 350
samples. We are grateful to Peter Outridge, Canadian Geological survey and Michael Goodsite, 351
National Environmental Research Institute (NERI, Roskilde, Denmark) for advice and discussion 352
underway. This study was partly financed by The Dancea Programme, KVUG (Kommissionen for 353
Videnskabelige Undersøgelser i Grønland) and the Prince Albert II Foundation. Finally, the Poitou-354
Charentes region and Fund M.L. Furnestin-Faure did support financially the PhD research. 355
356
hal-0
0647
260,
ver
sion
1 -
1 D
ec 2
011

14
References 357
1 S. E. Lindberg, S. Brooks, C. J. Lin, K Scott, T. Meyers, L. Chambers, M. R. Landis and R. 358
Stevens, Water Air Soil Poll., 2001, 295-302. 359
2 P. A. Ariya, A. P. Dastoor, M. Amyot, W. H. Schroeder, L. Barrie, K. Anlauf, F. Raofie, A. 360
Ryzhkov, D. Davignon, J. Lalonde and A. Steffen, Tellus Series B-Chemical and Physical 361
Meteorology, 2004, 56, 397-403. 362
3 G. Stern, L. Loseto, R. Macdonald, F. Wang, C. Zdanowicz, P. Outridge, A. Cole, J. Chételat, H. 363
Hintelmann and A. Steffen, in AMAP Assessment 2011: Mercury in the Arctic. Arctic Monitoring 364
and Assessment Programme (AMAP), Oslo, Norway, 2011, pp. 67-83. 365
4 L. Atwell, K. A. Hobson and H. E. Welch, Can. J. Fish and Aquat. Sci., 1998, 55, 1114-1121. 366
5 AMAP, in AMAP Assessment 2002: Heavy metals in the Arctic, Arctic Monitoring and 367
Assessment Programme (AMAP), Oslo, Norway, 2005. 368
6 E. W. Born, A. Renzoni and R. Dietz, Polar Res., 1991, 9, 113-130. 369
7 B. M. Braune, R. J. Norstrom, M. P. Wong, B. T. Collins and J. Lee, Sci. Total Environ., 1991, 370
100, 283-299. 371
8 R. Dietz, E. W. Born, C. T. Agger and C. O. Nielsen, Polar Biol., 1995, 15, 175-185. 372
9 R. Dietz, F. Riget and E. W. Born, Sci. Total Environ., 2000, 245, 25-47. 373
10 G. Norheim, J. U. Skaare and O. Wiig, Environ. Pollut., 1992, 77, 51-57. 374
11 S. A. Rush, K. Borga, R. Dietz, E. W. Born, C. Sonne, T. Evans, D. C. G. Muir, R. J. Letcher, R. 375
J. Norstrom and A. T. Fisk, Environ. Pollut., 2008, 153, 618-626. 376
12 R. Dietz, F. Riget, E. W. Born, C. Sonne, P. Grandjean, M. Kirkegaard, M. T. Olsen, G. 377
Asmund, A. Renzoni, H. Baagoe and C. Andreasen, Environ. Sci. Technol., 2006, 40, 1120-1125. 378
13 R. Dietz, E. W. Born, F. Rigét, A. Aubail, C. Sonne, R. Drimmie and N. Basu, Environ. Sci. 379
Technol., 2011, 45, 1458-1465. 380
14 R. D. P. Eaton and J. P. Farant, Arctic, 1982, 35, 422-425. 381
15 T. W. Horton, J. D. Blum, Z. Xie, M. Hren and C. P. Chamberlain, Polar Res., 2009, 28, 443-382
454. 383
16 T. Cardona-Marek, K. K. Knott, B. E. Meyer and T. M. O'Hara, Environ. Toxicol. Chem., 2009, 384
28, 1416-1424. 385
17 WHO, IPCS/International Programme on Chemical Safety, WHO (World Health Organization), 386
Environmental Health Criteria 101, Geneva, 1990. 387
18 N. Miyazaki, in Encyclopedia of marine mammals, ed. W. F. Perrin, B. Würsig and J. G. M. 388
Thewissen, Academic Press, 2002, pp. 1227-1232. 389
19 R. Eide, G. B. Wesenberg and G. Fosse, Scand. J. Dent. Res., 1993, 101, 1-4. 390
20 H. M. Tvinnereim, R. Eide and T. Riise, Sci. Total Environ., 2000, 255, 21-27. 391
hal-0
0647
260,
ver
sion
1 -
1 D
ec 2
011
15
21 R. Eide and G. R. Wesenberg, Environ. Res., 1993, 61, 212-222. 392
22 P. M. Outridge, R. Wagemann and R. McNeely, Environ. Toxicol. Chem., 2000, 19, 1517-1522. 393
23 P. M. Outridge, K. A. Hobson, R. McNeely and A. Dyke, Arctic, 2002, 55, 123-132. 394
24 P. M. Outridge, K. A. Hobson and J. Savelle, Sci. Total Environ., 2009, 407, 6044-6051. 395
25 A. Aubail, R. Dietz, F. Rigét, B. Simon-Bouhet and F. Caurant, Sci. Total Environ., 2010, 408, 396
5137-5146. 397
26 B. J. Peterson and B. Fry, Annu. Rev. Ecol. Syst., 1987, 18, 293-320. 398
27 B. S. Chisholm, D. E. Nelson and H. P. Schwarcz, Science, 1982, 216, 1131-1132. 399
28 M. Minagawa and E. Wada, Geochim. Cosmochim. Ac., 1984, 48, 1135-1140. 400
29 P. M. Outridge, in Mercury: Sources, Measurements, Cycles and Effects, Mineralogical 401
Association of Canada, Ottawa, 2005, ch. 11, pp. 217-234. 402
30 I. Stirling, in Encyclopedia of marine mammals, ed. W. F. Perrin, B. Würsig and J. G. M. 403
Thewissen, Academic Press, 2002, pp. 945-948. 404
31 S. J. Iverson, S. Stirling and S. L. Lang, in Top Predators in Marine Ecosystems, ed. I. L. Boyd, 405
S. Wanless and C. J. Camphuysen, Cambridge University Press, 2006, pp. 98-117. 406
32 M. A. McKinney, R. J. Letcher, J. Aars, E. W. Born, M. Branigan, R. Dietz, T. J. Evans, G. W. 407
Gabrielsen, D. C. G. Muir, E. Peacock and C. Sonne, Environ. Sci. Technol., 2011, 45 (3), 896-902. 408
33 A. E. Derocher, O. Wiig and M. Andersen, Polar Biol., 2002, 25, 448-452. 409
34 W. Calvert and I. Stirling, Bears - Their Biology and Management, 1990, 8, 351-356. 410
35 L. F. Lowry, J. J. Burns and R. R. Nelson, Can. Field-Nat., 1987, 101, 141-146. 411
36 A. E. Derocher, O. Wiig and G. Bangjord, Polar Biol., 2000, 23, 675-678. 412
37 K. L. Laidre, I. Stirling, L. F. Lowry, O. Wiig, M. P. Heide-Jorgensen and S. H. Ferguson, Ecol. 413
Appl, 2008, 18, 97-125. 414
38 K. M. Kovacs, C. Lydersen, J. E. Overland and S. E. Moore, Mar. Biodiv., 2011, 41(1), 181-194. 415
39 R. Dietz, M. P. Heide-Jørgensen, T. Harkonen, J. Teilmann and N. Valentin, Sarsia, 1991, 76, 416
17-21. 417
40 G. E. M. Hall and P. Pelchat, Analyst, 1997, 122 (9), 921-924. 418
41 J. H. Zar, in Biostatistical analysis: International edition. Pearson Education, 2009. 419
42 R Development Core Team, in R: A language and environment for statistical computing. 420
Foundation for Statistical Computing, Vienna, Austria, 2008, ISBN 3-900051-07-0, URL 421
http://www.R-project.org. 422
43 M. A. Ramsay and I. Stirling, J Zool, Lond, 1988, 214, 601-634. 423
44 A. Aguilar, A. Borrell and T. Pastor, J. Cetacean Res. Manag. Special Issue, 1999, 1, 83-116. 424
hal-0
0647
260,
ver
sion
1 -
1 D
ec 2
011
16
45 T. J. Brookens, J. T. Harvey and T. M. O’Hara, Sci. Total Environ., 2007, 372, 676–692. 425
46 T. J. Brookens, T. M. O’Hara, R. J. Taylor, G. R. Bratton and J. T. Harvey, Mar. Poll. Bull., 426
2008, 56, 27-41. 427
47 R. Dietz, N. Basu, B. Braune, T. O’Hara, T. Scheuhammer and C. Sonne, in AMAP Assessment 428
2011: Mercury in the Arctic. Arctic Monitoring and Assessment Programme (AMAP), Oslo, 429
Norway, 2011, pp.113-137. 430
48 R. Dietz, P. Paludan-Müller, C. T. Agger and C. O. Nielsen, NAMMCO Scientific contributions, 431
1998, 1, 242-273. 432
49 R. J. Norstrom, R. E. Sweinsberg and B. T. Collins, Sci. Total Environ., 1986, 48, 195-212. 433
50 F. Riget, D. Muir, M. Kwan, T. Savinova, M. Nyman, V. Woshner and T. O'Hara, Sci. Total 434
Environ., 2005, 351, 312-322. 435
51 I. Stirling and E. H. McEwan, Can. J. Zool., 1975, 53, 1021-1027. 436
52 P. Johansen, D. Muir, G. Asmund and F. Riget, Sci. Total Environ., 2004, 331, 189-206. 437
53 A. Kinghorn, M. M. Humphries, P. Outridge and H. M. Chan, Sci. Total Environ., 2008, 402, 438
43-50. 439
54 B. E. Stewart, S. Innes and R. E. A. Stewart, Mar. Mamm. Sci., 1998, 14, 221-231. 440
55 A. A. Hohn, in Encyclopedia of marine mammals, ed. W. F. Perrin, B. Würsig and J. G. M. 441
Thewissen, Academic Press, 2002, pp. 6-13. 442
56 D. E. Kenny and C. Bickel, International Zoo Yearbook, 2005, 39, 205-214. 443
57 R. Dietz, F. Riget, K. A. Hobson, M. P. Heide-Jorgensen, P. Moller, M. Cleeman, J. de Boer and 444
M. Glasius, Sci. Total Environ., 2004, 331, 83-105. 445
58 K. A. Hobson and J. L. Sease, Mar. Mamm. Sci., 1998, 14, 116-129. 446
59 S. C. Polischuk, K. A. Hobson and M. A. Ramsay, Can. J. Zool., 2001, 79, 499-511. 447
60 H. M. Tvinnereim, R. Eide and G. R. Fosse, International Conference on Human Health Effects 448
of Mercury Exposure, Faroe Islands, 1997. 449
61 R. W. Macdonald, T. Harner, J. Fyfe, H. Loeng and T. Weingartner, in AMAP, Assessment 2002: 450
The Influence of Global Change on Contaminant Pathways to, within, and from the Arctic. Arctic 451
Monitoring and Assessment Programme (AMAP), Oslo, Norway, 2003. 452
62 AMAP/UNEP, in Technical Background Report to the Global Atmospheric Mercury 453
Assessment, Arctic Monitoring and Assessment Programme/UNEP Chemicals Branch, 2008 454
(http://www.chem.unep.ch/mercury/Atmospheric_Emissions/Technical_background_report.pdf). 455
63 J. Munthe, M. Goodsite, T. Berg, J. Chételat, A. Cole, A. Dastoor, T. Douglas, D. Durnford, R. 456
Macdonald, D. Muir, P. Outridge, J. Pacyna, A. Ryzhkov, H. Skov, A. Steffen, K. Sundseth, O. 457
Travnikov, I. Wängberg and S. Wilson, in AMAP Assessment 2011: Mercury in the Arctic. Arctic 458
Monitoring and Assessment Programme (AMAP), Oslo, Norway, 2011, pp. 9-44. 459
64 E. G. Pacyna and J. M. Pacyna, Water Air Soil Pollut., 2002, 137, 149-165. 460
461
hal-0
0647
260,
ver
sion
1 -
1 D
ec 2
011
17
Fig. 1 Map of Svalbard (Norway), where polar bear samples have been collected 462
463
464
hal-0
0647
260,
ver
sion
1 -
1 D
ec 2
011
18
Fig. 2 Age (years) vs Hg concentrations (in ng/g dw) (a), vs 15
N values (in ‰) (b) and vs 13
C 465
values (in ‰) (c) in teeth of polar bears from Svalbard, 1964-1966. The smoothing line (robust, 466
locally weighted scatterplot smoothing system based on the LOWESS algorithm) represents the 467
fitted non-linear trend of the values. Note that y axis is a logarithmic scale on Fig. 2a 468
469
470
a
b
c
hal-0
0647
260,
ver
sion
1 -
1 D
ec 2
011
19
Fig. 3 Year vs dental Hg concentrations (ng/g dw) (a), vs 15
N values (b) and vs 13
C values (c) in 471
polar bears from Svalbard, aged from 3 to 10 years old. Smoothing lines (robust, locally weighted 472
scatterplot smoothing system based on the LOWESS algorithm) represent the fitted non-linear trend 473
of the values 474
475
476 477
hal-0
0647
260,
ver
sion
1 -
1 D
ec 2
011

20
Table 1 Sex, age and numbers of Svalbard polar bears for both sub-groups (individuals collected 478
from 1964 to 1966, and individuals aged from 3 to 10 years old) used to test the age effect and to 479
investigate the temporal trend, respectively, and for all individuals 480 481
Period Male Female Unknown sex All
n Mean age ± sd n Mean age ± sd n Mean age ± sd n Mean age ± sd
1964-1966 32 11.0 ± 7.2 22 9.9 ± 5.0 4 12.5 ± 15.2 58 10.7 ± 7.1
3-10 years old 19 6.6 ± 2.0 13 6.2 ± 2.6 5 6.6 ± 1.9 37 6.5 ± 2.2
All 42 9.5 ± 7.3 32 8.4 ± 5.3 13 10.1 ± 10.0 87 9.2 ± 7.1 482 483
Table 2 Analytical data for the customised reference material (units in ng/g dw), number of 484
analyses (n), Hg concentration mean value, its standard deviation (sd) and the relative sd 485 486
Hg concentration
n mean sd Relative sd %
AMA CCA 8 96.3 3.5 3.7
AMA NERI 10 105 6 5.7
FIMS NERI 5 106.3 3.6 3.4
Measured concentration * 23 102.3 6.4 6.3
Theoretical concentration ** 1 100 4.1 4.1 * The measured concentration is the average of the Hg concentrations determined by the three sequences of analyses.
** The theoretical concentration is based on the DOLT-3 certified concentration in Hg.
487
488
Table 3 Mercury concentrations (units in ng/g dw) and isotopic ratio of carbon and nitrogen (‰) 489
range, median and mean ± standard deviation in teeth of polar bears from Svalbard (n = 87) 490 491
Measurements Range Median Mean ± sd
Hg 0.6 - 72.3 4.9 6.0 ± 8.3
15
N 17.7 - 21.8 19.6 19.6 ± 0.7
13
C -17.4 - (-)14.8 -15.8 -15.8 ± 0.4 492
493
Table 4 Correlation matrix of Spearman's correlation* coefficient between age, stable isotopes 494
values and Hg concentrations (using log-transformed Hg values) 495
496
Variable Age Log Hg
Log Hg 0.50 (p < 0.001) -
15
N -0.02 (p = 0.90) 0.11 (p = 0.29)
13
C -0.11 (p = 0.42) 0.01 (p = 0.91) * Spearman’s correlations were tested on all individuals excluding the outlier of 72.3 ng/g dw (n = 86). Moreover, when the correlation
involved the age factor, only individuals from the 1964-1966 period were selected (n = 57).
497
hal-0
0647
260,
ver
sion
1 -
1 D
ec 2
011