Exploration on nano–composite fumed silica–based composite polymer electrolytes with doping of...
10
Exploration on nano-composite fumed silica-based composite polymer electrolytes with doping of ionic liquid S. Ramesh ⁎, Chiam-Wen Liew Centre for Ionics University Malaya, Department of Physics, Faculty of Science, University of Malaya, Lembah Pantai, 50603 Kuala Lumpur, Malaysia abstract article info Article history: Received 15 September 2011 Received in revised form 29 December 2011 Available online 24 January 2012 Keywords: Composite polymer electrolytes; HATR–FTIR; Frequency dependence–ionic conductivity; Dielectric constant Fumed silica (SiO 2 )-based composite polymer electrolytes were prepared by means of solution casing technique. Horizontal attenuated total reflectance-Fourier Transform Infrared (HATR-FTIR) study shows the complexation between polymer matrix and SiO 2 . The highest ionic conductivity of (4.11 ± 0.01) × 10 −3 Scm −1 is achieved upon inclusion of 8 wt.% of SiO 2 . Three different regions have been observed in the frequency dependence–ionic conductivity study. The conductivity rises sharply with frequency at low frequency regime. It is followed by a fre- quency independent plateau region and sharp decrease in the conductivity at high frequency range. The dielectric permittivity (ε ' ) and dielectric loss (ε " ) are decreased with increasing the frequency. This phenomenon is mainly attributed to the electrode polarization effect. The formation of electrical double layer has been proven in these di- electric permittivity studies. This indicates the non-Debye properties of the nano-composite polymer electrolytes. © 2012 Elsevier B.V. All rights reserved. 1. Introduction Ionic liquid-based gel polymer electrolytes are superior materials in electrochemical devices such as supercapacitors, electrochromic win- dows (ECWs), dye-sensitized solar cells (DSSCs), batteries, chemical sensors and electromechanical actuator systems as well as fuel cells [1,2]. Room temperature ionic liquids (RTILs) are alternative additives to replace plasticizer. It is because plasticizer exhibits high vapor pres- sure, low flash point, small working voltage range and narrow electro- chemical window [2]. Other features are slow evaporation, poor interfacial stability with lithium electrodes, and decreases in thermal, electrical and electrochemical stabilities as well [3,4]. RTILs have attracted the attention of many researchers in the area of electrical power generation and storage systems because of their intrinsic charac- teristics such as wide electrochemical window (up to 6 V), higher ionic conductivity and excellent safety performance. Since they have negligi- ble vapor pressure, thus they are able to improve the safety performance and act as a potential substitution for volatile organic solvent [1]. They also possess some unique properties, for example, non-volatility, non- toxicity, and non-flammability as well as excellent chemical, thermal, mechanical and electrochemical stabilities [5-9]. The reactions which re- quire high temperature are also able to be carried out as RTILs do not de- compose over a wide temperature range. RTILs have received an upsurge of interest in recent years due to its vast amounts of applications such as catalytic cracking of polyeth- ylene and radical polymerization. From green chemistry view point, ionic liquids are well known as environmentally friendly green sol- vent. It has widely been used as recyclable solvent for liquid–liquid extraction processes in biocatalysis field and in organometallic reac- tions [1]. RTILs remain in liquid state at room temperature without presence of any solvent. They are generally known as room tempera- ture molten salt which comprised of bulky cations and anions. The physical properties of RTILs such as melting point, viscosity, density and hydrophobicity can be altered by changing the nature of their cations and anions [1]. However, ionic liquid-based gel polymer electrolytes have some limitations, for instance, poor dimensional and mechanical stabilities. Therefore, inorganic reinforcement fillers are introduced in order to improve the mechanical stability and ionic conductivity. It ultimately leads to the formation of composite polymer electrolytes (CPEs). Nano-sized fumed silica (SiO 2 ) is a versatile candidate as inorganic inert filler because it has larger surface contact area and thus en- hances the volume fraction of amorphous proportion of polymer sys- tems, thereby increases ionic conductivity. These nano-composite polymer electrolytes (NCPEs) offer some advantages such as im- proved lithium transportation, excellent interfacial stability with branched primary structure and high ability to tailor the surface func- tionalities by forming native surface onto fumed silica, which is sila- nol (Si–OH) [10,11]. The physical gel appearance is obtained through formation of hydrogen bonding and Van der Waals attraction forces as the fumed silica is hydrophilic [12]. Several developments had been accomplished onto the composite polymer electrolytes. Ahmad and co-workers found out that disper- sion of 2 wt.% of SiO 2 had achieved the maximum ionic conductivity of mScm −1 with poly (methyl methacrylate) (PMMA) as host poly- mer, lithium triflate as salt and propylene carbonate (PC) as Journal of Non-Crystalline Solids 358 (2012) 931–940 ⁎ Corresponding author. Tel.: + 60 3 7967 4391; fax: + 60 3 7967 4146. E-mail address: [email protected] (S. Ramesh). 0022-3093/$ – see front matter © 2012 Elsevier B.V. All rights reserved. doi:10.1016/j.jnoncrysol.2012.01.005 Contents lists available at SciVerse ScienceDirect Journal of Non-Crystalline Solids journal homepage: www.elsevier.com/ locate/ jnoncrysol
-
Upload
independent -
Category
Documents
-
view
0 -
download
0
Transcript of Exploration on nano–composite fumed silica–based composite polymer electrolytes with doping of...
Journal of Non-Crystalline Solids 358 (2012) 931–940
Contents lists available at SciVerse ScienceDirect
Journal of Non-Crystalline Solids
j ourna l homepage: www.e lsev ie r .com/ locate / jnoncryso l
Exploration on nano-composite fumed silica-based composite polymer electrolyteswith doping of ionic liquid
S. Ramesh ⁎, Chiam-Wen LiewCentre for Ionics University Malaya, Department of Physics, Faculty of Science, University of Malaya, Lembah Pantai, 50603 Kuala Lumpur, Malaysia
⁎ Corresponding author. Tel.: +60 3 7967 4391; fax:E-mail address: [email protected] (S. Rames
0022-3093/$ – see front matter © 2012 Elsevier B.V. Alldoi:10.1016/j.jnoncrysol.2012.01.005
a b s t r a c t
a r t i c l e i n f oArticle history:Received 15 September 2011Received in revised form 29 December 2011Available online 24 January 2012
Keywords:Composite polymer electrolytes;HATR–FTIR;Frequency dependence–ionic conductivity;Dielectric constant
Fumed silica (SiO2)-based composite polymer electrolytes were prepared by means of solution casing technique.Horizontal attenuated total reflectance-Fourier Transform Infrared (HATR-FTIR) study shows the complexationbetween polymer matrix and SiO2. The highest ionic conductivity of (4.11±0.01)×10−3 Scm−1 is achievedupon inclusion of 8 wt.% of SiO2. Three different regions have been observed in the frequency dependence–ionicconductivity study. The conductivity rises sharply with frequency at low frequency regime. It is followed by a fre-quency independent plateau region and sharp decrease in the conductivity at high frequency range. The dielectricpermittivity (ε') and dielectric loss (ε") are decreased with increasing the frequency. This phenomenon is mainlyattributed to the electrode polarization effect. The formation of electrical double layer has been proven in these di-electric permittivity studies. This indicates the non-Debye properties of the nano-composite polymer electrolytes.
© 2012 Elsevier B.V. All rights reserved.
1. Introduction
Ionic liquid-based gel polymer electrolytes are superior materials inelectrochemical devices such as supercapacitors, electrochromic win-dows (ECWs), dye-sensitized solar cells (DSSCs), batteries, chemicalsensors and electromechanical actuator systems as well as fuel cells[1,2]. Room temperature ionic liquids (RTILs) are alternative additivesto replace plasticizer. It is because plasticizer exhibits high vapor pres-sure, low flash point, small working voltage range and narrow electro-chemical window [2]. Other features are slow evaporation, poorinterfacial stability with lithium electrodes, and decreases in thermal,electrical and electrochemical stabilities as well [3,4]. RTILs haveattracted the attention of many researchers in the area of electricalpower generation and storage systems because of their intrinsic charac-teristics such as wide electrochemical window (up to 6 V), higher ionicconductivity and excellent safety performance. Since they have negligi-ble vapor pressure, thus they are able to improve the safety performanceand act as a potential substitution for volatile organic solvent [1]. Theyalso possess some unique properties, for example, non-volatility, non-toxicity, and non-flammability as well as excellent chemical, thermal,mechanical and electrochemical stabilities [5-9]. The reactions which re-quire high temperature are also able to be carried out as RTILs do not de-compose over a wide temperature range.
RTILs have received an upsurge of interest in recent years due toits vast amounts of applications such as catalytic cracking of polyeth-ylene and radical polymerization. From green chemistry view point,
+60 3 7967 4146.h).
rights reserved.
ionic liquids are well known as environmentally friendly green sol-vent. It has widely been used as recyclable solvent for liquid–liquidextraction processes in biocatalysis field and in organometallic reac-tions [1]. RTILs remain in liquid state at room temperature withoutpresence of any solvent. They are generally known as room tempera-ture molten salt which comprised of bulky cations and anions. Thephysical properties of RTILs such as melting point, viscosity, densityand hydrophobicity can be altered by changing the nature of theircations and anions [1].
However, ionic liquid-based gel polymer electrolytes have somelimitations, for instance, poor dimensional and mechanical stabilities.Therefore, inorganic reinforcement fillers are introduced in order toimprove the mechanical stability and ionic conductivity. It ultimatelyleads to the formation of composite polymer electrolytes (CPEs).Nano-sized fumed silica (SiO2) is a versatile candidate as inorganicinert filler because it has larger surface contact area and thus en-hances the volume fraction of amorphous proportion of polymer sys-tems, thereby increases ionic conductivity. These nano-compositepolymer electrolytes (NCPEs) offer some advantages such as im-proved lithium transportation, excellent interfacial stability withbranched primary structure and high ability to tailor the surface func-tionalities by forming native surface onto fumed silica, which is sila-nol (Si–OH) [10,11]. The physical gel appearance is obtainedthrough formation of hydrogen bonding and Van der Waals attractionforces as the fumed silica is hydrophilic [12].
Several developments had been accomplished onto the compositepolymer electrolytes. Ahmad and co-workers found out that disper-sion of 2 wt.% of SiO2 had achieved the maximum ionic conductivityof mScm−1 with poly (methyl methacrylate) (PMMA) as host poly-mer, lithium triflate as salt and propylene carbonate (PC) as
932 S. Ramesh, C.-W. Liew / Journal of Non-Crystalline Solids 358 (2012) 931–940
plasticizer. These CPEs are homogeneous and exhibit wider electro-chemical stability with excellent rheological properties at ambienttemperature [13]. Organic–inorganic hybrid membranes based onpoly (vinylidene fluoride–co–hexafluoropropylene) (PVdF–HFP)/sul-fosuccinic acid (SSA) were fabricated with different nano-sized silicaparticles. The proton conductivity increases with SiO2 loadings andthen reaches the highest proton conductivities of 10−2 Scm−1. Thedecrease in the filler size induces to the formation of effective path-way of polymer–filler interface and hence promotes the proton con-ductivity of the polymer membranes [14]. Composite polymerelectrolyte containing methylsisesquioxane (MSQ) filler and 1-butyl-3-methyl-imidazolium tetrafluoroborate (BMImBF4) ionic liq-uid in poly (2-hydroxyethyl methacrylate) (PHEMA) matrix hadalso been prepared by free radical polymerization of HEMAmacromer[15]. In this study, MSQ filler improves the mechanical strength of thepolymer matrix and increases ionic conductivity by providing the ionconductive pathway.
In the initial study of poly(ethylene oxide) (PEO) with various in-organic lithium salts, PEO failed to exhibit high ionic conductivity atambient temperature due to the higher degree of crystallization. Anamorphous polymer, poly(methyl methacrylate) (PMMA) was usedin order to attain high ionic conductivity at ambient temperature.Highly flexible polymer backbone is also another reason for choosingthis material as host polymer in this present work. However, it ex-hibits brittle property especially under a loaded force. Therefore, me-chanical stiffener, PVC is being introduced to overcome the poormechanical strength of PMMA. The attempt of selecting lithium bis(trifluoromethanesulfonyl) imide (LiTFSI) as doping salt in this pro-ject is due to its extensive delocalized electrons in TFSI anion whichcauses a low tendency for coordination with lithium cations. Hence,it enhances the lithium transportation and eventually leads to an in-crease in ionic conductivity. In addition, LiTFSI is a promising candidatedue to its non-corrosive behavior towards electrodes andwider electro-chemical stability with excellent thermal stability. Ionic liquidBmImTFSI was added into the polymer network to improve the ionicconductivity. BmImTFSI was selected due to its inherent properties. 1-butyl-3-methylimidazolium (BmIm+) is an appealing cation becauseof its favorable properties and ease to gather abundant information.On the contrary, TFSI anion was chosen because of its bulky structurewhich would enhance the electrochemical stability. Besides, high flexi-bility of this anion shows two low energy conformations and henceaccerelates the ionic dissociation.
2. Experimental
2.1. Materials
PMMA with an average molecular weight of 350000 (Aldrich),high molecular weight of poly(vinyl chloride), PVC (Fluka), inorganicdopant salt lithium bis(trifluoromethanesulfonyl) imide (LiTFSI)(Fluka), ionic liquid 1-butyl-3-methylimidazolium bis(trifluoro-methylsulfonyl imide) (BmImTFSI) (Sigma-Aldrich), nano-sized
Table 1Ionic conductivities of nano–sized SiO2 based composite polymer electrolytes and their des
Composition of (PMMA–PVC–LiTFSI–BmImTFSI):SiO2 (wt.%)
PMMA PVC LiTFSI BmImTFSI
19.60±0.03 8.40±0.01 12.00±0.01 60.00±0.0219.21±0.02 8.23±0.02 11.76±0.01 58.80±0.0218.82±0.01 8.06±0.02 11.52±0.02 57.60±0.0118.43±0.02 7.89±0.01 11.28±0.01 56.40±0.0318.04±0.01 7.72±0.01 11.04±0.03 55.20±0.0117.65±0.01 7.55±0.02 10.80±0.02 54.00±0.02
inorganic filler SiO2 with the particle size 7 nm (Sigma-Aldrich) andsolvent tetrahydrofuran (THF) (J.T.Baker) were used without furtherpurification in this study. The nano-composite polymer electrolyteswere prepared by solution casting technique.
2.2. Preparation of thin films
Prior to the preparation of the polymer electrolytes, LiTFSI wasdried at 100 °C for 1 hour to remove any trace amounts of water inthe material. The incorporation of SiO2 was expressed as weightratio and its designation was tabulated in Table 1. Appropriateamounts of PMMA, PVC, LiTFSI, BmImTFSI and nano-sized SiO2 weredissolved in THF. In order to determine the systematic errors, the ac-curacy of digital weighing balance is focused. The measurement un-certainty from the calibration is ±0.0002 g, whereas the readability ofthe weighing balance is around 0.0001 g, which can be obtained fromthe guide book of the weighing balance. The solution was then stirredcontinuously for 24 hours at room temperature. The solution was thuscast on a glass Petri dish and allowed to evaporate slowly inside afume hood. Nano-composite polymer electrolytes were eventuallyformed in this study.
2.3. Characterizations
2.3.1. Ac-impedance spectroscopyThe prepared samples were subjected to ac-impedance spectros-
copy for data acquisition. The thicknesses of the thin films were mea-sured by using micrometer screw gauge, where the accuracy of themicrometer screw gauge of ±0.001 mm is considered as the system-atic error. Furthermore, the ionic conductivities of the samples weredetermined, by using HIOKI 3532-50 LCR HiTESTER, over a frequencyrange between 50 Hz and 1 MHz at ambient temperature. Sampleswere mounted on the holder with stainless steel (SS) blocking elec-trodes under spring pressure with the configuration of SS/SPE/ SS.The bulk ionic conductivity of polymer electrolytes is determined byusing the equation below:
σ ¼ ιRbA
ð1Þ
where l is the thickness (cm), Rbis bulk resistance (Ω) and A is theelectrolyte–electrode contact area (cm2). For frequency depen-dence–ionic conductivity studies, the ionic conductivity is expressedas illustrated as below:
σ ¼ GlA
ð2Þ
where G is the conductance (Siemens, S). The ionic conductivity inthis study is different from the bulk ionic conductivity because the ca-pacitance of electrical double layer and resistance of charge transferwould be counted in this ionic conductivity determination.
ignations.
Designations Ionic conductivity atambient temperature(Scm-1)
SiO2
0 CPE 0 (1.64±0.01)×10−4
2±0.01 CPE 1 (1.76±0.01)×10−4
4±0.01 CPE 2 (4.28±0.01)×10−4
6±0.01 CPE 3 (4.65±0.01)×10−4
8±0.01 CPE 4 (4.11±0.01)×10−3
10±0.01 CPE 5 (3.73±0.01)×10−3
SiO
O
O
OH
Si
OO
Si
O
O
O O
H HO
S CF3NSF3C
O
O
O
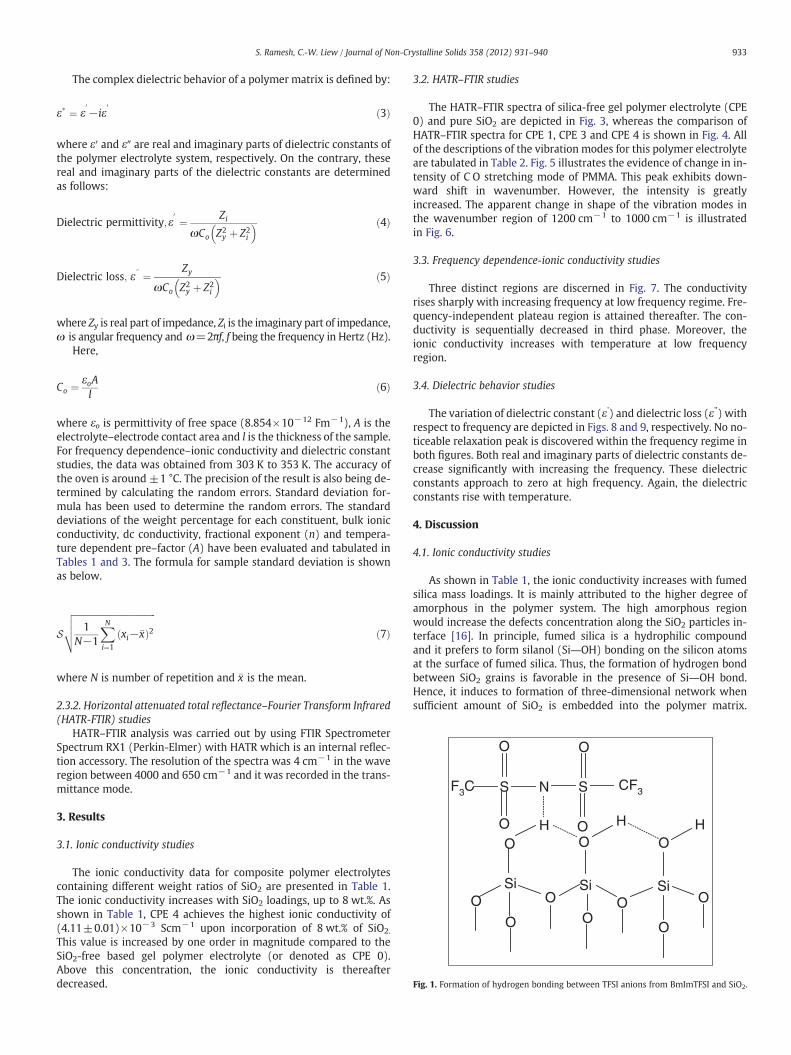
Fig. 1. Formation of hydrogen bonding between TFSI anions from BmImTFSI and SiO2.
933S. Ramesh, C.-W. Liew / Journal of Non-Crystalline Solids 358 (2012) 931–940
The complex dielectric behavior of a polymer matrix is defined by:
ε� ¼ ε0−iε
0ð3Þ
where ε′ and ε″ are real and imaginary parts of dielectric constants ofthe polymer electrolyte system, respectively. On the contrary, thesereal and imaginary parts of the dielectric constants are determinedas follows:
Dielectric permittivity;ε0¼ Zi
ωCo Z2y þ Z2
i
� � ð4Þ
Dielectric loss; ε} ¼ Zy
ωCo Z2y þ Z2
i
� � ð5Þ
where Zy is real part of impedance, Zi is the imaginary part of impedance,ω is angular frequency and ω=2πf, f being the frequency in Hertz (Hz).
Here,
Co ¼εoAl
ð6Þ
where εo is permittivity of free space (8.854×10⁻¹² Fm−1), A is theelectrolyte–electrode contact area and l is the thickness of the sample.For frequency dependence–ionic conductivity and dielectric constantstudies, the data was obtained from 303 K to 353 K. The accuracy ofthe oven is around ±1 °C. The precision of the result is also being de-termined by calculating the random errors. Standard deviation for-mula has been used to determine the random errors. The standarddeviations of the weight percentage for each constituent, bulk ionicconductivity, dc conductivity, fractional exponent (n) and tempera-ture dependent pre–factor (A) have been evaluated and tabulated inTables 1 and 3. The formula for sample standard deviation is shownas below.
Sffiffiffiffiffiffiffiffiffiffiffiffiffiffiffiffiffiffiffiffiffiffiffiffiffiffiffiffiffiffiffiffiffiffiffiffiffi1
N−1
XNi¼1
xi−�xð Þ2vuut ð7Þ
where N is number of repetition and �x is the mean.
2.3.2. Horizontal attenuated total reflectance–Fourier Transform Infrared(HATR-FTIR) studies
HATR–FTIR analysis was carried out by using FTIR SpectrometerSpectrum RX1 (Perkin-Elmer) with HATR which is an internal reflec-tion accessory. The resolution of the spectra was 4 cm−1 in the waveregion between 4000 and 650 cm−1 and it was recorded in the trans-mittance mode.
3. Results
3.1. Ionic conductivity studies
The ionic conductivity data for composite polymer electrolytescontaining different weight ratios of SiO2 are presented in Table 1.The ionic conductivity increases with SiO2 loadings, up to 8 wt.%. Asshown in Table 1, CPE 4 achieves the highest ionic conductivity of(4.11±0.01)×10−3 Scm−1 upon incorporation of 8 wt.% of SiO2.
This value is increased by one order in magnitude compared to theSiO2-free based gel polymer electrolyte (or denoted as CPE 0).Above this concentration, the ionic conductivity is thereafterdecreased.
3.2. HATR–FTIR studies
The HATR–FTIR spectra of silica-free gel polymer electrolyte (CPE0) and pure SiO2 are depicted in Fig. 3, whereas the comparison ofHATR–FTIR spectra for CPE 1, CPE 3 and CPE 4 is shown in Fig. 4. Allof the descriptions of the vibration modes for this polymer electrolyteare tabulated in Table 2. Fig. 5 illustrates the evidence of change in in-tensity of C O stretching mode of PMMA. This peak exhibits down-ward shift in wavenumber. However, the intensity is greatlyincreased. The apparent change in shape of the vibration modes inthe wavenumber region of 1200 cm−1 to 1000 cm−1 is illustratedin Fig. 6.
3.3. Frequency dependence-ionic conductivity studies
Three distinct regions are discerned in Fig. 7. The conductivityrises sharply with increasing frequency at low frequency regime. Fre-quency-independent plateau region is attained thereafter. The con-ductivity is sequentially decreased in third phase. Moreover, theionic conductivity increases with temperature at low frequencyregion.
3.4. Dielectric behavior studies
The variation of dielectric constant (ε') and dielectric loss (ε") withrespect to frequency are depicted in Figs. 8 and 9, respectively. No no-ticeable relaxation peak is discovered within the frequency regime inboth figures. Both real and imaginary parts of dielectric constants de-crease significantly with increasing the frequency. These dielectricconstants approach to zero at high frequency. Again, the dielectricconstants rise with temperature.
4. Discussion
4.1. Ionic conductivity studies
As shown in Table 1, the ionic conductivity increases with fumedsilica mass loadings. It is mainly attributed to the higher degree ofamorphous in the polymer system. The high amorphous regionwould increase the defects concentration along the SiO2 particles in-terface [16]. In principle, fumed silica is a hydrophilic compoundand it prefers to form silanol (Si―OH) bonding on the silicon atomsat the surface of fumed silica. Thus, the formation of hydrogen bondbetween SiO2 grains is favorable in the presence of Si―OH bond.Hence, it induces to formation of three-dimensional network whensufficient amount of SiO2 is embedded into the polymer matrix.
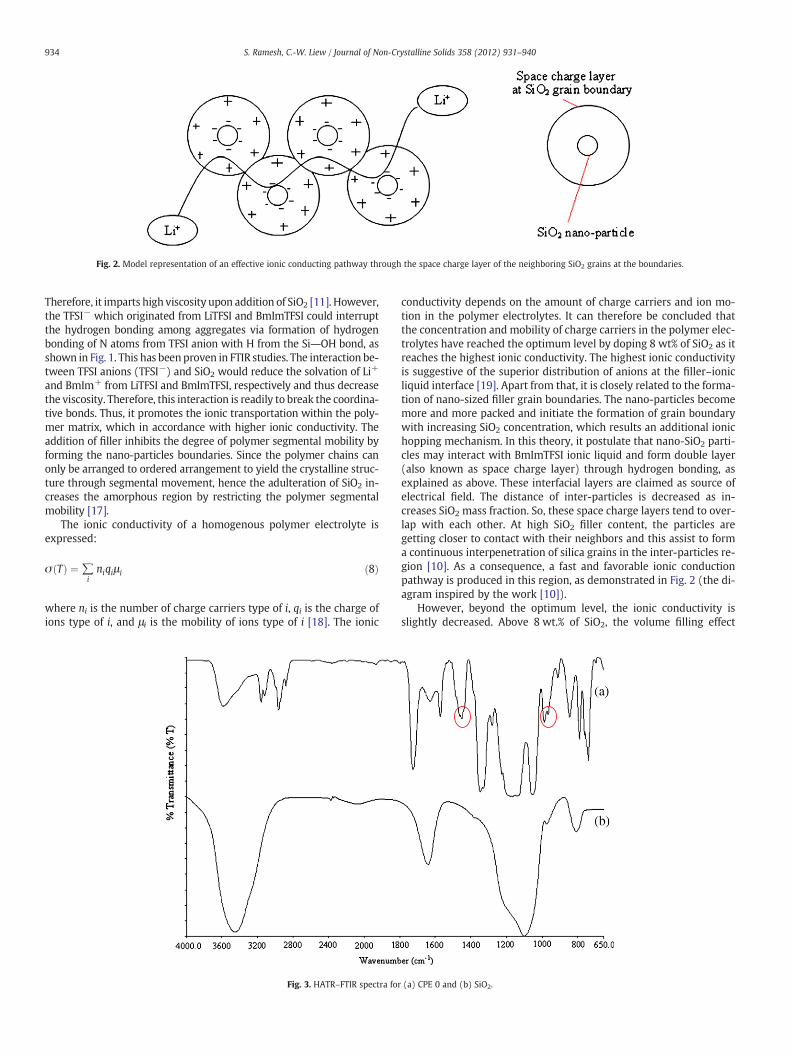
Fig. 2. Model representation of an effective ionic conducting pathway through the space charge layer of the neighboring SiO2 grains at the boundaries.
934 S. Ramesh, C.-W. Liew / Journal of Non-Crystalline Solids 358 (2012) 931–940
Therefore, it imparts high viscosity upon addition of SiO2 [11]. However,the TFSI− which originated from LiTFSI and BmImTFSI could interruptthe hydrogen bonding among aggregates via formation of hydrogenbonding of N atoms from TFSI anion with H from the Si―OH bond, asshown in Fig. 1. This has beenproven in FTIR studies. The interaction be-tween TFSI anions (TFSI−) and SiO2 would reduce the solvation of Li+
and BmIm+ from LiTFSI and BmImTFSI, respectively and thus decreasethe viscosity. Therefore, this interaction is readily to break the coordina-tive bonds. Thus, it promotes the ionic transportation within the poly-mer matrix, which in accordance with higher ionic conductivity. Theaddition of filler inhibits the degree of polymer segmental mobility byforming the nano-particles boundaries. Since the polymer chains canonly be arranged to ordered arrangement to yield the crystalline struc-ture through segmental movement, hence the adulteration of SiO2 in-creases the amorphous region by restricting the polymer segmentalmobility [17].
The ionic conductivity of a homogenous polymer electrolyte isexpressed:
σ Tð Þ ¼ ∑iniqiμ i ð8Þ
where ni is the number of charge carriers type of i, qi is the charge ofions type of i, and μi is the mobility of ions type of i [18]. The ionic
Fig. 3. HATR–FTIR spectra for
conductivity depends on the amount of charge carriers and ion mo-tion in the polymer electrolytes. It can therefore be concluded thatthe concentration and mobility of charge carriers in the polymer elec-trolytes have reached the optimum level by doping 8 wt% of SiO2 as itreaches the highest ionic conductivity. The highest ionic conductivityis suggestive of the superior distribution of anions at the filler–ionicliquid interface [19]. Apart from that, it is closely related to the forma-tion of nano-sized filler grain boundaries. The nano-particles becomemore and more packed and initiate the formation of grain boundarywith increasing SiO2 concentration, which results an additional ionichopping mechanism. In this theory, it postulate that nano-SiO2 parti-cles may interact with BmImTFSI ionic liquid and form double layer(also known as space charge layer) through hydrogen bonding, asexplained as above. These interfacial layers are claimed as source ofelectrical field. The distance of inter-particles is decreased as in-creases SiO2 mass fraction. So, these space charge layers tend to over-lap with each other. At high SiO2 filler content, the particles aregetting closer to contact with their neighbors and this assist to forma continuous interpenetration of silica grains in the inter-particles re-gion [10]. As a consequence, a fast and favorable ionic conductionpathway is produced in this region, as demonstrated in Fig. 2 (the di-agram inspired by the work [10]).
However, beyond the optimum level, the ionic conductivity isslightly decreased. Above 8 wt.% of SiO2, the volume filling effect
(a) CPE 0 and (b) SiO2.
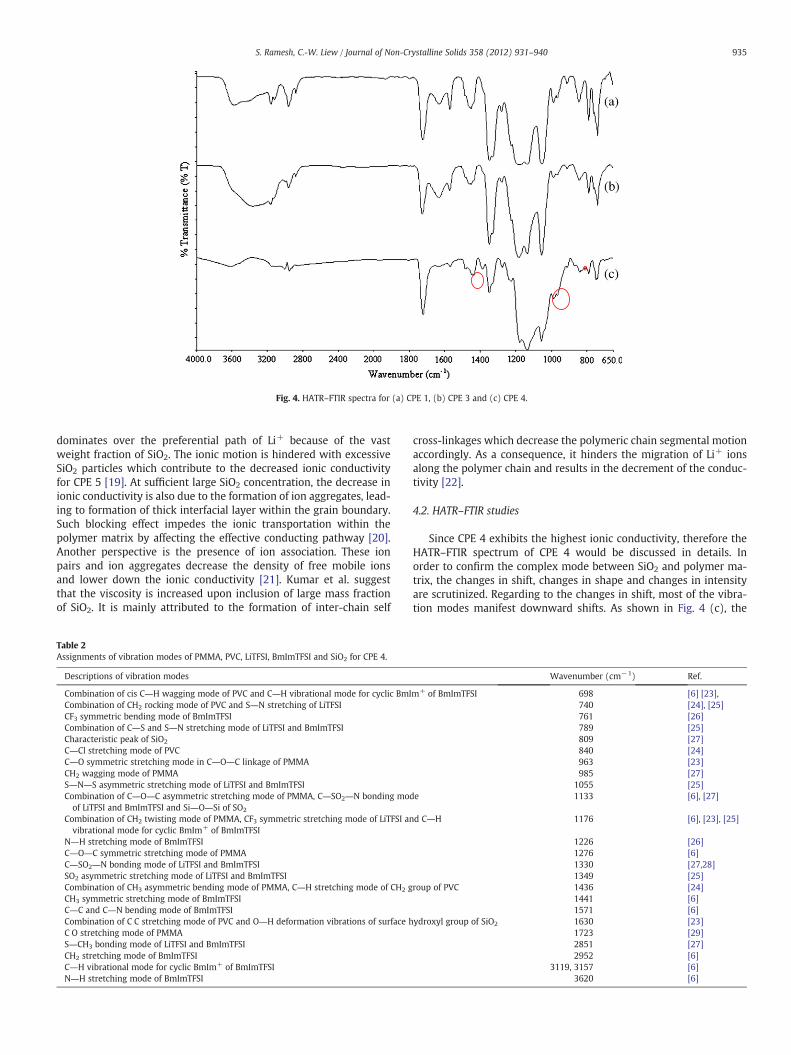
Fig. 4. HATR–FTIR spectra for (a) CPE 1, (b) CPE 3 and (c) CPE 4.
935S. Ramesh, C.-W. Liew / Journal of Non-Crystalline Solids 358 (2012) 931–940
dominates over the preferential path of Li+ because of the vastweight fraction of SiO2. The ionic motion is hindered with excessiveSiO2 particles which contribute to the decreased ionic conductivityfor CPE 5 [19]. At sufficient large SiO2 concentration, the decrease inionic conductivity is also due to the formation of ion aggregates, lead-ing to formation of thick interfacial layer within the grain boundary.Such blocking effect impedes the ionic transportation within thepolymer matrix by affecting the effective conducting pathway [20].Another perspective is the presence of ion association. These ionpairs and ion aggregates decrease the density of free mobile ionsand lower down the ionic conductivity [21]. Kumar et al. suggestthat the viscosity is increased upon inclusion of large mass fractionof SiO2. It is mainly attributed to the formation of inter-chain self
Table 2Assignments of vibration modes of PMMA, PVC, LiTFSI, BmImTFSI and SiO2 for CPE 4.
Descriptions of vibration modes
Combination of cis C―H wagging mode of PVC and C―H vibrational mode for cyclic BmICombination of CH2 rocking mode of PVC and S―N stretching of LiTFSICF3 symmetric bending mode of BmImTFSICombination of C―S and S―N stretching mode of LiTFSI and BmImTFSICharacteristic peak of SiO2
C―Cl stretching mode of PVCC―O symmetric stretching mode in C―O―C linkage of PMMACH2 wagging mode of PMMAS―N―S asymmetric stretching mode of LiTFSI and BmImTFSICombination of C―O―C asymmetric stretching mode of PMMA, C―SO2―N bonding modof LiTFSI and BmImTFSI and Si―O―Si of SO2
Combination of CH2 twisting mode of PMMA, CF3 symmetric stretching mode of LiTFSI anvibrational mode for cyclic BmIm+ of BmImTFSI
N―H stretching mode of BmImTFSIC―O―C symmetric stretching mode of PMMAC―SO2―N bonding mode of LiTFSI and BmImTFSISO2 asymmetric stretching mode of LiTFSI and BmImTFSICombination of CH3 asymmetric bending mode of PMMA, C―H stretching mode of CH2 gCH3 symmetric stretching mode of BmImTFSIC―C and C―N bending mode of BmImTFSICombination of C C stretching mode of PVC and O―H deformation vibrations of surface hC O stretching mode of PMMAS―CH3 bonding mode of LiTFSI and BmImTFSICH2 stretching mode of BmImTFSIC―H vibrational mode for cyclic BmIm+ of BmImTFSIN―H stretching mode of BmImTFSI
cross-linkages which decrease the polymeric chain segmental motionaccordingly. As a consequence, it hinders the migration of Li+ ionsalong the polymer chain and results in the decrement of the conduc-tivity [22].
4.2. HATR–FTIR studies
Since CPE 4 exhibits the highest ionic conductivity, therefore theHATR–FTIR spectrum of CPE 4 would be discussed in details. Inorder to confirm the complex mode between SiO2 and polymer ma-trix, the changes in shift, changes in shape and changes in intensityare scrutinized. Regarding to the changes in shift, most of the vibra-tion modes manifest downward shifts. As shown in Fig. 4 (c), the
Wavenumber (cm−1) Ref.
m+ of BmImTFSI 698 [6] [23],740 [24], [25]761 [26]789 [25]809 [27]840 [24]963 [23]985 [27]
1055 [25]e 1133 [6], [27]
d C―H 1176 [6], [23], [25]
1226 [26]1276 [6]1330 [27,28]1349 [25]
roup of PVC 1436 [24]1441 [6]1571 [6]
ydroxyl group of SiO2 1630 [23]1723 [29]2851 [27]2952 [6]
3119, 3157 [6]3620 [6]
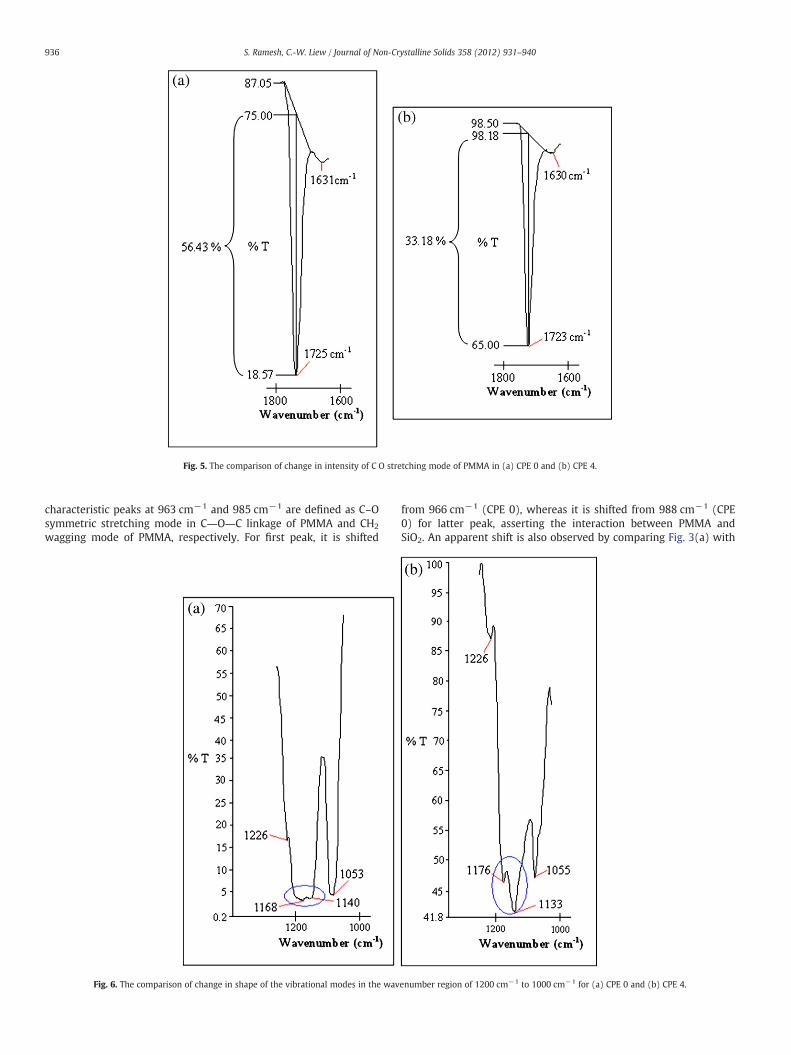
Fig. 5. The comparison of change in intensity of C O stretching mode of PMMA in (a) CPE 0 and (b) CPE 4.
936 S. Ramesh, C.-W. Liew / Journal of Non-Crystalline Solids 358 (2012) 931–940
characteristic peaks at 963 cm−1 and 985 cm−1 are defined as C–Osymmetric stretching mode in C―O―C linkage of PMMA and CH2
wagging mode of PMMA, respectively. For first peak, it is shifted
Fig. 6. The comparison of change in shape of the vibrational modes in the wav
from 966 cm−1 (CPE 0), whereas it is shifted from 988 cm−1 (CPE0) for latter peak, asserting the interaction between PMMA andSiO2. An apparent shift is also observed by comparing Fig. 3(a) with
enumber region of 1200 cm−1 to 1000 cm−1 for (a) CPE 0 and (b) CPE 4.
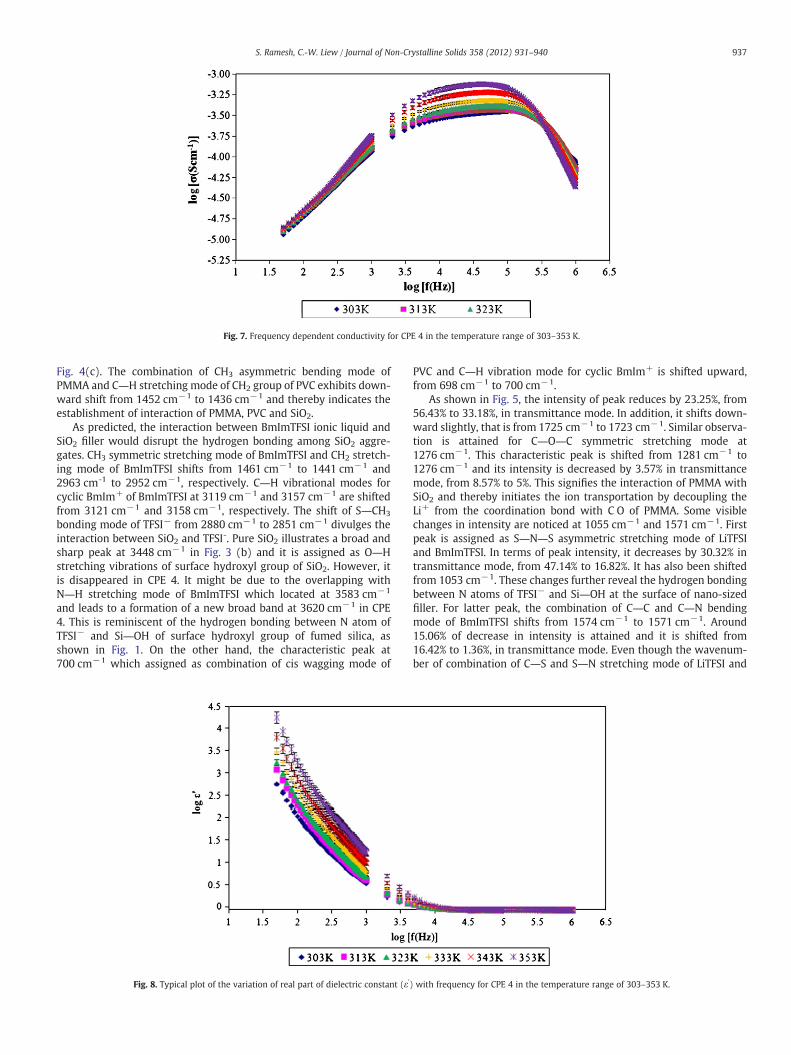
Fig. 7. Frequency dependent conductivity for CPE 4 in the temperature range of 303–353 K.
937S. Ramesh, C.-W. Liew / Journal of Non-Crystalline Solids 358 (2012) 931–940
Fig. 4(c). The combination of CH3 asymmetric bending mode ofPMMA and C―H stretching mode of CH2 group of PVC exhibits down-ward shift from 1452 cm−1 to 1436 cm−1 and thereby indicates theestablishment of interaction of PMMA, PVC and SiO2.
As predicted, the interaction between BmImTFSI ionic liquid andSiO2 filler would disrupt the hydrogen bonding among SiO2 aggre-gates. CH3 symmetric stretching mode of BmImTFSI and CH2 stretch-ing mode of BmImTFSI shifts from 1461 cm−1 to 1441 cm−1 and2963 cm-1 to 2952 cm−1, respectively. C―H vibrational modes forcyclic BmIm+ of BmImTFSI at 3119 cm−1 and 3157 cm−1 are shiftedfrom 3121 cm−1 and 3158 cm−1, respectively. The shift of S―CH3
bonding mode of TFSI− from 2880 cm−1 to 2851 cm−1 divulges theinteraction between SiO2 and TFSI-. Pure SiO2 illustrates a broad andsharp peak at 3448 cm−1 in Fig. 3 (b) and it is assigned as O―Hstretching vibrations of surface hydroxyl group of SiO2. However, itis disappeared in CPE 4. It might be due to the overlapping withN―H stretching mode of BmImTFSI which located at 3583 cm−1
and leads to a formation of a new broad band at 3620 cm−1 in CPE4. This is reminiscent of the hydrogen bonding between N atom ofTFSI− and Si―OH of surface hydroxyl group of fumed silica, asshown in Fig. 1. On the other hand, the characteristic peak at700 cm−1 which assigned as combination of cis wagging mode of
Fig. 8. Typical plot of the variation of real part of dielectric constant (ε')
PVC and C―H vibration mode for cyclic BmIm+ is shifted upward,from 698 cm−1 to 700 cm−1.
As shown in Fig. 5, the intensity of peak reduces by 23.25%, from56.43% to 33.18%, in transmittance mode. In addition, it shifts down-ward slightly, that is from 1725 cm−1 to 1723 cm−1. Similar observa-tion is attained for C―O―C symmetric stretching mode at1276 cm−1. This characteristic peak is shifted from 1281 cm−1 to1276 cm−1 and its intensity is decreased by 3.57% in transmittancemode, from 8.57% to 5%. This signifies the interaction of PMMA withSiO2 and thereby initiates the ion transportation by decoupling theLi+ from the coordination bond with C O of PMMA. Some visiblechanges in intensity are noticed at 1055 cm−1 and 1571 cm−1. Firstpeak is assigned as S―N―S asymmetric stretching mode of LiTFSIand BmImTFSI. In terms of peak intensity, it decreases by 30.32% intransmittance mode, from 47.14% to 16.82%. It has also been shiftedfrom 1053 cm−1. These changes further reveal the hydrogen bondingbetween N atoms of TFSI− and Si―OH at the surface of nano-sizedfiller. For latter peak, the combination of C―C and C―N bendingmode of BmImTFSI shifts from 1574 cm−1 to 1571 cm−1. Around15.06% of decrease in intensity is attained and it is shifted from16.42% to 1.36%, in transmittance mode. Even though the wavenum-ber of combination of C―S and S―N stretching mode of LiTFSI and
with frequency for CPE 4 in the temperature range of 303–353 K.
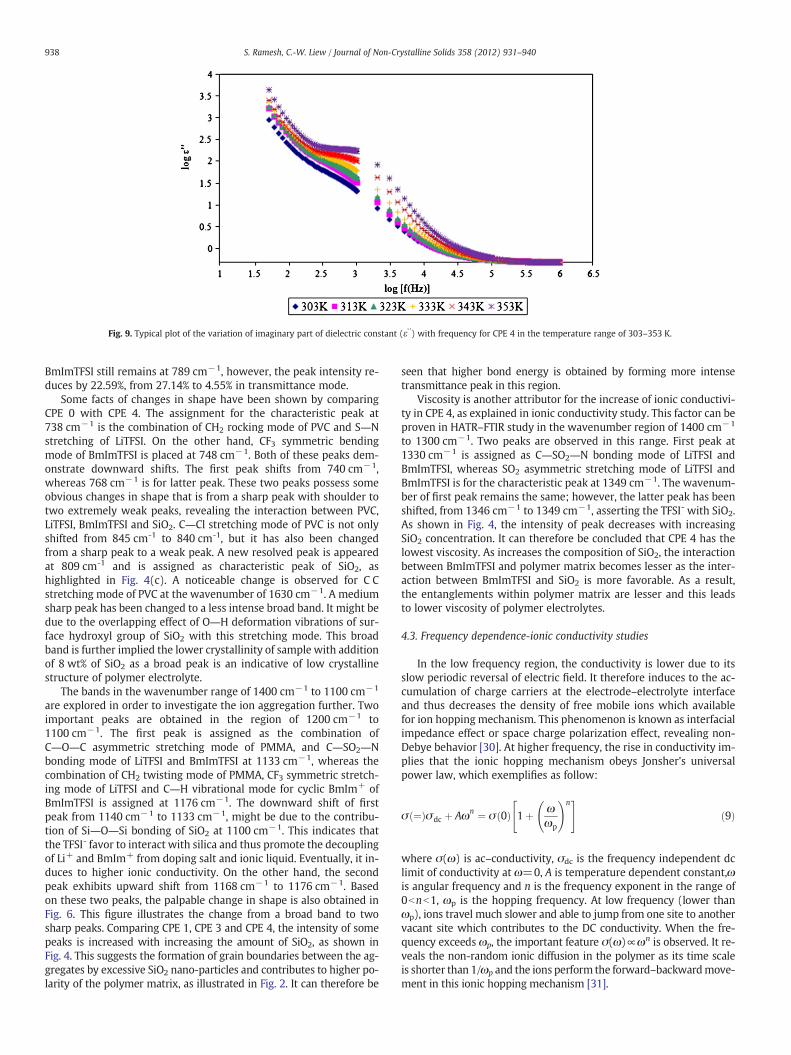
Fig. 9. Typical plot of the variation of imaginary part of dielectric constant (ε' ') with frequency for CPE 4 in the temperature range of 303–353 K.
938 S. Ramesh, C.-W. Liew / Journal of Non-Crystalline Solids 358 (2012) 931–940
BmImTFSI still remains at 789 cm−1, however, the peak intensity re-duces by 22.59%, from 27.14% to 4.55% in transmittance mode.
Some facts of changes in shape have been shown by comparingCPE 0 with CPE 4. The assignment for the characteristic peak at738 cm−1 is the combination of CH2 rocking mode of PVC and S―Nstretching of LiTFSI. On the other hand, CF3 symmetric bendingmode of BmImTFSI is placed at 748 cm−1. Both of these peaks dem-onstrate downward shifts. The first peak shifts from 740 cm−1,whereas 768 cm−1 is for latter peak. These two peaks possess someobvious changes in shape that is from a sharp peak with shoulder totwo extremely weak peaks, revealing the interaction between PVC,LiTFSI, BmImTFSI and SiO2. C―Cl stretching mode of PVC is not onlyshifted from 845 cm-1 to 840 cm-1, but it has also been changedfrom a sharp peak to a weak peak. A new resolved peak is appearedat 809 cm-1 and is assigned as characteristic peak of SiO2, ashighlighted in Fig. 4(c). A noticeable change is observed for C Cstretching mode of PVC at the wavenumber of 1630 cm−1. A mediumsharp peak has been changed to a less intense broad band. It might bedue to the overlapping effect of O―H deformation vibrations of sur-face hydroxyl group of SiO2 with this stretching mode. This broadband is further implied the lower crystallinity of sample with additionof 8 wt% of SiO2 as a broad peak is an indicative of low crystallinestructure of polymer electrolyte.
The bands in the wavenumber range of 1400 cm−1 to 1100 cm−1
are explored in order to investigate the ion aggregation further. Twoimportant peaks are obtained in the region of 1200 cm−1 to1100 cm−1. The first peak is assigned as the combination ofC―O―C asymmetric stretching mode of PMMA, and C―SO2―Nbonding mode of LiTFSI and BmImTFSI at 1133 cm−1, whereas thecombination of CH2 twisting mode of PMMA, CF3 symmetric stretch-ing mode of LiTFSI and C―H vibrational mode for cyclic BmIm+ ofBmImTFSI is assigned at 1176 cm−1. The downward shift of firstpeak from 1140 cm−1 to 1133 cm−1, might be due to the contribu-tion of Si―O―Si bonding of SiO2 at 1100 cm−1. This indicates thatthe TFSI- favor to interact with silica and thus promote the decouplingof Li+ and BmIm+ from doping salt and ionic liquid. Eventually, it in-duces to higher ionic conductivity. On the other hand, the secondpeak exhibits upward shift from 1168 cm−1 to 1176 cm−1. Basedon these two peaks, the palpable change in shape is also obtained inFig. 6. This figure illustrates the change from a broad band to twosharp peaks. Comparing CPE 1, CPE 3 and CPE 4, the intensity of somepeaks is increased with increasing the amount of SiO2, as shown inFig. 4. This suggests the formation of grain boundaries between the ag-gregates by excessive SiO2 nano-particles and contributes to higher po-larity of the polymer matrix, as illustrated in Fig. 2. It can therefore be
seen that higher bond energy is obtained by forming more intensetransmittance peak in this region.
Viscosity is another attributor for the increase of ionic conductivi-ty in CPE 4, as explained in ionic conductivity study. This factor can beproven in HATR–FTIR study in the wavenumber region of 1400 cm−1
to 1300 cm−1. Two peaks are observed in this range. First peak at1330 cm−1 is assigned as C―SO2―N bonding mode of LiTFSI andBmImTFSI, whereas SO2 asymmetric stretching mode of LiTFSI andBmImTFSI is for the characteristic peak at 1349 cm−1. The wavenum-ber of first peak remains the same; however, the latter peak has beenshifted, from 1346 cm−1 to 1349 cm−1, asserting the TFSI- with SiO2.As shown in Fig. 4, the intensity of peak decreases with increasingSiO2 concentration. It can therefore be concluded that CPE 4 has thelowest viscosity. As increases the composition of SiO2, the interactionbetween BmImTFSI and polymer matrix becomes lesser as the inter-action between BmImTFSI and SiO2 is more favorable. As a result,the entanglements within polymer matrix are lesser and this leadsto lower viscosity of polymer electrolytes.
4.3. Frequency dependence-ionic conductivity studies
In the low frequency region, the conductivity is lower due to itsslow periodic reversal of electric field. It therefore induces to the ac-cumulation of charge carriers at the electrode–electrolyte interfaceand thus decreases the density of free mobile ions which availablefor ion hopping mechanism. This phenomenon is known as interfacialimpedance effect or space charge polarization effect, revealing non-Debye behavior [30]. At higher frequency, the rise in conductivity im-plies that the ionic hopping mechanism obeys Jonsher's universalpower law, which exemplifies as follow:
σ ¼ð Þσdc þ Aωn ¼ σ 0ð Þ 1þ ωωp
!n" #ð9Þ
where σ(ω) is ac–conductivity, σdc is the frequency independent dclimit of conductivity at ω=0, A is temperature dependent constant,ωis angular frequency and n is the frequency exponent in the range of0bnb1, ωp is the hopping frequency. At low frequency (lower thanωp), ions travel much slower and able to jump from one site to anothervacant site which contributes to the DC conductivity. When the fre-quency exceeds ωp, the important feature σ(ω)∝ωn is observed. It re-veals the non-random ionic diffusion in the polymer as its time scaleis shorter than 1/ωp and the ions perform the forward–backwardmove-ment in this ionic hopping mechanism [31].
939S. Ramesh, C.-W. Liew / Journal of Non-Crystalline Solids 358 (2012) 931–940
The frequency-independent region in the second phase signifiesthat the conductivity is equal to the bulk conductivity of polymerelectrolytes [32]. At high frequency regime, the conductivity is de-creased. It is evocative of the formation of electrical double layer.The TFSI- travels much faster due to high periodic reversal of appliedelectric field and leads to rapid interaction of TFSI- with SiO2 throughhydrogen bonding, as explained as above. These high interactions as-sociate with the formation of thick interfacial layer between the grainboundaries and decrease the ionic conductivity. The formation ofelectrical double layer is also attributed to adsorption of complex ag-gregates of the constituents in the polymer matrix [33]. For first andsecond regions, the ionic conductivity also increases with tempera-ture due to high thermal vibration mode of the polymer chains. Astemperature increases, the polymer chain acquires faster internal vi-bration modes and weakens the interaction of the coordinativebonds between charge carriers and polymer backbone. Hence, it en-hances the freedom of movement of the charge carriers and favorsthe inter-chain and intra-chain ionic hopping process. However, theoppose result is obtained for third stage. It might be due to therapid occurrence of complete cycles per second in alternating currentdirection with high thermal motion. This induces to formation of animpede layer which blocks the ionic transportation.
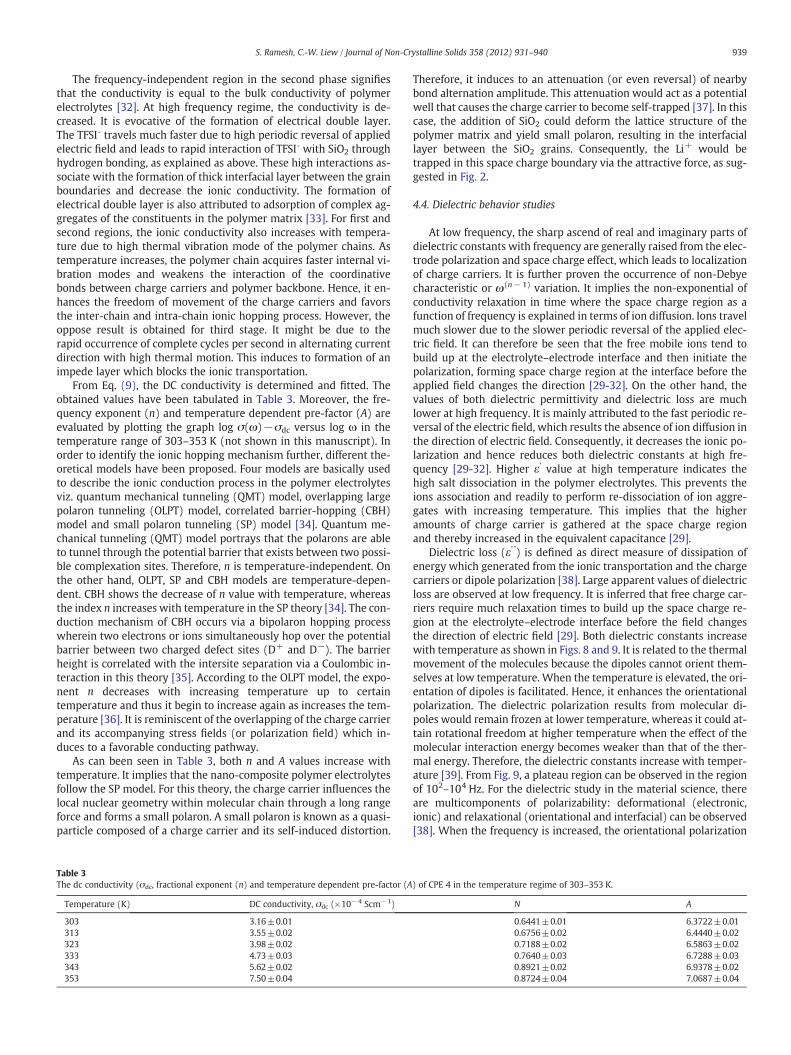
From Eq. (9), the DC conductivity is determined and fitted. Theobtained values have been tabulated in Table 3. Moreover, the fre-quency exponent (n) and temperature dependent pre-factor (A) areevaluated by plotting the graph log σ(ω)−σdc versus log ω in thetemperature range of 303–353 K (not shown in this manuscript). Inorder to identify the ionic hopping mechanism further, different the-oretical models have been proposed. Four models are basically usedto describe the ionic conduction process in the polymer electrolytesviz. quantum mechanical tunneling (QMT) model, overlapping largepolaron tunneling (OLPT) model, correlated barrier-hopping (CBH)model and small polaron tunneling (SP) model [34]. Quantum me-chanical tunneling (QMT) model portrays that the polarons are ableto tunnel through the potential barrier that exists between two possi-ble complexation sites. Therefore, n is temperature-independent. Onthe other hand, OLPT, SP and CBH models are temperature-depen-dent. CBH shows the decrease of n value with temperature, whereasthe index n increases with temperature in the SP theory [34]. The con-duction mechanism of CBH occurs via a bipolaron hopping processwherein two electrons or ions simultaneously hop over the potentialbarrier between two charged defect sites (D+ and D−). The barrierheight is correlated with the intersite separation via a Coulombic in-teraction in this theory [35]. According to the OLPT model, the expo-nent n decreases with increasing temperature up to certaintemperature and thus it begin to increase again as increases the tem-perature [36]. It is reminiscent of the overlapping of the charge carrierand its accompanying stress fields (or polarization field) which in-duces to a favorable conducting pathway.
As can been seen in Table 3, both n and A values increase withtemperature. It implies that the nano-composite polymer electrolytesfollow the SP model. For this theory, the charge carrier influences thelocal nuclear geometry within molecular chain through a long rangeforce and forms a small polaron. A small polaron is known as a quasi-particle composed of a charge carrier and its self-induced distortion.
Table 3The dc conductivity (σdc, fractional exponent (n) and temperature dependent pre-factor (A
Temperature (K) DC conductivity, σdc (×10−4 Scm−1)
303 3.16±0.01313 3.55±0.02323 3.98±0.02333 4.73±0.03343 5.62±0.02353 7.50±0.04
Therefore, it induces to an attenuation (or even reversal) of nearbybond alternation amplitude. This attenuation would act as a potentialwell that causes the charge carrier to become self-trapped [37]. In thiscase, the addition of SiO2 could deform the lattice structure of thepolymer matrix and yield small polaron, resulting in the interfaciallayer between the SiO2 grains. Consequently, the Li+ would betrapped in this space charge boundary via the attractive force, as sug-gested in Fig. 2.
4.4. Dielectric behavior studies
At low frequency, the sharp ascend of real and imaginary parts ofdielectric constants with frequency are generally raised from the elec-trode polarization and space charge effect, which leads to localizationof charge carriers. It is further proven the occurrence of non-Debyecharacteristic or ω(n−1) variation. It implies the non-exponential ofconductivity relaxation in time where the space charge region as afunction of frequency is explained in terms of ion diffusion. Ions travelmuch slower due to the slower periodic reversal of the applied elec-tric field. It can therefore be seen that the free mobile ions tend tobuild up at the electrolyte–electrode interface and then initiate thepolarization, forming space charge region at the interface before theapplied field changes the direction [29-32]. On the other hand, thevalues of both dielectric permittivity and dielectric loss are muchlower at high frequency. It is mainly attributed to the fast periodic re-versal of the electric field, which results the absence of ion diffusion inthe direction of electric field. Consequently, it decreases the ionic po-larization and hence reduces both dielectric constants at high fre-quency [29-32]. Higher ε' value at high temperature indicates thehigh salt dissociation in the polymer electrolytes. This prevents theions association and readily to perform re-dissociation of ion aggre-gates with increasing temperature. This implies that the higheramounts of charge carrier is gathered at the space charge regionand thereby increased in the equivalent capacitance [29].
Dielectric loss (ε' ') is defined as direct measure of dissipation ofenergy which generated from the ionic transportation and the chargecarriers or dipole polarization [38]. Large apparent values of dielectricloss are observed at low frequency. It is inferred that free charge car-riers require much relaxation times to build up the space charge re-gion at the electrolyte–electrode interface before the field changesthe direction of electric field [29]. Both dielectric constants increasewith temperature as shown in Figs. 8 and 9. It is related to the thermalmovement of the molecules because the dipoles cannot orient them-selves at low temperature. When the temperature is elevated, the ori-entation of dipoles is facilitated. Hence, it enhances the orientationalpolarization. The dielectric polarization results from molecular di-poles would remain frozen at lower temperature, whereas it could at-tain rotational freedom at higher temperature when the effect of themolecular interaction energy becomes weaker than that of the ther-mal energy. Therefore, the dielectric constants increase with temper-ature [39]. From Fig. 9, a plateau region can be observed in the regionof 102–104 Hz. For the dielectric study in the material science, thereare multicomponents of polarizability: deformational (electronic,ionic) and relaxational (orientational and interfacial) can be observed[38]. When the frequency is increased, the orientational polarization
) of CPE 4 in the temperature regime of 303–353 K.
N A
0.6441±0.01 6.3722±0.010.6756±0.02 6.4440±0.020.7188±0.02 6.5863±0.020.7640±0.03 6.7288±0.030.8921±0.02 6.9378±0.020.8724±0.04 7.0687±0.04
940 S. Ramesh, C.-W. Liew / Journal of Non-Crystalline Solids 358 (2012) 931–940
decreases because it takesmore time than electronic and ionic polariza-tion. Therefore, it is not applicable in this region. As aforementioned inthe beginning of the section, the high dielectric constant at low frequen-cy is due to the ionic polarization at the electrolyte–electrode interface.Therefore, it can be concluded that the plateau region is an indicative ofthe interfacial polarization. For this polarization, the charge carriers arebeing self-trapped in the grain boundary within the lattice structure ofthe polymer chain. This is in good agreement with the previous study.
5. Conclusion
Nano-composite polymer electrolytes with different ratio of fumedsilica were prepared by solution casting technique. HATR–FTIR studyis employed to study the structural of polymer electrolytes and thusverify the complexation between gel polymer matrix and fumed silicafiller. Among all the samples, CPE 4 (addition of 8 wt.% of SiO2) is a fea-sible candidate. The highest ionic conductivity of (4.11±0.01)×10−3
Scm−1 is achieved by CPE 4 due to the formation of an effective conduct-ing pathway between the grain boundaries. The conductivity is increasedwith frequency, up to an optimum level. Beyond this region, the decreasein conductivity is perceived. At low frequency, slow periodic reversalcauses the accumulation of ions and hence decreases the ion transportin the polymer matrix which in accordance with lower conductivity.The dielectric permittivity formalism is decreased with frequency. Elec-trode polarization due to the accumulation of ion is the main attributor.There is no ion diffusion in the direction of electric field at high frequencydue to the fast periodic reversal of electric field.
Acknowledgements
One of the authors, Chiam-Wen Liew gratefully acknowledges the“SkimBright SparksUniversitiMalaya (SBSUM)” for thefinancial support.This work was supported by the Exploratory Research Grant Scheme(ERGS: ER017-2011A).
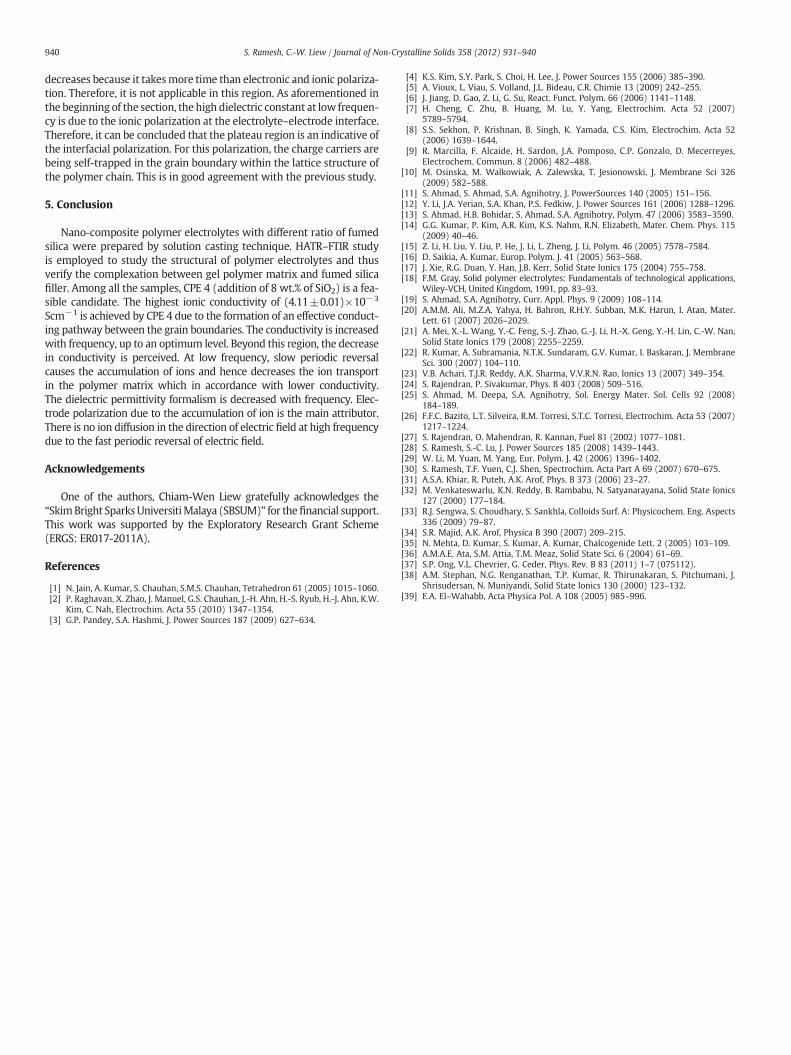
References
[1] N. Jain, A. Kumar, S. Chauhan, S.M.S. Chauhan, Tetrahedron 61 (2005) 1015–1060.[2] P. Raghavan, X. Zhao, J. Manuel, G.S. Chauhan, J.-H. Ahn, H.-S. Ryub, H.-J. Ahn, K.W.
Kim, C. Nah, Electrochim. Acta 55 (2010) 1347–1354.[3] G.P. Pandey, S.A. Hashmi, J. Power Sources 187 (2009) 627–634.
[4] K.S. Kim, S.Y. Park, S. Choi, H. Lee, J. Power Sources 155 (2006) 385–390.[5] A. Vioux, L. Viau, S. Volland, J.L. Bideau, C.R. Chimie 13 (2009) 242–255.[6] J. Jiang, D. Gao, Z. Li, G. Su, React. Funct. Polym. 66 (2006) 1141–1148.[7] H. Cheng, C. Zhu, B. Huang, M. Lu, Y. Yang, Electrochim. Acta 52 (2007)
5789–5794.[8] S.S. Sekhon, P. Krishnan, B. Singh, K. Yamada, C.S. Kim, Electrochim. Acta 52
(2006) 1639–1644.[9] R. Marcilla, F. Alcaide, H. Sardon, J.A. Pomposo, C.P. Gonzalo, D. Mecerreyes,
Electrochem. Commun. 8 (2006) 482–488.[10] M. Osinska, M. Walkowiak, A. Zalewska, T. Jesionowski, J. Membrane Sci 326
(2009) 582–588.[11] S. Ahmad, S. Ahmad, S.A. Agnihotry, J. PowerSources 140 (2005) 151–156.[12] Y. Li, J.A. Yerian, S.A. Khan, P.S. Fedkiw, J. Power Sources 161 (2006) 1288–1296.[13] S. Ahmad, H.B. Bohidar, S. Ahmad, S.A. Agnihotry, Polym. 47 (2006) 3583–3590.[14] G.G. Kumar, P. Kim, A.R. Kim, K.S. Nahm, R.N. Elizabeth, Mater. Chem. Phys. 115
(2009) 40–46.[15] Z. Li, H. Liu, Y. Liu, P. He, J. Li, L. Zheng, J. Li, Polym. 46 (2005) 7578–7584.[16] D. Saikia, A. Kumar, Europ. Polym. J. 41 (2005) 563–568.[17] J. Xie, R.G. Duan, Y. Han, J.B. Kerr, Solid State Ionics 175 (2004) 755–758.[18] F.M. Gray, Solid polymer electrolytes: Fundamentals of technological applications,
Wiley-VCH, United Kingdom, 1991, pp. 83–93.[19] S. Ahmad, S.A. Agnihotry, Curr. Appl. Phys. 9 (2009) 108–114.[20] A.M.M. Ali, M.Z.A. Yahya, H. Bahron, R.H.Y. Subban, M.K. Harun, I. Atan, Mater.
Lett. 61 (2007) 2026–2029.[21] A. Mei, X.-L. Wang, Y.-C. Feng, S.-J. Zhao, G.-J. Li, H.-X. Geng, Y.-H. Lin, C.-W. Nan,
Solid State Ionics 179 (2008) 2255–2259.[22] R. Kumar, A. Subramania, N.T.K. Sundaram, G.V. Kumar, I. Baskaran, J. Membrane
Sci. 300 (2007) 104–110.[23] V.B. Achari, T.J.R. Reddy, A.K. Sharma, V.V.R.N. Rao, Ionics 13 (2007) 349–354.[24] S. Rajendran, P. Sivakumar, Phys. B 403 (2008) 509–516.[25] S. Ahmad, M. Deepa, S.A. Agnihotry, Sol. Energy Mater. Sol. Cells 92 (2008)
184–189.[26] F.F.C. Bazito, L.T. Silveira, R.M. Torresi, S.T.C. Torresi, Electrochim. Acta 53 (2007)
1217–1224.[27] S. Rajendran, O. Mahendran, R. Kannan, Fuel 81 (2002) 1077–1081.[28] S. Ramesh, S.-C. Lu, J. Power Sources 185 (2008) 1439–1443.[29] W. Li, M. Yuan, M. Yang, Eur. Polym. J. 42 (2006) 1396–1402.[30] S. Ramesh, T.F. Yuen, C.J. Shen, Spectrochim. Acta Part A 69 (2007) 670–675.[31] A.S.A. Khiar, R. Puteh, A.K. Arof, Phys. B 373 (2006) 23–27.[32] M. Venkateswarlu, K.N. Reddy, B. Rambabu, N. Satyanarayana, Solid State Ionics
127 (2000) 177–184.[33] R.J. Sengwa, S. Choudhary, S. Sankhla, Colloids Surf. A: Physicochem. Eng. Aspects
336 (2009) 79–87.[34] S.R. Majid, A.K. Arof, Physica B 390 (2007) 209–215.[35] N. Mehta, D. Kumar, S. Kumar, A. Kumar, Chalcogenide Lett. 2 (2005) 103–109.[36] A.M.A.E. Ata, S.M. Attia, T.M. Meaz, Solid State Sci. 6 (2004) 61–69.[37] S.P. Ong, V.L. Chevrier, G. Ceder, Phys. Rev. B 83 (2011) 1–7 (075112).[38] A.M. Stephan, N.G. Renganathan, T.P. Kumar, R. Thirunakaran, S. Pitchumani, J.
Shrisudersan, N. Muniyandi, Solid State Ionics 130 (2000) 123–132.[39] E.A. El–Wahabb, Acta Physica Pol. A 108 (2005) 985–996.