Polymer electrolytes based on ionic liquids for lithium batteries
235
HAL Id: tel-01179985 https://tel.archives-ouvertes.fr/tel-01179985 Submitted on 23 Jul 2015 HAL is a multi-disciplinary open access archive for the deposit and dissemination of sci- entific research documents, whether they are pub- lished or not. The documents may come from teaching and research institutions in France or abroad, or from public or private research centers. L’archive ouverte pluridisciplinaire HAL, est destinée au dépôt et à la diffusion de documents scientifiques de niveau recherche, publiés ou non, émanant des établissements d’enseignement et de recherche français ou étrangers, des laboratoires publics ou privés. Polymer electrolytes based on ionic liquids for lithium batteries Priew Eiamlamai To cite this version: Priew Eiamlamai. Polymer electrolytes based on ionic liquids for lithium batteries. Materials. Uni- versité Grenoble Alpes, 2015. English. NNT : 2015GREAI016. tel-01179985
-
Upload
khangminh22 -
Category
Documents
-
view
3 -
download
0
Transcript of Polymer electrolytes based on ionic liquids for lithium batteries

HAL Id: tel-01179985https://tel.archives-ouvertes.fr/tel-01179985
Submitted on 23 Jul 2015
HAL is a multi-disciplinary open accessarchive for the deposit and dissemination of sci-entific research documents, whether they are pub-lished or not. The documents may come fromteaching and research institutions in France orabroad, or from public or private research centers.
L’archive ouverte pluridisciplinaire HAL, estdestinée au dépôt et à la diffusion de documentsscientifiques de niveau recherche, publiés ou non,émanant des établissements d’enseignement et derecherche français ou étrangers, des laboratoirespublics ou privés.
Polymer electrolytes based on ionic liquids for lithiumbatteries
Priew Eiamlamai
To cite this version:Priew Eiamlamai. Polymer electrolytes based on ionic liquids for lithium batteries. Materials. Uni-versité Grenoble Alpes, 2015. English. NNT : 2015GREAI016. tel-01179985

THÈSE Pour obtenir le grade de
DOCTEUR DE L’UNIVERSITÉ DE GRENOBLE Spécialité : Matériaux, Mécanique, Génie civil, Electrochimie
Arrêté ministériel : 7 août 2006
Présentée par
Priew EIAMLAMAI Thèse dirigée par Jean-Yves SANCHEZ et codirigée par Cristina IOJOIU préparée au sein du Laboratoire d’Electrochimie et de Physico-chimie des Matériaux et des Interfaces dans l'École Doctorale I-MEP 2 (Ingénierie – Matériaux, Mécanique, Energétique, Environnement, Procédés, Production)
Electrolytes polymères à base de liquides ioniques pour batteries au lithium Thèse soutenue publiquement le 20 février 2015, devant le jury composé de :
M. André VIOUX Professeur à l’Institut Charles Gerhardt, Montpellier Président/Examinateur
M. Thierry HAMAIDE Professeur à l’Université Claude Bernard Lyon 1 Rapporteur
M. François TRAN-VAN Professeur à l’Université de Tours Rapporteur
M. Jean-Yves SANCHEZ Professeur à l’Université de Grenoble Directeur de thèse
Mme Cristina IOJOIU Chargé de Recherche au CNRS, LEPMI Co-directrice de thèse
Mme Laure COINTEAUX Ingénieur de Recherche à Grenoble INP Invitée

Acknowledgement
It’s always hard to acknowledge so many people and their contribution to my PhD
research work at Grenoble, as they all deserve my deepest thanks and appreciation for their
help.
First and foremost I would like to express the deepest gratitude to my supervisor
Professor Jean-Yves SANCHEZ for allowing me to work within his research group, his
valuable advices and also for sharing his vision and experiences.
Equally, a very great ‘Thank you!’ has to go to my co-supervisor, Dr. Cristina IOJOIU.
Her expert guidance helped me to overcome the obstacles from the experimental work and
made all presentations corrections for thesis and project meeting, as well as the redaction of the
manuscript of my thesis work.
My thanks also go to my doctoral dissertation committee, Prof. André VIOUX, Prof.
Thierry HAMAIDE, Prof. François TRAN-VAN and Dr. Laure COINTEAUX for reading the
manuscript and providing many valuable comments that improve the contents of this
dissertation.
I want to thank Jean –Claude LEPRETRE and Fannie ALLOIN for their kind concern
and discussion concerning the electrochemical investigation, especially the cyclic voltammetry.
A part of diffusion coefficient and transference number investigation of my research
work would not been accomplished without the support of Renaud BOUCHET, Priscillia
SOUDANT, Patrick JUDEINSTEIN and in particular Lavinia ASTRATINE who also tested
the electrochemical stability of my samples and was always helpful and cheered me up
throughout the period of thesis redaction.
I gratefully acknowledge the funding source, The Thai Royal Government, which made
my PhD life in France possible. In addition, I thank to SLiM project that allowed me to join in
their project and also supported the research work.
I have also been fortunate to have a great group of friends in Grenoble; this includes my
classmates during my master degree study at Joseph Fourier University (UJF). I would like to
express my thanks to my lab colleagues in ELSA research group for their friendship and help
during my thesis work as well as the activities outside the laboratory. And also, all members in

Thai student society in Grenoble from the past to present who shared both good and bad
experiences and have had the good memories together over the years.
Finally and most importantly, I wish to thank my “P” family (Peerapong, Pradab and
Priu) for their moral support, unending love and for sharing the fun stories from home. That
always made me happy during my long stay far from our home and helped to move on from
any of the tough moments in my life. Thank you!

Contents
1
Contents
Introduction ................................................................................................................................ 5
I. Literature review ................................................................................................................. 8
I.1. Overview of batteries ................................................................................................... 9
I.2. Advantages and disadvantages of secondary batteries .............................................. 10
I.3. Fundamental Thermodynamics ................................................................................. 10
I.4. Secondary batteries; comparison of battery technologies ......................................... 12
I.5. Lithium batteries ........................................................................................................ 15
I.5.1. Lithium-ion batteries .......................................................................................... 17
I.5.1.1. Liquid electrolyte .............................................................................................. 18
I.5.1.2. Polymer gel electrolyte (PGE) .......................................................................... 19
I.5.2. Lithium-polymer batteries .................................................................................. 20
I.6. Solvent in electrolytes of lithium batteries ................................................................ 21
I.7. Key aspects for the electrolyte improvement ............................................................ 23
I.7.1. Electrochemical stability .................................................................................... 23
I.7.2. Transference number .......................................................................................... 24
I.7.3. Conductivity and ionic conduction mechanisms ................................................ 25
I.8. Polymer electrolytes .................................................................................................. 28
I.8.1. Poly(oxyethylene) based electrolytes ................................................................. 28
I.8.2. POE with lower crystallinity degree .................................................................. 30
I.8.3. Blended-based polymer electrolyte .................................................................... 35
I.9. Motivation of thesis work .......................................................................................... 43
I.10. References .............................................................................................................. 44
II. Synthesis and characterization of a family of oligoethers end-capped by lithium aryl
perfluorosulfonate .................................................................................................................... 49
II.1. Introduction ............................................................................................................... 49
II.2. Preparation of salts and their characterizations ......................................................... 51

Contents
2
II.2.1. Synthesis of salt 1 ............................................................................................... 52
II.2.2. Synthesis of salt 2 ............................................................................................... 57
II.2.3. Physical characterizations of salts ...................................................................... 61
II.2.3.1.Thermal characterizations of salts .................................................................... 61
II.2.3.2. Intrinsic conductivity of salts........................................................................... 63
II.2.3.3. Diffusion coefficient of salts ........................................................................... 64
II.2.3.4. Cationic transference number .......................................................................... 66
II.2.3.5. Electrochemical stability of salts ..................................................................... 67
II.3. Polymer electrolytes based on linear POE and salts 1 and 2 ..................................... 69
II.3.1. Thermal characterization .................................................................................... 69
II.3.2. Thermal stability ................................................................................................ 73
II.3.3. Thermo-mechanical properties ........................................................................... 75
II.3.4. Conductivity ....................................................................................................... 78
II.3.5. Diffusion coefficients ......................................................................................... 83
II.3.6. Cationic transference number and cationic conductivity ................................... 84
II.4. Film elaboration based on POE network (NPC) electrolyte based on salt 1 and 2 ... 87
II.4.1. Polycondensat synthesis (LPC) .......................................................................... 87
II.4.2. Membrane preparation ....................................................................................... 88
II.4.3. Thermal characterizations .................................................................................. 89
II.4.4. Thermal stability ................................................................................................ 92
II.4.5. Mechanical properties ........................................................................................ 95
II.4.6. Conductivity ....................................................................................................... 99
II.4.7. Diffusion coefficients and cationic transference numbers ............................... 103
II.5. Conclusion ............................................................................................................... 104
II.6. References ............................................................................................................... 105
III. Aliphatic Lithium Salts based on Sulfonate and Sulfonylimide Oligoether ............... 107
III.1. Introduction .......................................................................................................... 107

Contents
3
III.2. Publication ........................................................................................................... 109
III.3. Preparation and characterizations of aliphatic oligoether lithium salts ............... 133
III.3.1. Synthesis of Salt 3 ........................................................................................ 135
III.3.2. Synthesis of Salt 4 ........................................................................................ 139
III.3.3. Salt 5 ............................................................................................................. 143
III.3.4. Characterizations of salts .............................................................................. 146
III.3.4.1. Thermal Properties ....................................................................................... 146
III.3.4.2. Intrinsic conductivity of salts ....................................................................... 149
III.3.4.3. Diffusion coefficient..................................................................................... 150
III.3.4.4. Transference numbers .................................................................................. 151
III.3.4.5. Electrochemical stability .............................................................................. 152
III.4. Elaboration and characterization of membrane based on POE host polymer doped
with mPEG aliphatic lithium salt ........................................................................................ 153
III.4.1. Thermal characterizations ............................................................................. 153
III.4.2. Mechanical properties ................................................................................... 158
III.4.3. Conductivity ................................................................................................. 161
III.4.4. Diffusion coefficient ..................................................................................... 163
III.4.5. Cationic transference number and cationic conductivity ............................. 165
III.5. Membrane elaboration based on NPC host polymer doped with aliphatic lithium
salt………………………………………………………………………………………...167
III.5.1. Thermal characterizations ............................................................................. 167
III.5.2. Mechanical properties ................................................................................... 171
III.5.3. Conductivity ................................................................................................. 174
III.6. Conclusion ........................................................................................................... 177
III.7. References ............................................................................................................ 179
IV. Experimental Part ........................................................................................................ 180
IV.1. Section 1: Synthesis procedure of salts, linear polycondensat (LPC1000) and their
characterization methods .................................................................................................... 181

Contents
4
IV.1.1. Salt synthesis ................................................................................................ 182
Lithium perfluorosulfonate salt ................................................................................... 182
Lithium perfluorosulfonimide salt .............................................................................. 183
Lithium aromatic perfluorosulfonate salts .................................................................. 184
Lithium aliphatic perfluorosulfonate salts ................................................................... 189
Lithium aliphatic perfluorosulfonimide salt ................................................................ 193
IV.1.2. Linear polycondensat (LPC1000) preparation ............................................. 194
IV.1.3. Salt and LPC1000 characterization .............................................................. 195
a) Thermal analysis .................................................................................................. 195
b) Conductivity measurements ................................................................................. 195
c) Cyclic voltammetry .............................................................................................. 195
d) Transference number............................................................................................ 196
e) Freeze dryer or lyophilization .............................................................................. 196
f) Gel Permeation Chromatography (GPC) ................................................................. 197
IV.2. Section 2: Membrane preparation and salt concentration calculation ................. 197
IV.2.1. Membrane preparation .................................................................................. 197
IV.2.2. Calculation of salt concentration .................................................................. 197
IV.3. Section 3: Membrane characterization ................................................................. 198
IV.3.1. Thermal analysis ........................................................................................... 198
IV.3.2. Dynamic mechanical analysis ...................................................................... 199
IV.3.3. Conductivity measurements ......................................................................... 199
IV.3.4. Diffusion coefficient and transference number ............................................ 199
IV.4. References ............................................................................................................ 201
General conclusion and prospects .......................................................................................... 202
Résumé (in French)………………………………………………………………………….204

Introduction
5
Introduction
The growing market of electric transportation i.e. electric vehicles, EV, hybrid electric
vehicles, HEV, Plug-in Hybrid Electric Vehicles, PHEV, motivates a neat improvement of the
safety as compared to the worldwide existing 4C (Computer, Cellular Phone, Camcorders,
Cordless tools) market. So, solvent-free batteries currently regain attention. This is the case of
solid-state batteries, made of inorganic solid components, and of batteries using solvent-free
polymer electrolytes.
With regard to the security concerns, solvent free polymer electrolyte films are very
attractive in particular those made from poly(oxyethylene) (POE) host polymer. POE has
outstanding ability to solvate lithium cation. It suffers however of various handicaps, namely
(i) a high crystallinity that penalizes the electrolyte conductivity below the melting
temperature (ii) a mechanical strength that vanishes following the polymer electrolyte melting
and (iii) a stability in oxidation limited to roughly 3.9 V vs Li/Li+. In addition to the high
performances such as the thermo mechanical, chemical, electrochemical properties, a special
attention has to be paid to ion transport. Operation of a battery based on solvent-free polymer
electrolyte is partly conditioned by its melting temperature as the conductivity occurs mainly
at the amorphous state. The architecture modification of POE is one of the routes to decrease
the crystallinity but does not allow overcoming the bottleneck of a low cationic transference
number, T+, in POE electrolytes. The use of commercial ionic liquids is one of the routes to
get sufficient conductivities at low temperatures but, once again, T+ remains low.
Furthermore these ionic liquids, which benefit to the conductivity, are based on tetraalkyl
ammonium that do not participate in the electrode reactions. We have therefore directed our
researches towards lithium-conducting ionic liquids. Hence, this thesis work proposes to
address these issues by designing new ionic liquid lithium salts containing the oxyethylene
moiety and the perfluorosulfonate/ sulfonimide anion. Consequently, the influences of (i) the
number of oxyethylene units (ii) the different chemical structures and (iii) the anion on their
intrinsic performances and those of the related polymer electrolytes were investigated.
This is one part of the LEPMI contribution to the ‘SLiM’ ANR project which has been
carried out in collaboration with four academic partners (LEPMI, CMOS : Chimie

Introduction
6
Moleculaire et Organisation du solide-Montpellier, IMN : Institut de Matériaux Jean Rouxel-
Nantes, and MATEIS : MATEriaux Ingénierie et Science-Lyon).
This manuscript is divided into 4 chapters as follows;
The first chapter will introduce the overview about the secondary batteries, in
particular, lithium batteries including the basic aspect and a brief review on different
electrolytes. Then, the progresses in the development of ‘solid’ electrolytes such as polymer
electrolytes especially based on poly(oxyethylene) host polymer are mentioned. The key
issues from literature reviews initiated the motivation to improve the electrochemical
performances i.e. ion conduction and cationic transference numbers of polymer electrolytes as
well as the mechanical ones.
The second chapter will be focused on the effect of oxyethylene moiety (mPEG)
addition on the aromatic lithium salt (PhSCF2CF2SO3Li) which was previously studied by E.
Paillard (thesis, INPG, 2008). The key performance like the cationic transference number
should be improved and approached to the ideal value 1 by immobilizing or slowing down the
anions. The comparative performance of a family of aromatic oligoether lithium salts varying
the number of oxyethylene units will be discussed with regard to the characterization data.
This chapter also demonstrates the intrinsic properties of liquid-viscous lithium salts.
Apart from the study of a family of aromatic lithium salts in chapter 2, the following
chapter will also discuss about the influence of oligooxyethylene moiety end-capped with
aliphatic lithium salts as well as the difference of anion functional group between sulfonate
and sulfonimide on their properties. The aliphatic lithium salts will be incorporated in two
different polymer matrix systems to investigate their performances. Additionally the neat salts
(without any added polymer or solvent) will be characterized. Moreover, the performance
comparison between aromatic and aliphatic lithium salt will be also mentioned. Additionally,
it will also comparatively study the influence of the anionic function of the lithium salts prior
to their incorporation on mPEG oligomers: thermal, mechanical, electrochemical properties as
well as the ion transport properties i.e. conductivity and transference number in the same host
polymers as used in both previous parts. Perfluoroalkane sulfonate (LiTPSN) and sulfonimide
(LiTPSM) lithium salts are named as the salts which will be used in the chapter and their
performance investigation will be presented in the form of the publication as well.

Introduction
7
The performance characterization of all salts will be started with the neat salt and
followed by the salt dissolved in linear and poly(oxyethylene) network host polymers
respectively for each chapter.
The important points carried out from all chapters will be sum up into the general
conclusion part and some interesting points which could be further deepened will be
discussed in the perspectives.
The last chapter will present the protocols of synthesis for all materials and the
experimental procedures for all characterizations employed to carry out during this thesis
work.

Chapter I : Literature review
8
I. Literature review
In a domain of the generating and storing electrical energy devices, batteries are always
mentioned due to their usability in a variety of applications. They can be found in many
vehicles and portable electronic equipments related to our lives in this modern world. However,
despite they are expanded to the worldwide market, the development of batteries exhibiting
high durability and composed on environmentally friendly components is still under progress.
Thus many academic research groups and industrial R&D laboratory are focused on the
improvements of lithium battery technology.
Basically, these chemical-electrical energy conversion devices are composed of two
electrodes and an electrolyte in a container called “cell”. In general, batteries are categorized to
two different types by the ability or inability of the rechargeable process: Primary batteries
(non-rechargeable batteries) and secondary batteries (rechargeable batteries).
This chapter will focus on the secondary lithium batteries and in particularly it will give
on overview on the main progress in the development of polymer electrolyte. In the first part
some basic aspects on lithium batteries are presented followed by a brief review on different
electrolytes. The polymer electrolytes based on poly(oxyethylene) and lithium salts are then
largely discussed and finally the motivation of my PhD is presented.

Chapter I : Literature review
9
I.1. Overview of batteries
General background
Secondary batteries are electrochemical energy storage devices that consist of three key
components; a positive electrode (improperly called cathode), a negative electrode (improperly
called cathode), and an electrolyte. They directly convert stored chemical energy in electrical
energy through electrochemical reactions which are called oxidation and reduction. Moreover,
these reactions are electrically reversible, when a voltage is applied to the battery. This point
justifies the difference between the secondary batteries which can be recharged many times and
the primary batteries which are discarded after using only once. Figure 1.1 represents the
diagram of working and component positions of secondary battery during discharge and
charge.
Oxidation: Reductor Oxidant + n e- Reduction: Oxidant + n e- Reductor
Figure 1.1. Schematic representation of one battery during the discharge and charge.
During discharge, an oxidation reaction occurs at the negative electrode/electrolyte
interface which can be called ‘anode’. This produces the positively charged ions (i.e. Li+) that
are moving from anode to cathode while the electrons pass via the external circuit to the
positive electrode that can be called cathode. The reduction of positively charged ions (i.e. Li+)

Chapter I : Literature review
10
is carried out at the positive electrode. On the contrary, when the battery is charged, the
oxidation – reduction will occur at the reverse direction as the discharging process.
I.2. Advantages and disadvantages of secondary batteries
Over several years, the rechargeable batteries have been available and grown in the
battery market because of their, advantages when comparing with the primary. Some examples
are presented here down: [1]
Cost: The secondary batteries are used much longer time because they can be recharged
many times while the primary batteries have to be replaced after the first discharge
Performances: in terms of capacity, energy density (weight & volume) and self-
discharge are lower in rechargeable batteries. These later however make continuous
progresses and, obviously, the energy supplied by a rechargeable battery during its
lifetime significantly exceeds that of non-rechargeable battery.
Environmental impact: Producing less waste and toxic mineral
But also, they still have some weak points;
Safety: Even though the rechargeable batteries are less toxic, they still contain some
toxic materials. Dangerous trash and special care are still needed for such batteries
Cost for purchasing at the first time: more expensive than non-rechargeable batteries.
I.3. Fundamental Thermodynamics
In order to understand how a battery works, the fundamental of thermodynamics and
electrochemistry must be introduced.
Here, we consider batteries which consist of a lithium metal Li0 and a vanadium oxide (V2O5)
as negative and positive electrodes, respectively. These rechargeable batteries were replaced by
Lithium-ion batteries from roughly 1992. The alone commercial batteries based on a Li0
negative are lithium-polymer batteries, LPB, which address electric transportation and
stationary applications but, operating at high temperatures are unadapted to electronic devices.
LPB use LFP instead of vanadates as positive.

Chapter I : Literature review
11
The oxidation reaction occurs at the negative electrode during the discharge:
Li Li+ + e-
E- = E0Li+/Li + (RT/F) ln (aLi+/aLi)
where E0Li+/Li is a standard potential of Li+/Li compared with Standard Hydrogen Electrode
(-3.1 V/SHE), T is the absolute temperature (K), R is an ideal gas constant (8.314 Jmol-1 K-1), F
is the Faraday’s constant (96500 Cmol-1) and ai is a chemical activity for the relevant species i,
in our case Li
The reduction reaction involves at the positive electrode during the discharge:
4Li+ + 4e- + LiV3O8 Li5V3O8
継+ = 継4挑+ +挑典潮8/挑5典潮80 + 迎繋 ln 峭挑+4 挑典潮8挑5典潮8 嶌
The activity of pure solid specie is 1 so, aL辿V典O8 = aL辿5V典O8 = aL辿 = な
Redox reaction: 4Li + LiV3O8 Li5V3O8
Theoretical tension
The theoretical tension of the battery (E0) is standard electrode potential difference between
positive and negative. 継0 = 継挑典潮8 /挑5典潮8 0 − 継挑+/挑0
Free enthalpy (Gibbs free energy)
The Gibbs free energy change for the cell reaction is given by this simple relationship: ∆罫0 = −券繋継0
Where n = the charge number of the mobile species involved in the reaction
E = the voltage between the electrodes
F = Faraday’s constant

Chapter I : Literature review
12
Theoretical capacity
The theoretical capacity of an electrochemical cell is determined by the quantity of electricity
involved in the electrochemical reaction. It is denoted 芸痛ℎ and is given by: Qt竪 = xnF 岫Qt竪 in C unit岻
where x= number of moles of active materials involved in electrochemical reaction,
n = number of electrons transferred per mole of reaction and F = Faraday’s constant
The capacity is usually expressed in weight (or volume) and not in moles:
Qt竪 = nFぬはどどMr
Where Mr = Molar Mass of active species. The capacity in the above formula is expressed in
Ampere-hour per gram (Ah/g)
Theoretical energy
Specific energy is defined as the energy per weight (Wh.kg-1). The theoretical specific energy is
the maximum energy that can be generated per total mass of cell reactants. The practical
specific energy is much lower than the theoretical one and depends on the discharge region
because the power varies in the function of the discharge capacity.
I.4. Secondary batteries; comparison of battery
technologies
To improve the performances of secondary batteries, various types of such technologies
have been developed. The comparison of characteristics of commonly used rechargeable
batteries is shown in Table 1.1. Depending on the material of negative electrode they are
classified into three types; lead (Pb) based, nickel (Ni) based and lithium (Li) based batteries.
Below is a short summary of comparative of different systems:

Chapter I : Literature review
13
Table 1.1 Comparison of the performances of different battery types [2]
System
(negative/positive
electrodes)
Cell
Voltage (V)
Theoretical
specific
capacity
(practical)
(Ah.kg-1)
Theoretical
volume
capacity
(practical)
(Ah.dm-3)
Theoretical
specific energy
(practical)
(Wh.kg-1)
Theoretical
volume energy
(practical)
(Wh.dm-3)
Cycles
number
Aqueous electrolyte rechargeable batteries
Pb/PbO2
2.1
(2.0)
120
(18)
240
(58)
252
(35)
454
(70)
50-500
Cd/NiOOH
1.35
(1.2)
181
(29)
517
(83)
244
(45)
695
(100)
>500
MH/NiOOH
1.35
(1.2)
178
(63)
570
(200)
240
(75)
768
(240)
> 800
Nonaqueous electrolyte rechargeable batteries
LixC6/Li(1-x)CoO2
4.1
(4.1)
100
(37)
270
(98)
410
(150)
1013
(400)
> 800
Li/MnO2
3.5
(3.0)
286
(40)
894
(88)
1001
(120)
3131
(265)
50-200
*Li/VXOY
3.5
(2.8)
142
(122)
400
(342)
486
(342)
1396
(963)
200
In LPB more than 800 cycles were performed with *Li/VXOY at 100% DOD. [3]
Lead and nickel based rechargeable batteries are examples of aqueous based
electrolytes, lead acid batteries being available from more than 140 years. Current Pb/PbO2
batteries are very reliable and less costly than other candidates. Their practical specific energy

Chapter I : Literature review
14
is close to 35 Wh/kg. Their charge-discharge cycles vary from 50 cycles to 500 cycles
depending on the design of the cell and, probably, to the charging protocols.
Cd/NiOOH, known as Nickel-Cadmium (NiCd) is a well-optimised battery, the most
common cell for an alkaline electrolyte system. It was used for longtime even in portable
electronic but its market shares dramatically decreased in the last decade. Very robust battery it
suffers from two main drawbacks (i) a memory effect that implies a specific charge of the
battery and (ii) a detrimental environmental impact related to the use of cadmium. Cd is highly
toxic but can be almost quantitatively recycled. This recycling can be easily done with high
capacity batteries but it can be feared that some of the small capacity batteries escape to the
recycling. Nickel Metal Hydride batteries (NiMH) are also alkaline batteries having
approximately the same voltage as NiCd but their practical specific energy increases with
regard to NiCd from 45 to 75 Wh/kg. They allow overcoming the issue related to the use of Cd.
They suffer two main drawbacks (i) their self-discharge rate is fairly high and (ii) they use rare-
earth elements (AB5 or AB2 alloys) whose production is concentrated in China, thus submitted
to geopolitical constraints. NiMH cell supplies several hundred charge-discharge cycles and are
used in Hybrid Cars as for instance, Toyota Prius.
Rechargeable batteries with non aqueous and more generally aprotic electrolytes have
been also widely developed and some of them are already available in the market. In most of
them the electrolytes are based on organic solvents, in particular, a lithium salt dissolved in a
mixture of ethylene carbonate and linear carbonates as dimethyl carbonate (DMC),
diethylcarbonate (DEC), or ethyl methyl carbonate (EMC). These kinds of batteries provide
excellent performances but they still needs improvements in term of security and cost. As
example, LixC6/Li(1-x)CoO2 cell has very long cycle life and high specific energy but
unfortunately these materials are expensive. Additionally, this system raises security problems,
which might be amplified by the flammability of the solvents (DMC and EMC have a low
Flash Point, Fp), which can result in the cell burning.
A solution to overcome this problem consists in the replacement of LixCoO2 by LiFePO4
(LFP). LFP is safer and less costly than LixCoO2but its redox potential ~3.5 V vs Li/Li+ is
detrimental does not allow obtaining sufficient energy density when lithium graphite is used as
a negative electrode. Manganese oxides are also excellent candidates for Li batteries.
LiFePO4 and other transition metal phosphates including vanadium have been proposed
as cathode materials. They have promising performances in term of specific capacity, energy

Chapter I : Literature review
15
density and cell voltage. In addition, they are cheaper and more environmental friendly than
cobalt oxides.
I.5. Lithium batteries
Nowadays, lithium batteries have paid attention and increased global demand for the
energy storage domain. The unique properties of lithium element are presented in Table 1.2.
Lithium has the highest capacity, the lowest electrochemical potential (-3.04 V/SHE) and
provides, for a given positive, the highest energy density.
Two types of lithium batteries have been developed: batteries based on Lithium metal
negative, Li0, and batteries based on graphite, LiC6 i.e. lithium ion. Shifting from Li0 to LiC6
was motivated by the instability of Li0, especially during charging [4]. There is roughly an
order of magnitude between the theoretical capacity of Li0 and LiC6 but it must be emphasized
than Li0 is used in large excess with regard to the stoichiometry i.e. often 5 to 7 excess, so the
gap in practical capacity strongly decreases. Li0 has other advantages, namely (i) its electronic
conductivity and (ii) its mechanical strength and ductility; these advantages making useless the
use of carbon black and polymeric binders and allowing its easy calendaring. Although slightly
lower in energy density than lithium metal, lithium-ion is safe, provided certain precautions are
met when charging and discharging. In 1991, the Sony Corporation commercialized the first
lithium-ion battery. Other manufacturers followed. The energy density of current lithium-ion
batteries is typically triple of that of the standard NiCd; some prototypes reaching specific
energies around 200 Wh/kg [5].
Table 1.2 Some properties of Lithium
Properties Lithium
Equivalent weight (g/equiv.) 6.94
Reversible potential (V) -3.045
Electronegativity 0.98
Specific gravity (g/cm3) 0.53
Theoretical specific capacity (A.h/kg) 3,860

Chapter I : Literature review
16
Figure 1.2. Energy density of different types of batteries [6]
Li-ion batteries consist generally of a porous separator, which is soaked with a liquid
electrolyte or of a gelled polymer electrolyte, while rechargeable lithium batteries can only
operate without liquid organic solvents i.e. solid state batteries made of inorganic materials
(electrodes + electrolyte) or polymer batteries based on solvent-free polymer electrolytes. The
solvent-free polymer design offers simplifications with respect to fabrication, ruggedness,
safety and thin-profile geometry. Unfortunately, the solvent-free lithium-polymer batteries
suffer from poor conductivity at low to medium temperatures, operating only around 80°C and,
therefore, are unusable in electronic devices.

Chapter I : Literature review
17
I.5.1. Lithium-ion batteries
In the figure 1.3 is schematically represented a lithium ion battery.
Figure 1.3. Schematic draw of Li-on battery [7].
Typically, the graphite and the transition metal oxide are used as the negative and
positive electrodes, respectively. The electrochemical reactions are presented as follows:
Negative electrode half reaction: LixC6 xLi+ + xe- + C6
Positive electrode half reaction: xLi+ + xe- + Li(1-x)CoO2 LiCoO2
Overall reaction: LixC6 + Li(1-x)CoO2 LiCoO2 + C6
Lithium-ion batteries are divided in two types according the used electrolytes:
Liquid electrolyte: consisting of a molar solution of a lithium salt in a mixture of
organic solvents that filled the porosity of a macroporous separator.
Polymer gel electrolyte: consisting of a dense polymer swelled by a molar solution
of a lithium salt in a mixture of organic solvents

Chapter I : Literature review
18
I.5.1.1. Liquid electrolyte
Solvents
Conventional organic solvents for lithium ion batteries are carbonate-based solvents
such as ethylene carbonate (EC) and propylene carbonate (PC). These cyclic carbonates have
low vapor pressures, thus high Flash Point (Fp), high dielectric constant that favors the ion-pair
dissociation but high viscosities that decrease the ion’s mobility. Except in the case of some
special carbons, PC exfoliates the graphite negative electrode and is therefore not used in Li-
ion electrolytes. Thus, combination of cyclic carbonates e.g. EC and acyclic ones e.g. DMC,
DEC or EMC are used to obtain high enough dielectric constant while moderating the
viscosity. The physical properties of common carbonate solvents are listed in Table 1.3.
Table 1.3 Physical properties of organic solvents [8], [9]
Name Melting
Temperature
(°C)
Boiling
Temperature
(°C)
Viscosity at
25 °C (cP)
Dielectric
constant at 25
°C
Solubility
parameter
(J cm-3)1/2
Ethylene
carbonate (EC)
36.4 248 1.86 at 40 °C 89.6 at 40 °C 30.1
Propylene
carbonate (PC)
-48.8 242 2.5 66.14 27.2
Dimethyl
carbonate
(DMC)
2.4 90 0.59 3.12 20.3
-butyrolactone
(-BL)
-43.3 204 1.75 39 25.8
Lithium salts
Lithium salts incorporated in the organic solvent or polymer gel should be highly stable
in such medium. In addition, they should provide high conductivities, thermal, chemical and

Chapter I : Literature review
19
electrochemical stabilities, non-toxicity and low cost. Several salts are currently used such as
LiPF6, LiAsF6, LiN(CF3SO2)2, LiBF4, LiBOB and LiPF6 being the most used.
More information will be mentioned in the section of “Incorporation of lithium salt and ionic
liquid in polymer electrolytes” (in the section I.8.3).
Liquid electrolytes
These liquid electrolytes can pose some safety concerns; perhaps the most widely
reported of these is the flammability and volatility (low Fp) of the solvents. Under the right
circumstances, the electrolyte in a Li-ion battery can ignite or even explode [10].
Alkyl carbonates, particularly the linear carbonates are flammable and can vaporize at
temperatures that are attainable during battery operation [10], [11]. These kind of electrolytes
have caused safety problems for Li-ion batteries and have complicated the deployment of Li-
ion batteries for electric and hybrid cars [10], [12].
Also, at temperatures above ~ 60°C, the electrolyte solution used in mostly commercial
Li-ion batteries can deteriorate [13]. The dissolved lithium salts can undergo chemical reactions
with the solvents at these elevated temperatures, negatively affecting the batteries performance.
Because these reactions are irreversible, the electrolytes properties are not fully restored even
when the temperature is reduced, and the resulted products can pose additional safety issues.
I.5.1.2. Polymer gel electrolyte (PGE)
Gelled polymer electrolytes, also called ‘‘plasticized polymer electrolytes’, preceded
polymer electrolytes and were early proposed by Feuillade [14] who patented in 1973 the
concept of thin batteries.
Gel electrolytes are obtained by swelling a polymer matrix by the liquid electrolyte. The
required properties are high ionic conductivity down to sub-ambient temperature, wide
electrochemical stability window (with a stability in oxidation up to 4.5 V vs Li/Li+) and
sufficient dimensional stabilities. Among the host polymers used are homopolymers and
copolymers including poly(oxyethylene) (POE) [15], poly(vinyl chloride (PVC) [16],
Poly(acrylonitrile) (PAN) [17], polymethacrylonitrile poly(vinylene fluoride) (PVdF) [18] and
Chapter I : Literature review
20
poly(vinylene fluoride -co-hexafluoropropylene) [19], [20]. Although the electrochemical
stability is mainly governed by the liquid electrolyte contained into the polymer, the latter, as
PAN [14], must be source of electrochemical instability. Our laboratory identified the polarized
hydrogen of PAN repeat unit as the main source of instability and prepared copolymers of
PMAN, where the previous hydrogen is replaced by a methyl group and found a neat
improvement of the stability in reduction [21]. Thus, the interfacial resistance vs Li0 of PAN
gelled electrolytes was found to increase by 500% in 5 days while that of PMAN was constant
over 10 days [22].
Among the above quoted polymers to be gelled POE has a stability in oxidation limited to 3.9-
4V vs Li/Li+ and above all has poor mechanical strength. Dealing with the halogenated
polymers one can fear an instability in reduction (halogen-lithium exchange) and a possibility
to undergo, in presence of bases, a dehydrohalogenation (reaction in chain). However the
fluorinated polymers can be used in lithium-ion batteries based on graphite negatives [23].
According to their crystallinity of host polymers must be unsuited for a gel application: thus
PVdF homopolymer leads once gelled by liquid electrolytes to very poor conductivities [24].
So PVdF homopolymer is well-adapted to a macroporous separator function when PVdF-HFP
is unsuited for macroporous separator but suitable as host polymer of gelled polymer
electrolytes.
I.5.2.Lithium-polymer batteries
The lithium polymer battery differs from other rechargeable batteries by the electrolyte
it uses. The electrolyte is a plastic-like layer, which cannot conduct the electricity, but allows
the exchange of ions. The advantages of this electrolyte are a thin film feature, non-volatility,
non-flammability and safety. Wright et al. [25], [26] first demonstrated the ion conduction in
poly(oxyethylene)/ alkaline salt complexes in 1973. Later, Armand, Duclot and Chabagno
proposed polymer as electrolytes for lithium batteries. [27], [28].
These polymer electrolytes are solvent-free thus the accumulators have not the risk of
solvent leakage. However, the dry lithium polymer suffers from poor conductivity. For several
years now, academic and industrial research groups have unceasingly developed the polymer
electrolyte for higher performances. This part will be more developed in the chapter I.8. Before
some aspect concerning the role of solvents and the key aspects in the improvement of lithium
battery electrolytes are shortly discussed.

Chapter I : Literature review
21
I.6. Solvent in electrolytes of lithium batteries
The electrolyte, one of key components of the battery, is a pathway of lithium
conduction between two electrodes. How it was presented below, usually, the lithium salt is
dissolved in a solvent (organic, polymeric), and the interaction solvent-salt are crucial in
determining the electrolyte performances. The main physical role of the solvent are considered
as follows:
1. Dissolution of ions in solvent
2. Ion pair dissociation and solvation
3. Ion mobility
In order to understand the nature and the interaction force of solute and solvent in the
solution, the dissolution mechanism and ion solvation will be mentioned.
In the fundamental chemistry, when one substance is dissolved into a solvent, a solution is
formed. Solvent molecules arrange around solute molecules. Both substances interact each
other at the molecule level. In the case of the salt, the solute is an ionic specie and the polar
solvent are those with a molecule structure that contain dipoles, thus, the interaction between
the solute and the solvent is an ion-dipole electrostatic interaction. The energy of solvation
depends on the interaction force, in particularly, in the case of ionic solutes. The interaction
force is inversely proportional to the squared distance between solute and solvent molecule. It
means that the smaller ion has more interaction force resulting to perform more energy
solvation with solvent molecule. As deal with solvents, the solvation by the electrostatic
interaction is proportional to the dipole moment () of solvent therefore, polar solvents such as
water, nitrile, amide, etc. can strongly solvate ions.
Born proposed [29] the model of solvation of ionic compound by placing a charge in a
spherical solvent cavity. The solvation energy is equaled to the electrostatic work for
transferring the ion from vacuum to the medium. This is the difference in work to charge the
ion in the two environments. 激喋墜追津 = − 圏22ぱ0 岫な − な追岻
Where q is elemental charge of electron, z is valence of ion concerned, 0 is relative
permittivity in vacuum and r is dielectric constant of solvent.

Chapter I : Literature review
22
Moreover the dielectric constant is as important as the electrostatic interaction between
solute and solvent molecules. Polar solvents have been found to have high dielectric constant
resulting in polar molecules of these solvent can strongly solvate ions. Thus, the polar solvent
can be used for ion solvation.
Thermodynamic dissolution of crystalline material (solute) in the solvent is represented
via the cycle of Born Haber as follows:
(Az+)gaz + (Bz-)gaz (AB)crystal
(Az+)solvate + (BZ-)gaz (Az+)solvate + (Bz-)solvate
This cycle shows the dissolution of two ions (Az+, Bz-). The activities of two species in
saturated solution influence to the solubility which is determined by the sum of free enthalpy of
solvation two ions.
The free energy of dissolution of a crystalline salt is given by:
G°diss(AB) = 2.3 R.T.pKs = G°solv(Az+) + G°solv(B
z-) - G°crist(AB)
From the equation of dissolution energy, the solubility is increased if the energy of
solvation of ions is higher than that of crystal formation or G°diss < 0.
However, this model of Born cannot use to explain for all cases in reality, especially,
small ions (radius < 0.1-0.2 nm) because such ions have other factors which should be
considered for example; the influence of intense electric field of the neighbor. Therefore, the
dielectric constant of ion has to be modified.
Also, the approach of Gutmann is mentioned [30], [31]. The chemical nature of solute
and solvent is considered for this specific interaction such as the hydrogen bond formed
between the protic solvent and doublet electronic solute donor.
The acceptor-donor interaction (Lewis acidity/basicity) corresponds to the formation of
the coordination bond:
between solvent donor molecule and solute acceptor (cation)

Chapter I : Literature review
23
between solvent acceptor molecule and solute donor (anion)
From this concept, the donor number (DN) and acceptor number (AN) of a good solvent
should be thus high for interaction with cation and anion that contribute the dissolution and
dissociation of salt.
I.7. Key aspects for the electrolyte improvement
I.7.1. Electrochemical stability
The electrochemical stability of an electrolyte is one of the important parameters when
rechargeable lithium batteries are concerned. The instability in the electrolyte is known to show
up irreversible reactions. The electrochemical stability window ordinarily expressed for the
stability of the electrolyte should be capable of sustaining highly oxidative condition until the
positive electrode potential (~ 5 V) and at the same time, until the potential of lithium or
lithium graphite for the cathodic stability (0 V vs Li/Li+). However, solvents and dissolved salts
have an influence in the limitation of the stability. Therefore, solvents and salts should be
selected to properly use for electrochemical stability investigation.
Acetonitrile is one of solvents commonly used which has good properties in the
electrochemical potential domain e.g. moderate dielectric constant, fair donor number and low
viscosity. Nevertheless, acetonitrile is replaced by cyclic carbonate compounds such as
ethylene carbonate (EC) and propylene carbonate (PC) because of its toxicity and
inflammability. Apart from the physical property of EC, it can produce an effective solid
electrolyte interphase (SEI) formation on the negative electrode surface to ensure good cyclic
stability. The SEI layer is formed by the inorganic and organic electrolyte decomposition
product during the first charge for further degradation by blocking the electron transport and
allowing the Li ion to pass through it [32]. However, the drawback of EC is its high viscosity
and melting point. Linear carbonates are thus added to improve the physical properties of cyclic
carbonate. On the other hand, the safety of this mixture is decreased because the mixture can be
flammable easier. A co-solvent with a non-flammable additive has to be used for enhancing the
security.
In addition to the influence on solvents affecting the electrochemical instability, the salt
is also a significant factor. For instance, F. Kita et al. investigated the oxidation stability of

Chapter I : Literature review
24
several salts with different fluoroalkyl chain lengths. They found that the oxidation potential of
C8F17SO3Li (6.5 V) is higher than that of C4F9SO3Li (6.0 V) and CF3SO3Li (4.8 V),
respectively and also an increase of fluoroalkyl group can provide higher oxidation potential
comparing with Li/Li+ i.e. (C8F17SO2)(CF3SO2)NLi (6.0 V) > (C4F9SO2)(CF3SO2)NLi (5.9 V)
> (CF3SO2)2NLi (5.2 V) [33].
I.7.2. Transference number
In the electrolyte system, it consists of the cation (Li+) and the anion (A-). The ionic
conductivity is defined by the following equation; = 挑+ + 凋−
Transference number is the parameter that denotes the fraction of the current density to
the total density carried by one of the ions. It can be related to the conductivity by this
relationship [34], [35]. + = 挑+挑++ 凋−
Transference number which ideally for lithium battery application should be unity but a
value of T+ is mostly lower than 1. During the operation of the cell, cations migrate to an
electrode and anions should move to another electrode at the opposite way. However, there are
only cations that react at the electrodes, anions do not involve in these reactions. This can lead
to the concentration gradient in the system and limits the power output of the cell. Thus, there
is much concern about an increase in concentration polarization and attempt to decrease this
phenomenon by the development of salt giving high transference number.
Various techniques are used to investigate the cationic transference number in the
electrolyte: namely the potentiostatic polarization (PP) method, the galvanostatic polarization
(GP) method [36], the electromotive force (emf) method [37], the determination by Pulse Field
Gradient (PFG)-NMR [38] and the impedance measurement [39]. The cationic transference
number obtained depends on the technique used.

Chapter I : Literature review
25
I.7.3.Conductivity and ionic conduction mechanisms
Conductivity
The conductivity of the electrolyte is defined to the ability to conduct ions through such
electrolyte. It depends on two parameters; those are the number of charge carriers and their
mobilities. The number of charge conductors is proportional to the concentration of salt, the
dissociation and solvation of solvent and the nature of salt dissolution. The ionic mobility is
related to the viscosity of the electrolyte and the interaction between ion and solvent.
The solvation behavior of the solvent in the solution is demonstrated in various types. In
the case of the highly concentrated solution or the solvent cannot dissociate the ions
completely, the ion-pair phenomenon that does not contribute the current transport is formed
depending on the extent of the solvation of the two ions as follows (figure 1.4):
Figure 1.4. Various types of ion pair in the electrolyte solution [40].
Moreover, the formation of aggregate can occur at high concentration of solutes as seen
in Figure 1.5. It may be charged and participates to the charge conduction but the performances
are much lower than that of the solvated free ion.
Figure 1.5. Formation of aggregate.

Chapter I : Literature review
26
In the case of poly(ethyleneoxide) (POE), the Li+ migration is done by the polymer
chain segmental motions and ion cluster motions. Figure 1.6 shows 4 possibilities of Li cation
motion in both intra/inter polymer chain and cluster.
Figure 1.6. Cation migration in polymer electrolyte [41]
Ionic conduction mechanisms
Mechanisms of ionic transport in the polymer electrolyte can be explained by two models.
a) Arrhenius model
For semi-crystalline polymer electrolytes at temperature below the melting temperature
(T<Tm) and amorphous system, the conductivity is followed by the Arrhenius law.
= 0 結喧 (−継迎 )
Where is the conductivity (S.cm-1), 0 is pre-exponential factor (S.cm-1), Ea is activation
energy (J.mol-1), R is perfect gas constant (R = 8.314 J.mol-1.K-1) and T is temperature (K).
The variation of conductivity of electrolyte in function of temperature is generally
represented by log () = f(1000/T). This equation is usually used for the polymer electrolyte
which is at the temperature between Tg < T < Tm.
In solid polymer, the movement of polymer chains is quite difficult because of chain
entanglement. Thus, the microscopic viscosity of segmental polymer affects to the ion
transport. The ionic conduction is carried out effectively when there is a balance of the
solvation of ions by the coordinating EO units for promoting the salt dissolution and permitting

Chapter I : Literature review
27
the cation mobility. Moreover, the ions migration from one coordinating site to another
controlled by the segmental motion is also considered for the ionic conduction.
Figure 1.7. Contribution to ion mobility [42].
Another model of H. Vogel, G. Tammann and G.S. Fulcher was proposed to explain the
process that is related to the motion of segment of the polymer.
b) Vogel Tammann-Fulcher (VTF) model
Liquid electrolytes [43], gels [44], molten salts [45] and amorphous polymer at above
the glass transition temperature (T > Tg) has Vogel-Tammann-Fulcher (VTF) [46], [47], [48]
dependence and the conductivity is varied in function of temperature as the following
relationship:
= √ 結喧 ( −継迎岫 − 0岻)
where A is a pre-exponential factor related to the number of charge carriers (S.cm-1.K1/2), Ea is
a pseudo activation energy (J.mol-1), T0 is the ideal glass transition temperature at which ion
mobility goes to zero (K). Above T0, thermal motion of the polymer chains initiates the
transport of ions. T0 is usually found to 50 K below Tg.
At low temperature, the VTF model is dominant and is defined as rate-limiting. When
the temperature is increased, the Arrhenius model becomes rate-limiting because the segment
of polymer chains has more freedom to move.
At constant pressure and temperature, the conductivity can be related to the ion
concentration by this relationship

Chapter I : Literature review
28
(T,P) = qc(+ + -)
where q is the charge, c is the concentration and is the mobility of the cation and anion. The
mobility is related to the diffusion coefficient (D) through the Nernst-Einstein equation;
= qD / kT
For anion transport mechanism, the migration principally depends on the free segmental
motion or a VTF type at all concentrations and temperatures due to the weak solvation with the
polymer host.
I.8. Polymer electrolytes
Up to now, the performance of polymer electrolytes has been continuously improved
under the requirement of a variety of applications. For lithium battery electrolytes, a solvation
of ions by polymer chain is important requirement that can be related to other characteristics of
electrolyte such as the cationic conduction in the term of the conductivity and transference
number and the dissolution of salt in polymeric medium.
When the ability to solvate ions of the polymer electrolyte is considered, the acceptor-
donor numbers (AN and DN) that are related to the formation of coordination bond between
solvent and solute in the system need to be mentioned. Polymers with strong DN such as
polyethers, polyamines or polythiols are promising candidates as the electrolyte because
electron lone pairs at oxygen, nitrogen or sulfur in such polymers can solvate the lithium cation
[49].
Among those high DN polymers, poly(oxyethylene) (POE) based compounds have been
studies, because POE forms more stable complexes with inorganic salts and possesses higher
solvating power for salt than any other polymers [50].
I.8.1.Poly(oxyethylene) based electrolytes
Poly(oxyethylene) is synthesized via the polymerization of oxyethylene (CH2CH2O)
monomer by a ring opening mechanism. The monomer molecules are highly strained and
possess a triangle structure which favors to open in the presence of polymerization initiators.

Chapter I : Literature review
29
The regularity of repeating units allows a high degree of crystallinity of the polymer. Since the
experiment of Wright, the studies have been focused on the bulk properties of polymer
electrolytes based on the combination of poly(oxyethylene), the most extensively dry solid
polymer electrolytes for lithium batteries, with various salts. This led to understand the
characteristic and improve the performance of such complex. As the following factors, either
the unique characteristic of host polymer or the additives incorporated may affect to the
properties of electrolytes.
Regarding the polymer chain length effect, in the case of POE/LiN(SO2CF3)2 complex,
the mixture of low Mw POE is always viscous liquid whereas the high Mw POE amorphous
mixture spends a period of weeks to months to form crystalline regions. In contrast, the
crystalline phase formation of P(OE)6-LiSbF6 and LiAsF6 can occur with both low and high
MW POE. The influence of the high MW P(OE)3-LiCF3SO3 on the Tm is not much but for
shorter POE chains, Tm is considerable lowered whereas all complexes perform the same
pattern of ion coordination [51].
POE has been found to complex with a wide variety of lithium salts. POE-LiClO4
complexes (Mw = 2×10⁶) were studied by B.K. Choi et al.[48]. They found that the
conductivity was in the range of 10-7-10-6 S/cm with the salt concentration (O/Li) ranging
between 10 and16 at 20°C. The thermal and ion transport characterization of the system POEn
–LiPF6 were investigated. The conductivity is higher than 10-4 S/cm at 70°C with O/Li= 30 but
it was around 10-8 S/cm at room temperature [52].
As a function of concentration of lithium salt in POE considered, the decreases of
conductivity and cationic transference number were observed when the concentration was
increased [53]. This was due to the formation of ion pairs instead of the free lithium ions which
is more useful for the conduction [54].
POE based polymer electrolyte exhibits very poor ionic conductivity (~10-8 S/cm at
40°C) [55] which is a serious barrier in potential technological application. It was widely
believed that this obstacle comes from the high degree of crystallinity (~65%) which hinders its
ability for ionic conduction. Above the glass transition temperature (Tg), the segmental motion
can move faster in the amorphous phase than in the crystalline phase, therefore, the cations
migration occurs predominantly in the amorphous phase. Even though Bruce et al. [56]
demonstrated that highly crystalline polymer electrolytes exhibit remarkable ionic conductivity
although the value was still lower than in the amorphous phase and the understanding about the

Chapter I : Literature review
30
phenomenon of ion transport in those crystalline polymer electrolytes is still not completely
clear. Later, Q. Liu et al. [57] reported that the conductivity of P(OE)6/LiAsF6 complex
decreases by around 3 orders of magnitude with the molecular weight of POE from 1000 to
6000 Da.
In this context the research was focused on development of modified POE in order to diminish
the crystallinity and improved the mechanical properties. Some of these approaches are
presented here below.
I.8.2.POE with lower crystallinity degree
One of the strategies to improve the performance of solid electrolyte, in particular the
conductivity is a decrease of the crystalline region. Many approaches were proposed to
eliminate the crystallinity of polymer electrolyte. Two extensively studied approaches are (i)
the modification of POE molecule structure and (ii) the adding material able to interact with the
POE decrease its crystallization ability (nanocharge, plasticizer, etc.).
Modified POE
Polycondensats
The polycondensation of oligomer of POE with a co-monomer leads to decrease the
crystallinity and the melting temperature of POE which commonly exhibit around 65% and
65°C, respectively. Le Nest et al. [58] reported first work about polycondensats by preparing
poly(urethane ether) from polyethylene glycol (PEG) end capping with OH group and
polyisocyanates. The resulting polymer exhibited an amorphous behavior at ambient
temperature. However, the main problem with this synthesis consists that the unreacted PEG
and polyisocyanates, that are difficult to remove from the final polymer, are instable to the
lithium metal.
Polyurethanes (TPU) with chelating groups was also carried out from 4,4’-diphenylmethane
diisocyanate (MDI) , poly(ethylene glycol) (PEG) and imino-diacetic aide (EP-1DM). The hard
domain of this polymer not only provided good mechanical properties but also decreases the
crystallinity of the polyether. The complex with 0.25 mmol (g TPU)-1of LiClO4 reaches a
conductivity of 1.5 ×10⁻⁶ S/cm [59].

Chapter I : Literature review
31
Benrabah et al. [60] synthesized poly(amide ether) by polycondensation between an ,-
diamine poly(oxyethylene -co-oxypropylene) (Jeffamine®diamine) and terephthaloyl chloride.
The linear polymer obtained had less crystallinity and its melting temperature was decreased.
Moreover, F. Alloin et al. [61] investigated the thermal behavior of various Mw polymers
synthesized by a Williamson reaction. The polycondensation of polyethylene glycol (PEG) and
3-chloro-2-chloromethyl-1-propene provided linear polycondensates with a lower melting point
compared to a starting PEG.
Branch polymer
Comb polymer
Watanabe and co-workers [62], [63], [64] first reported the synthesis of comb shaped
polymer with both backbone and side chains consisting of ethylene oxide units. Short ether side
chain decreased the crystallization and promoted the mobility of polymer segments leading to
higher conductivity at room temperature when compared with linear POE matrix. However, it
was found the loss of mechanical properties of comb-shape polymers when the number of side
chains was increased [65], [66].
Comb-shaped polymers with poly(oxyethylene) side chains blended with POE polymer were
designed and these polymer were consist of various types of macromolecules as the backbone
including the oxyethylene unit and derivatives [67], [68], [69] aromatic polyether [70]. The
conductivity, of complexes based on comb-shaped polymers and LiClO4 was found around 10-4
S/cm at room temperature and DSC characterization showed that the copolymer might play a
role of plasticizer to increase the free volume and favors the ion conduction.
Due to the presence of flexible amorphous phase, the mechanical properties are reduced. In
order to improve the mechanical properties of these solid polymer electrolytes, a new approach
is a comb-like network polymer. The expected drop of conductivity caused by crosslinking was
well compensated by the introduction of POE side chain as shown in figure 1.8. It provided the
conductivity of 1.01×10⁻⁴ S/cm and the storage modulus of 0.66 MPa at 30°C.

Chapter I : Literature review
32
Figure 1.8. Comb-like network polymer electrolyte [71].
Star shaped polymer
Star shaped polymers have unique structure with multiple chain ends and large free
volume. Therefore, they are interesting materials for solid polymer electrolytes. This polymer
consists of two main parts; the first part is the core of the molecule often made from siloxane
acrylate [72], [73], polyhedral oligomeric silsesquioxane [74] or diepoxide [75] and another
important part are the side groups of POE or its derivative. Star-branched polymers in
POE/lithium salt system can inhibit the crystallization and improve the ion transport through
the matrix by the contribution of side chains. In addition, the core of star-branched polymer can
enhance the mechanical strength of the polymer but still low for some electrolytes [75]. The
conductivities were around 10-5 – 10-4 S/cm at 30°C.
Figure 1.9. Star-branched structure; D= core, = reactive site on the core, lines represent POE
chains [75].
Block copolymer
Another approach to improve the multiple properties for POE based polymer electrolyte
is the utilization of block copolymers. J. Ji et al. [76] studied the multiple functional diblock
POE-b-PE copolymer to enhance the ionic conductivity and mechanical properties. The
conductivity was more than 10 times higher than that from the POE/LiClO4 complex. And also,

Chapter I : Literature review
33
the mechanical properties were improved 2-6 times compared to POE/LiClO4 electrolyte.
Moreover, the XRD results showed that a degree of the crystallinity was obviously decreased
and no ion pair formation in the sample. An increase of the amorphous phase by the copolymer
provided more free volume for the ion movement. Other analogous material of POE was used
for the formation of di-block copolymers such as methoxy capped oligo(ethylene) glycol
methacrylate (EGMA). (PMMA)x-b-(PnEGMA)y (n=8~9, x/y ratio 3/1) was synthesized
through atom transfer radical polymerization (ATRP) and gave the conductivity of 2 × 10⁻⁶
S/cm at room temperature when doped with LiTFSI [77].
Polymer electrolytes based on triblock copolymer of POE complexed with different
lithium salts have been proposed. PMAN-b-POE-b-PMAN triblock copolymer was prepared by
the anionic polymerization with different starting PEGs. The complexes of LiTFSI PMAN-b-
POE-b-PMAN copolymers was studied, the interaction between cation and polymer chain was
evidenced. PMAN domain exhibited higher salt dissolution ability whereas POE block had
stronger cation solvation ability. The conductivity reaching 10-5 S/cm at 37°C was still too low
for dry polymer electrolytes [78]. H. R. Allcock et al. synthetized poly(phosphazene)-
poly(oxyethylene) copolymers. The membranes based on poly(phosphazene)-
poly(oxyethylene) copolymers and lithium triflate shown conductivity of 10-4 S/cm at high
temperature and 7.6 × 10⁻⁶ S/cm at room temperature [79]. The polystyrene (PS) and
poly(ethylene glycol) methyl ether methacrylate (PME BAB block copolymer was synthesized
by T. Niitani et al.. The micro phase separation with a continuous POE phase was observed
when the POE content exceeded 70%. The copolymer/LiClO4 complex exhibited the
conductivity of 2× 10⁻⁴ S/cm at 30°C and had good electrochemical stability [80].
Network polymer
Cross-linking of the polymer is another effective way to suppress or decrease
significantly the POE crystallization degree. Additionally, the cross-linking is also very
beneficial to enhance the mechanical strength of the polymer comparing to the corresponding
linear polymer electrolytes. The cross-linking gives to the polymer a rubber-like aspect, large
amorphous phase which enhance its ionic conductivity when incorporated with the salts and
prevents the creeping behavior of elastomeric materials [81], [82].
Two possible strategies are proposed for the formation of cross-linked polymer electrolytes
depending upon the basis on which monomers undergo the chemical reaction. The first strategy

Chapter I : Literature review
34
is the polycondensation of di or tri functional monomers. It could be seen in several studies of
J. F. LeNest et al. and M. Mastragostino et al. for example; multi-functional reactive molecules
such as triisocyanate [83], [84] or triphenylisocyanate [85] and polyether glycol or its
derivatives were used as substrates for the formation of network polymers. Another technique
is the utilization of the crosslinking agent and macromolecules for instance, phosphate-
polyether networks were synthesized by the polycondensation reaction of phosphorus
oxychloride (POCl3) with poly(ethylene glycol)/poly(tetramethylene glycol) (PEG/PTMG)
(70/30) copolymers to improve ionic conductivity at room temperature without decreasing
mechanical properties [86].
The second strategy is the addition reaction of the moderate molecular weight pre-polymer
which generally occurs among double or triple-bonded molecule called the post-crosslinking.
The post-crosslinking need reactive groups introduced to the polymeric chain. The reactivity
and reaction rate of these groups can be controlled by different parameters i.e. temperature,
radiation, external reactant (such as moisture, O2, H2O, etc) and processing [87].
The polymers containing reactive groups (double bonds) were prepared by F. Alloin et al.
[88].The linear Poly(oxyethylene)/ allyl glycidyl ether copolymer obtained from the ring
opening polymerization exhibited a lowering of crystallinity and melting temperature when
compared to those of POE homopolymer. After the crosslinking, the post cross-linked polymer
provided the lower proportion of crystalline phase. The conductivity of the network polymer
was 10-4 S/cm at 32°C and the mechanical properties were also improved.
Moreover, the three-dimensional networks were synthesized from linear polycondensats of
poly(isobutenyloligooxyehtylene) [89] and showed high dimensional and thermal stabilities.
Membranes with conductivity of 2×10⁻⁵ S/cm at 20°C and 10-3 S/cm at 80°C (for
NPC1000/LiTFSI O/Li=9) were obtained when LITFSI (O/Li=14) was added to this network.
However, cationic transference number of only 0.06 was reported for such membranes [90].

Chapter I : Literature review
35
I.8.3.Blended-based polymer electrolyte
The second approach for reducing the crystalline phase in polymer electrolyte is the
addition of other materials to the POE system such as
Other polymer (polymer blending)
Plasticizers
Inorganic fillers
a. Blended-based polymer electrolyte
The blending of two or more polymers together has been extensively paid attention due
to the simplicity of preparation and easy control of the physical properties within the
compositional regime. The influences on the electrical, thermal and mechanical properties of
polymer electrolytes can also be evaluated from the relative importance of various factors
which involve in polymer blends. However, polymer selected for blending system should be
concerned in the compatibility that can lead to the phase separation problem. Many POE-based
blend systems have been studied e.g. POE/PPO [91], POE/ PVP [92], POE/PAN [93]. The
blending of a fully amorphous poly(ethylene oxide-co-propylene oxide) network with POE
exhibited a network –type morphology with no obvious microcracks that commonly found in
the blend-based polymer and can reduce the crystallization and the melting temperature. At
higher than 50 wt% of network polymer mixing, the blended-based polymer electrolytes have
an excellent dimensional stability at high temperature. Below 50°C the conductivities were
slightly increased due to the adding of network polymers [94]. In additional to such binary
blend system, the ternary blends have also been studied. As pointed out by A.M. Rocco and co-
workers [95], POE/poly(bisphenol A-co-epichlorohydrin) (PBE) blend polymers which are
known to be miscible in all blend compositions due to the intermolecular hydrogen bonds
between polymers performed a decrease in a degree of crystallinity and depression of the
melting temperature of the system. The complexation of Li cation by both POE and PBE
oxygen atoms was confirmed by FTIR evidence. The dissociation behavior of LiClO4 was
highly affected to the ionic conductivity of polymer electrolyte at room temperature. However,
the conductivity obtained was only 10-5 S/cm, probably due to the high Tg of PBE and
insufficient number of basic oxygen sites for Li+ coordination. Low-molecular weight
poly(vinyl ethyl ether) (PVEE) was added to improve the performances. Importantly, the

Chapter I : Literature review
36
conductivity values of 10-3 Ω-1cm-1 (20 wt% LiClO4) at room temperature are the highest
values among the literature cited for lithium polymer electrolyte system.
b. Inorganic fillers
One way of enhancing the ion conduction as well as the mechanical properties is the
incorporation of inorganic fillers such as nano-particulate ceramics (TiO2, SiO2, Al2O3, etc),
carbon nanotubes, nanaclays (monmorillonite). Therefore, this polymer electrolyte is called
composite polymeric electrolyte. POE-LiClO4 based composite polymer electrolyte containing
nano-Al2O3 as fillers was prepared by E.M. Masoud et al. [96]. The introduction of ceramic
fillers did not only reduce the crystallinity and the melting point but increased the dielectric
constant that subsequently, increased the conductivity. In the case of nano-clay, the addition of
lithium monmorillonite (LiMMT) was proved to decrease the crystallinity of POE which
completely disappear above 40 wt% of LiMMT and reduced POE melting temperature.
Moreover LiMMT can improve the conductivity, however at high content of LiMMT, the ion
mobility decreased due to the self-aggregation. The thermal stability was significant lower than
that of the corresponding POE [97].
c. Plasticizers
Increasing the amorphous nature of the polymer electrolyte can be achieved by the
addition of plasticizing agents with high dielectric constants relating to enhance the dissociation
of ion pair of the salt [98]. Plasticizers commonly used in solid polymer electrolyte system are
polar organic solvents i.e. ethylene carbonate, propylene carbonate. These solvent can easily
dissolve numerous salts and obtain good conductivity but they are volatile and flammable that
may cause a safety concern for lithium battery application [99]. Therefore, non-volatile
solvents and low molecular weight polyether are considered as a plasticizer to the matrix
polymer [99], [100], [101]
In addition, some salts and ionic liquid can also act as plasticizers.
Chapter I : Literature review
37
Ionic liquids
So far, the approach of plasticization has been the conventional way to reduce the
crystallinity resulting in an increase of amorphous phase content of the polymer electrolytes.
However, the organic solvents widely used as plasticizers lead to the safety issue due to their
volatile nature and the reactivity with metal electrodes. Thus, the replacement of such solvents
by the addition of room temperature ionic liquids (RTILs) is the promising approach for POE
electrolytes.
Ionic liquids are molten salts at room temperature that generally consist of organic
cations and organic or inorganic anions. Ionic liquids have been paid attention for their use as
an additive for electrolytes in lithium battery application due to their advantages such as non-
flammability, negligible vapor pressure, high ionic conductivity and high thermal, chemical and
electrochemical stabilities [102]. The combination of a polymer matrix and an ion conducting
ionic liquid affects the properties of POE-based electrolytes. A broad and stable amorphous
region is increased and creates the free-volume for facilitating the ion conduction [103]. The
improvement of conductivity requires low viscosity and high dielectric constant ionic liquid to
increase the flexibility to polymer electrolytes and to promote the dissociation of paired ions.
Several ionic liquid possessing such properties have been studied for polymer electrolytes.
Their performance relies on the component of ionic liquid such as those with cations based on
imidazolium [104], pyrrolidium [105], piperidinium [106], morpholinium [19] and quarternary
ammonium [107]. Methyl butyl pyridinium (PYR14)TFSI is considered a very promising ionic
liquid for lithium batteries due to its wide electrochemical window, high ionic conductivity and
hydrophobicity. It was examined that the incorporation of PYR14TFSI ionic liquid in POE
matrix and crosslinked POE electrolyte effectively prevented the crystallinity of POE. The
ternary system of linear POE-LiTFSI-PYR14TFSI and UV cross-linked POE-LiTFSI-
PYR14TFSI solid polymer electrolytes were performed, and conductivity of 1.1×10⁻⁴ S/cm
[108] and 3×10⁻⁴ S/cm at 20°C [109], respectively were reported while the conductivity of pure
PYR14TFSI was around 2×10⁻³ S/cm. [110] Moreover, no obvious change of conductivity when
the irradiation time increased.

Chapter I : Literature review
38
Lithium salts
The performances of an polymer electrolyte depend not only on solvent but also on
lithium salt. A strategy for improving the conductivity of polymer electrolyte is the increasing
of number of charge carriers by the incorporation of high dissociated salt and adequate salt
concentration avoiding the formation of ion pair and aggregation of salt which may obstruct the
coordination between cation and polymer chain and subsequently, affect to the ion migration.
Suitable salts should possess the large anion with well delocalized negative charge and low
basicity leading to good salt dissociation, less ion pairing and high conductivity in POE matrix.
Many salts have been developed the main characteristic being presented in Table 1.4.
Among them, those based on bis(trifluoromethyl sulfonyl)imide anion or LiTFSI
initially synthesized by M. Armand and C.E.M.F. El Kadiri [111] then commercialized by 3M®
[112] has been most extensively studied as charge carrier for solid polymer electrolytes. As
discussed earlier, the TFSI anion has unique features with (i) high flexibility of –SO2-N-SO2-
bringing to the plasticizing effect and to lower crystallinity in POE. (ii) A decrease of the
interaction between Li+ and TFSI- by highly delocalized charge distribution of TFSI- and, (iii)
excellent thermal, chemical and electrochemical stabilities are performed in this outstanding
salt.
Another salt in the imide family, bis(fluorosulfonyl)imide Li[N(SO2F)2] (LiFSI), has been a
rapidly growing interest in lithium as a conducting salt with good anticorrosive properties for
Li-ion batteries. However, the salt with high purity cannot be synthesized in an unspecialized
laboratory due to its difficulty of preparative process [113]. H. Zhang et al. [114]
comparatively studied the performance of LiFSI and LiTFSI salts in poly(oxyethylene) matrix
with Mv =5×10⁶ g/mol. Above 60°C, the ionic conductivity of LiFSI was higher than that of
LiTFSI one and exceeded 10-3 S/cm at 80°C. On the other hand, the transference number of
LiFSI/POE electrolyte was 0.14 whereas that of LiTFSI/POE matrix was 0.18. That was
expected due to the smaller size of FSI- bringing out more mobile than the bigger anion like
TFSI-. Both FSI- and TFSI- anions dominated the plasticizing effect on their polymer
electrolyte that might increase the free volume and lead to enhance the ion mobility in polymer
matrix. Moreover, POE/LiFSI and POE/LiTFSI complexes were electrochemical stable up to
5.3 and 5.7 V vs Li+/Li, respectively.

Chapter I : Literature review
39
Table 1.4: Structure and properties of commonly used lithium salts in polymer electrolytes
[115]
Lithium
salts Anions Main Characteristics
LiPF6
High conductivity, favor SEI formation
Decomposes in the presence of moisture and reacts with
electrolytes at high temperature resulting in the formation of HF
LiClO4 Broad electrochemical stability window
Low solubility in carbonate type solvent
LiBF4 Broad electrochemical stability window
Low solubility in carbonate type solvent
LiTFSI
High solubility, conductivity, electrochemical stability
Unable to form passivation layer on Al current collectors (Al-
degradation and corrosion)
LiFSI
Higher conductivity compared to LiTFSI, high electrochemical
stability
Unable to form passivation layer on Al current collectors (at the
presence of LiCl)
LiBETI High solubility, conductivity, electrochemical stability
Unable to form passivation layer on Al current collectors
LiBOB
High electrochemical stability and long term stability
Form highly resistive SEI-film (low conductivity in comparison to
LiPF6 and LiTFSI)
LiDFOB
High electrochemical stability and cycling behavior, Able to form
passivation layer on Al current collectors
Lower solubility in carbonate type solvent compared to LiTFSI and
LiPF6 but higher than LiBOB
In addition to the studies on linear polymer electrolytes, the network matrix was also
investigated. The matrix of NPC1000/LiTFSI with the salt concentration O/Li =14.5 exhibited

Chapter I : Literature review
40
the conductivities of more than 10-3 S/cm at 110°C and around 10-5 at room temperature [116],
[117] while the transference number was approximately only 0.1 to 0.15 at 80°C [90].
Recently new lithium salts have been developed and were incorporated in POE based
polymers. Thus E. Paillard et al. [118], [119] synthesized a family of aryl based on
perfluorosulfonylimide and perfluorosulfonate lithium salts. They exhibited high chemical and
thermal stabilities even the conductivities were insufficient at room temperature. The
transference numbers of sulfonate salts (T+ = 0.4 to 0.55) were higher than those of
sulfonylimide ones (T+ = 0.20 to 0.26) and both values, hosted in POE, were higher when
compared to LiTFSI. The ionic conductivities were around 10-4 S/cm at 70°C and some of
perfluorosulfonate salts had an outstanding stability in oxidation (>5.8 V vs Li/Li+).
Figure 1.10. General structure of (a) sulfonylimide and (b) sulfonate salts proposed by E.
Paillard et al.
Macromolecular single-ion conductors
It is generally accepted that not only the conductivity but also the transference number
is the main parameter considered for the polymer electrolyte performance. Practically, the
lithium cation transport is coupled to the motion of polymer backbone or segmental motion of
polymer chain by coordinating interactions of mobile Li+ to ether oxygen while the counter
anions have weaker interactions with main chains allowing to occur more facile migration of
anions compared to cation transport thus, a major drawback of dual ion conduction is the low
transference number [110]. Additional, the accumulation of such anions at anode electrode and
low diffusion coefficient of Li cations cause the salt concentration gradient which further the
concentration polarization and thus the poor performance of the cell [120]. To achieve the high

Chapter I : Literature review
41
transference number equaling to unity in theory, the single ion conductor should be prepared, in
which the anions are immobilized by covalently linking the anions to the polymeric chains
[121]. With such feature, it is expected that only lithium cations mobile in the polymeric
matrix. However, the polymer electrolytes obtained from this idea had some issues in the
purification because they were involved in several synthetic steps and could not be isolated
from the starting materials resulting in the conductivity in the range of 10-8 to 10-7 S/cm [122].
Single ion conducting concept has been attracted by several research groups, particularly,
Watanabe et al., Armand et al. and DesMarteau et al. [118-121]
Polymeric lithium salts of imide anions whose well delocalized negative charges were studied
by Watanabe and co-workers [123], [124]. The space length between anionic charges
influences to the conductivity and the dissociation of salts. These salts can increase the cationic
transference number.
Armand and co-workers [125], [126] prepared the polymer alloys from blending POE with of
lithium poly(4-styrenesulfonyl(trifluoromethylsulfonyl)imide polyelectrolyte. The conductivity
was still low (7.94×10⁻⁷ S/cm at 40°C) for practical use in Li-ion batteries even through this
polyanion contains the flexible and delocalized nature of the –SO2-N-SO2-CF3 providing more
amorphous region in polymer matrix. On the other hand, the lithium-ion transference number is
almost unity (T+ = 0.92) at 60°C.
Perfluorinated polymer with sulfonylimide group was also studied by DesMarteau and co-
workers [127], [128]. Aliphatic and aromatic lithium salt of sulfonylimide anions attached
covalently to a polyether oligomers of variable chain length. The highest ambient temperature
conductivity of ~10-6 S/cm was observed and it reached in the range of 10-4-10-3 S/cm at 120°C.
Even though, transference numbers were not investigated but the concentration polarization
gradient was not found by galvanostatic polarization studies.

Chapter I : Literature review
42
Figure 1.11. Structures of (a) aliphatic and (b) aromatic lithium ionic melts of DesMarteau
and co-workers [127], [128]
Besides sulfonylimide anions, polyethers also functionalized with other ionic end groups such
as carboxylate, sulfonate and sulfate which were presented in the research work as follows.
Bannister et al. prepared a perfluorocarboxylate anion as a single cation conductor although,
this lithium salt was not enough dissociated in polyether matrix resulting in the poor
conductivities [129]. In order to decrease the ion paring by using the fluorine atom compound
and simultaneously, achieve the high transference number which closing to unity, T. Hamaide
and C. Le Deore were trying to blend a large perfluorinated sulfonate lithium salt (C8F17SO3Li)
with a higher molecular weight POE [130]. D. Benrabah et al. studied perfluorosulfonate
lithium salts grafting network polyethers. They provided the conductivity of 10-7 S/cm and 10-6
S/cm at ambient temperature and 72°C, respectively. Besides, the conductivity increased to 10-5
S/cm when such lithium salt was incorporated in NPC1000 matrix [131]. K. Ito et al. reported
the systhesis of PEG, PPG and PEGME attached with lithium benzenesulfonate on the chain
end and the conductivities of such oligomer lithium salts [132]. W. Xu et al. prepared different
chain lengths of PEGs end-capped with sulfonate benzoyl group (EOnPSLi) possessing the self
dissociation. The length of ethyleneoxy repeating unit of such lithium salts affected to the ionic
conductivity behavior (2.7×10⁻⁷ S/cm for n=2 and 1×10⁻⁵ S/cm for n=12 at room temperature,

Chapter I : Literature review
43
pure salt) while the conductivities of blend POE/EOnPSLi complex were in the range of 10-8-
10-7 S/cm at 25°C. However, the transference number was not mentioned [133].
Figure 1.12. Structure of lithium p-[methoxy-oligo(ethyleneoxy)phenylsulfonate.
X. Ollivrin synthesized PEGs end –capped by lithium perfluorosulfonate and obtained high
value of conductivity when lithium salts were incorporated in the high molecular weight POE
(10-3 S/cm at 78°C) [134]. Mono and di-lithium salt based on oligoether sulfate was carried out
by C. Chauvin et al. The conductivity reached 6×10⁻⁵ S/cm at 70°C and was close to 10-5 S/cm
at 30°C for pure mono lithium salt while pure di-lithium salts exhibited the conductivities of
8×10⁻⁵ S/cm at 70°C and 2×10⁻⁵ S/cm at 30°C. The transference numbers of two salts were
almost unity at 70°C [135].
Figure 1.13. Structure of mono lithium salt based on oligoether sulfate.
I.9. Motivation of thesis work
The main objective of my thesis work is to performed polymer electrolytes based on
POE and lithium salt complexes with high conductivity at low temperature and good
mechanical properties after the melting point of POE. Therefore new salts were synthetized
with the aim to improve the interaction between the POE chains and the anion of lithium salt
and hence perform POE electrolytes with lower crystallization degree and higher cationic
transport number as compared with the polymer electrolytes based benchmarked salts.
In the first part aromatic perfluorosulfonate mono-end caped with polyethylene glycol are
synthetized and characterized in POE and POE derivate electrolytes.

Chapter I : Literature review
44
The second part is dedicated to the synthesis and characterization of aliphatic
perfluorosulfonates and perfluorosulfonimide salt. In order to performed membrane with good
mechanical properties POE with double bonds were synthetized and cross-linked by UV
irradiation.
The impact of salt structure on the POE and cross-linked POE membrane are study in terms of
conductivity, thermal and thermo-mechanical properties, cation transport number.
I.10. References
[1] http://www.ehow.co.uk/about_5397626_advantages-disadvantages-rechargeable-
batteries.html, (2014).
[2] C. Chauvin, Thesis, Institut Polytechnique de Grenoble, 2005.
[3] M. Gauthier, A. Bélanger, P. Bouchard, B. Kapfer, S. Ricard, G. Vassort, et al., J. Power
Sources. 54 (1995) 163 – 169.
[4] http://batteryuniversity.com/learn/article/is_lithium_ion_the_ideal_battery (accessed July
13, 2014).
[5] C. Arbizzani, F. Colò, F.D. Giorgio, M. Guidotti, M. Mastragostino, F. Alloin, et al., J.
Power Sources. 246 (2014) 299 – 304.
[6] J. Tarascon, M. Armand, Nature. (2001) 359.
[7] C. Daniels, J. Besenhard, Handbook of Battery Materials, 2011.
[8] J.Y. Song, Y.Y. Wang, C.C. Wan, Electrochem Soc. (2000) 3219.
[9] B. Scrosati, S. Megahed, Electrochem Soc Shirt Course. (1993).
[10] Q. Wang, P. Ping, X. Zhao, G. Chu, J. Sun, C. Chen, J Power Sources. 208 (2012) 210–224.
[11] M. Holzepfel, C. Jost, A. Prodi-Schwab, F. Krumiech, A. Wursig, H. Buqa, et al.,
Carbon. (2005) 1488–1498.
[12] E. Quartarone, P. Mustarelli, Chem Soc Rev. (2011) 2525–2540.
[13] J.S. Lee, J.Y. Bae, H. Lee, N.D. Quan, H.S. Kim, H.Kim, J Ind Eng Chem. (2004)
1086–1089.
[14] G. Feuillade, Ph. Perche, J Appl. Electrochem. 5 (1975) 63–69.
[15] P.P. Prosini, S. Passerini, Solid State Ion. 146 (2002) 65 – 72.
[16] E.M. Shembel, O.V. Chervakov, L.I. Neduzhko, I.M. Maksyuta, Y.V. Polischyk, D.E.
Reisner, et al., J. Power Sources. 96 (2001) 20 – 28.
[17] B. Kurc, Electrochimica Acta. 125 (2014) 415 – 420.
[18] F. Boudin, X. Andrieu, C. Jehoulet, I.I. Olsen, J. Power Sources. 81–82 (1999) 804 –
807.
[19] K.-S. Kim, S.-Y. Park, S. Choi, H. Lee, J. Power Sources. 155 (2006) 385 – 390.
[20] C.L. Cheng, C.C. Wan, Y.Y. Wang, Electrochem. Commun. 6 (2004) 531 – 535..
[21] N. Chaix, F. Alloin, J.-P. Bélières, J. Saunier, J.-Y. Sanchez, Electrochimica Acta. 47
(2002) 1327 – 1334.
[22] J.-P. Belières, M. Marechal, J. Saunier, F. Alloin, J.-Y. Sanchez, J. Electrochem. Soc.
150 (2003) A14.
[23] J. Saunier, F. Alloin, J.Y. Sanchez, G. Caillon, J. Power Sources. 119–121 (2003) 454 –
459.

Chapter I : Literature review
45
[24] J. Saunier, F. Alloin, J.Y. Sanchez, L. Maniguet, J. Polym. Sci. Part B Polym. Phys. 42
(2004) 2308–2317. doi:10.1002/polb.20099.
[25] D.E. Fenton, J.M. Parker, P.V. Wright, Polymer. (1973) 589.
[26] C.C. Lee, P.V. Wright, Polymer. 23 (1982) 681 – 689.
[27] M.B. Armand, J.M. Chabagno, M. Duclot, St Andrews Scotl. (1978).
[28] M. Armand, J.M. Chabagno, M. Duclot, Fast Ion Transport in Solids, Elsevier N. Y.
USA. (1979).
[29] B. Trémillon, Electrochimie analytique et reactions en solution, tome 1, Masson, (1993).
[30] V. Gutmann, Coordination chemistry in non aqueous solutions, Springer. (1968).
[31] V. Gutmann, Coord. Chem. Rev. (1975) 107.
[32] E. Peled, J Electrochem Soc. (1979) 2047.
[33] F. Kita, H. Sakata, S. Sinomoto, A. Kawakami, H. Kamizori, T. Sonoda, et al., J. Power
Sources. 90 (2000) 27 – 32.
[34] J.O.M. Bockris, A.K.N. Reddy, Mod. Electrochem. 1 – Ion. (1998) 489.
[35] M.M. Hiller, M. Joost, H.J. Gores, S. Passerini, H.-D. Wiemhöfer, Electrochimica Acta.
114 (2013) 21 – 29.
[36] S. Zugmann, M. Fleischmann, M. Amereller, R.M. Gschwind, H.D. Wiemhöfer, H.J.
Gores, Electrochimica Acta. 56 (2011) 3926 – 3933.
[37] M. Amereller, T. Schedlbauer, D. Moosbauer, C. Schreiner, C. Stock, F. Wudy, et al.,
Solid State Chem. (2014) 1–18.
[38] P.M. Richardson, A.M. Voice, I.M. Ward, Electrochimica Acta. 130 (2014) 606 – 618.
[39] Soeresen, P.R., Jacobsen, T., Electrochimica Acta. (1982) 1671–1675.
[40] B.E. Conway, Electrochemical Supercapacitors: Scientific Fundamentals and
Technological Applications, Kluwer Acad. Plenum Publ. (1999) 698.
[41] F.M. Gray, Polym. Electrolyte R. Chem. Soc. Camb. (n.d.) 1997.
[42] G. Nazri, G. Pistoia, Lithium Batteries : Science and Technology, (2009). [43] S.I. Smedly, The interpretation of conductivity in liquids, Plenum Press. (1980).
[44] H.S. Choe, B. Caroll, D.M. Pastiquareillo, K.M. Abraham, Chem Mater. (1997) 369.
[45] C.A. Angell, J Phys Chem. (1964) 218.
[46] H. Vogel, Phys Z. (1921) 645.
[47] G. Tammann, W. Hesse, Z. Anorg, Allg Chem. (1926) 245.
[48] G.S. Fulcher, JAm Chem Soc. (1925) 339.
[49] F.M. Gray, Solid Polymer Electrolytes, in: VCH, New York, 1991: p. 4.
[50] A. Ghosh, P. Kofinas, ECS Trans. (2008) 131–137.
[51] W.A. Henderson, Solid State Ion. 217 (2012) 1 – 5.
[52] B.K. Choi, Y.W. Kim, Electrochim Acta. (2004) 2307–2313.
[53] A. Magistris, P. Mustarelli, E. Quartarone, C. Tomasi, Solid State Ion. 136–137 (2000)
1241 – 1247.
[54] I. Oslen, R. Koksbang, E. Shou, Electrochim Acta. (1995) 1701.
[55] G. Petersen, P. Jacobsson, L.M. Torell, Electrochim Acta. (1992) 1495.
[56] Z. Gadjourova, Y.G. Andreev, D.P. Tunstall, P.G. Bruce, Nature. (2001) 520.
[57] Q. Liu, B. Peng, M. Shen, B. Hu, Q. Chen, Solid State Ion. 255 (2014) 74 – 79.
[58] J.A. Killis, J.-F. LeNest, A. Gandini, H. Cheradame, J Polym Sci. 19 (1981) 1073.
[59] S.M. Lee, C.Y. Chen, C.C. Wang, Y.H . Huang, Electrochim Acta. 48 (2003) 669–677.
[60] D. Benrabah, J.Y. Sanchez, M. Armand, Electrochimica Acta. 37 (1992) 1737 – 1741.
[61] F. Alloin, C.R. Herrero, J.Y. Sanchez, D. Delabouglise, M. Armand, Electrochimica
Acta. 40 (1995) 1907 – 1912.
[62] M. Watanabe, A. Nishinoto, Solid State Ion. 79 (1995) 306.
[63] A. Nishimoto, M. Watanabe, Y. Ikeda, S. Kohjiya, Electrochim Acta. 43 (1998) 1177.

Chapter I : Literature review
46
[64] A. Nishimoto, K. Agehara, N. Furuya, T. Watanabe, M. Watanabe, Macromolecules. 31
(1999) 1541.
[65] Y. Ikeda, Y. Wada, Y. Mataba, S. Murakami, S. Kohijiya, Electrochim Acta. 45 (2000)
1167.
[66] M. Kono, E. Hayashi, M. Watanabe, J Electrochem Soc. 145 (1998) 1521.
[67] G. Liu, C.L. Reeder, X. Sun, J.B. Kerr, Solid State Ion. 175 (2004) 781–783.
[68] J.S. Chung, H.J. Sohn, J Power Sources. 112 (2002) 671–675.
[69] T. Zheng, Q. Zhou, Q. Li, L. Zhang, H. Li, Y. Lin, Solid State Ion. 259 (2014) 9–13.
[70] A. Vögo, V. Deimede, F. Paloukis, S. G. Neophytides, , J. K. Kallitsis, Mater. Chem.
Phys. (2014) 1–10.
[71] H. Jiang, S. Fang, J Power Sources. 159 (2006) 673–678.
[72] Y. Kang, J. Lee, J. I. Lee, C. Lee, J Power Sources. 165 (2007) 92–96.
[73] J.I. Lee, D.W. Kim, C. Lee, Y.Kang, J Power Sources. 195 (2010) 6138–6142.
[74] D.G. Kim, J. Shim, J.H. Lee, S.J. Kwon, J.H. Baik, J.C. Lee, Polymer. 54 (2013) 5812–5820.
[75] M. Marzantowicz, J.R. Dygas, F. Krok, A. Tomaszewska, Z. Florjanczyk, E. Zygadlo-
Monikowska, et al., J Power Sources. 194 (2009) 51–57.
[76] J. Ji, B. Li, W. H. Zhong, Electrochim Acta. 55 (2010) 9075–9082.
[77] S.M. Chang, H.W. Liao, C.L. Lin, T.J. Lee, Synth. Met. 154 (2005) 21–24.
[78] J. Saunier, F. Alloin, J.-Y. Sanchez, Electrochimica Acta. 45 (2000) 1255 – 1263.
[79] H. R. Allcock, R. Prange, T. j. Hartle, Macromolecules. 34 (2001) 5463.
[80] T. Niitani, M. Shimada, K. Kawamura, K. Kanamura, J Power Sources. 146 (2005) 386.
[81] J. F. Le Nest, A. Gandini, H. Cheradame, J. P. Cohen-Addad, Macromolecules. 21
(1988) 1117.
[82] J. F. Le Nest, S. Callens, A. Gandini, M. Armand, Electrochim Acta. 37 (1992) 1585.
[83] A. Killis, J.F. LeNest, A. Gandini, H. Cheradame, Solid State Ion. 14 (1984) 231–237.
[84] H. Cheradame, A. Gandini, A. Killis, J.F.L. Nest, J. Power Sources. 9 (1983) 389 – 395.
[85] M.C. Borghini, M. Mastragostino, A. Zanelli, Electrochim Acta. 41 (1996) 2369–2373.
[86] J.-Y. Kim, S.H. Kim, Solid State Ion. 124 (1999) 91–99.
[87] G. Tillet, B. Boutevin, B. Ameduri, Prog. Polym. Sci. 36 (2011) 191–217.
[88] F. Alloin, J.-Y. Sanchez, Electrochimica Acta. 40 (1995) 2269 – 2276.
[89] F. Alloin, J.-Y. Sanchez, M. Armand, J. Power Sources. 54 (1995) 34 – 39.
[90] F. Alloin, D. Benrabah, J.-Y. Sanchez, J. Power Sources. 68 (1997) 372 – 376.
[91] J.L. Acosta, E. Morales, Solid State Ion. 85 (1996) 85–90.
[92] Y.W. Park, D.S. Lee, J Non Cryst. Solids. 351 (2005) 144–148.
[93] B.K. Choi, Y.W. Kim, H.K. Shin, Electrochim Acta. 45 (2000) 1371–1374.
[94] Z. Wen, T. Itoh, T. Uno, M. Kubo, T. Wen, O. Yamamoto, Solide State Ion. 175 (2004)
739.
[95] A.M. Rocco, A. de A. Carias, R.P. Pereira, Polymer. 51 (2010) 5151 – 5164.
[96] E.M. Masoud, A.A. El-Bellihi, W.A. Bayoumy, M.A. Mousa, J Alloys Compd. 575
(2013) 223–228.
[97] M. Erceg, D. Jozić, I. Banovac, S. Perinović, S. Bernstorff, Thermochim. Acta. 579 (2014) 86 – 92.
[98] L.R.A.K. Bandara, M.A.K.L. Dissanayake, B.-E. Mellander, Electrochimica Acta. 43
(1998) 1447 – 1451.
[99] Z. Zeng, B. Wu, L. Xiao, X. Jiang, Y. Chen, X. Ai, et al., J. Power Sources. 279 (2015)
6–12.
[100] L. Yang, J. Lin, Z. Wang, Solid State Ion. 40/41 (1990) 616–619.
[101] I.E. Kelly, J.R.Owen, B.C.H. Steele, J Power Sources. 14 (1985) 13–21.
[102] H. Ohno, Electrochemical Aspects of Ionic Liquids, Wiley New Jersy. (2005).

Chapter I : Literature review
47
[103] G.T. Kim, G.B. Appetecchi, M. Carewska, M. Joost, A. Balducci, M. Winter, et al., J
Power Sources. 195 (2010) 6130–6137.
[104] B. Garcia, S. Lavallee, G. Perron, C. Michot, M. Armand, Electrochim Acta. 49 (2004)
4583.
[105] J.H. Shin, W.A. Henderson, S. Scaccia, P.P. Prosini, S. Passerini, J Power Sources. 156
(2006) 560.
[106] L.X. Yuan, J.K. Feng, X.P. Ai, Y.L. Cao, S.L. Chen, H.X. Yang, Electrochem Commun.
8 (2006) 610.
[107] T. Sato, T. Maruo, S. Marukane, K. Takagi, J Power Sources. 138 (2004) 253.
[108] G.B. Appetecchi, G.T. Kim, M. Montanino, F. Alessandrini, S. Passerini, J. Power
Sources. 196 (2011) 6703–6709.
[109] G.T. Kim et al., J. Power Sources. 195 (2010) 6130-6137.
[110] D.R. MacFarlane, P. Meakim, J. Sun, N. Amini, M. Forsyth, J. Phy.Chem B 103 (1999)
4164.
[111] M. Armand, C.E.M.F. El Kadiri, US 4505997, 1985.
[112] L.J. Krause, W. Lamanna, J. Summerfield, M. Engle, G. Korba, R. Loch, et al., J. Power
Sources. 68 (1997) 320–325.
[113] C. Michot, CA 2527802, 2007.
[114] H. Zhang, C.Liu, L. Zheng, F. Xu, W. Feng, H. Li, et al., Electrochim Acta. 133 (2014)
529–538.
[115] M. Grunebaum, M.M. Hiller, S. Jankowsky, S. Jeschke, B. Pohl, T. Schurmann, et al.,
Prog. Solid State Chem. (2014) 1–21.
[116] J.-Y. Sanchez, F. Alloin, D. Benrabah, R. Arnaud, J. Power Sources. 68 (1997) 43 – 51.
[117] F. Alloin, J.-Y. Sanchez, Electrochimica Acta. 43 (1998) 1199 – 1204.
[118] E. Paillard, F. Toulgoat, R. Arvai, C. Iojoiu, L. Cointeaux, M. Medebielle, et al., J.
Fluor. Chem. 132 (2011) 1213 – 1218.
[119] E. Paillard, F. Toulgoat, C. Iojoiu, F. Alloin, J. Guindet, M. Medebielle, et al., J. Fluor.
Chem. 134 (2012) 72 – 76.
[120] Ayan Ghosh, Chunsheng Wang, Peter Kofinas, J. Electrochem. Soc. (2010) A846–A849.
[121] M. Armand, Solid State Lonics. 9&10 (1983) 745.
[122] W. Xu, C.A. Angell, Solid State Ion. 147 (2002) 295.
[123] M. Watanabe, Y. Suzuki, A. Nishimoto, Electrochimica Acta. 45 (2000) 1187 – 1192.
[124] M. Watanabe, H. Tokuda, S. Muto, Electrochimica Acta. 46 (2001) 1487 – 1491.
[125] R. Meziane, J.-P. Bonnet, M. Courty, K. Djellab, M. Armand, Electrochimica Acta. 57
(2011) 14 – 19.
[126] S. Feng, D. Shi, F. Liu, L. Zheng, J. Nie, W. Feng, et al., Electrochimica Acta. 93
(2013) 254 – 263.
[127] B.B. Hallac, O.E. Geiculescu, R.V. Rajagopal, S.E. Creager, D.D. DesMarteau,
Electrochimica Acta. 53 (2008) 5985 – 5991.
[128] M.B. Herath, S.E. Creager, R.V. Rajagopal, O.E. Geiculescu, D.D. DesMarteau,
Electrochimica Acta. 54 (2009) 5877 – 5883.
[129] D.J. Bannister, G.R. Davies, I.M. Ward, J.E. McIntyre, Polymer. 25 (1984) 1291 –
1296.
[130] T. Hamaide, C.L. Deore, Polymer. 34 (1993) 1038 – 1046.
[131] D. Benrabah, S. Sylla, F. Alloin, J.-Y. Sanchez, M. Armand, Electrochimica Acta. 40
(1995) 2259 – 2264.
[132] K. Ito, Y. Tominaga, H. Ohno, Electrochim Acta. (1997) 1561–1570.
[133] W. Xu, X.-Z. Zhang, Z.-H. Deng, Y.-G. Zheng, G.-X. Wan, Solid State Ion. 111 (1998)
219 – 226.

Chapter I : Literature review
48
[134] X. Ollivrin, F. Alloin, J.-F. Le Nest, D. Benrabah, J.-Y. Sanchez, Electrochimica Acta.
48 (2003) 1961 – 1969.
[135] C. Chauvin, X. Ollivrin, F. Alloina, J.-F. LeNest, J.-Y. Sanchez, Electrochimica Acta.
50 (2005) 3843 – 3852.

Chapter II: Synthesis and characterization of a family of oligoethers end-capped by lithium aryl
perfluorosulfonates
49
II. Synthesis and characterization of a family of
oligoethers end-capped by lithium aryl perfluorosulfonate
II.1. Introduction
Solvent-free polymer electrolytes, which behave both as an ionic conductor and a
separator, preventing short-circuits, are used in lithium polymer batteries [1], [2] to overcome
the safety issue related to liquid leakage and organic solvent flammability in liquid
electrolytes [3], [4]. The main attributions of electrolytes relates to their transport properties
such as the ionic conductivity and the transference numbers, which are mainly related to the
ion’s mobility, salt dissociation and the interactions of the salt with the polymer matrix.
Moreover other characteristics for example; a wide electrochemical stability window and
good thermo-mechanical properties are also the indispensable properties contributing to the
performance enhancement of polymer electrolytes [5]. Due to (i) its commercial availability
and (ii) its excellent properties i.e., its cationic solvation ability favored by a high ionicity of
the oxygen lone pair (high DN), its flexibility originating from oxyethylene segments
supporting the ion transport [6], poly(oxyethylene) (POE), early became the reference host
polymer and was extensively studied [7], [8]. Another essential component of electrolyte is
the lithium salt that has to present good chemical and electrochemical stabilities, good
solubility in the polymer and high dissociation constant. Lithium-trifluoromethansulfonimide
(LiTFSI) salt is mostly used because it has good thermal, chemical and electrochemical
stabilities and also provides high conductivity [9]; however, its cationic transference number
is low [10] when hosted both in linear and cross-linked POE [11].
As mentioned in the bibliographic chapter, the cation diffusion in POE is assisted by
the segmental motion of the polymer chain. The mobile Li+ is strongly coordinated with ether
oxygen atoms (high DN) while anions have much weaker interactions (low AN) with polymer
chains allowing the anions to diffuse faster than Li+ and resulting in low cationic transference
numbers [12]. Additionally, the existence of higher anionic mobility in the electrolyte leads to
the detrimental effect of large salt concentration gradient causing the concentration
polarization and limiting the power output of the cell [13].

Chapter II: Synthesis and characterization of a family of oligoethers end-capped by lithium aryl
perfluorosulfonates
50
The designing of bulkier anions with improved interactions with polymer matrix could
lead to an increase in cationic transference number.
In previous work our group synthesized the lithium -2-(phenylsulfanyl)-1,1,2,2-
tetrafluoroethanesulfonate (Figure 2.1) [14, 16] with fairly high cationic conductivity (1×10⁻⁴
S/cm at 70 °C) and transference numbers ranging between 0.48 and 0.52 in POE matrix. The
perfluoroethane chain (-CF2CF2-) contributes to the delocalization of negative charge through
the strong electron withdrawing effect causing a good dissociation and dissolution of salt. The
thioether function (-S-) increases the flexibility of the molecule but its stability in oxidation
was a priori questionable. However, it was previously shown the double substitution of S by
aryl and perfluorinated moieties induce an significant enhancement of its electrochemical
stability [15] (and any salt degradation was observed up to 4.3 V vs Li/Li+).
With the aim to increase the cationic transference number and the cationic
conductivity we propose to attach the anion PhSCF2CF2SO3Li to a short POE chain (methoxy
polyethylene glycol, mPEG). The aromatic ring has the advantage to be easily modified and
allow its coupling with mPEG derivates. By attaching the mPEG to the anion of lithium salt
we could expect (i) to improve the compatibility between the anion and the POE matrix and
thus an increase of cationic transport number, (ii) to decrease the crystallinity of POE matrix,
(iii) to benefit from a self-solvation of Li+ by the oligomeric chain and (iv) to induce a
plasticization of the polymer electrolyte and, therefore to increase Li+ motion. Thus, in this
work, lithium salts end-capped by mPEG with different lengths were synthesized.
CF2
F2C
SO3Li
S
PhSCF2CF2SO3Li
Figure 2.1. Chemical structure of Lithium -2-(Phenylsulfanyl)-1,1,2,2-
tetrafluoroethanesulfonate.
In this chapter in the first part we discuss on the synthesis and characterizations of
mPEG aryl perfluoroalkyl lithium salts (figure 2.2). In the second part the new salts were
incorporated in a POE or in a POE derivate matrix and the resulting films were assessed in

Chapter II: Synthesis and characterization of a family of oligoethers end-capped by lithium aryl
perfluorosulfonates
51
terms of thermal, thermo-mechanical, electrochemical properties. Their ion transport ability
was studied obviously by measuring the conductivity by impedance spectroscopy but also by
measuring their cationic transference numbers by using both electrochemical impedance
spectroscopy and Pulsed Field Gradient Nuclear Magnetic Resonance spectroscopy (PFG-
NMR).
O
y
S
Rf
A Li
n
Figure 2.2. Chemical structure mPEG-aromatic.
II.2. Preparation of salts and their characterizations
The aim of this synthesis is to link a mPEG chain to the lithium perfluorosulfonated
salt by a nucleophilic substitution, starting from lithium 2-(4-oxydophenylsulfanyl)-1,1,2,2-
tetrafluoroethanesulfonate (LiPST) (Figure 3.3 delivered by the SME Eras-Labo).
S
CF2
F2C
SO3
O
LiLi
LiPST
Figure 2.3. Chemical structure of lithium 2-(4-Oxydophenylsulfanyl)-1,1,2,2-
tetrafluoroethanesulfonate (LiPST).
Two synthesis protocols were used:
1) Nucleophilic substitution of LiPST on bromoallyl mPEG (salt 1).
2) Nucleophilic substitution of LiPST on trifluoromethansulfonate mPEG (salt 2)

Chapter II: Synthesis and characterization of a family of oligoethers end-capped by lithium aryl
perfluorosulfonates
52
Prior to synthesize PEG-salts, the reactions were tested on molecules.
II.2.1.Synthesis of salt 1
O
O
O SCF2CF2SO3Li
Figure 2.4. Chemical structure of salt 1.
The synthesis of salt 1 was carried out in two main steps (Figure 2.5). Firstly, the
hydroxyl function of methoxyethanol was reacted with the dibromobutene via a nucleophilic
substitution (SN) to produce BrmPEG, followed in the second step by a SN with the LiPST.
O
O
Br
O
OHO
OMOH 3 eq , M
Br
Br
(3 eq)
(1 eq)
CH2Cl2
+ H2O
+ MBr
CH2Cl2
O
O
O
SCF2CF2SO3
LiO SCF2CF2SO3
Li
Li THF
BrmPEG
Salt 1
M = K or Na
Figure 2.5. Synthesis pathway of BrmPEG and Salt 1.
BrmPEG
Salt 1

Chapter II: Synthesis and characterization of a family of oligoethers end-capped by lithium aryl
perfluorosulfonates
53
Synthesis of salt 1.First step
In order to avoid the double substitution of dibromobutene (reaction shown in the
Figure 2.6) and to optimize the yield different reaction conditions (base, temperature, solvent)
were tested before to find the best protocol Table 2.1.
Figure 2.6. Possible by-product of BrmPEG.
Table 2.1. Various conditions tested for the formation of intermediate of BrmPEG
Entry
Deprotonation BrmPEG formation
% yield Base Solvent
Temperature,
reaction time Solvent
Temperature,
reaction time
1 NaH (1 eq) THF (in
glove box)
RT, 18 h THF (in
glove box)
RT, 24 h 33
2 NaH (1 eq) THF (in
glove box)
50 °C, 18 h THF (in
glove box)
50 °C, 24 h 30
3 KOH (3 eq) THF 50 °C, 4 h THF 50 °C, 24 h 27
5 KOH (3 eq) ACN 50 °C, 4 h ACN 50 °C, 24 h 8
4 KOH (3 eq) CH2Cl2 50 °C, 4 h CH2Cl2 RT, 16 h 42
6 KOH (3 eq) CH2Cl2 RT, 4 h CH2Cl2 RT, 16 h 66
7 KOH (3 eq)
NBuHSO4 (0,1eq)
CH2Cl2 RT, 1 h
CH2Cl2 RT, 16 h 16
First the reaction was carried out in the glove box; the alcohol deprotonation was
performed with NaH but the maximum yield was only 33%. Moreover the increase of reaction
temperature from room temperature (RT) to 50°C decreases the conversion in mono-
substituted bromobutene.
The solvent seems to have an important impact on the reaction conversion, how it can
be seen from Table 2.1. The best conversion into BrmPEG was obtained with
dichloromethane in which the KOH and potassium alcoolate might have the lowest solubility
as compared to other two solvents (acetonitrile ACN, tetrahydrofurane THF). We expected an
O
OH
O
O
O
O
Br
Br
1) KOH, CH2Cl2
2)
+ KBr

Chapter II: Synthesis and characterization of a family of oligoethers end-capped by lithium aryl
perfluorosulfonates
54
increase of conversion by using the tetrabutylammonium bisulfate as phase transfer catalyst
[16] but the result was the opposite, only 16 % of BrmPEG was isolated.
Finally the precursor of salt 1 was synthetized by the nucleophilic substitution
between the ether alcohol and dibromobutene in the presence of KOH in dichloromethane at
ambient temperature.
Synthesis of salt 1. Second step
In the second step, the nucleophilic substitution between the resulting monobromo
intermediate (BrmPEG) obtained in the first step and the LiPST takes place to form salt 1.
The presence of a double bond in beta of halogen could both (i) avoid the elimination,
competitive to substitution and (ii) accelerate the SN substitution with the phenolate by
increasing the nucleofuge (leaving) character of Br.
However to achieve the maximum yield, that was 95%, the reaction was maintained
for 3 days at 60°C. For some batches from ERAS labo, the addition of LiH was necessary to
increase the conversion from 80% to 95%. This was probably due to the presence of LiPST in
phenol form (OH) and not Li phenolate. Nevertheless, after the LiPST was treated with
quantitative amount of LiH (figure 2.7) the crude yield, observed by NMR, exceeded 95%.
Figure 2.7. Reformation of LiPST by LiH.
NMR characterization
The 1H-NMR spectra of salt 1 and BrmPEG are presented in the figure 2.8. After the
substitution of Br from BrmPEG the peak corresponding to the allylic protons shifts from 5.8
(e’f’) ppm to 5.9 ppm (e,f) while the peak corresponding to BrCH2, at 3.8 ppm (g’),
SCF2CF2SO3
Li
+ LiH O SCF2CF2SO3 LiLi + H2
O
O
Br
O
O
O
SCF2CF2SO3 Li
HO

Chapter II: Synthesis and characterization of a family of oligoethers end-capped by lithium aryl
perfluorosulfonates
55
disappears and a new peak appears at 4.6 ppm corresponding to CH2-O-aryl (g). New peaks
appear in the range 7.0-7.5 ppm assigned to the aromatic protons (h, i) as well.
Figure 2.8. Comparative 1H-NMR spectra between (a) substrate (monobromo
compound) and (b) product (salt 1).
The evolution of the reaction during the second step was followed by 19F-NMR too. In
the figure 2.9 the spectra of salt 1 with LiPST are presented. The peaks corresponding to the
salt 1 are slightly shifted as compared to LiPST. Any other peak is observed in the spectrum
2.9 b that prove the salt 1 is pure and all the LiPST was reacted or eliminated.
2.53.03.54.04.55.05.56.06.57.07.58.08.59.0 2.53.03.54.04.55.05.56.06.57.07.58.08.59.0
Chemical shift (ppm)
9.0 8.0 7.0 6.0 5.0 4.0 3.0
O
O
O SCF2CF2SO3Li
O
O
Br
a’
c’
b’
d’
e’
f’
g’
a’ b’, c’
d’, g’
e’, f’
a b
c d
e
f
g
h i a
b, c d g e, f h i
DMSO-d6 H
2O in
DMSO-d6

Chapter II: Synthesis and characterization of a family of oligoethers end-capped by lithium aryl
perfluorosulfonates
56
Figure 2.9. Comparative 19F-NMR spectra between (a) reactive and (b) product (salt 1).
Elementary analysis
The purity of the salt was also checked by elemental analysis. As shown in the Table
2.2 there is a very good agreement between the calculated and found values for the whole of
the analyzed elements.
Table 2.2 Elemental analysis of salt 1
Salts % C H S F Li
Salt 1 Calc. 40.91 3.89 14.56 17.26 1.58
Found. 40.90 3.91 14.30 17.2 1.52
The best total yield in the synthesis of salt 1 was 63 %. However the reaction time of
each step was long. Moreover, the final product contains a double bond that could decrease
the electrochemical stability of the salt. The hydrogenation of the double bond can be
performed but a new step has to be added in the synthesis of the salt.

Chapter II: Synthesis and characterization of a family of oligoethers end-capped by lithium aryl
perfluorosulfonates
57
II.2.2.Synthesis of salt 2
In order to simplify the synthesis and increase the yield, an alternative protocol was
proposed by using a mPEG end-capped by a better leaving group than the Br from allyl
bromide, i.e. trifluoromethanesulfonate (CF3SO3). The utilization of such leaving group,
allows performing the reaction directly on saturated alcohol and good yield might be
expected.
Figure 2.10. Chemical structure of salt 2.
The synthesis of the salt 2 was performed in two steps (figure 2.11). In the first step
the reaction between mPEG and triflic anhydride was carried out in the presence of Amberlyst
A21® resin in anhydrous dichloromethane, followed in the second step by the reaction of
LiPST.
O SCF2CF2SO3
LiLi
O
OHn
F3C
O2S
O
O2S
CF3
O
O
O2S
CF3n+
Amberlyst A21
CH2Cl2 ,0°C+ CF3SO3H
O
O
SCF2CF2SO3
Li
n
+ CF3SO3Li
ACN
mPEGSO3CF3
Salt 2
Figure 2.11. Synthesis of salt 2, n= 1, 3, 7.2 and 16.3.
Synthesis of salt 2. First step
The first step was monitored by 1H and 19F NMR:
In the 1H-NMR spectra the shifting, from 3.6 to 4.5 ppm, of the peak corresponding to protons
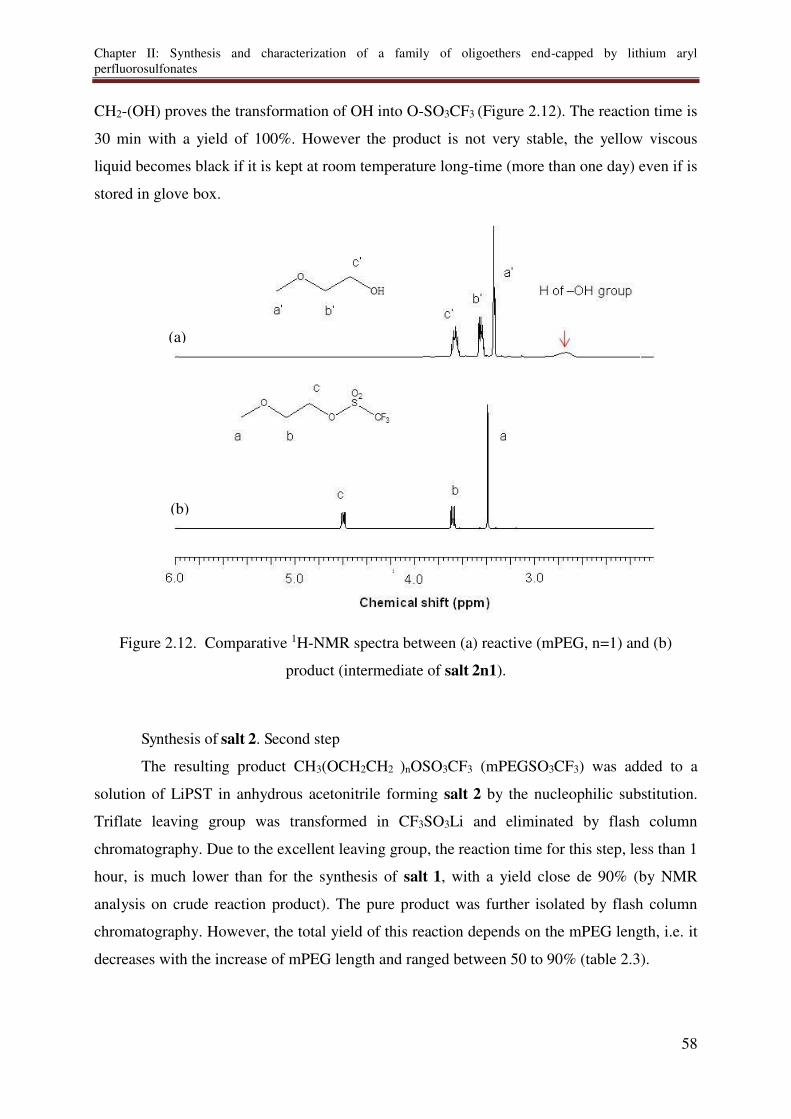
Chapter II: Synthesis and characterization of a family of oligoethers end-capped by lithium aryl
perfluorosulfonates
58
CH2-(OH) proves the transformation of OH into O-SO3CF3 (Figure 2.12). The reaction time is
30 min with a yield of 100%. However the product is not very stable, the yellow viscous
liquid becomes black if it is kept at room temperature long-time (more than one day) even if is
stored in glove box.
Figure 2.12. Comparative 1H-NMR spectra between (a) reactive (mPEG, n=1) and (b)
product (intermediate of salt 2n1).
Synthesis of salt 2. Second step
The resulting product CH3(OCH2CH2 )nOSO3CF3 (mPEGSO3CF3) was added to a
solution of LiPST in anhydrous acetonitrile forming salt 2 by the nucleophilic substitution.
Triflate leaving group was transformed in CF3SO3Li and eliminated by flash column
chromatography. Due to the excellent leaving group, the reaction time for this step, less than 1
hour, is much lower than for the synthesis of salt 1, with a yield close de 90% (by NMR
analysis on crude reaction product). The pure product was further isolated by flash column
chromatography. However, the total yield of this reaction depends on the mPEG length, i.e. it
decreases with the increase of mPEG length and ranged between 50 to 90% (table 2.3).
(a)
(b)

Chapter II: Synthesis and characterization of a family of oligoethers end-capped by lithium aryl
perfluorosulfonates
59
Table 2.3 Yield % in crude and pure salt 2 according to the mPEG length
Repeating units of
mPEG (n)
% crude yield (from
NMR spectra)
% yield (pure
product)
1 95 56
3 100 90
7.2 90 67
16.3 85 50
NMR characterization
Figure 2.13 and Figure 2.14 represent the 1H-NMR and 19F-NMR spectra of
intermediate mPEGSO3CF3 and salt 2n1. The shift of the triplet from 4.6 ppm (corresponding
to the two protons situated on the carbon in position of sulfonate group) to 4.15 ppm
assigned to the two protons of located on C on c position (bonded to phenolate) prove the
transformation of mPEGSO3CF3 in salt 2n1. Additionally the evolution of reaction is
monitored by the integral of singlet at 3.3 ppm and multiplet at 7.0 and 7.5 ppm
corresponding to the three protons of methyl group and four aromatic protons, respectively.
The evolution of reaction was monitored by 19F-NMR as well. The peak at -74 ppm
disappears whereas two triplets at -85 and -113 ppm appear indicating the successful bonding
between the oligoether to the LiPST.

Chapter II: Synthesis and characterization of a family of oligoethers end-capped by lithium aryl
perfluorosulfonates
60
Figure 2.13. Comparative 1H-NMR spectra between (a) intermediate mPEGSO3
and (b) salt 2n1.
Figure 2.14. Comparative 19F-NMR spectra between (a) intermediate mPEGSO3
and (b) salt 2n1.
(a)
(b)

Chapter II: Synthesis and characterization of a family of oligoethers end-capped by lithium aryl
perfluorosulfonates
61
Elemental analysis
The purity of the salts were checked also by the elemental analysis, the results are
gathered in the Table 2.4. The obtained values seem to be very close from the calculated ones
and confirm the high purity of the synthetized salts as also shown by 1H and 19F NMR.
Table 2.4 Elemental analyses of salt 2n1, salt 2n7, salt 2n16
Salts % C H S F Li
Salt 2n1 Calc. 35.68 2.99 17.32 20.52 1.87
Found. 35.37 2.9 17.64 20.84 1.8
Salt 2n7 Calc. 43.67 5.57 9.95 11.82 1.09
Found. 43.57 5.44 9.13 11.54 1.07
Salt 2n16 Calc. 47.86 6.92 6.14 7.29 0.67
Found. 47.75 7.06 5.93 7.33 0.57
II.2.3.Physical characterizations of salts
II.2.3.1.Thermal characterizations of salts
The characteristic temperatures of the salts, i.e. glass transition temperature (Tg),
melting temperature (Tf), degradation temperature (Td) were measured by Differential
Scanning Calorimetry (DSC) and Thermogravimetric Analysis (TGA) respectively. The DSC
measurements were performed in the temperature range of -100 to 250°C and the DSC results
are presented in Table 2.5.
The Tgs of salt 1 and salt 2n1 were impossible to be measured even after the salt
melting and quenching, probably due to high ability of the salt to crystallize. For the other
salts 2 with n 3 the bonding of LiPST on the mPEG leads to an important increase of the
glass transition temperature (Tg) as compare to pure mPEG. However their Tg are much lower
than that of aromatic lithium salt, PhSCF2CF2SO3Li (without end-capping with mPEG [15],
[17]) and decrease with the increase of n.
The salt 1 and salt 2 n1 and n3 are crystalline and the values of Tm are higher than that
of PhSCF2CF2SO3Li. Moreover, except for the salt 2 n1 the H is also higher. From these

Chapter II: Synthesis and characterization of a family of oligoethers end-capped by lithium aryl
perfluorosulfonates
62
results, it can be pointed out that the bonding of short mPEG chains on the anion favors the
salt organization and reinforce the intermolecular interactions, due probably to the interaction
of Li with the oxygen from oligoether. However, for n7 and n16 the salts are completely
amorphous at room temperature. It is known that five O atoms are necessary for the solvation
of Li+. In the salt 2 n7 and n16, 2 and 11 O atoms respectively are in excess; therefore we
assume the mPEG chain can organize differently and lead to amorphous materials.
Table 2.5 Glass transition temperature (Tg) and melting temperature (Tm) of mPEG, Salt 1,
salt 2 and PhSCF2CF2SO3Li
Samples Tg (°C) Tm (°C) H (J/g)
PhSCF2CF2SO3Lia 63 118 20
Salt 1 - 162 58
Salt 2n1 - 197 8
mPEG (n=3)b -73 - -
Salt 2n3 29 130 76
mPEG (n=7.2)b -64 -7 54
Salt 2n7 -11 - -
mPEG (n=16.3)b -60 22 118
Salt 2n16 -39 - -
a: data from thesis of E. Paillard, INPG (2008) [17]
b: data from thesis of C. Chauvin, INPG (20005) [18]
The thermal stability was studied by TGA (Figure 2.15). The percentage of weight
loss of samples is followed as a function of temperature; the measurements were scanned
from 25°C to 500°C under nitrogen with a heat rate of 5°C/min.
Figure 2.15 shows TGA curves of salt 2 with different chain lengths of mPEG. The
onset of weight loss varying from 210 °C to 250 °C and depends on the lengths of mPEG. The
decomposition of salt 2n3 starts at 210°C, similar to that of an aryl lithium perfluorosulfonte
salt (PhSCF2CF2SO3-Li+) [19] while the thermal stability is enhanced for the salts 2n7 and
2n16. Taking into account the similar structure of the salts and the degradation temperature of
mPEG we suppose that the degradation starts at the same temperature for all the salts but with
the increase of mPEG molecular weight, the salts are more dissociated and interact with
mPEG chains and probably its resulted degradation fragments, decreasing their volatility.

Chapter II: Synthesis and characterization of a family of oligoethers end-capped by lithium aryl
perfluorosulfonates
63
Figure 2.15. Thermogravimetric analysis of aromatic lithium salts.
II.2.3.2. Intrinsic conductivity of salts
The conductivities of the salts were measured by electrochemical impedance
spectroscopy in the frequency range of 5 Hz – 13 MHz and temperature range from 20° to
110°C. In this range of temperature only salt 2 n7 and salt 2 n16 are in their amorphous state
while the others are crystalline and don’t present any measurable conductivity. Figure 2.16
shows the conductivity curves of salt 2n7 and salt 2n16 as a function of 1000/T. It can be
seen that, the conductivity of salt 2n16 is higher than that of salt 2n7 with 2.91×10⁻⁴ S/cm at
110°C and 7.22×10⁻⁶ S/cm at 30 °C respectively, despite a higher ionic concentration of the
salt 2n7. However, to solvate the Li and to dissociate the lithium salt at least five oxyethylene
units are necessary. The interaction of Li+ with several oxygen leads to inter-chains physical
cross-linking that could stiffen the system. The increase of molar ratio O/Li contributes both
(i) to the solvation of Li+ and thus the increase of the dissociation, and (ii) to the increase in
ions mobility, proved also by the lower Tg in the case of salt 2n16. However by analogy with
the Li+ migration, in the case of poly(oxyethylene) (POE), the Li+ migration from one
coordinating site to another is controlled by the segmental motion, that might be higher is the
case of salt 2n7 (lower Tg values).
-100
-80
-60
-40
-20
0
0 100 200 300 400 500
Wei
gh
t L
oss
(%
)
Temperature (°C)
salt 2n3
salt 2n7
salt 2n16
mPEG n=16

Chapter II: Synthesis and characterization of a family of oligoethers end-capped by lithium aryl
perfluorosulfonates
64
Figure 2.16. Conductivity of aromatic lithium salt in a family of salt 2.
II.2.3.3. Diffusion coefficient of salts
The self-diffusion coefficient of anion (D19F) and Li+ (D7Li) of salts 2n7 and n16,
measured by multinuclear Pulse Field Gradient NMR (7Li and 19F) are gathered in the Table
2.6. It is observed that the diffusion coefficients of anions are lower than that of lithium for
both salts. As for comparison of self-diffusion coefficient of both salts, the values of anions
(F) are very close while a factor more than 2 is obtained for the diffusion coefficient values of
lithium cations. The diffusion coefficient is directly related to the viscosity of the salt and the
bulkiness of species that are diffusing. Taking into account the differences in size of mPEG
and the close values of diffusion coefficients of anions of both salts it can be supposed that the
viscosity of salt 2n16 is lower than of that of salt 2n7. The higher value of diffusion
coefficient of Li in the salt 2n16 is due to higher flexibility and segmental motion of mPEG
chain as compared to those of mPEG from salt 2n7.
1.00E-06
1.00E-05
1.00E-04
1.00E-03
2.5 2.7 2.9 3.1 3.3 3.5
Co
nd
uct
ivit
y (S
/cm
)
1000/T (K-1)
salt 2n7
salt 2n16

Chapter II: Synthesis and characterization of a family of oligoethers end-capped by lithium aryl
perfluorosulfonates
65
Table 2.6 Comparison of diffusion coefficients determined by PFG-NMR at 383K
Salt 2n7 Salt 2n16
D19F(cm2s-1) 0.69×10⁻⁷ 0.67×10⁻⁷
D7Li(cm2s-1) 1.22×10⁻⁷ 1.52×10⁻⁷
Nernst (Scm-1) 4.95×10⁻⁴ 4.07×10⁻⁴
exp (Scm-1) 2.52×10⁻⁴ 2.91×10⁻⁴
% dissociation 51 71
With the help of self-diffusion coefficients the conductivities can be calculated (calc )
by using Nernst-Einstein equation.
朝追津鎚痛 = 繋2系 岫経+ + 経−岻迎
(4)
Where F Faraday constant (9.6485×10⁶ Coulomb/mol), R gas constant (8.31446 J/(K
mol), C ionic molar concentration mol.
However, this equation is valid for the infinitely dilute solution. For our salts, it is sure
the calculated values are not correct but it permits the comparison between the two salts.
In order to calculate the ionic molar concentration (C), we first calculate the salt
density by using the next formula: [18]
LiPST
LiPSTPEG
LIPST
PEG
LiPSTPEG
PEG
saltMM
M
MM
M ** (5)
where MPEG et PEG the molecular weight and density of mPEG used in the synthesis
of salt 2, MLiPST is the molecular weight of LiPST et LiPST is the density of LIPST measured
with a pycnometer (2.4915 g/cm3). The values of density of different salts are gathered in
Table 2.7 and the calculated values of conductivity of salt 2n7 and n16 are presented in Table
2.6.

Chapter II: Synthesis and characterization of a family of oligoethers end-capped by lithium aryl
perfluorosulfonates
66
Density (g/cm3) Concentration (mol/cm3)
Salt 2 n1 2.20 5.94×10⁻³
Salt 2 n3 1.99 4.35×10⁻³
Salt 2 n7 1.75 2.73×10⁻³
Salt 2 n16 1.51 1.45×10⁻³
Table 2.7 Density and molar concentration of salt 2
The NMR provides the diffusion coefficient of a specie but it does not discriminate
between the charged and neutral species (dissociated anion-cation or ion pairs), while the
ionic conductivity measure the diffusion of only the charged species. Hence, by the ratio
between exp and calc (equation (5)),, the dissociation degrees can be inferred (Table 2.5).
% 穴嫌嫌剣潔建剣券 = 灘認韮濡禰 × などど (6)
For both salts values of 51 % and 71 % were calculated for salt 2n7 and salt 2n16
respectively. These results indicate a higher dissociation of salt 2n16 as compared with salt
2n7. The higher dissociation degree can explain the higher conductivity of salt 2n16 despite a
lower lithium concentration.
II.2.3.4. Cationic transference number
One of the factors affecting the performances of lithium salt is the transference
number. The ideal transference number is T+ = 1, that means the conductivity is done only by
the migration of Li+. But for most of the salts the migration of the anion is much higher than
that of cation and the existence of anionic mobility in the electrolyte leads to the detrimental
effect of large salt concentration gradient causing the concentration polarization and limiting
the power output of the cell.
The intrinsic cationic transference numbers were determined here starting from
diffusion coefficients using the next equation (7), where D+ is D7Li and D- is D19F.
+ = 帖+帖++ 帖− (7)

Chapter II: Synthesis and characterization of a family of oligoethers end-capped by lithium aryl
perfluorosulfonates
67
The cationic conductivities are calculated with the equation: + = T+ where is
experimental conductivity. (Table 2.8)
Table 2.8 Comparison of intrinsic cationic transference numbers and cationic conductivities
of salt 2n7 and salt 2n16 investigated by PFG-NMR at 383K
Salt O/Li
(S/cm)
T+
+
(S/cm)
Salt 2n7 7.2 2.52×10⁻⁴ 0.64 1.61×10⁻⁴
Salt 2n16 16.3 2.91×10⁻⁴ 0.72 2.09×10⁻⁴
From the result in Table 2.8, the transference number of salt 2n16 (T+ = 0.72) exhibits
higher value than that of salt 2n7 (T+ = 0.64). The cationic conductivities reached 2.09×10⁻⁴
S/cm for salt 2n16, higher than for salt 2n7 i.e. 1.61×10⁻⁴ S/cm. These results are different
from those reported by C. Chauvin [18] for POE oligomer mono-end capped by sulfate group
(CH3-O (-CH2-CH2-O)n-OSO3Li for which they reported a higher T+ for the salts with shorter
mPEG (n= 7 T+ = 0.58, n=16 T+=0.46).
II.2.3.5. Electrochemical stability of salts
The cyclic voltammetry measurements (figure 2.17) were performed in ACN + 0.1 M
TEABF4 as support electrolyte, scan rate of 10 mVs-1 at 20°C. The salt was dissolved in the
electrolyte with a concentration of 5 mmol/L. The oxidation wall of the salt 2 starts at 4.25 V
versus Li/Li+ and seems to be independent of the chain length of mPEG and very close to that
of PhSCF2CF2SO3Li (4.3 V) [17]. Moreover, the stability seems to be slightly higher than that
of POE that is known to be close to 3.9 V versus Li/Li+. This result is a good surprise and is in
line with theoretical calculations performed by Chauvin et al. [18] Concerning the salt 1 its
stability seems to be slightly lower, a first shoulder appear to 3.9 V versus Li/Li+ probably due
to the presence of the double bond. However, all synthesized salts seem to be enough stable
for an utilization in lithium polymer batteries.

Chapter II: Synthesis and characterization of a family of oligoethers end-capped by lithium aryl
perfluorosulfonates
68
Figure 2.17. Cyclic voltamperometry of salt 1, salt 2n3 and salt 2n16 at 5 mmol/l in
ACN + TEABF4 (0.1 M), scan rate: 10 mVs-1 at 20°C on platinum as working electrode.
Table 2.9 Oxidation potential of different salts in the solution of TEABF4
Salt Oxidation potential
(V vs Li/Li+)
Supporting electrolyte (CH3CN + TEABF4) 5.3
Salt 1 3.9
Salt 2n1 4.25
Salt 2n3 4.25
Salt 2n7 4.25
Salt 2n16 4.25
0 1 2 3 4 5 6 7
-4,0
-3,5
-3,0
-2,5
-2,0
-1,5
-1,0
-0,5
0,0
0,5
1,0
1,5
2,0
salt 1
salt 2n3
salt 2n16
Blank solution
Cu
rre
nt
de
nsity (
mA
/cm
2)
Potential (V vs Li/Li+)

Chapter II: Synthesis and characterization of a family of oligoethers end-capped by lithium aryl
perfluorosulfonates
69
II.3. Polymer electrolytes based on linear POE and salts 1
and 2
Films with different amounts of salt 1 and 2 were elaborated by casting in glove box in
argon by dissolving both POE (Mw = 300,000 g/mol) and salt in anhydrous acetonitrile. After
the solvent evaporation, membranes were dried at 50 °C under vacuum for 2 days and they
were then kept in the glove box for further characterizations. The membrane’s thickness is
100-150 m approximately. The thermal, thermo-mechanical properties were studied by
DSC, ATG and dynamic mechanical analysis (DMA) and the ion mobility was evaluated
through ionic conductivity and diffusion coefficients measurements.
II.3.1.Thermal characterization
POE is a semi-crystalline polymer. Tg, Tm and the melting enthalpy (Hm) of POE
electrolytes depend on salt concentration and on salt- POE interactions. Therefore the host
polymer was blended with different amounts of salt, the concentration, as usual, being
expressed by the ratio O/Li, where O represents the number of structural oxyethylene (OE)
units for 1 mole of Li salt. For the calculation of O/Li we took also in account the OE units of
the anions and we used the next formula (8):
潮挑 = 陳鍋捺陳濡如禰 暢44 + 券 (8)
Where mPOE is the weight of POE; msalt is the weight of the salt, M the molecular
weight of the salt, n the number of OE structural units in the salt (mPEG), 44 represent the
molecular weight of OE.
In table 2.10 are gathered Tg, Tm, and HPOE of the electrolytes based on the linear
commercial POE (Mw = 300,000 g/mol) and on salt 1 and salt 2, used at various
concentrations. In the column O/Li into brackets we give also the O/Li taking in account only
the OE from POE.
Two series of measurements were performed. First, all the samples were submitted to
two heating scans, in the first scan the samples, that was kept at least for a month in the glove

Chapter II: Synthesis and characterization of a family of oligoethers end-capped by lithium aryl
perfluorosulfonates
70
box, were heated from -100 °C to 100 °C and we measured the Tg1, Tm1, Hm1, then it was
cooled down at -100 °C with a ramp of 20 °C/min and heated once again to 100°C (Tg2, Tm2,
Hm2). In the second series, the samples were quenched, therefore the pans containing the
samples placed in a well closed recipient were heated at 80°C on a heater outside of the DSC
device and, after 10 min, the pans were put in the DSC at -100°C to get the characteristic
temperatures of the quenched samples (Tgq, Tmq, Hmq).
First we discuss the results obtained in the first series. Tm measured for the first and
the second cycles are very close for all the electrolytes, which means that the crystallization
kinetics are very fast; the salt does not delay the crystallization phenomena.
Regarding the impact of the salt on Tg, from the first and second scans, similar values
were obtained excepted for the salt 1, where the values for the first cycle seems to be
surprising lower. Moreover the Tgs of the electrolytes based on salt 1 are lower, for the whole
of the concentrations, than those of the electrolytes based on salt 2n1.
The interaction of Li+ with several oxygen leads to inter-chains physical cross-links
that stiffens the polymer electrolyte evidenced by a Tg increase [18]. The lower values for the
complexes based on salt 1 could be explained by (i) a lower dissociation of the salt 1 or (ii) a
higher ability of the anion to plasticize the POE electrolytes as compared to salt 2n1. The
difference on Tg between the first and second scan without significant modification on Tm
and HPOE indicate a better dissociation of the salt after the first heating scan. Thus, it can be
assumed in the second scan due to the heating and the melting of the POE more salt are
disaggregated, dispersed in POE matrix and interact with POE in amorphous state. Hence, the
Tg values are increased for the second scan. But the formed complexes are probably not stable
and in time the salt reform aggregates (this could explain the lower Tg in the first scan). The
behavior of salt 1/POE is similar to that of PhSCF2CF2SO3Li/POE [14].
Concerning the impact of the concentration, for almost all the studied series the
highest Tg seems to be for O/Li =20. At higher Li salt concentration (O/Li =12, O/Li=16) it
could be expected a higher Tg value due to a higher density in physical crosslinking. The
opposite results (lower Tg for O/Li =12, O/Li=16) are probably due to the salt aggregation and
partial dissociation of lithium salt.

Chapter II: Synthesis and characterization of a family of oligoethers end-capped by lithium aryl
perfluorosulfonates
71
Regarding the impact of the size of anion, for the same O/Li ratio, we observe a
slightly decrease of Tg with increase of mPEG chain length. However the salt 2n16 presents
two Tg, that means two amorphous phases.
The Tg decrease with the increase of mPEG lengths can be explained by (i) the ratio
O/Li that involves the OE from POE (Table 2.10) (ii) the plasticizing effect of the anion. To
support the 1st explanation, it must be assumed that Li+ interacts mostly with the OE
belonging to the salt when the mPEG chain is long enough. In that case the POE density in
physical cross-links is decreased and the stiffness of the polymer electrolyte decreases. To
support the 2nd explanation it must be emphasized that the anion’s tail acts as an external
plasticizer. A 3rd explanation might be invoked: a decrease of Tg that could be expressed by
the well-known Flory-Fox semi-empirical relationship. However the semi-crystalline nature
of the polymer does not allow a quantitative prediction to be done. However if anion’s tail
acts as an external plasticizer with lengthening of the anion tail a decrease in crystallization
content might be expected. Contrarily it can be seen, from the table 2.10, a reverse behavior
with an increase in Hm and % crystallinity with the chain lengthening.
The crystallinity percentage is directly proportional to Hm and is calculated according
to eq. (9) where H0 is the melting enthalpy per unit weight of 100% crystalline POE, which
is 205 J/g [20] and w is the weight fraction of POE in the sample.
隙 = ∆尿∆0 .栂 × などど (9)
The increase of crystallinity with the anion size means the amount of amorphous phase
in POE is lower and these results sustain the hypothesis that Li+ prefers to interact with the
oxygen atoms from the anion. Moreover, for the salt 2n16 the crystallinity degree seems to be
very close to that of pure membrane that allows assuming that Li+ interacts mostly with the O
from mPEG anion.
The melting temperatures increase slightly with the increase of O/Li for all the studied
series. The lengthening of mPEG anion seems to have no effect on Tm; however the values
remain lower than that of the POE host.
Now if we analyze then second series we observed the Tgq has much lower values as
compared to those obtained on the first series (Tg1 and Tg2). Concerning the Tm the values

Chapter II: Synthesis and characterization of a family of oligoethers end-capped by lithium aryl
perfluorosulfonates
72
seem to be slightly lower. However for all the quenched membrane a crystallization peak was
observed during the heating scan.

Chapter II: Synthesis and characterization of a family of oligoethers end-capped by lithium aryl
perfluorosulfonates
73
Table 2.10 Glass transition temperature (Tg) and melting temperature (Tm) of POE/salt 1 and
POE/salt 2 complexes (1 = the 1st cycle, 2 = the 2nd cycle)
Samples O/Li
( (O/Li)-n))
Tg1
(°C)
Tg2
(°C)
Tg(q)
(°C)
Tm1
(°C)
Tm2
(°C)
Tm(q)
(°C)
HPOE1
(J/g)
HPOE2
(J/g)
HPOE(q)
(J/g)
%
crystallinity
(1st/2nd/q)
POE - - -63 - 70 69 - 125 127 - 61/62
POE/
Salt 1
12 (11) -32 -23 - 53 53 - 34 34 - 17/17
20 (19) -39 -16 -44 62 62 55 75 74 90 36/34/44
30 (29) -49 -25 -50 60 60 60 108 105 113 52/51/55
POE/
Salt 2n1
16 (15) -32 -32 -41 60 55 61 44 37 142 21/18/69
20 (19) -11 -11 -39 61 60 59 92 87 82 45/42/40
30 (29) -14 -14 -47 62 62 54 92 90 63 45/44/31
POE/
Salt 2n3
16 (13) -34 -35 - 55 55 - 67 65 - 33/32
20 (17) -14 -14 -41 58 58 57 74 71 74 36/35/36
30 (27) -15 -17 -48 61 61 53 96 89 67 47/43/32
POE/
Salt 2n7
20 (13) -18 -18 -40 57 56 56 89 87 98 44/42/48
30 (23) -28 -27 -49 60 60 58 96 83 98 47/41/48
40 (33) - - -52 61 61 60 126 117 126 61/57/61
POE/
Salt 2n16
40 (24) -26; 7 -22;
7
-50;
7
59 59 59 123 115 107 60/56/52
50 (34) -33;
4
-36;
5
-54 59 59 61 122 119 146 60/58/71
60 (44) 11 14 -51 61 61 61 128 128 189 62/62/92
HPOE fusion enthalpy calculated by mass of POE host polymer; q : sample heated at 80°C and introduced on
DSC (TA) at -100°C.
II.3.2.Thermal stability
The weight losses of different POE/salt complexes are presented in figure 2.18 as a
function of temperature. The onset of weight losses of POE/salt 2n3 and POE/salt 2n7 start at
266 °C and 278 °C respectively and both complexes show higher thermal stability than those
of the pure salts but much lower than that of pure POE. We assume that the thermal stability
increase of the salts, when they are embedded in POE matrix might be due to the formation of

Chapter II: Synthesis and characterization of a family of oligoethers end-capped by lithium aryl
perfluorosulfonates
74
fragments during the degradation, that are less volatile due to the interaction with the POE.
The weight loss takes place in two steps (figure 2.18b). However during the first step the
weight loss is much higher than the amount of salt contained by the POE electrolytes, which
means that the salt’s degradations induce that of POE at much lower temperature than the
pure POE.
Figure 2.18. (a) TGA curves for salt 2n3, 2n7 and POE+salt 2n3 and salt 2n7 complexes
(O/Li=20) and (b) first derivatives of POE+salt 2n3 and salt 2n7.
-100
-80
-60
-40
-20
0
0 100 200 300 400 500
Wei
gh
t L
oss
(%
)
Temperature (°C)
salt 2n3
salt 2n7
POE+salt 2n3
POE+salt 2n7
POE without salt
-4
-3.5
-3
-2.5
-2
-1.5
-1
-0.5
0
0.5
0 100 200 300 400 500
Wei
gh
t L
oss
der
ivat
ive
(%/°C
)
Temperature (°C)
POE+salt 2n3
POE+salt2n7-0.15
-0.10
-0.05
0.00
0.05
200 250 300 350 400
(a)
(b)

Chapter II: Synthesis and characterization of a family of oligoethers end-capped by lithium aryl
perfluorosulfonates
75
II.3.3.Thermo-mechanical properties
Dynamic mechanical analysis (DMA) is particularly useful for measuring the storage
modulus and the transitions temperatures in polymers. Figure 2.19 (a) shows the variation in
storage modulus at 1 Hz as a function of temperature for POE electrolytes at the concentration
O/Li= 20. The elastic storage modulus E’ at -100°C was normalized at one constant value
(approximately 3 GPa) with the aim of minimizing the effect from the difference of the
thickness of each sample.
If we compare the curve of pure POE, POE/salt 1 and POE/salt 2n1 electrolytes we observed
that (i) the Tα of POE is lower than the electrolytes one, (ii) the Tα of membrane based on
POE/salt 2n1 is the highest (iii) the POE electrolytes melt at similar temperature but lower
than pure POE. The Tα are associated with the Tg, nevertheless the values of Tg obtained by
DSC and DMA are very different due to the conditions of measurements. The Tα of POE +
salt 2n1 is 10°C lower than that of POE + salt 1 and about 20°C higher than that of POE
The results corroborate those obtained by DSC in the first heating scan, where the Tg of POE<
POE+salt2n1< POE+salt 1.

Chapter II: Synthesis and characterization of a family of oligoethers end-capped by lithium aryl
perfluorosulfonates
76
Figure 2.19. Mechanical properties of aromatic lithium salts at the concentration (O/Li) =20
(a) storage tensile modulus (E’) and (b) loss angle tangent tan in a function of temperature.
Regarding the impact of the chain length of mPEG (n=1, 3, 7) on thermo-mechanical
properties we observe that the drop in storage modulus and in Tα, appears at lower values with
0
0.2
0.4
0.6
0.8
1
1
10
100
1000
10000
-100 -50 0 50 100
Tan
Sto
rag
e M
od
ulu
s (M
Pa)
Temperature (°C)
POE without salt POE+salt 1, O/Li=20
POE+salt 2n1, O/Li=20
(a)
(b)

Chapter II: Synthesis and characterization of a family of oligoethers end-capped by lithium aryl
perfluorosulfonates
77
the anion lengthening. These results are in agreement with those obtained by DSC. All the E’
drop dramatically at temperatures close to 60°C, which correspond to the POE melting point.
Nevertheless, the behavior of electrolytes POE + salt 2n16 is different of the other
POE electrolytes based on salt 2 having lower mPEG lengths. The figure 2.20, on the
evolution of storage modulus and tan with the temperature, two thermal transitions appear.
The first one is very close to that of pure POE membrane while the second one is much
higher. The presence of two Tα, corresponding to the amorphous phases, underlines the
presence of phase separation with the formation of two percolated phases. Similar results
were obtained by DSC and support the hypothesis that the Li+ of the salt interacts mainly with
the O from mPEG attached to the anion and the salt is phase separate. Indeed, oligomers are
often incompatible with their polymers of high molecular weight. The end-capping of the
oligoether by a Lithium ion pair should act as a compatibilizer. If Li+ however interacts
mostly with its own oligoether tail rather than with the POE long chain, these oligomers might
become immiscible with the host polymer and lead to a partial phase separation.
However the DSC Tg observed for the first and second heating of POE + salt 2n16
seems to be higher than that of the pure salt 2n16. We can explain partially this higher value
by the high crystallinity of the POE matrix; as DSC shown that the degree of crystallinity of
POE host polymer is close to that of pure POE. The Li salt phase is therefore constrained by
the crystalline phase explaining the higher Tg.
Figure 2.20. DMA curves of POE/salt 2n3 and salt 2n16.

Chapter II: Synthesis and characterization of a family of oligoethers end-capped by lithium aryl
perfluorosulfonates
78
II.3.4.Conductivity
The conductivities were measured in the temperature range of 20-70 °C by impedance
spectroscopy, in the heating and cooling cycles. The conductivities were measured after
stabilizing for 1 hour the sample at each temperature. The maximum temperature was 70°C in
order to minimize the membrane creeping. In the figure 2.21 the evolution of conductivities as
a function of 1000/T on both heating and cooling cycles for membranes based on POE/salt 1,
POE/salt 2n1 and POE/salt 2n16 are represented. All the conductivity curves show a specific
shape for the POE electrolyte, i.e. below melting point, the conductivities followed the classic
Arrhenius law, at the melting point the conductivity increase very fast to reach than a plateau
where conductivities follow the VTF law. At temperatures lower than Tm, the conductivities
on the cooling cycles are higher than those measured on the heating cycles due to (i) surfusion
phenomena, (ii) presence of a lower amount of POE in crystalline phase and (iii) a better
contact between the POE electrolyte and the blocking electrodes after the polymer melting.
POE/ salt 1 (O/Li =20)
POE/ salt 2n1 (O/Li =20) POE/ salt 2n16 (O/Li =40)
Figure 2.21. Comparison of conductivity of polymer electrolyte on heat scan (up) and cooling
scan (down).
However, from the figure 2.21 we can observe that the gap between up and down is much
higher in the case of salt 1 as compared to salt 2n16, while salt 2n1 is in between. For the salt
1 we have evidenced by DSC an increase of Tg after the first heating scan and we supposed a
better homogeneity of the electrolyte after the POE fusion. This could explain the higher
conductivity differences between up and down as compared to salt 2n1. For the salt 2n16, by
DSC we shown that POE has almost the same crystallinity than the neat POE membrane, the
low difference between the conductivities on heating and cooling cycles allows to suppose
10-9
10-8
10-7
10-6
10-5
10-4
10-3
2.9 3 3.1 3.2 3.3 3.4 3.5
down up
1000/T K-1
10-9
10-8
10-7
10-6
10-5
10-4
10-3
2.9 3 3.1 3.2 3.3 3.4 3.5
downup
1000/T K-1
10-8
10-7
10-6
10-5
10-4
10-3
2.9 3 3.1 3.2 3.3 3.4 3.5
downup
1000/T K-1

Chapter II: Synthesis and characterization of a family of oligoethers end-capped by lithium aryl
perfluorosulfonates
79
that the crystalline phase has a moderate impact on the ionic conductivity and corroborate
with the hypothesis the Li interact preferentially with the O from mPEG chain.
For the next discussion we consider the conductivities on the down cycle in order to suppress
the thermal history of the membrane.
A decrease in the value of Tg contributes to easy movement of the polymer chains and
as a result an increase in the conductivity is expected [21]. As comparing the complexes with
lower Tg and similar lengths of mPEG, i.e. membranes based on POE+salt 1 with those based
on POE+salt 2n1 the conductivities of both membranes are similar above crystallization
temperature while after the crystallization the values are lower for POE+salt 2n1 (figure
2.22a). The higher conductivities values of complexes POE+salt 1 after the membrane
crystallization corroborates with DSC studies, for that a lower Tg2 was obtained.
The Arrhenius plots of POE electrolytes with lithium salt with different chain lengths
are presented in the figure 2.22b. The ration O/Li is 30 for n=1, 3, 7 while for n=16 O/Li =40.
The measurements of the conductivity for a membrane POE+salt 2n16 O/Li =30 were not
possible because the membrane is too soft and creeps even at room temperature. In the figure
2.22 c the conductivities of membranes based on POE+ salt 2n7 and POE + salt2 n16 at same
O/Li (40) are compared.
A slight increase of the conductivities was observed with the increase of the mPEG
lengths. We suppose that this increase is due to the contribution of EO from mPEG to the
solvation and mobility of Li+. The mPEG is more flexible and mobile (length much lower
than the entanglement threshold) as compared to the EO units from POE. Moreover, by DMA
and DSC phase separation between the salt and POE was evidenced for the electrolytes
POE+salt 2n16. Hence, the short chain length of mPEG and thus absence of chain
entanglements as compared to POE might decrease the local viscosity in the conducting
domains. However the increase of mPEG chain length has to decrease the anion conductivity
due to the increase of steric hindrance. This impact of the size of anion will be studied on the
next part related to the self-diffusion coefficients.
Regarding the conductivity of the POE+salt 2n16 with that of POE+salt 2n7 at the
same concentration (O/Li = 40), the conductivity of the former is 40% higher than that if the
latter. However, for O/Li =40 the weight ratio POE+salt 2n16 is approximately 1:1 while is
for salt 2n7 it is 1:0.63.

Chapter II: Synthesis and characterization of a family of oligoethers end-capped by lithium aryl
perfluorosulfonates
80
The conductivity seems to be even higher than that of pure salt. This can be explained
by the contribution of POE in its melted state to the solvation and mobility of Li+.
a) POE/ salt 1 and POE/sal2n1 (O/Li =20)
b) POE/ salt 2 n =1,3,7 (O/Li =30) and n=16
(O/Li =40)
c) POE/ salt 2 n =7,16 (O/Li =40)
Figure 2.22. Comparison of conductivity of POE/salt 2 with various chain lengths.
10-8
10-7
10-6
10-5
10-4
10-3
2.9 3 3.1 3.2 3.3 3.4 3.5
salt 2n1salt 1
1000/T /K-1
10-8
10-7
10-6
10-5
10-4
10-3
2.9 3 3.1 3.2 3.3 3.4 3.5
salt 2 n7salt 2 n16
salt 2 n3salt 2n1
1000/T /K-1
10-8
10-7
10-6
10-5
10-4
10-3
2.9 3 3.1 3.2 3.3 3.4 3.5
n =7
n=16
1000/T /K-1

Chapter II: Synthesis and characterization of a family of oligoethers end-capped by lithium aryl
perfluorosulfonates
81
In the figure 2.23 the impact of the ratio O/Li on the conductivities, for the electrolytes
(a) POE+salt 2n1, (b) POE+salt 2n3 and (c) POE+salt 2n16, are represented. For the
electrolytes based on salt 2n1 and salt 2n3 the higher conductivity is obtained for n=20. The
conductivity depends on the salt concentration; addition of higher amount of salt means
theoretically increase of ion concentration which might improve the conductivity but also
decrease in mobility. Increasing the salt concentration from O/Li= 20 to 16 induces for both
electrolytes (figure 2.23 a and b) a decrease in conductivity. The decrease in salt
concentration (from O/Li=20 to O/Li=30) induces also a decrease in conductivity. This means
that, as often, the conductivity vs salt concentration passes by a maximum that might be close
to O/Li = 20. In the case of POE +salt 2n16 a salt concentration increase must increase the
concentration in ionic species contributing to the conductivity even if the dissociation
decreases with the salt concentration according to the theory of weak electrolytes. But
contrary to POE + salt 2n1 and POE + salt 2n3, the mobility should not be penalized by a salt
concentration increase. Unfortunately, the electrolytes creeping did not allow assessing to salt
concentrations exceeding O/Li= 40. Nonetheless, the conductivities increase from O/Li= 60 to
O/Li= 40.

Chapter II: Synthesis and characterization of a family of oligoethers end-capped by lithium aryl
perfluorosulfonates
82
a) POE + salt 2n1
b) POE + salt 2n3
c) POE + salt 2n16
Figure 2.23. Comparison of conductivity of POE/salt 2 with various O/Li.
10-8
10-7
10-6
10-5
10-4
10-3
2.9 3 3.1 3.2 3.3 3.4 3.5
O/Li = 16
O/Li = 30O/Li = 20
1000/T /K-1
10-8
10-7
10-6
10-5
10-4
10-3
2.9 3 3.1 3.2 3.3 3.4 3.5
O/Li =20O/Li =16O/Li = 30
1000/T /K-1
10-7
10-6
10-5
10-4
10-3
2.9 3 3.1 3.2 3.3 3.4 3.5
O/Li = 60
O/Li = 50
O/Li=40
1000/T K-1

Chapter II: Synthesis and characterization of a family of oligoethers end-capped by lithium aryl
perfluorosulfonates
83
II.3.5.Diffusion coefficients
The diffusion coefficients of the different species, Li+ and anion determined by
multinuclear Pulsed Field Gradient 7Li-NMR and 19F-NMR respectively are presented in
Table 2.11.
Table 2.11 Comparison of diffusion coefficients for the different polymer electrolytes
POE/salt 1 and 2) determined by PFG-NMR at 110°C
POE/Salt Salt 1 Salt 2n1 Salt 2n3 Salt 2n7 Salt 2n16
O/Li 30 30 30 30 40
D 19F(cm2 s-1) 1.15×10⁻⁷ 1.64×10⁻⁷ 1.55×10⁻⁷ 1.25×10⁻⁷ 1.02×10⁻⁷
D 7Li(cm2 s-1) 0.85×10⁻⁷ 1.20×10⁻⁷ 1.35×10⁻⁷ 1.42×10⁻⁷ 1.45×10⁻⁷
Nernst (S cm-2mol-1) 4.6×10⁻⁴ 6.7×10⁻⁴ 6.9×10⁻⁴ 5.3×10⁻⁴ 3.7.×10-4
exp (S cm-1) 3.32×10⁻⁴ 2.96×10⁻⁴ 2.94×10⁻⁴ 3.07×10⁻⁴ 3.41×10⁻⁴
% dissociation 71 44 42 59 91
From Table 2.11 it can be observed that the self-diffusion coefficients of anion and Li+
are lower for POE+salt 1 than for POE+salt 2. However, it was shown previously that
conductivities are very close at temperatures higher than the POE crystallization temperature
at the same concentration. Regarding the salt 2, first it can be pointed out that the self-
diffusion coefficient of anion is higher in the POE+salt as compared to the pure salt. An
increase of factor close to 2 and 1.5 is observed in the case of salt 2n7 and salt 2n16
respectively while the values of D7Li are much closer (in pure salt and POE electrolytes). The
higher values of the anion self-diffusion coefficients in POE membrane could be explained by
the interactions of Li+ with the O atoms of the melted POE and thus an increase of mPEG
chain mobility. However the values of diffusion coefficients decrease with the increase of
mPEG chain length (from n=1 to n=16). Contrarily, the self-diffusion coefficients of Li+
increase with the increase of the mPEG chain lengths, due certainly to the higher mobility of
mPEG chain as compared to POE chain. The higher n is the higher weight content of salt in

Chapter II: Synthesis and characterization of a family of oligoethers end-capped by lithium aryl
perfluorosulfonates
84
the POE electrolyte and the higher probability for Li+ to interact with more O atoms
belonging to more mobile mPEG.
As we already mentioned the Nernst–Einstein equation is valid for the infinitely dilute
state, in our case we use it only to compare the values obtained with different POE
electrolytes. To measure the conductivities at 110°C (in order to compare the experimental
conductivity with that obtained by Nernst–Einstein equation) we have used the same cell that
was used for the pure salts (salt 2n 7 and salt 2n16), i.e. a dip-type glass cell with two
platinum electrodes at a constant distance while, at this temperature the utilization of stainless
disc electrodes in a Swagelok cell was impossible because of the films creeping that affects
the thickness or even leads to short circuit. However there is a good concordance between the
conductivities measured with both types of cells.
From Table 2.11 it can be observed that the experimental conductivities, of electrolytes based
on salt 2, increase slightly with the lengthening of mPEG while those calculated using
Nernst–Einstein equation decrease. This behavior might reveal a higher dissociation of the
salt based on the longest mPEG. However, the obtained values for the % dissociation are too
high, from our point of view.
II.3.6.Cationic transference number and cationic conductivity
One very important parameter for the performances and safety of the lithium batteries
is the cationic transport number. In this manuscript the T+ values were determined employing
both, pulsed NMR spectroscopy and electrochemical impedance spectroscopy methods.
T+ inferred by NMR is obtained from diffusion coefficients of anion and cation, even though
NMR cannot discriminate between, on the one hand, the free ions and solvent-separated ion
pairs that contribute to the conductivity and, on the other hand contact ion pairs that are
electrically neutral.
The electrochemical measurements are based on the method developed by Sorensen
and Jacobsen [22]. According to the method by Sorensen and Jacobsen, the lithium transport
number can be extracted from a single impedance experiment. In this work symmetrical
lithium test cells: Lithium/ solid polymer electrolyte/ Lithium were used for electrochemical
experiments. The acquired electrochemical impedance spectrum comprises the electrolyte
resistance (Re) and the two electrode/electrolyte interfaces. In general, in the high frequency

Chapter II: Synthesis and characterization of a family of oligoethers end-capped by lithium aryl
perfluorosulfonates
85
region are detected the processes related to ion transport within the bulk electrolyte and it can
be easily observed that this component changes substantially. At low frequencies, the Nyquist
plot for impedance of the symmetric plane cell Lithium/electrolyte/Lithium containing two
ionic mobile species is characteristic of lithium ions transport limitation by diffusion through
electrolyte. This solid state lithium ion diffusion is known as Warburg diffusion [23]. The
cells were carefully prepared in an argon glove box in order to avoid degradations of lithium
metal foil and the presence of humidity in the electrolyte. Both electrodes (anode and cathode)
are made of thin lithium foils which have a thickness of approximately 65 µm, while a
polypropylene layer was used as insulator. Also the polymer electrolyte thickness thickness
(l), important, must be known before and after the impedance measurements). The cell
elaboration (the lamination process) and further impedance measurements modify the
membrane thickness. For this reason, the membrane thickness after impedance represents the
‘real’ thickness which is used for calculation of diffusion coefficient. The value of diffusion
coefficient can be easily detected while using the characteristic (solid state) diffusion time τ
[24].
τ = l2/ D (12)
where l is the inter-electrode distance (polymer electrolyte thickness) and D is the ambipolar
diffusion coefficient [25].
In the case of symmetrical electrochemical cells, Li/electrolyte/Li, the lithium metal
electrodes are considered as blocking electrodes for the anion and non-blocking for the
lithium cation. For this reason, the diffusion impedance (Warburg diffusion, Wd) is given by:
Wd = Re µ2/µ1 (13)
Where µ1 is the lithium cation mobility, µ2 is the anion mobility and Re is the electrolyte
resistance. This leads to the final equation for transference number, T+:
T+= Re/ (Re+Wd) (14)
Prior to impedance measurement a potential of 40 mV is applied. All measurements were
done at high temperature i.e. 110 °C, as the high temperature generates fast ion movement and
in order to match with PFG NMR data. The complexes of POE+ lithium salt were maintained
to 20 h isotherm in order to be sure the film is stable. After 20 h only 5 % weight loss was
shown.

Chapter II: Synthesis and characterization of a family of oligoethers end-capped by lithium aryl
perfluorosulfonates
86
The cationic conductivities of the electrolyte were calculated from the equation (15).
+ = T+ (15)
The cationic transference numbers and cationic conductivities are presented in Table 2.10.
The values of T+ measured by PFG-NMR, range from 0.42 to 0.59. All POE/salt 1 and 2
electrolytes exhibit higher T+ than that obtained with POE/LiTFSI electrolytes. In the case of
salt 2, the lengthening of mPEG induces an increase of T+. However, the incorporation of salt
2n7 and salt 2n16 in POE results in lower cationic transference number as compared to the
pure salt. This is certainly due to the participation of POE to the Li+ mobility.
Excepting the salt 2n7 the T+ obtained by EIS technique are close to 0.5 (ranging between 0.5
and 0.55) and for the salts salt 1, salt 2n1, salt 2n3, the values are higher than those obtained
by PFG-NMR. The PFG-NMR measured both the diffusion of dissociated ion-pair and
contact ions pairs. For contact ion-pairs anion and cation diffuse at the same rate: therefore
the cationic contribution of these ion-pairs is 0.5. If the salt has a low T+ as LiTFSI, the
undissociated ion pairs increase artificially T+. Conversely if the salt has a high T+, the
undissociated ion-pairs will lower artificially T+.
Table 2.12 Transference number (T+), conductivity () and cationic conductivity (T+) for
salt 1 and salt 2 in POE matrix with two different investigating methods at 110°C
Complex O/Li
(S/cm)
PFG-NMR EIS
T+ +
(S/cm)
T+ +
(S/cm)
Salt 2n7 - 2.52×10⁻⁴ 0.64 1.61×10⁻⁴ - -
Salt 2n16 - 2.91×10⁻⁴ 0.72 2.10×10⁻⁴ - -
POE/LiTFSI 30 1.24×10⁻³ 0.28 3.47×10⁻⁴ 0.12 1.74×10⁻⁴
POE/PhSCF2C
F2SO3Li* 30 1.8×10⁻⁴* - - 0.48* 8.6×10-5*
POE/Salt 1 30 3.32×10⁻⁴ 0.42 1.40×10⁻⁴ 0.55 1.82×10⁻⁴
POE/Salt 2n1 30 2.96×10⁻⁴ 0.42 1.26×10⁻⁴ 0.50 1.51×10⁻⁴
POE/Salt 2n3 30 2.94×10⁻⁴ 0.46 1.35×10⁻⁴ 0.53 1.73×10⁻⁴
POE/Salt 2n7 30 3.07×10⁻⁴ 0.53 1.63×10⁻⁴ 0.26 0.8×10⁻⁴
POE/salt 2n16 40 3.41×10⁻⁴ 0.59 2.01×10⁻⁴ 0.51 1.74×10⁻⁴
* measured at 70°C [17]

Chapter II: Synthesis and characterization of a family of oligoethers end-capped by lithium aryl
perfluorosulfonates
87
II.4. Film elaboration based on POE network (NPC)
electrolyte based on salt 1 and 2
As previously discussed, the films based on semi-crystalline POE electrolytes exhibit a
low conductivity below their melting temperature and very poor mechanical properties after
this melting. This is detrimental both, for the performances (conductivity, thickness, ohmic
drop) and for the safety of lithium polymer batteries. Therefore, many research groups have
proposed modified POE matrix in order to increase both the content of amorphous phase and
the mechanical strength after the POE melting [2], [26], [27], [28], [29], [30]. In this
manuscript we selected an unsaturated polyether (polycondensat) obtained by Williamson
type polycondensation. This reaction is performed by reacting poly(ethylene glycol) (Mw
=1,000) with 3-chloro-2-chloromethyl -1-propene in the presence of KOH. Once casted the
electrolyte films, the polymer are cross-linked by an UV photo-initiation of their double
bonds.
II.4.1.Polycondensat synthesis (LPC)
Unsaturated polyethers were prepared by a Williamson type polycondensation as
shown in Figure 2.24. Poly(ethylene glycol) (Mw =1,000) and 3-chloro-2-chloromethyl -1-
propene were used as the starting materials, the reaction take place in presence of grinded
KOH without any added solvent at 40°C for 48 hours. The linear polycondensat (LPC) was
purified by ultrafiltration (cut-off: 3,000 Dalton) in order to remove the reaction product, KCl,
the excess of KOH, and all the oligomers having a molecular weight lower than 3,000 g/mole.
As the entanglement threshold in POE is close to 3,400 g/mole we can assume that even the
uncross-linked chains will be entangled into the network
Cl Cl
HO
O
OH22
+KOH O
O
O22
O
O
O22
LPC1000
n
Figure 2.24. Synthesis of linear polycondensat (LPC).

Chapter II: Synthesis and characterization of a family of oligoethers end-capped by lithium aryl
perfluorosulfonates
88
The unsaturated polyether was characterized by Size Exclusion Chromatography
(SEC) and 栂 = 73,470 g/mole, 津 = 26740 g/mole and = 栂 津⁄ = に.ば were obtained.
II.4.2.Membrane preparation
The cross-linked films (NPC) were obtained by the UV irradiation of the casted films.
The LPC, the salt, the initiator (IRGACURE® 2959, CIBA) were dissolved in acetonitrile in
the glove box. The resulting electrolyte was poured into a Teflon plate. After the solvent
evaporation, the cross-linking under UV radiation was carried out for 30 seconds or 1 minute.
The resulting network polycondensat electrolytes (NPC) were then dried under vacuum at 60
°C for 72 h and carefully stored in the glove box.
The membranes with the average thickness of 200-300 m were characterized by
various methods to study and understand their physical, chemical, mechanical and
electrochemical behavior (discussed in the following section).
O
O
O22
O
O
O22
LPC1000
n
O
OH
O
HO
IRGACURE® 2959
UV, Lithium salt
Crosslinked POE/salt (NPC/salt)
Figure 2.25. Schematic draw of Crosslinked POE (NPC).

Chapter II: Synthesis and characterization of a family of oligoethers end-capped by lithium aryl
perfluorosulfonates
89
II.4.3.Thermal characterizations
Table 2.13 summarizes the Tg, the Tm and the H obtained by DSC measurements for
the host polymer NPC and its electrolytes. The Tg1, Tm1, H1 were measured after the first
heating from -100°C to 60°C and the Tg2, Tm2, H2 were measured during the second heating
after a 1st heating up to 60°C followed by a quenching (cooling ramp 50°C/min). The
thermograms showed a crystallization peak before the fusion of crystalline phase, sometime
the peaks are overlapping, therefore the values of Tm was taken at peak. The samples still
exhibited the semi-crystalline behavior but the melting temperature decreased as compared to
POE and to the 1st heating.
For NPC+salt complexes, at the same salt concentration and irradiation time we did
not observe a significant and coherent evolution of Tg with the increase of the mPEG chain
length from n=1 to n=7 or with the increase of O/Li ratio. However for salt 2n16 the Tg seems
to be at least 4°C higher as compared to other NPC +other salts and additionally another Tg is
observed at 7°C. This behavior is similar to that observed for POE +salt 2n16 and shows the
presence of two amorphous phases.
Concerning the melting temperature and enthalpy a significant decrease was observed for the
second scan as compare to the first scan. However, similar to the membrane based on POE the
values of H seem to increase with the increase of n of mPEG. Nevertheless the values of H
for longer mPEG are higher than of NPC without salt. These results prove the presence of salt
into membrane can modified the value of H of NPC. Moreover, in the case of membranes
based on NPC the presence of salt could affect the crosslinking reaction, and thus the H
value. The H of 100% NPC crystalline is not known therefore the % crystallization was not
calculated.

Chapter II: Synthesis and characterization of a family of oligoethers end-capped by lithium aryl
perfluorosulfonates
90
Table 2.13 (a) Glass transition temperature (Tg) melting temperature (Tm) and fusion enthalpy
(H) of NPC/salt 1 and NPC/salt 2 electrolytes at different cross-linking times 30s
Sample O/Li
(O/Li-n)
Tg1
(°C)
Tg2
(°C)
Tm1
(°C)
Tm2
(°C)
HNPC1
(J/g)
HNPC2
(J/g)
NPC ∞ -52 -64 44 38 58 38
NPC/Salt 2n1 20(19) -40 -59 39 31 37 17
30(29) -36 -59 42 34 54 29
NPC/Salt 2n3 12(9) -31 -63 36 28 27 6
20(17) -38 -64 36 30 22 13
30(27) -35 -66 40 32 42 27
NPC/Salt 2n7 20(13) -38 -66 39 32 33 27
30(23) -37 -63 41 36 48 40
40(33) -38 -65 37 36 26 31
NPC/Salt 2n16 30(14) -31; 7 -67; 7 45 39 73 94
35(19) -31; 7 -63; 4 45 38 63 76
40(24) -37 -66 48 36 64 54
The increase of irradiation time from 30 s to 1 min in the case of NPC films does not induce
significant modification of Tg, while Tm and H are significantly decreased. The longer
irradiation time should enhance the cross-linking density that usually induces a Tg increase. In
our case, obtaining the same Tg can be explained by the significant crystallinity decrease,
which counterbalances the stiffening produced by higher crosslinking density. Indeed the

Chapter II: Synthesis and characterization of a family of oligoethers end-capped by lithium aryl
perfluorosulfonates
91
formation of the cross-linking bridges creates disorder and prevents the crystallization of the
POE segments of NPC.
Concerning the effect of irradiation time on NPC+salt 2 complexes, a slight increase of Tg
was observed for the sample irradiated 1 min as compared to those irradiated 30s.
Similarly to the results obtained on the sample irradiated for 30s, no correlation between the
lengths of mPEG chain or O/Li ratio and the Tg values can be established. Moreover, for the
electrolytes based on salt 2n1, 2n2 and 2n7 important decreases of Tm and H values were
observed following a longer irradiation time. For the electrolytes based on salt 2n16 the
values of H and Tm for the samples irradiated at different times are close.

Chapter II: Synthesis and characterization of a family of oligoethers end-capped by lithium aryl
perfluorosulfonates
92
Table 2.13 (b) Glass transition temperature (Tg) melting temperature (Tm) and fusion enthalpy
(H) of NPC/salt 1 and NPC/salt 2 complexes in different cross-linking times 1 minute
O/Li
(O/Li-n)
Tg1
(°C)
Tg2
(°C)
Tm1
(°C)
Tm2
(°C)
H1NPC
(J/g)
H2NPC
(J/g)
NPC ∞ -51 -64 32 21 40 33
NPC/Salt 2n1 20(19) -37 -64 35 26 14 6
30(29) -49 -68 34 34 46 34
NPC/Salt 2n3 12(9) -28 -63 35 26 13 2
20(17) -47 -61 35 27 24 13
30(27) -48 -62 32 18 5 5
NPC/Salt 2n7 20(13) -38 -62 34 26 12 4
30(23) -41 -60 40 33 40 29
40(33) -35; 14 -62 41 31 38 27
NPC/Salt 2n16 30(14) -32 -58 45 38 96 94
35(19) -32 -60 45 38 83 76
40(24) -31 -60 45 38 68 70
HNPC: fusion enthalpy calculated by mass of NPC host polymer
O/Li-n: the O/Li taking in account only the OE from NPC.
II.4.4.Thermal stability
Figure 2.26 shows the TGA curves of salt 2n3 , POE + salt 2n3 , NPC+ salt 2n3 , and
NPC. Similarly to the POE + salt electrolytes we observed an increase of Td when the salt is
incorporated in NPC matrix and its values are much lower than that of pure NPC matrix. It
could see that POE electrolyte exhibited a slightly higher thermal stability as compared with

Chapter II: Synthesis and characterization of a family of oligoethers end-capped by lithium aryl
perfluorosulfonates
93
electrolytes based on NPC but the stability of host polymers free of salt is in agreement with
these data. This result is surprising as a network is a polymer of infinite molecular weight and
its thermal stability should be higher than that of a unidimensional polymer. However the
thermal stability of all these materials is overestimated and TGA does not allow detecting
degradation products if there chain lengths are high enough to prevent their evaporation.
Then, the TGA experiments were performed in inert gas and not in air. So, the main
conclusion of these TGA records is that the weight loss of the salt is delayed when the salt is
blended to host polyether in relation with the possible interaction of the degradation products
with the host polymers.
Figure 2.26. Influence of different host polymers on the thermal stability of complex at the
concentration O/Li = 20.
-100
-80
-60
-40
-20
0
0 100 200 300 400 500
Wei
gh
t L
oss
(%
)
Temperature (°C)salt 2n3 POENPC, 30s POE+salt 2n3, O/Li=20NPC+salt 2n3, O/Li=20, 30 s

Chapter II: Synthesis and characterization of a family of oligoethers end-capped by lithium aryl
perfluorosulfonates
94
Figure 2.27. (a) Weight loss (%) of NPC/salt 2n3, 2n7 complexes as a function of
temperature and (b) their first weight loss derivatives.
The weight loss temperatures of NPC complexes increases with the increase of mPEG
chain lengths of the salt, starting at 257 °C and 267 °C, in nitrogen, for NPC/salt 2n3 and
NPC/salt 2n7 at O/Li =20, respectively. This phenomenon was also observed when the longer
lithium salt was incorporated in POE host polymer. The weight loss takes place in two steps.
-100
-80
-60
-40
-20
0
0 100 200 300 400 500
Wei
gh
t L
oss
(%
)
Temperature (°C)
NPC+salt 2n3, O/Li=20 NPC+salt 2n3, O/Li=30
NPC+salt 2n7, O/Li=20
-2
-1.5
-1
-0.5
0
0.5
25 125 225 325 425
Wei
gh
t L
oss
der
ivat
ive
(%/°
C)
Temperature (°C)
NPC+salt 2n3, O/Li=20 NPC+salt 2n3, O/Li=30 NPC+salt 2n7, O/Li=20
-0.3
-0.1
0.1
240 290 340
(a)
(b)

Chapter II: Synthesis and characterization of a family of oligoethers end-capped by lithium aryl
perfluorosulfonates
95
However in the first step more than 60% weigh is lost that is much higher than the weight of
the salt. With regard to the salt concentration, the highest salt content exhibits slightly lower
thermal stability as shown in the figure 2.27 for NPC/salt 2n3 for O/Li= 20 and 30
concentrations. We can suppose that the salt concentration impacts on the degradation ;
similar results being previously obtained by C. Chauvin et al. [31]
II.4.5.Mechanical properties
The mechanical properties are improved when the linear POE is replaced by the cross-
linked one, NPC, as represented in figure 2.28. At low temperature, the storage modulus of
NPC membrane is higher than that of POE due to the strength of cross-linked architecture.
However, relaxation temperature (Tα) associated to Tg for NPC membrane appears at slightly
lower temperature as compared to POE membrane. Above the melting temperature the NPC
membrane present rubbery plateau, that indicates a behavior of cross-linked elastomer,
whereas the storage modulus of linear POE matrix drops to 0 MPa.
Figure 2.28. Comparison of mechanical properties between POE and NPC host
polymers (crosslinking time of 30 seconds for NPC complex).
0
0.2
1
10
100
1000
10000
-100 -50 0 50 100
Tan
Sto
rag
e M
od
ulu
s (M
Pa)
Temperature (°C)
POE without salt NPC, 30s without salt

Chapter II: Synthesis and characterization of a family of oligoethers end-capped by lithium aryl
perfluorosulfonates
96
Irradiation time
As we can see from the figures 2.29, a longer irradiation time induces a slight decrease
of the transition α, Tα, associated to Tg and of the storage modulus between Tα and Tm. This is
certainly due to the decrease of crystallinity of host the polymer as evidenced by DSC. This
can be explained by an increased disorder generated by a more complete crosslinking, which
reduces both the crystallinity and melting point. Moreover, longer irradiation time leads to
higher crosslinking degree, evidenced through the DMA by the greater values of the storage
modulus on the rubbery plateau, E’ increasing from 2 to 5 MPa.
Figure 2.29. Effect of irradiation time on mechanical properties of NPC membrane (a)
NPC without salt, (b) NPC+ salt 2n3 and NPC + salt 2n7. (O/Li=30)
(a)
(b)

Chapter II: Synthesis and characterization of a family of oligoethers end-capped by lithium aryl
perfluorosulfonates
97
Concerning the salt doped NPC membranes the behavior is dependent on the salt
structure (figure 2.29 b). Thus in the case of salt 2n7 the increase of irradiation time seems to
have any significant impact on the relaxation temperature but the value of storage modulus on
rubbery plateau is twice higher. Moreover, the storage modulus drop related to the melting
temperature is lower for the membrane irradiated for 1 min as compared to the membranes
irradiated for 30 s, indicating a lower crystallization degree of host polymer for the first.
These results corroborate the DSC results. In the case of the membranes based on NPC +salt
2n3 the same effect was observed as for free NPC membranes, i.e. a decrease of storage
modulus values between the Tα and Tm and higher storage modulus on the rubbery plateau.
Length of mPEG
The doping of NPC with a salt affected both the alpha relaxation and the storage
modulus on rubbery plateau (figure 2.30). The Tα values of the NPC + salt 2n3 and n7 are
lower than that of NPC + salt 2n1. Moreover, the peaks corresponding to α relaxation are
very intense and thin in the case of membranes based on the salt 2n1, salt 2n3 and salt 2n7 as
compare to NPC membrane. These results indicate a greater content of amorphous phase with
more homogenous domains size in NPC electrolytes as compared to pure NPC. Regarding the
storage modulus on the rubbery plateau the NPC + salt 2n3 give the highest values that means
the higher reticulation degree. The membrane based on NPC + salt 2n16 exhibits a surprising
behavior. This membrane has two relaxation temperatures and the values of both of them are
higher than those of all membranes studied here. This behavior underlines the presence of two
amorphous phases. The surprising high value can be partially explained by the high
crystallization degree of NPC matrix evidenced by DSC measurements. A similar behavior
was reported in this manuscript for the membranes POE+ salt 2n16. The second Tα could
correspond to salt 2n16 confined in NPC crystallized phase.
None rubbery plateau was observed for the electrolytes NPC+salt 2n16. However the
films are insoluble in acetonitrile, which proves the formation of a NPC (cross-linked
polycondensate LPC). To explain the total absence of rubbery plateau we can assume that
NPC phase doesn’t well percolate. The NPC content in the membrane (O/Li = 30) is only
47% w/w.

Chapter II: Synthesis and characterization of a family of oligoethers end-capped by lithium aryl
perfluorosulfonates
98
Figure 2.30. (a) Storage modulus vs temperature for various salt 2 incorporated in NPC host
polymer at O/Li= 30, irradiation time 30 seconds, (b) their Tan .
The membranes NPC + salt 2n16 show a similar behavior for different O/Li.
0.01
0.1
1
10
100
1000
10000
-100 -50 0 50 100
Sto
rag
e M
od
ulu
s (M
Pa)
Temperature (°C)
NPC without salt
NPC+salt 2n1
NPC+salt 2n3
NPC+salt 2n7
NPC+salt 2n16
0
0.1
0.2
0.3
0.4
0.5
0.6
0.7
0.8
-100 -50 0 50
Tan
Temperature (°C)
NPC without salt
NPC+salt 2n1
NPC+salt 2n3
NPC+salt 2n7
NPC+salt 2n16
(a)
(b)

Chapter II: Synthesis and characterization of a family of oligoethers end-capped by lithium aryl
perfluorosulfonates
99
II.4.6. Conductivity
Host polymer
The effects of the host polymer (POE, NPC) on the conductivities of the electrolytes,
based on salt 2n3 and salt 2n16, are compared in figure 3.31. The conductivities of the
electrolytes based on salt 2n3 + POE and salt 2n16 + POE are slightly higher than those of
membranes based on NPC above the melting temperature Tm while, below Tm, the
conductivities of NPC based electrolytes are roughly 10 times higher. The much lower
crystallinity and Tm of NPC explain this conductivity gain at low temperatures.
Figure 2.31. Conductivities vs 1000/T for (a) salt 2n3 O/Li=30 and (b) salt 2n16 O/Li=40 in
POE and NPC matrix.
Up and down
The conductivities were measured in the temperature range 20 -110°C in heating-cooling
cycle, first (up) the temperature was increased and then it was decreased (down). In the figure
2.32 we can see, at temperatures higher than 40°C, that conductivities perfectly superimpose
on curves up and down. These results prove that: (i) the thickness of the membrane is very
stable despite the performing of the measurements at temperatures much higher than the NPC
Tm (between 30 and 40°C) (ii) the cross-linking degree of the membrane was unaffected by
the high temperature. The membranes were heated for an hour at 110°C and at this
temperature it could be expected a thermal polymerization of the residual uncross-linked
double bonds, and thus an increase of the crosslinking density. The higher crosslinking degree
2,5 2,6 2,7 2,8 2,9 3,0 3,1 3,2 3,3 3,4 3,5
1E-8
1E-7
1E-6
1E-5
1E-4
1E-3
Co
nd
uctivity (
S/c
m)
1000/T (K-1)
POE/salt 2n3, O/Li=30
NPC/salt 2n3, O/Li=30
2,5 2,6 2,7 2,8 2,9 3,0 3,1 3,2 3,3 3,4 3,5
1E-8
1E-7
1E-6
1E-5
1E-4
1E-3
Co
nd
uctivity (
S/c
m)
1000/T (K-1)
POE/salt 2n16, O/Li=40
NPC/salt 2n16, O/Li=40
(a) (b)

Chapter II: Synthesis and characterization of a family of oligoethers end-capped by lithium aryl
perfluorosulfonates
100
leads usually at to a decrease of conductivity (as we show below for the membranes irradiated
for a longer time). This means that the membranes are thermally stable up to at least 110°C.
(a)
(b)
(c)
(d)
Figure 2.32. Conductivities vs 1000/T for (a) salt 2n1 irradiation time 1 min, (b) salt 2n16
irradiation time 1 min, (c) salt 2n1 irradiation time 30s and (d) salt 2n16 irradiation time 30s
in NPC matrix, O/Li 30.
mPEG chain lengths
The temperature dependence of the ionic conductivity for complexes based on NPC + salts
with different chain PEG lengths is represented in Figure 2.33 (a and b). In both figures we
can see that conductivities are close, in the whole temperature range, for all the electrolytes
whatever the mPEG lengths. However, for the membranes irradiated 30 s the conductivity of
1.00E-08
1.00E-07
1.00E-06
1.00E-05
1.00E-04
1.00E-03
2.5 2.7 2.9 3.1 3.3 3.5
Co
nd
uct
ivit
y (S
/cm
)
1000/T (K-1)
NPC+salt 2n1, 1min, up
NPC+salt 2n1, 1min, down
1.00E-08
1.00E-07
1.00E-06
1.00E-05
1.00E-04
1.00E-03
2.5 2.7 2.9 3.1 3.3 3.5
Co
nd
uct
ivit
y (S
/cm
)
1000/T (K-1)
NPC+salt 2n16, 1min, up
NPC+salt 2n16, 1min, down
1.00E-08
1.00E-07
1.00E-06
1.00E-05
1.00E-04
1.00E-03
2.5 2.7 2.9 3.1 3.3 3.5
Co
nd
uct
ivit
y (S
/cm
)
1000/T (K-1)
NPC+salt 2n1, 30s, up
NPC+salt 2n1, 30s, down

Chapter II: Synthesis and characterization of a family of oligoethers end-capped by lithium aryl
perfluorosulfonates
101
the electrolyte NPC + salt2 n16 is slightly higher than the other ones that superimpose. On the
other hand, the conductivities of all the electrolytes, irradiated for 1 min, superimpose.
Figure 2.33. Conductivities vs reciprocal temperature for various chain length of salt 2 in
NPC matrix at the concentration O/Li=30 with irradiation times of 30 seconds and 1 minute.
Irradiation time
From the graph 2.34, which represents the influence of the irradiation time on the
conductivity, a conductivity decrease can be observed upon an increase in irradiation time that
can be ascribed to an increase of crosslink density. All the membranes, irradiated for 1 min,
exhibit conductivities of 10-6 S/cm at room temperature and 7×10⁻⁵ S/cm at 110°C. These
values are however lower than the conductivities of NPC/PhSCF2CF2SO3Li prepared by E.
Paillard [17]. However, the membranes were processed in different conditions (irradiation
time, light intensity, lamp power).
2,6 2,8 3,0 3,2 3,4
1E-7
1E-6
1E-5
1E-4
1E-3
Co
nd
uctivity (
S/c
m)
1000/T (K-1)
salt 2n1, 30s
salt 2n3, 30s
salt 2n7, 30s
salt 2n16, 30s
2,6 2,8 3,0 3,2 3,4
1E-7
1E-6
1E-5
1E-4
1E-3
Co
nd
uctivity (
S/c
m)
1000/T (K-1)
salt 2n1, 1 min
salt 2n3, 1 min
salt 2n7, 1 min
salt 2n16, 1 min
(a) (b)

Chapter II: Synthesis and characterization of a family of oligoethers end-capped by lithium aryl
perfluorosulfonates
102
Figure 2.34. Conductivities vs reciprocal temperature for two irradiation time of salt 2n16 in
NPC matrix at the concentration O/Li=30.
The ratio O/Li
Figure 2.35. Conductivities vs reciprocal temperature for each chain length of salt 2 in NPC
matrix at various concentration O/Li=30 with the crosslinking time 30 seconds.
1.00E-08
1.00E-07
1.00E-06
1.00E-05
1.00E-04
1.00E-03
2.5 2.7 2.9 3.1 3.3 3.5
Co
nd
uct
ivit
y (S
/cm
)
1000/T (K-1)
NPC+salt 2n16, 30sNPC+salt 2n16, 1min
2,6 2,8 3,0 3,2 3,4
1E-7
1E-6
1E-5
1E-4
1E-3
Co
nd
uctivity (
S/c
m)
1000/T (K-1)
salt 2n1, O/Li=20
salt 2n1, O/Li=30
2,6 2,8 3,0 3,2 3,4
1E-7
1E-6
1E-5
1E-4
1E-3
Co
nd
uctivity (
S/c
m)
1000/T (K-1)
salt 2n7, O/Li=20
salt 2n7, O/Li=30
salt 2n7, O/Li=40
2,6 2,8 3,0 3,2 3,4
1E-7
1E-6
1E-5
1E-4
1E-3
Co
nd
uctivity (
S/c
m)
1000/T (K-1)
salt 2n16, O/Li=30
salt 2n16, O/Li=35
salt 2n16, O/Li=40

Chapter II: Synthesis and characterization of a family of oligoethers end-capped by lithium aryl
perfluorosulfonates
103
Except the salt 2n7 for which O/Li =20 give the best conductivities, for the other
complexes (NPC + salt 2 (n1, n3, n16 and salt 1) the O/Li has low impact on the
conductivities. This is probably due to the crosslinking degree that can change as a function of
salt concentration.
II.4.7.Diffusion coefficients and cationic transference numbers
The self-diffusion coefficients, of anion and Li+, determined by PFG-NMR at 110°C
are gathered in the table 2.14. The self-diffusion coefficients of anion in NPC membranes
seem to be less dependent of the size of anion as compared to membranes based on POE.
Additionally the values of self-diffusion coefficients in NPC membranes are close or higher as
compared to those determined in POE electrolytes. Moreover, the highest values were
obtained for the electrolytes that shown the highest storage modulus on the rubbery plateau
(Figure 2.30). Regarding, the self-diffusion coefficients of Li+, they increase with the increase
of anion size and this behaviour is similar to the POE electrolytes. However, this increase is
much higher in the case of NPC membrane and the value of the self-diffusion coefficient in
the electrolytes based on NPC+salt 2n16 is more than 3 times higher than that of POE +salt
2n16 one. These results are very surprising; all the more so since the conductivities NPC
based electrolytes are lower than those of on POE ones. These higher values of diffusion
coefficient and much lower conductivities can be explained by a lower dissociation degree of
the salts in NPC host polymer than in POE, how it can be seen from the Table 2.14

Chapter II: Synthesis and characterization of a family of oligoethers end-capped by lithium aryl
perfluorosulfonates
104
Table 2.14 Comparison of diffusion coefficients and transference numbers for different salt 2
in NPC at 110°C. O/Li=30 irradiation time=30s at 110°C
NPC/Salt Salt 2n1 Salt 2n3 Salt 2n7 Salt 2n16
D 19F (cm2 s-1) 1.39×10⁻⁷ 1.61×10⁻⁷ 1.40×10⁻⁷ 1.55×10⁻⁷
D 7Li (cm2 s-1) 0.93×10⁻⁷ 1.75×10⁻⁷ 2.08×10⁻⁷ 4.70×10⁻⁷
T+ 0.40 0.52 0.60 0.75
exp (S cm-1) 1.45×10⁻⁴ 1.19×10⁻⁴ 1.24×10⁻⁴ 1.46×10⁻⁴
+ (S cm-1)
5.80×10⁻⁵ 4.83×10⁻⁵ 6.84×10⁻⁵ 1.10×10⁻⁴
Nernst (S cm-2mol-1)* 5.26×10-4 7.71×10⁻⁴ 8.11×10⁻⁴ 1.48×10⁻³
%dissociation 28 15 15 10
* We suppose to NPC has the lower density than the POE.
II.5. Conclusion
Salts
Five salts were successfully synthetized by the modification of 2-(phenylsulfanyl)-
1,1,2,2 –tetrafluoroethane sulfonate with the mPEG.
Only two salts can be considered as ionic liquids (Tm<100°C), i.e. the salt 2n7 and the
salt 2n16.
The T+ and the conductivities increase with the increase of n of PEG.
The thermal stability of the salts are higher than of 2-(phenylsulfanyl)-1,1,2,2 –
tetrafluoroethane.
The electrochemical stability is better than the POE and comparable to of 2-
(phenylsulfanyl)-1,1,2,2 –tetrafluoroethane lithium salt.
Polymer electrolytes
Polymer electrolytes were prepared by blending the synthesized salt with the linear
(POE) or cross-linked (NPC) host polymer.
In the of POE electrolytes the increase of mPEG lengths of the salt induce:

Chapter II: Synthesis and characterization of a family of oligoethers end-capped by lithium aryl
perfluorosulfonates
105
o a decrease of Tg,
o increase of conductivity,
o increase of T+ (determinate by NMR)
o increase of dissociation salt degree
DMA, DSC show the presence of two amorphous phases in the case of POE+salt 2n16
The conductivities and Li self-diffusion coefficients sustain the hypothesis the OE
from mPEG have an important contribution to the Li+ conduction.
In the of NPC electrolytes the increase of mPEG lengths influence less significantly
the Tg and the conductivity as compared to POE electrolytes. In contrast the T+ and
the values of diffusion coefficients are higher for all the complexes based on NPC+
salts as compared to POE+salts while the conductivities at 110°C are lower.
Consequently the salt in NPC seems to be less dissociated.
The conductivity of electrolytes based NPC are 10 times higher at low temperature as
compared to those of POE while at high temperature is 2 to 3 times lower.
Contrary to POE electrolytes, NPC provides sufficient mechanical properties to
prevent the creeping.
II.6. References
[1] Y. Aihara, J. Kuratomi, T. Bando, T. Iguchi, H. Yoshida, T. Ono, et al., J. Power
Sources. 114 (2003) 96 – 104.
[2] Y. Kobayashi, S. Seki, Y. Mita, Y. Ohno, H. Miyashiro, P. Charest, et al., J. Power
Sources. 185 (2008) 542 – 548.
[3] Q. Wang, P. Ping, X. Zhao, G. Chu, J. Sun, C. Chen, J. Power Sources. 208 (2012) 210
– 224.
[4] M. Holzapfel, C. Jost, A. Prodi-Schwab, F. Krumeich, A. Würsig, H. Buqa, et al.,
Carbon. 43 (2005) 1488 – 1498.
[5] C.A. Vincent, 1959–2009, Solid State Ion. 134 (2000) 159 – 167.
[6] M. Armand, J.M. Chabagno, M. Duclot, Fast Ion Transport in Solids, Elsevier N. Y.
USA. (1979).
[7] Z. Wen, T. Itoh, T. Uno, M. Kubo, T. Wen, O. Yamamoto, Solid State Ion. 175 (2004)
739 – 742.
[8] Y. Kumar, S.A. Hashmi, G.P. Pandey, Solid State Ion. 201 (2011) 73 – 80.
[9] D. Benrabah, J.-Y. Sanchez, M. Armand, Solid State Ion. 60 (1993) 87 – 92.
[10] H. Zhang, C. Liu, L. Zheng, F. Xu, W. Feng, H. Li, et al., Electrochimica Acta. 133
(2014) 529 – 538.
[11] F. Alloin, D. Benrabah, J.-Y. Sanchez, J. Power Sources. 68 (1997) 372 – 376.

Chapter II: Synthesis and characterization of a family of oligoethers end-capped by lithium aryl
perfluorosulfonates
106
[12] S. Guhathakurta, K. Min, Polymer. 51 (2010) 211 – 221.
[13] D. Benrabah, S. Sylla, F. Alloin, J.-Y. Sanchez, M. Armand, Electrochimica Acta. 40
(1995) 2259 – 2264.
[14] E. Paillard, F. Toulgoat, C. Iojoiu, F. Alloin, J. Guindet, M. Medebielle, et al., J. Fluor.
Chem. 134 (2012) 72 – 76.
[15] E. Paillard, F. Toulgoat, J.-Y. Sanchez, M. Médebielle, C. Iojoiu, F. Alloin, et al.,
Electrochimica Acta. 53 (2007) 1439 – 1443.
[16] O. Seitz, H. Kunz, Angew Chem Int Ed Engl. (1995) 803–805.
[17] Elie Paillard, Institut Polytechnique de Grenoble, 2008.
[18] Christophe CHAUVIN, Institut Polytechnique de Grenoble, 2005.
[19] E. Paillard, F. Toulgoat, C. Iojoiu, F. Alloin, J. Guindet, M. Medebielle, et al., J. Fluor.
Chem. 134 (2012) 72 – 76.
[20] M. Erceg, D. Jozić, I. Banovac, S. Perinović, S. Bernstorff, Thermochim. Acta. 579
(2014) 86 – 92.
[21] M. Kumar, S.S. Sekhon, Eur. Polym. J. (2002) 1297.
[22] Soeresen, P.R., Jacobsen, T., Electrochimica Acta. (1982) 1671–1675.
[23] D. Aurbach, J Power Sources. (2000) 206–218.
[24] J Phys Chem B. (1997) 4630–4640.
[25] M. Rosso, Electrochimica Acta. (2006) 5334–5340.
[26] H. Cheradame, A. Gandini, A. Killis, J.F.L. Nest, J. Power Sources. 9 (1983) 389 –
395.
[27] X. Ollivrin, N. Farin, F. Alloin, J.-F.L. Nest, J.-Y. Sanchez, Electrochimica Acta. 43
(1998) 1257 – 1262.
[28] X. Ollivrin, N. Farin, F. Alloin, J.-F.L. Nest, J.-Y. Sanchez, Electrochimica Acta. 43
(1998) 1257 – 1262.
[29] D. Benrabah, J.Y. Sanchez, M. Armand, Electrochimica Acta. 37 (1992) 1737 – 1741.
[30] M. Watanabe, H. Tokuda, S. Muto, Electrochimica Acta. 46 (2001) 1487 – 1491.
[31] C. Chauvin, F. Alloin, P. Judeinstein, D. Foscallo, J.-Y. Sanchez, Electrochimica Acta.
52 (2006) 1240 – 1246.

Chapter III :Aliphatic Lithium Salts based on Sulfonate and Sulfonylimide Oligoether
107
III. Aliphatic Lithium Salts based on Sulfonate and
Sulfonylimide Oligoether
III.1. Introduction
In the previous chapter, a family of aryl-perfluorosulfonate lithium salt end-capped
with oligoether (mPEG) was studied. The presence of the mPEG in the structure of salt has a
moderate impact on crystallinity degree of host polymer but higher polymer electrolyte T+ and
cationic conductivities were obtained as compared to the salt without mPEG. Indeed the
presence of aromatic ring in the structure of the salt usually (i) increases the viscosity of the
salt and (ii) could modified the interaction of the salt with the host polymer as compare to
aliphatic salts [1]. Thereafter, it will be interesting to design aliphatic salt end-capped with
mPEG and study the impact of the bonding of mPEG on anion on the performances of
polymer electrolytes. Moreover, thanks to the higher ability of sulfonimide lithium salt
(LiTFSI) to dissociate and form polymer electrolyte with high conductivity and very low T+,
as previously reported in many works [2], [3], [4] it will be interesting to study how the
introduction of mPEG moieties affect the performances of membranes based on sulfonimide
salt.
This chapter is divided in 2 parts: (i) in the first part we present as a publication the
characterization of 2 salts, i.e. LiTPSM and LiTPSN (figure 3.1) in polymer electrolytes based
on POE and cross-linked POE, (NPC).
Figure 3.1. Chemical structures of (a) LiTPSM and (b) LiTPSN.
F3C
F2C
O
F2C
CF2
O2S
N
O2S
CF3
Li
F3C
F2C
O
F2C
CF2
SO3 Li

Chapter III :Aliphatic Lithium Salts based on Sulfonate and Sulfonylimide Oligoether
108
(ii) in the second part the anion LiTPSM and LiTPSN were modified (mono-end caped) with
mPEG with different lengths (figure 3.2.). The resulted salts were characterized in pure state
or in polymer electrolytes based on POE and POE derivate (cross-linked POE – NPC). Along
this part comparisons with the aromatic salt (chapter 2) were performed.
Figure 3.2. Three families of aliphatic lithium salts (a) salt 3, n=1, (b) salt 4 n=1 and 3 and (c)
salt 5, n=3.
O
O CF2CF2OCF2CF2SO3Lin
O
O CF2CF2OCF2CF2SO2NSO2CF3
n
Li
O
O CF2CF2OCF2CF2SO3Li
I
n
(a)
(b)
(c)

Chapter III :Aliphatic Lithium Salts based on Sulfonate and Sulfonylimide Oligoether
109
III.2. Publication
Polymer electrolytes based on flexible perfluoroalkanesulfonylimide and sulfonate
lithium salts hosted in linear and crosslinked poly(oxyethylene)
P. Eiamlamai1,2, C. Iojoiu1,2, P. Judeinstein3, L. Astratine1,2 , A. Thiam1,2, J.-Y. Sanchez1,2
1) Univ. Grenoble Alpes, LEPMI, F-38000 Grenoble, France
2) CNRS, LEPMI, F-38000 Grenoble, France, 1130 Rue de la Piscine, 38402,
St. Martin d’Hères, France
3) R.M.N. en Milieu Orienté, Institut de Chimie Moléculaire et des Matériaux d’Orsay
(ICMMO), UMR8182, Bâtiment 410, Université Paris-Sud, 91405 Orsay Cedex, France
Key words: POE; PEO; Lithium salt; lithium battery, Polymer electrolyte; Ionic conductivity;
Transference numbers
Abstract
Perfluoroalkanesulfonimide and perfluoroalkanesulfonate lithium salts endowed with
a flexible ether moiety were synthesized. The performances of their polymer electrolytes were
assessed in linear and cross-linked host polymers. Their conductivities, stabilities, and
transference numbers, make these salts promising for lithium polymer batteries. The Pulse
Gradient NMR study allowed highlighting distinctly different diffusion coefficients according
whether a linear POE or a cross-linked one is used.
1. Introduction
Lithium battery production deals mostly with Li-ion batteries able to operate at sub zero
ambient temperatures. Initially oriented towards the nomad electronic applications, which
require cyclability down to 250 K, Li-ion batteries are also excellent candidates for electric
transportation i.e. EV (Electric Vehicles), HEV (Hybrid Electric Vehicles) and PHEV (Plug-
in Electric Vehicles). All these lithium batteries incorporate a liquid electrolyte made of a
lithium salt dissolved in mixtures of organic aprotic solvents, often cyclic and acyclic

Chapter III :Aliphatic Lithium Salts based on Sulfonate and Sulfonylimide Oligoether
110
carbonates. In order to overcome some safety issues related to the use of flammable solvents
i.e. with low Fp (Flash point) their replacement by ionic liquids was proposed [1] Whatever
the liquid electrolyte selected it requires, for safety purpose, the use of a dense or a
macroporous polymer. The former leads to gelled polymer electrolytes, which were early
reported by Feuillade et al. forty years ago [2], while the later, widely used in commercial
lithium-ion batteries, are made of polyolefins and commercialized under registered marks
such as Celgard®. Another technology, which is oriented towards the use of solvent-free
polymer electrolytes SFPE, was found successful in terms of both performances and safety
[3]. Unsuited for nomad electronic application, SFPE based batteries address the EV and
stationary markets [4], [5]. In SFPE, the host polymer must be a multifunctional polymer
endowed with abilities in (i) salt dissolution/solvation (ii) ion’s mobility via segmental motion
and (iii) in electrodes separation to prevent the battery from short-circuits. P.Wright early
reported [6], [7] about the ionic conductivity, of blends made of poly(oxyethylene) POE and
salts, and pointed out a conductivity increase above the melting point of the crystalline phase.
The deciding contribution of the amorphous phase in the ionic conductivity was later
confirmed by NMR measurements [8]. It must be however pointed out that highly
concentrated solutions of lithium superacid salts can exhibit an appreciable ionic transport in
their crystalline phase [9]. Nonetheless the conductivity maxima remain much lower than
those obtained in amorphous SFPE and, on the other hand, high salt concentrations are
detrimental to the battery operation. Thus, the ideal SFPE host polymer should be amorphous
with glass transition temperatures as low as possible and sufficient thermomechanical
performances to be shaped into thin films. To fulfill these contradictory requirements, 3D-
solvating host polymers are the best compromise. So, from the pioneering works of
Cheradame et al. [10] on polyurethane-ether cross-linked polymer electrolytes, a variety of
networks were reported. Thus, M.Watanabe et al. [11] reported 3D materials obtained by free-
radical polymerization of macromonomers consisting of OE/OP oligomers end-capped by
(meth)acrylate functions. C. Schoeneberger et al. [12] reported the use of POE-grafted
polysaccharides cross-linked by isocyanates. Alloin et al. reported [13] the synthesis, by
anionic ring-opening polymerization, of oxyethylene/allyl-glycidyl-ether random copolymers
and of the resulting cross-linked electrolytes, which provide conductivities exceeding 1
mS/cm at 70°C.
In parallel to the research efforts to tailor new host polymers alternative to the highly
crystalline homopolymer POE, another approach has dealt with the invention of new lithium

Chapter III :Aliphatic Lithium Salts based on Sulfonate and Sulfonylimide Oligoether
111
salts as for instance Lithium bis(oxaloborate) LiBOB [14], or aromatic lithium salts [15].
Bis(trifluoromethanesulfonyl)amide or (trifluoromethanesulfonyl)imideim properly called
Bis(trifluoromethanesulfonyl) imide, (CF3SO2)2NLi abbreviated LiTFSI, which provides a
neat enhancement of ionic conductivity in a variety of host polymers [16]. Among the
advantages of LiTFSI can be mentioned (i) its impact on crystallinity and melting
temperatures of semi-crystalline host polymers that it decreases (ii) its lesser effect on the
glass transition temperature of polymer electrolytes i.e. the so-called plasticization and (iii) its
high thermal, chemical and electrochemical stability. LiTFSI suffers however of two main
drawbacks. One of the drawbacks is, a low cationic transference number when dissociated
into poly(oxyethylene) based host polymers [17]. The second one deals with the corrosion of
the Aluminum current collector that it induces, at high voltage, which prohibited its use in
most of the lithium-ion batteries. This second issue was recently overcame thanks to the use
of suitable acyclic fluorinated carbonates [18]. Following the performances of TFSI anion,
methide salt (CF3SO2)3CLi, was also investigated and provided in POE slightly more
conducting polymer electrolytes but the molar mass of the salt is probably too high [19]. In
order to improve the performances of sulfonamide, (pentafluoroethanesulfonyl)imide
(C2F5SO2)2NLi, called LiBETI [20] but the performances don’t exceed LiTFSI ones.
Dissymetric sulfonylimides were also proposed but if the anion dissymmetry is an asset, the
increase in apolar difluoromethylene groups, CF2, is not an asset [21]. In order to increase the
number of CF2 while avoiding this drawback, and to increase the flexibility of the anion,
perfluoroether was selected. Thus, 2 flexible salts were prepared and investigated i.e. the
lithium 1,1,2,2-tetrafluoro-2-(perfluoroethoxy)ethanesulfonate, LiTPSN, and the
lithium[tetrafluoro-2-(pentafluoroethoxy)ethane]-trifluoromethanesulfonimide, LiTPSM
(Figure 1). The Lewis basicity of the lone pair of the ether function is impoverished by the
perfluoralkylene groups meaning that, even if it should slightly improve the polarity, it should
not participate to the solvation of Li+. It might be feared that the oxygen atom decrease the
electron-withdrawing effect of the perfluoroalkylene ether moiety. Oxygen is however, just
after fluorine, the most electronegative element. Due to the position of the ether function, this
inductive effect cannot be counterbalanced by the resonance electron-donating effect. Thus
pentafluoroethoxy moiety should lead to a strong electron-withdrawing effect, which is
expected to benefit both to the decrease of the anion’s negative charge density and to a high
oxidative stability. This contribution reports on the performances of these salts hosted in both
linear POE and in cross-linked polyether as host polymers.

Chapter III :Aliphatic Lithium Salts based on Sulfonate and Sulfonylimide Oligoether
112
Figure 1. Chemical structures of (a) LiTPSM and (b) LiTPSN
2. Experimental
2.1. Materials and solvents
High molecular weight poly(oxyethylene) (POE) (Mw =300,000 g/mol) from Acros
Organics was dried at 80°C during 48h before to be use in the glove box. Lithium
bis(trifluoro-methanesulfonyl)imide (LiTFSI) and Lithium hydroxide monohydrate were
purchased from Sigma-Aldrich. Acetonitrile for the membrane preparation was distilled
before to be used.
2.2. Salts synthesis
LiTPSN synthesis
LiTPSN synthesis was carried out by the neutralization of perfluoro(2-ethoxyethane) sulfonic
acid in aqueous solution with lithium hydroxide (scheme 1). In a typical procedure, the
Perfluoro(2-ethoxyethane) sulfonic acid (20 mmol, 3.3 ml) was added in an aqueous solution
of lithium hydroxide monohydrate (2M) (60 mmol, 30 ml). The mixture was stirred at room
temperature for 2 h. After water evaporation, the residue was dissolved in dried acetonitrile,
filtered and concentrated under vacuum. The operation was repeated 3 times in order to
remove all LiF. LiTPSN salts were further dried at 80 °C, respectively for 48 h under vacuum
F3C
F2C
O
F2C
CF2
O2S
N
O2S
CF3
Li
F3C
F2C
O
F2C
CF2
SO3 Li
(a)
(b)

Chapter III :Aliphatic Lithium Salts based on Sulfonate and Sulfonylimide Oligoether
113
before storing in a dry glove box. The LiTPSN, a white solid, was obtained with a net yield of
83%. The purity of LiTPSN was verified by 19F-NMR spectroscopy and elemental analysis.
LiTPSN (C4F9LiO4S): 19F NMR (CD3)2SO2): -83.30 (t, J= 16 Hz., 2F), -87.91 (s, 3F), -89.39
(t, J= 16Hz., 2F), -119.33 (s, 2F)
Anal. Calcd. C, 14.92; F, 53.10; Li, 2.16; S, 9.96; Found: C, 15.08; F, 52.92; Li, 2.15; S, 9.74
Scheme 1. Lithium 1,1,2,2-tetrafluoro-2-(perfluoroethoxy)ethanesulfonate salt (LiTPSN)
preparation.
LiTPSM salt synthesis
The LiTPSM salt was purchased by ERAS-labo.
The synthesis of LiTPSM was carried out in 3 steps (scheme 2).
LiTPSM synthesis was carried out by three steps as presented in Scheme 2. To a solution of
anhydrous 1,2-dichloroethane and perfluoro(2-ethoxyethane) sulfonyl fluorides (13 mmol,
4.14 g) under inert atmosphere, was added freshly distilled benzylamine (65 mmol, 7.1 ml).
The mixtrure was stirred at 50 °C during 20 h and was followed by thin layer chromatography
(TLC) and 19F NMR until sulfonyl fluoride completely disappeared. At room temperature, an
aqueous HCl solution (10%) was added, and the mixture was extracted with dichloromethane.
The organic phases were dried over MgSO4, filtered and evaporated. The residue was purified
by column chromatography on silica gel with gradient eluent (Pentane/AcOEt 1/0 to 4/1) to
obtain a benzyl sulfonamide (13 mmol, 5.27 g). The second step, a solution of
dichloromethane and benzyl sulfonamide, under inert atmosphere, was added DIEA (13
mmol, 2.3 ml) Then triflic anhydride (19.5 mmol, 3.3 ml) was added at 0°C, the mixture was
stirred for 30 min at constant temperature then 1 h at room temperature (followed by TLC and
19F NMR). Then the products were evaporated, and the residue was dissolved in hot pentane
and the supernatant was isolated. The solvent was evaporated and the benzyl
F3C
F2C
O
F2C
CF2
SO3H + LiOHF3C
F2C
O
F2C
CF2
SO3 + H2OLi

Chapter III :Aliphatic Lithium Salts based on Sulfonate and Sulfonylimide Oligoether
114
trifluoromethanesulfonamide was obtained. The third step, a suspension of benzyl
trifluoromethanesulfonamide (12.8 mmol, 6.88 g) in ethanol (60 ml) was stirred during 8 h at
room temperature until the solution was completely soluble. An aqueous solution of lithium
hydroxide monohydrate (12.87 mmol, 540 mg) was added and the mixture was stirred at room
temperature overnight. After the solvent removal, the white residue was dissolved in diethyl
ether, filtered and concentrated under vacuum. The residue was washed with cyclohexane,
filtered and concentrated under vacuum to afford 4.5 g of LiTPSM salt as solid. LiTPSM salts
was storing in a dry glove box.
F3C
F2C
O
F2C
CF2
O2S
F
CH2NH2
+
1) DCE, 50 °C
2) HClF3C
F2C
O
F2C
CF2
O2S
NHCH2
DIEA, DCM-10 °C to RT
F3C
O2S
O
O2S
CF3
F3C
F2C
O
F2C
CF2
O2S
N
SO2CF3
EtOH, LiOHF3C
F2C
O
F2C
CF2
O2S
N
SO2CF3
Li
Perfluoro(2-éthoxyéthane)sulfonyl fluoride
Benzyl sulfonamide
LiTPSM
Scheme 2. Synthesis of lithium[tetrafluoro-2-(pentafluoroethoxy)ethane]-
trifluoromethanesulfonimide salt (LiTPSM).
19F NMR (CD3)2SO2): -79.08 (s, 3F), -81.52(t, J= 18 Hz, 2F), -86.34(s, 3F), -88.25(t, J=18
Hz, 2F), -117.29(s, 2F);
Anal. Calcd. C, 13.25; F, 50.21; Li, 1.53; N, 3.09; S, 14.15; Found: C, 13.29; F, 47.48; Li,
1.52; N, 3.16; S, 13.03
2.3. Linear polycondensat (LPC1000) preparation
Linear unsaturated polycondensates prepared by following the procedure of F. Alloin
et al. [22], as shown in scheme 3.
Benzyl trifluoromethanesulfonamide
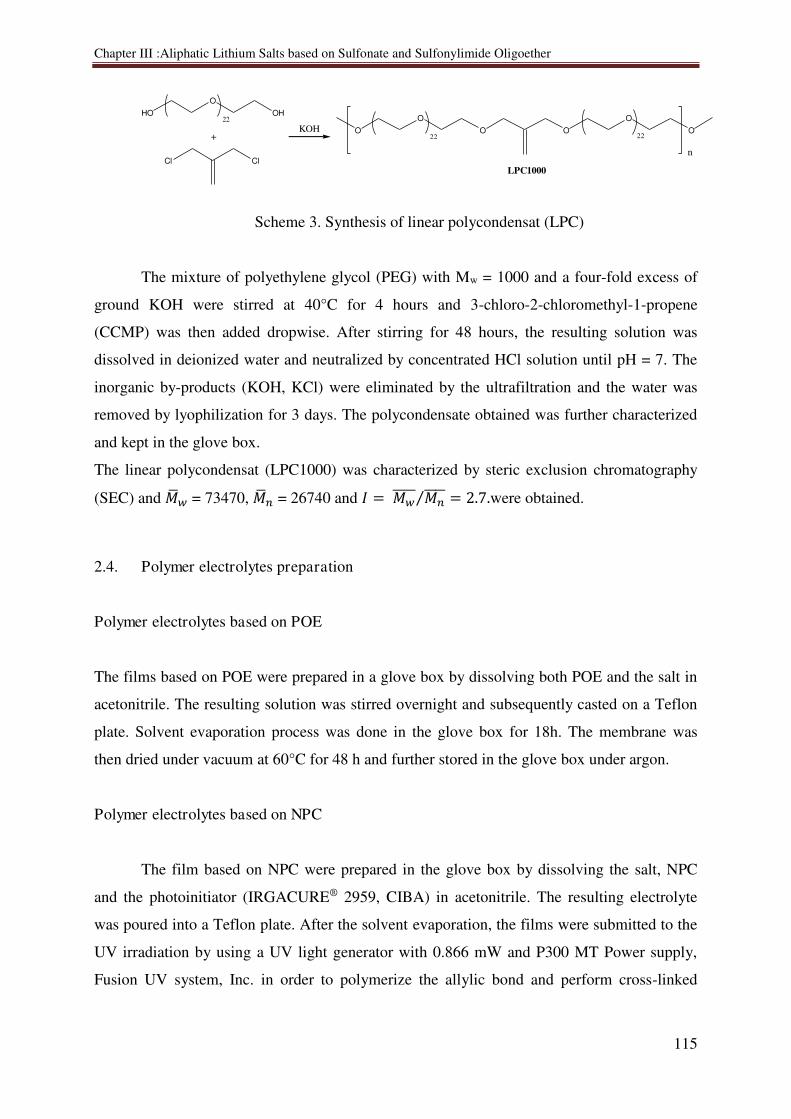
Chapter III :Aliphatic Lithium Salts based on Sulfonate and Sulfonylimide Oligoether
115
Cl Cl
HO
O
OH22
+KOH O
O
O22
O
O
O22
LPC1000
n
Scheme 3. Synthesis of linear polycondensat (LPC)
The mixture of polyethylene glycol (PEG) with Mw = 1000 and a four-fold excess of
ground KOH were stirred at 40°C for 4 hours and 3-chloro-2-chloromethyl-1-propene
(CCMP) was then added dropwise. After stirring for 48 hours, the resulting solution was
dissolved in deionized water and neutralized by concentrated HCl solution until pH = 7. The
inorganic by-products (KOH, KCl) were eliminated by the ultrafiltration and the water was
removed by lyophilization for 3 days. The polycondensate obtained was further characterized
and kept in the glove box.
The linear polycondensat (LPC1000) was characterized by steric exclusion chromatography
(SEC) and 栂 = 73470, 津 = 26740 and = 栂 津 ⁄ = に.ば.were obtained.
2.4. Polymer electrolytes preparation
Polymer electrolytes based on POE
The films based on POE were prepared in a glove box by dissolving both POE and the salt in
acetonitrile. The resulting solution was stirred overnight and subsequently casted on a Teflon
plate. Solvent evaporation process was done in the glove box for 18h. The membrane was
then dried under vacuum at 60°C for 48 h and further stored in the glove box under argon.
Polymer electrolytes based on NPC
The film based on NPC were prepared in the glove box by dissolving the salt, NPC
and the photoinitiator (IRGACURE® 2959, CIBA) in acetonitrile. The resulting electrolyte
was poured into a Teflon plate. After the solvent evaporation, the films were submitted to the
UV irradiation by using a UV light generator with 0.866 mW and P300 MT Power supply,
Fusion UV system, Inc. in order to polymerize the allylic bond and perform cross-linked

Chapter III :Aliphatic Lithium Salts based on Sulfonate and Sulfonylimide Oligoether
116
network. The films were irradiated 30s. The resulted NPC membranes were then dried under
vacuum at 60 °C for 72 h and carefully stored in the glove box.
The lithium salt concentration in the both films (based POE on NPC) is indicated by
the number n = O/Li, which actually corresponds to the oxyethylene/lithium molar ratio. [15]
2.5. NMR measurement
19F NMR (282 MHz) spectra were run on a Bruker Advance 400 spectrometer, and
obtained using DMSO-d6. Chemical shifts (δ) are given in ppm vs. CFCl3 (19F), used as
internal references. Coupling constants J are reported in hertz (Hz). Multiplicities are reported
as follows: s = singlet, t = triplets.
2.6. Thermal analysis
Glass transition temperatures, Tg, and melting temperatures, Tm, were measured in
nitrogen flow using a DSC 1- Mettler -Toledo. In a typical procedure, the samples maintained
in glove box for at least one month were submitted to two heating cycles. In the first samples
were cooled down to -100°C and heated at 5°C/min up to 100°C, and Tg1, Tm1 and H1 were
measured. Then the samples were cold down with 50°C/min at -100°C and Tg2, Tm2 and H2
were measured during the second heating from -100°C to 100°C. The Tg were taken as the
inflection point of specific heat increment at the glass-rubber transition while Tm was taken in
the top of peak of the melting peak. Around 10 mg of sample were placed in a DSC
aluminium crucible in glove box.
Thermogravimetric measurements were carried out with a TGA/SDTA Mettler-Toledo
STARe software version 12.10 thermal analyzer. A few milligrams of the sample were heated
from room temperature up to 500 °C at 5°C/min under nitrogen flow.
2.7. Dynamic mechanical analysis
The thermo-mechanical properties of the different membranes were determined using
a TA Instruments DMA2980. The setup measured the complex tensile modulus E*, i.e. the
storage component E’ and the loss component E”, as well as the ratio of the two component,
i.e. tan (=E’/E”). Measurements were performed in isochronal conditions at the frequency of
1 Hz. Strain magnitude was fixed at 0.01% of the sample length and 150% force track. The
temperature was varied in the temperature range of -100 °C - 100 °C at a heating rate of 3 °C /
min.

Chapter III :Aliphatic Lithium Salts based on Sulfonate and Sulfonylimide Oligoether
117
2.8. Conductivity measurements
Conductivities were measured by electrochemical impedance spectroscopy using an
HP 4192A Impedance Analyzer in the low frequency range 5 Hz – 13 MHz. The membrane
was placed between two stainless steel electrodes in a Swagelok cell with Teflon o-rings and
spacers. Measurements were done on successive increase and decrease of temperature in the
range 20 °C - 70 °C (from 20 °C – 110 °C for NPC/salt complex). The temperature was
equilibrated for 1 hour before each measurement.
2.9. Transference number
The transference number was estimated from two methods; an electrochemical
impedance spectroscopy technique (EIS) and Pulsed Field Gradient NMR (PFG-NMR)
technique.
The electrochemical measurements are based on the method developed by Sorensen and
Jacobsen [23]. According to the method by Sorensen and Jacobsen, the lithium transport
number can be extracted from a single impedance experiment. In this work symmetrical
lithium test cells: Lithium/ solid polymer electrolyte/ Lithium were used for electrochemical
experiments. The acquired electrochemical impedance spectrum comprises the electrolyte
resistance (Re) and the two electrode/electrolyte interfaces. In general, in the high frequency
region are detected the processes related to ion transport within the bulk electrolyte and it can
be easily observed that this component changes substantially. At low frequencies, the Nyquist
plot for impedance of the symmetric plane cell Lithium/electrolyte/Lithium containing two
ionic mobile species is characteristic of lithium ions transport limitation by diffusion through
electrolyte. This solid state lithium ion diffusion is known as Warburg diffusion [24]. The
cells were carefully prepared in an argon glove box in order to avoid degradations of lithium
metal foil and the presence of humidity in the electrolyte. Both electrodes (anode and cathode)
are made of thin lithium foils which have a thickness of approximately 65 µm, while a
polypropylene layer was used as insulator. Also the polymer electrolyte thickness (l),
important, must be known before and after the impedance measurements. The cell elaboration
(the lamination process) and further impedance measurements modify the membrane
thickness. For this reason, the membrane thickness after impedance represents the ‘real’
thickness which is used for calculation of diffusion coefficient. The value of diffusion
coefficient can be easily detected while using the characteristic (solid state) diffusion time τ
[25].

Chapter III :Aliphatic Lithium Salts based on Sulfonate and Sulfonylimide Oligoether
118
τ = l2/ D
where l is the inter-electrode distance (polymer electrolyte thickness) and D is the ambipolar
diffusion coefficient [26].
In the case of symmetrical electrochemical cells, Li/electrolyte/ Li, the lithium metal
electrodes are considered as blocking electrodes for the anion and non-blocking for the
lithium cation. For this reason, the diffusion impedance (Warburg diffusion, Wd) is given by:
Wd = Re µ2/µ1
Where µ1 is the lithium cation mobility, µ2 is the anion mobility and Re is the electrolyte
resistance. This leads to the final equation for transference number, T+:
T+= Re/ (Re+Wd) (14)
Prior to impedance measurement a potential of 40 mV is applied.
The Pulsed Field Gredient-NMR is another technique used for determining the
diffusion coefficient. The magnitude of the pulsed field gradient was varied between 0 and 55
G cm−1 (sinus shaped pulsed gradient); the diffusion time Δ between two pulses was fixed at
500 ms and the gradient pulse duration δ was set between 3 and 22 ms depending on the
diffusion coefficient of mobile species. This allowed us to observe the attenuation of spin
echo amplitude over a range of at least 2 decades leading to a good accuracy (5%) of the
self-diffusion coefficient values. They were determined from the classic relationship ln(I/I0) =
2Dg22 (Δ - /3) where g is the magnitude of the two gradient pulses, is the gyromagnetic
ratio of the nucleus under study and I and I0 are respectively the area of the signal obtained
with or without gradient pulses. The measurement was carried out at high temperatures of 110
°C. The cation transference number is obtained from this relationship (1):
+ = 帖+帖++ 帖− (1)
where D+ is the self diffusison coefficient of the cation and D- the self-diffusion coefficient of
the anion. All measurements were done at high temperature i.e. 110 °C, as the high
temperature generates fast ion movement and in order to match with PFG-NMR data.

Chapter III :Aliphatic Lithium Salts based on Sulfonate and Sulfonylimide Oligoether
119
3. Results and discussion
3.1. Thermal characterizations
3.1.1. Calorimetric measurements
DSC analyzes are essential as they allow assessing the ability of new salts to decrease
the crystallinity of POE and favor the segmental mobility.
a) POE electrolytes
Table 1
Glass transition temperature (Tg) and melting temperature (Tm) of POE/LiTPSM and
POE/LiTPSN complexes (1= the first cycle, 2= the second cycle after cooling with 50
°C/min)
Samples O/Li
Tg1
(°C)
Tm1
(°C)
H1POE
(J/g)
Tg2
(°C)
Tm2
(°C)
HPOE2
(J/g)
LiTPSMa - - 193 -
LiTPSNb - 123 157 -
PEO - 70 126 -62 58 105
POE/LiTFSI 12 -32 47 111 -42 41 6
20 -32 58 107 -51 50 68
30 - 66 173 -55 53 84
POE/LiTPSM 16 -38 63 53 -54 35 10
20 -38 66 61 -53 51 64
30 -38 61 69 -52 54 78
POE/LiTPSN 12 - 66 92 -43 59 90
20 - 68 135 -51 56 100
30 - 66 155 -55 63 112
HPOE : fusion enthalpy calculated by mass of POE host polymer
As usual, the crystallinity contents and the Tg values obtained using highly crystalline
polymer electrolytes are poorly reproducible and strongly depends on the experimental
conditions (Table 1). Indeed, the Tg that should reflect, at the amorphous state, the ionic
mobility of a solvent-free polymer electrolyte through the chain’s segmental motion is

Chapter III :Aliphatic Lithium Salts based on Sulfonate and Sulfonylimide Oligoether
120
subjected to the effect of the crystalline phase that constrains the amorphous one. DSC data of
POE/LiTPSM and POE/LiTPSN electrolytes are reported in Table 1 and compared with those
of POE matrix and of POE/LiTFSI, O/Li=20 and O/Li=30. It can be observed that despite the
flexibility induced by the ether function, LiTPSN induces neither a significant decrease in
crystallinity content nor a decrease in melting temperatures. Contrarily, LiTPSM has a more
important effect both on crystallinity and Tg. Indeed, as increasing the salt concentration
decreases the crystallinity it also decreases the constraining suffered by the amorphous phase.
This leads to the surprising effect that the most concentrated sample (O/Li=16) exhibits the
lowest Tg (Tg2), while the contrary effect was observed on the LiTFSI and LiTPSN due to the
interaction of POE with Li+.
b) NPC electrolytes
Table 2
Glass transition temperature (Tg) and melting temperature (Tm) of NPC/LiTPSM and
NPC/LiTPSN complexes
O/Li
Tg1
(°C)
Tm1
(°C)
H1NPC
(J/g)
Tg 2
(°C)
Tm2
(°C)
H2NPC
(J/g)
NPC ∞ -52 44 58 -64 38 38
NPC/LiTFSI 12 -45 - - -53 - -
20 -49 22 22 -53 21 5
30 -44 40 34 -58 33 31
NPC/LiTPSM 12 -46 - - -66 - -
20 -46 36 13 -59 29 12
30 -45 39 34 -58 30 30
NPC/LiTPSN 12 -42 37 19 -54 29 16
20 -38 40 26 -55 33 23
30 -39 37 42 -58 34 55
In NPC, melting temperature and crystallinity are strongly decreased with regard to the
homopolymer POE and, therefore, the DSC data are much more reproducible and credible.

Chapter III :Aliphatic Lithium Salts based on Sulfonate and Sulfonylimide Oligoether
121
However the same restrictions about the impact of the crystalline phase on the Tgs can be
made. Thanks to the low crystallinity and Tm of NPC, the salt LiTPSN can lead to amorphous
polymer electrolytes from 29 to 34°C, according to the salt concentration. LiTPSM, once
again, has more effect on both parameters and provide crystallinity and Tm at least equal to
those obtained with LiTFSI. A first heating up to 60°C followed by a rapid quenching and a
second heating allowed decreasing or suppressing the crystallization and therefore accessing
to Tg more representative of the polymer segmental mobility, above Tm. Thus Tg ranging from
– 58 to – 66°C were obtained with LiTPSM. As compared to LiTFSI, LiTPSM leads to
slightly lower Tg in particular at high salt concentration. It was reported [27] from
conformational ab initio calculations that the energy barrier in the rotation around the SNS
bonds of LiTFSI, close to 10 JK/mole, is very low allowing an easy rotation of the TFSI-
anion. Even if the same calculation were not performed on LiTPSM it can be assumed for the
related anion an energy barrier close to TFSI-. The higher plasticizing effect of LiTPSM could
be ascribed partly to the dissymmetry around the sulfonamide moiety but above all to the
additional flexibility around the perfluoroether function.
3.1.2. Thermal stability
Thermal degradation temperatures were determined in nitrogen, the figure 2 (a, b and
c) represents the TGA thermograms of (a) salts, (b) salts and POE films, (c) salts and NPC
films respectively.
For the salts, the onset of weight loss starts at 340°C for both flexible salts as shown
by Figure 2a , a value close to that of LiTFSI (340°C) but lower than that of CF3SO3Li (425
°C) under a nitrogen atmosphere [28].

Chapter III :Aliphatic Lithium Salts based on Sulfonate and Sulfonylimide Oligoether
122
Figure 2. Thermogravimetric analysis of (a) LiTPSM and LiTPSN salts; (b) salt, POE
and POE electolytes (O/Li =30) (c) salt, NPC and NPC electrolytes at O/Li= 30.
The onsets of weight loss are very close for LiTPSM and LiTPSN but the weight loss is faster
in the case of the former. It might therefore be assumed that degradation occurs around the
sulfonamide group. As for the slight decrease in thermal stability of LiTPSM vs LiTFSI and
LiTFSN vs lithium triflate they might be ascribed to the perfluoroether function. It must be
however emphasized that both flexible salts are much more stable than LiPF6 and could
enhance the safety of liquid electrolytes.
Concerning the stability of films based POE, figure 2b, 2c gathers the TGA records of
POE and NPC electrolytes as compared to POE, NPC and salts. The onsets of the weight loss
for electrolytes start at temperatures close to POE, NPC respectively. It must be recalled that
these weight losses (i) are observed in inert gas and (ii) exceed distinctly the operating
50 100 150 200 250 300 350 400 450 500
-100
-90
-80
-70
-60
-50
-40
-30
-20
-10
0
10W
eig
ht
Loss (
%)
Temperature (°C)
LiTPSM
LiTPSN
100 200 300 400 500
-100
-80
-60
-40
-20
0
Weig
ht
loss (
%)
Temperature (°C)
POE without salt
LiTPSM
LiTPSN
POE+LiTPSM
POE+LiTPSN
100 200 300 400 500
-100
-80
-60
-40
-20
0
We
ight
loss (
%)
Temperature (°C)
NPC without salt
LiTPSM
LiTPSN
NPC+ LiTPSM
NPC+ LiTPSN
(a) (b)
(c)

Chapter III :Aliphatic Lithium Salts based on Sulfonate and Sulfonylimide Oligoether
123
temperature of lithium polymer batteries and even, in case of short-circuits the melting
temperature of lithium metal.
3.2. Thermo-mechanical characterizations
The knowledge of the thermo-mechanical behavior of a polymer electrolyte in the
operating temperature range of a battery is essential. Polymer electrolytes endowed with high
mechanical strength can indeed benefit to battery performances in slimming the electrolyte
film, thus in decreasing the ohmic drop while improving the safety. This is an indisputable
asset provided the reinforcements do not result in a significant conductivity decrease.
3.2.1. POE electrolytes
The Figure 3 compares, at 1 Hz, the thermal evolution of the storage modulus of POE
and its electrolytes at the concentration O/Li =20. Such evolutions are expected for linear
semi-crystalline polymers with a glassy plateau interrupted by a transition and followed by
a second plateau slightly decreasing with temperature, which is related to the reinforcement
induced by the crystalline phase. Regarding the mechanical strength of the films, the whole of
the DMA curves shows that E’ drops sharply around 60°C i.e. above the melting temperature
of the samples. Thus, POE and its polymer electrolytes lose their solid aspect to become
viscous gels above Tm i.e. in the operating range of the batteries. As LiTPSM and LiTFSI
impact more on the crystalline phase than LiTPSN, the E’ drop at T of their electrolytes is
much more pronounced as well as the slope d(E’)/dT along the crystallinity-induced plateau.
Due to the salt-matrix interactions T increases, with regard to the host polymer, following the
salt dissolution, as evidenced by the maxima of tang δ. Although T are supposed to roughly
represent the Tg of polymers, T values exceeding significantly, by 12 (LiPSN) to ~25°C
(LiTPSM, LiTFSI, POE) the Tg (DSC), were determined. This discrepancy must be ascribed
(i) to the different type of characterization and (ii) to the thermal history of the samples. Thus,
in order to avoid or to limit the constraining of the amorphous phase by the crystalline that
artificially increases Tg, DSC analyses were performed with a first heating of the samples up
to their total fusion followed by a cooling at 50°/mn; the Tg being measured in a second scan.
This is not a quenching as the cooling is not fast enough to prevent the crystallization of the
melted sample but the crystalline phase content is decreased. The amorphous phase is
therefore less constrained in the second measurement than in the pristine sample leading to
lower Tg, which reflect more the segmental motion ability of the polymer. As for the DMA

Chapter III :Aliphatic Lithium Salts based on Sulfonate and Sulfonylimide Oligoether
124
measurements, a 1st heating scan would obviously modify the mechanical properties of the
polymer and therefore were performed on the pristine sample.
Figure 3. Storage tensile modulus (E’) and loss angle tangent tan vs temperature at 1 Hz for
POE, POE/LiTPSM, POE/LiTPSN and POE/LiTFSI electrolytes at O/Li=30.
3.2.2. NPC electrolytes
Figure 4 gathers the DMA curves of NPC and its electrolytes benchmarked with
NPC/LiTFSI ones. Due to the tridimensional nature of NPC, the DMA curves differ in their
shape and in their characteristic temperatures from those based on linear POE. The whole of
the records show a much narrower crystallinity-induced plateau and the maintaining, through
a rubbery plateau, of storage modulus much higher than those obtained with linear POE. The
maxima of tan δ curves allow accessing to accurate determination of T. The latter are
significantly higher than the Tg obtained by DSC, from 20 to more than 30°C with regard to
their DSC determination during the 1st or the 2nd heating scan. A slightly higher T is
obtained for NPC/LiTPSN electrolytes as compared to NPC/LiTPSM ~LiTFSI ones. The E’
drop at T is much more pronounced for LiTPSM and might be ascribed to a higher disorder
induced by the dissymmetric and flexible anion. E’ values, on the rubbery flat plateau, range
between 1 and 3 MPa, up to at least 100°C.
-100 -80 -60 -40 -20 0 20 40 60 80 10010
0
101
102
103
104
Sto
rage M
odulu
s (
MP
a)
Temperature (°C)
POE
POE/LiTFSI, O/Li=30
POE/LiTPSM, O/Li=30
POE/LiTPSN, O/Li=30
0.0
0.2
0.4
0.6
0.8
Tan D
elta (
°)T
an

Chapter III :Aliphatic Lithium Salts based on Sulfonate and Sulfonylimide Oligoether
125
Figure 4. (a) Storage tensile modulus (E’) and loss angle tangent tan vs. temperature at 1 Hz
for NPC, NPC/LiTPSM, NPC/LiTPSN and NPC/LiTFSI complexes, (b) their Tan .
3.3. Conductivity measurements
The comparison of the ionic behavior of LiTFSI, LiTPSM and LiTPSN was performed in
linear POE and in the cross-linked host polymer NPC.
3.3.1. Conductivities of POE electrolytes
Figure 5 shows the conductivities vs reciprocal temperature obtained with POE electrolytes.
The ionic conductivities of analyzed samples were measured between 20°C and 70°C
downwards. This allows improving electrode/electrolyte surface area contact but leads to
overestimated values in semi-crystalline host polymer as linear POE. Indeed at 70°C the
samples become amorphous and some salts, delaying the polymer crystallization, provide
conductivities higher than those obtained with the same sample at its equilibrium state. The
-100 -50 0 50 100
0.1
1
10
100
1000
Sto
rag
e M
od
ulu
s (
MP
a)
Temperature (°C)
NPC without salt
NPC/LiTFSI
NPC/LiTPSM
NPC/LiTPSN
-100 -80 -60 -40 -20 0 20
0.0
0.2
0.4
0.6
0.8
Tan
Temperature (°C)
NPC without salt
NPC/LiTFSI
NPC/LiTPSM
NPC/LiTPSN
(a)
(b)
Tan

Chapter III :Aliphatic Lithium Salts based on Sulfonate and Sulfonylimide Oligoether
126
highest conductivities, 5× 10⁻⁴ S/cm at 70°C and 2.6 × 10⁻⁶ S/cm at 20°C, were obtained with
POE/LiTPSM at O/Li= 16. This must be related to a decrease in crystallinity corroborated by
the lower fusion enthalpy and Tm values. Additionally, the thermal conductivity evolution of
LiTPSM and LiTPSN electrolytesis obviously different owing to the plasticizing effect and to
a greater negative charge delocalization on sulfonimide anion [29] as compared to sulfonated
anion leading to higher conductivities. At the same concentration (O/Li=20), POE/LiTPSM
exhibited higher conductivities than those obtained for POE/LiTPSN but still lower than those
obtained for POE/LiTFSI. If conductivity comparisons in linear POE are unavoidable, owing
to its commercial availability and to the tremendous amount of papers, the conductivity
accuracy and the reproducibility strongly depend (i) on the thermal history of the sample
(stabilization time at each temperature, rate of cooling) and (ii) on the geometric factor with a
possible creeping of the sample at high temperatures.
Figure 5. Comparison of conductivity as a function of salt concentration in
POE/LiTPSM complexes: ( ) O/Li = 16, ( ) O/Li= 20, ( ) O/Li= 30 and in POE/LiTPSN
complexes: (+) O/Li=12, ( ) O/Li= 20, ( ) O/Li=30 as compared with POE/LiTFSI complex
( ) O/Li=20.
3.3.2. Conductivities of NPC electrolytes
Contrary to POE, NPC host polymer allows the investigation of polymer electrolytes
to be performed in a wide temperature range. Thus, the low crystallinity and melting points
allow measuring the conductivities, in the amorphous state, down to ambient temperatures
2.9 3.0 3.1 3.2 3.3 3.4 3.5
1E-8
1E-7
1E-6
1E-5
1E-4
1E-3
0.01
Co
nd
uct
ivit
y (S
/cm
)
1000/T (K-1)

Chapter III :Aliphatic Lithium Salts based on Sulfonate and Sulfonylimide Oligoether
127
while the cross-linking allows measuring accurate conductivities at high temperatures without
fearing a possible creeping. In Figure 6 are compared the Arrhenius plots of LiTPSM,
LiTPSN and LiTFSI NPC electrolytes. It must be emphasized that the physical appearance of
the films i.e. dimensional shape and thickness was found unaffected by their heating up to
110°C. The best conductivities reached at 20 °C, 1.6×10⁻⁵ S/cm and at 110 °C, 7.2×10⁻⁴ S/cm
were obtained for the composition O/Li=20 of NPC/LiTPSM electrolyte. However the data
obtained at O/Li =12 are very close to the previous one, while those obtained at O/Li =30 are
fairly disappointing. From the benchmarking done with NPC/LiTFSI it can be inferred that
LiTPSM and LiTFSI behave similarly, with slight advantages at high temperatures for LiTFSI
and at lower temperatures for LiTPSM. NPC/LiTPSN films exhibited the highest
conductivities, 3.9×10⁻⁶ S/cm at 20°C and 3.4×10⁻⁴ S/cm at 110°C, for the composition
O/Li=12. At 20°C the conductivity data reveal, for the compositions O/Li = 20 and 30, a
partial crystallization of the LiTPSN samples. As the glass transition temperatures of
NPC/LiTPSN are in the same range than those of the sulfonamide electrolytes, the
conductivity gap might be related to the higher delocalization of the negative charge in both
TPSM and TFSI anions. As expected, the use of NPC host polymer instead of linear POE
allows more accurate and exploitable conductivities to be obtained.
Figure 6. Temperature dependence of the ionic conductivity of NPC electrolytes based on
different salts; NPC/LiTPSM electrolytes ( ) O/Li=12, ( ) O/Li=20, ( ) O/Li=30,
NPC/LiTPSN electrolytes ( ) O/Li=12, ( ) O/Li =20, ( ) O/Li= 30 compared with
NPC/LiTFSI electrolyte (×) O/Li=12.
2,6 2,8 3,0 3,2 3,4
1E-6
1E-5
1E-4
1E-3
0,01
Co
nd
uctivity (
S/c
m)
1000/T (K-1)
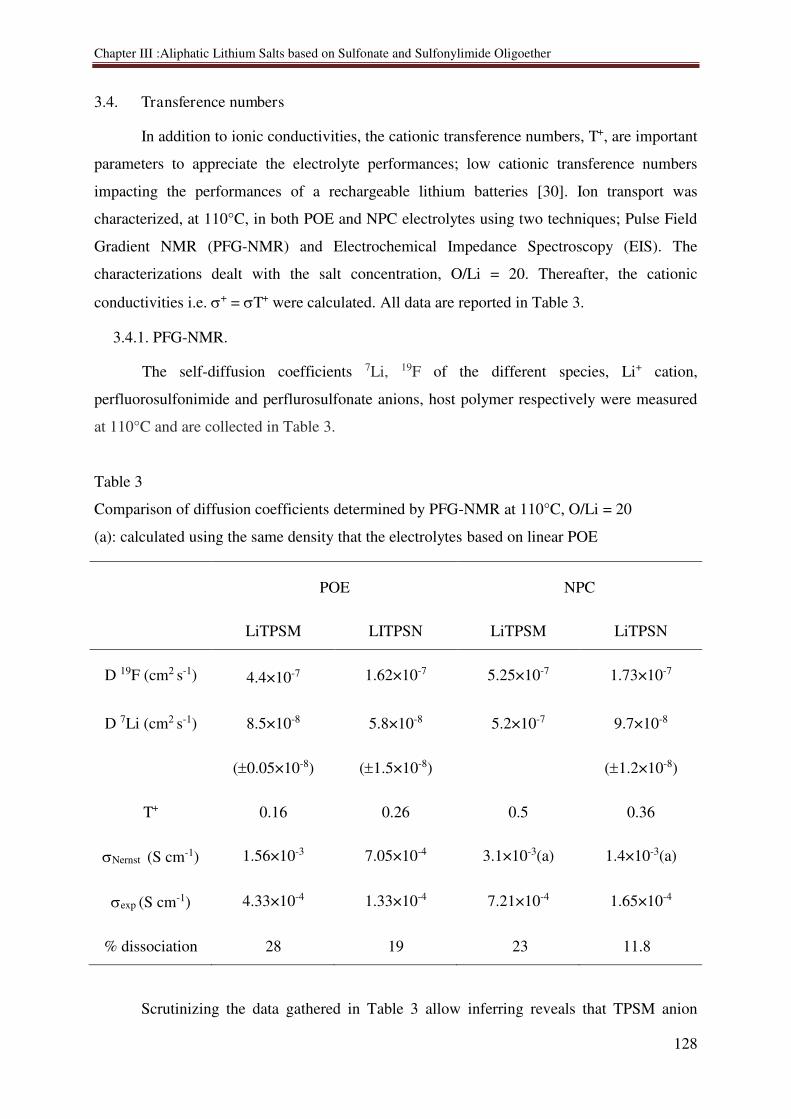
Chapter III :Aliphatic Lithium Salts based on Sulfonate and Sulfonylimide Oligoether
128
3.4. Transference numbers
In addition to ionic conductivities, the cationic transference numbers, T+, are important
parameters to appreciate the electrolyte performances; low cationic transference numbers
impacting the performances of a rechargeable lithium batteries [30]. Ion transport was
characterized, at 110°C, in both POE and NPC electrolytes using two techniques; Pulse Field
Gradient NMR (PFG-NMR) and Electrochemical Impedance Spectroscopy (EIS). The
characterizations dealt with the salt concentration, O/Li = 20. Thereafter, the cationic
conductivities i.e. + = T+ were calculated. All data are reported in Table 3.
3.4.1. PFG-NMR.
The self-diffusion coefficients 7Li, 19F of the different species, Li+ cation,
perfluorosulfonimide and perflurosulfonate anions, host polymer respectively were measured
at 110°C and are collected in Table 3.
Table 3
Comparison of diffusion coefficients determined by PFG-NMR at 110°C, O/Li = 20
(a): calculated using the same density that the electrolytes based on linear POE
POE NPC
LiTPSM LITPSN LiTPSM LiTPSN
D 19F (cm2 s-1) 4.4×10⁻⁷ 1.62×10⁻⁷ 5.25×10⁻⁷ 1.73×10⁻⁷
D 7Li (cm2 s-1) 8.5×10⁻⁸ 5.8×10⁻⁸ 5.2×10⁻⁷ 9.7×10⁻⁸
(0.05×10⁻⁸) (1.5×10⁻⁸) (1.2×10⁻⁸)
T+ 0.16 0.26 0.5 0.36
Nernst (S cm-1) 1.56×10⁻³ 7.05×10⁻⁴ 3.1×10⁻³(a) 1.4×10⁻³(a)
exp (S cm-1) 4.33×10⁻⁴ 1.33×10⁻⁴ 7.21×10⁻⁴ 1.65×10⁻⁴
% dissociation 28 19 23 11.8
Scrutinizing the data gathered in Table 3 allow inferring reveals that TPSM anion

Chapter III :Aliphatic Lithium Salts based on Sulfonate and Sulfonylimide Oligoether
129
despite its higher molar weight exhibits higher mobility than its sulfonated analog TPSN. The
diffusion coefficient of TPSN anion in NPC is slightly increased (~8%) with regard to POE
matrix, the same tendency being observed for TPSM (~12%). This means that despite the
tridimensional nature of NPC, its segmental mobility is slightly higher than that of linear
POE. Regarding Li+ diffusion coefficients in POE, the cation diffusion is slower, from
roughly 30%, in LiTPSN/POE than in LiTPSM/POE. As Li+ is a hard acid and the polyethers
as POE and NPC are hard bases the HSAB theory predicts a very strong Li+-polyether
interaction which can be counterbalanced by the anion-cation interaction.
The cationic transference numbers T+ are lower than 0.5 for both salts when the salts
are hosted in POE. Moving from POE to NPC host polymers results for both salts in a T+
increase, moderate for LiTPSN (38 %) high for LiTPSM (~300 %).
For free ions and solvent-separated ion pairs, the Nernst–Einstein equation may be
used to calculate ionic conductivity, Nernst, from the diffusion coefficients of the cation and
anion eq. (2) 朝追津鎚痛 = 繋2系 岫経+ + 経−岻迎
(2)
And also, the degree of dissociation can be calculated from the equation (3).
% 穴嫌嫌剣潔建剣券 = 掴椎朝追津鎚痛 × などど
(3)
From the values of Nerst and exp presented in Table 3, the estimated dissociation
degree is ≤ 0.5, with an advantage for LiTPSM. The degrees of dissociation are lower in NPC
than in POE. This result seems questionable as NPC and POE have a very similar chemical
nature as (i) the average number of oxyethylene repeat units between 2 cross-links exceeds 22
and (ii) as the conductivities obtained by impedance spectroscopy are very close.
3.4.2. T+ comparison from EIS and PFG-NMR
The results from EIS and NMR are collected in Table 4.

Chapter III :Aliphatic Lithium Salts based on Sulfonate and Sulfonylimide Oligoether
130
Table 4 Transference number (T+), conductivity () and cationic conductivity (T+) for
LiTPSM, LiTPSN, LiTFSI in POE and NPC matrix with two different investigating methods
at 110°C
Complex O/Li
(S/cm)
PFG-NMR EIS
T+ +
(S/cm)
T+ +
(S/cm)
POE/LiTFSI 30 1.34×10⁻³ 0.28 3.75×10⁻⁴ 0.14 1.88×10⁻⁴
POE/LiTPSM 20 4.33×10⁻⁴ 0.16 6.93×10⁻⁵ 0.19 8.22×10⁻⁵
30 3.17×10⁻⁴ 0.20 6.34×10⁻⁵ 0.19 6.02×10⁻⁵
POE/LiTPSN 20 1.33×10⁻⁴ 0.26 3.45×10⁻⁵ 0.50 6.65×10⁻⁵
30 1.94×10⁻⁴ 0.36 6.98×10⁻⁵ 0.46 8.92×10⁻⁵
NPC/LiTFSI 20 4.52×10⁻⁴ 0.29 1.33×10⁻⁴ 0.16 7.23×10⁻⁵
NPC/LiTPSM 20 7.21×10⁻⁴ 0.50 3.59×10⁻⁴ 0.17 1.22×10⁻⁴
NPC/LiTPSN 20 1.65×10⁻⁴ 0.36 5.94×10⁻⁵ 0.40 6.60×10⁻⁵
From EIS measurements, T+ values ranging between 0.14 and 0.5 were obtained
according to the salt used. In some cases as NPC/LiTFSN there is a very good agreement
between the values obtained by impedance and those calculated from the diffusion
coefficients. Once again, T+ are higher with LiTPSN based electrolytes than with LiTPSM.
The gap between the T+ calculated from PFG-NMR and those obtained from EIS is related to
the type of analysis. Thus, PFGNMR does not discriminate between on the one hand contact
ion-pairs that are electrically neutral and, on the other hand, free-ions and solvent separated
ion-pairs that both contribute to the electrolyte conductivity. In POE the highest + was
obtained with LiTFSI while in NPC host polymer, the highest +was obtained with LiTPSM.
4. Conclusion
New lithium salts based on perfluoroethersulfonate and dissymmetric

Chapter III :Aliphatic Lithium Salts based on Sulfonate and Sulfonylimide Oligoether
131
perfluoroethersulfonimide anions, hosted in linear and tridimensional, were thoroughly
characterized. Generally polymer electrolytes are used in a wide range of salt concentration.
However, the best performances are obtained, in lithium battery, for medium to fairly low salt
concentrations. Furthermore, decreasing the salt concentration allows cost-cutting to be
performed as the lithium salts are expensive. We have therefore mainly focus our polymer
electrolyte study on 2 concentrations (O/Li = 20 and 30). The best conductivities in POE
commercial host polymer were obtained for electrolytes based on the dissymmetric
sulfonamide. However, thanks probably to the flexibility brought by the ether function, the
conductivities obtained with the perfluorosulfonate salt are much higher, at 70°C, than those
already reported for lithium triflate [31]. In a perspective or post-lithium-ion batteries based
on sodium or on alkaline-earth metals e.g. magnesium, it should be interesting to assess the
capability of this flexible perfluorosulfonate anion to induce both high conductivities and
cationic conductivities. Using as host polymer NPC allows significantly (i) reinforcing the
mechanical strength of the polymer electrolytes (ii) decreasing the crystallinity and Tm of the
polymer electrolyte and (iii) increasing the ambient temperature conductivities as compared to
commercial POE. The conductivity of NPC electrolytes based on both salts could be still
improved in terms of conductivity, by decreasing the crosslink density, while their mechanical
strength could be distinctly increased by the use of Nano Crystalline Cellulose [32]
These results are still limited as compared to hundreds of published papers dealing with
LiTFSI and, owing to the data here reported, these new salts deserve to be investigated not
only in solvent-free polymer electrolytes but also in liquid and gelled electrolytes.
Furthermore the potential of these new anions must be assessed in ionic liquids and, in
particular, in proton-conducting ionic liquids for High Temperature PEM Fuel Cells. The
starting commercial sulfonyl fluoride could be easily produced at large scale as it can be
derived from one of the monomer used to synthesize perfluorosulfonic acids, while the
perfluorosulfonamide (TPSM) synthesis can use trifluorosulfonic anhydride [33]
Acknowledgements
This work was supported by the Agence Nationale de la Recherche (ANR 2011 BS08
003 01)

Chapter III :Aliphatic Lithium Salts based on Sulfonate and Sulfonylimide Oligoether
132
References
[1] P. Isken, C. Dippel, R. Schmitz, R.W. Schmitz, M. Kunze, S. Passerini, et al.,
Electrochimica Acta. 56 (2011) 7530–7535.
[2] G. Feuillade, Ph. Perche, J Appl. Electrochem. 5 (1975) 63–69.
[3] M. Gauthier, A. Bélanger, P. Bouchard, B. Kapfer, S. Ricard, G. Vassort, et al., J.
Power Sources. 54 (1995) 163 – 169.
[4] K. Murata, S. Izuchi, Y. Yoshihisa, Electrochimica Acta. 45 (2000) 1501 – 1508.
[5] V.D. Noto, S. Lavina, G.A. Giffin, E. Negro, B. Scrosati, Electrochimica Acta. 57
(2011) 4 – 13.
[6] D.E. Fenton, J.M. Parker, P.V. Wright, Polymer. 14 (11) (1973) 589.
[7] P.V. Wright, Br Polym. J. 7 (1975) 319.
[8] C. Berthier, W. Gorecki, M. Minier, M.B. Armand, J.M. Chabagno, P. Rigaud, Solid
State Ion. 11 (1983) 91 – 95.
[9] Z. Stoeva, I. Martin-Litas, E. Staunton, Y. G. Andreev, P. G. Bruce, J AM CHEM
SOC. 125 (2003) 4619–4626.
[10] A.Killis, J-F.Le Nest, H.Cheradame, MakrolChemRapid Comm.1 (1980) 595.
[11] M. Watanabe, H. Tokuda, S. Muto, Electrochimica Acta. 46 (2001) 1487 – 1491.
[12] C. Schoenenberger, J.F. Le Nest, A. Gandini, Int. Symp. Polym. Electrolytes. 40
(1995) 2281–2284.
[13] F. Alloin, J.-Y. Sanchez, Electrochimica Acta. 40 (1995) 2269–2276.
[14] J. Barthel, M. Schmidt, H.J. Gores, J Electrochem Soc. 145 (1998) L17–L20.
[15] E. Paillard, C. Iojoiu, F. Alloin, J. Guindet, J.-Y. Sanchez, Electrochimica Acta. 52
(2007) 3758 – 3765.
[16] S. Sylla, J.-Y. Sanchez, M. Armand, Electrochimica Acta. 37 (1992) 1699 – 1701.
[17] F. Alloin, D. Benrabah, J.-Y. Sanchez, J. Power Sources. 68 (1997) 372 – 376.
[18] J. Kalhoff, D. Bresser, M. Bolloli, F. Alloin, J.-Y. Sanchez, S. Passerini,
ChemSusChem. 7 (2014) 2939–2946.
[19] D.Benrabah, D.Baril, J-Y.Sanchez, M.Armand, G.Gard, J.Chem. Soc. Faraday Trans.
89 (1993) 355–359.
[20] L. Conte, G. Gambaretto, G. Caporiccio, F. Alessandrini, S. Passerini, J. Fluor. Chem.
125 (2004) 243 – 252.
[21] O.E. Geiculescu, S.E. Creager, D.D. DesMarteau, in : T. Nakajima, H. Groult (Eds.),
Fluorinated Materials for Energy Conversion, Elsevier (2005), pp. 223–251 (Chapter
10)
[22] F. Alloin, J.-Y. Sanchez, M. Armand, J. Electrochem. Soc.141 (1994) 1915.
[23] P.R. Soeresen, T. Jacobsen, Electrochimica Acta. 27 (1982) 1671–1675.
[24] D. Aurbach, J Power Sources. 89 (2000) 206–218.
[25] M.D. Levi, D. Aurbach, J. Phys. Chem. B. 101 (1997) 4630–4640.
[26] M. Rosso, Electrochimica Acta. 51 (2006) 5334–5340.
[27] R.Arnaud, D.Benrabah, J-Y.Sanchez, J Phys Chem. 100 (1996) 10882–91.
[28] Z. Lu, L. Yang, Y. Guo, J. Power Sources. 156 (2006) 555–559.
[29] D. Benrabah, R. Arnaud, J.-Y. Sanchez, Electrochimica Acta. 40 (1995) 2437 – 2443.
[30] M. Doyle, T.F. Fuller, J. Newman, Electrochimica Acta. 39 (1994) 2073 – 2081.
[31] D. Benrabah, S. Sylla, F. Alloin, J.-Y. Sanchez, M. Armand, Electrochimica Acta. 40
(1995) 2259–2264.
[32] M.A.S. Azizi Samir, F. Alloin, J.-Y. Sanchez, N. El Kissi, A. Dufresne,
Macromolecules. 37 (2004) 1386–1393.
[33] F. Toulgoat, B.R. Langlois, M. Médebielle, J.-Y. Sanchez, J. Org. Chem. 73 (2008)
5613–5616.

Chapter III :Aliphatic Lithium Salts based on Sulfonate and Sulfonylimide Oligoether
133
III.3. Preparation and characterizations of aliphatic
oligoether lithium salts
In order to study the performance of aliphatic lithium salts based on
sulfonate/sulfonimide mono end-capped mPEG and to compare with the salts LiTPSM and
LiTPSN we selected to modify the 1,1,2,2,-tetrafluoro-2-(1,1,2,2,-tetrafluoro-2-
iodoethoxy)ethane sulfonyl fluoride. It is well known the iodoperfluoalkyl is able to perform
an addition reaction on allylic double bond (figure 3.3) [5]. Then the SO2F from RF can be
transformed in SO3Li by hydrolysis or in sulfonimide Li.
RF is CF2CF2-O-CF2CF2SO2F
Figure 3.3. Mechanism for free radical addition on allylic double bond [5].
The fluorinated part of these salts is similar to that of salt LiTPSM and LiTPSN.
The synthesis of these salts needs a precursor that is an allyl mono-ended mPEG.
Synthesis of allyl monoended mPEG precursor
The allyl ether precursors were obtained by Williamson synthesis from mPEG and allyl
bromide via the nucleophilic substitution reaction (figure 3.4). The alcohols with different
number of repeating oxyethylene units are deprotonated by the NaH at 40°C in anhydrous
tetrahydrofurane at room temperature. Allyl bromide was added dropwise at 0°C in order to
limit the side reactions. The temperature of solution was heated to 40 °C and the reaction
progress was monitored by 1H-NMR.

Chapter III :Aliphatic Lithium Salts based on Sulfonate and Sulfonylimide Oligoether
134
Figure 3.4. Schematic of allyl ether precursor synthesis for n 3.
The figure 3.5 represents the spectrum of mPEG and Allyl-mPEG. The transformation of
mPEG in Allyl-mPEG is showed by the shifting of the peak corresponding to the protons
from position a (CH3) from 3.1 ppm to 3.3 ppm and the multiplet peaks corresponding to
protons of oxyethylene appear at 3.5 ppm instead of 3.3 ppm. Moreover, new peaks appear at
3.9, 5.1 and 5.8 ppm corresponding to protons of methylene (d) and allyl (e,f). All proton
signals represented in figure 3.5 (b) indicates the successful formation of allyl ether
precursors.
Figure 3.5. 1H-NMR spectra of (a) alcohol starting material (mPEG) (b) allyl ether precursor
(Allyl-mPEG), n=3.
The crude yield of reaction was 100%, the resulted product is a solid or a liquid,
depending on the chain length of molecule. In order to separate, the Allyl-mPEG from by-
product (white precipitate NaBr) and excess of bromoallyl the mixture resulted after the
O
OH
2)Br
O
On n
1) NaH+ NaBr + H2
(a)
(b)

Chapter III :Aliphatic Lithium Salts based on Sulfonate and Sulfonylimide Oligoether
135
evaporation of THF was washed with water and extracted in diethylether. The net yield
depends on the length of mPEG and the results are gathered in the Table 3.1.
Table 3.1 Percentage yield obtained for each chain length of mPEG
n % crude yield % net yield
1 100 60
3 100 85
7 100 85
16 100 62
III.3.1.Synthesis of Salt 3
Salt 3 was carried out by the radical addition reaction of allyl oligoether (figure 3.6) on 5-
Iodoperfluoro-3-oxapentanesulfonyl fluoride using benzoyl peroxide as an initiator [6], [7] to
form mPEG-SO2F follow by the hydrolysis reaction to form the salt 3 .
The synthesis of mPEG-SO2F takes place with net yield of 66 %. As side products we found
small quantity of by-product resulted by the polymerization of Allyl-mPEG or by
dimerization of 5-Iodoperfluoro-3-oxapentanesulfonyl fluoride. The side products, the
benzoyl peroxide and the excess of 5-Iodoperfluoro-3-oxapentanesulfonyl fluoride were
removed by flash column chromatography.
Figure 3.6. Synthesis of salt 3.

Chapter III :Aliphatic Lithium Salts based on Sulfonate and Sulfonylimide Oligoether
136
The 1H NMR spectrum of mPEGSO2F is represented in the figure 3.7. As comparing
with Allyl-mPEG it can be observed the peaks corresponding to the protons from allyl
disappear and a new peak, as multiplet, appears at 4.2 ppm corresponding to the proton of
CH-I (e). New peaks appear, like multiplets, at 2.6 and 3.0 ppm corresponding to two protons
of carbon bonded to CF2 and CHI (f). We note the peak corresponding to the protons in d and
f positions are multiplets with a very complicate shape. This was also reported by other
authors [8], [9], [10] and we assume this is due to the presence of stereocentre (CHI) and the
formation of different diastereomers. Hence the protons from d and f positions are
diastereotopic.
Furthermore, 19F-NMR spectra, represented in Figure 3.8 indicates the formation of
mPEGSO2F by the shift of the peak corresponding to -CF2-I from -65 ppm to -112 ppm
assigned to CF2 bonded to CH2. Also the peaks corresponding to the other F from other
carbons (2’, 3’,4’) shift with some ppm after the addition reaction while the peak of SO2F
located at 45.8 ppm shift only with 0.5 ppm (45.3 ppm).
Figure 3.7. 1H NMR spectra of (a) allyl ether precursor and (b) intermediate of salt 3 in
CDCl3.
(a)
(b)

Chapter III :Aliphatic Lithium Salts based on Sulfonate and Sulfonylimide Oligoether
137
Figure 3.8. 19F-NMR spectra of (a) 5-Iodoperfluro-3-oxapentanesulfonyl fluoride and (b)
intermediate of salt 3 in CDCl3.
In order to obtain the lithium salt, the –SO2F was transformed in –SO3Li in THF with
LiOH at ambient temperature (Figure 3.9). The success of transformation was checked by the
disappearance of the peak at 46 ppm on 19F-NMR spectrum corresponding to the F from SO2F
as shown in Figure 3.9. The peak NMR spectra were performed in acetone, while the
obtained product in SO3Li form (salt 3) is not more soluble in chloroform. In acetone solvent
the F in 1 position appears like multiplet in 19F-NMR spectrum, probably due to the protons in
f positions that are diastereotopic.
Additionally, there is a slightly shift of peaks in 1H-NMR as seen in Figure 3.10.
The transformation of SO2F in SO3Li carried out in basic condition and a deiodination
reaction could be expected (figure 3.11) that might lead to the formation of double bonds.
However, in 1H-NMR (Figure 3.10), any peak corresponding to the double bonds was
detected. Another possibility is a part of iodine was replaced with OH but the elementary
analysis does not sustain this hypothesis (Table 3.2), the iodine found in the composition is
slightly higher than expected one.
(b)
(a)

Chapter III :Aliphatic Lithium Salts based on Sulfonate and Sulfonylimide Oligoether
138
Figure 3.9. 19F-NMR spectra in acetone of (a) mPEGSO2F and (b) salt 3 in acetone-
d6.
Figure 3.10. 1H-NMR spectra of (a) intermediate of salt 3 and (b) salt 3.
(b)
(a)
(b)
(a)

Chapter III :Aliphatic Lithium Salts based on Sulfonate and Sulfonylimide Oligoether
139
R CF2CF2OCF2CF2SO3Li
I
R CF2CF2OCF2CF2SO3Li + I- + H2O
HO
H
R CF2CF2OCF2CF2SO2F
I
H
OH
Figure 3.11. Deiodination of salt 3 (R = CH3OCH2CH2O-). [11]
Elementary analysis
Table 3.2 Elemental analysis of salt 3
Element C H F Li S I
Calc. 21.99 2.21 27.83 1.27 5.87 23.24
Found 22.020.3 2.600.3 27.89 1.1 5.65 23.55
III.3.2.Synthesis of Salt 4
The presence of iodine in the structure of salt can affect its chemical and
electrochemical stability. Therefore, the salt 4 was obtained by the substitution of iodine with
hydrogen. The synthesis of salt 4n1 was performed by intermolecular perfluoroalkylation of
alkenes in presence of tris-(trimethylsilyl)silane (Me3Si)3SiH) and benzoyl peroxide (figure
3.12) followed by the transformation of SO2F in SO3Li.
salt 3
Deiodinated salt 3

Chapter III :Aliphatic Lithium Salts based on Sulfonate and Sulfonylimide Oligoether
140
Figure 3.12. One pot reaction and lithiation of salt 4.
The mechanism of the (Me3Si)3SiH-mediated intermolecular perfluoroalkylation of alkenes is
depicted in the Scheme represented in Figure 3.13 [12]. The (Me3Si)3Si• radical (produced
peroxide decomposition) abstracts the halogen atom (iodine) from RfX. This Rf• radical reacts
faster with the alkene than with the silicon hydride, affording the perfluoroalkylated radical
adduct 10. The perfluoroalkylated radical adduct 10 abstracts hydrogen from the silane,
affording the perfluoroalkyl-substituted alkane 11, and regenerating the silyl radical, thus
propagating the chain. The electrophilicity of Rf• radicals is the dominant factor giving rise to
their high reactivity. The stronger carbon-carbon bond that forms when Rf • versus R• radicals
add to an alkene is a driving force for the radical addition (the greater exothermicity of the Rf•
radical addition is expected to lower the activation energy).
Dolbier et al. [13] have found that perfluorinated radicals were much more reactive than their
hydrocarbon counterparts in addition to normal, electron rich alkenes such as 1-hexene (40
000 times more reactive) in organic solvents, and that H transfer from (Me3Si)3SiH to a
perfluoro-n-alkyl radical such as n-C7F15CH2CH•C4H9 was 110 times more rapid than that to
the analogous hydrocarbon radicals.

Chapter III :Aliphatic Lithium Salts based on Sulfonate and Sulfonylimide Oligoether
141
Figure 3.13. Mechanism for Radical Carbon-Carbon Bond Formation Reactions from
Alkenes and Perfluoroalkyl Iodides mediated by (Me3Si)3SiH
The intermediate (mPEGHSO2F) of salt 4n1 was recovered by distillation and then by
reaction with LiOH the salt 4n1 was obtained.
However for n>3 the distillation was not more possible the purification of mPEGHSO2F by
extraction or flash column chromatography give not good results probably due the similar
polarity of different products present in the reaction mixture. In order to improve it we
proceed first to the transformation of mPEGSO2F in salt 4 (SO3Li) and then perform the
purification. However, the purification is quite difficult and the yield net was lower than 30%.
Therefore in the second time we performed the synthesis of salt 4 by hydrogenation of salt
3 with (Me3Si)3SiH. The salt 4n1 (3, 7, 16) was purified and then was submitted to
hydrogenation reaction (Figure 3.14).
The 1H-NMR spectra (figure 3.15) represents the comparison between the salt 3 and salt 4
intermediate. The disappearance of multiplet at 4.3 ppm which corresponds to proton of CHI
(e’) and the apparition of a new peak 1.3 ppm prove the transformation of CHI in CH2.
Moreover the protons from the carbon close to CF2 shift from 2.6 and 3 ppm at 2.1 ppm.
The modification of SO2F in SO3Li was monitored by 19F-NMR. The disappearance of peak
at 45 ppm belonging to SO2F and the slight shift of CF2 peak from 112 ppm to 118 ppm was

Chapter III :Aliphatic Lithium Salts based on Sulfonate and Sulfonylimide Oligoether
142
shown in 19F-NMR spectrum in figure 3.16. This can indicate the successful formation of salt
4n3.
O
O
O
O CF2CF2OCF2CF2SO3Li
LiOH, THF
TTMSS, Bz2O2
Toluene
O
O CF2CF2OCF2CF2SO2F
n
ICF2CF2OCF2CF2SO2F
Bz2O2
n
n
O
O CF2CF2OCF2CF2SO2Fn
I
Figure 3.14. Syntheses of salt 4n1 and salt 4n3.
Figure 3.15. 1H NMR spectra of (a) salt 3n3-SO2F and (b) salt 4n3 after the replacement of I
with H in CDCl3.
mPEG (n=1 or 3)
salt 4 (n=1 or 3)
(a)
(b)

Chapter III :Aliphatic Lithium Salts based on Sulfonate and Sulfonylimide Oligoether
143
Figure 3.16. 19F NMR spectra of (a) intermediate of salt 4n3 and (b) salt 4n3 in acetone –d6.
The synthesis of salt 4n1 and salt 4n3 were obtained with a net yield around 53%.
For the synthesis of salt 4 with n= 7 and 16 we did not succeed to improve the yield. During
the purification by column chromatography almost all product was loss. Therefore, the study
on the salt 4n7 and salt 4n16 were not carried out in the further characterization.
III.3.3.Salt 5
As reported in the bibliographic part, the performances of sulfonylimide anions are
more attractive due to the feature of TFSI- anion. This anion function provides a large
delocalization of its negative charge contributing the ion pair dissociation and the high
flexibility. Therefore, the lithium salt of aliphatic sulfonylimide oligoether is synthesized by
transforming the sulfonyl fluoride into sulfonylimide group as shown in the following
schematic (Figure 3.17).
(b)
(a)

Chapter III :Aliphatic Lithium Salts based on Sulfonate and Sulfonylimide Oligoether
144
O
O CF2CF2OCF2CF2SO2NSO2CF3
3
O
O
3
CF2CF2OCF2CF2SO2F
CF3SO2NH2
Triethylamine
50°C, 16h
O
O
3
CF2CF2OCF2CF2SO2NSO2CF3
LiOH, THF
40°C, 2h
(C2H5)3NH
Li
Figure 3.17. Synthesis of salt 5n3.
The sulfonyl fluoride oligoether n= 3 is reacted with trifluoromethanesulfonamide in
the presence of triethylamine in acetonitrile according to a procedure for synthesis of lithium
sulfonylimide monomers [14], [15]. The residue after the solvent evaporation is dissolved in
dichloromethane, washed by distilled water many times to remove the excess of
trifluoromethanesulfonamide and the side product, sulfonate triethylammonium salt (figure
3.18). This side product can be formed by the hydrolysis of SO2F with water traces from
solvent [14]. This competitive reaction simultaneously occurs with the formation of
sulfonylimide triethylammonium salt. This assumption is indicated by the 4 peaks at -82, -88,
-117 and -118 ppm on the 19F-NMR spectrum (figure 3.19 (a)). The triethylammonium salt of
the main product is concentrated and followed by the cation exchange with a solution of
LiOH. The 1H-NMR spectrum in figure 3.20 shows the disappearance of protons on methyl
and methylene carbon of sulfonylimide triethylammonium salt at 1.3 and 3.1 ppm
respectively.
O
O
n
CF2CF2OCF2CF2SO3
(C2H5)3NH
Figure 3.18. Possible formation of sulfonate triethylammonium salt from competitive
reaction.
Salt 5n3

Chapter III :Aliphatic Lithium Salts based on Sulfonate and Sulfonylimide Oligoether
145
Figure 3.19. 19F spectra of (a) mixture of sulfonate triethylammonium salt and sulfonylimide
triethylamonium salt (b) sulfonylimide triethylammonium salt in DMSO-d6.
(a)
(b)

Chapter III :Aliphatic Lithium Salts based on Sulfonate and Sulfonylimide Oligoether
146
Figure 3.20. 1H spectra of (a) sulfonylimide triethylammonium salt (b) salt 5n3 in DMSO-d6.
III.3.4. Characterizations of salts
III.3.4.1. Thermal Properties
a. DSC analyses
The Tg, Tm and H of different salts synthesized are gathered in the Table 3.2. The salt
LiTPSM and LiTPSN were added for comparison.
(a)
(b)

Chapter III :Aliphatic Lithium Salts based on Sulfonate and Sulfonylimide Oligoether
147
O
O CF2CF2OCF2CF2SO3Li
O
O CF2CF2OCF2CF2SO3Li3
O
O CF2CF2OCF2CF2SO2NSO2CF3
3
Li
O
O CF2CF2OCF2CF2SO3Li
I
CF3CF2OCF2CF2SO3Li
CF3CF2OCF2CF2SO2NSO2CF3
Li
Table 3.2 Glass transition temperature (Tg), melting temperature (Tm) and H of aliphatic
lithium salts modified mPEG.
Samples Chemical Structure Tg (°C) Tm (°C) H (J/g)
LiTPSN 123 157 10
Salt 3n1
30 126 28
Salt 4n1 8 130 58
Salt 4n3
-8 102 7
LiTPSM not
detected 192 50
Salt 5n3
-33 - -
Concerning the sulfonated salts, the bonding of a mPEG to the perfluorulfonated anion leads
to a significant decrease of Tg and Tm values. The presence of bulky and polar iodine in the
salt structure seems to increase the Tg (salt 3n1) as compare to the salt 4n1 where the I was
replaced by H (salt 4n1) while the melting point and the H are higher for the last salt. The
presence of I might increase the viscosity of the salt and prevent its fully organization.
However, the increase of n from 1 to 3 (salt 4n3) leads to an important decreases of both
temperature, Tg and Tm as well as H. The same phenomena were observed in the case of salt
2 (see chapter 2).
As regarding the salts based on sulfonimide the bonding of mPEG n=3 to the anion leads to a
salt completely amorphous. This is contrarily to the pristine salts, where the salt LiTPSM has
higher Tm as compared to LiTPSN. The higher Tm for the first (LiTPSM ) can be explaining

Chapter III :Aliphatic Lithium Salts based on Sulfonate and Sulfonylimide Oligoether
148
by a higher dissociation degree of the salt and thus stronger interaction between the chains
forming the crystals. For the salt 5n3 we suppose adding of mPEG, create disorder due to the
interaction of Li+ with the O from mPEG, and this disorder should be most important as
compare to the salt 4n3 due to the anion asymmetry.
As compared with the salt 2n3 (chapter 2) the thermal characteristic and especially the
Tg are much lower for aliphatic perfluorsulfonated salts, (salt 4n1 as compared to salt 2n1,
salt 4n3 as compared to salt 2n3)
b. Thermal stability
Figure 3.21 shows TGA curves of aliphatic lithium salts i.e. salt 3n1, salt 4n3 and salt 5n3,
and for comparison the salt 2n3(aromatic salt) and LiTPSM, LiTPSM were added in the
figure. Also in order to evaluate if the presence of mPEG in the salt structure decrease the
thermal stability as compared to the salt, we added mPEG n=16 (we choose n=16 to avoid the
evaporation before degradation). The temperature of TGA measurements were carried out
from 25°C to 500°C under argon.
The onset of weight loss starts at 232 °C up to 292 °C and leads to 35 and 70 wt% weight
losses for salt 3n1 and salt 4n3 respectively.
The presence of I in the structure of the salt (salt 3n1) decreases drastically the thermal
stability as compared to salt 4 (when I was replaced by H). However, the onset of weight loss
is slightly higher than that of aromatic salt (i.e. salt 2n3). Regarding the impact of the mPEG
bonded to the anion on the stability of the salt, we can see, by comparing the TGA curves of
LiTPSN and LiTPSM with those of salt 4n3 and salt 5n3, the onsets of weight loss are lower
in the case of the last salts but higher to the onset of mPEG degradation. Hence we can
conclude the weight losses of the salt 4n1, 4n3 and 5n3 start with mPEG degradation. The
formed fragments have to interact with the Li+ therefore the weight loss onset is higher than
that of mPEG n16.
However, the stability of all the salts are enough good for the application lithium batteries.

Chapter III :Aliphatic Lithium Salts based on Sulfonate and Sulfonylimide Oligoether
149
Figure 3.21. Thermogravimetric analysis of aromatic (salt 2n3) and aliphatic (salt 3, salt 4n3
and salt 5n3) lithium salts.
III.3.4.2. Intrinsic conductivity of salts
The intrinsic conductivities were measured for the salt 4n3 and the salt 5n3 and are
represented in the Figure 3.22 as a function of temperature (1000/T). At 30 °C the salt 4n3
exhibits a conductivity of 5.08×10⁻⁶ S/cm and 4.10×10⁻⁴ S/cm at 110°C. This value is
comparable with that of salt 2n16, higher than that of salt 2n7 (see chapter 2) and much
higher than that of the oligoether sulfate salt (POEMSLi164: CH3-(OCH2CH2)3-OSO3Li)
which has been reported (10-7 S/cm) by C. Chauvin [16]. The replacement of
Oxydophenylsulfanyl)-1,1,2,2-tetrafluoroethane (in the case of salt 2) with more flexible
moiety i.e. 1,1,2,2,-tetrafluoro-2-(1,1,2,2,-tetrafluoro-2-ethoxy)ethane might to decrease
significantly the viscosity and thus increase the conductivities.
As comparing the salts 5n3 and salt 4n3 with same n of mPEG, the salt based on
sulfonylimide (salt 5n3) provides higher conductivity than that based on sulfonate one (salt
4n3) with 6.11×10⁻⁴ S/cm at 110°C and 4.05×10⁻⁵ S/cm at 30 °C. This result can be explained
by the lower viscosity of the salts, as shown by the DSC (lower Tg) but also by the
dissociation degree of salt based n on sulfonimide might be higher.
0 50 100 150 200 250 300 350 400 450 500 550
-100
-80
-60
-40
-20
0
We
igh
t lo
ss (
%)
Temperature (°C)
Salt 2n3
Salt 3
Salt 4n3
Salt 5n3
LiTPSN
LiTPSM
mPEG n=16

Chapter III :Aliphatic Lithium Salts based on Sulfonate and Sulfonylimide Oligoether
150
2,6 2,8 3,0 3,2 3,4
1E-6
1E-5
1E-4
1E-3
Co
nd
uctivity (
S/c
m)
1000/T (K-1)
salt 4n3
salt 5n3
Figure 3.22. Conductivity of aliphatic lithium salts.
III.3.4.3. Diffusion coefficient
The self-diffusion coefficient was measured by multinuclear Pulsed Field Gradient NMR (7Li,
19F and 1H) and all results are gathered in Table 3.3. The diffusion coefficients of anion (D19F
– D- fluorine) are lower than those of cation, Li+, (D7Li, D+) for both salt 4n3 and salt 5n3. C.
Chauvin [17] reported opposite results on aliphatic sulfate oligoether lithium salt (CH3-
(OCH2CH2)3-OSO3Li), where the D- is higher. However, we obtained similar results reported
in the chapter 2 on the salt 2n7 and salt 2n16. The values of both, i.e. self-diffusion
coefficient of anion, D- and Li+, D+ of the salt 5n3 are higher than those of the salt 4n3. The
diffusion coefficient is directly related to the viscosity of the salt and the bulkiness of species
that are diffusing. Taking into account the size of anion is even higher in the case of salt 5n3
we can suppose the viscosity of this salt is lower
The dissociation degree of salt 4n3 and salt 5n3 are calculated by the ratio of the conductivity
obtained from the experiment and the conductivity calculated by applying the Nernst-Einstein
equation. As expected result lower dissociation degree is obtained for the salt 4n3 as
compared with the salt 5n3.

Chapter III :Aliphatic Lithium Salts based on Sulfonate and Sulfonylimide Oligoether
151
Table 3.3 Comparison of diffusion coefficients determined by PFG-NMR at 383K
Salt 4n3 Salt 5n3
D19F (cm2s-1) 0.29×10⁻⁷ (0.02×10⁻⁷) 0.43×10⁻⁷
D7Li (cm2s-1) 0.39×10⁻⁷ (0.10×10⁻⁷) 0.7×10⁻⁷
Density (g/cm3) 1.61 1.65
Concentration (mol/cm3) 3.17×10⁻³ 2.58×10⁻³
Nernst (Scm-1) 6.30×10⁻⁴ 8.54×10⁻⁴
exp (Scm-1) 4.10×10⁻⁴ 6.11×10⁻⁴
% dissociation 65 72
III.3.4.4. Transference numbers
The cationic transference numbers, T+, are calculated with the self-diffusion
coefficient of anion (D- = D19F) and cation (D+ = D7Li) determinate by PFG-NMR by using
the next relationship: + = 帖+帖++ 帖− . The cationic conductivities are also calculated from + = T+.
It is observed that the cationic transference number of salt 5n3 is higher than that of
salt 4n3. This behavior is in contrast to the salt incorporated in POE membranes where the
sulfonylimide/POE complex has much lower T+ than the sulfonate one [4]. The lower T+ is
generally due to both the strong interaction of Li+ with the O from OE and the poor
interactions between the anion and the POE host polymer. Here, Li+ diffuse thanks to the
segmental motion of mPEG. The lithium is solvated by 5 O, in the case of the both salts the
number of O is lower (n=3 from OE + 1 from methoxy), that means at least 2 mPEG are
involved in the solvatation of a Li+. The higher T+ for the salt 5n3 could be explaining by the
higher dissociation degree of the salt 5n3.
The cationic conductivities calculated reach 2.34×10⁻⁴ S/cm for salt 4n3, lower than
salt 5n3 providing 3.79×10⁻⁴ S/cm.

Chapter III :Aliphatic Lithium Salts based on Sulfonate and Sulfonylimide Oligoether
152
Table 3.4 Comparison of intrinsic cationic transference numbers and cationic conductivities
between sulfonate and sulfonylimide mPEG lithium salts (salt 4n3 and salt 5n3) at 383K
Salt O/Li
(S/cm) T+
+
(S/cm)
Salt 4n3 3 4.10×10⁻⁴ 0.57 2.34×10⁻⁴
Salt 5n3 3 6.11×10⁻⁴ 0.62 3.79×10⁻⁴
III.3.4.5. Electrochemical stability
The anodic oxidation potentials were measured by cyclic voltammetry.
Platinum wires (diameter = 0.2 mm) were used for working and counter electrodes using
Ag/AgNO3 as reference electrode. Tetraethyl ammonium tetrafluoroborate in acetonitrile was
used as the supporting electrolyte. Table 3.5 gathered the values of onset oxidation peak
potentials obtained by cyclic voltamperometry with a rate of 10 mV/s.
The salt 3 shows the lower stability in oxidation. The oxidation wall of the salt 3 starts
at 4.5 V and is lower than those of salt LiTPSN (4.9 V). The replacement of I by H induce an
increase of the oxidation potential with 0.3V. Despite the presence of OE units that are
known to present oxidation stability close to 3.9 V versus Li/Li+, the oxidation stability of
salts seems to be higher than that of POE. Similar results were obtained for the salt 2 (chapter
2). These results are a good surprise and are in line with theoretical calculations performed by
Chauvin et al.[16]
The chain lengths of the mPEG perform any impact on the oxidation potential. The
oxidation potential of the salt 5n3 (4.7 V) is slightly lower than that of salt 4n3.
However, all synthetized salts seem to be enough stable for an utilization in lithium
polymer batteries.

Chapter III :Aliphatic Lithium Salts based on Sulfonate and Sulfonylimide Oligoether
153
Table 3.5 Oxidation potential of different salts in the solution of TEABF4
Salt Oxidation potential
(V vs Li/Li+)
Supporting electrolyte (CH3CN + TEABF4) 5.3
LiTPSN 4.9
Salt 3n1 4.5
Salt 4n1 4.8
Salt 4n3 4.8
LiTPSM 4.8
Salt 5n3 4.7
III.4. Elaboration and characterization of membrane
based on POE host polymer doped with mPEG aliphatic
lithium salt
Practically, lithium electrolytes are obtained by the incorporation of lithium salt in a
host polymer (solid electrolyte for lithium polymer batteries) or by dissolving of a salt in a
solvent (liquid electrolyte for lithium ion batteries). In this current work, similar to chapter 2
and first part of chapter 3 the salts are mixed with the linear POE or with polycondensat.
Characterization of membrane based on linear POE host polymer doped with
aliphatic lithium salt
III.4.1.Thermal characterizations
The glass transition temperature (Tg), the melting temperature (Tm) and the fusion
enthalpy (H) of polymer electrolytes, based on aliphatic perfluorosulfonate lithium salts
modified by mPEG (salt 3, salt 4 or salt 5) and linear POE (Mw = 300,000 g/mol), were
measured by DSC. All data are gathered in Table 3.6.

Chapter III :Aliphatic Lithium Salts based on Sulfonate and Sulfonylimide Oligoether
154
To evaluate the impact of mPEG on the thermal behavior of polymer electrolytes
based on salt mono-end caped with mPEG the thermal characteristics of POE/LiTPSN and
POE/LiTPSM, O/Li =20 were added in the table.
The POE was blended with different amount of salt, expressed by the ration O/Li,
where O represents the number of structural oxyethylene (OE) units for a Li salt. For the
calculation of O/Li we take in account the OE from the anion and we use the next formula:
潮挑 = 陳鍋捺陳濡如禰 暢44 + 券 (1)
Where mPOE is the weight of POE; msalt is the weight of the salt, M the molecular
weight of the salt, n the number of OE structural unit in the salt, 44 represent the molecular
weight of OE.
In the column O/Li, in brackets, we give also the O/Li taking in account only the OE
from POE.
Two series of measurements were performed. First, all the samples were submitted to
two heating scans, in the first scan the samples, that were conserved at least a month in the
glove box, were heated from -100°C to 100°C and we measured the Tg1, Tm1, Hm1, then it
was cooled down at -100°C with a ramp of 20°C/min and further heated once again to 100°C
(Tg2, Tm2, Hm2). In the second series, the samples were quenched, therefore the pans
containing the samples placed in a well closed recipient, were heated at 80°C on a heater
outside of the DSC devise and after 10 min the pans were removed in the DSC at -100°C (Tgq,
Tmq, Hmq).
First, if we analyze the results obtained on the first series, we observed the Tg values
are higher than that of pure POE and the values enhance with the salt concentration in the
electrolyte. This is a general behavior for the electrolytes based on lithium salt/POE
complexes, the Tg increase due to the interactions of Li cation with OE moieties. The
interaction density (physical crosslinking) might to increase with salt concentration affecting
the mobility of chains and thus increase the Tg.
By comparing the Tm and Tg for the first and the second heating scan, in the second
lower values were obtained for all the complexes. These results are different from the
electrolytes based on aromatic salts (chapter 3, Tg, Tm, H very close in the first and second

Chapter III :Aliphatic Lithium Salts based on Sulfonate and Sulfonylimide Oligoether
155
scan) and suggest the aliphatic salt delate the crystallization phenomena. To explain this
different behavior we can suppose a better interaction between the POE and the aliphatic salt.
Regarding the impact of the size of anion, for the same O/Li ration, we observe a
slightly decrease of Tg values with increase of mPEG chain (salt 4 n=1 and n=3), this results
is similar to those reported on salt 2 (chapter 2).
The crystallinity percentage is directly proportional to Hm and is calculated according
to eq. (2) where H0 is the melting enthalpy per unit weight of 100% crystalline POE, which
is 205 J/g [18] and w is the weight fraction of POE in the sample.
隙 = ∆尿∆0 .栂 × などど (2)
We observed, similar to the salt 2 an increase of Tm and of crystallinity with the n of
PEG. Also the lower Tm and crystallinity were obtained for the salt 5n3.
The values of melting temperatures and the crystallinity degree increase slightly with
the increase of O/Li for all the studied salts.
For the quenched sample the Tg, Tm are lower as compared with Tg1 and Tg2, Tm1 and
Tm2 and follow the same trend (decrease with the n, decrease of Tg with the O/Li, increase of
Tm with the O/Li).

Chapter III :Aliphatic Lithium Salts based on Sulfonate and Sulfonylimide Oligoether
156
Table 3.6 Glass transition temperature (Tg) and melting temperature (Tm) of POE/salt 3n1,
salt 4n1, salt 4n3 and salt 5n3 complexes
Samples O/Li
(O/Li-n)
Tg1
(°C)
Tg2
(°C)
Tg(q)
(°C)
Tm*1
(°C)
Tm*2
(°C)
Tm*(q)
(°C)
H1POE
(J/g)
H2POE
(J/g)
HPOE(q)
(J/g)
%
crystallinity
(1st/2nd /q)
POE - -63 -62 70 69 58 126 127 105 61/62/51
POE/LiPSTN 20 - -21 -51 68 63 56 135 101 100 66/49/49
POE/LiPSTM 20 -38 -37 -53 66 60 51 61 50 64 30/24/31
POE/ Salt
3n1
20(19) -28 -46 -46 63 57 55 66 60 61 32/29/30
30(29) -27 -48 -51 65 60 55 76 69 97 37/33/34
40(39) -26 -49 -54 66 62 58 119 99 104 58/48/45
POE/ Salt
4n1
12(11) -33 -34 50 52 103 64 50/31
20(19) -33 -35 -38 65 59 58 86 71 129 42/34/33
30(29) -44 -39 -45 68 61 61 124 90 133 60/44/45
POE/ Salt
4n3
16(13) -25 -34 -49 62 47 57 98 66 106 48/32/52
20(17) -29 -38 -52 63 58 57 124 99 67 61/48/43
30(27) -29 -41 -54 65 60 61 156 121 120 76/59/58
POE/ Salt
5n3
20(17) -30 -33 60 55 59 52 29/25
30(27) -32 -36 -56 60 57 55 74 65 125 36/32/30
Tm was taken at peak
The weight loss of different POE/salt complexes is presented in figure 3.23 as a
function of temperature. It is observed in the thermogram the degradation of electrolytes
based on salt 3 takes place in many degradation steps (at least, 3 steps) for the total weight
loss. The percentage weight loss is 80 %, and it start at 260 °C. How already shown on study

Chapter III :Aliphatic Lithium Salts based on Sulfonate and Sulfonylimide Oligoether
157
of the salt degradation, the degradation temperature of the salt increase significantly when the
I is replaced by H (salt 4n1, salt 4n3). The degradation temperature of the polymer
electrolytes follows the same order as that reported on the salts. Indeed the weight loss starts
at higher temperature when the salt is incorporated in the POE. Thus, the weight loss of
POE/salt 4n1 starts at 320 °C while POE/salt 4n3 starts at 340 °C, the last close to the POE
host polymer.
Figure 3.23. (a) Thermogravimetric curves of various POE/aliphatic salt membranes at O/Li
=30, under argon with heating rate of 5 °C/min and (b) their first weight loss derivatives.
0 50 100 150 200 250 300 350 400 450 500 550
-100
-80
-60
-40
-20
0
Weig
ht lo
ss (
%)
Temperature (°C)
salt 3n1
salt 4n3
POE without salt
POE+ salt 3n1
POE+ salt 4n1
POE+ salt 4n3
100 200 300 400 500
-0.8
-0.6
-0.4
-0.2
0.0
We
igh
t lo
ss d
eriva
tive (
%/°
C)
Temperature (°C)
POE without salt
POE+salt 3n1
POE+salt 4n1
POE+salt 4n3
(a)
(b)

Chapter III :Aliphatic Lithium Salts based on Sulfonate and Sulfonylimide Oligoether
158
III.4.2.Mechanical properties
Figure 3.24 (a) shows the variation of storage modulus at 1 Hz as a function of
temperature for POE, POE/LiTPSN and POE/salt 4 (n=1 and n=3) for ratio O/Li= 20. The
elastic storage modulus E’ at -100°C was normalized at one constant value (approximately 3
MPa) with the aim of minimizing the effect from the difference of the thickness of each
sample.
If we compare the curve of pure POE (Figure 3.24.a), POE/salt LiTPSN, POE/salt 4n1 and
POE/salt 4n3 we observed (i) the Tα of POE is lower than that of the membranes based on
salts, (ii) the Tα of electrolyte POE/ LiTPSN is the highest (iii) the Tα of electrolytes POE/
salt 4 are lower than that of POE/LiTPSN and decrease slightly with the increase of n from
mPEG (iv) the electrolytes based on LiTPSN melt at similar temperature as POE while the
electrolytes based on salts 4 salts melt at lower temperature (v) the storage modulus drop
dramatically after the Tα in the case of electrolyte POE/salt 4n1 and 4n3 while it the case of
POE/LiTPSN is similar to POE. All these observation leads to the conclusion the bonding of a
mPEG to the anion change significantly the interactions salt- host polymer (POE). The
dramatic decrease of storage modulus after Tα can be explaining by a higher content of
amorphous phase due to the contribution of the salt.
The results corroborate with those obtained by DSC in the first heating scan, where the Tg of
POE<POE+LiTPSN< POE+salt4n1<POE+salt 4n3 while Tm and H are opposite (POE>
POE+LiTPSN >POE+salt4n1>POE+salt 4n3)
3.8

Chapter III :Aliphatic Lithium Salts based on Sulfonate and Sulfonylimide Oligoether
159
Figure 3.24. Storage modulus and tan in a function of temperature for (a) POE, POE+
LiTPSN, POE +salt 4n1, POE +salt4n3 and (b) POE+salt 3n1 and POE+salt 4n1 at O/Li=20.
The same behavior is observed for the salt 3n1, however the storage modulus and the Tα are
slightly lower as compared to those of salt 4n1.
As regards the impact of the bonding of mPEG on the salt 5n3 (comparison between the POE
+LiTPSM and POE+salt 5n3) the effect is minor as compare with that obtained on sulfonate.
-100 -80 -60 -40 -20 0 20 40 60 80 100
1
10
100
1000
Sto
rage M
odulu
s (
MP
a)
Temperature (°C)
POE without salt
POE+ LiTPSN
POE+ salt 4n1
POE+ salt 4n3
0.0
0.2
0.4
0.6
-100 -80 -60 -40 -20 0 20 40 60 80 100
1
10
100
1000
Sto
rage M
odulu
s (
MP
a)
Temperature (°C)
POE without salt
POE+salt 3n1
POE+salt 4n1
0.0
0.2
0.4
0.6
0.8
1.0
(a)
(b)
Tan
Tan

Chapter III :Aliphatic Lithium Salts based on Sulfonate and Sulfonylimide Oligoether
160
Moreover, the Tα and storage modulus increase when mPEG n=3 is bonded to the salt, in this
is opposite as compared to the behavior of salt based on aliphatic sulfonate (salt 3 and salt 4).
It should be mentioned the LiTPSM impact much more the thermo-mechanical properties of
POE as compare to the LiTPSN how it can be seen from the figure 3.25.
Figure 3.25. Storage modulus and tan in a function of temperature for (a) POE, POE+
LiTPSM, POE +salt 5n3 at O/Li= 20.
Now, if we compare the POE electrolyte based on the salt 2n3 (aromatic salt chapter
2) with POE electrolyte doped with salt 4n3 (same anion and same mPEG lengths) (figure
3.26) we can conclude the moiety between the anion and the mPEG influence significantly the
Tα and the Tm, i.e. lower values were obtained for the aliphatic salts. This behavior point out
that the presence of aromatic ring in the salt induce both (i) a higher stiffness of the complex
(POE/salt) and (ii) lower impact on crystallization degree of the POE host polymer.
-100 -80 -60 -40 -20 0 20 40 60 80 100
0.1
1
10
100
1000
10000
Sto
rage M
odulu
s (
MP
a)
Temperature (°C)
POE without salt
POE+LiTPSM
POE+salt 5n3
0.0
0.2
0.4
0.6
0.8
1.0
1.2
Tan

Chapter III :Aliphatic Lithium Salts based on Sulfonate and Sulfonylimide Oligoether
161
-100 -80 -60 -40 -20 0 20 40 60 80 100
1
10
100
1000
10000
Sto
rag
e m
od
ulu
s (
MP
a)
Temperature (°C)
salt 2n3 (aromatic)
salt 4n3 (aliphatic)
0,0
0,2
0,4
0,6
0,8
1,0
Ta
n D
elta
(°)
Figure 3.26. Comparison of mechanical properties between aromatic (salt 2n3) and aliphatic
(salt 4n3) lithium salts at the concentration (O/Li) =20.
III.4.3.Conductivity
The conductivity as function of 1000/T of different polymer electrolytes based on
aliphatic Li salts modified with mPEG are presented in the Figure 3.27 (a,b,c,d). To evidence
the impact of the mPEG the Arrhenius plots of salt LiTPSN and LiTPSM are added. The
figure 3.27 (a) pointed out that both mPEG modified salts (salt 3n1, and salt 4n1) show
greater conductivities for both concentration (O/Li =20 and O/Li 30) as compared to the
electrolyte based on POE+LiTPSN. The best conductivity value is 3.3×10⁻⁴ S/cm at 70 °C for
POE/salt 4n1 electrolyte at O/Li= 20 which is slightly higher than that of POE/salt 3n1
electrolyte. For both salts (salt 3n1 and salt 4n1) the conductivities of electrolytes are slightly
higher for O/Li =20 as compared to those of O/Li=30.
Similar to mPEG modified sulfonic salt, the bonding of mPEG to LiTPSM anion
improve their conductivities, thus the polymer electrolytes based on salt 5n3 give higher
conductivities than those of electrolytes based on LiTPSM (Figure 3.27 b). Concerning the
increase of n of mPEG, greater conductivity was obtained in the case of salt 4 when n was
increased from 1 to 3 (figure 3.27 c), especially after the recrystallization temperature. This
Tan

Chapter III :Aliphatic Lithium Salts based on Sulfonate and Sulfonylimide Oligoether
162
behavior is in agreement with the DSC results where a lower Tg was obtained for the polymer
electrolytes based on salt 4n3 and is similar to that reported on the salt 2 on chapter 2.
Now if we compare the electrolytes of mPEG modified sulfonimide (salt 5) and
sulfonate (salt 3, salt 4) the first exhibits higher conductivities. However, the gap between the
conductivities at different temperatures are much lower than observed between the
electrolytes based on salts LiTPSN and LiTPSM (figure 3.27 d).
Figure 3.27. Comparison of conductivity of polymer electrolyte: (a) POE/ salt 3n1 and POE/ salt 4n1, O/Li =
20 and 30 and POE/LiTPSN O/Li =20; (b) ) POE/ salt 5n3 and POE/LiTPSM at the concentration, O/Li = 20
(c) POE/ salt 4n3, POE/ salt 4n1 and POE/LiTPSN, O/Li = 20 (d) ) POE/ salt 5n3, POE/ salt 4n3,
POE/LiTPSM and POE/LiTPSN, O/Li = 20.
10-8
10-7
10-6
10-5
10-4
10-3
2.9 3 3.1 3.2 3.3 3.4 3.5
salt 3n1 O/Li = 30salt 4n1 O/Li = 30
salt 3n1 O/Li =20
salt 4n1 O/Li =20
LiTPSN O/Li =20
1000/T (K-1)
10-6
10-5
10-4
10-3
2.9 3 3.1 3.2 3.3 3.4 3.5
salt LiTPSM
salt 5n3
1000/T (1/K)
10-8
10-7
10-6
10-5
10-4
10-3
2.9 3 3.1 3.2 3.3 3.4 3.5
LiTPSN
salt 4n1
salt 4n3
1000/T (1/K)
10-8
10-7
10-6
10-5
10-4
10-3
2.9 3 3.1 3.2 3.3 3.4 3.5
salt 4n3salt 5n3
LiTPSNLiTPSM
1000/T (1/K)
(a) (b)
(c) (d)

Chapter III :Aliphatic Lithium Salts based on Sulfonate and Sulfonylimide Oligoether
163
In figure 3.28 the Arrhenius plots of two electrolytes, i.e. POE/salt 2n3 and POE/salt
4n3 are represented. Both salts contain the same mPEG (n =3) bonded to perfluorosulfonate
anion. The electrolytes of salt 4n3 exhibit at least 2 times higher conductivities than polymer
electrolyte of salt 2n3. These results point out the presence of aromatic ring in the structure of
the salt might increase the viscosity of the polymer electrolyte and thus decrease the
conductivities. This hypothesis is sustained by the results on the DSC and DMA analysis.
Figure 3.28. Comparison of conductivity of POE/salt 2n3 and POE/salt 4n3 at the
concentration, O/Li = 20.
III.4.4.Diffusion coefficient
The self-diffusion coefficients of anion D- (D19F) and of Li+, D+ (D7Li) in POE polymer
electrolyte determined by PFG-NMR are gathered in the table 3.7. To evaluate the impact of
mPEG on the diffusion coefficients the salt LiTPSM and LiTPSN were added in table 3.7.
It can be seen the diffusion coefficients of anions are higher than those of Li+ for all the salts.
However the values of D- decrease when the anion LiTPSM or LiTPSN is modified with
mPEG. The values decrease with the increase of anion size, thus the lowest value in the case
of perfluorinated salt are done by salt 4n3 and salt 3n1. As regarding the self-diffusion
coefficient of the lithium, excepting the salt 3n1, higher values were obtained when the anion
10-8
10-7
10-6
10-5
10-4
10-3
2.9 3 3.1 3.2 3.3 3.4 3.5
salt 4n3salt 2 n3
1000/T (1/K)

Chapter III :Aliphatic Lithium Salts based on Sulfonate and Sulfonylimide Oligoether
164
is modified with mPEG. The lower diffusion of anion in the case of electrolyte based on salt
3n1 is probably due to the interaction of Li with the I from the anion. It is surprising to
observe the D+ values of salt 4n1, 4n3 and 5n3 are very close. This result point out the D+ is
independent on the length and nature of anions discussed here (sulfonate or sulfonimide). We
mention also the self-diffusion coefficient of both anion and cation of aliphatic salt polymer
electrolytes are higher as compared to those of aromatic salt (salt 2, chapter 2).
Table 3.7 Comparison of diffusion coefficients of different polymer electrolytes determined
by PFG-NMR at 110°C
POE/Salt LiTPSM LiTPSN Salt 3n1 Salt 4n1 Salt 4n3 Salt 5n3
O/Li 30 30 30 30 30 30
D 19F(cm2 s-1) 3.9×10⁻⁷ 2.49×10⁻⁷ 1.98×10⁻⁷ 2.40×10⁻⁷ 2.00×10⁻⁷ 3.00×10⁻⁷
D 7Li(cm2 s-1) 1.00×10⁻⁷ 1.4×10⁻⁷ 1.27×10⁻⁷ 1.7×10⁻⁷ 1.8×10⁻⁷ 1.7×10⁻⁷
Nernst (S cm-1) 1×10⁻³ 8.9×10⁻⁴ 7×10⁻⁴ 8.9×10⁻⁴ 7.9×10⁻⁴ 9.7×10⁻⁴
exp (S cm-1) 3.2×10⁻⁴ 1.9×10⁻⁴ 4.7×10⁻⁴ 4.6×10⁻⁴ 4.7×10⁻⁴ 6.5×10⁻⁴
%dissociation 30 22 67 51 59 66
By applying the Nernst–Einstein equation, starting from the self-diffusion coefficient
we can calculate the conductivity. The densities of different salts were obtained by applying
the same equation (equation 5 from chapter 2).
LiPST
APEG
APEG
APEG
PEGsalt
MM
M
MM
M ** (5)
where MPEG et PEG the molecular weight and density of mPEG used in the synthesis
of salt, MA is the molecular weight of anion (LiTPSN or LiTPSM) et A is the density of
LiTPSN or LiTPSM measured with a pycnometer (1.80 and 1.83 g/cm3 respectively). The
values of density of different salts are gathered in Table 3.8 and the calculated values of
conductivity of salt 4n3 and 5n3 are presented in Table 3.7.
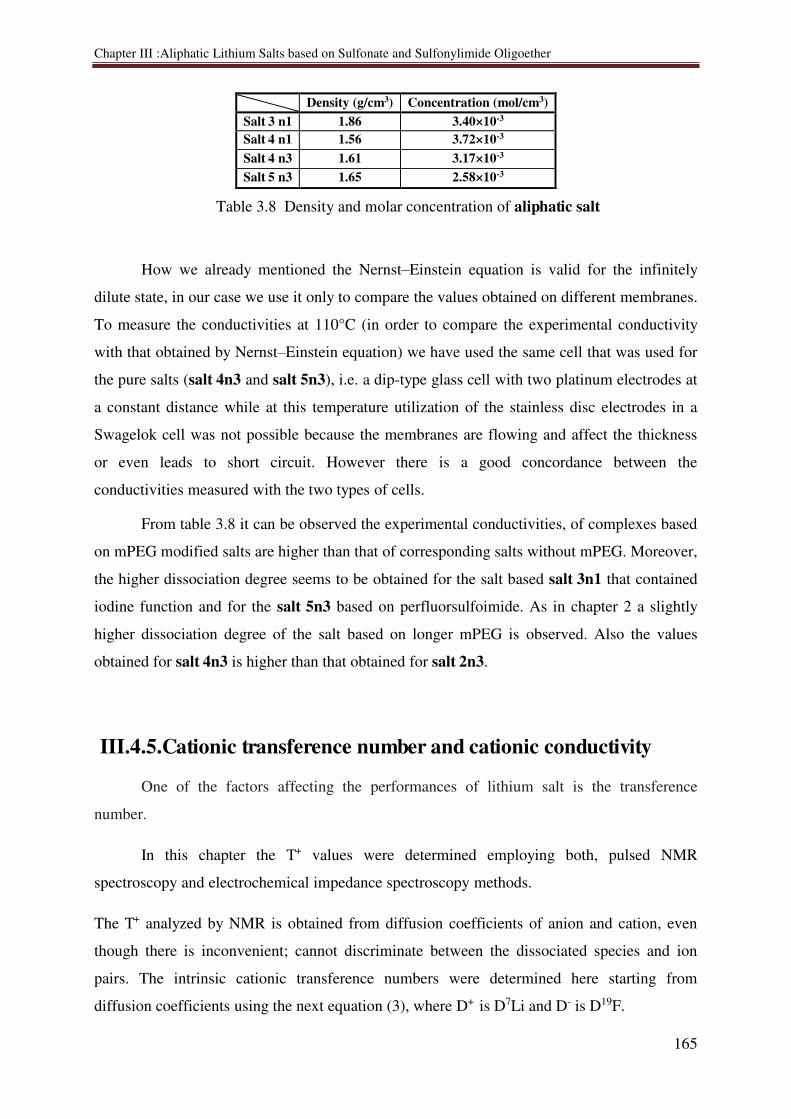
Chapter III :Aliphatic Lithium Salts based on Sulfonate and Sulfonylimide Oligoether
165
Density (g/cm3) Concentration (mol/cm3)
Salt 3 n1 1.86 3.40×10⁻³
Salt 4 n1 1.56 3.72×10⁻³
Salt 4 n3 1.61 3.17×10⁻³
Salt 5 n3 1.65 2.58×10⁻³
Table 3.8 Density and molar concentration of aliphatic salt
How we already mentioned the Nernst–Einstein equation is valid for the infinitely
dilute state, in our case we use it only to compare the values obtained on different membranes.
To measure the conductivities at 110°C (in order to compare the experimental conductivity
with that obtained by Nernst–Einstein equation) we have used the same cell that was used for
the pure salts (salt 4n3 and salt 5n3), i.e. a dip-type glass cell with two platinum electrodes at
a constant distance while at this temperature utilization of the stainless disc electrodes in a
Swagelok cell was not possible because the membranes are flowing and affect the thickness
or even leads to short circuit. However there is a good concordance between the
conductivities measured with the two types of cells.
From table 3.8 it can be observed the experimental conductivities, of complexes based
on mPEG modified salts are higher than that of corresponding salts without mPEG. Moreover,
the higher dissociation degree seems to be obtained for the salt based salt 3n1 that contained
iodine function and for the salt 5n3 based on perfluorsulfoimide. As in chapter 2 a slightly
higher dissociation degree of the salt based on longer mPEG is observed. Also the values
obtained for salt 4n3 is higher than that obtained for salt 2n3.
III.4.5.Cationic transference number and cationic conductivity
One of the factors affecting the performances of lithium salt is the transference
number.
In this chapter the T+ values were determined employing both, pulsed NMR
spectroscopy and electrochemical impedance spectroscopy methods.
The T+ analyzed by NMR is obtained from diffusion coefficients of anion and cation, even
though there is inconvenient; cannot discriminate between the dissociated species and ion
pairs. The intrinsic cationic transference numbers were determined here starting from
diffusion coefficients using the next equation (3), where D+ is D7Li and D- is D19F.

Chapter III :Aliphatic Lithium Salts based on Sulfonate and Sulfonylimide Oligoether
166
+ = 帖+帖++ 帖− (3)
The cationic conductivities are calculated with the equation: + = T+ where is
experimental conductivity. (Table 3.9). The electrochemical measurements are based on the
method developed by Sorensen et Jacobsen [19], the method was described in the chapter 2.
Table 3.9 Transference number (T+), conductivity () and cationic conductivity (T+) for salt
3n1, salt 4n1, salt 4n3 and salt 5n3 in POE matrix with two different investigating methods at
110°C
Complex O/Li
(S/cm)
PFG-NMR EIS
T+ +
(S/cm)
T+ +
(S/cm)
POE/LiTPSM 30 3.6x10⁻⁴ 0.20 0.7x10⁻⁴ 0.19 0.68×10⁻⁴
POE/LiTPSN 30 1.9×10⁻⁴ 0.36 0.7×10⁻⁴ 0.46 0.87×10⁻⁴
POE/salt 3n1 30 4.7×10⁻⁴ 0.39 1.8×10⁻⁴ 0.35 1.65×10⁻⁴
POE/salt 4n1 30 4.6×10⁻⁴ 0.40 1.84×10⁻⁴ - -
POE/salt 4n3 30 4.7×10⁻⁴ 0.44 2.1×10⁻⁴ 0.60 2.06×10⁻⁴
POE/salt 5n3 30 6.5×10⁻⁴ 0.35 2.3×10⁻⁴ 0.22 1.43×10⁻⁴
In the case of sulfonate anion the T+ increase with the increase of n of mPEG.
However despite the higher molecular weight of anion of salt 3n1, the T+ is lower than that of
salt 4n1. Moreover, by electrochemical measurements the T+ of the salt 3n1 seems to be
lower than that of the salt LiTPSN. The presence of iodine in the salt structure has slow down
the migration of Li. We can note also the T+ values of LiTPSN and salt 4n3 are higher when
they are calculated from electrochemical measurements as compared to NMR, while for the
LiTPSM and salt 5n3 the reverse is obtained.
The bonding of mPEG to the anion leads to polymer electrolytes with better cationic
conductivities and it seems the values are close or even higher than that obtained with POE
and TFSI (1.74×10⁻⁴ S/cm).

Chapter III :Aliphatic Lithium Salts based on Sulfonate and Sulfonylimide Oligoether
167
III.5. Membrane elaboration based on NPC host
polymer doped with aliphatic lithium salt
The cross-linked films (NPC) were obtained by the UV irradiation of the casted films.
In this part, we selected to study only the salt 4n3 and 5n3. Thus the NPC membranes were
performed by the irradiation of a film (30 s and 1 min) obtained after the evaporation of
acetonitrile (in the glove box) from the mixture of LPC, salt 4n3 or 5n3 and initiator
(IRGACURE® 2959, CIBA).
The membranes were characterized by various methods to study and understand their
physical, chemical, mechanical and electrochemical behavior (discussed in the following
section).
O
O
O22
O
O
O22
LPC1000
n
O
OH
O
HO
IRGACURE® 2959
UV, Lithium salt
Crosslinked POE/salt (NPC/salt)
Figure 3.29. Schematic draw of Crosslinked POE (NPC).
III.5.1.Thermal characterizations
Table 3.10 summarizes the Tg, the Tm and the H obtained by DSC measurements for
the host polymer NPC and its electrolytes. All the data presented in this table were measured
during the first heating from -100 to 60 °C (Tg1, Tm1, H1) and the second heating after a 1st
Chapter III :Aliphatic Lithium Salts based on Sulfonate and Sulfonylimide Oligoether
168
heating up to 60°C followed by a quenching (cooling ramp 50°C/min) (Tg2, Tm2, H2). The
thermograms showed a crystallization peak before the fusion of crystalline phase. The
samples still exhibited the semi-crystalline behavior but the melting temperature decreased as
compared to POE and to the 1st heating.
For NPC+ salt complexes, at the same salt concentration and 30 s irradiation time we
observed lower Tg, Tm and H for the electrolytes based on salt 5n3 for the both heating
cycles. The Tg and Tm values of electrolytes are higher respectively lower than the pure NPC.
The polymer electrolytes irradiated more time, i.e. 1 min show lower Tg and Tm as compared
with those irradiated 30 s. The longer irradiation time should enhance the cross-linking
density that usually induces a Tg increase. In our case, obtaining Tg with lower values can be
explained by the significant crystallinity decrease, which counterbalances the stiffening
produced by higher crosslinking density. Indeed the formation of the cross-linking bridges
creates disorder and prevents the crystallization of the POE segments of NPC.
The evolution of the Tg with the concentration doesn’t follow the same trend as the
electrolytes based on POE, i.e. increase of Tg with the decrease of O/Li. This can be
explaining by the fact the crosslinking density might be affected by the salt concentration.

Chapter III :Aliphatic Lithium Salts based on Sulfonate and Sulfonylimide Oligoether
169
Table 3.10 (a) Glass transition temperature (Tg) melting temperature (Tm) and fusion enthalpy
(H) of NPC/salt 4n3 and salt 5n3 complexes in the cross-linking times 30s
O/Li
(O/Li –n)
Tg1
(°C)
Tg2
(°C)
Tm1
(°C)
Tm2
(°C)
H1NPC
(J/g)
H2NPC
(J/g)
NPC ∞ -52 -64 44 38 58 38
NPC/salt 4n3 20(17) -43 -55 39 32 35 28
30(27) -44 -53 40 32 38 28
40(37) -43 -63 39 30 52 44
NPC/salt 5n3 20(17) -49 -63 29 23 0 16
30(27) -48 -63 39 32 35 27
40(37) -49 -62 40 33 41 33

Chapter III :Aliphatic Lithium Salts based on Sulfonate and Sulfonylimide Oligoether
170
Table 3.10 (b) Glass transition temperature (Tg) melting temperature (Tm) and fusion enthalpy
(H) of NPC/salt 4n3 and salt 5n3 complexes in the cross-linking times 1minute
O/Li
(O/Li-n)
Tg1
(°C)
Tg2
(quenching)
(°C)
Tm1
(°C)
Tm2
(°C)
H1NPC
(J/g)
H2NPC
(J/g)
NPC ∞ -51 -64 32 21 52 33
NPC/salt 4n3 20(17) -46 -64 38 26 23 18
30(27) -45 -65 39 33 52 31
40(37) -45 -64 32 33 40. 39
NPC/salt 5n3 20(17) -49 -61 34 20 2 11
30(27) -50 -63 39 32 14 12
40(37) -53 -62 38 32 19 11
O/Li-n: the O/Li taking in account only the OE from NPC. H1NPC and H2NPC : fusion entralpy calculated by the consideration of NPC mass in the first and second cycles
respectively
Figure 3.30 shows the TGA curves of salt 4n3, NPC+ salt 2n3, NPC+ salt 5n3. Similarly to
the POE + salt electrolytes we observed an increase of Td when the salt is incorporated in
NPC matrix and its values are close to that of pure NPC matrix.

Chapter III :Aliphatic Lithium Salts based on Sulfonate and Sulfonylimide Oligoether
171
Figure 3.30. TGA curves for NPC/salt 4n3 and NPC/salt 5n3 complexes.
It was found the salt concentration and irradiation time do not affect the decomposition of the
sample.
III.5.2.Mechanical properties
Figure 3.31 (a, b) shows the variation of storage modulus at 1 Hz as a function of
temperature for different NPC electrolytes in order to put in evidence the impact on mPEG
(a,b), of the irradiation time (c) and anion nature (d). By analyzing the figure 3.31 (a) we
observed the mPEG bonded to the anion (LiTPSN) induces a decrease of storage modulus
after the Tα, the value of Tα as well storage modulus on plateau (after the NPC melting). The
impact on Tα and storage modulus before the melting point is similar to that of POE, however
the impact of the mPEG bonded on the anion is less dramatic. However the Tm seems to be
not affected by the presence of mPEG.
Concerning the impact of mPEG on the mechanical behavior of electrolytes based on
LiTPSM (figure 3.31 b) anion the curves are very similar before the rubbery plateau. On the
rubbery the storage modulus is almost 0.5 MPa for the NPC+LiTPSM electrolyte while for
NPC +salt 5n3 is more than 1 MPa. Hence for the polymer electrolytes based on salt 5n3 we
can suppose a higher crosslinking degree.
0 50 100 150 200 250 300 350 400 450 500 550
-100
-80
-60
-40
-20
0
Weig
ht lo
ss (
%)
Temperature (°C)
salt 4n3, O/Li= 20, 30 s
salt 4n3, O/Li= 30, 30 s
salt 4n3, O/Li= 30, 1 min
salt 5n3, O/Li= 30, 30 s
salt 4n3
salt 5n3
NPC, 30s

Chapter III :Aliphatic Lithium Salts based on Sulfonate and Sulfonylimide Oligoether
172
If we compare the irradiation time, the membranes irradiated 1 min show higher
storage module after the NPC melting (on the rubbery plateau) and thus how expected a
higher crosslinking degree (figure 3.31c).
-100 -50 0 50 100
0.1
1
10
100
1000
Sto
rag
e m
od
ulu
s (
MP
a)
Temperature (°C)
LiTPSN, 30 s
salt 4n3, 30 s
0.0
0.2
0.4
0.6
0.8
1.0
-100 -50 0 50 100
0.1
1
10
100
1000
10000
Sto
rag
e M
od
ulu
s (
MP
a)
Temperature (°C)
LiTPSM, 30 s
salt 5n3, 30 s
0.0
0.2
0.4
0.6
0.8
1.0
(a)
(b)
Tan
Tan

Chapter III :Aliphatic Lithium Salts based on Sulfonate and Sulfonylimide Oligoether
173
Figure 3.31. Storage modulus vs temperature for various polymer electrolytes based on NPC
host polymer at O/Li= 30 in different crosslinking times.
(a) NPC/LiTPSN and NPC/salt 4n3 for ratio O/Li= 30, irradiation time 30 s, (b)
NPC/LiTPSM and NPC/salt 5n3 for ratio O/Li= 30, irradiation time 30 s, (c) NPC/salt 4 n3
and NPC/salt 5n3 O/Li=30, irradiation time 30 s and 1 min (d) NPC/salt 4n3 and NPC/salt
5n3 O/Li=30, irradiation time 30s.
-100 -50 0 50 100
0.1
1
10
100
1000
Sto
rage M
odulu
s (
MP
a)
Temperature (°C)
salt 4n3, 30 s
salt 4n3, 1 min
0.0
0.2
0.4
0.6
0.8
-100 -50 0 50 100
0.1
1
10
100
1000
10000
Sto
rag
e m
od
ulu
s (
MP
a)
Temperature (°C)
salt 4n3, 30s
salt 5n3, 30s
0.0
0.2
0.4
0.6
0.8
1.0
1.2
(c)
(d)
Tan
Tan

Chapter III :Aliphatic Lithium Salts based on Sulfonate and Sulfonylimide Oligoether
174
With regard to the difference of anion function, the Tα of NPC/salt 5n3 is less than that of
NPC/salt 4n3 and this in agreement with the Tg obtained by DSC on the first heating.
However after the Tα an increase of storage modulus is observed for the electrolyte
NPC+salt5n3, due to the membrane recrystallization. The storage modulus on the rubbery
plateau is higher for the electrolyte based on salt 5n3 due probably to the higher crosslinking
degree. This behavior (recrystallization + higher storage modulus on rubbery plateau) can
explain why the Tg2 measured by DSC is higher for the polymer electrolytes based on salt 5n3
as compared to salt 4n3 why for the polymer electrolytes irradiated 30 s the reverse was
observed.
III.5.3.Conductivity
Host polymer
The effects of the host polymer (POE, NPC) on the conductivities of the electrolytes,
based on salt 4n3 and salt 5n3, are compared in figure 3.32. The conductivities of the
electrolytes based on salt 4n3 + POE and salt 5n3 + POE are slightly higher than those of
membranes based on NPC above the melting temperature, Tm, while, below Tm, the
conductivities of NPC based electrolytes are roughly 10 times higher. The much lower
crystallinity and Tm of NPC explain this conductivity gain at low temperatures.
Figure 3.32. Comparison of conductivity between salt 4n3 and salt 5n3 in POE and NPC
matrix.
2,5 2,6 2,7 2,8 2,9 3,0 3,1 3,2 3,3 3,4 3,5
1E-7
1E-6
1E-5
1E-4
1E-3
Co
nd
uctivity (
S/c
m)
1000/T (K-1)
POE/salt 4n3
POE/salt 5n3
NPC/salt 4n3
NPC/salt 5n3

Chapter III :Aliphatic Lithium Salts based on Sulfonate and Sulfonylimide Oligoether
175
Impact of mPEG
To evidence the impact of the mPEG on the conductivity the NPC electrolytes based on the
LiTPSN, LiTPSM, salt 4n3 and salt 5n3 at O/Li=20 are drawn on the figure 3.33. The
bonding the mPEG chain on LiTPSN and LiTPSM show two opposite effects. Thus in the
case of anion LiTPSN the conductivity increase when mPEG is added to the anion. This result
is similar to that obtained with POE host polymer electrolytes. Contrarily, the adding of
mPEG to LiTPSM seems to decrease the conductivity and this result is opposite to that
observed on this anion in POE host polymer electrolytes. One explanation on this opposite
behavior could be the higher crosslinking degree of the film based on salt 5n3 as compared to
the film based LiTPSM and a decrease of POE chain mobility how prove the DMA analysis.
The higher crosslinking degree can induce conductivity decreasing.
Figure 3.33. Conductivity of salt 4n3 and salt 5n3 compared with LiTPSN and LiTPSM in
NPCmembranes (O/Li=20)
2.6 2.8 3.0 3.2 3.4
1E-6
1E-5
1E-4
1E-3
Conductivity (
S/c
m)
1000/T (K-1)
NPC/salt 4n3
NPC/salt 5n3
NPC/LiTPSM
NPC/LiTPSN

Chapter III :Aliphatic Lithium Salts based on Sulfonate and Sulfonylimide Oligoether
176
Impact of irradiation time
From the figure 3.34, which represents the influence of the irradiation time on the
conductivity, a conductivity decrease can be observed upon an increase in irradiation time that
can be ascribed to an increase of crosslink density.
Figure 3.34. Conductivity of salt 4n3 and salt 5n3 in NPC with different crosslinking time 30
seconds and 1 minute, O/Li=20.
In figure 3.35 the Arrhenius plots of two electrolytes, i.e NPC/salt 2n3 and NPC/salt
4n3 are represented. Both salts contain the same mPEG (n =3) bonded to perfluorosulfonate
anion. The electrolytes of salt 4n3 exhibit at least 2 times higher conductivities than polymer
electrolyte of salt 2n3. These results are similar with those obtained on polymer electrolytes
based on these salts and POE and point out the presence of aromatic ring in the structure of
2.6 2.8 3.0 3.2 3.4
1E-6
1E-5
1E-4
1E-3
Co
nd
uctivity (
S/c
m)
1000/T (K-1)
NPC/salt 4n3, 30s
NPC/salt 4n3, 1 min
NPC/salt 5n3, 30s
NPC/salt 5n3, 1 min

Chapter III :Aliphatic Lithium Salts based on Sulfonate and Sulfonylimide Oligoether
177
the salt might increase the viscosity of the polymer electrolyte and the salt dissociation degree
and thus decrease the conductivities.
Figure 3.35. Comparison of conductivity between salt 2n3 and salt 4n3 in NPC matrix at
O/Li=20.
III.6. Conclusion
The chapter 3 addresses both the new Li-conducting oligo(oxyethylene) salts and their blends
with 2 types of host polymers i.e. linear (POE) and cross-linked (NPC) . The conclusions will
therefore be shared into salts and polymer electrolytes.
Dealing with the salts
Perfluoroalkanesulfonimide and perfluoroalkanesulfonate lithium salts endowed with
a flexible ether moiety were synthesized.
Perfluoroalkanesulfonimide and perfluoroalkanesulfonate modified with mPEG with 1
and 3 OE units were successfully obtained
The addition of iodoperfluoroalkyl to an allylic bond was for the first time used for the
synthesis of lithium salt
2,6 2,8 3,0 3,2 3,4
1E-7
1E-6
1E-5
1E-4
1E-3
Co
nd
uctivity (
S/c
m)
1000/T (S/cm)
NPC/salt 2n3
NPC/salt 4n3

Chapter III :Aliphatic Lithium Salts based on Sulfonate and Sulfonylimide Oligoether
178
The addition reactions and Me3Si)3SiH-mediated intermolecular perfluoroalkylation of
alkenes are quantitative, however many problems were met during the purification
steps.
The aliphatic salt, salt 4 and salt 5 are thermally more stable than that of aromatic one.
The salts are amorphous at room temperature at n (from mPEG) =3 while in the case
of salt 2 only from n>7.
High oxidation potentials were obtained for all the salts
Dealing with the membranes
The adding of mPEG on LiTPSN has a significant impact on mechanical properties,
especially in POE polymer electrolytes.
In the case of POE electrolytes, the increase of the mPEG lengths of the salt induce:
o a Tg decrease,
o a conductivity increase ,
o a T+ increase (determined by PFG NMR)
o an increase of the salt dissociation
As compared to the aromatic salt, the aliphatic salts:
o Plasticize better the POE host polymer
o give better conductivities in POE and NPC
o have comparable or higher cationic transference number in POE
o have higher dissociation degree in POE
The polymer electrolytes based on mPEG sulfonimide aliphatic salts (salt 5n3) are the
best in term of conductivity.
The conductivity of NPC electrolytes is 10 times higher at low temperature than the
POE ones while at high temperature they are 2 times lower.
The irradiation time improve the mechanical properties; however the crosslinking
degree depends on the salt structure and salt concentration.

Chapter III :Aliphatic Lithium Salts based on Sulfonate and Sulfonylimide Oligoether
179
III.7. References
[1] E. Paillard, F. Toulgoat, C. Iojoiu, F. Alloin, J. Guindet, M. Medebielle, et al.,
J. Fluor. Chem. 134 (2012) 72 – 76.
[2] E. Paillard, Thesis, Institut Polytechnique de Grenoble, 2008.
[3] H. Zhang, C. Liu, L. Zheng, F. Xu, W. Feng, H. Li, et al., Electrochimica Acta. 133
(2014) 529 – 538.
[4] F. Alloin, D. Benrabah, J.-Y. Sanchez, J. Power Sources. 68 (1997) 372 – 376.
[5] S. Barata-Vallejo, A. Postigo, Eur. J. Org. Chem. (2012) 1889–1899.
[6] W. Qiu, D.J. Burton, J Fluor. Chem. 62 (1993) 273–281.
[7] L.F. Chen, J. Mohtasham, G.L. Gard, J Fluor. Chem. 43 (1989) 329–347.
[8] T. Takagi, T. Kanamori, J. Fluor. Chem. 132 (2011) 427 – 429.
[9] T. Yajima, K. Yamaguchi, R. Hirokane, E. Nogami, J Fluor. Chem. 150 (2013) 1–7.
[10] M. Slodowicz, S. Barata-Vallejo, A. Vazquez, N. Sbarbati Nudelman, A. Postigo,
J Fluor. Chem. 135 (2012) 137–143.
[11] M. Mortimer, P. Taylor, Chemical Kinetics and Mechanism, in: The Open University,
2002: p. 212.
[12] S. Barata-Vallejo, A. Postigo, J Org Chem. 75 (2010) 6141–6148.
[13] W.R. Dolbier, X.X. Rong, Tetrahedron Lett. 35 (1994) 6225–6228.
[14] A.E. Feiring, E.R. Wonchoba, J. Fluor. Chem. 105 (2000) 129 – 135.
[15] C.G. Cho, Y.S. Kim, X. Yu, M. Hill, J.E. Mcgrath, J. Polymer Science: Part A:
Polymer Chemistry (2006) 6007-6014.
[16] C. Chauvin, X. Ollivrin, F. Alloina, J.-F. LeNest, J.-Y. Sanchez, Electrochimica Acta.
50 (2005) 3843 – 3852.
[17] C. Chauvin, Thesis, Institut Polytechnique de Grenoble, 2005.
[18] M. Erceg, D. Jozić, I. Banovac, S. Perinović, S. Bernstorff, Thermochim. Acta. 579 (2014) 86 – 92.
[19] P.R Soeresen, T. Jacobsen, Electrochimica Acta. 27 (1982) 1671–1675.

Chapter IV : Experimental Part
180
IV. Experimental Part
This chapter will focus on the synthesis protocols of each salt and the characterization
procedure used in this research work. The detail has been divided into three main sections as
follows:
The first section will be focused on the synthesis procedures of all lithium salts, the
linear polycondensat (LPC1000) for crosslinking the network polycondensat
(NPC1000) including the characterization of salts and polymer synthesized and also
LiTPSM salt (commercially available but it is used as one of the main products for
chapter III.2)
The second section contains the detail about the film preparation and salt
concentration calculation.
The last section, the characterization for the performance investigation of those
membranes will be performed.

Chapter IV : Experimental Part
181
IV.1. Synthesis procedure of salts, linear polycondensat
(LPC1000) and their characterization methods
a) Chromatographic purification
Crude products were purified by flash column chromatography with different column
size of silica gel (stationary phase) and organic solvent system (movable phase) depending on
the polarity of product. For chromatographic purification, reagent grade solvents were used as
received.
Reactions were monitored by thin layer chromatography (TLC) using
aluminiumbacked silica gel plates (Merck, Kieselgel 60 F254). Two techniques used to
investigate TLC spots are (i) viewing under ultraviolet light at short wavelength of 254 nm
and (ii) reacting with KMnO4 solution.
b) Nuclear Magnetic Resonance (NMR)
NMR spectra were obtained on a Bruker AVANCE 300 NMR spectrometer at
frequencies of 300.12 MHz for 1H, 75 MHz for 13C and 282.39 MHz for 19F. The chemical
shift () is measured in the unit of part per million (ppm). The coupling constant (J) was
expressed in Hertz (Hz). The deuterated solvent used was (CD3)2SO-d6 (H = 2.50 ppm, C =
39.52 ppm). The substitution pattern of the different carbons was determined by a “DEPT135”
sequence. Multiplicities are reported as follows: s = singlet, d = doublet, t = triplet,
q = quadruplet, m = multiplet, dd = doublet of doublet, ddd = doublet of doublet of doublet,
td = triplet of doublet.
c) Elemental analysis
All samples were characterized the elemental analysis by Service Central d’Analyse-
Institute des Sciences Analytiques, Villeurbanne, France.

Chapter IV : Experimental Part
182
IV.1.1.Salt synthesis
Lithium perfluorosulfonate salt
Product name: lithium 1,1,2,2-tetrafluoro-2-(perfluoroethoxy)ethanesulfonate
(LiTPSN)
Formula: C4F9LiO4S
Molecular weight: 322.03
Synthesis protocol:
Perfluoro(2-ethoxyethane) sulfonic acid (from Fluorochem) (20 mmol, 3.3 ml) was
added in an aqueous solution of lithium hydroxide monohydrate (Alfa Aesar) (60 mmol, 25
ml). The mixture was stirred at room temperature for 2 h. After the solvent removal, the
residue was dissolved in acetonitrile (Sigma Aldrich), filtered and concentrated under vacuum
to afford 5.35 g of LiTPSN salt as a white solid. LiTPSN salts were further dried at 80°C for
48 h under vacuum before storing in a dry glove box.
% yield: 83%
Characterization:
19F NMR (CD3)2SO2-d6): -83.30 (t, J= 16 Hz., 2F), -87.91 (s, 3F), -89.39 (t, J= 16Hz., 2F),
-119.33 (s, 2F)
Anal. Calcd.: C, 14.92; F, 53.10; Li, 2.16; S, 9.96
Found: C, 15.08; F, 49.92; Li, 2.15; S, 9.44

Chapter IV : Experimental Part
183
Lithium perfluorosulfonimide salt
Product name: Lithium[tetrafluoro-2-(pentafluoroethoxy)ethane]-
trifluoromethanesulfonimide (LiTPSM)
Formula: C5F12LiNO5S2
Molecular weight: 453.11
Synthesis protocol:
To a solution of anhydrous 1,2-dichloroethane and perfluoro(2-ethoxyethane) sulfonyl
fluorides (13 mmol, 4.14 g) under inert atmosphere, was added freshly distilled benzylamine
(65 mmol, 7.1 ml). The mixtrure was stirred at 50 °C during 20 h and was followed by thin
layer chromatography (TLC) and 19F NMR until sulfonyl fluoride completely disappeared. At
room temperature, an aqueous HCl solution (10%) was added, and the mixture was extracted
with dichloromethane. The organic phases were dried over MgSO4, filtered and evaporated.
The residue was purified by column chromatography on silica gel with gradient eluent
(Pentane/AcOEt 1/0 to 4/1) to obtain a benzyl sulfonamide (13 mmol, 5.27 g). The second
step, a solution of dichloromethane and benzyl sulfonamide, under inert atmosphere, was
added DIEA (13 mmol, 2.3 ml) Then triflic anhydride (19.5 mmol, 3.3 ml) was added at 0°C,
the mixture was stirred for 30 min at constant temperature then 1 h at room temperature
(followed by TLC and 19F NMR). Then the products were evaporated, and the residue was
dissolved in hot pentane and the supernatant was isolated. The solvent was evaporated and the
benzyl trifluoromethanesulfonamide was obtained. The third step, a suspension of benzyl
trifluoromethanesulfonamide (12.8 mmol, 6.88 g) in ethanol (60 ml) was stirred during 8 h at
room temperature until the solution was completely soluble. An aqueous solution of lithium
hydroxide monohydrate (12.87 mmol, 540 mg) was added and the mixture was stirred at room
temperature overnight. After the solvent removal, the white residue was dissolved in diethyl
ether, filtered and concentrated under vacuum. The residue was washed with cyclohexane,

Chapter IV : Experimental Part
184
filtered and concentrated under vacuum to afford 4.5 g of LiTPSM salt as solid. LiTPSM salts
was storing in a dry glove box.
% yield: 78%
Characterization:
19F NMR (CD3)2SO2): -79.08 (s, 3F), -81.52(t, J= 18 Hz, 2F), -86.34(s, 3F),
-88.25(t, J=18 Hz, 2F), -117.29(s, 2F);
Anal. Calcd.: C, 13.25; F, 50.31; Li, 1.53; S, 14.15; N, 3.09
Found: C, 13.29; F, 47.48; Li, 1.52; S, 13.03; N, 3.16
Lithium aromatic perfluorosulfonate salts
Product name: salt 1
Formula: C15H17O6F4S2Li
Molecular weight: 440.36
Synthesis protocol:
A mixture of 2-Methoxyethanol (1 equiv.) and potassium hydroxide (3 equiv.) was
dissolved in anhydrous dichloromethane. The reaction was stirred at the room temperature for
4 hours under an argon flow. Excess amount of (E)-1,4-dibromo-2-butene (3 equiv.) was
added. The solution was then stirred for 24 hours. The resulting solution was extracted by

Chapter IV : Experimental Part
185
diethylether three times. The organic layer was concentrated under reduced pressure. The
resulting residue was purified by silica gel column chromatography using 10% diethyl ether in
CH2Cl2 as eluent to afford yellow oil (66 %). After that, the resulting yellow oil was added
under an argon atmosphere to a magnetically stirred solution of LiPST (1 equiv.) in anhydrous
THF (20 ml). The solution was heated to 60°C. The reaction progress was monitored by 19F-
NMR (appearance of C-H bonded peak of aromatic ring of salt 1 at -84.98 and -112.32 ppm).
After 72 hours, the progress was constant but it was not complete because of the hydrolyzed-
LiPST. The reaction mixture had to be treated with quantitative amount of LiH that possibly
reformed the LiPST hydrolyzed then reacted with the monobromo oligoether. After the
solvent removal, the residue was purified by silica gel flash column chromatography using 5-
10% of methanol in CH2Cl2 as eluent to eliminate unreacted substrates. The white powder
was further dried at 80°C for 48 h under vacuum before it was stored in a dry glove box.
% yield: 63 %
Characterization:
1H-NMR (DMSO-d6): 7.57 - 7.46 (m, 2H, ArCH), 7.06 - 6.97 (m, 2H, ArCH), 5.89 (td, J
= 3.9Hz, J = 2.4 Hz, 2H, CH=CH), 4.64 - 4.56 (m, 2H, CHOAr),
4.00 - 3.91 (m, 2H, CHCH2O), 3.51 - 3.39 (m, 4H, OCH2CH2),
3.23 (s, 3H, OCH3)
13C-NMR (DMSO-d6): 160.64 (s, CF2SO3), 139.06 (s, ArCHO), 131.20 (s, CF2S),
127.04 (s, ArCHS), 116.14 (s, ArCH), 115.08 (s, ArCH), 71.70 (s,
CHCH2O), 70.60 (s, CH2OCH3), 69.30(m, CHCH2O), 68.03 (s,
CH2O), 58.54 (s, CH3O)
19F-NMR (DMSO-d6): -84.89 (t, J= 7.2 Hz, 2F, CF2S), -112.60 (t, J= 7.1 Hz, 2F,
CF2SO3)
Anal. Calcd.: C, 40.91; H, 3.89; F, 17.26; Li, 1.58; S, 14.56
Found: C, 40.90; H, 3.91; F, 17.20; Li, 1.52; S, 14.30

Chapter IV : Experimental Part
186
Product name: salt 2
Synthesis protocol:
Each different length of methoxy polyethylene glycol (mPEG) (n=1, 3, 7.2, 16.3) (1
equiv.) was dissolved in anhydrous dichloromethane (30 ml) under an argon flow in the
presence of Amberlyst 21® resin. Trifluoromethanesulfonic anhydride (1.2 equiv.) was added
slowly, at 0°C. The reaction was monitored by 1H and 19F-NMR (appearance of CH2 signals
at 4.55 and 3.64 ppm for 1H-NMR and CF3 signal at -74.7 ppm in case of 19F-NMR). After
the reaction was complete, the solvent was removed by the rotary evaporator. The
CH3(OCH2CH2 )nOSO2CF3, resulting product was then added drop-wise to a solution of
LiPST (1 equiv.) in anhydrous acetonitrile (20 ml) at ambient temperature. After stirring for 1
hour, the residue was concentrated under vacuum and was then purified by silica gel flash
column chromatography using 20-100% of acetonitrile in dichloromethane as eluent. The
white powder or yellow viscous liquid product was further dried at 80°C for 48 h under
vacuum before it was stored in a dry glove box.
Table 5.1 Summary of the percentage of yield for each salt in a family of salt 2
n 1 3 7.2 16.3
% yield 56 90 67 50
n = repeating oxyethylene unit
With n = 1
Product name: salt 2n1
Formula: C11H11O5F4S2Li
Molecular weight: 370.27

Chapter IV : Experimental Part
187
Characterization:
1H-NMR (DMSO-d6) 7.57 - 7.48 (m, 2H, ArCH), 7.07 - 6.99 (m, 2H, ArCH),
4.15 (dd, J = 5.4 Hz, 3.7 Hz, 2H, CH2OAr), 3.62 (dd, J = 5.4 Hz,
3.8 Hz, 2H, CH2OCH3), 3.32 (s, 3H, OCH3)
13C-NMR (DMSO-d6) 160.94 (s, CF2SO3), 139.07 (s, ArCHO), 126.98 (s,CF2S), 124.10
(s, ArCHS), 117.77 (s, ArCH), 115.22 (s, ArCH), 115.05(s, ArCH),
114.90 (s, ArCH), 70.67 (s, CH2OCH3), 67.65 (s, CH2O), 58.62
(s, CH3O)
19F-NMR (DMSO-d6) -84.89 (t, J = 7.2 Hz, CF2S), -112.57 (t, J = 7.1 Hz,CF2SO3)
Anal. Calcd.: C, 35.68; H, 2.99; F, 20.52; Li, 1.87; S, 17.32
Found: C, 35.37; H, 2.90; F, 20.84; Li, 1.80; S, 17.64
With n = 3
Product name: salt 2n3
Formula: C15H19O7F4S2Li
Molecular weight: 458.37
Characterization:
1H-NMR (DMSO-d6) 7.51 (d, J = 8.4 Hz, 2H, ArCH), 7.03 (d, J= 8.5 Hz, 2H, ArCH),
4.14 (s, 2H, CH2OAr), 3.75 - 3.34 (m, 12H, OCH2CH2OCH3),
3.23 (s, 3H, OCH3)
19F-NMR (DMSO-d6) -84.93 (t, J = 7.1 Hz, CF2S), -112.64 (t, J = 7.0 Hz,CF2SO3)
With n = 7.2
Product name: salt 2n7
Formula: CH3(OCH2CH2)7.2OC6H4SCF2CF2SO3Li
Molecular weight: 643

Chapter IV : Experimental Part
188
Characterization:
1H-NMR (DMSO-d6) 7.56 - 7.45 (m, 2H, ArCH), 7.06 - 6.98 (m, 2H, ArCH), 4.16 -
4.12 (m, 2H, CH2OAr), 3.64 - 3.36 (m, 28H, OCH2CH2OCH3),
3.22 (s, 3H, OCH3)
13C-NMR (DMSO-d6) 160.94 (s, CF2SO3), 139.06 (s, ArCHO), 124.16 (s, CF2S), 115.97
(s, ArCHS ), 115.05 (s, ArCH), 71.74 (s, CH2OCH3), 70.25 (t,
J=60 Hz, J=84 Hz, CH2O), 69.24 (s, CH2O), 67.90 (s, CH2O),
58.51 (s, CH3O)
19F-NMR (DMSO-d6) -84.90 (t, J = 7.2 Hz, CF2S), -112.60 (t, J = 7.1 Hz,CF2SO3)
Anal. Calcd.: C, 43.67; H, 5.57; F, 11.82; Li, 1.09; S, 9.95
Found: C, 43.57; H, 5.44; F, 11.54; Li, 1.07; S, 9.13
With n = 16.3
Product name: salt 2n16
Formula: CH3(OCH2CH2)16.3OC6H4SCF2CF2SO3Li
Molecular weight: 1043
Characterization:
1H-NMR (DMSO-d6) 7.55 - 7.45 (m, 2H, ArCH), 7.06 - 6.96 (m, 2H, ArCH), 4.13 (dd,
J = 5.4 Hz, J = 3.8, 2H, CH2OAr), 3.74 (dd, J = 5.3 Hz, J = 3.9
Hz, 2H, CH2OCH3), 3.61 - 3.37 (m, 61H, OCH2CH2OCH3), 3.23
(s, 3H, OCH3)
13C-NMR (DMSO-d6) 160.94 (s, CF2SO3), 139.06 (s, ArCHO), 124.10 (s, CF2S),
115.97 (s, ArCHS), 115.05 (s, ArCH ), 71.76 (s, CH2OCH3), 70.26
(t, J= 56 Hz, J=84 Hz, CH2O), 69.24 (s, CH2O), 67.90 (s,
CH2O), 58.51 (s, CH3O)
19F-NMR (DMSO-d6) -84.90 (t, J = 7.2 Hz, CF2S), -112.60 (t, J = 7.1 Hz,CF2SO3)
Anal. Calcd.: C, 47.86; H, 6.92; F, 7.29; Li, 0.67; S, 6.14
Found: C, 47.75; H, 7.06; F, 7.33; Li, 0.57; S, 5.93

Chapter IV : Experimental Part
189
Lithium aliphatic perfluorosulfonate salts
Product name: salt 3
Formula: C10H12O6F8SILi
Molecular weight: 546.10
Synthesis protocol
A mixture consisting of 2-Methoxyethanol (1 equiv.) and potassium hydroxide (3
equiv.) in dry dichloromethane was stirred at room temperature for 4 h under argon
atmosphere. Allylbromide was added dropwise at 0°C and the reaction was stirred overnight.
The crude product was washed by distilled water to remove a by-product and unreacted
substrate. The pure product was carried out by the distillation as the colourless liquid. Next
step, the mixture of allyl oligoether, benzoyl peroxide and 5-Iodoperfluoro-3-
oxapentanesuolfonyl fluoride was stirred at 80°C for 24 h. Flash column chromatography on
silica gel with hexane and dichloromethane (1:1) gave the compound containing the
OCF2CF2SO2F group as light yellow liquid. In order to transform –SO2F group to –SO3Li
group, LiOH was dissolved in THF and then, the resulting OCF2CF2SO2F compound was
added at room temperature. The mixture was stirred overnight. After THF removal, the
residue was dissolved in acetonitrile. LiF and LiOH in excess were removed by filtration and
the crude product was then concentrated under vacuum to give a yellow viscous liquid. The
product was further dried at 80°C for 48 h under vacuum before it was stored in a dry glove
box.
% yield 67 %

Chapter IV : Experimental Part
190
Characterization:
1H-NMR (DMSO-d6) 4.41 - 4.34 (m, CHI), 3.73 - 3.63 (m, CH2CHI), 3.62 - 3.60 (m,
CH2O), 3.48 - 3.46 (m, CH2O), 3.27 (s, CH3O), 3.11 - 2.96 (m,
CH2CF2), 2.79 - 2.63 (m, CH2CF2)
13C-NMR (DMSO-d6) 75.84 (s, CH2CHICF2), 71.65 (s, CH2OCF3), 69.99 (s, CH2O),
58.58 (s, CH3O), 36.61-36.20 (t, J=96 Hz, CH2CF2), 17.00 (s,
CHI)
19F-NMR (DMSO-d6) -83.61- -83.70 (m, 2F, OCF2CF2), -88.78- -89.86 (m, 2F,
CH2CF2CF2O), -118.48- -118.61 (m, 2F, CH2CF2), -119.21 (s,
2F, CF2SO3Li).
Anal. Calcd.: C, 21.99; H, 2.21; F, 27.83; Li, 1.27; S, 5.87; I, 23.24
Found: C, 22.02; H, 2.60; F, 27.89; Li, 1.10; S, 5.65; I, 23.55
Product name: salt 4
With n = 1
Product name: salt 4n1
Formula: C10H13O6F8SLi
Molecular weight: 420.20
Synthesis protocol
The allyl oligoether was prepared by stirring 2-Methoxyethanol (1 equiv.) and
potassium hydroxide (3 equiv.) in dry dichloromethane at room temperature for 4 h under
argon atmosphere. The resulting solution was cooled to 0°C and the allylbromide (2 equiv.)
was added dropwise, following complete addition, the reaction was stirred overnight. The
crude product was washed by distilled water to remove a by-product and unreacted substrate.
The pure product was carried out by the distillation as the colourless liquid. Then, one-pot

Chapter IV : Experimental Part
191
reaction was done by adding the allyl oligoether (n = 1) to a solution of 5-Iodoperfluoro-3-
oxapentanesuolfonyl fluoride (1.2 equiv), benzoyl peroxide (0.25 equiv.) and
tris(trimethylsilyl)silane (1.2 equiv.) in dried toluene (15 ml). The solution was heated to
80°C and stirred for 36 h. After solvent removal, the crude solution was used as the substrate
for the following step without the isolation, it was added to a solution of LiOH in dried THF
and then, stirred at room temperature for 12 h. The reaction was monitored by 19F-NMR
(disappearance of signal around 46 ppm). After THF removal, the residue was dissolved in
acetonitrile. LiF and LiOH in excess were removed by filtration. The resulting crude was
purified by column chromatography on silica gel (CH2Cl2: ACN / 3:7) to afford the salt 4n1,
as a white solid.
% yield 30 %
Characterization:
1H-NMR (DMSO-d6) 3.55 – 3.45 (m, 4H, CH2O), 3.23 (s, 3H, CH3O), 2.15 (dd, J =
22.6 Hz, J = 14 Hz, 2H, CH2CF2), 1.74 (dt, J = 12.3 Hz, J = 6.1
Hz, 2H, CH2).
19F-NMR (DMSO-d6) -82.58 – -82.64 (m, 2F, OCF2CF2), -88.01 – -88,14 (m, 2F,
CH2CF2CF2O), -117.52 (t, J = 20 Hz, 2F, CF2SO3Li), -118.31
(s, 2F, CH2CF2).
Anal. Calcd.: C, 28.58; H, 3.12; F, 36.17; Li, 1.65; S, 7.63
Found: C, 28.48; H, 3.14; F, 34.63; Li, 1.65; S, 7.53
With n = 3
Product name: salt 4n3
Formula: C14H21O8F8SLi
Molecular weight: 508.30
Synthesis protocol
Triethylene glycol monomethylether (n = 3) was used as a substrate, the allyl
oligoether was prepared by the following method. The alcohol substrate (1 equiv.) was stirred

Chapter IV : Experimental Part
192
with sodium hydride (3 equiv.) in anhydrous THF (20 ml) at ambient temperature for 1h.
Allylbromide was then added dropwise and the mixture was heated to 40°C and stirred
overnight. After THF removal, the resulting product was washed by water and extracted by
diethylether to obtain the desired allyl oligoether as a pale yellow liquid. Allyl oligoether
synthesized (n=3) was reacted with a solution of 5-Iodoperfluoro-3-oxapentanesuolfonyl
fluoride (1.2 equiv.) and benzoyl peroxide (0.25 equiv.). The solution was stirred at 80°C for
36 h. The resulting crude was purified by flash column chromatography on silica gel (hexane :
CH2Cl2 / 1:1) to afford iodoperfluoro oxapentanesulfonyl fluoride oligoether as a yellow
liquid.
The following step, the dehalogenation was done by adding tris(trimethylsilyl)silane
as a radical-based reducing agent to the dry toluene solution of previous resulting product and
benzoyl peroxide at 80°C. The solution was stirred for 36 h. After solvent removal, the crude
product was concentrated. Purification by column chromatography (hexane : diethyl ether / 2 :
3) afforded the desired product as a yellow viscous liquid.
To carry out the salt 4n3, the yellow viscous product from previous step was added to
a solution of LiOH in dry THF at ambient temperature and the solution was stirred overnight.
The reaction was monitored by 19F-NMR (disappearance of signal around 46 ppm). After
THF removal, the residue was dissolved in acetonitrile. LiF and LiOH in excess were
removed by filtration. The salt 4n3 was then concentrated and further dried at 80°C for 48 h
under vacuum before it was stored in a dry glove box.
Overall percentage yield 52 %
Characterization:
1H-NMR (DMSO-d6) 3.53 – 3.43 (m, 14H, CH2O), 3.24 (s, 3H, CH3O), 2.14 (dd, J =
22.8 Hz, J = 14.2 Hz, 2H, CH2CF2), 1.71 (dt, J = 12.4 Hz, J =
6.1 Hz, 2H, CH2).
13C-NMR (DMSO-d6) 117.87 (s, CF2S), 117.53 (s, CF2CH2), 117.19 (s, CF2O), 112.33
(s, OCF2CF2), 71.73 (s, CH2OCF3), 70.23 (t, CH2O), 70.04 (s,
CH2O), 69.92 (s, CH2O), 69.17 (s, CH2O), 58.48 (s, CH3O),
27.11 (t, J=88 Hz, CH2CF2), 21.01 (s, CH2CH2CH2)

Chapter IV : Experimental Part
193
19F-NMR (DMSO-d6) -82.51 – -82.63 (m, 2F, OCF2CF2), -87.97 – -88,04 (m, 2F,
CH2CF2CF2O), -117.16 (t, J = 24 Hz, 2F, CF2SO3Li), -118.20
(s, 2F, CH2CF2).
Anal. Calcd.: C, 33.08; H, 4.16; F, 29.90; Li, 1.37; S, 6.31
Found: C, 31.44; H, 4.65; F, 26.33; Li, 1.24; S, 5.28
Lithium aliphatic perfluorosulfonimide salt
Product name: salt 5n3
Formula: C15H21O9F11S2NLi
Molecular weight: 639.38
Synthesis protocol:
After the dehalogenation, perfluoro sulfonyl fluoride oligoether (mPEGSO2F, n = 3)
obtained was used as the substrate for this functional modification reaction. Firstly,
trifluoromethanesulfonamide and dry triethylamine were dissolved in anhydrous acetonitrile
at 40°C, then cooled to room temperature. The sulfonyl fluoride substrate was added and the
solution was heated at 50°C for 16 h. The reaction was monitored by 19F-NMR
(disappearance of signal around 46 ppm). The solvent was evaporated under vacuum. The
residue was dissolved in dichloromethane, washed several times by distilled water and
concentrated under vacuum to yield the triethylammonium salt of the title product. This salt
was added to the solution of aqueous LiOH in THF and the mixture solution was stirred at
40°C for 2 h. After THF removal, the residue was dissolved in acetonitrile, the LiOH excess
was eliminated by filtration, then, the resulting solution was concentrated giving the title salt.
The salt was further dried at 80°C for 48 h under vacuum before it was stored in a dry glove
box.

Chapter IV : Experimental Part
194
Overall percentage yield 41 %
Characterization:
1H-NMR (DMSO-d6) 3.52 – 3.44 (m, 14H, CH2O), 3.34 (s, 3H,CH3O), 2.26 (dd, J =
21.9 Hz, J = 13.4 Hz, 2H, CH2CF2), 1.90 – 1.74 (m, 2H,
CH2CH2CF2).
13C-NMR (DMSO-d6) 121.60 (s, CF3SO2), 118.40 (s, CF2S), 117.31 (s, CF2CF2O),
117.20 (s, OCF2CF2), 116.71 (s, OCF2CF2), 112.00 (s,
OCF2CF2), 71.3 (s, CH2OCF3), 70.22 (s, CH2O), 70.03 (s,
CH2O), 69.62 (s, CH2O), 69.05 (s, CH2O), 58.46 (s, CH3O),
26.76 (t, J= 88 Hz, CH2CF2), 20.96 (s, CH2CH2CH2)
19F-NMR (DMSO-d6) -78.63 (s, 3F, CF3-SO2), -81.46 (m, 2F, CF2-SO2), -87.86 (t, J=
12 Hz, 2F, CF3-CF2-O), -116.94 (s, 2F, O-CF2-CF2), -117.22 (t,
J = 19.5 Hz, 2F, CF2-CH2).
Anal. Calcd.: C, 28.18; H, 3.31; F, 32.69; Li, 1.09; S, 10.03; N, 2.19
Found: C, 28.75; H, 3.70; F, 30.13; Li, 0.90; S, 8.33; N, 2.28
IV.1.2.Linear polycondensat (LPC1000) preparation
Synthesis protocol:
The mixture of polyethylene glycol (PEG) with Mw = 1000 and a four-fold excess of
ground KOH were stirred at 40°C for 4 hours and 3-chloro-2-chloromethyl-1-propene
(CCMP) was then added dropwise. After stirring for 48 hours, the resulting solution was
dissolved in deionized water and neutralized by concentrated HCl solution until pH = 7. The
inorganic by-products (KOH, KCl) were eliminated by the ultrafiltration and the water was
removed by lyophilization for 3 days. The polycondensate obtained was further characterized
and kept in the glove box.

Chapter IV : Experimental Part
195
Characterization:
= 2.674×10⁴ (±8.759%)
= 7.347×10⁴ (±3.123%)
Polydispersity (I) = 2.748 (±9.299%)
IV.1.3.Salt and LPC1000 characterization
a) Thermal analysis
The thermal properties of salts and the related membranes were determined while
consecutively performing thermal gravimetric analysis (TGA/SDTA Mettler-Toledo STARe
software version 12.10) and differential scanning calorimetry (DSC 1- Mettler -Toledo). For
glass transition temperature (Tg) and melting temperature (Tm) measurements as in a typical
procedure, samples were heated from -100 ° C to 150-200 °C (depending on the sample) with
a heating rate of 10 °C / min. The oscillation period was 60 s and amplitude was ±1 °C. The
TGA measurement was carried out at a heating rate of 5 °C/ min under nitrogen atmosphere
and from 25 °C to 500 °C. An amount of approximately10 mg of sample was prepared on a
particular plate.
b) Conductivity measurements
Conductivities were measured by electrochemical impedance spectroscopy using an
HP 4192A Impedance Analyzer in the low frequency range 5 Hz – 13 MHz. The ionic liquid
lithium salts were placed in a dip-type glass cell with two platinum electrodes at a constant
distance. Measurements were done on successive increase and decrease of temperature in the
range 20 °C - 110 °C. The temperature was equilibrated for 1 hour before each measurement.
The cell constant was determined by using a 0.1 M KCl solution.
c) Cyclic voltammetry
Cyclic voltammograms (CV) were recorded at room temperature in a glove box. The
counter electrode was a Pt wire, and the working electrode was Pt with a diameter of 2 mm.
The scan rate used was 10 mVs-1. The reference electrode was an Ag wire in 10 mM AgNO3
in acetronitrile + 0.1 M tetraethylammonium borofluoride (TEABF4). Potential can be

Chapter IV : Experimental Part
196
converted to the NHE scale by adding 0.542 [1]. The ACN + TEABF4 0.1 M electrolyte
exhibits a large electrochemical stability, with oxidation and reduction potentials at 2.6 V vs
Ag/Ag+ and −2.4 V vs Ag/Ag+ respectively. These limits in potential were associated, in the
studies, to the oxidation and reduction of the BF4- [2] and [3].
d) Diffusion coefficient and cationic transference number
The self-diffusion measurements were performed with the pulsed field gradient
stimulated echo and LED sequence using 2 spoil gradients (PFG NMR) [4]. The magnitude of
the pulsed field gradient was varied between 0 and 40 G cm−1, the diffusion time, Δ, between
two pulses was fixed at 100 ms and the gradient pulse duration, δ, was set between 3 ms and
18 ms, depending on the diffusion coefficient of mobile species, D. This allowed to observe
the attenuation of spin echo amplitude over a range of at least 2 decades leading to good
accuracy (<5%) of the self-diffusion coefficient values. They were determined from the
relationship ln (I/I0) = −Dg2γ2δ2(Δ − δ/3), where g is the magnitude of the two gradient
pulses, γ is the gyromagnetic ratio of the nucleus under study and I and I0 are respectively the
area of the signal obtained with or without gradient pulses, D the diffusion coefficient, δ the
gradient pulse duration and Δ the diffusion time. The measurement was carried out at high
temperatures of 110 °C. The cation transference number is obtained from this relationship:
+ = 帖+帖++ 帖−
where D+ is the self diffusiton coefficient of the cation and D- the self-diffusion coefficient of
the anion.
The sample investigated the diffusion coefficient by PFG-NMR technique was prepared
by containing into the small tube in the glove box for preventing the humidity. The tube was
subsequently closed and put in the NMR test tube before measuring by NMR instrument.
e) Freeze dryer or lyophilization
The LPC1000 dissolved in deionized water was dried by the lyophilization instrument.
The solution was poured into the freeze drying flask and rotated the flask in a liquid nitrogen
bath for few minutes. The solution flask was connected to the freeze drying machine. The
lyophilization usually spent at least 3 days (depending on the water content inside the
material) and the freezing temperature was -100°C.

Chapter IV : Experimental Part
197
f) Gel Permeation Chromatography (GPC)
GPC measurement was performed in a Waters 515 HPLC, equipped with a differential
refractometer SOPARES RI2000 and WYATT DAWN EOS at 690nm. A column Couplage
10: AGILENT 2xPLgel-Mixed-D was used with DMF (Alfa aesar – HPLC grade 99.7%) +
0.1 M NaNO3 flow rate of 1ml/min to analyse the sample. Molecular weight was calculated in
polystyrene equivalents
IV.2. Membrane preparation and salt concentration
calculation
IV.2.1.Membrane preparation
In our work, we study the performance of the salts in two different types of host
polymer. The first one is linear POE (Mw =300,000 g/mol) from Acros Organics and another
one is cross-linked POE (NPC). The former electrolyte was prepared in a glove box by
dissolving both POE (0.3 g) and the salt (mass calculated by the following equation) in
acetonitrile (8 ml). The resulting solution was stirred overnight and subsequently casted on a
Teflon plate (diameter of 4 cm). Solvent evaporation process was done in the glove box for 18
h. The membrane was then dried under vacuum at 50°C for 48 h and further stored in the
glove box under argon.
For the film processing of NPC, the electrolytes were prepared in the glove box by
dissolving the salt (mass calculated by the following equation), LPC (0.3 g) and the initiator
(IRGACURE® 2959, CIBA) (5 % of NPC mass) in acetonitrile (8 ml) and allowed to stir
overnight. The resulting electrolyte was poured into a Teflon plate. After the solvent
evaporation, the cross-linking under UV radiation (0.866 mW) was carried out for 30 seconds
and 1 minute. The resulted NPC membranes were then dried under vacuum at 60°C for 72 h
and carefully stored in the glove box.
IV.2.2.Calculation of salt concentration
The lithium salt concentration in the film is indicated by the number x = O/Li, which
actually corresponds to the oxyethylene/lithium molar ratio.
The quantity of salt incorporated is calculated from these equations:

Chapter IV : Experimental Part
198
For POE host polymer 潮挑 = 陳鍋捺陳濡如禰 暢44 + 券
For NPC1000 host polymer 潮挑 = 陳鍋捺陳濡如禰 暢46.4 + 券
where mPOE = mass of polymer used
msalt = mass of salt incorporated
M = theoretical molecular weight of salt
寵鉄寵鉄潮 = 44 g/mol for POE and 46.4 g/mol for NPC1000
n = the number of oxyethylene repeating unit in lithium salt
IV.3. Membrane characterization
IV.3.1.Thermal analysis
The thermal properties of salts and the related membranes were determined while
consecutively performing thermal gravimetric analysis (TGA/SDTA Mettler-Toledo STARe
software version 12.10) and differential scanning calorimetry (DSC 1- Mettler -Toledo).
In the case of POE/salt samples, the glass transition temperature (Tg) and melting
temperature (Tm) measurements was investigated with a typical procedure, two series of data
can be obtained. For the first data series, samples were heated from -100 °C to 100 °C with a
heating rate of 10°C / min, the Tg1, Tm1, ΔHm1 were measured, the membranes were cooled
down at -100 °C with a ramp of 20 °C/min and heated once again to 100 °C (Tg2, Tm2, ΔHm2).
In the second ones, the samples were quenched, therefore the pans containing the samples
places in a well closed recipient. They were heated at 80 °C on a heater outside of the DSC
device and, after 10 min, the pans were put again in the DSC at -100 °C to get the
characteristic temperature of the quenched samples (Tgq, Tmq, ΔHmq).
For NPC/salt complexes, samples were heated to 60 °C with a heating rate of 10
°C/min and then quenched to -100 °C with a cooling rate of 50 °C/min. The samples were
heated up again to 60 °C. The oscillation period was 60 s and amplitude was ±1 °C.
The TGA measurement was carried out at a heating rate of 5 °C/ min under nitrogen
and from 25 °C to 500 °C. An amount of approximately10 mg of sample was prepared on a
particular plate.

Chapter IV : Experimental Part
199
IV.3.2.Dynamic mechanical analysis
The thermo-mechanical properties of the different membranes were determined using
a TA Instruments DMA2980. The setup measured the complex tensile modulus E*, i.e. the
storage component E’ and the loss component E”, as well as the ratio of the two component,
i.e. tan (=E’/E”). Measurements were performed in isochronal conditions at the frequency of
1 Hz. Strain magnitude was fixed at 0.01% of the sample length, 150% force track. The
temperature was varied in the temperature range of -100 °C - 100 °C at a heating rate of 3 °C /
min. The film sample used should have the size of 5×10 mm2 approximately and it should be
measured immediately after taking out from the glove box for avoiding the humidity.
IV.3.3.Conductivity measurements
Conductivities were measured by electrochemical impedance spectroscopy using an
HP 4192A Impedance Analyzer in the low frequency range 5 Hz – 13 MHz. The membrane
with the diameter of 9 mm was placed between two stainless steel electrodes in a Swagelok
cell with Teflon o-rings and spacers. The sample preparation step should take place in the
glove box for avoiding the contamination of humidity. Measurements were done on
successive increase and decrease of temperature in the range 20 °C - 70 °C (from 20 °C – 110
°C for NPC/salt complex). The temperature was equilibrated for 1 hour before each
measurement. The ionic conductivity was calculated from
(S.cm-1)
where is the ionic conductivity, R is the bulk resistance, L is the thickness of the polymer
membrane and S is the area of the stainless steel electrode.
IV.3.4.Diffusion coefficient and transference number
The transference number was estimated from two methods; an electrochemical
impedance spectroscopy technique (EIS) and diffusion coefficients. For the former technique,
a sample was sandwiched between two metallic lithium electrodes. This cell was carefully
prepared in an argon glove box in order to avoid degradations of lithium metal foil and the
presence of humidity in the electrolyte. Both electrodes (anode and cathode) are made of thin

Chapter IV : Experimental Part
200
lithium foils which have a thickness of approximately 65 µm, while a polypropylene layer
was used as insulator. Also the polymer electrolyte thickness (l), important, must be known
before and after the impedance measurements. The cell elaboration (the lamination process)
and further impedance measurements modify the membrane thickness. The value of diffusion
coefficient can be easily detected while using the characteristic (solid state) diffusion time τ
τ = l2/ D
where l is the inter-electrode distance (polymer electrolyte thickness) and D is the ambipolar
diffusion coefficient.
In the case of symmetrical electrochemical cells, Li/electrolyte/Li, the lithium metal
electrodes are considered as blocking electrodes for the anion and non-blocking for the
lithium cation. For this reason, the diffusion impedance (Warburg diffusion, Wd) is given by:
Wd = Re µ2/µ1
Where µ1 is the lithium cation mobility, µ2 is the anion mobility and Re is the electrolyte
resistance. This leads to the final equation for transference number, T+:
T+= Re/ (Re+Wd)
The polarization voltage was kept at 40 mV using a computer-monitored Solartron 1470
battery test unit. The Nyquist plot obtained from EIS method was shown as follows.
Nyquist diagram

Chapter IV : Experimental Part
201
The latter one, diffusion coefficient was determined by pulsed field gradient (PFG)-
NMR. The magnitude of the pulsed field gradient was varied between 0 and 55 G cm−1 (sinus
shaped pulsed gradient); the diffusion time Δ between two pulses was fixed at 500 ms and the
gradient pulse duration δ was set between 3 and 22 ms depending on the diffusion coefficient
of mobile species. This allowed us to observe the attenuation of spin echo amplitude over a
range of at least 2 decades leading to a good accuracy (5%) of the self-diffusion coefficient
values. They were determined from the classic relationship ln(I/I0) = 2Dg22 (Δ - /3) where
g is the magnitude of the two gradient pulses, is the gyromagnetic ratio of the nucleus under
study and I and I0 are respectively the area of the signal obtained with or without gradient
pulses. The measurement was carried out at high temperatures of 110°C. The cation
transference number is obtained from this relationship:
+ = 帖+帖++ 帖−
where D+ is the self-diffusion coefficient of the cation and D- the self-diffusion coefficient of
the anion.
IV.4. References
[1] V.V. Pavilishchuk, A.W. Addison, Inorg. Chim. Acta, 298 (2000) 97-102.
[2] P.A.Z. Suarez, V.M. Selbach, J.E.L. Dullius, S. Einloft, C.M.S. Piatnicki, D. Azambuja,
R.F. deSouza, J. Dupont, Electrochim. Acta, 42 (1997) 2533-2535.
[3] E. Peled, D. Golodnitsky, C. Menachem, D. Bar-Tow, J. Electrochem. Soc., 145 (1998)
3482-3486.
[4] S. Altieri, D.P. Hinton, R.A.J. Byrd, J. Am. Chem. Soc., 117 (1995) 7566-7567.

General conclusion and prospects
202
General conclusion and prospects
This research targeted the syntheses and assessments of new lithium salts intended to
be used, in a first stage, in solvent-free polymer electrolytes.
Once selected the suitable host polymer, macromolecular ionic solutions face two main issues
as: 1) low cationic transference numbers T+ and 2) a progressive stiffening of the polymer
electrolytes with the increase in salt concentration, detrimental to the ionic conductivity. This
stiffening results from the intra-chain and, above all, inter-chains solvation of Li+ that induces
physical cross-links, sometimes called transient cross-links. If the use of volatile, and then
flammable, organic solvents, is discarded, one solution is to swell the polymer electrolytes
with ionic liquids. These one, based on quaternary ammonium allow decreasing the glass
transition temperatures thus increasing conductivities but are costly and don’t participate to
the reactions at the electrodes. Furthermore the T+ of lithium is fairly low in these commercial
ionic liquids.
Our target was to prepare multifunctional salts endowed with a plasticizing, a solvating and an
ionic function. These materials, indeed Lithium-conducting ionic liquids, have 2 additional
functions with regard to current ionic liquids i.e. lithium conductivity and Li+ solvation.
For that purpose salts having an oligomeric tail i.e. oligo(oxyethylene) end-capped by
perfluorinated or perfluorosulfonimide lithium salts were prepared. The ionic groups were
spaced from the oligomeric tail either by a, aryl moiety or by an alkyl one. The results, which
are promising both in terms of conductivity and of cationic transference numbers, can be still
optimized and improved by monitoring the length of the oligomeric tail.
The new Li-conducting ionic liquids were characterized, alone (when possible) and in blend
with 2 host polymers i.e. a linear commercial POE and a cross-linked polycondensate. The
former, which is unsuited for the application, owing to its high crystallinity and to its very
poor mechanical performances, was used because it allows a good comparison with a lot of
literature data to be performed. The later provides much higher conductivities at ambient
temperature and much higher storage modulus.
High cation transference numbers were obtained in both host polymers, and its values
increase with the lengthening of the mPEG. The adding of mPEG chain on the anion leads,

General conclusion and prospects
203
generally to greater conductivity of polymer electrolytes and its conductivities increase with
the increase of mPEG lengths.
The salts where the ionic groups were spaced from the oligomeric tail by an alkyl give
polymer electrolytes with better properties in term of conductivity, cationic transference
number, dissociation degree as compared with those of the salts spaces with an aryl moiety.
Some questions are still pending. This is the case for the presence with the ionic liquid
(salt2n16) of 2 Tg or 2 T obtained respectively by DSC and DMA and might reflect a phase
or microphase separation. This ionic liquid seems to be prone to induce a self-solvation of the
lithium cation, suppressing the increase compatibilization expected from the cation interaction
with both hosts.
Prospects
From the synthesis point of view, due to the difficulty in the salt purification step, a
family of aliphatic lithium salts with four different number of oxyethylene units for both
sulfonate and sulfonimide function was not completely carried out like the aromatic one as it
was expected. It will be interesting if such salts can be purified by a green process in water i.e.
ultrafiltration to make easier the full synthesis protocol but at this time we didn’t find
ultrafiltration membranes with a cut-off lower than 1,000 Dalton (g/mole). End-capping
oligomers by two ionic groups will allow salts having molar mass much higher than 1,000
g/mole paving the route for an efficient ultrafiltration purification process.
If, some of the oligomeric salts weaken the NPC electrolytes, the use of Nano
Crystalline Cellulose will allow a huge improvement of the resulting nanocomposite NPC
electrolytes while unaffecting the conductivities.
Salts of Na and of alkaline-earth as Mg and Ca could be easily prepared and should be
useful for the cation transport of electrolytes for post-lithium batteries. Last the best salts
could be used as Li-ion electrolytes in solution in organic solvent mixtures.
A more deep study has to be conduct in order to understand the differences between
the cation transference numbers obtained by two methods.

Résumé
204
Contexte
Actuellement, les prévisions de croissance du marché du transport électrique - electric
vehicles, EV, hybrid electric vehicles, HEV, Plug-in hybrid electric vehicles, PHEV, motivent
une recherche de nette amélioration de la sécurité par rapport aux batteries commercialisées
pour les marchés des applications 4C (ordinateur, téléphone cellulaire, caméscopes, outils sans
fil). Ainsi, les batteries sans solvant retrouvent actuellement un regain d’attention. C’est le cas
des batteries tout- solide, aux composants solides inorganiques, et des batteries utilisant des
électrolytes polymères sans solvant moléculaire liquide.
En ce qui concerne les problèmes de sécurité, les électrolytes polymères à solvant
macromoléculaire permettant une élaboration en forme de films minces sont très intéressants,
n particulier ceux préparés à partir du polymère hôte, le poly (oxyéthylène) (POE). Grâce au
haut DN du POE, lié à la présence de paire d’électrons sur l'atome d'oxygène, le POE a une
capacité exceptionnelle à solvater le cation lithium. La chaîne POE présente également une
grande flexibilité et la mobilité des cations lithium, au-dessus de la température de fusion,
s’effectue par le mouvement de segments de polymère. Il souffre cependant de divers
handicaps, à savoir (i) une cristallinité élevée qui pénalise la conductivité de l'électrolyte en
dessous de la température de fusion (ii) une résistance mécanique qui disparaît après la fusion
de l'électrolyte de polymère et (iii) une stabilité à l'oxydation limitée à environ 3,9 V vs Li / Li+.
Outre des performances élevées en termes de propriétés électrochimiques, thermomécaniques,
chimiques, une attention particulière doit être accordée au transport d'ions. Le fonctionnement
d'une batterie à électrolyte polymère est en partie conditionné par sa température de fusion, Tf,
car la conductivité est principalement obtenue à l'état amorphe. Mais le module de stockage,
E’, chute complètement à T > Tf avec un risque d'un court-circuit. La croissance de dendrites
dépend de la mobilité de l’anion et serait donc favorisée par un faible nombre de transport
cationique (T+) pour les mélanges de POE et de sel. Ce nombre de transport bas est lié aux
interactions faibles entre l'anion et les segments POE qui mènent à des coefficients de diffusion
des anions très supérieurs à celui du cation lithium qui est lui fortement solvaté par les atomes
d’oxygène du POE. Par conséquent, l'interaction entre les deux espèces doit être améliorée en
modifiant l'anion. De plus, la modification de l'architecture du POE est l’une des voies pour
améliorer les propriétés mécaniques après le point de fusion des membranes.

Résumé
205
L'utilisation de liquides ioniques commerciaux est une des voies pour obtenir une
conductivité suffisante aux basses températures mais, encore une fois, T+ reste faible. De plus,
ces liquides ioniques, qui bénéficient à la conductivité, sont basés sur des cations tétraalkyl
ammonium qui ne participent pas aux réactions d'électrodes.
En pratique, le transport de cations lithium est couplé au mouvement du squelette du
polymère ou de la mobilité segmentaire de la chaîne de polymère en coordonnant les
interactions des mobiles Li+ à l'oxygène de l'éther tandis que les anions ayant des interactions
plus faibles avec des chaînes principales, sont beaucoup plus mobiles. Cela se traduit par un
inconvénient majeur : un nombre de transport cationique faible. En outre, l'accumulation de ces
anions à l''anode et un faible coefficient de diffusion des cations Li provoquent des gradients de
concentration en sel qui favorisent une polarisation de concentration et donc une mauvaise
performance de la cellule [120]. Afin d’atteindre un nombre de transport cationique élevé égal
à l'unité, en théorie, un conducteur cationique unipolaire doit être préparé, dans lequel les anions
sont immobilisés via des liaisons covalentes les liant aux chaînes polymères [121]. Ce concept
a donné lieu à plusieurs contributions [118-121]. Les sels de lithium à anions imidure polymères
dont les charges négatives sont délocalisées ont été étudiés par Watanabe et al. [123], [124]. La
longueur de l'espace entre charges anioniques influence la conductivité et la dissociation de
sels. Ces sels peuvent augmenter le nombre de transport cationique. Bouchet et al. [125], [126]
ont préparé les alliages de polymères de mélange POE avec de lithium poly (4-styrènesulfonyle
(trifluorométhylsulfonyl) imide polyélectrolyte. La conductivité est très faible (7.94 × 10⁻⁷ S/cm
à 40 °C) pour une utilisation pratique dans les batteries Li-ion, même à travers ce polyanion
+ +
+
+ +
+
+ + +
+ +
+ +
+
- + -
-
-
-
-
Figure 1. Ion mouvement en polymère hôte.

Résumé
206
contient le caractère souple et délocalisée de la -SO2-N-SO2-CF3 fournissant région plus
amorphe matrice polymère. D'autre part, le nombre de transport lithium-ion est presque unité
(T+ = 0,92) à 60 ° C. Ces résultats sont très inférieurs à ceux obtenus précédemment, dans des
réseaux POE par fixation d’anion perfluorosulfonate qui avaient abouti à une conductivité de
0,1 mS à 86°C pour un T+ =1 par construction : réseau tri-dimensionnel extrait pour éliminer
toutes traces de sel non-lié à la chaîne polymère [131]. Des oligomères porteurs de groupes
perfluorosulfonimidure ont également été étudiés par Desmarteau et al. [127], [128]. Des
oligomères à anions sulfonimidure aliphatiques et aromatiques ont été caractérisés : la plus
haute conductivité à température ambiante est ~ 10-6 S/cm et atteint entre 10-4 et 10-3 S/cm à
120 °C Même si, les nombres de transport n’ont pas été déterminés, des gradients de
polarisation de concentration n'ont pas été détectés par des études galvanostatiques. Outre des
anions sulfonimidures, des oligoéthers ont également fonctionnalisés avec d'autres groupes
terminaux ioniques tels que carboxylate, sulfonate et sulfate qui ont été présentés dans la
recherche bibliographique de la manière suivante.
Deux démarches ont été entreprises pour se rapprocher d’un nombre de transport
cationique = 1 : l’utilisation de polymères ioniques ou ioniques de haute masse ou réticulés, des
oligomères porteurs de fonctions ioniques en bout de chaîne. Seuls les premiers garantissent un
T+ =1 si le polymère ionique est réticulé.
Ainsi les précurseurs, Bannister et al. ont préparé un conducteur unipolaire cationique à
anion perfluorocarboxylate mais ce sel de lithium n’étant pas suffisamment dissocié dans la
matrice de polyéther fournit de faibles conductivités [129]. D.Benrabah et al. ont immobilisé
des anions perfluorosulfonates dans des réseaux polyéther et ont obtenu une conductivité
purement cationique égale à 0,1 mS/cm à 86°C. [131]. Afin de diminuer la mobilité anionique
et, d'atteindre le nombre élevé de transfert qui fermeture à l'unité, T. Hamaide et C. Le Deore
ont utilisé des perfluorosulfonate de lithium à longue chaîne (C8F17SO3Li) mais cela ne conduit
pas à des T+ =1 [130]. K. Ito et al. ont rapporté la synthèse de PEG, PPG et PEGME terminés
par un benzènesulfonate de lithium [132]. W. Xu et al. ont préparé différentes longueurs de
chaînes de PEG portant à leur extrémité un groupe sulfonate de benzoyle (EOnPSLi). [133]. X.
Ollivrin a synthétisé les PEG attachés par le lithium perfluorosulfonate et a obtenu de hautes
valeur de conductivité lorsque les sels de lithium ont été incorporés dans le POE (10-3 S/cm à
78 ° C) [134]. Des mono et di-sel de lithium à base de sulfate oligoéther ont été réalisés par C.
Chauvin et al. La conductivité atteint 6 x 10⁻⁵ S/cm à 70°C et est proche de 10-5 S/cm à 30° C
pour le sel de lithium mono pur alors que les di-sels de lithium pur ont atteint des conductivités

Résumé
207
de 8×10⁻⁵ S/cm à 70° C et de 2×10⁻⁵ S/cm à 30° C. Les nombres de transport cationique de ces
deux sels étaient voisins de l'unité à 70° C [135].
Nous avons donc axé nos recherches vers les sels de lithium pouvant améliorer
l’interaction entre les anions et les segments de polymère afin de diminuer la mobilité des
anions. Ainsi, ce travail de thèse se propose d'aborder ces questions en concevant de nouveaux
sels de lithium qui sont des liquides ioniques contenant les groupements oxyéthylène et les
anions perfluorosulfonate /perfluorosulfonimidure. Le groupement oxyéthylène (CH2-CH2-O-)
doit plastifier la chaîne polymère pour réduire la cristallinité et augmenter la mobilité
segmentaire tout en améliorant l'interaction anion - segments polymères. En outre les motifs
oligo(oxyethylène) peuvent contribuer à la solvatation des cations lithium. Par conséquent,
l'influence (i) du nombre d'unités oxyéthylène (ii) des différentes structures chimiques et (iii)
de la nature de l'anion sur leurs performances intrinsèques et sur celles de leurs complexes avec
du POE (linéaire ou réticulé) ont été étudiées.
Résultats et discussion
Les résultats de mes travaux de thèse sont présentés à travers deux chapitres principaux.
Le Chapitre II est consacré à la synthèse et la caractérisation de sels de lithium à base de
perfluorosulfonates aromatiques greffés sur des chaînes de PEG de longueur différente (n = 1,
3, 7 et 16) et le sel de lithium avec une double liaison dans la molécule afin d’étudier l’impact
de la longueur de la chaîne de mPEG et de la structure chimique.
Le Chapitre III concerne des électrolytes à base d’anions perfluorosulfonates et
perfluorosulfonimidures de lithium aliphatiques. Ce chapitre est divisé en deux parties. La
première partie, présente la synthèse et la caractérisation de nouveaux perfluorosulfonate et
perfluorosulfonimidure de lithium, destinés à être-fixés à une chaîne PEG afin de connaître les
performances intrinsèques de ces sels. Les deux anions ont en commun la présence d’une
fonction perfluoroéther qui devrait assurer une plus grande flexibilité des anions et l’anion
perfluorosulfonimidure est dissymétrique.
La deuxième partie est consacrée aux synthèses et caractérisations d’oligoéthers (PEGs)
porteurs des précédents sels de lithium. Pour réaliser l'électrolyte polymère, tous les sels

Résumé
208
synthétisés ont été incorporés dans deux polymères hôte différents du POE linéaire et du POE
réticulé. Leurs performances ont été comparées à celles des oligoéthers ioniques du chapitre II.
Chapitre II : Synthèse et caractérisation d'une famille d’oligoéthers terminés
par un aryl perfluorosulfonate de lithium
L’objectif était l’évaluation de l'impact de la longueur de mPEG sur les oligoéthers à fonction
aryl perfluorosulfonate de lithium sur les propriétés chimiques, mécaniques, électrochimiques,
particulièrement, la conductivité et le nombre de transport cationique.
La première partie ce chapitre est consacrée à la synthèse et la caractérisation de ces sels. Dans
la deuxième partie les nouveaux sels ont été incorporés dans du POE de masse 300000 g/mole
ou dans une matrice POE réticulée, les films résultants étant évalués en termes de propriétés
électrochimiques, thermiques, thermomécanique. Les conductivités ont été mesurées par
spectroscopie d'impédance et leurs nombres de transport cationique par spectroscopies
d'impédance électrochimique et de RMN à Gradient de champ pulsé (PFG-RMN).
Nous avons fixé les sels PhSCF2CF2SO3Li à une courte chaîne POE (méthoxy
polyéthylène glycol, MPEG). Le cycle aromatique de PhSCF2CF2SO3Li a l'avantage d'être
facilement modifié pour permettre son couplage avec les dérivés MPEG. En fixant le mPEG à
l'anion du sel de lithium, on pourrait s’attendre (i) à une amélioration de la compatibilité entre
l'anion et la matrice POE et donc à une augmentation du nombre de transport cationique, (ii) à
une diminution de la cristallinité de la matrice POE (iii) à bénéficier d'une auto-solvatation de
Li+ par la chaîne oligomère et (iv) à une plastification de l'électrolyte polymère augmentant la
mobilité de Li+. Ainsi, dans ce travail, les PEG de différentes longueurs (n= 1, 3,7 et 16)
terminés par la fonction sel ont été synthétisés.
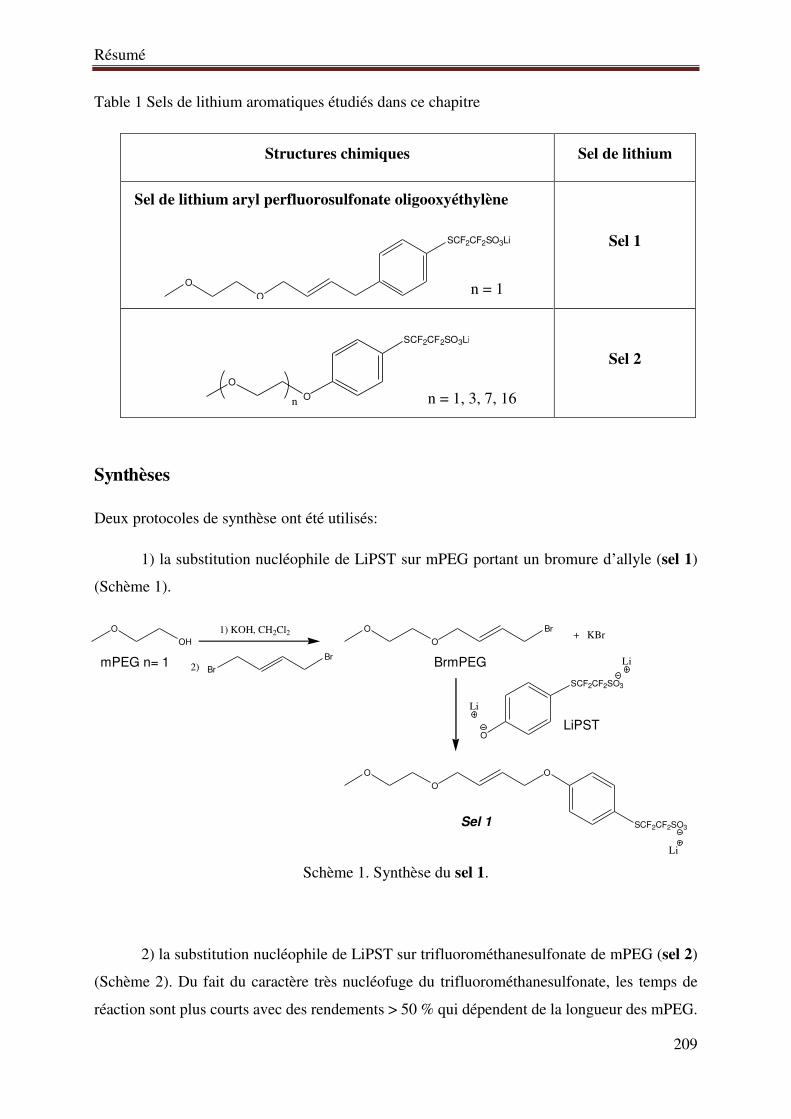
Résumé
209
Table 1 Sels de lithium aromatiques étudiés dans ce chapitre
Structures chimiques Sel de lithium
O
O
SCF2CF2SO3Li
Sel 1
O
O
SCF2CF2SO3Li
n
Sel 2
Synthèses
Deux protocoles de synthèse ont été utilisés:
1) la substitution nucléophile de LiPST sur mPEG portant un bromure d’allyle (sel 1)
(Schème 1).
Schème 1. Synthèse du sel 1.
2) la substitution nucléophile de LiPST sur trifluorométhanesulfonate de mPEG (sel 2)
(Schème 2). Du fait du caractère très nucléofuge du trifluorométhanesulfonate, les temps de
réaction sont plus courts avec des rendements > 50 % qui dépendent de la longueur des mPEG.
O
OH
O
O
Br
Br
Br
2)
1) KOH, CH2Cl2 + KBr
O
O
O
O
SCF2CF2SO3
Li
Li
SCF2CF2SO3
Li
mPEG n= 1 BrmPEG
Sel 1
LiPST
Sel de lithium aryl perfluorosulfonate oligooxyéthylène
n = 1
n = 1, 3, 7, 16

Résumé
210
Schème 2. Synthèse du sel 2 (n= 1, 3, 7, 16).
Caractérisations
Sel de lithium
Les composés obtenus ont été caractérisés par DSC, qui montre l’influence de la tête ionique
sur les phases amorphes et cristallines.
Les Tf du sel 2n7 et du sel 2n16 ne sont pas observées mais ils sont amorphes à la
température ambiante et répondent donc aux caractéristiques des liquides ioniques. Il
est connu que cinq atomes d’oxygène sont nécessaires pour la solvatation de Li+. Dans
les sels 2n7 et n16, 2 et 11 atomes d’oxygène sont respectivement en excès. Nous
supposons donc que la chaîne mPEG peut s’organiser différemment et conduire à des
matériaux amorphes.
La Tg du sel 1 et du sel 2n1 était impossible à mesurer, même après fusion et trempe,
probablement en raison de l’aptitude des sels à recristalliser. Pour les autres sels 2 avec
n 3, la liaison du LiPST sur le mPEG conduit à une augmentation importante de la
température de transition vitreuse (Tg) vs le mPEG pur. Cependant leurs Tg sont
beaucoup plus basses que celle du sel de lithium aromatique, PhSCF2CF2SO3Li non-
fixé sur mPEG et diminuent avec l’augmentation de n.
L’ATG montre que la dégradation du sel 2 ayant un n faible commence à la même température
que celle du sel non-fixé sur mPEG (Td = 210°C) et augmente avec n. Elle reste cependant
O SCF2CF2SO3
LiLi
O
OHn
F3C
O2S
O
O2S
CF3
O
O
O2S
CF3n+
Amberlyst A21
CH2Cl2 ,0°C+ CF3SO3H
O
O
SCF2CF2SO3
Li
n
+ CF3SO3Li
ACN
mPEGSO3CF3
Salt 2
mPEG (n= 1, 3, 7, 16) mPEGSO3CF3
Sel 2
LiPST

Résumé
211
inférieure à celle du mPEG n = 16. Nous supposons donc que la dégradation se produit au
niveau de la liaison C-S de l’anion.
Figure 2. ATG des sels de lithium aromatiques.
La conductivité de sel 2n16 est supérieure à celle du sel 2n7. L’augmentation du rapport molaire
O/Li contribue à la fois (i) à la solvatation de Li+, et donc à l’augmentation de la dissociation,
et (ii) à l’augmentation de la mobilité des ions, en accord avec la Tg plus basse du sel 2n16.
Figure 3. Conductivité des sel 2n7 et sel 2n16.
1.00E-07
1.00E-06
1.00E-05
1.00E-04
1.00E-03
2.5 2.7 2.9 3.1 3.3 3.5
Co
nd
uct
ivit
é (S
/cm
)
1000/T (K)
salt 2n7
salt 2n16
Per
te d
e p
oid
s ()
Sel 2n3
Sel 2n7
Sel 2n16
mPEG n=16
Température (°C)
Sel 2n7
Sel 2n16

Résumé
212
Les coefficients de diffusion des anions (19D) et de Li+ (7D) des sels 2n7, 2n16, est obtenu par
PFG-RMN (7Li et 19F). On constate que les coefficients de diffusion des anions sont inférieurs
à celui du lithium pour les deux sels. La comparaison des coefficients de diffusion des deux sels
montre que ceux des anions (19D) sont très proches alors qu’un facteur supérieur à 2, sépare les
coefficients de diffusion du lithium (7D). On peut supposer que la viscosité du sel 2n16 est
inférieure à celle du sel 2n7. La valeur élevée du coefficient de diffusion du lithium dans le sel
2n16 est en raison d’une plus grande flexibilité et du mouvement de la chaîne de segment mPEG
par rapport à ceux de mPEG du sel 2n7.
Le nombre de transport du sel 2n16 (T+ = 0,72) présente une valeur supérieure à celle du sel
2n7 (T+ = 0,64).
Le mur d'oxydation du sel 2 commence à 4,25 V par rapport à Li/Li+ et semble être indépendant
de la longueur de chaîne de mPEG et très proche de celui de PhSCF2CF2SO3Li (4,3 V). En
outre, la stabilité semble être légèrement supérieure à celle du POE qui est connu pour être
proche de 3,9 V par rapport à Li/Li+. En ce qui concerne le sel 1 sa stabilité semble être
légèrement plus faible, un premier épaulement apparaît à 3,9 V par rapport à Li/Li+
probablement dû à l’oxydation de la double liaison.
POE+Sel de lithium aromatique
Le sel oligomère a été incorporé dans le POE linéaire. La comparaison entre les électrolytes
polymères conduit à plusieurs conclusions :
L'augmentation classique de la Tg avec l'addition de sel dans la matrice POE, en
raison de l'interaction entre les chaînes du POE hôte et le sel, une Tg qui décroît lorsque la
longueur de chaîne de mPEG augmente. En outre, la DMA corrobore les résultats de DSC.
Ainsi, la température de relaxation diminue avec l'augmentation de longueur de chaîne (figure
4 (a)). Toutefois, dans le cas de POE + sel 2n16, on observe une séparation de phase avec
l'apparition de deux Tg en DSC et de deux T en DMA (figure 4 (b)).

Résumé
213
Figure 4. Propriétés mécaniques des sels de lithium aromatiques (module de
conservation et Tan ) (a) POE+sel 2, O/Li= 20 et (b) POE+sel 2n16, O/Li= 40.
Toutes les courbes de conductivité montrent une forme classique pour
l'électrolyte POE, c’est-à-dire qu’en dessous du point de fusion, Tf, la conductivité suit la loi
d’Arrhenius, avec augmentation très nette de la conductivité au niveau de Tf et une loi de
comportement de type VTF. Les conductivités des deux membranes (POE+sel 1 et POE+sel
2n1) sont semblables au-dessus de Tf, pour T <Tf les valeurs sont plus faibles pour l’électrolyte
POE + sel 2n1 (figure 5 (a)). Une augmentation régulière de la conductivité a été observée avec
l'augmentation de la longueur de mPEG (figure 5 (b)), un écart qui diminue lorsque T >Tf. Nous
supposons que cette augmentation est due à la double contribution des EO de mPEG en termes
de solvatation et de mobilité des cations Li+.
Ta
n
Ta
n
-100 -80 -60 -40 -20 0 20 40 60 80 1000,1
1
10
100
1000
10000
Sto
rag
e M
od
ulu
s (
MP
a)
Temperature (°C)
POE+salt 2n16, O/Li=40
POE without salt
0,0
0,2
0,4
0,6
-100 -80 -60 -40 -20 0 20 40 60 80 1000,1
1
10
100
1000
10000
Sto
rag
e m
od
ulu
s (
MP
a)
Temperature (°C)
POE without salt
POE+salt 2n1, O/Li=20
POE+salt 2n3, O/Li=20
POE+salt 2n7, O/Li=20
0,0
0,2
0,4
0,6
0,8
1,0
1,2
T1
T2
Mo
du
le d
e co
nse
rvat
ion
(M
Pa)
Mo
du
le d
e co
nse
rvat
ion
(M
Pa)
Température (°C) Température (°C)
POE
POE+ sel 2n1, O/Li=20 POE + sel 2n3, O/Li=20
POE + sel 2n7, O/Li=20
POE + sel 2n16, O/Li= 40
POE

Résumé
214
Figure 5. (a) conductivité de POE+ sel 1 vs POE+ sel 2n1, O/Li =20, (b) comparaison de la
conductivité de POE / sel 2 avec différentes longueurs de chaîne mPEG, O/Li= 30 pour sel
2n1, sel 2n3, sel 2n7 et O/Li= 40 pour sel 2n16.
Les coefficients de diffusion d'anions et Li+ sont plus faibles pour POE + sel 1 par
rapport à POE + sel 2. Toutefois, il a été montré précédemment que les conductivités sont très
proches à des températures supérieures à la température de fusion de l’électrolyte POE à la
même concentration. En ce qui concerne l'anion du sel 2, ses coefficients de diffusion diminuent
avec l'augmentation de la longueur de chaîne mPEG (à partir de n = 1 à n = 16). Au contraire,
les coefficients de diffusion de Li+ augmentent avec l'augmentation de longueur de chaîne
mPEG : ceci tient probablement à l’auto-solvatation du cation Li+ et à une plus grande mobilité
des sels auto-solvatés par rapport aux cations solvatés par les grandes chaînes de POE.
Les valeurs de T+ mesurées par PFG-RMN se situent entre 0,42 et 0,59. Tous les
électrolytes POE / sel 1 et 2 présentent des T+ plus élevés que ceux obtenus avec des électrolytes
POE/LiTFSI. Dans le cas du sel 2, l'allongement de mPEG induit une augmentation de T+.
Toutefois, l'incorporation des sel 2n7 et sel 2n16 dans le POE se traduit par des T+ inférieurs à
ceux des sels utilisés à l’état pur (sans POE). Dans le cas des sels purs l’auto-solvatation est
possible pour les sel 2n7 et sel 2n16. Leur dilution dans le POE se traduit par une compétition
entre auto-solvatation et solvatation partielle ou totale par les grandes chaînes POE, donc à une
diminution de la mobilité de Li+. Sauf pour le sel 2n7, T+ obtenus par EIS technique sont
proches de 0,5 (entre 0,5 et 0,55) et pour les sel 1, sel 2n1, sel 2n3, les valeurs sont plus élevées
que celles obtenues par PFG-RMN.
Co
nd
uct
ivit
é (S
/cm
)
1000/T (K-1)
Co
nd
uct
ivit
é (S
/cm
)
1
1
Sel 2n1
Sel 1
Sel 2n16
Sel 2n7
Sel 2n3
Sel 2n1

Résumé
215
NPC+Sel de lithium aromatique
Tout électrolyte polymère à base de POE subit une nette dégradation des propriétés
mécaniques au-dessus de la température de fusion (~60 °C). Par conséquent, afin d'améliorer la
tenue mécanique, ces sels ont été incorporés dans une matrice de POE réticulé.
Après l'élaboration de films de sel de lithium et de polycondensat linéaire (LPC), les
double liaisons du LPC ont été réticulées par irradiation UV pour former le POE réticulé ou
NPC.
A même concentration en sel et pour des temps d’irradiation identiques nous n’avons
pas observé une évolution importante et cohérente de Tg avec l'augmentation de la longueur de
chaîne de mPEG n = 1 à n = 7 ou avec l'augmentation du rapport O/Li. Toutefois, pour les NPC
+ sel 2n16, un comportement similaire POE + sel 2n16 a été observé. Ainsi, l’obtention de deux
Tgs (en DSC) et deux Ts (en DMA) confirment l’existence d'une séparation de phase (figure
6).
Figure 6. Module de stockage vs température pour divers sel 2 incorporés dans NPC hôte
polymère à O / Li = 30, temps d'irradiation 30 secondes et leurs Tan .
En ce qui concerne l'effet du temps de l'irradiation sur NPC + sel 2 complexes, une
légère augmentation de Tg, attribuable à une augmentation de la densité de réticulation, est
observée pour l'échantillon irradié 1 min par rapport à ceux irradiés pendant 30 secondes.
-100 -50 0 50 1000,1
1
10
100
1000
10000
Sto
rag
e M
odu
lus (
MP
a)
Temperature (°C)
NPC without salt
NPC+salt 2n1
NPC+salt 2n3
NPC+salt 2n7
NPC+salt 2n16
0,0
0,2
0,4
0,6
0,8
1,0
T1
T2
Mo
du
le d
e co
nse
rvat
ion
(M
Pa)
Température (°C)
Tan
NPC
NPC + Sel 2n1 NPC + Sel 2n3
NPC + Sel 2n7
NPC + Sel 2n16

Résumé
216
Les Tα du NPC + sel 2n3 et 2n7 sont inférieures à celles des NPC + sel 2n1. En outre,
les pics correspondant aux relaxations α sont très intenses et minces dans le cas des films à base
de sel 2n1, sel 2n3 et sel 2n7 par rapport à la membrane NPC. Ces résultats indiquent une plus
grande teneur en phase amorphe avec des tailles de domaines plus homogènes dans les
électrolytes NPC par rapport à NPC pur. En outre, la présence du plateau caoutchouteux après
la température de fusion démontre l'amélioration des propriétés mécaniques de ces films.
Les conductivités des électrolytes à base de POE + sel 2n16 sont légèrement supérieures
à celles des électrolytes à base de NPC-dessus de la température de fusion Tf tandis que, en
dessous de Tf, les conductivités des électrolytes à base NPC sont à peu près 10 fois plus élevées
(figure 7 (a)). La cristallinité et le Tf beaucoup plus faibles de NPC expliquent ce gain de
conductivité à basse température.
Les conductivités sont proches, dans toute la gamme de température, pour tous les
électrolytes quels que soient les longueurs de mPEG (figure 7 (b)).
Figure 7. (a) Conductivités vs 1000/T pour le sel 2n16 O/Li = 40 dans
POE et NPC matrice et (b) Conductivité vs température réciproque des différentes longueurs
de chaîne de sel 2 dans le matrice NPC à la concentration O/Li = 30 avec des temps
d'irradiation de 30 secondes.
.
T+ ainsi que les valeurs des coefficients de diffusion sont plus élevés pour tous les
électrolytes à base de NPC + sels par rapport à ceux des électrolytes POE + sels tandis que les
conductivités, à 110°C sont plus faibles.
Co
nd
uct
ivit
é (S
/cm
)
Co
nd
uct
ivit
é (S
/cm
)
POE/Sel 2n16, O/Li=40 NPC/Sel 2n16, O/Li=40
Sel 2n1, 30s Sel 2n3, 30s Sel 2n7, 30s Sel 2n16, 30s

Résumé
217
Chapitre III : Sels aliphatiques oligoéther de lithium à base de
perfluorosulfonate et de perfluorosulfonimidure
Objectif :
Dans le chapitre précédent, une famille de sels de lithium aryle-perfluorosulfonate fixée
sur oligoéther (mPEG) a été étudiée. La présence de mPEG dans la structure du sel a un impact
modéré sur le degré de cristallinité du polymère hôte mais améliore les T+ des électrolytes
polymères et les conductivités cationiques par rapport au sel non-fixé sur mPEG. La présence
du cycle aromatique dans la structure du sel généralement (i) augmente la viscosité du sel et (ii)
pourrait modifier l'interaction du sel avec le polymère hôte par rapport aux sels aliphatiques.
Par la suite, nous avons conçu des sels aliphatiques fixés sur mPEG et étudié l'impact de la
fixation de mPEG sur les anions et sur les performances des électrolytes polymères.
Ce chapitre est divisé en deux parties: (i) dans la première partie, nous présentons
comme une publication la caractérisation de deux sels, c’est à dire LiTPSM et LiTPSN dans
des électrolytes polymères à base de POE linéaire et réticulé NPC. (ii) dans la deuxième partie
les anions de LiTPSM et LiTPSN ont été modifiés pour les fixer sur des oligoéthers mPEG de
différentes longueurs.
Table 2 Sels de lithium aliphatiques étudiés dans la première partie de ce chapitre
Structures chimiques Sel de lithium
F3C
F2C
O
F2C
CF2
O2S
N
O2S
CF3
Li
LiTPSM
F3C
F2C
O
F2C
CF2
SO3Li
LiTPSN
Sel de lithium perfluoro alkyl sulfonimidure
Sel de lithium perfluoro alkylsulfonate

Résumé
218
Synthèse
LiTPSN a été réalisé par la neutralisation de l’acide perfluoro (2-éthoxyéthane)
sulfonique en solution aqueuse avec de l'hydroxyde de lithium (Schème 3).
F3C
F2C
O
F2C
CF2
SO3H
+ LiOH F3C
F2C
O
F2C
CF2
SO3
Li
+ H2O
Schème 3. Synthèse de LiTPSN.
La synthèse de LiTPSM a été réalisée en trois étapes (schéme 4).
F3C
F2C
O
F2C
CF2
O2S
F
CH2NH2
+
1) DCE, 50 °C
2) HClF3C
F2C
O
F2C
CF2
O2S
NHCH2
DIEA, DCM-10 °C to RT
F3C
O2S
O
O2S
CF3
F3C
F2C
O
F2C
CF2
O2S
N
SO2CF3
EtOH, LiOHF3C
F2C
O
F2C
CF2
O2S
N
SO2CF3
Li
Perfluoro(2-éthoxyéthane)sulfonyl fluoride
Benzyl sulfonamide
LiTPSM
Schème 4. Synthèse de LiTPSM.
Caractérisations
POE+ LiTPSM ou LiTPSN
LiTPSN induit ni une diminution significante de la cristallinité, ni une diminution des
températures de fusion. Au contraire, LiTPSM a un effet plus important à la fois sur la
cristallinité, sur Tf et sur Tg.

Résumé
219
Figure 8. Module de stockage en traction (E') et Tan vs température à 1 Hz pour POE,
POE/LiTPSM, POE/LiTPSN et POE/LiTFSI électrolytes à O/Li = 30.
Les courbes de DMA montrent que E' diminue fortement au-dessus de la température de fusion
des échantillons. LiTPSM et LiTFSI impactent davantage la phase cristalline que LiTPSN : la
baisse de E' à la T des électrolytes est beaucoup plus prononcée ainsi que la pente d (E')/dT
sur le plateau cristallin.
Figure 9. Comparaison de la conductivité en fonction de la concentration de sel dans
POE/LiTPSM: ( ) O/Li = 16, ( ) O/Li = 20, ( ) O/Li = 30 et POE/LiTPSN: (+) O/Li = 12,
( ) O / Li = 20, ( ) O / Li = 30 par rapport à POE/LiTFSI ( ) O / Li = 20.
Les conductivités les plus élevées, 5×10⁻⁴ S/cm à 70 °C et 2,6×10⁻⁶ S/cm à 20 °C, ont été
obtenues avec POE/LiTPSM à O/Li = 16. A la même concentration (O/Li = 20), POE/LiTPSM
Mo
du
le d
e co
nse
rvat
ion
(M
Pa)
Température (°C)
Tan
Co
nd
uct
ivit
é (S
/cm
)

Résumé
220
a montré les conductivités plus élevées que celles obtenues pour POE/LiTPSN mais toujours
légèrement inférieures à celles obtenues pour POE/LiTFSI.
Les nombres de transports cationiques T+ sont inférieurs à 0,5 pour les deux sels lorsque les sels
sont dissous dans le POE.
NPC+ LiTPSM ou LiTPSN
Grâce à la faible cristallinité et Tf de NPC, le LiTPSN peut conduire à électrolytes polymères
amorphes entre 29 et 34 °C, en fonction de la concentration de sel. LiTPSM, encore une fois, a
fourni des cristallinités et Tf proches de celles obtenues avec LiTFSI.
Figure 10. (a) Module de stockage en traction (E') et (b) Tan vs température à 1 Hz pour
NPC, NPC/LiTPSM, NPC/LiTPSN et NPC/LiTFSI électrolytes à O/Li = 30.
Une T légèrement plus élevée est obtenue pour les électrolytes NPC/LiTPSN par rapport à
NPC/LiTPSM ~ LiTFSI. La baisse de E' à T est beaucoup plus prononcée pour LiTPSM.
Tan
Température (°C) Température (°C)
Mo
du
le d
e co
nse
rvat
ion
(M
Pa)
NPC NPC/LiTFSI NPC/LiTPSM NPC/LiTPSN
NPC NPC/LiTFSI NPC/LiTPSM NPC/LiTPSN

Résumé
221
Figure 11. Comparaison de la conductivité en fonction de la concentration de sel dans
NPC/LiTPSM: ( ) O/Li = 12, ( ) O/Li = 20, ( ) O/Li = 30 et NPC/LiTPSN: ( ) O/Li = 12,
( ) O / Li = 20, ( ) O / Li = 30 par rapport à NPC/LiTFSI (×) O / Li = 12.
Les meilleures conductivités atteignant à 20°C, 1,6×10⁻⁵ S/cm et à 110 °C, 7,2×10⁻⁴ S/cm ont
été obtenues pour la composition O/Li = 20 de NPC/LiTPSM électrolyte.
Les T+ sont plus élevés avec des électrolytes à base de LiTPSN qu'avec ceux à base de LiTPSM
avec les deux techniques (PFG-NMR et EIS).
Afin d'étudier les performances des sels de lithium basé sur les 2 précédents sels à anions
sulfonate /sulfonylimidure fixés sur mPEG et de les comparer avec les sels LiTPSM et LiTPSN
nous avons modifié le 1,1,2,2, -tetrafluoro-2- (1,1,2,2, -tetrafluoro-2-iodoéthoxy ) éthane
fluorure de sulfonyle. Il est bien connu que le iodoperfluoalkyle est capable de s’additionner
sur une double liaison allylique. Ensuite le SO2F de RF peut être transformé en SO3Li par
hydrolyse en présence de lithine ou en sulfonimidure de Li. La partie fluorée de ces sels est très
proche de celle des sels LiTPSM et LiTPSN.
Ces sels sont présentés dans la Table 3.
Co
nd
uct
ivit
é (S
/cm
)

Résumé
222
Table 3 Sels de lithium aliphatiques étudiés dans la deuxième partie de ce chapitre
Structures chimiques Sel de lithium
O
O CF2CF2OCF2CF2SO3Li
I
Sel 3
O
O CF2CF2OCF2CF2SO3Lin
Sel 4
O
O CF2CF2OCF2CF2SO2NSO2CF3n
Li
Sel 5
Synthèse
O
OHn
Br
1) NaH
2)
O
On
+ NaBr
+ H2
O
On CF2CF2OCF2CF2SO2F
TTMSS, Bz2O2, Toluene
ICF2CF2OCF2CF2SO2F, Bz2O2
O
On CF2CF2OCF2CF2SO2F
I
O
On CF2CF2OCF2CF2SO3Li
I
LiOH, THF
O
On CF2CF2OCF2CF2SO2NSO2CF3
1) CF3SO2NH2, Triethylamine, 50°C
2) LiOH, THF, 40°C
Li
O
On CF2CF2OCF2CF2SO3LiLiOH, THF
Schème 5. Synthèse de sels de lithium aliphatiques.
Sel de lithium alkyl perfluorosulfonate oligooxyéthylène
Sel de lithium alkyl perfluorosulfonimidure oligooxyéthylène
n=1 et 3
n=3
mPEG
Sel 3
Sel 4
Sel 5

Résumé
223
Caractérisations
Sels de lithium
Les composés obtenus sont caractérisés par DSC.
En ce qui concerne les sels sulfonés, la fixation d'un mPEG à l'anion perfluorosulfoné
conduit à une diminution importante des valeurs de Tg et Tf. La présence d'iode volumineux et
polaire dans la structure du sel semble augmenter la Tg (sel 3n1) par rapport au sel 4n1 où l’iode
a été remplacé par H (sel 4n1) alors que le point de fusion et le H de fusion sont plus élevés
pour ce dernier. La présence de I peut augmenter la viscosité du sel et empêcher son
organisation. Cependant, l'augmentation de n de 1 à 3 (sel 4n3) conduit à une diminution
importante de Tg, Tf ainsi que de H de fusion.
En ce qui concerne les sels à base de sulfonimidure la fixation de mPEG n = 3 à l'anion
conduit à un sel complètement amorphe. C’est contraire aux résultats obtenus avec les sels de
référence, où le sel LiTPSM a une Tf plus élevée que LiTPSN. Pour le sel 5n3, nous supposons
que l’ajout de mPEG, crée le désordre en raison de l'interaction de Li+ avec le O de mPEG, et
que ce désordre devrait être plus important que dans le sel 4n3 en raison de l'asymétrie de
l’anion. Par rapport au sel 2n3 (chapitre 2) les Tg sont beaucoup plus faibles pour les sels
perfluorosulfonate aliphatiques, (sel 4n1 vs sel 2n1, sel 4n3 vs sel 2n3).
La présence de I dans la structure du sel 3n1 diminue considérablement la stabilité
thermique par rapport au sel 4n1 (lorsque le I a été remplacé par H). Toutefois, l'apparition de
la perte de poids est légèrement supérieure à celui du sel aromatique (par exemple le sel 2n3).
En ce qui concerne l'impact de la mPEG lié à l'anion sur la stabilité du sel, nous pouvons voir,
en comparant les courbes ATG de LiTPSN et LiTPSM avec celles des sel 4n3 et le sel 5n3, que
les seuils de perte de poids sont plus bas dans le cas des sels 4n3 et 5n3 mais qu’ils sont
supérieurs à celui de mPEG. Par conséquent, nous pouvons en conclure que les pertes en poids
des sels 4n1, 4n3 et 5n3 démarrent après la dégradation de mPEG. Les fragments formés
doivent interagir avec le Li+ retardant le début de perte de masse par rapport à celui du PEG
non-ionique : mPEG n16.

Résumé
224
Figure 12. ATG des sels de lithium aliphatiques.
En comparant le sel 4n3 et le sel 5n3 ayant le même n de mPEG, le sel à anion
sulfonimidure (sel 5n3) est plus conducteur que son homologue à anion sulfonate (sel 4n3). Ce
résultat peut être expliqué par la faible viscosité des sels, c’est-à-dire une plus grande mobilité,
comme le montre la DSC (Tg inférieure), mais aussi par une meilleure dissociation du sel à
anion sulfonimidure.
Figure 13. Conductivités des sels de lithium aliphatiques.
Per
te d
e p
oid
s ()
Température (°C)
Co
nd
uct
ivit
é (S
/cm
)
sel 4n3
sel 5n3
Sel 2n3
Sel 3
Sel 4n3
Sel 5n3
LiTPSN
LiTPSM mPEG n=16

Résumé
225
Le coefficient de diffusion 7D du sel 5n3 est supérieur à celui du sel 4n3. On peut
supposer que la viscosité du sel 5n3 est inférieure. Un plus faible degré de dissociation est
obtenu pour le sel 4n3 par rapport au sel 5n3.
Le nombre de transport cationique, T+, du sel 5n3 est supérieur à celui du sel 4n3 et
pourrait s’expliquer par une plus forte dissociation du sel 5n3.
Le sel 3 a une plus faible stabilité en oxydation. Le mur d'oxydation du sel 3 commence
à 4,5 V et est inférieur à celles du sel LiTPSN (4,9 V). Le remplacement de I par H induit une
augmentation du potentiel d'oxydation de 0,3 V qui le rapproche de LiTPSN et montre
l’instabilité en oxydation générée par l’atome d’iode (rupture radicalaire de la liaison C-I ?).
Les longueurs de chaîne de mPEG n’exercent aucun effet sur le potentiel d'oxydation.
En effet, à ces potentiels, les PEG ne sont pas stables. Le potentiel d'oxydation du sel 5n3 (4,7
V) est légèrement inférieur à celle du sel 4n3.
POE+Sel de lithium aliphatique
Caractérisations
En ce qui concerne l'impact de la taille de l'anion, pour la même concentration O/Li, on
observe une légère diminution de Tg avec l’augmentation de la longueur de chaîne mPEG (sel
4 n = 1 et n = 3), ce résultat est similaire à ceux rapportés sur le sel 2 (chapitre 2). Comme pour
le sel 2 une augmentation de Tf et de cristallinité est observée lorsque la valeur n du PEG
augmente. Les Tf et cristallinité les plus basses ont été obtenues pour le sel 5n3.
Toutes les observations en DMA amènent à la conclusion que la fixation d'un mPEG
sur des anions change considérablement les interactions entre le sel et le polymère hôte (POE).
La diminution dramatique du module de stockage après Tα peut être expliquée par une plus
forte teneur en phase amorphe en raison de la contribution du sel.
Les résultats corroborent ceux obtenus par DSC dans le premier balayage en
température, où la Tg du POE <POE+LiTPSN <POE + sel 4n1 <POE+sel 4n3 alors que Tf et
le H de fusion varient en sens opposé (POE> POE +LiTPSN> POE+sel 4n1> POE+sel 4n3)
(figure 14 (a).).
Si l'on compare les électrolytes POE+sel 2n3 (aromatique), POE+sel 4n3 (aliphatique)
et POE+sel5n3 (aliphatique), on observe que la Tα du sel de lithium aromatique est supérieure
à celles des sels de lithium aliphatiques. Ce comportement indique que la présence du noyau

Résumé
226
aromatique dans le sel induit à la fois (i) une plus grande rigidité du complexe (POE/sel) et (ii)
réduit l'impact du sel sur le degré de cristallisation du polymère hôte (POE) (figure 14 (b)).
Figure 14. Comparaison des propriétés mécaniques du sel 2n3 (aromatique) et des sels de
lithium aliphatiques à la concentration O/Li= 20.
Les conductivités des électrolytes polymères à base de mPEG aliphatique,
sulfonimidure (sel 5n3), aliphatique sulfonate (sel 4n3) et aromatique sulfonate (sel 2n3), et de
POE ont été comparées, le premier électrolyte s’avérant le plus conducteur dans toute la gamme
de températures explorée (figure 15).
Figure 15. Comparaison des conductivités des électrolytes polymères : POE/sel 2n3, POE/sel
4n3 et POE/sel 5n3, O/Li=20.
Tan
Tan
Température (°C)
Mo
du
le d
e co
nse
rvat
ion
(M
Pa)
Mo
du
le d
e co
nse
rvat
ion
(M
Pa)
Température (°C)
Co
nd
uct
ivit
é (S
/cm
)
POE+sel 2n3, O/Li=20 30s
POE+sel 5n3, O/Li=20 30s
POE+sel 4n3, O/Li=20 30s
POE+sel 4n3
POE
POE+sel 4n1
POE+LiTPSN
POE+sel 5n3
POE
POE+sel 4n3
POE+sel 2n3

Résumé
227
Les conductivités de l’électrolyte à base de sel 4n3 ne sont pour autant pas négligeables.
Ainsi ses conductivités sont au moins deux fois plus élevées que celles de l’électrolyte polymère
du sel 2n3. Ce résultat indique que la présence d’un cycle aromatique augmente la rigidité et la
viscosité de l'électrolyte polymère. Cette hypothèse est confortée par les résultats de DSC et de
DMA.
Les coefficients de diffusion des anions sont plus élevés que ceux de Li+ pour tous les
sels. Toutefois, ils sont plus faibles que ceux des anions de LiTPSM ou de LiTPSN.
Le coefficient de diffusion plus faible de l'anion dans le cas d'électrolytes polymères à
base de sel 3n1 est probablement dû à l'interaction de Li+ avec I qui porte une charge partielle
δ. Il est surprenant d’observer que les valeurs de 7D pour les sel 4n1, sel 4n3 et sel 5n3 sont
très proches.
Ce résultat souligne que 7D est indépendant de la longueur et de la nature des anions
discutés ici (sulfonate ou sulfoimidure). D’autre part les sels à base d’anion aliphatique ont des
coefficients de diffusion, anion et cation, supérieurs à ceux des sels incorporant un cycle
aromatique.
Dans le cas de l'anion sulfonate, T+ augmente avec l'augmentation du n de mPEG.
Cependant, malgré la masse molaire supérieure de l'anion du sel 3n1, son T+ est inférieur à
celui du sel 4n1. En outre, le T+ du sel 3n1 obtenu par des mesures électrochimiques est
inférieur à celui du LiTPSN. La présence d'iode dans la structure de sel doit ralentir la migration
de Li+. Nous pouvons noter également que les valeurs de T+ de LiTPSN et du sel 4n3 sont plus
élevées quand ils sont calculés à partir des mesures électrochimiques, tandis que pour le
LiTPSM et le sel 5n3, des résultats inverses sont obtenus. La fixation de l'anion mPEG conduit
à des électrolytes polymères ayant de meilleures conductivités cationiques et il semble que les
valeurs soient proches ou supérieures à celles obtenues pour POE/LiTFSI (1,74 x 10⁻⁴ S/cm).
NPC+Sel de lithium aliphatique
Caractérisations
Les valeurs de Tg et Tf d'électrolytes (NPC+sel) sont, malgré l’effet plastifiant des
anions, plus élevées que celles de la matrice hôte NPC. En ce qui concerne le temps d'irradiation
(30s vs 1 min), les membranes qui ont été réticulées pendant 1 mn ont de plus faible Tg et Tf
que celles irradiées pendant 30s. Un temps d'irradiation plus long devrait améliorer la densité

Résumé
228
de réticulation qui induit généralement une augmentation de Tg. Dans notre cas, l'obtention de
Tg plus basses peut s’expliquer par la diminution significative de cristallinité (phase cristalline
contraint la phase amorphe), qui contrebalance la rigidification produite par une densité de
réticulation plus élevée. En effet, la formation des ponts de réticulation crée du désordre et
empêche la cristallisation des segments de NPC.
L'évolution de la Tg avec la concentration ne suit pas la même tendance que pour les
électrolytes à base de POE, à savoir augmentation de la Tg avec la diminution de O/Li. Cela
peut être expliqué par le fait que la densité de réticulation peut être affectée par la concentration
en sel.
En ce qui concerne les propriétés mécaniques, nous avons observé que la fixation de
mPEG à l'anion de LiTPSN, induit une diminution 1) du module de stockage après la Tα, 2) de
la valeur de Tα 3) du module de stockage sur le plateau (après la fusion de NPC). L'impact sur
Tα et sur le module de stockage avant le point de fusion est similaire à celui du POE, cependant
l'effet du mPEG fixé à l'anion est moins spectaculaire. Cependant, la Tf ne semble pas être
affectée par la présence de mPEG (figure 16 (a)).
Concernant l'impact de mPEG sur le comportement mécanique des électrolytes à base
de LiTPSM (figure 16 (b)) anion les courbes sont très similaires avant le plateau caoutchouteux.
Sur le plateau caoutchouteux le module de conservation est à peu près 0,5 MPa pour l'électrolyte
NPC+LiTPSM tandis que pour NPC+sel 5n3 il est supérieur à 1 MPa. Ainsi, pour les
électrolytes polymères à base de sel 5n3 nous pouvons supposer un degré de réticulation plus
élevé.
Si l'on compare les temps d'irradiation, les membranes irradiées 1 mn ont un module de
stockage après fusion i.e.sur le plateau caoutchouteux) plus élevé en relation avec un degré de
réticulation plus élevé (figure 16 (c)).
En ce qui concerne l’influence de l’anion perfluorée, la Tα de NPC+sel 5n3 est inférieure
à celle de NPC+sel 4n3, en accord avec les Tg obtenues par DSC lors du premier balayage en
température. Cependant, au-dessus de Tα on observe une augmentation du module de stockage
pour l'électrolyte NPC+sel 5n3, en raison de la recristallisation de la membrane. Le module de
stockage sur le plateau caoutchouteux est plus élevé pour l'électrolyte à base de sel 5n3
probablement en raison du degré de réticulation plus élevé.

Résumé
229
Figure 16. Module de stockage en fonction de la température pour différents électrolytes
polymères à base du polymère hôte NPC à O/Li = 30 et à différents temps d’irradiation.
(a) NPC+LiTPSN et NPC+sel 4n3, O/Li= 30, 30 s, (b) NPC+LiTPSM et NPC+sel 5n3, O/Li=
30, 30 s, (c) NPC+sel 4 n3 et NPC+sel5n3, O/Li = 30, 30 s et 1 min (d) NPC+sel4n3 et
NPC+sel 5n3, O/Li = 30, 30s.
Les effets du polymère hôte (POE, NPC) sur les conductivités des électrolytes, basée
sur les sels 4n3, 5n3, sont comparées dans la figure 17. Les conductivités des électrolytes à
base de sel 4n3 + POE et de sel 5n3 + POE sont légèrement supérieures à celles des membranes
à base de NPC au-dessus de la température de fusion, Tf, tandis qu’en dessous de Tf, les
conductivités des électrolytes à base NPC sont environ 10 fois plus élevées. La cristallinité et
Tf beaucoup plus faibles de NPC expliquent ce gain de conductivité à basse température.
La fixation de la chaîne mPEG sur les anions de LiTPSN et LiTPSM permet de pointer
deux effets opposés. Ainsi, dans le cas d'anions TPSN- la conductivité augmente lors de sa
Tan
Tan
Tan
Tan
Température (°C)
Mo
du
le d
e co
nse
rvat
ion
(M
Pa)
Mo
du
le d
e co
nse
rvat
ion
(M
Pa)
Température (°C)
Mo
du
le d
e co
nse
rvat
ion
(M
Pa)
Mo
du
le d
e co
nse
rvat
ion
(M
Pa)
Température (°C) Température (°C)
sel 4n3, 30s
sel 4n3, 1min sel 4n3, 30s
sel 5n3, 30s
LiTPSN, 30s
sel 4n3, 30s sel 5n3, 30s
LiTPSM, 30s

Résumé
230
fixation sur mPEG ; un résultat similaire à celui obtenu avec des électrolytes polymères à base
de POE. Au contraire, la fixation de mPEG à TPSM- semble diminuer la conductivité ; un
résultat opposé à celui observé pour ce sel en solution dans POE. Une explication de ce
comportement opposé pourrait être le degré de réticulation du film à base de sel 5n3 plus élevée
par rapport au film à base LiTPSM et une diminution de la mobilité des chaînes POE comme
l’établit l'analyse DMA.
Figure 17. Comparaison des conductivités entre le sel 4n3 et le sel 5n3 dans les matrices POE
et NPC.
Co
nd
uct
ivit
é (S
/cm
)
1000/T (K-1)
POE/sel 4n3
POE/sel 5n3
NPC/sel 4n3
NPC/sel 5n3

Abstract
The new families of lithium-conducting ionic liquids; aromatic and aliphatic lithium salts based
on perfluorosulfonate and perfluorosulfonylimide anions attached to an oligoether (methoxy
polyethylene glycol mPEG) with different lengths were synthesized and characterized with the
aim to improve the salt interaction with the host polymer’s POE chains while keeping a high
segmental mobility. They allowed obtaining membranes with lower crystallization degree and
higher cationic transport number as compared with benchmarked salts. Their properties as
lithium salts were investigated in two types of host polymers i.e. a linear polyether (POE) and
a cross-linked polyether prepared by a ‘GREEN’ process. Their oligooxyethylene moieties
improve the lithium cation solvation leading to an increase in cationic transference numbers.
Their electrochemical and thermal stabilities are suitable for lithium battery application.
Key words: PEO; POE; Lithium salt; Polymer electrolyte; Ionic conductivity; Transference
numbers
Résumé
De nouvelles familles de liquides ioniques conducteurs par ion lithium; à anions aromatiques
et aliphatiques de type perfluorosulfonate perfluorosulfonylimidure attachés à des oligoéthers
(méthoxy polyéthylène glycol mPEG) de longueurs différentes ont été synthétisées et
caractérisées dans le but d'améliorer l'interaction entre les chaînes de POE et les sels de lithium
en améliorant la mobilité segmentaire. Ainsi différentes membranes amorphes ou peu
cristallines améliorent le transport cationique par rapport aux électrolytes polymères usuels.
Leurs propriétés ont été évaluées dans deux types de polymères hôtes : un polyéther linéaire
(POE) et un polyéther réticulé préparé par un procédé "VERT". Leurs parties oligooxyéthylène
aident à la solvatation des cations lithium et conduisent à l'augmentation des propriétés de
transport; c’est à dire la conductivité cationique et le nombre de transport. Leurs stabilités
thermiques et électrochimiques sont adaptées à l'application batterie lithium-polymère.
Mots-clés : PEO; POE; sel de lithium; Electrolyte polymère; Conductivité ionique; Nombre
de transport.