Exploration of meaningful subspecies definitions of the carnivorous Northern Pitcher Plant...
10
RESEARCH ARTICLE Exploration of meaningful subspecies definitions of the carnivorous Northern Pitcher Plant (Sarracenia purpurea), throughout its geographic distribution Jennifer M. Karberg • Margaret R. Gale Received: 15 January 2010 / Accepted: 11 August 2010 / Published online: 31 August 2010 Ó Springer Science+Business Media B.V. 2010 Abstract The carnivorous wetland plant, Sarracenia pur- purea (the northern pitcher plant) is native to eastern and Midwestern North America. This species is abundant within its habitat but suitable habitat is increasingly scarce, raising interest in S. purpurea restoration and conservation. Compli- cating conservation planning, two controversial subspecies of S. purpurea are historically defined primarily on morphologic traits: S. purpurea subsp. purpurea distributed north of Mary- land and S. purpurea subsp. venosa distributed south of Maryland. S. purpurea is also found in three distinct habitat types defined by substrate: acidic Sphagnum peatlands, acidic sandy savannahs, and alkaline marl wetlands. In species level studies, S. purpurea leaves have exhibited morphological plasticity in response to environmental variability, bringing into question the validity of subspecies definitions based on mor- phology alone. This study examined morphologic and genetic variation throughout S. purpurea’s natural distribution, encompassing both the traditional subspecies and three unique habitat types testing the validity of traditional subspecies defi- nitions. Genetic analysis indicated possible ecological signifi- cance of considering a new grouping of S. purpurea populations into Midwest, N. East Coast and S. East Coast populations (AMOVA % variation = 13.34, P = 0.0078) based on genetic differentiation. Morphological variation in leaf shape mea- surements supported this division as well as indicating plasticity associated with environmental variables. This study conserva- tively suggests that new, geographical area conservation units may be a more important conservation unit for preserving S. purpurea genetic variation and morphological plasticity than traditional subspecies definitions. Keywords Wetlands Conservation genetics Sarracenia purpurea Subspecies definition Carnivorous plants Introduction Habitat alteration and fragmentation often function as drivers of species declines and extinctions (Fahrig 2002; Frankham et al. 2004). Conservation research explores ways to successfully understand and plan ecosystem res- toration, typically with the intent to restore or preserve a particular endangered or threatened species. In plant con- servation, the question arises as to which level to conserve a species to gain the most beneficial conservation result: at the entire species-level, subspecies-level or even at the individual population level (Haig et al. 2006; Leadlay and Jury 2006). In the United States, legal prioritization for species restoration is controlled by the Endangered Species Act, which allows the listing of ecologically important subspecies and other groupings for federal protection (Haig et al. 2006), yet no standardized definition of what consti- tutes a plant subspecies exists. Traditionally plant subspe- cies definitions have been primarily applied using one or two morphological traits (Haig et al. 2006). A subspecies designation can most often refer to geographic variation present within a species (morphological response to Electronic supplementary material The online version of this article (doi:10.1007/s10592-010-0123-7) contains supplementary material, which is available to authorized users. J. M. Karberg (&) Science and Stewardship Department, Nantucket Conservation Foundation, 118 Cliff Dr, Nantucket, MA 02554, USA e-mail: [email protected] M. R. Gale School of Forest Resources and Environmental Science, Michigan Technological University, 1400 Townsend Dr, Houghton, MI 49931, USA 123 Conserv Genet (2010) 11:2369–2378 DOI 10.1007/s10592-010-0123-7
-
Upload
independent -
Category
Documents
-
view
0 -
download
0
Transcript of Exploration of meaningful subspecies definitions of the carnivorous Northern Pitcher Plant...
RESEARCH ARTICLE
Exploration of meaningful subspecies definitionsof the carnivorous Northern Pitcher Plant (Sarracenia purpurea),throughout its geographic distribution
Jennifer M. Karberg • Margaret R. Gale
Received: 15 January 2010 / Accepted: 11 August 2010 / Published online: 31 August 2010
� Springer Science+Business Media B.V. 2010
Abstract The carnivorous wetland plant, Sarracenia pur-
purea (the northern pitcher plant) is native to eastern and
Midwestern North America. This species is abundant within its
habitat but suitable habitat is increasingly scarce, raising
interest in S. purpurea restoration and conservation. Compli-
cating conservation planning, two controversial subspecies of
S. purpurea are historically defined primarily on morphologic
traits: S. purpurea subsp. purpurea distributed north of Mary-
land and S. purpurea subsp. venosa distributed south of
Maryland. S. purpurea is also found in three distinct habitat
types defined by substrate: acidic Sphagnum peatlands, acidic
sandy savannahs, and alkaline marl wetlands. In species level
studies, S. purpurea leaves have exhibited morphological
plasticity in response to environmental variability, bringing into
question the validity of subspecies definitions based on mor-
phology alone. This study examined morphologic and genetic
variation throughout S. purpurea’s natural distribution,
encompassing both the traditional subspecies and three unique
habitat types testing the validity of traditional subspecies defi-
nitions. Genetic analysis indicated possible ecological signifi-
cance of considering a new grouping of S. purpurea populations
into Midwest, N. East Coast and S. East Coast populations
(AMOVA % variation = 13.34, P = 0.0078) based on genetic
differentiation. Morphological variation in leaf shape mea-
surements supported this division as well as indicating plasticity
associated with environmental variables. This study conserva-
tively suggests that new, geographical area conservation units
may be a more important conservation unit for preserving
S. purpurea genetic variation and morphological plasticity than
traditional subspecies definitions.
Keywords Wetlands � Conservation genetics �Sarracenia purpurea � Subspecies definition � Carnivorous
plants
Introduction
Habitat alteration and fragmentation often function as
drivers of species declines and extinctions (Fahrig 2002;
Frankham et al. 2004). Conservation research explores
ways to successfully understand and plan ecosystem res-
toration, typically with the intent to restore or preserve a
particular endangered or threatened species. In plant con-
servation, the question arises as to which level to conserve a
species to gain the most beneficial conservation result: at
the entire species-level, subspecies-level or even at the
individual population level (Haig et al. 2006; Leadlay and
Jury 2006). In the United States, legal prioritization for
species restoration is controlled by the Endangered Species
Act, which allows the listing of ecologically important
subspecies and other groupings for federal protection (Haig
et al. 2006), yet no standardized definition of what consti-
tutes a plant subspecies exists. Traditionally plant subspe-
cies definitions have been primarily applied using one or
two morphological traits (Haig et al. 2006). A subspecies
designation can most often refer to geographic variation
present within a species (morphological response to
Electronic supplementary material The online version of thisarticle (doi:10.1007/s10592-010-0123-7) contains supplementarymaterial, which is available to authorized users.
J. M. Karberg (&)
Science and Stewardship Department, Nantucket Conservation
Foundation, 118 Cliff Dr, Nantucket, MA 02554, USA
e-mail: [email protected]
M. R. Gale
School of Forest Resources and Environmental Science,
Michigan Technological University, 1400 Townsend Dr,
Houghton, MI 49931, USA
123
Conserv Genet (2010) 11:2369–2378
DOI 10.1007/s10592-010-0123-7
environmental characters within a particular geographic
region) or an evolutionary step (i.e. subspecies on the
evolutionary path to becoming individual species) within a
species (Hamilton and Reichard 1992). Each of these two
characterizations of plant subspecies often reflects impor-
tant ecological differences that many increase the prioriti-
zation for conservation needs. Understanding the ecological
relevance of a defined categorization for a particular plant
of concern can have great import on planning successful
conservation across a species’ range.
Carnivorous plants, plants that utilize digested nutrients
from insects for plant nutrition, are represented in many
biomes across the world with North America species
concentrated in nutrient poor wetland environments
(Christensen 1976; Givnish 1989; Schnell 2002). Sarrace-
niaceae, the pitcher plant family, is the most common
carnivorous plant family in North America (Schnell 2002).
Of the estimated nine species within the Sarracenia genus,
Sarracenia purpurea (the northern pitcher plant) represents
the most widespread pitcher plant, distributed from north-
ern Canada, through the Midwest and along the East Coast
to Florida (Schnell 2002). S. purpurea is a long-lived
perennial plant (35–50 years) reproducing both clonally
(spreading through rhizomes) and sexually (setting viable
seeds) (Schnell 2002). S. purpurea individuals are abun-
dant within their habitat yet that habitat is becoming
increasingly rare due to anthropogenic landscape devel-
opment and habitat alteration making conservation an
increasing concern, particularly in southern distributions
and in developing Midwestern areas (Schnell 2002).
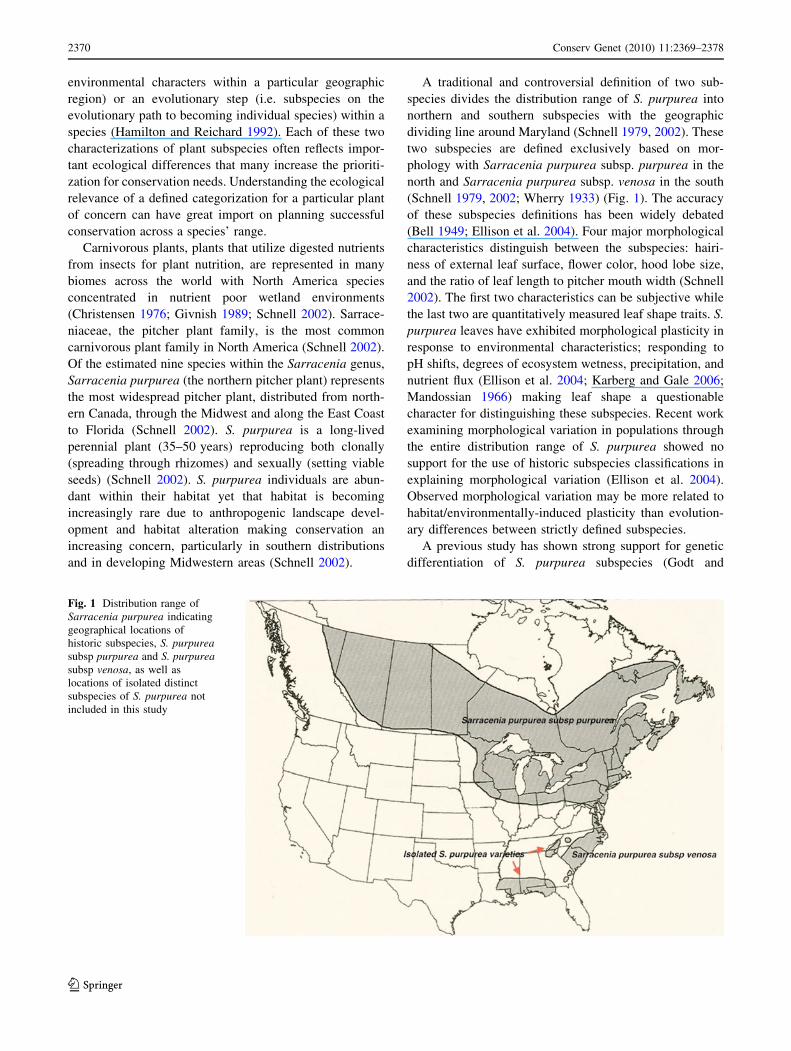
A traditional and controversial definition of two sub-
species divides the distribution range of S. purpurea into
northern and southern subspecies with the geographic
dividing line around Maryland (Schnell 1979, 2002). These
two subspecies are defined exclusively based on mor-
phology with Sarracenia purpurea subsp. purpurea in the
north and Sarracenia purpurea subsp. venosa in the south
(Schnell 1979, 2002; Wherry 1933) (Fig. 1). The accuracy
of these subspecies definitions has been widely debated
(Bell 1949; Ellison et al. 2004). Four major morphological
characteristics distinguish between the subspecies: hairi-
ness of external leaf surface, flower color, hood lobe size,
and the ratio of leaf length to pitcher mouth width (Schnell
2002). The first two characteristics can be subjective while
the last two are quantitatively measured leaf shape traits. S.
purpurea leaves have exhibited morphological plasticity in
response to environmental characteristics; responding to
pH shifts, degrees of ecosystem wetness, precipitation, and
nutrient flux (Ellison et al. 2004; Karberg and Gale 2006;
Mandossian 1966) making leaf shape a questionable
character for distinguishing these subspecies. Recent work
examining morphological variation in populations through
the entire distribution range of S. purpurea showed no
support for the use of historic subspecies classifications in
explaining morphological variation (Ellison et al. 2004).
Observed morphological variation may be more related to
habitat/environmentally-induced plasticity than evolution-
ary differences between strictly defined subspecies.
A previous study has shown strong support for genetic
differentiation of S. purpurea subspecies (Godt and
Fig. 1 Distribution range of
Sarracenia purpurea indicating
geographical locations of
historic subspecies, S. purpureasubsp purpurea and S. purpureasubsp venosa, as well as
locations of isolated distinct
subspecies of S. purpurea not
included in this study
2370 Conserv Genet (2010) 11:2369–2378
123
Hamrick 1999). This study attempted to examine genetic
differentiation between S. purpurea subsp purpurea and
three varieties of S. purpurea subsp venosa (vars. burkii,
montana, venosa) using only two sampled populations of
each. Observed genetic differentiation between S. purpurea
subsp purpurea and S. purpurea subsp venosa maybe be a
result of the inclusion of two very isolated and divergent
varieties (vars. burkii and montana), which are isolated
from the otherwise continuous distribution range of
S. purpurea. Examination of the genetic relatedness of just
S. purpurea subsp purpurea and S. purpurea subsp venosa
may show less strong differentiation. S. purpurea is pre-
dominantly a clonal species and tends to show moderate to
low levels of genetic diversity with fairly low genetic
differentiation between populations (GST ranging from
0.072–0.038) even across great distances (Karberg and
Gale 2006; Parisod et al. 2005; Schwaegerle and Schaal
1979) although Schwaegerle and Schaal (1979) found
increased levels of genetic differentiation between popu-
lations when sampling across the species range, not con-
sidering subspecies differentiation.
In addition to conflicting results from studies of mor-
phologic and genetic variation, Sarracenia purpurea
inhabits three environmentally distinct habitat types across
its range (Schnell 2002), perhaps contributing to observed
variation in leaf morphology and the observed genetic vari-
ation resulting from localized genetic adaptations. S. pur-
purea populations found within the historic northern
subspecies distribution can be located in two very different
habitat types. The typical habitat type in northern regions is
an acidic, fairly low nutrient, Sphagnum-dominated peatland
(Schnell 2002). The second habitat, found primarily around
the Midwestern Great Lakes region, is an extremely alkaline,
calcareous marl wetland (Schnell 2002). Only one habitat
type is typically found within the range of the southern
subspecies and it is an acidic peaty-sand savannah with lower
nutrient concentrations (Schnell 2002). No clear under-
standing exists about the effect of habitat type on morpho-
logic and genetic variation in S. purpurea. The interaction of
both habitat type as defined by substrate and geographic
distance between populations may be influencing observed
morphological and genetic variation that has previously been
attributed to a strict North/South subspecies definition.
The purpose of this study was to examine the genetic
structure of Sarracenia purpurea populations across the
species’ continuous range in an attempt to verify historic
subspecies definitions of S. purpurea subsp purpurea and S.
purpurea subsp venosa. Our goal was to utilize previously
understudied molecular markers (ISSR sequences) to define
populations in a way that site managers can easily replicate
in order to designate specific populations for conservation
planning, and select seed sources for restoration planning.
Thus our objectives in this paper were to (1) determine if
genetic and morphological patterns together substantiate the
traditional subspecies definition, and (2) if these definitions
do not hold, determine if a different subspecies definition for
S. purpurea can be defined to aid in designing successful,
economic, and efficient conservation.
Methods
Sample collection
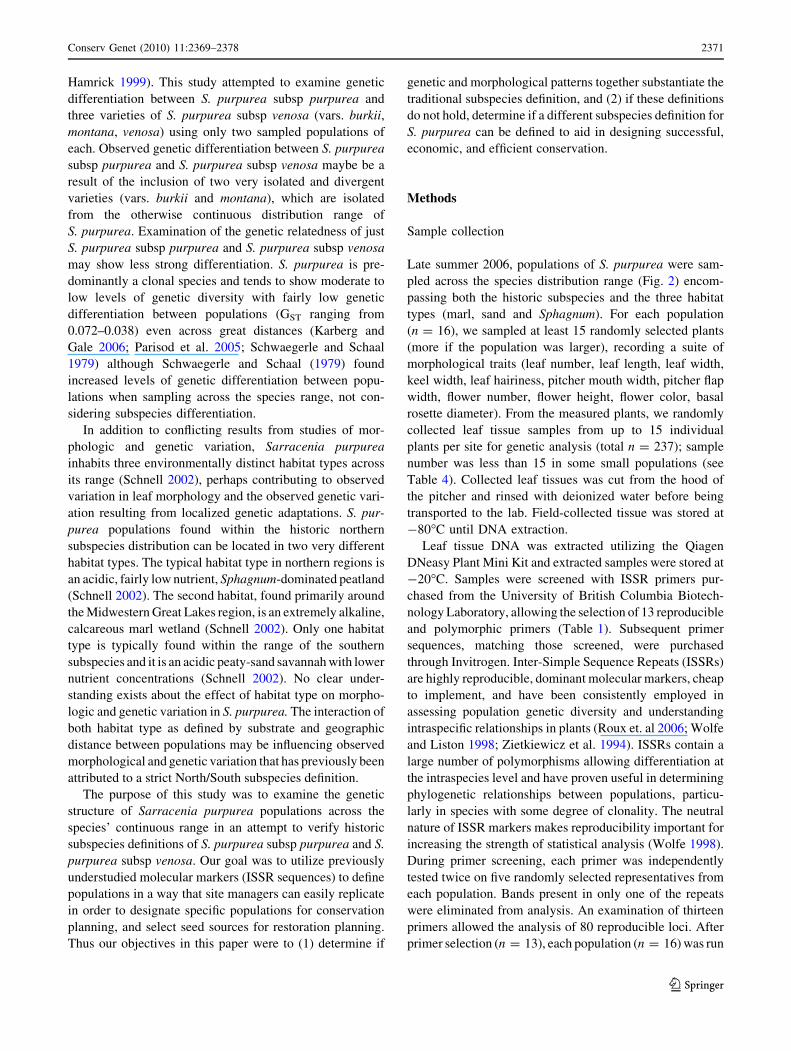
Late summer 2006, populations of S. purpurea were sam-
pled across the species distribution range (Fig. 2) encom-
passing both the historic subspecies and the three habitat
types (marl, sand and Sphagnum). For each population
(n = 16), we sampled at least 15 randomly selected plants
(more if the population was larger), recording a suite of
morphological traits (leaf number, leaf length, leaf width,
keel width, leaf hairiness, pitcher mouth width, pitcher flap
width, flower number, flower height, flower color, basal
rosette diameter). From the measured plants, we randomly
collected leaf tissue samples from up to 15 individual
plants per site for genetic analysis (total n = 237); sample
number was less than 15 in some small populations (see
Table 4). Collected leaf tissues was cut from the hood of
the pitcher and rinsed with deionized water before being
transported to the lab. Field-collected tissue was stored at
-80�C until DNA extraction.
Leaf tissue DNA was extracted utilizing the Qiagen
DNeasy Plant Mini Kit and extracted samples were stored at
-20�C. Samples were screened with ISSR primers pur-
chased from the University of British Columbia Biotech-
nology Laboratory, allowing the selection of 13 reproducible
and polymorphic primers (Table 1). Subsequent primer
sequences, matching those screened, were purchased
through Invitrogen. Inter-Simple Sequence Repeats (ISSRs)
are highly reproducible, dominant molecular markers, cheap
to implement, and have been consistently employed in
assessing population genetic diversity and understanding
intraspecific relationships in plants (Roux et. al 2006; Wolfe
and Liston 1998; Zietkiewicz et al. 1994). ISSRs contain a
large number of polymorphisms allowing differentiation at
the intraspecies level and have proven useful in determining
phylogenetic relationships between populations, particu-
larly in species with some degree of clonality. The neutral
nature of ISSR markers makes reproducibility important for
increasing the strength of statistical analysis (Wolfe 1998).
During primer screening, each primer was independently
tested twice on five randomly selected representatives from
each population. Bands present in only one of the repeats
were eliminated from analysis. An examination of thirteen
primers allowed the analysis of 80 reproducible loci. After
primer selection (n = 13), each population (n = 16) was run
Conserv Genet (2010) 11:2369–2378 2371
123
through two independent Polymerase Chain Reactions
(PCRs) for each primer to reduce error that may occur during
PCR. Additionally, to further reduce the chance of proce-
dural errors, two negative controls were run with each PCR.
These precautions gave the authors strong confidence in the
accuracy of examined bands. Laboratory constructed PCR
Master Mix was a 15 ll reaction mixture of 2 ll DNA in
solution, 1 ll of GoGreen Taq polymerase in solution, 2.5 ll
of reaction buffer, 1.9 ll of MgCl2, 0.25 ll of dNTPs, 6.35 ll
of double-distilled water, and 1 ll of primer. The PCR
thermocycler program consisted of an initial denaturing step
of 4 min at 94�C followed by 1 min at 72�C, 1 min at primer
optimal Tm8C (Table 1), and 1 min at 94�C for 45 cycles.
PCR product was then separated on a 1% agarose electro-
phoresis gel, with a 1 kb ladder, stained in ethidium bromide
and visualized using a digital camera.
Sample analysis
A principal component analysis (PCA) based on a Pearson’s
correlation matrix was constructed using sampled mor-
phological measurements and transformations (flower
number, flower height, plant basal diameter, leaf number,
leaf length, leaf hairiness, pitcher mouth width ratio of
pitcher length to pitcher mouth width and ratio of keel width
to leaf width) to determine the characteristics that explained
the majority of variation observed between individual
populations. Two measured morphological characters
Fig. 2 Population sample
locations across the range of
Sarracenia purpurea. State-
level grouping circles indicate
assigned geographic area
classification (Midwest, North
East Coast, and South East
Coast). Population marker
shapes indicate substrate type
(filled circle Marl, filled starSand, and filled triangleSphagnum sites)
Table 1 Inter simple sequence repeat (ISSRs) primer sequences and
Tm �C selected for population analysis
Primer name Sequence: (50–30) Concentration Tm�C
830 TGTGTGTGTGTGTGTGG 274 52
836 AGAGAGAGAGAGAGAGYA 179 53
842 GAGAGAGAGAGAGAGAYG 186 55
850 GTGTGTGTGTGTGTGTYC 260 55
851 GTGTGTGTGTGTGTGTYG 262 55
854 TCTCTCTCTCTCTCTCRG 298 55
864 ATGATGATGATGATGATG 265 48
874 CCCTCCCTCCCTCCCT 255 56
880 GGAGAGGAGAGGAGA 167 48
872 GATAGATAGATAGATA 224 40
826 ACACACACACACACACC 250 52
2372 Conserv Genet (2010) 11:2369–2378
123
consistently explained the majority of observed variation
among populations, flower height and leaf length.
Examination of population groupings from the principal
component analysis suggested the establishment of a geo-
graphical area grouping of the data for statistical analysis in
addition to the a priori establishment of groupings by his-
toric subspecies and substrate type. Three geographical
areas were defined as (1) Midwest, (2) Northern East Coast,
and (3) Southern East Coast (Fig. 2).
A one-way analysis of variance (ANOVA) examined the
differences of the two characters (flower height and leaf
length) as partitioned within four population groupings: (1)
all populations; (2) northern and southern subspecies; (3)
three substrate types—marl, sand, Sphagnum; and (4)
geographical area—Midwest, N. East Coast, and S. East
Coast populations. We also examined a one-way analysis
of variance (ANOVA) of the ratio of leaf length to pitcher
mouth width and the ratio of keel width to leaf width, as
these transformations have shown a strong relationship to
environmental variation, particularly pore-water nitrogen
concentrations (Ellison et al. 2004). A Tukey analysis of
mean differences examined partitioning of morphological
variability among the different population groupings.
Analysis of all morphological characters was conducted
using the R statistical package (Team RDC 2006).
For the molecular data, 16 populations were explored
using 13 reproducible ISSR primers. Polymorphic bands
were scored as 1 (present) or 0 (absent) for analysis. All
analyses assumed dominant, diallelic markers in Hardy-
Weinberg equilibrium (Lynch and Milligan 1994). Patterns
of genetic variation were examined through an AMOVA
(analysis of molecular variation). Four different AMOVAs
were explored: (1) all populations; (2) northern and
southern subspecies; (3) substrate type and (4) geographic
area. Genetic structure in the AMOVA was calculated from
Euclidian square genetic distance. Calculated genetic dis-
tances were also used to perform Mantel’s test of geo-
graphic distance (Meirmans and Van Tendering 2004).
AMOVAs were conducted using Arlequin ver. 3.0
(Schneider et al. 2005).
Using POPGENE ver. 1.31 (Yeh et al. 1997) we cal-
culated two genetic diversity measures on all populations,
Nei’s measure of genetic diversity (H = 1 – Rpi2) and
Shannon’s information index (I = Rpi log pi) where pi is
the frequency of alleles in a population (Lewontin 1972)
assuming Hardy–Weinberg equilibrium. We calculated
Nei’s GST (GST = (1 – (HS/HT)), a measurement of pop-
ulation differentiation, essentially the proportion of genetic
diversity among populations (Nei 1973). Presence and
absence of individual allele loci between populations were
examined for patterns of allelic differences between
populations.
Results
Morphological data
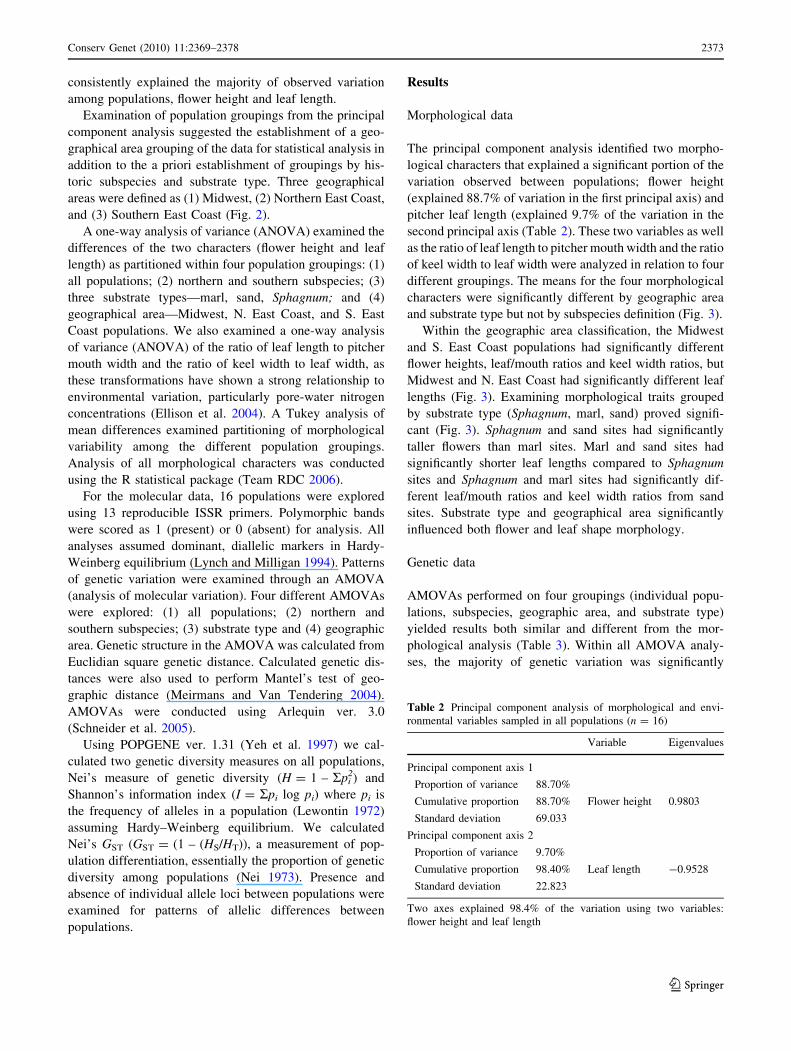
The principal component analysis identified two morpho-
logical characters that explained a significant portion of the
variation observed between populations; flower height
(explained 88.7% of variation in the first principal axis) and
pitcher leaf length (explained 9.7% of the variation in the
second principal axis (Table 2). These two variables as well
as the ratio of leaf length to pitcher mouth width and the ratio
of keel width to leaf width were analyzed in relation to four
different groupings. The means for the four morphological
characters were significantly different by geographic area
and substrate type but not by subspecies definition (Fig. 3).
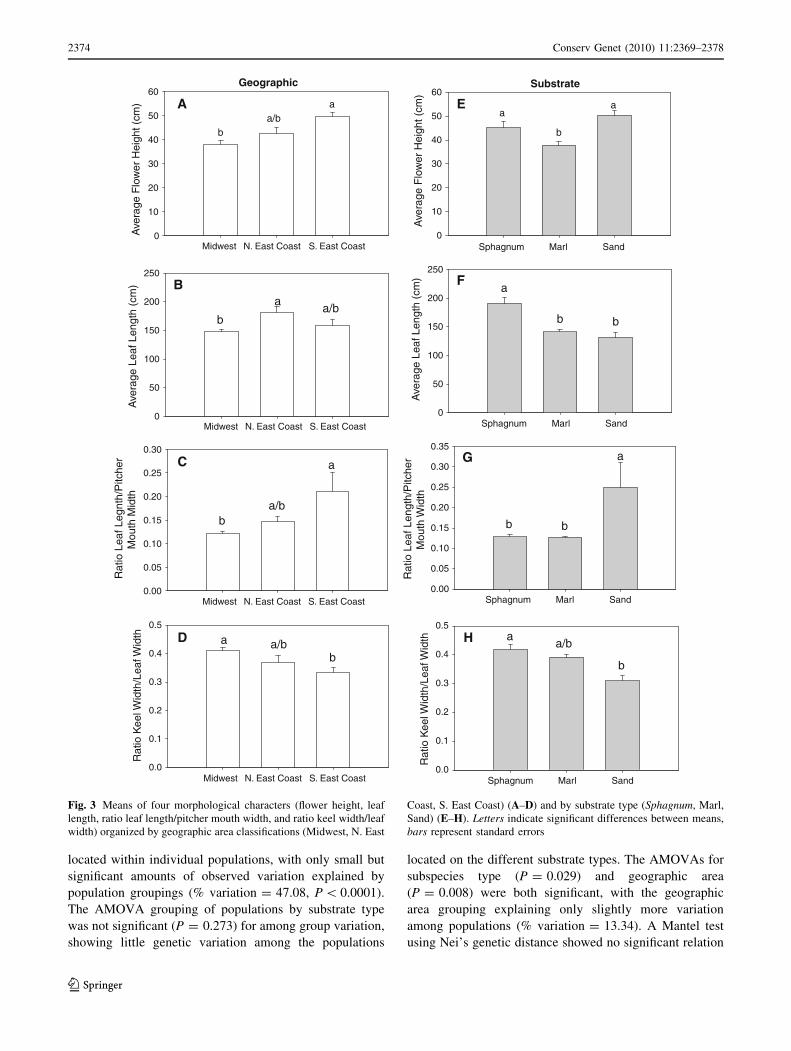
Within the geographic area classification, the Midwest
and S. East Coast populations had significantly different
flower heights, leaf/mouth ratios and keel width ratios, but
Midwest and N. East Coast had significantly different leaf
lengths (Fig. 3). Examining morphological traits grouped
by substrate type (Sphagnum, marl, sand) proved signifi-
cant (Fig. 3). Sphagnum and sand sites had significantly
taller flowers than marl sites. Marl and sand sites had
significantly shorter leaf lengths compared to Sphagnum
sites and Sphagnum and marl sites had significantly dif-
ferent leaf/mouth ratios and keel width ratios from sand
sites. Substrate type and geographical area significantly
influenced both flower and leaf shape morphology.
Genetic data
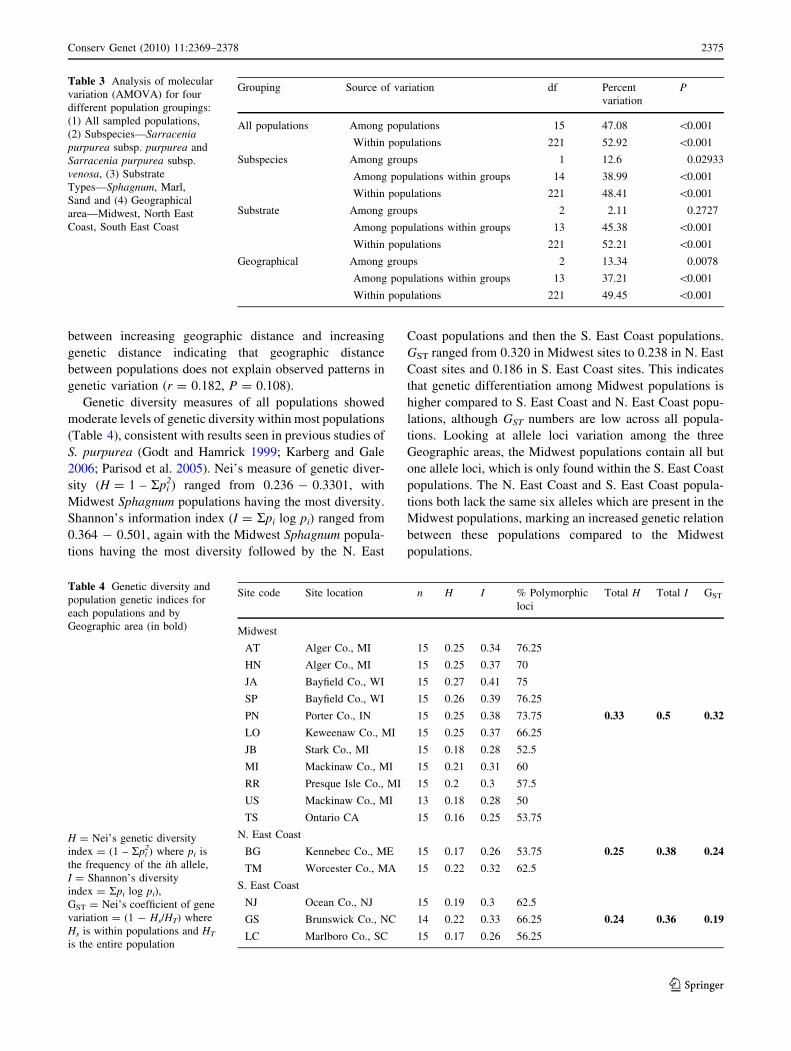
AMOVAs performed on four groupings (individual popu-
lations, subspecies, geographic area, and substrate type)
yielded results both similar and different from the mor-
phological analysis (Table 3). Within all AMOVA analy-
ses, the majority of genetic variation was significantly
Table 2 Principal component analysis of morphological and envi-
ronmental variables sampled in all populations (n = 16)
Variable Eigenvalues
Principal component axis 1
Proportion of variance 88.70%
Cumulative proportion 88.70% Flower height 0.9803
Standard deviation 69.033
Principal component axis 2
Proportion of variance 9.70%
Cumulative proportion 98.40% Leaf length -0.9528
Standard deviation 22.823
Two axes explained 98.4% of the variation using two variables:
flower height and leaf length
Conserv Genet (2010) 11:2369–2378 2373
123
located within individual populations, with only small but
significant amounts of observed variation explained by
population groupings (% variation = 47.08, P \ 0.0001).
The AMOVA grouping of populations by substrate type
was not significant (P = 0.273) for among group variation,
showing little genetic variation among the populations
located on the different substrate types. The AMOVAs for
subspecies type (P = 0.029) and geographic area
(P = 0.008) were both significant, with the geographic
area grouping explaining only slightly more variation
among populations (% variation = 13.34). A Mantel test
using Nei’s genetic distance showed no significant relation
Geographic
Ave
rage
Flo
wer
Hei
ght (
cm)
0
10
20
30
40
50
60
Ave
rage
Lea
f Len
gth
(cm
)
0
50
100
150
200
250
Rat
io L
eaf L
egnt
h/P
itche
r
Mou
th M
idth
0.00
0.05
0.10
0.15
0.20
0.25
0.30
Rat
io K
eel W
idth
/Lea
f Wid
th
0.0
0.1
0.2
0.3
0.4
0.5
Substrate
Ave
rage
Flo
wer
Hei
ght (
cm)
0
10
20
30
40
50
60
Ave
rage
Lea
f Len
gth
(cm
)0
50
100
150
200
250
Rat
io L
eaf L
engt
h/P
itche
r
Mou
th W
idth
0.00
0.05
0.10
0.15
0.20
0.25
0.30
0.35
Midwest N. East Coast S. East Coast
Midwest N. East Coast S. East Coast
Midwest N. East Coast S. East Coast
Midwest N. East Coast S. East Coast
Sphagnum Marl Sand
Sphagnum Marl Sand
Sphagnum Marl Sand
Sphagnum Marl Sand
Rat
io K
eel W
idth
/Lea
f Wid
th
0.0
0.1
0.2
0.3
0.4
0.5
ba/b
a
aa
aa
aa
aa
a/ba/b
a/b
a/b
bb
b bb
b b b
b
A E
B F
C G
HD
Fig. 3 Means of four morphological characters (flower height, leaf
length, ratio leaf length/pitcher mouth width, and ratio keel width/leaf
width) organized by geographic area classifications (Midwest, N. East
Coast, S. East Coast) (A–D) and by substrate type (Sphagnum, Marl,
Sand) (E–H). Letters indicate significant differences between means,
bars represent standard errors
2374 Conserv Genet (2010) 11:2369–2378
123
between increasing geographic distance and increasing
genetic distance indicating that geographic distance
between populations does not explain observed patterns in
genetic variation (r = 0.182, P = 0.108).
Genetic diversity measures of all populations showed
moderate levels of genetic diversity within most populations
(Table 4), consistent with results seen in previous studies of
S. purpurea (Godt and Hamrick 1999; Karberg and Gale
2006; Parisod et al. 2005). Nei’s measure of genetic diver-
sity (H = 1 – Rpi2) ranged from 0.236 - 0.3301, with
Midwest Sphagnum populations having the most diversity.
Shannon’s information index (I = Rpi log pi) ranged from
0.364 - 0.501, again with the Midwest Sphagnum popula-
tions having the most diversity followed by the N. East
Coast populations and then the S. East Coast populations.
GST ranged from 0.320 in Midwest sites to 0.238 in N. East
Coast sites and 0.186 in S. East Coast sites. This indicates
that genetic differentiation among Midwest populations is
higher compared to S. East Coast and N. East Coast popu-
lations, although GST numbers are low across all popula-
tions. Looking at allele loci variation among the three
Geographic areas, the Midwest populations contain all but
one allele loci, which is only found within the S. East Coast
populations. The N. East Coast and S. East Coast popula-
tions both lack the same six alleles which are present in the
Midwest populations, marking an increased genetic relation
between these populations compared to the Midwest
populations.
Table 3 Analysis of molecular
variation (AMOVA) for four
different population groupings:
(1) All sampled populations,
(2) Subspecies—Sarraceniapurpurea subsp. purpurea and
Sarracenia purpurea subsp.
venosa, (3) Substrate
Types—Sphagnum, Marl,
Sand and (4) Geographical
area—Midwest, North East
Coast, South East Coast
Grouping Source of variation df Percent
variation
P
All populations Among populations 15 47.08 \0.001
Within populations 221 52.92 \0.001
Subspecies Among groups 1 12.6 0.02933
Among populations within groups 14 38.99 \0.001
Within populations 221 48.41 \0.001
Substrate Among groups 2 2.11 0.2727
Among populations within groups 13 45.38 \0.001
Within populations 221 52.21 \0.001
Geographical Among groups 2 13.34 0.0078
Among populations within groups 13 37.21 \0.001
Within populations 221 49.45 \0.001
Table 4 Genetic diversity and
population genetic indices for
each populations and by
Geographic area (in bold)
H = Nei’s genetic diversity
index = (1 – Rpi2) where pi is
the frequency of the ith allele,
I = Shannon’s diversity
index = Rpi log pi),
GST = Nei’s coefficient of gene
variation = (1 - Hs/HT) where
Hs is within populations and HT
is the entire population
Site code Site location n H I % Polymorphic
loci
Total H Total I GST
Midwest
AT Alger Co., MI 15 0.25 0.34 76.25
HN Alger Co., MI 15 0.25 0.37 70
JA Bayfield Co., WI 15 0.27 0.41 75
SP Bayfield Co., WI 15 0.26 0.39 76.25
PN Porter Co., IN 15 0.25 0.38 73.75 0.33 0.5 0.32
LO Keweenaw Co., MI 15 0.25 0.37 66.25
JB Stark Co., MI 15 0.18 0.28 52.5
MI Mackinaw Co., MI 15 0.21 0.31 60
RR Presque Isle Co., MI 15 0.2 0.3 57.5
US Mackinaw Co., MI 13 0.18 0.28 50
TS Ontario CA 15 0.16 0.25 53.75
N. East Coast
BG Kennebec Co., ME 15 0.17 0.26 53.75 0.25 0.38 0.24
TM Worcester Co., MA 15 0.22 0.32 62.5
S. East Coast
NJ Ocean Co., NJ 15 0.19 0.3 62.5
GS Brunswick Co., NC 14 0.22 0.33 66.25 0.24 0.36 0.19
LC Marlboro Co., SC 15 0.17 0.26 56.25
Conserv Genet (2010) 11:2369–2378 2375
123
Discussion
This study attempted to examine the validity of an historic
subspecies description of Sarracenia purpurea utilizing
surveys of both morphologic and genetic variation within
and among sampled populations. Plant morphology has
historically been used to define subspecies of S. purpurea but
morphological characters observed in this study showed no
significant support for a subspecies classification dividing
S. purpurea into a northern subspecies (S. purpurea subsp.
purpurea) and a southern subspecies (S. purpurea subsp.
venosa) as described by Schnell (2002). Morphological
characters in this species respond to environmental variation
and potentially localized adaptation and cannot be used
alone to develop subspecies designations for S. purpurea.
Morphological variation in the ratio of leaf length to pitcher
mouth width (a term used in the differentiation of historic
subspecies) showed significant differences in population
grouping by both geographic area and substrate type (Fig. 3)
but not historic subspecies. Examined morphologic traits
support the classification of populations based on geographic
area, significantly distinguishing Midwest populations and
S. East Coast populations. These regions have very different
environmental trends from annual temperature to annual
precipitation. Morphologic variation observed within sub-
strate types classifications indicated significant differences
separating Sphagnum and marl wetlands from the southern
sand wetlands (Fig. 3). These substrate types can have very
different environmental characteristics from soil pH to soil
moisture. The relation of morphological variation to these
two population groupings supports the idea that S. purpurea
morphological variation is closely related to environmental
variation as described by Ellison et al (2004) and not a
realistic or reliable measure of subspecies distinction.
Population genetics, on the other hand showed support
for both a geographical grouping and the historic subspe-
cies grouping. Populations sampled across the entire range
of this species appear closely related genetically with only
a few loci separating populations. The moderate amounts
of observed genetic variation within populations and
AMOVA analyses indicate strong genetic similarity
between all sampled populations (Table 3), which is
expected given the clonally reproductive nature of this
plant. Even though populations are genetically very similar
to each other, we were able to detect small but significant
amounts of variation explained by grouping populations
into the defined geographic areas and by historic subspe-
cies with no genetic support for a substrate type grouping
(Table 3). Examination of morphologic traits in addition to
genetic variation is important when using a neutral marker
system such as ISSRs, which do not illustrate direct trait
adaptation but rather overall genetic patterns (Wolfe 1998;
Wolfe and Liston 1998). Genetic support may exist for the
subspecies classification but strict morphological descrip-
tion cannot be used to assign populations to a particular
subspecies grouping due to the plastic response of plant
morphology to environmental variation. This makes the use
of a geographic grouping, supported by both morphology
and genetic variation, potentially better for classifying all
variation that exists in S. purpurea and helping prioritize
conservation efforts. The geographic grouping accounts for
both environmental variation and historic distributions of
S. purpurea that may influence genetic patterns observed in
modern population distributions.
The new proposed organization of populations into
geographic areas, supported by both observed genetic
diversity and morphological variation, could result from a
few historical scenarios. An historic separation between
these three geographic areas (Midwest, N. East Coast and
S. East Coast) could, through an extended period of low
gene flow, have lead to small amounts of genetic differ-
entiation and local adaption to the unique habitat charac-
teristics present in each geographic area. Historically the
entire range of S. purpurea north of Maryland was glaci-
ated as recently as 10,000 years ago while southern pop-
ulations were never glaciated (Dorr and Eschman 1970).
Two scenarios are often proposed for historical reestab-
lishment of S. purpurea populations in glaciated areas,
(1) source populations were remnant, isolated populations
within the glaciated S. purpurea range, or (2) source pop-
ulations came from the southern, unglaciated populations
(Shehlik et al 2002). Either of these reestablishment
methods could explain observed variation among these
geographical groups. Additionally, the three substrate types
examined in this study exhibit a range of different localized
variation in pH, hydrology, water chemistry etc. Genetic
and morphological variation among geographic areas may
be influenced partially by localized responses to substrate
type. No statistical genetic support exists for classifying
populations based on substrate type alone but morpholog-
ical differences observed in different substrate types may
be recent with genetic differentiation not yet occurring
within these populations. On the other hand S. purpurea
may inherently have enough genetic variability to allow
morphological plasticity without necessitating genetic dif-
ferentiation, indicating that observed genetic variation
within the geographic grouping is related to historic
S. purpurea ranges.
For Sarracenia purpurea, utilizing a geographic area
subspecies definition may be a more ecologically important
approach to classify within-species variation, than the his-
toric subspecies definition. S. East Coast populations contain
significantly different genetic and morphological variation
in comparison to N. East Coast and Midwest populations,
which are genetically significantly differentiated from each
other. A useful classification to encompass unique variation
2376 Conserv Genet (2010) 11:2369–2378
123
within populations would consider the S. East Coast popu-
lations one conservation unit, the Midwest sites another unit
and the N. East Coast wetlands the last conservation unit,
with special consideration given to localized morphologies
expressed in response to different substrate types. Both the
S. East Coast sand savannas and Midwest marl substrate
systems are declining across their range through habitat
destruction indicating an increased need to plan successful
restoration in these geographic regions.
Analysis of genetic variation indicated that even though
geographic area groupings significantly explained variation
among populations, a significant portion of observed
genetic variation was located within individual populations
(% variation = 49.45, P \ 0.0001). Effective restoration
of plant variation (genetic and morphological) would
therefore benefit from increased preservation of individual
populations.
Conclusions
Our results did not support the traditional definition of two
distinct subspecies of Sarracenia purpurea following a
strict north/south division. Instead, our study supports a
more ecologically important designation of a geographic
area based subspecies definition delineating populations of
S. purpurea into three categories: S. East Coast, N. East
Coast and Midwest (Fig. 2). These categories represent
areas containing the majority of genetic and morphologic
variation represented by the species. Our analyses showed
significant differences in genetic variation and morphology
between the three geographic areas but the ecological
reasons for this variation are not well understood. S. pur-
purea leaves may show increased morphological plasticity
in response to environmental variation. In order to consider
how much of our field observed variation is due to envi-
ronmental conditions and not genetics, intensive common
garden and greenhouse experiments will need to be con-
ducted. Additionally, due to the scarcity of populations in
the southern portion of the S. purpurea range, sample sizes
were small for both the S. East Coast geographic grouping
and the S. purpurea subsp venosa grouping. Increased
sampling in these populations may clarify differences in
morphological versus genetic variation observed in this
study.
Populations of a species can be differentiated based on
geographic segregation, acknowledging the theory that
differences between geographic areas, environmental
characteristics and increased distance leading to lower gene
flow, may significantly alter the genetic and morphological
make up of a species. Using this new subspecies definition,
geographical units are important when they contain some
characteristics, morphological and/or genetic, that are
unique to their population, increasing their conservation
concern. This definition might be more appropriate for
individual plant species relating to evolutionary theories of
plant population dynamics. The federal Endangered Spe-
cies Act allows the recognition of plants of conservation
concern at a subspecies level, making accurate designations
of subspecies, as in the case of Sarracenia purpurea vital
for planning economical and successful restoration.
Acknowledgments The authors which to thank the staff and
supervisors at Isle Royale National Park, South Carolina State Parks,
The Nature Conservancy of North Carolina, Harvard Forest, Jackson
Bog Ohio, Indiana Dunes National Lakeshore, Pictured Rocks
National Lakeshore, Apostle Islands National Lakeshore, and Leba-
non State Forest New Jersey for logistical support. Dr. Joy Marburger,
Dr. Christopher Webster, Dr. Leah Vucetich, and Dr. Sarah Green for
assistance in project development. This research was supported in part
by grants from the National Park Service, McIntire-Stennis, the
DeVlieg Foundation, and Michigan Technological University.
References
Bell CR (1949) A cytotaxonomic study of the Sarraceniaceae of
North America. J Elisha Mitchell Sci Soc 65:137–166
Christensen NL (1976) The role of carnivory in Sarracenia flava L.
with regard to specific nutrient deficiencies. J Mitchell Soc
92:144–147
Dorr JAJ, Eschman DF (1970) Geology of Michigan. The University
of Michigan Press, Ann Arbor, MI
Ellison AM, Buckley HL, Miller TE, Gotelli NJ (2004) Morpholog-
ical variation in Sarracenia purpurea (Sarraceniaceae): geo-
graphic, environmental and taxonomic correlates. Am J Bot
91:1930–1935
Fahrig L (2002) Effect of habitat fragmentation on the extinction
threshold: a synthesis. Ecol Appl 12:346–353
Frankham R, Ballou JD, Briscoe DA (2004) A primer of conservation
genetics. Cambridge University Press, Cambridge
Givnish TJ (1989) Ecology and evolution of carnivorous plants. In:
Abrahamson WG (ed) Plant-animal interactions. McGraw-Hill
Publishing Co, Inc., New York, pp 243–290
Godt MJW, Hamrick JL (1999) Genetic divergence among infraspe-
cific taxa of Sarracenia purpurea. Syst Bot 23:427–438
Haig SM, Beever EA, Chambers SM, Draheim HM, Dugger BD,
Dunham S, Elliott-Smith E, Fontaine JB, Kesler DC, Knaus BJ,
Lopes LF, Loschhl P, Mullins TD, Sheffield LM (2006)
Taxonomic considerations in listing subspecies under the U.S.
Endangered Species Act. Conserv Biol 20:1584–1594
Hamilton CW, Reichard SH (1992) Current practice in the use of
subspecies, variety, and forma in the classification of wild plants.
Taxon 41:485–498
Karberg JM, Gale MR (2006) Genetic diversity and distribution of
Sarracenia purpurea in the Western Lake Superior Basin. Can J
Bot 84:235–242
Leadlay E, Jury S (2006) Taxonomy and plant conservation.
Cambridge University Press, NewYork, USA
Lewontin RC (1972) The apportionment of human diversity. Evol
Biol 6:381–398
Lynch M, Milligan BG (1994) Analysis of population genetic
structure with RAPD markers. Mol Ecol 3:91–99
Mandossian AJ (1966) Variations in the leaf of Sarracenia purpurea(Pitcher Plant). Michigan Bot 5:26–35
Conserv Genet (2010) 11:2369–2378 2377
123
Meirmans PG, Van Tienderen PH (2004) GENOTYPE and GENO-
DIVE: two programs for the analysis of genetic diversity of
asexual organisms. Mol Ecol Notes 4:792–794
Nei M (1973) Analysis of gene diversity in subdivided populations.
Proc Natl Acad Sci USA 70:3321–3323
Parisod C, Trippi C, Galland N (2005) Genetic variability and founder
effect in the pitcher plant Sarracenia purpurea (Sarraceniaceae)
in populations introduced into Switzerland: from inbreeding to
invasion. Ann Bot 95:277–286
Roux O, Gevrey M, Arvanitakis L, Gers C, Bordat D, Legal L (2006)
ISSR-PCR: tool for discrimination and genetic structure analysis
of Plutella xyostella populations native to different geographical
areas. Mol Phylogenet Evol 43:240–250
Schneider S, Roessli D, Excoffier L (2005) Arlequin: a software for
population genetics data analysis. University of Geneva, Genet-
ics and Biomentry Lab, Department of Anthropology, Geneva
Schnell DE (1979) A critical review of published variants of
Sarracenia purpurea L. Castanea 44:217–223
Schnell DE (2002) Carnivorous plants of the United States and
Canada, 2nd edn. John F Blair, Winston-Salem
Schwaegerle KE, Schaal BA (1979) Genetic variability and founder
effect in the pitcher plant Sarracenia purpurea L. Evolution
33:1210–1218
Shehlik I, Schneller JJ, Bachmann K (2002) Immigration and in situ
glacial survival of the low-alpine Erinus aplinus (Scrophulari-
aceae). Biol J Linnean Soc 77:87–103
Team RDC (2006) R: a language and environment for statistical
computing. R Foundation for Statistical Computing, Vienna,
Austria
Wherry ET (1933) The geographic relations of Sarracenia purpurea.
Bartonia 15:1–8
Wolfe AD (1998) Using ISSR markers in studies of natural
populations. In: ASPT/BSA meeting. The Ohio State University,
Baltimore, MD
Wolfe AD, Liston A (1998) Contributions of PCR-based methods to
plant systematics and evolutionary biology. In: Soltis DE, Soltis
PS, Doyle JJ (eds) Molecular systematics of plant. II. DNA
sequencing. Chapman and Hall, New York, pp 43–86
Yeh FC, Yang R-C, Boyle T, Ye Z-H, Mao JX (1997) POPGENE: the
user friendly shareware for population genetic analysis. Univer-
sity of Alberta Canada, Molecular Biology and Biotechnology
Centre, Alberta
Zietkiewicz E, Rafalski A, Labuda D (1994) Genome fingerprinting
by simple sequence repeat (SSR)-anchored polymerase chain
reaction amplification. Genomics 20:176–183
2378 Conserv Genet (2010) 11:2369–2378
123