Direct Comparisons of 2D and 3D Dental Microwear Proxies in Extant Herbivorous and Carnivorous...
11
Direct Comparisons of 2D and 3D Dental Microwear Proxies in Extant Herbivorous and Carnivorous Mammals Larisa R. G. DeSantis 1* , Jessica R. Scott 2 , Blaine W. Schubert 3 , Shelly L. Donohue 1 , Brian M. McCray 4 , Courtney A. Van Stolk 1 , Amanda A. Winburn 4 , Michael A. Greshko 1 , Mackie C. O’Hara 2 1 Department of Earth and Environmental Sciences, Vanderbilt University, Nashville, Tennessee, United States of America, 2 Department of Sociology and Anthropology, University of Arkansas at Little Rock, Little Rock, Arkansas, United States of America, 3 Center of Excellence in Paleontology and Department of Geosciences, East Tennessee State University, Johnson City, Tennessee, United States of America, 4 Department of Anthropology, Vanderbilt University, Nashville, Tennessee, United States of America Abstract The analysis of dental microwear is commonly used by paleontologists and anthropologists to clarify the diets of extinct species, including herbivorous and carnivorous mammals. Currently, there are numerous methods employed to quantify dental microwear, varying in the types of microscopes used, magnifications, and the characterization of wear in both two dimensions and three dimensions. Results from dental microwear studies utilizing different methods are not directly comparable and human quantification of wear features (e.g., pits and scratches) introduces interobserver error, with higher error being produced by less experienced individuals. Dental microwear texture analysis (DMTA), which analyzes microwear features in three dimensions, alleviates some of the problems surrounding two-dimensional microwear methods by reducing observer bias. Here, we assess the accuracy and comparability within and between 2D and 3D dental microwear analyses in herbivorous and carnivorous mammals at the same magnification. Specifically, we compare observer-generated 2D microwear data from photosimulations of the identical scanned areas of DMTA in extant African bovids and carnivorans using a scanning white light confocal microscope at 100x magnification. Using this magnification, dental microwear features quantified in 2D were able to separate grazing and frugivorous bovids using scratch frequency; however, DMTA variables were better able to discriminate between disparate dietary niches in both carnivorous and herbivorous mammals. Further, results demonstrate significant interobserver differences in 2D microwear data, with the microwear index remaining the least variable between experienced observers, consistent with prior research. Overall, our results highlight the importance of reducing observer error and analyzing dental microwear in three dimensions in order to consistently interpret diets accurately. Citation: DeSantis LRG, Scott JR, Schubert BW, Donohue SL, McCray BM, et al. (2013) Direct Comparisons of 2D and 3D Dental Microwear Proxies in Extant Herbivorous and Carnivorous Mammals. PLoS ONE 8(8): e71428. doi:10.1371/journal.pone.0071428 Editor: Peter Stuart Ungar, University of Arkansas, United States of America Received December 11, 2012; Accepted June 28, 2013; Published August 6, 2013 Copyright: © 2013 DeSantis et al. This is an open-access article distributed under the terms of the Creative Commons Attribution License, which permits unrestricted use, distribution, and reproduction in any medium, provided the original author and source are credited. Funding: Financial support was provided by Vanderbilt University, University of Arkansas at Little Rock, East Tennessee State University, and the National Science Foundation (EAR 1053839). The funders had no role in study design, data collection and analysis, decision to publish, or preparation of the manuscript. Competing interests: The authors have declared that no competing interests exist. * E-mail: [email protected] Introduction Dental microwear, the microscopic wear patterns resulting from food processing, is among the most frequently used and effective proxies to infer diet in extant and extinct animals, including humans and their ancestors. As dental microwear records food consumption during the last few days to weeks of an animal’s life, it can be used to clarify ancient diets and assess dietary responses to changing climates and environments. While microwear has been commonly used by anthropologists and paleontologists since the late 1970s (e.g., [1–3]), the methodologies used to quantify tooth surfaces are highly variable and still debated among researchers, and results generated between and within methods are not directly comparable [4–7]. The pioneering microwear studies of the 1970s and 1980s used scanning electron microscopy (SEM) to document the correlation between size, shape, and orientation of wear features and dietary habits of extant taxa (e.g., [1,2]). These studies standardized methods related to data collection including the type of wear facet analyzed [8], analysis of homologous facets across studied taxa [3,9], specimen coating material and thickness, and beam settings of individual SEM machines [10]. However, the analysis and subsequent interpretation of microwear features assessed via SEM relies on observers counting individual pits and scratches from two- PLOS ONE | www.plosone.org 1 August 2013 | Volume 8 | Issue 8 | e71428
-
Upload
independent -
Category
Documents
-
view
0 -
download
0
Transcript of Direct Comparisons of 2D and 3D Dental Microwear Proxies in Extant Herbivorous and Carnivorous...

Direct Comparisons of 2D and 3D Dental MicrowearProxies in Extant Herbivorous and Carnivorous MammalsLarisa R. G. DeSantis1*, Jessica R. Scott2, Blaine W. Schubert3, Shelly L. Donohue1, Brian M. McCray4,Courtney A. Van Stolk1, Amanda A. Winburn4, Michael A. Greshko1, Mackie C. O’Hara2
1 Department of Earth and Environmental Sciences, Vanderbilt University, Nashville, Tennessee, United States of America, 2 Department of Sociology andAnthropology, University of Arkansas at Little Rock, Little Rock, Arkansas, United States of America, 3 Center of Excellence in Paleontology and Department ofGeosciences, East Tennessee State University, Johnson City, Tennessee, United States of America, 4 Department of Anthropology, Vanderbilt University,Nashville, Tennessee, United States of America
Abstract
The analysis of dental microwear is commonly used by paleontologists and anthropologists to clarify the diets ofextinct species, including herbivorous and carnivorous mammals. Currently, there are numerous methods employedto quantify dental microwear, varying in the types of microscopes used, magnifications, and the characterization ofwear in both two dimensions and three dimensions. Results from dental microwear studies utilizing different methodsare not directly comparable and human quantification of wear features (e.g., pits and scratches) introducesinterobserver error, with higher error being produced by less experienced individuals. Dental microwear textureanalysis (DMTA), which analyzes microwear features in three dimensions, alleviates some of the problemssurrounding two-dimensional microwear methods by reducing observer bias. Here, we assess the accuracy andcomparability within and between 2D and 3D dental microwear analyses in herbivorous and carnivorous mammals atthe same magnification. Specifically, we compare observer-generated 2D microwear data from photosimulations ofthe identical scanned areas of DMTA in extant African bovids and carnivorans using a scanning white light confocalmicroscope at 100x magnification. Using this magnification, dental microwear features quantified in 2D were able toseparate grazing and frugivorous bovids using scratch frequency; however, DMTA variables were better able todiscriminate between disparate dietary niches in both carnivorous and herbivorous mammals. Further, resultsdemonstrate significant interobserver differences in 2D microwear data, with the microwear index remaining the leastvariable between experienced observers, consistent with prior research. Overall, our results highlight the importanceof reducing observer error and analyzing dental microwear in three dimensions in order to consistently interpret dietsaccurately.
Citation: DeSantis LRG, Scott JR, Schubert BW, Donohue SL, McCray BM, et al. (2013) Direct Comparisons of 2D and 3D Dental Microwear Proxies inExtant Herbivorous and Carnivorous Mammals. PLoS ONE 8(8): e71428. doi:10.1371/journal.pone.0071428
Editor: Peter Stuart Ungar, University of Arkansas, United States of America
Received December 11, 2012; Accepted June 28, 2013; Published August 6, 2013
Copyright: © 2013 DeSantis et al. This is an open-access article distributed under the terms of the Creative Commons Attribution License, which permitsunrestricted use, distribution, and reproduction in any medium, provided the original author and source are credited.
Funding: Financial support was provided by Vanderbilt University, University of Arkansas at Little Rock, East Tennessee State University, and the NationalScience Foundation (EAR 1053839). The funders had no role in study design, data collection and analysis, decision to publish, or preparation of themanuscript.
Competing interests: The authors have declared that no competing interests exist.
* E-mail: [email protected]
Introduction
Dental microwear, the microscopic wear patterns resultingfrom food processing, is among the most frequently used andeffective proxies to infer diet in extant and extinct animals,including humans and their ancestors. As dental microwearrecords food consumption during the last few days to weeks ofan animal’s life, it can be used to clarify ancient diets andassess dietary responses to changing climates andenvironments. While microwear has been commonly used byanthropologists and paleontologists since the late 1970s (e.g.,[1–3]), the methodologies used to quantify tooth surfaces arehighly variable and still debated among researchers, and
results generated between and within methods are not directlycomparable [4–7].
The pioneering microwear studies of the 1970s and 1980sused scanning electron microscopy (SEM) to document thecorrelation between size, shape, and orientation of wearfeatures and dietary habits of extant taxa (e.g., [1,2]). Thesestudies standardized methods related to data collectionincluding the type of wear facet analyzed [8], analysis ofhomologous facets across studied taxa [3,9], specimen coatingmaterial and thickness, and beam settings of individual SEMmachines [10]. However, the analysis and subsequentinterpretation of microwear features assessed via SEM relieson observers counting individual pits and scratches from two-
PLOS ONE | www.plosone.org 1 August 2013 | Volume 8 | Issue 8 | e71428

dimensional SEM micrographs [8]. Typically, in herbivoroustaxa, a high incidence of scratches relative to pits is interpretedto indicate the consumption of tougher food items, potentiallywith higher silica or grit content; in contrast, a greaterfrequency of pits indicates the consumption of more brittleobjects and the potential processing of seeds and/or fruit pits[1,2,8].
Microwear studies utilizing low-magnification lightmicroscopy follow similar methods as those applied duringSEM analysis, with the added benefit of being able to analyze asurface quickly with a low-cost stereo light microscope atmagnifications ranging from 35x in large animals (e.g., [11]) to100x in small animals (e.g., [12]). Here, observers can eitherdirectly count wear features through the microscope lens [11],or they can take digital photomicrographs of specimens andthus keep a record of their counts by tracing wear featuresusing imaging software [13,14]. Biplots of pits and scratchesyield a ‘trophic triangle’ where, for example, herbivorousbrowsing taxa have a high number of pits and low number ofscratches, grazing taxa have a high number of scratches andlow number of pits, and frugivores/hard object feeders fall in-between these end members [11,15]. Further, the addition offeatures including scratch texture, cross scratches, large pits,and gouges can further parse out dietary information [11].
Observer identification and quantification of individual wearfeatures, whether from an SEM micrograph or using lightmicroscopy, is prone to high observer biases, particularlybetween observers of different experience levels [4,5,7,16].Grine and co-authors [4] found a 9% error in measurementsbetween observers while Galbany and co-authors [5] found a6% error in observers with five or more years of experiencewhen quantifying SEM micrographs. Most recently, Mihlbachlerand colleagues [7] documented a 45% interobserver erroramong experienced and inexperienced individuals, which wasreduced to 8-12% in experienced individuals after multipleiterations. While experienced observers yielded similarlyshaped trophic triangles consistent with prior work [11],inexperienced microwear observers failed to generate a trophictriangle using light microscopy [7]. Further biases can arisefrom viewing microwear features at different resolutions [17], inaddition to data loss from the analysis of three-dimensionalmicrowear features in two dimensions [6,18]
Dental microwear texture analysis (DMTA), the analysis ofdental microwear in three dimensions using a scanning whitelight confocal microscope and scale sensitive fractal analysis,alleviates some of the problems surrounding traditionalmicrowear methods by essentially eliminating observer biasthrough a quantitative, repeatable method, and by analyzingwear features in three dimensions [18–20]. While someobserver biases may still be present (e.g., area of wear facetchosen for analysis by individual observers), DMTA has beenshown to distinguish between disparate diets in mammalsincluding bovids [21], carnivorans [22,23], marsupials [24],primates [18,19], and xenarthrans [25]. Specifically, greatervalues in features such as complexity (i.e., surface roughnessat varying scales) occur in taxa consuming brittle food items,such as frugivores and bone consumers, while greateranisotropy (i.e., the orientation of wear features of similar
depth) occurs in grazers and carnivores that avoid bone. Incontrast, Beatty and Mihlbachler [26] found that low-magnification microwear methods were better able todiscriminate between species than DMTA, although neithermethod discriminated diet well. However, the Beatty andMihlbachler [26] study was limited in sample size (total of 15specimens from four species) and could not compare identicalsurface areas on each specimen due to methodologicalconstraints.
Here, we directly compare 2D and 3D dental microwearfeatures of herbivorous and carnivorous mammals at 100xmagnification (Figure 1). Specifically, we compared DMTA datawith generated 2D microwear data from photosimulations of theidentical scanned areas of previously published DMTA 3D pointclouds of extant African bovids (4 species [21]) and carnivorans(3 species [23]). Photosimulations avoid the pitfalls of SEM andstereo light microscopy methods, which can be subject to theissue of depth distorting the visibility of microwear features dueto differences in coating thickness, SEM beam angle, or angleof incoming light, among other factors. The view settings forphotosimulations can be manipulated to alter the direction oflight and photo contrast to maximize feature visibility, while stillpreserving "observer-perceived depth" via feature shadows.Conducting 2D microwear analysis on DMTA-producedphotosimulations is the only method that ensures directcomparisons of 2D and 3D methods between identical scannedareas. Analyzing the identical tooth area using a confocalmicroscope to generate 3D data and an SEM or stereo lightmicroscope to generate 2D data is virtually impossible andwould introduce additional sources of differences. Thus, weanalyzed taxa with similar dental morphology (within eachgroup) representing distinct dietary niches, to address thefollowing questions: (i) do two-dimensional and three-dimensional microwear studies produce accurate andcomparable dietary interpretations of extant taxa with knownfeeding behavior, (ii) how does the inclusion of depth alter orimprove dental microwear interpretations, and (iii) can differentobservers generate comparable data using two-dimensionalwear feature counting methods in herbivorous and carnivorousmammals? Understanding how 2D and 3D dental microweardata compare in a diversity of mammals with disparate diets iscritical to advancing our understanding of dietary behavior inthe prehistoric and historic past, globally.
Results
Dietary ComparisonsResults are presented in Tables 1-2 and illustrated in Figure
2. All primary data are noted in Tables S1-S4 and thesupplemental Appendix Data File. As carnivoran and boviddietary comparisons are the focus of prior studies [21,23], weinstead specify how DMTA data compares to 2D metrics at thesame resolution. In the 2D analysis the number of pits andcoarse pits are not statistically distinct between carnivorans(Kruskal-Wallis tests, p=0.078 and 0.626, respectively). Agreater number of scratches (p=0.017) and coarse scratches(p=0.004) distinguishes Acinonyx jubatus from Crocuta crocuta,with Panthera leo also having statistically greater coarse
2D and 3D dental microwear comparisons
PLOS ONE | www.plosone.org 2 August 2013 | Volume 8 | Issue 8 | e71428

scratches than C. crocuta. DMTA attributes instead yieldsignificantly greater parallel elongated wear features (meananisotropy or epLsar) in A. jubatus than in all extant taxa (Table1, Kruskal-Wallis tests, p<0.0001). In contrast, meancomplexity and textural fill volume are smallest in A. jubatus,followed by P. leo, and C. crocuta (Table 1), consistent withdegree of durophagous activity in these carnivorans (Kruskal-Wallis tests, p<0.01).
Mean number of pits (ANOVA, p=0.025) is statisticallydistinct between bovids in the 2D study, with the grazerDamaliscus lunatus having greater pits than the browserSylvicapra grimmia. The number of coarse pits is insteadgreatest in the grazer-browser Antidorcas marsupialis ascompared to the frugivore Cephalophus sylvicultor (ANOVA,p=0.002). Although pits can distinguish between some extantbovids, these trends are contrary to expectations of greater pitsand coarse pits in browsers and frugivores, in comparison tograzers and generalists, respectively. Mean number of
scratches is distinct in bovids (ANOVA, p<0.0001). Predictably,fewer scratches occur in the frugivore C. sylvicultor, ascompared to all other extant bovids analyzed (p<0.0001 for allTukey HSD tests). Further, A. marsupialis has fewer scratchesthan D. lunatus and S. grimmia (p=0.001 and 0.012,respectively, Tukey HSD tests).
Although scratch frequency can clearly discriminate betweenfrugivores and grazers consistent with observed diets (i.e.,grazers having a greater number of scratches), DMTAvariables are better able to discriminate between disparatedietary niches (Figure 2). Specifically, the grazer D. lunatus hasgreater anisotropy than all other bovids (Fisher LSD and TukeyHSD tests, p<0.0001), while the intermediate grazer-browser A.marsupialis has greater anisotropy than C. sylvicultor and S.grimmia (Fisher LSD tests, p<0.05). Similarly, the frugivore C.sylvicultor has the greatest complexity (followed by the browserS. grimmia, mixed feeder A. marsupialis, and grazer D.lunatus), significantly greater than all other bovids sampled
Figure 1. Dental microwear photosimulations in 2D and 3D. Example of photosimulations in two dimensions (A–D) and threedimensions (E–H) of the browser Sylvicapra grimmia. Scans are from four adjacent areas (totaling ~204 x 276 µm2, with each scanrepresenting and area of ~102 x 138µm2).doi: 10.1371/journal.pone.0071428.g001
2D and 3D dental microwear comparisons
PLOS ONE | www.plosone.org 3 August 2013 | Volume 8 | Issue 8 | e71428
(Fisher LSD and Tukey HSD tests, p≤0.001). The browser S.grimmia also has greater complexity than A. marsupialis and D.lunatus (Fisher LSD and Tukey HSD tests, p<0.01), while D.lunatus has lower complexity than A. marsupialis (Fisher LSDtests, p<0.05). Similarly, features such as textural fill volumecan be used to distinguish between grazing/mixed feeding (i.e.,D. lunatus and A. marsupialis) as compared to browsing/frugivory (i.e., S. grimmia and C. sylvicultor; Kruskal-Wallis test,p<0.0001).
While DMTA provides greater resolution between disparatedietary groups in both herbivorous and carnivorous taxa, thereis also congruence between DMTA variables and traditionaldental microwear variables (Spearman’s rank correlations).Most notably, anisotropy and total number of scratches andcoarse scratches are positively correlated (ρ=0.31, p<0.01;
ρ=0.30, p<0.01, respectively). The same is true for scale ofmaximum complexity (ρ=0.38, p<0.001; ρ=0.36, p<0.01,respectively). Further, scratch counts and coarse scratchcounts are negatively correlated with complexity (ρ=-0.59,p<0.0001; ρ=-0.49, p<0.0001, respectively) and textural fillvolume (ρ=-0.40, p<0.001; ρ=-0.32, p<0.01, respectively). Pitcounts and coarse pit counts are not significantly correlatedwith DMTA characters, with the exception of a negativerelationship between total pit count and textural fill volume(ρ=-0.27, p=0.02). Microwear index values are positivelycorrelated with anisotropy (ρ=0.33, p<0.01) and scale ofmaximum complexity (ρ=0.45, p<0.0001), and negativelycorrelated with complexity (ρ=-0.55, p<0.0001) and textural fillvolume (ρ=-0.33, p<0.01). Although DMTA variables measuredifferent textural attributes, complexity is positively correlated
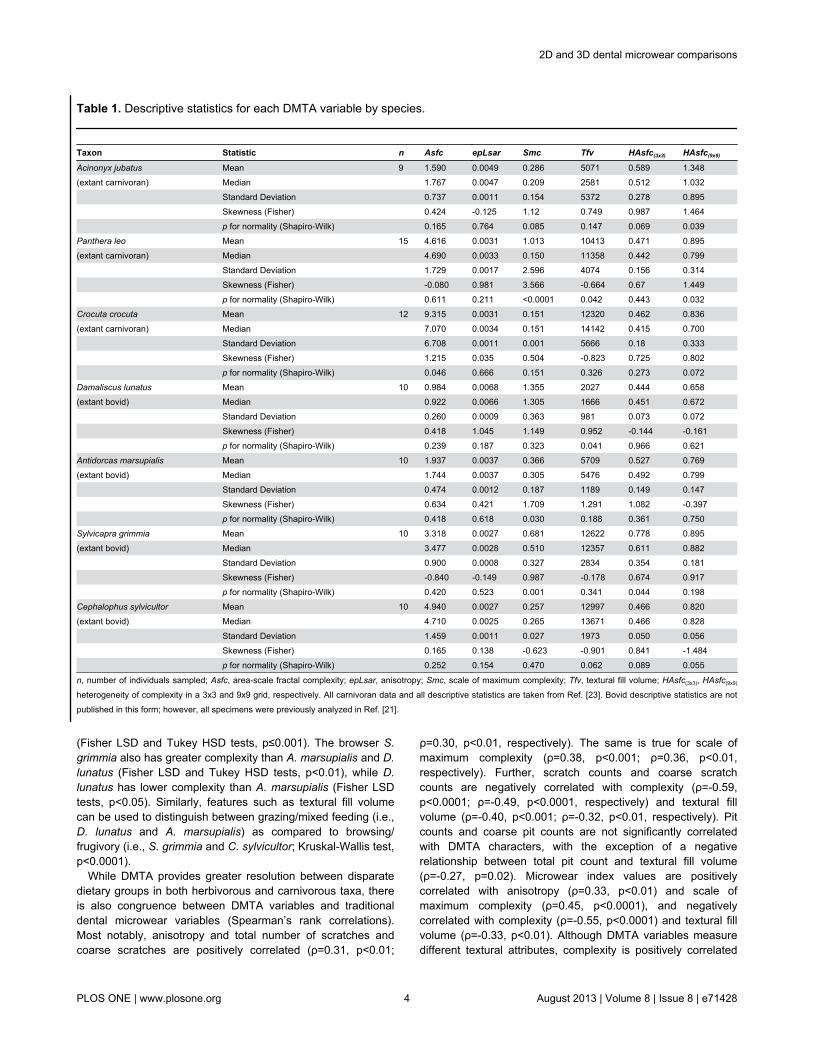
Table 1. Descriptive statistics for each DMTA variable by species.
Taxon Statistic n Asfc epLsar Smc Tfv HAsfc(3x3) HAsfc(9x9)Acinonyx jubatus Mean 9 1.590 0.0049 0.286 5071 0.589 1.348(extant carnivoran) Median 1.767 0.0047 0.209 2581 0.512 1.032 Standard Deviation 0.737 0.0011 0.154 5372 0.278 0.895 Skewness (Fisher) 0.424 -0.125 1.12 0.749 0.987 1.464 p for normality (Shapiro-Wilk) 0.165 0.764 0.085 0.147 0.069 0.039Panthera leo Mean 15 4.616 0.0031 1.013 10413 0.471 0.895(extant carnivoran) Median 4.690 0.0033 0.150 11358 0.442 0.799 Standard Deviation 1.729 0.0017 2.596 4074 0.156 0.314 Skewness (Fisher) -0.080 0.981 3.566 -0.664 0.67 1.449 p for normality (Shapiro-Wilk) 0.611 0.211 <0.0001 0.042 0.443 0.032Crocuta crocuta Mean 12 9.315 0.0031 0.151 12320 0.462 0.836(extant carnivoran) Median 7.070 0.0034 0.151 14142 0.415 0.700 Standard Deviation 6.708 0.0011 0.001 5666 0.18 0.333 Skewness (Fisher) 1.215 0.035 0.504 -0.823 0.725 0.802 p for normality (Shapiro-Wilk) 0.046 0.666 0.151 0.326 0.273 0.072Damaliscus lunatus Mean 10 0.984 0.0068 1.355 2027 0.444 0.658(extant bovid) Median 0.922 0.0066 1.305 1666 0.451 0.672 Standard Deviation 0.260 0.0009 0.363 981 0.073 0.072 Skewness (Fisher) 0.418 1.045 1.149 0.952 -0.144 -0.161 p for normality (Shapiro-Wilk) 0.239 0.187 0.323 0.041 0.966 0.621Antidorcas marsupialis Mean 10 1.937 0.0037 0.366 5709 0.527 0.769(extant bovid) Median 1.744 0.0037 0.305 5476 0.492 0.799 Standard Deviation 0.474 0.0012 0.187 1189 0.149 0.147 Skewness (Fisher) 0.634 0.421 1.709 1.291 1.082 -0.397 p for normality (Shapiro-Wilk) 0.418 0.618 0.030 0.188 0.361 0.750Sylvicapra grimmia Mean 10 3.318 0.0027 0.681 12622 0.778 0.895(extant bovid) Median 3.477 0.0028 0.510 12357 0.611 0.882 Standard Deviation 0.900 0.0008 0.327 2834 0.354 0.181 Skewness (Fisher) -0.840 -0.149 0.987 -0.178 0.674 0.917 p for normality (Shapiro-Wilk) 0.420 0.523 0.001 0.341 0.044 0.198Cephalophus sylvicultor Mean 10 4.940 0.0027 0.257 12997 0.466 0.820(extant bovid) Median 4.710 0.0025 0.265 13671 0.466 0.828 Standard Deviation 1.459 0.0011 0.027 1973 0.050 0.056 Skewness (Fisher) 0.165 0.138 -0.623 -0.901 0.841 -1.484 p for normality (Shapiro-Wilk) 0.252 0.154 0.470 0.062 0.089 0.055
n, number of individuals sampled; Asfc, area-scale fractal complexity; epLsar, anisotropy; Smc, scale of maximum complexity; Tfv, textural fill volume; HAsfc(3x3), HAsfc(9x9)
heterogeneity of complexity in a 3x3 and 9x9 grid, respectively. All carnivoran data and all descriptive statistics are taken from Ref. [23]. Bovid descriptive statistics are notpublished in this form; however, all specimens were previously analyzed in Ref. [21].
2D and 3D dental microwear comparisons
PLOS ONE | www.plosone.org 4 August 2013 | Volume 8 | Issue 8 | e71428

Table 2. Descriptive statistics for each 2D dental microwearvariable by species.
Taxon Statistic n Pits CP ScratchesCS MIAcinonyx
jubatusMean 9 27.43 4.19 17.61 1.75 0.782
(extantcarnivoran)
Median 27.88 3.50 17.25 1.75 0.609
StandardDeviation
6.93 1.53 7.24 0.70 0.687
Skewness(Fisher)
2.635 1.811 0.514 -1.010 6.248
p for normality(Shapiro-Wilk)
0.338 0.066 0.918 0.592 0.002
Panthera leo Mean 15 30.61 4.18 12.19 1.208 0.414(extantcarnivoran)
Median 29.75 4.75 9.38 1.125 0.344
StandardDeviation
6.19 1.04 5.64 0.614 0.228
Skewness(Fisher)
-1.152 -1.182 -0.499 -0.899 3.274
p for normality(Shapiro-Wilk)
0.189 0.054 0.041 0.430 0.007
Crocuta crocuta Mean 12 25.23 3.77 9.20 0.625 0.354(extantcarnivoran)
Median 25.31 3.56 7.81 0.313 0.296
StandardDeviation
2.79 0.82 5.17 0.612 0.183
Skewness(Fisher)
-0.947 -0.176 0.221 -1.978 1.163
p for normality(Shapiro-Wilk)
0.297 0.025 0.521 0.014 0.209
Damaliscus
lunatusMean 10 39.11 3.61 22.04 2.09 0.972
(extant bovid) Median 39.94 3.00 21.75 2.19 0.774
StandardDeviation
15.32 2.05 4.63 0.82 0.527
Skewness(Fisher)
0.017 1.320 0.171 0.132 2.500
p for normality(Shapiro-Wilk)
0.294 0.215 0.317 0.790 <0.001
Antidorcas
marsupialisMean 10 33.71 6.84 14.39 0.96 0.654
(extant bovid) Median 32.31 6.5 14.44 0.88 0.519
StandardDeviation
8.34 3.35 5.21 0.87 0.368
Skewness(Fisher)
-0.139 0.352 0.109 1.454 1.004
p for normality(Shapiro-Wilk)
0.786 0.763 0.443 0.143 0.068
Sylvicapra
grimmiaMean 10 23.95 3.64 20.19 2.58 1.334
(extant bovid) Median 23.06 3.31 20.06 2.50 1.285
StandardDeviation
5.49 0.86 3.69 1.40 0.657
Skewness(Fisher)
1.396 0.469 -0.131 0.051 0.839
with textural fill volume (ρ=0.71, p<0.0001) and negativelycorrelated with anisotropy (ρ=-0.51, p<0.0001) and scale ofmaximum complexity (ρ=-0.59, p<0.0001). Anisotropy ispositively correlated with scale of maximum complexity(ρ=0.33, p<0.01) and negatively correlated with textural fillvolume (ρ=-0.36, p<0.01), while scale of maximum complexityis negative correlated with textural fill volume (ρ=-0.23,p=0.046). Heterogeneity measurements do not here revealdietary differences and are only correlated with each other(ρ=0.73, p<0.0001).
Observer DifferencesResults are presented in Tables 3-4 and illustrated in Figure
3. As DMTA attributes are calculated using scale sensitivefractal analysis, microwear data do not vary betweenobservers. In contrast, mean interobserver error of 2D featuresvaries in carnivorans from 30.4% to 463% (mean of 169%) inpit frequency and 12.4% to 98.9% (mean of 60.5%) in scratchfrequency. Mean interobserver error for coarse pits and coarsescratches instead range from 33.3% to 166.7% (mean 82%)and from 16.7% to 200% (mean 81.5%), respectively. Bovidsinstead have significantly lower mean interobserver errors of49.4% (range of 9.1% to 102%) and 45.4% (range of 6.5% to150%) in pits and scratches, respectively (p<0.0001, Mann-Whitney tests). Coarse scratches have error percentages of65.6% (ranging from 0% to 150%), significantly lower(p=0.0002, Mann-Whitney tests) than carnivorans despite thetendency for observers to have highly variable feature counts.Interobserver error of mean coarse pits is 78.2% (ranging from4.8% to 150%).
Two-dimensional dental microwear data are highly variable,and observer differences are significant in all features of allspecies, except scratches in carnivorans and microwear indexin P. leo and C. crocuta (Table 3). However, when all scans arecompared between observers, differences are significant in all
Table 2 (continued).
Taxon Statistic n Pits CP ScratchesCS MI
p for normality(Shapiro-Wilk)
0.124 0.089 0.601 0.646 0.684
Cephalophus
sylvicultorMean 10 31.89 3.09 2.05 0.11 0.204
(extant bovid) Median 34.38 2.63 1.75 0.06 0.172
StandardDeviation
10.75 1.63 0.98 0.14 0.134
Skewness(Fisher)
-0.966 1.250 0.619 0.863 1.824
p for normality(Shapiro-Wilk)
0.126 0.139 0.161 0.019 0.022
n, number of individuals sampled; Pits, number of pits of all size categories; CP,number of coarse pits as defined by Ref. [11]; Scratches, number of scratches ofall size categories; CS, number of coarse scratches as defined by Ref. [11]; MI,microwear index as defined by the number of scratches/number of pits, Ref. [36].All 2D dental microwear features are averages of median values taken from fourphotosimulations per specimen (see Materials and Methods).
2D and 3D dental microwear comparisons
PLOS ONE | www.plosone.org 5 August 2013 | Volume 8 | Issue 8 | e71428

but A. jubatus scratches, which approaches significance(p=0.052; Table S5). While observer differences are apparent,observers maintain consistency in regard to the relative amount
of pits and scratches assigned. For example, all observersattribute the greatest mean number of scratches to A. jubatus,followed by the generalist P. leo and scavenger C. crucuta
Figure 2. Bivariate plots of dental microwear 2D and 3D data of carnivorans and bovids. Bivariate plots of number ofscratches and number of pits from 2D photosimulations of (A) carnivorans, and (C) bovids. Dental microwear texture data (Asfc,complexity; epLsar, anisotropy) of (B) carnivorans, and (D) bovids, from Refs. 21,23, respectively.doi: 10.1371/journal.pone.0071428.g002
Table 3. Summary of comparisons using Dunn’s procedure of observer differences between all extant taxa analyzed.
Dietary Group Taxon n Pits CP Scratches CS MIcarnivore, avoids bone processing Acinonyx jubatus 9 p<0.001* p<0.0001* p=0.291 p<0.0001* p=0.014*carnivore, generalized degree of durophagy Panthera leo 15 p<0.0001* p<0.0001* p=0.068 p<0.0001* p=0.059carnivore, high degree of durophagy Crocuta crocuta 12 p<0.0001* p<0.0001* p=0.066 p<0.001* p=0.068herbivore, grazer Damaliscus lunatus 10 p<0.0001* p<0.0001* p<0.001* p<0.001* p<0.0001*herbivore, grazer-browser Antidorcas marsupialis 10 p<0.0001* p<0.001* p=0.009* p<0.001* p=0.001*herbivore, browser Sylvicapra grimmia 10 p<0.0001* p<0.0001* p=0.002* p<0.001* p<0.001*herbivore, frugivore Cephalophus sylvicultor 10 p<0.001* p<0.001* p<0.0001* p=0.004* p<0.001** Significant values (p<0.05). n, number of individuals sampled; Pits, number of pits of all size categories; CP, number of coarse pits as defined by Ref. [11]; Scratches,number of scratches of all size categories; CS, number of coarse scratches as defined by Ref. [11]; MI, microwear index as defined by the number of scratches/number ofpits, Ref. [36]. All 2D dental microwear features analyzed are averages of median values taken from four photosimulations per specimen per observer (see Materials andMethods)
2D and 3D dental microwear comparisons
PLOS ONE | www.plosone.org 6 August 2013 | Volume 8 | Issue 8 | e71428

(Figure 3). In contrast, pit assignments are more variable,although mean pits are consistently greater in P. leo ascompared to C. crucuta (Figure 3). Observers are similarlyconsistent when characterizing scratches, and typically assignthe greatest mean number of scratches to either D. lunatus orS. grimmia, with A. marsupialis having more scratches than C.sylvicultor (Figure 3). Similar to carnivorans, pit assignmentsare highly variable and not consistent in relative rank orderbetween observers.
Observers 1 and 2 are the most highly trained and have 2Dmicrowear variables most similar to mean values (Figure 3);thus, these observers were compared to one another across alldietary categories. In carnivorans, observer assignments were
different in all but coarse scratches and microwear indexvalues (Table 4). In bovids, only coarse pits and scratcheswere different between observers (Table 4). However, meaninterobserver error of observers 1 and 2 is lowest in scratches(24.6%), followed by coarse scratches (26.2%), pits (27.3%),and coarse pits (66.3%) in carnivorans. In bovids, meaninterobserver error of observers 1 and 2 is lowest in coarsescratches (25.2%), followed by pits (29.4%), scratches(34.3%), and coarse pits (44.8%).
Table 4. Paired comparisons of the two most highly trained observers (1 and 2) for all carnivorous and herbivorous taxaanalyzed.
Taxa Statistical Tests Pits CP Scratches CS MI
BovidsWilcoxon signed-rank test(mean values, n=40)
p=0.468 p=0.002* p=0.023* p=0.256 p=0.900
Student’s t-test (if appropriate) p=0.703 N/A p=0.039* N/A N/A
Wilcoxon signed-rank test(all scans, n=120)
p=0.161 p<0.001* p<0.010* p=0.112 p=0.875
CarnivoransWilcoxon signed-rank test(mean values, n=40)
p=0.001* p<0.0001* p<0.0001* p=0.078 p=0.119
Student’s t-test (if appropriate) p=0.001* N/A p<0.0001* N/A N/A
Wilcoxon signed-rank test(all scans, n=120)
p<0.0001* p<0.0001* p<0.0001* p=0.029* p=0.383
* Significant values (p<0.05). Pits, number of pits of all size categories; CP, number of coarse pits as defined by Ref. [11]; Scratches, number of scratches of all sizecategories; CS, number of coarse scratches as defined by Ref. [11]; MI, microwear index as defined by the number of scratches/number of pits, Ref. [36].
Figure 3. Bivariate plots of number of scratches and number of pits of carnivorans and bovids. Mean values of all fourobservers +/- 1 standard deviation are noted in black. Individual observer mean values are noted for each observer (1, orange; 2,green; 3, blue; 4, red) for carnivorans (A) and bovids (B). Colored dashed triangles correspond with each individual observer andmean values, connecting all carnivorans (A) and the three dietary categories of grazers, browsers, and frugivores in bovids (B).Carnivoran symbols include: A. jubatus, diamond; P. leo, triangle; and, C. crucuta, square. Bovid symbols include: D. lunatus,diamond; A. marsupialis, triangle; S. grimmia, circle; and, C. sylvicultor, square.doi: 10.1371/journal.pone.0071428.g003
2D and 3D dental microwear comparisons
PLOS ONE | www.plosone.org 7 August 2013 | Volume 8 | Issue 8 | e71428

Discussion
Dietary ComparisonsPrevious studies of carnivoran 2D microwear differentiate
between distinct diets based on foraging behavior [27,28]. VanValkenburgh and coauthors demonstrated that analysis ofscanning electron microscope images of dental microwear(250x) differentiates consumers of large bones such as thespotted hyena (Crocuta crocuta), from other carnivorans,based on the number of pits present on their teeth [28].Subsequent studies further confirmed these results andsuggest that the consumption of large bones can bedetermined by low resolution (63x) two-dimensional microwearanalysis [27]. Specifically, spotted hyenas are statisticallydistinct from folivores, frugivores, insectivores, malacophages,omnivores, piscivores, and larvae and worm eaters via pitfrequency [27]. Contrary to expectations, our two-dimensionalmicrowear results actually demonstrate the absence ofstatistical distinctions between C. crocuta and othercarnivorans sampled, based on number of pits or coarse pits(Table 2). It is possible that our sampled C. crocuta differedfrom expectations based on a difference in diet caused byseasonal or regional variation, or that C. crocuta has ‘fallback’resources of bone that are not always utilized [22]. In contrast,our 2D analysis of scratch frequency does differentiatebetween bone-avoiders and those engaging in greaterdurophagy, as suggested by prior work [28]. Thus, our resultsimply that 2D analysis can be successful at distinguishingbone-avoiders, such as A. jubatus, from bone consumers;however, DMTA analysis of extinct and extant carnivoransdemonstrates the ability to infer degree of carcass utilizationabsent of observer biases and potentially with greaterdiscrimination at the individual specimen level [22,23].
The more extensive literature concerning herbivoremicrowear suggests that 2D analysis of ungulate molars candistinguish between grazers and browsers, with frugivores andmixed feeders falling in-between [15]. Many studies havesought to characterize past environments based on bovidmicrowear [29,30]. A comparison of extant and extinct Africanbovids showed that these herbivores could be reliably identifiedas browsers or grazers [31]. As many paleoecological studiesanalyze bovid microwear to assess the presence of opengrasslands, being able to identify grazers using microwear isfairly reliable via scratch counts, both here and in prior work[31–33].
Observer-generated 2D microwear features can distinguishextreme dietary categories, such as between frugivores andnon-frugivorous bovids, based on number of scratches (Figure2). Contrary to expectations, we recorded higher numbers ofpits for the obligate grazer D. lunatus than for the browser S.grimmia. ‘Prism plucking’, wherein small, prism-sized pits areremoved from the enamel surface, can result from parallel foodprocessing of tough foods such as grass blades that requireshearing or grinding [34,35]. Previous researchershypothesized that this phenomena caused pits in the teeth ofgrazers, and thus may have caused the higher number of pitsobserved for D. lunatus relative to S. grimmia. Our findingssuggest that coarse designations (e.g., between grazers and
frugivores) may be possible using 2D microwear; however,distinguishing between distinct dietary niches in herbivoroustaxa such as bovids, requires the inclusion of three-dimensional data. For example, 3D microwear studies haveshown that DMTA attributes accurately separated obligategrazers, generalists, browser-grazer intermediates, frugivores,and browsers in extant African bovids [21]. The DMTA analysisof bovids described here derives from the same dataset anddemonstrates how increased complexity (Asfc) and decreasinganisotropy (epLsar) occurs with the predictable consumption ofharder and/or less abrasive food items. Lastly, theconvergence of similar DMTA results across disparatetaxonomic groups (e.g., bovids, macropods, primates,xenarthrans) [18,19,21–25] contributes to greater comparabilityamongst diverse organisms.
Dental microwear texture analysis attributes record diet in asimilar, but more discerning manner, as some traditional dentalmicrowear variables (i.e., scratches and microwear indexvalues). Specifically, photosimulations with greater scratch andcoarse scratch frequencies also had higher anisotropy, asexpected (i.e., anisotropy is greater when features of similardepth are oriented in similar directions, akin to scratches). Incontrast, photosimulations with high numbers of scratches andcoarse scratches also had lower complexity and textural fillvolume. While anisotropy and complexity are representative ofdifferent textural attributes, high anisotropy is usuallyaccompanied with low complexity and vice versa (relationshipsbetween these two variables are significant). Number of pits istypically unrelated to most DMTA variables, as individualsconsuming hard objects may have fewer but deeper pits whileothers may have lots of smaller pits; however, individuals withhigher textural fill volume (likely containing fewer but largerand/or deeper pits) have significantly fewer pits. As pit countsof like surfaces are highly variable and inconsistent betweenobservers, pits may be harder for observers to discern and lessinformative. Thus, the use of 3D DMTA data can betterdifferentiate between disparate dietary groups in bothherbivorous and carnivorous taxa, likely due to the inclusion ofquantitative depth data.
Observer ComparisonsOverall, highly significant differences were observed
between observers in either pits and/or scratches in all taxa.This is consistent with prior methodological studies [4–7,16]and poses a concern for comparing data between observers.Even highly trained observers lack consistency in at least onemajor feature (i.e., pits or scratches) in both herbivorous andcarnivorous mammals (Table 4). Although observer differencesin herbivorous taxa are slightly higher than other studies[4–7,16], they are consistent with ranges from these studieswhen also accounting for the number of observers (whichincreases the potential for greater observer differences) andwhen comparing the most highly trained observers. However,as there are no published studies that have calculatedinterobserver error of microwear features in carnivores, futurework is necessary to determine if carnivore microwear countsare consistently highly variable. While observer discrepanciesin microwear feature counts raise concern, ratios such as the
2D and 3D dental microwear comparisons
PLOS ONE | www.plosone.org 8 August 2013 | Volume 8 | Issue 8 | e71428

microwear index may be useful in reducing observerdifferences in highly trained individuals, as previouslysuggested [5,7]. For example, an individual who counts morefeatures may have a similar microwear index as anotherobserver if both pit and scratch counts are proportionallyinflated.
The rough structure of herbivore 'trophic triangles' ispreserved in the most experienced observers and is consistentwith prior work [7,15]. While carnivorous 'trophic triangles' areapparent and relatively consistent between the most highlytrained observers, pit counts are highly variable andinconsistent (as compared to mean scratches which maintainthe same rank order between all observers, Figure 3).Nevertheless, the overall lack of consistency betweenobservers (all mean interobserver error rates are greater than45%) calls to question the repeatability and comparability oftwo-dimensional microwear data that is determined by a humanobserver, particularly in the case of carnivorous mammals (withmean observer errors exceeding 60%).
Concluding Remarks
Previous studies have indicated that two-dimensional low-resolution microwear analysis provides a fast, cost-effectivemethod for determining gross dietary differences within taxa,such as the difference between grazers and frugivores [11,15],or the difference between bone-avoiders and bone consumers[27]. DMTA, however, is able to distinguish between moresubtle dietary niches than two-dimensional high-resolutionmicrowear analysis for both bovids and carnivorans. Further,2D analyses are highly variable between observers, even thosewho are highly trained. Collectively, we suggest that quantifyingdental microwear in 3D has the potential to distinguish betweendiverse diets with less variability than 2D methods. Theidentification of coarse dietary categories using 2D methods (at100x magnification) may still be possible; however, cautionshould be taken in comparing data between differentobservers.
Materials and Methods
MaterialsCarnivorans included in this study consist of the following
extant species: Acinonyx jubatus (cheetah, n=9), Panthera leo(African lion, n=15), and Crocuta crocuta (spotted hyena,n=12). All extant carnivoran data including descriptive statisticsare reported in Ref. [23]. Bovids included in this study are fromScott [21] and consist of the following extant species:Antidorcas marsupialis (springbok, n=10), Cephalophussylvicultor (yellow-backed duiker, n=10), Damiliscus lunatus(common tsessebe, n=10), and Sylvicapra grimmia (commonduiker, n=10). All specimens examined in this study are housedin publicly accessible collections and were examined andmolded while visiting respective museums (permission to moldand study all included specimens was granted by all listedmuseums), including the American Museum of Natural History(AMNH), Field Museum of Natural History (FMNH), NationalMuseum of Natural History (NMNH), Iziko South African
Museum (SAM), and, Royal Museum for Central Africa(RMCA). All dental microwear texture data were previouslyanalyzed and published [21,23]; however, the photosimulationsof prior analyses are here measured for 2D dental microwearfeatures.
Dental MicrowearThe enamel region of the lower carnassial shearing facet of
the M1 trigonid was examined on all carnivoran specimens [23],and on all bovid specimens the disto-buccal enamel band ofthe mesial cuspoid of the M2 was examined [21]. All analyzedfacets were first cleaned with cotton swabs soaked in acetoneto remove preservative (e.g., Butvar). Once the tooth was dry,a mold was made using polyvinylsiloxane dental impressionmaterial (President’s Jet regular body, Coltène-WhaledentCorp., Cuyahoga Falls, OH, USA). Tooth casts were thenprepared using Epotek 301 epoxy resin and hardener (EpoxyTechnologies Corp., Billerica, MA, USA).
Dental microwear texture analysis (DMTA) was performed onall casts that preserved ante mortem microwear using white-light confocal profilometry and scale-sensitive fractal analysis(SSFA) [18–23]. All specimens were scanned in threedimensions in four adjacent fields of view at 100xmagnification, for a total sampled area of 204 x 276 µm2. Thesescans, labeled a-d, were converted to photosimulation bitmapimages for 2D dental microwear analysis via SolarmapUniversal software (Solarius Development, Inc.). At themagnification and total sampling area mentioned above,features ≥2 µm are likely to be well resolved. All bitmaps wererenamed with a randomly assigned number and madeaccessible to all observers for counting. Four observerscounted each a-d scan of all taxa per dietary group, for a totalof 144 carnivoran and 160 bovid scans. None of the observerswere aware of what taxa were being studied or theidentification of individual scans, when collecting data. Allphotosimulations were saved at 28.35 dots per cm (dpcm) andviewed on computer monitor screens with resolutions of ≥35.43 dpcm. Observers counted the number of pits, coarsepits, scratches, and coarse scratches in each bitmap (asdefined by [11]), with microwear index calculated from scratchand pit counts (number of scratches/number of pits) [36]. AsRef. [11] is the most commonly employed method by thoseprimarily studying non-primate herbivorous and carnivorousmammals, we have quantified 2D microwear using this method(in contrast to other similar microwear methods, including thosethat use imaging or microwear software). Median dentalmicrowear variables were calculated per specimen perobserver (as is done with DMTA attributes) and subsequentlyanalyzed, except when explicitly noted. All image files areavailable upon request.
Tooth surfaces were analyzed for DMTA attributes including:complexity, scale of maximum complexity, anisotropy,heterogeneity, and textural fill volume. Complexity (Asfc)distinguishes taxa that consume brittle foods from taxa thatconsume softer and/or tougher ones, by assessing the changein surface roughness across changing scale of observation[19,20]. Organisms that consume harder and/or more brittlefood items have higher complexity [19–25]. Scale of maximum
2D and 3D dental microwear comparisons
PLOS ONE | www.plosone.org 9 August 2013 | Volume 8 | Issue 8 | e71428

complexity (Smc) measures the fine-scale limits of the Asfcwith greater Smc surface values associated with fewer smallfeatures [20]. Anisotropy (epLsar) represents the degree thatfeatures of similar depth share a similar orientation (e.g., lots ofparallel striations yield more anisotropic surfaces) [19,20].Grazers or flesh consumers typically have higher anisotropydue to the presence of many parallel scratches of similar depth[19–25]. Heterogeneity (HAsfc(3x3) and HAsfc(9x9)), the degree oftexture complexity variation, is measured by calculating Asfcvariation among subdivided samples (a 3x3 and 9x9 grid,totaling 9 to 81 subsamples, respectively) [19,20]. Thus,surfaces with high heterogeneity have greater disparity incomplexity values between subdivided samples and the entiresurface. Lastly, textural fill volume (Tfv) measures the volumefilled by large (10 µm diameter) and small (2 µm diameter)square cuboids, with high Tfy values indicating potentiallydeeper and/or larger features [20–25]. Scale sensitive fractalanalysis software (ToothFrax and SFrax, Surfract Corp.,www.surfrait.com) was used to analyze all scans andcharacterize tooth surfaces.
Statistical AnalysisNormality tests (Shapiro-Wilk tests, Tables 1, 2) were run on
all 2D and 3D variables. However, as the majority of dentalmicrowear variables are not normally distributed we used non-parametric statistical tests (Kruskal-Wallis) to comparedifferences among all taxa and between observers, exceptwhen noted. Carnivorous and herbivorous mammals wereanalyzed separately. We used Dunn’s procedure [37] andequivalent parametric tests (i.e., Fisher LSD and Tukey HSDtests) when appropriate to conduct multiple comparisonsbetween taxa within like dietary groups (i.e., herbivores-carnivores). Additionally, we compared the two mostexperienced microwear counters per dietary group, usingpaired Wilcoxon signed-rank tests and Student’s t-tests (whennormally distributed). When comparing observer differences,median microwear values were compared between differentindividuals (however, comparisons of all individual scans werealso made and noted in the results and Table S5). Wecalculated interobserver error based on Ref. [4] using 2Dmicrowear attributes for all photosimulations analyzed perdietary group (i.e., 144 in carnivorans, 160 in bovids), includingall four observers and the two most trained observers. Note,when comparing only two observers, interobserver error cannever exceed 100%, mathematically. Correlations betweenDMTA feature attributes and traditional dental microwearcharacters (e.g., pit and scratch frequency) were analyzedusing Spearman’s rank correlation coefficients (ρ).
Supporting Information
Appendix S1. All observer counts for all scans of all extanttaxa included in this study.(XLS)
Table S1. All carnivoran specimens examined and 3D dentalmicrowear texture attributes.(DOC)
Table S2. All bovid specimens examined and 3D dentalmicrowear texture attributes.(DOC)
Table S3. All carnivoran specimens examined and 2D dentalmicrowear character averages between four observers.(DOC)
Table S4. All bovid specimens examined and 2D dentalmicrowear character averages between four observers.(DOC)
Table S5. Summary of comparisons using Dunn’s procedureof observer differences between all individual scans of allextant carnivorans analyzed.(DOC)
Acknowledgements
For access to publicly accessible collections we thank curatorsand collections managers from the American Museum ofNatural History (AMNH), Field Museum of Natural History(FMNH), National Museum of Natural History (NMNH), IzikoSouth African Museum (SAM), and, Royal Museum for CentralAfrica (RMCA). We are grateful to L. Loffredo and threeanonymous reviewers for comments on an earlier version ofthis manuscript.
Author Contributions
Conceived and designed the experiments: LRGD. Performedthe experiments: LRGD JRS BWS SLD BMM CAV AAW MAGMCO. Analyzed the data: LRGD. Contributed reagents/materials/analysis tools: LRGD JRS BWS. Wrote themanuscript: LRGD SLD BMM CAV AAW.
References
1. Walker A, Hoeck HN, Perez L (1978) Microwear of mammalian teeth asan indicator of diet. Science 201: 908–910. doi:10.1126/science.684415. PubMed: 684415.
2. Grine FE (1981) Trophic differences between “gracile” and “robust”Australopithecines: a scanning electron microscope analysis of occlusalevents. S Afr J Sci 77: 203–230.
3. Gordon KD (1982) A study of microwear on chimpanzee molars:implications for dental microwear analysis. Am J Phys Anthropol 59:195–215. doi:10.1002/ajpa.1330590208. PubMed: 7149017.
4. Grine FE, Ungar PS, Teaford MF (2002) Error rates in dentalmicrowear quantification using scanning electron microscopy. Scanning24: 144–153. PubMed: 12074496.
5. Galbany J, Martínez LM, López-Amor HM, Espurz V, Hiraldo O et al.(2005) Error rates in buccal-dental microwear quantification usingscanning electron microscopy. Scanning 27: 23–29. PubMed:15712754.
6. Ungar PS, Scott RS, Scott JR, Teaford MF (2008) Dental microwearanalysis: historical perspectives and new approaches. In: JD IrishGC
2D and 3D dental microwear comparisons
PLOS ONE | www.plosone.org 10 August 2013 | Volume 8 | Issue 8 | e71428

Nelson. Technique and Application in Dental Anthropology, Vol. 53,Vol. 53, Vol. 53. Cambridge: Cambridge University Press. pp. 389–425.
7. Mihlbachler MC, Beatty BL, Caldera-Siu A, Chan D, Lee R (2012) Errorrates and observer bias in dental microwear analysis using lightmicroscopy. Paleontol Electronica 15(1): 12A.
8. Teaford MF, Walker A (1984) Quantitative differences in dentalmicrowear between primate species with different diets and a commenton the presumed diet of Sivapithecus. Am J Phys Anthropol 64: 191–200. doi:10.1002/ajpa.1330640213. PubMed: 6380302.
9. Gordon KD (1984) Orientation of occlusal contacts in the chimpanzee,Pan troglodytes verus, deduced from scanning electron microscopicanalysis of dental microwear patterns. Arch Oral Biol 29: 783–787. doi:10.1016/0003-9969(84)90007-4. PubMed: 6594090.
10. Gordon KD (1988) A review of methodology and quantification in dentalmicrowear analysis. Scan Microsc 2: 1139–1147.
11. Solounias N, Semprebon G (2002) Advances in the reconstruction ofungulate ecomorphology with application to early fossil equids. Am MusNovit: 1–49.
12. Rodrigues HG, Merceron G, Viriot L (2009) Dental microwear patternsof extant and extinct Muridae (Rodentia, Mammalia): ecologicalimplications. Naturwissenschaften 96: 537–542. doi:10.1007/s00114-008-0501-x. PubMed: 19127354.
13. Merceron G, Blondel C, Brunet M, Sen S, Solounias N et al. (2004) TheLate Miocene paleoenvironment of Afghanistan as inferred from dentalmicrowear in artiodactyls. Palaeogeogr Palaeoclimatol Palaeoecol 207:143–163. doi:10.1016/j.palaeo.2004.02.008.
14. Merceron G, Blondel C, De Bonis L, Koufos GD, Viriot L (2005) A newmethod of dental microwear analysis: application to extant primatesand Ouranopithecus macedoniensis (Late Miocene of Greece). Palaios20: 551–561. doi:10.2110/palo.2004.p04-17.
15. Semprebon GM, Godfrey LR, Solounias N, Sutherland MR, JungersWL (2004) Can low-magnification stereomicroscopy reveal diet? J HumEvol 47: 115-144. doi:10.1016/j.jhevol.2004.06.004. PubMed:15337412.
16. Scott R, Schubert B, Grine F, Teaford M (2008) Low magnificationmicrowear: questions of precision and repeatability. J Vert Paleontol 28(3): 139A
17. Mihlbachler MC, Beatty BL (2012) Magnification and resolution indental microwear analysis using light microscopy. Paleontol Electronica15(3): 25A.
18. Ungar PS, Brown CA, Bergstrom TS, Walkers A (2003) Quantificationof dental microwear by tandem scanning confocal microscopy andscale-sensitive fractal analyses. Scanning 25: 185–193. PubMed:12926610.
19. Scott RS, Ungar PS, Bergstrom TS, Brown CA, Grine FE et al. (2005)Dental microwear texture analysis shows within-species diet variabilityin fossil hominins. Nature 436: 693–695. doi:10.1038/nature03822.PubMed: 16079844.
20. Scott RS, Ungar PS, Bergstrom TS, Brown CA, Childs BE et al. (2006)Dental microwear texture analysis: technical considerations. J HumEvol 51: 339–349. doi:10.1016/j.jhevol.2006.04.006. PubMed:16908052.
21. Scott JR (2012) Dental microwear texture analysis of extant AfricanBovidae. Mammalia 76: 157–174.
22. Schubert BW, Ungar PS, DeSantis LRG (2010) Carnassial microwearand dietary behaviour in large carnivorans. J Zool 280: 257–263. doi:10.1111/j.1469-7998.2009.00656.x.
23. DeSantis LRG, Schubert BW, Scott JR, Ungar PS (2012) Implicationsof diet for the extinction of saber-toothed cats and American lions.PLOS ONE 7(12): e52453. doi:10.1371/journal.pone.0052453.PubMed: 23300674.
24. Prideaux GJ, Ayliffe LK, Desantis LRG, Schubert BW, Murray PF et al.(2009) Extinction implications of a chenopod browse diet for a giantPleistocene kangaroo. Proc Natl Acad Sci U S A 106: 11646–11650.doi:10.1073/pnas.0900956106. PubMed: 19556539.
25. Haupt RJ, DeSantis LRG, Green JL, Ungar PS (2013) Dentalmicrowear texture as a proxy for diet in xenarthrans. J Mammal (Inpress). http://dx.doi.org/10.1644/12-MAMM-A-204.1.
26. Beatty BL, Mihlbachler MC (2012) Comparison of light microscopy-based dental microwear and dental microwear texture analysis:implications for testing hypotheses of feeding ecology in extinctvertebrates. J Vert Paleontol 32: 61A–62A
27. Goillot C, Blondel C, Peigné S (2009) Relationships between dentalmicrowear and diet in Carnivora (Mammalia) - Implications for thereconstruction of the diet of extinct taxa. Palaeogeogr PalaeoclimatolPalaeoecol 271: 13–23. doi:10.1016/j.palaeo.2008.09.004.
28. Van Valkenburgh B, Teaford MF, Walker A (1990) Molar microwearand diet in large carnivores: inferences concerning diet in thesabretooth cat, Smilodon fatalis. J Zool 222: 319–340. doi:10.1111/j.1469-7998.1990.tb05680.x.
29. Merceron G, de Bonis L, Viriot L, Blondel C (2005) Dental microwear offossil bovids from northern Greece: paleoenvironmental conditions inthe eastern Mediterranean during the Messinian. PalaeogeogrPalaeoclimatol Palaeoecol 217: 173-185. doi:10.1016/j.palaeo.2004.11.019.
30. Gagnon M, Chew AE (2000) Dietary preferences in extant AfricanBovidae. J Mammal 81: 490–511. doi:10.1644/1545-1542(2000)081.
31. Schubert BW, Ungar PS, Sponheimer M, Reed KE (2006) Microwearevidence for Plio-Pleistocene bovid diets from Makapansgat LimeworksCave, South Africa. Palaeogeogr Palaeoclimatol Palaeoecol 241: 301–319. doi:10.1016/j.palaeo.2006.04.004.
32. Solounias N, Rivals F, Semprebon GM (2010) Dietary interpretationand paleoecology of herbivores from Pikermi and Samos (late Mioceneof Greece). Paleobiology 36: 113–136. doi:10.1666/0094-8373-36.1.113.
33. Fraser D, Theodor JM (2011) Comparing ungulate dietary proxies usingdiscriminant function analysis. J Morphol 272: 1513–1526. doi:10.1002/jmor.11001. PubMed: 21915893.
34. Walker A (1984) Mechanisms of honing in the male baboon canine. AmJ Phys Anthropol 65: 47–60. doi:10.1002/ajpa.1330650108. PubMed:6541880.
35. Teaford MF, Runestad JA (1992) Dental microwear and diet inVenezuelan primates. Am J Phys Anthropol 88: 347–364. doi:10.1002/ajpa.1330880308. PubMed: 1642321.
36. MacFadden BJ, Solounias N, Cerling TE (1999) Ancient diets, ecology,and extinction of 5-million-year-old horses from Florida. Science 283:824-827. doi:10.1126/science.283.5403.824. PubMed: 9933161.
37. Dunn OJ (1964) Multiple comparisons using rank sums. Technometrics6: 241-252. doi:10.1080/00401706.1964.10490181.
2D and 3D dental microwear comparisons
PLOS ONE | www.plosone.org 11 August 2013 | Volume 8 | Issue 8 | e71428