Incisal Dental Microwear of the Prehistoric Point Hope ...
105
Western Michigan University Western Michigan University ScholarWorks at WMU ScholarWorks at WMU Master's Theses Graduate College 12-2006 Incisal Dental Microwear of the Prehistoric Point Hope Incisal Dental Microwear of the Prehistoric Point Hope Communities: A Dietary and Cultural Synthesis Communities: A Dietary and Cultural Synthesis Kristin L. Krueger Follow this and additional works at: https://scholarworks.wmich.edu/masters_theses Part of the Social and Cultural Anthropology Commons Recommended Citation Recommended Citation Krueger, Kristin L., "Incisal Dental Microwear of the Prehistoric Point Hope Communities: A Dietary and Cultural Synthesis" (2006). Master's Theses. 3976. https://scholarworks.wmich.edu/masters_theses/3976 This Masters Thesis-Open Access is brought to you for free and open access by the Graduate College at ScholarWorks at WMU. It has been accepted for inclusion in Master's Theses by an authorized administrator of ScholarWorks at WMU. For more information, please contact [email protected].
-
Upload
khangminh22 -
Category
Documents
-
view
4 -
download
0
Transcript of Incisal Dental Microwear of the Prehistoric Point Hope ...
Western Michigan University Western Michigan University
ScholarWorks at WMU ScholarWorks at WMU
Master's Theses Graduate College
12-2006
Incisal Dental Microwear of the Prehistoric Point Hope Incisal Dental Microwear of the Prehistoric Point Hope
Communities: A Dietary and Cultural Synthesis Communities: A Dietary and Cultural Synthesis
Kristin L. Krueger
Follow this and additional works at: https://scholarworks.wmich.edu/masters_theses
Part of the Social and Cultural Anthropology Commons
Recommended Citation Recommended Citation Krueger, Kristin L., "Incisal Dental Microwear of the Prehistoric Point Hope Communities: A Dietary and Cultural Synthesis" (2006). Master's Theses. 3976. https://scholarworks.wmich.edu/masters_theses/3976
This Masters Thesis-Open Access is brought to you for free and open access by the Graduate College at ScholarWorks at WMU. It has been accepted for inclusion in Master's Theses by an authorized administrator of ScholarWorks at WMU. For more information, please contact [email protected].
INCISAL DENTAL MICROWEAR OF THE PREHISTORIC POINT HOPE COMMUNITIES: A DIETARY AND CULTURAL SYNTHESIS
by
Kristin L. Krueger
A Thesis Submitted to the
Faculty of The Graduate College in partial fulfillment of the
requirements for the
Degree of Master of Arts
Department of Anthropology
Western Michigan University Kalamazoo, Michigan
December 2006

© 2006 Kristin L. Krueger
ACKNOWLEDGEMENTS
First and foremost, I would like to thank my parents, Steven and Marla Krueger,
for always reminding me of the "Prime Directive" and for being two of the wisest, most
supportive parents. Thank you for teaching me the balance between working hard and
having fun. Love to youse, you ole things!
To my sister and brother-in-law, Jenny and Jeff Krueger, for loving me no matter
what color hair I had. Also, thank you for not claiming me as a dependent on your taxes
during my years in Madison, even though I'm sure I qualified!
To my fiance, Dan, for being my calm and taking good care of me even when my
independent self doesn't think I need it.
To Boo and Bingley, my feline companions, for their unconditional love and
many laughs.
They say it takes a village to raise a child, but I believe the same goes for an
academic. I am sincerely indebted to the following professors and researchers who went
above and beyond the call of duty to help me. First, to my graduate advisor, Dr. Chuck
Hilton, for asking me questions even though he already knew the answer. You have been
both advisor and mentor, and I thank you. To my committee members, Drs. Bob
Anemone and Michael Nassaney, thank you for giving me your insights and advice. I
thoroughly appreciate your contribution and effort. To Dr. Ken Mowbray at the
American Museum of Natural History for his permission to use the Point Hope skeletal
materials. To Drs. Phil Guichelaar and Mitchell Keil in the Department of Engineering at
II

Acknowledgements - Continued
WMU for so diligently helping a young anthropologist with her project. To Veeco Co.
for the amazing interference microscope images. To Dr. Rob Eversole, microscopist
extraordinaire at the Biological Imaging Center at WMU for advice on the proper
microscope to use. To Dr. Bill Sanders at the University of Michigan for his incredible
advice with the molding and casting techniques. To Drs. Peter Ungar, Wendy Dirks, and
Debbie Guatelli-Steinberg for their much appreciated and desperately needed advice with
dental molding, casting, microwear, and my project in general.
A special thank you to my nephews, Noah Krueger and Colton Vinson, for
reminding me that the little things in life are the most important.
To G.A. for listening and _.guiding.
I would like to acknowledge the financial support received from the Graduate
Student Research Fund and the Graduate Student Travel Fund from The Graduate
College at Western Michigan University. The timely completion of this thesis was
accomplished through these financial outlets.
This thesis is dedicated to the memory of my great-grandmother (Grammy), Edna
B.A. Krueger, for teaching me the fundamentals in life with a deck of cards, a piece of
kuchen, and a Tootsie Roll bank. Thank you for instilling in me the importance of an
education and for being the only one to let me jump on the davenport.
Kristin L. Krueger
Ill
INCISAL DENT AL MICRO WEAR OF THE PREHISTORIC POINT HOPE COMMUNITIES: A DIETARY AND CULTURAL SYNTHESIS
Kristin L. Krueger, M.A.
Western Michigan University, 2006
The prehistoric coastal communities of Point Hope, Alaska have been considered
important Arctic archaeological sites since their initial excavations in 1939. The majority
of the archaeological artifacts are grouped into two temporally distinct cultural
components, the Ipiutak (2100-1500BP) and the Tigara (800-300BP). Although debated,
Arctic archaeologists have suggested that the Ipiutak depended heavily on land mammals
with only seasonal reliance on sea mammals, whereas the Tigara relied primarily on sea
mammals including whales. While both groups clearly utilized foraging subsistence
economies, the contrasts in their food acquisition strategies would have placed different
demands on the males and females, particularly with regard to paramasticatory behavior.
This paper addresses aspects of the gender-based division of labor in the Ipiutak and
Tigara through an analysis of their patterns of incisal dental microwear.
TABLE OF CONTENTS
ACKNOWLEDGEMENTS ................................................................................... 11
LIST OF TABLES.................................................................................................. VI
LIST OF FIGURES................................................................................................ Vll
CHAPTER
I. INTRODUCTION...................................................................................... 1
II. LITERATURE REVIEW........................................................................... 6
North American Arctic Archaeology ................................................ 6
Point Hope Site Description.............................................................. 10
Ethnographic Review .. .. .. . .. .. . .. .. ... .. ... .. . .. .. ... ... ..... .. . .. ... .. . .. ... .. . .. ... .. ... . 15
Dental Research on Point Hope......................................................... 19
Approaches to Dental Microwear Arlalysis....................................... 22
Approaches to Cultural Impact on Dentition..................................... 24
III. MATERIALS AND METHODOLOGY .................................................... 28
Sample Size and Composition........................................................... 28
Molding and Casting .. .. . .. .. .. .. . .. . . . .. .. . .. . .. .. . .. .. . .. .. . .. ... .. ... ... .. ... .. . .. ... .. ... 30
Microscopy Techniques..................................................................... 31
Dental Microwear Descriptions and Scoring .................................... 33
Statistical Methods............................................................................ 36
Hypotheses ........................................................................................ 39
IV
Table of Contents - Continued
IV. RESULTS ................................................................................................... 41
Feature Count Data............................................................................ 41
Sample Group Breakdown .......................... : ..................................... 43
Pit Occurrence in the Point Hope Samples .. .. .. ...... .. .. .... .. ........ ......... 44
Fine Scratch Occurrence in the Point Hope Samples........................ 49
Hypercoarse Scratch Occurrence in the Point Hope Samples........... 55
Summary ........................................................................................... 60
V. DISCUSSION ............................................................................................. 62
Pits ..................................................................................................... 64
Fine Scratches.................................................................................... 67
Hypercoarse Scratches....................................................................... 69
Research Comparisons...................................................................... 71
Summary ........................................................................................... 72
VI. CONCLUSION.......................................................................................... 75
REFERENCES....................................................................................................... 80
APPENDICES........................................................................................................ 83
A. Sex Determination Data . . .. . .. .. . . . . . .. . . . .. . .. .. . . . .. . . . .. . . . . . . .. .. . .. .. . .. . . . .. . .. .. . .. . .. ... .. . . 85
B. Individual Dental Microwear Data............................................................. 87
C. Results of Two-Way Analysis of Variance ................................................ 91
V
•
LIST OFT ABLES
3.1 lpiutak and Tigara specimens used............................................................. 29
3.2 Dental microwear features and their descriptions· ...................................... 34
3.3 Dental microwear features and their associated arbitrary size group ......... 36
4.1 Mean group dental microwear feature counts with standard deviation ...... 41
4.2 Sample group breakdown of Point Hope sample groups
used in this study ........................................................................................ 43
4.3 Mean pit feature counts, broken down by size, with standard deviation.... 48
4.4 Mean fine scratch feature counts, broken down by size, with standard deviation ..................................................................................................... 54
4.5 Mean hypercoarse scratch feature counts, broken down by size, with
standard deviation....................................................................................... 59
VI

LIST OF FIGURES
1.1 Map of Alaska ............................................................................................ 3
1.2 Point Hope spit ........................................................................................... 5
2.1 North American arctic................................................................................ 7
2.2 Arctic cultural traditions............................................................................. 8
2.3 General Ipiutak house structure.................................................................. 12
3.1 Tigara 441, male, occlusal surface of the central right incisor, before and after gold sputtering.................................................................................... 32
3.2 Possible enamel surfaces to be sampled ..................................................... 35
3.3 Examples of dental microwear features ..................................................... 38
4.1 Summary chart of mean dental microwear by size and Point Hope sample ......................................................................................................... 42
4.2 The total number of pits in the Point Hope sample groups........................ 44
4.3 Mean pit number between the Ipiutak and Tigara sample groups.............. 46
4.4 Mean pit number between male and female sample groups ....................... 47
4.5 Mean pit number for each Point Hope sample group ................................. 49
4.6 Total number of fine scratches of the Point Hope sample groups.............. 50
4.7 Mean fine scratch number between the Ipiutak and Tigara sample groups ......................................................................................................... 52
4.8 Mean fine scratch number between male and female sample groups ........ 53
4.9 Mean fine scratch number for each Point Hope sample group................... 55
4.10 The total number of HCS in the Point Hope sample groups. ..................... 56
Vll
List of Figures - Continued
4.11 Mean HCS number between the Ipiutak and Tigara sample groups....... 57
4.12 Mean HCS number between male and female sample groups.............. 58
4.13 Mean HCS number for each Point Hope sample group...................... 60
6.1 Tigara 359, female, central left incisor......................................... 78
6.2 Ipiutak 96-A, male, central left incisor......................................... 79
Vlll
...
CHAPTER!
INTRODUCTION
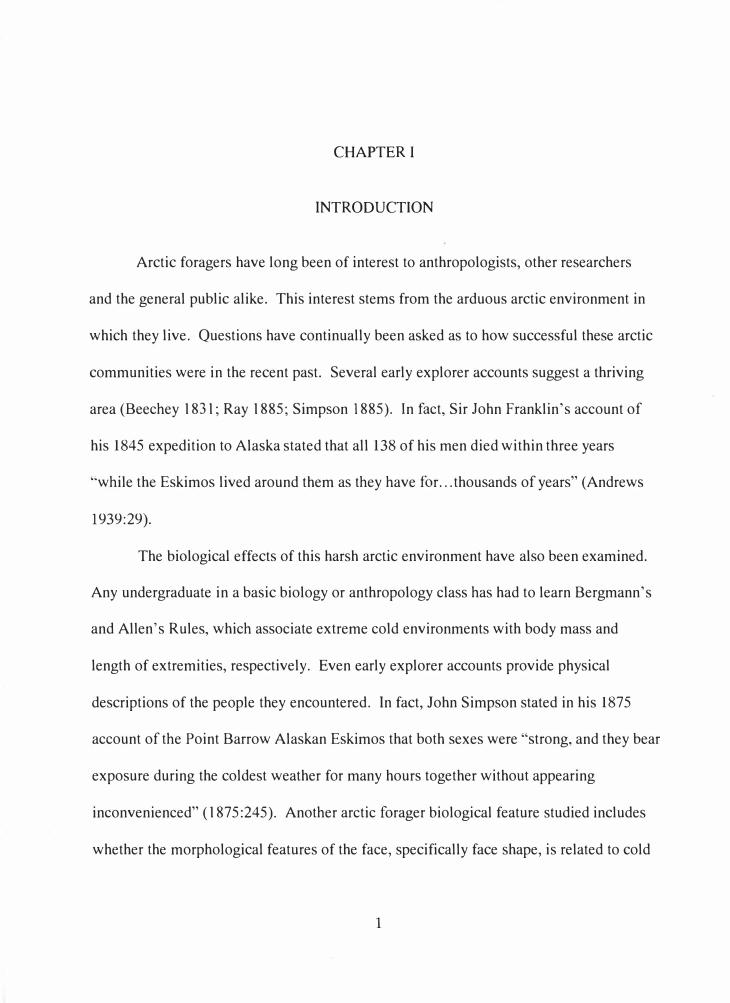
Arctic foragers have long been of interest to anthropologists, other researchers
and the general public alike. This interest stems from the arduous arctic environment in
which they live. Questions have continually been asked as to how successful these arctic
communities were in the recent past. Several early explorer accounts suggest a thriving
area (Beechey 1831; Ray 1885; Simpson 1885). In fact, Sir John Franklin's account of
his 1845 expedition to Alaska stated that all 138 of his men died within three years
"while the Eskimos lived around them as they have for. .. thousands of years" (Andrews
1939:29).
The biological effects of this harsh arctic environment have also been examined.
Any undergraduate in a basic biology or anthropology class has had to learn Bergmann's
and Allen's Rules, which associate extreme cold environments with body mass and
length of extremities, respectively. Even early explorer accounts provide physical
descriptions of the people they encountered. In fact, John Simpson stated in his 1875
account of the Point Barrow Alaskan Eskimos that both sexes were "strong, and they bear
exposure during the coldest weather for many hours together without appearing
inconvenienced" (1875:245). Another arctic forager biological feature studied includes
whether the morphological features of the face, specifically face shape, is related to cold
1
adaptation or facial function (i.e. chewing strength) (Cederquist 1979; Cederquist et al.
1977; Dahlberg et al. 1978; Mayhall et al. 1970).
As one can see, arctic foragers have been the focus of several inquiries by
anthropologists and other researchers simply due to the extreme climate in which they
lived. As a consequence of these inquiries, several debates have developed. What role, if
any, do these biological features have on arctic forager success? What functions do
subsistence strategies play? What sort of research needs to be completed to unravel these
complex questions?
Initially, it seems like a daunting task; however, focusing these research questions
on one debate at a particular site helps to separate out multifaceted issues. One debate
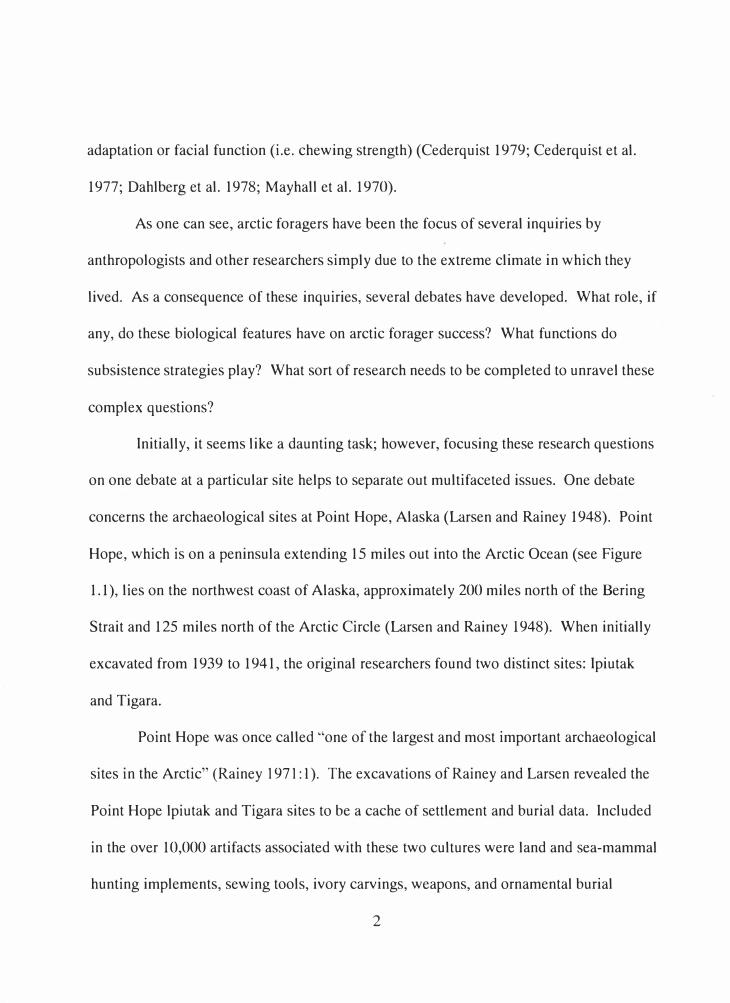
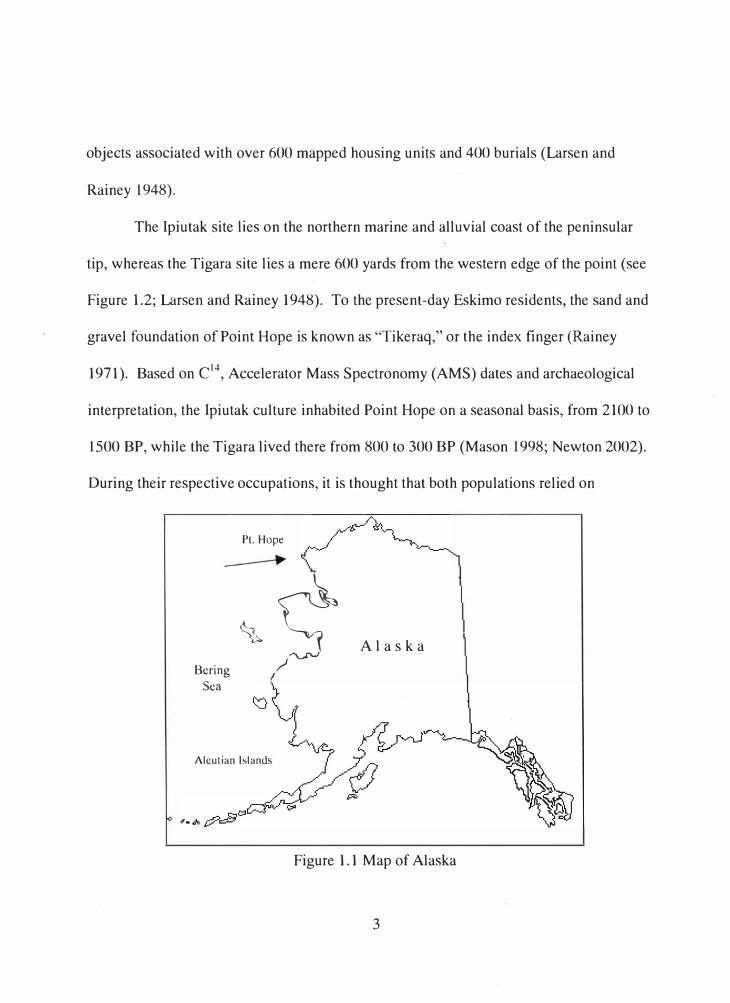
concerns the archaeological sites at Point Hope, Alaska (Larsen and Rainey 1948). Point
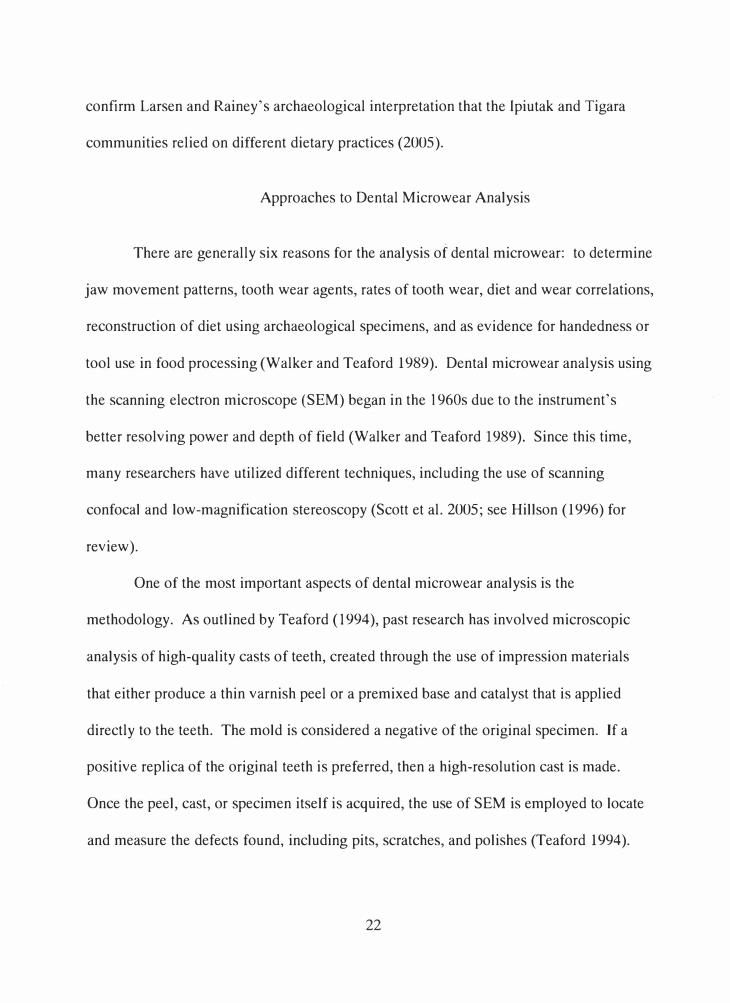
Hope, which is on a peninsula extending 15 miles out into the Arctic Ocean (see Figure
1.1), lies on the northwest coast of Alaska, approximately 200 miles north of the Bering
Strait and 125 miles north of the Arctic Circle (Larsen and Rainey 1948). When initially
excavated from 1939 to 1941, the original researchers found two distinct sites: Ipiutak
and Tigara.
Point Hope was once called "one of the largest and most important archaeological
sites in the Arctic" (Rainey 1971: 1 ). The excavations of Rainey and Larsen revealed the
Point Hope lpiutak and Tigara sites to be a cache of settlement and burial data. Included
in the over 10,000 artifacts associated with these two cultures were land and sea-mammal
hunting implements, sewing tools, ivory carvings, weapons, and ornamental burial
2
objects associated with over 600 mapped housing units and 400 burials (Larsen and
Rainey 1948).
The Ipiutak site lies on the northern marine and alluvial coast of the peninsular
tip, whereas the Tigara site lies a mere 600 yards from the western edge of the point (see
Figure 1.2; Larsen and Rainey 1948). To the present-day Eskimo residents, the sand and
gravel foundation of Point Hope is known as "Tikeraq," or the index finger (Rainey
1971). Based on C14
, Accelerator Mass Spectronomy (AMS) dates and archaeological
interpretation, the Ipiutak culture inhabited Point Hope on a seasonal basis, from 2100 to
1500 BP, while the Tigara lived there from 800 to 300 BP (Mason 1998; Newton 2002).
During their respective occupations, it is thought that both populations relied on
Pt. Hope
��
Bering /
A l a s k a
Sea
Aleutian Islands
Figure 1.1 Map of Alaska
3
distinctive dietary practices.
Although these two sites demonstrated a vast array of artifacts, they also brought
to light several questions concerning the possible subsistence strategies of these two
communities. Larsen and Rainey (1948) suggested that the Ipiutak community relied
primarily on land mammal hunting, specifically caribou, supplemented with seal and
walrus hunting. The Tigara community, on the other hand, relied primarily on whale
hunting. Both of these conclusions were based on the initial archaeological data with
minimal incorporation of research on the human skeletal remains.
My project examines Ipiutak and Tigara human skeletal remains from Point Hope,
currently housed at the American Museum of Natural History (AMNH) in New York
City. These skeletal remains, along with associated grave goods, can continue dialogue
regarding bio-cultural systems and adaptations to the Arctic environment. Specifically,
examining dental remains, which are most often recovered at an archaeological site,
provide a unique opportunity for a focused analysis on pre-contact Alaskan coastal
cultural adaptations.
Therefore, the objective of this thesis is to evaluate incisal dental microwear
patterns of the Ipiutak and Tigara skeletal sample to test hypotheses concerning the
relationship between diet and dental microwear. Additionally, distinct male and female
activities in both populations will be examined in order to discuss the consequences of
the gender-based division of labor on dental biology.
4

Vl
\�\et.
"'�x-t'f�
't.
---------
Jabbertown
O _______ S _______ IOkm
Figure 1.2 Point Hope spit. Modified from Larsen and Rainey 1948.
Tigara 0
CHAPTER II
LITERATURE REVIEW
North American Arctic Archaeology
In order to facilitate discussion on the Point Hope archaeological sites, it is
necessary to provide a basic background on North American arctic archaeology. The
North American arctic ranges approximately 6,000 miles from Greenland in the east,
through Canada and Alaska, to the northeast coast of Siberia in the west (see Figure 2.1,
Collins 1984). The first Europeans saw the Alaskan arctic coast Eskimos in 1741, and
the first Arctic archaeological excavation was undertaken in 1927 in Greenland (Collins
1984).
A temperature trace was kept at Point Hope from 1888-1904; the coldest
temperature recorded was -48° F and the warmest peaked at 97° F (Larsen and Rainey
1948). The windiest places in the arctic are those on the coast, and with Point Hope's
elevation at sea level, there are no barriers to the cold Siberian wind (Stager and
McSkimming 1984). Additionally, ice packs along the shore can cover surfaces
extending as much as ten miles out to sea (Stager and McSkimming 1984). Due to wind
and sea currents, Point Hope's southern coast is most affected by ice packing, with an
average height of 30 to 40 feet and width of 50 to 100 feet (Larsen and Rainey 1948).
Challenges to arctic archaeology include broadly distributed sites, expensive and
6

----.)
Chukchi '.,ea
0'-v-<1'--J �-�� ....... . ,,l ..... �..?' {,;;:-,..
( ,S. �A .,,-v---,J
r. '\ r I\ � \.r. 11( r ,,- ,
� � '\'
! --�
<::..). ,�,-). J-L • .,_ ,-,..., ) -1
".(. \ <� � ~ / "
'> � __, (__.,.,../ .� \ u \: Beaufort Sea . s ... � ·.. '1.. ,n�,,--)· -. •
r""")
'-fa - '<). ·• . . le>l,')IA', 1 · V
<'"i i � 'I- cc.� �- -·.\)'t'.:
K
v;
v
0. --· .
' ,
"" ' ,, \ � . � . ·o - - � - ' '\, ,, 'b,, \ .- f"l,,)J\!1 f4 Barr.· "'\. 1 .,..
· �"�" I , "��� "-. ,,,,
,!_ , v�--> >,,·_ .U· \ ((J.\ 'J.,,,, �. _ !,..
1'1/si� L..__.___.J .. __ � �-. ""i '
r ""Island . ' v'1 � �>�
�- . �L-"',- J' /\ �•.. )- ( �-'Z::��- .. , � � �"-�-::.:> ,o '1_ A
1---� \ ' •,f ,.. .C',,�. l� � ( H�!�on /):.: ).· --·ti·
(' . 'V ��.. . . '
.
/;-""'•� .
� \�� - ·;u., \\
r,.fl
):J �' . . ·. ( ..
"'
--� I
0 soo"' - - -. 'i'.,.,- .r·;c-
� cdfa ,, \ '
Figure 2.1 North American arctic. Modified from Giddings 1967.
Arctic Ocean
problematic transportation to those sites, rural living conditions, short field seasons, and
permafrost (Dekin 1978). Permafrost hinders excavation; as one layer is removed, the
layer underneath begins to melt. As water accumulates, it causes sidewall distortions or
crumbling (Dekin 1978). Regardless, permafrost also is a huge advantage to arctic
archaeology, as it can be an excellent preservative. Under the right conditions, organic
cultural objects will be well preserved if frozen shortly after deposition (Dekin 1978;
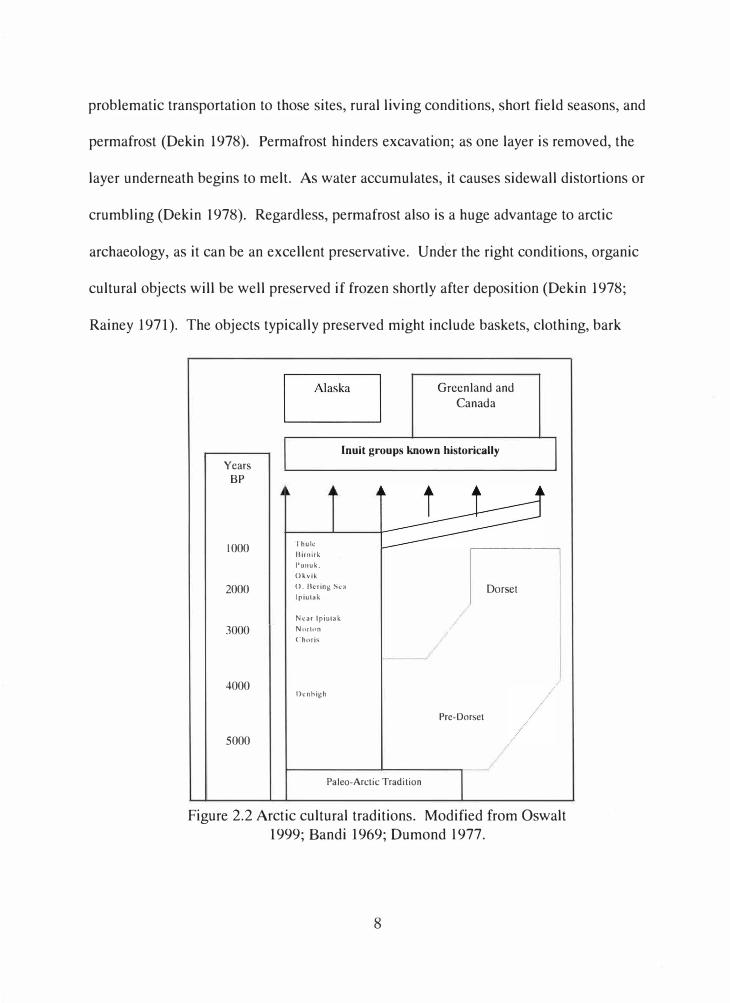
Rainey 1971). The objects typically preserved might include baskets, clothing, bark
Years
BP
1000
2000
3000
4000
5000
Greenland and
Canada
Inuit groups known historically
Thule
Birnirk
Punuk.
Okvik
0. Bering Sea Dorset lpiulak
Near lpiutak
Nl1rlon
C'horis
Dcnhigh
Pre-Dorset
Paleo-Arctic Tradition
I
Figure 2.2 Arctic cultural traditions. Modified from Oswalt 1999; Bandi 1969; Dumond 1977.
8
~\ ~---
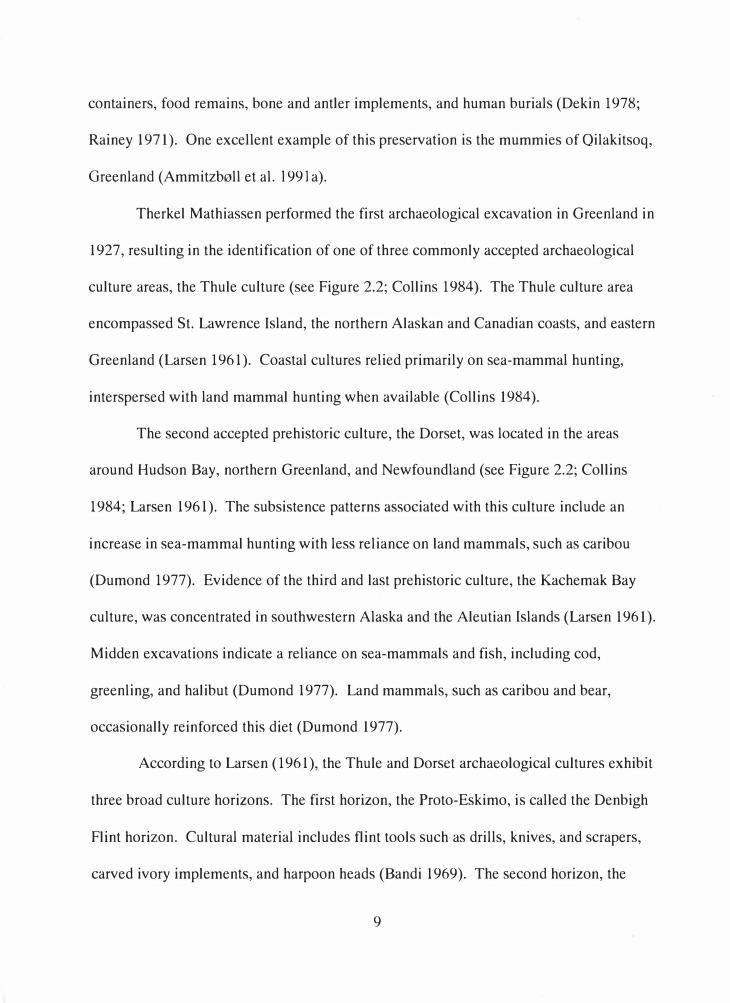
containers, food remains, bone and antler implements, and human burials (Dekin 1978;
Rainey 1971). One excellent example of this preservation is the mummies of Qilakitsoq,
Greenland (Ammitzb0ll et al. 1991a).
Therkel Mathiassen performed the first archaeological excavation in Greenland in
1927, resulting in the identification of one of three commonly accepted archaeological
culture areas, the Thule culture (see Figure 2.2; Collins 1984). The Thule culture area
encompassed St. Lawrence Island, the northern Alaskan and Canadian coasts, and eastern
Greenland (Larsen 1961). Coastal cultures relied primarily on sea-mammal hunting,
interspersed with land mammal hunting when available (Collins 1984).
The second accepted prehistoric culture, the Dorset, was located in the areas
around Hudson Bay, northern Greenland, and Newfoundland (see Figure 2.2; Collins
1984; Larsen 1961). The subsistence patterns associated with this culture include an
increase in sea-mammal hunting with less reliance on land mammals, such as caribou
(Dumond 1977). Evidence of the third and last prehistoric culture, the Kachemak Bay
culture, was concentrated in southwestern Alaska and the Aleutian Islands (Larsen 1961).
Midden excavations indicate a reliance on sea-mammals and fish, including cod,
greenling, and halibut (Dumond 1977). Land mammals, such as caribou and bear,
occasionally reinforced this diet (Dumond 1977).
According to Larsen (1961), the Thule and Dorset archaeological cultures exhibit
three broad culture horizons. The first horizon, the Proto-Eskimo, is called the Denbigh
Flint horizon. Cultural material includes flint tools such as drills, knives, and scrapers,
carved ivory implements, and harpoon heads (Bandi 1969). The second horizon, the
9

Paleo-Eskimo, is found in two different forms: one including pottery, and one without
(Larsen 1961). Cultures with pottery include the Norton, Near Ipiutak, and Choris, and
those without pottery are the Ipiutak and Dorset (Larsen 1961). The latest horizon is the
Neo-Eskimo and includes the Okvik and Inugsuk cultures. These cultures include
archaeological artifacts such as developed harpoon heads, snow goggles with round
openings (as opposed to the more common slit opening), and carved wooden figurines
(Bandi 1969).
When the archaeological sites of Point Hope were initially excavated, Larsen and
Rainey (1948) recognized that Tigara and Jabbertown were occupied during the late
prehistoric and early modern periods. However, the discovery of flaked flint tools
instead of rubbed slate tools at the Ipiutak site created confusion as to its position in
Eskimo culture (Rainey 1971). Additionally, the Ipiutak carved ivory objects closely
resembled those of the oldest culture known at the time, the Okvik (Rainey 1971). The
culture found at Ipiutak is now called the Ipiutak culture, with influences as far back as
the Denbigh Flint complex (Anderson 1984; Collins 1984).
Point Hope Site Description
The archaeological excavations at Point Hope began in 1939 and were conducted
by Larsen and Rainey as a joint American-Danish expedition. Their primary objective
was to locate the earliest Eskimo site, which they hypothesized would be found in the
west, closest to Siberia. They agreed that Point Hope, from preceding descriptions,
would merit study. Arriving in July of 1939, they found Eskimo women and children
10
excavating the site and selling the artifacts, a practice begun several decades earlier with
the increased number of trading ships in the area (Larsen and Rainey 1948). This trade
industry temporarily hindered Larsen, Rainey, and their crew from excavating, as the
council of village elders had to be persuaded regarding the benefits of scientific
archaeological excavation (Larsen and Rainey 1948).
With permission granted, two archaeological sites were excavated: Tigara and
Jabbertown (Rainey 1971). Tigara is situated 600 yards from the Arctic Ocean coast, and
Jabbertown lies approximately five miles east of Tigara (see Figure 1.2; Rainey 1947).
During the first field season, the Ipiutak site was found about one mile north of Tigara
(Rainey 1971).
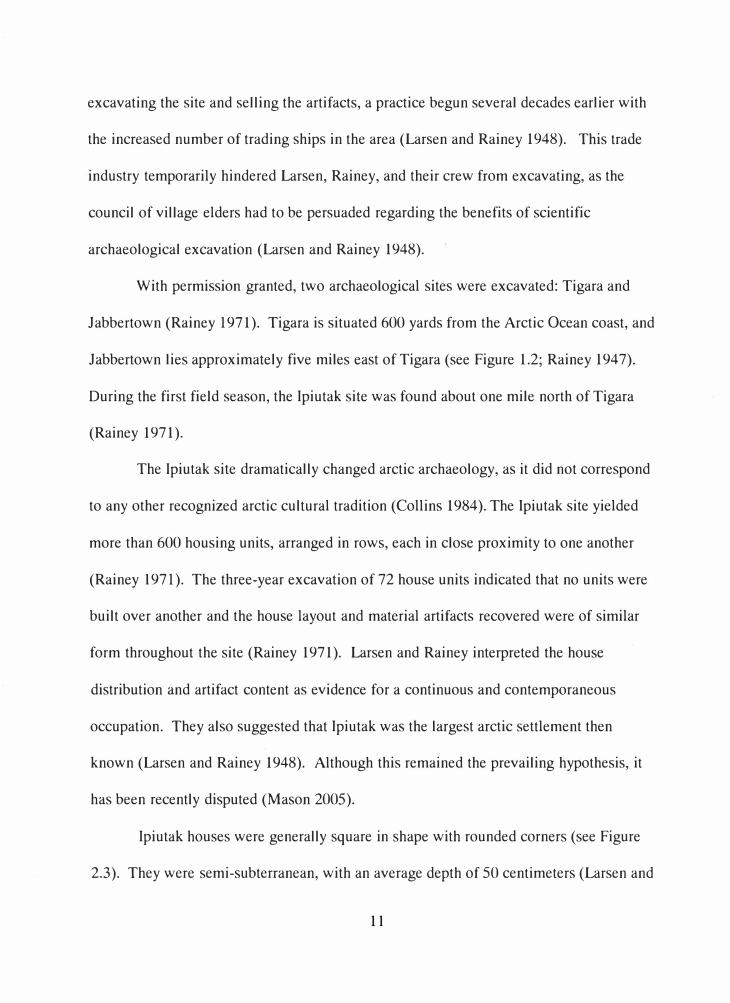
The Ipiutak site dramatically changed arctic archaeology, as it did not correspond
to any other recognized arctic cultural tradition (Collins 1984). The Ipiutak site yielded
more than 600 housing units, arranged in rows, each in close proximity to one another
(Rainey 1971). The three-year excavation of 72 house units indicated that no units were
built over another and the house layout and material artifacts recovered were of similar
form throughout the site (Rainey 1971). Larsen and Rainey interpreted the house
distribution and artifact content as evidence for a continuous and contemporaneous
occupation. They also suggested that Ipiutak was the largest arctic settlement then
known (Larsen and Rainey 1948). Although this remained the prevailing hypothesis, it
has been recently disputed (Mason 2005).
Ipiutak houses were generally square in shape with rounded corners (see Figure
2.3). They were semi-subterranean, with an average depth of 50 centimeters (Larsen and
11

Rainey 1948). The superstructure was most likely made from driftwood logs and willow
branches; however, the poor state of preservation hinders this hypothesis from being
accurately tested (Larsen and Rainey 1948). Ipiutak houses possessed a side
Pebble
Pebble
·,
✓-
Pebble
Figure 2.3 General Ipiutak house structure. Modified from Larsen and Rainey (1948).
12
11 I I ' II' \\'\\\I I i\\\\ ", I•
entrance, a four-post roof supporting system, and central fireplace, common features of
prehistoric Alaskan houses (Larsen and Rainey 1948). After excavating several housing
units, Larsen and Rainey examined the possible location of burials associated with the
site.
Local Point Hope community members were hired to help locate and excavate
these graves, with a monetary reward for each successful find (Rainey 1971). The
Ipiutak burial site was located in 1940, 560 meters southeast of the Ipiutak village
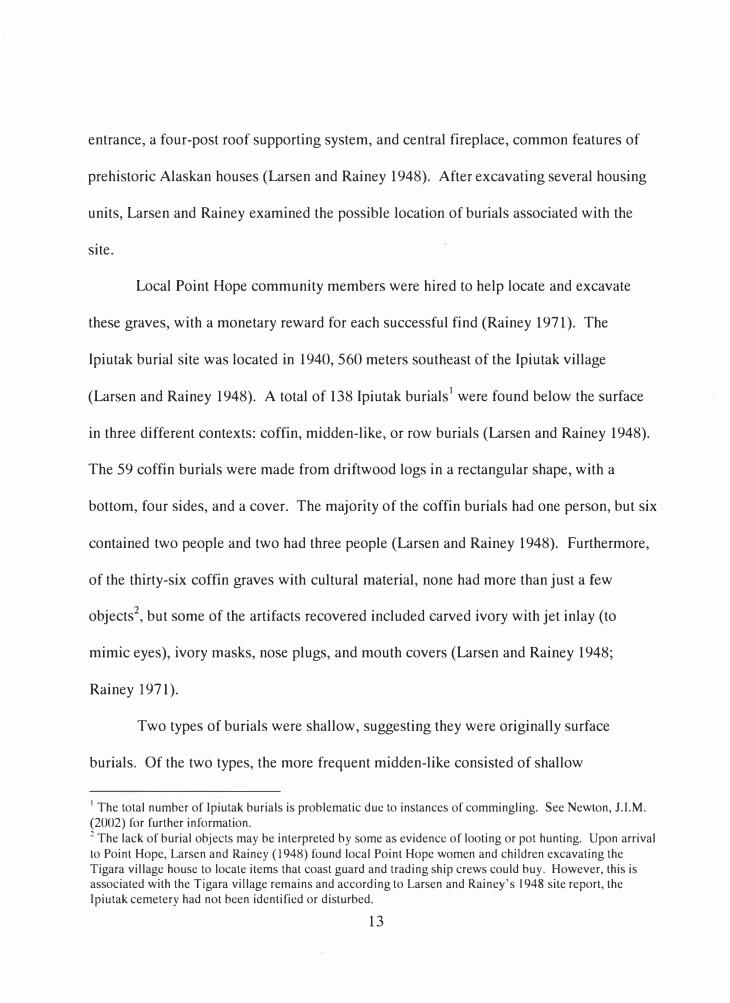
(Larsen and Rainey 1948). A total of 138 Ipiutak burials1
were found below the surface
in three different contexts: coffin, midden-like, or row burials (Larsen and Rainey 1948).
The 59 coffin burials were made from driftwood logs in a rectangular shape, with a
bottom, four sides, and a cover. The majority of the coffin burials had one person, but six
contained two people and two had three people (Larsen and Rainey 1948). Furthermore,
of the thirty-six coffin graves with cultural material, none had more than just a few
objects2, but some of the artifacts recovered included carved ivory with jet inlay (to
mimic eyes), ivory masks, nose plugs, and mouth covers (Larsen and Rainey 1948;
Rainey 1971).
Two types of burials were shallow, suggesting they were originally surface
burials. Of the two types, the more frequent midden-like consisted of shallow
1 The total number of Ipiutak burials is problematic due to instances of commingling. See Newton, J.I.M. (2002) for further information. � The lack of burial objects may be interpreted by some as evidence of looting or pot hunting. Upon arrival to Point Hope, Larsen and Rainey (1948) found local Point Hope women and children excavating the Tigara village house to locate items that coast guard and trading ship crews could buy. However, this is associated with the Tigara village remains and according to Larsen and Rainey's 1948 site report, the lpiutak cemetery had not been identified or disturbed.
13

assemblages of incomplete human and animal bones, antler, ivory, flint, and decaying
wood (Larsen and Rainey 1948). Row burials were virtually exclusive to the east end of
the cemetery near Jabbertown, and were compiled, "as if carefully laid out at one time"
(Rainey 1971:12). Artifacts found with both types of surface burials included ivory
openwork carvings unique to Ipiutak culture, carved rods, chains, ornamental points, and
daggers (Larsen and Rainey 1948).
Over 10,000 cultural artifacts associated with the Ipiutak site were recovered
during the three-year investigation. Although this group lived on the coast, only 324
harpoon parts were recovered, but 2240 artifacts related to archery were found (Rainey
1971). Thus, Larsen and Rainey (1948) suggested that the lpiutak culture was more
heavily reliant on a land-mammal diet than sea-mammal. Current research has
questioned this hypothesis and instead suggested the large amount of arrowheads found
could be attributed to warfare, not land-mammal hunting (Mason 2005). Additionally,
antler projectile points, flint blades, rounded ivory points, ivory and antler engraving
tools and bird bone needles, awls, antler flint flakers, snow goggles and birch bark
vessels were also part of the material assemblage.
The Tigara tradition differs from the Ipiutak culture in several ways. Housing
units were similar in construction to the lpiutak, being semi-subterranean and made of
driftwood logs, but both logs and whalebone were used as buttresses in the Tigara houses
(Larsen and Rainey 1948; Rainey 1947). Material artifacts found in the housing units
include slate harpoon blades, ice picks, flint projectile points, whalebone sled shoes, slate
knives and ulu blades, and potsherds (Larsen and Rainey 1948).
14

The nearly 400 Tigara burials excavated north and east of the village are
considerably different from the Ipiutak in that they are almost uniform in appearance.
Burials were found in two similar contexts: coffin and wood /whalebone frame (Larsen
and Rainey 1948). Each grave contained one skeleton in supine position with the head
facing west. Leg positions varied anywhere from being slightly bent, to completely
flexed upon the chest (Larsen and Rainey 1948). Cultural material in the graves was
sparse, but included flint, antler, and ivory projectile points and harpoon heads, ground
slate ulu blades, clay lamps and pots, ivory snow goggles, and bird bone needles (Larsen
and Rainey 1948).
Ethnographic Review
The foremost question pertaining to the Ipiutak and Tigara archaeological sites
regards the subsistence strategies of both groups. According to Larsen and Rainey
(1948), the Ipiutak were a seasonal group, relying primarily upon caribou and secondly
on sea mammals, not including whales. On the other hand, the Tigara are believed to
have relied solely on sea mammals, with whales taking precedence (Larsen and Rainey
1948). One must question whether this interpretation can be supported through other
lines of evidence.
One way to answer this question is by looking at the skeletal and dental remains.
My research investigates whether dental remains, specifically incisal dental microwear,
can offer additional evidence. However, ethnographically, anterior teeth are used by
Eskimo and Inuit communities in behaviors other than chewing food, called
15

paramasticatory behaviors. Thus, it is imperative to compare the sexual division of labor
between coastal (Taraeumiut) and interior (Nunamiut) Alaskan Eskimo groups to
determine if differences exist. If differences exist, this may help to distinguish
microwear signatures between the two Point Hope communities.
Ethnographic information on traditional activities for indigenous peoples from
coastal Alaskan (Taraeumiut) areas is largely from European and American explorers
from the 19th century. They suggest that women were primarily responsible for all
aspects of childcare and domestic tasks (Andrews 1939; Giffen 1930; Ray 1885; Simpson
1875). Particularly, women were recorded carrying and caring for both male and female
children (Andrews 1939; Giffen 1930; Simpson 1875). Domestic tasks included cooking
reindeer and seal meat; preparing, scraping, dressing and tanning skins; sewing clothing
and boots both from caribou and seal skins; housekeeping; caring for dogs and
maintaining the water supply and general supplies of the household (Andrews 1930;
Foote 1992; Giffen 1930; Ray 1885; Simpson 1875). They also were recorded bringing
in their husband's kill, such as seal carcasses (Simpson 1875).
Men were recorded performing tasks associated with hunting (Andrews 1939;
Giffen 1930; Ray 1885; Simpson 1875). Particularly, they were responsible for hunting
whales and seals; setting nets for seals; catching small fish; flintknapping; manufacturing
and maintaining subsistence technology used at other times of the year and removing and
stretching animal skins (Andrews 1939; Giffen 1930; Ray 1885; Simpson 1875).
Generally speaking, women provided the foundation for key subsistence activities.
16

For the interior (Nunamiut) groups existing on land mammals, a similar sexual
division of labor was recorded, although slight variations inevitably occurred. Women
were recorded as performing the majority of household duties, but also participated in
aspects of hunting (Giddings 1967; Gubser 1965; Oswalt 1967). Specifically, women
cared for children; manufactured pottery; collected firewood, berries, roots, ice, snow,
water, bark and plants; helped in the caribou hunts; transported caribou carcasses back to
camp; distributed caribou meat among the other families; fished, cleaned, and dried
salmon; constructed moss houses; handled and cared for the dogs; made toys for the
children; cooked and above all else, manufactured clothing by sewing (Giddings 1967;
Gubser 1965; Oswalt 1967). In fact, "the most important ability for her to develop is her
skill as a seamstress" (Gubser 1965: 111 ).
In the Nunamiut community, a woman's appeal was based upon her ability as a
seamstress. She had to prepare skins and sinew thread and construct clothing and boots.
The main difference between the coastal and interior groups in this aspect is the material
utilized. The Nunamiut community used primarily caribou skins, but used other land
mammals such as mountain sheep, gray wolves, foxes, mink and grizzly and black bear.
While some Nunamiut families had knowledge of sea mammals due to trading relations
with the coastal communities, they were not extensively used in the interior (Gubser
1965).
"For the Nunamiut, to become a man is to become a hunter" (Gubser 1965: 109).
Similarly to the Taraeumiut, men were hunters and craftsmen, but relied, above all, on
caribou. They shot and butchered the caribou before bringing it back home (Giddings
17
1967; Gubser 1965). They also were recorded killing mountain sheep, fox and wolf
(Giddings 1967; Oswalt 1967). They set traps and manufactured tools, weapons, bow
drills, bows and arrows, snowshoes, dog harnesses, meat racks, sleds and fish traps and
nets (Gubser 1965). Yet, it appears as if Nunamiut women performed a broader range of
tasks compared to both Nunamiut men and Taraeumiut men and women.
It is important to note a few significant details surrounding the labor differences
between the coastal Taraeumiut and interior Nunamiut communities. First, although the
Taraeumiut are recorded using primarily sea mammals and the Nunamiut using caribou,
one should not reach the conclusion that either group did not obtain skins from each other
through trade. In fact, several sources cited the importance of trade networks between
these two groups and an annual trading expedition to Point Barrow or Kotzebue was
always on the Nunamiut schedule (Giddings 1967; Gubser 1965; Oswalt 1967). There,
the Taraeumiut could obtain caribou skins, a material known to be the best for clothing.
Although the Taraeumiut could secure caribou themselves, weather and migration
patterns often thwarted these efforts (Gerlach 1989; Oswalt 1967). For the Nunamiut,
getting sea mammal oil, seal skin for weatherproof boots and ivory for tools were reasons
for the journey (Oswalt 1967). These trade partnerships were so important that they often
were exploited during lean times (Gubser 1965).
A second important difference is in the materials used to make hunting and other
household implements and their archaeological contexts. The Taraeumiut relied heavily
on ivory, flint and ground slate for their implements (Giddings 1967). Many carved ivory
objects were recovered during the field seasons at Point Hope. On the other hand, the
18
Nunamiut used sandstone, gray and black chert and especially local jade (Giddings
1967). It is important to note that carved ivory objects associated with coastal hunting
were recovered during archaeological research at the Ekseavik site of interior Alaska, but
no jade objects were found at Point Hope, even though coastal groups sought after it
when trading with inland groups.
A third and most obvious difference is the type of animals exploited. The
Taraeumiut relied primarily on sea mammals such as seal, walrus and whale while the
Nunamiut relied chiefly on land mammals (mountain sheep, fox and caribou) and fish,
especially salmon. In summary, it seems as though the sexual divisions of labor of the
coastal and interior Alaskan Eskimo communities were similar, but different materials
and animals were utilized according to availability and integral trade networks.
Dental Research on Point Hope
With a general overview of the ethnographic information and original excavation
it is possible to summarize the dental research on these two populations. Although
Raymond Costa conducted his Ph.D. dissertation research and published three successive
articles on the Point Hope dental remains (Costa 1977, 1980a, 1980b, 1982), there has
been only modest bioarchaeological work on the Point Hope collection since their
excavation between 1939-1941.
In his dissertation, Costa (1977) discussed the importance of studying the dental
lesions of past and present cultures without modern dentistry in order to compare them
19
with early hominids. Costa (1977) looked at many different dental dimensions of the
Point Hope population, including the formation of calculus deposits, the number of
carious lesions and abscesses, dental wear, crown height, alveolar recession, and
periodontal disease.
Calculus (the precursor to which is plaque) was found to decrease with age;
however, Costa attributes this to the large antemortem tooth loss with aging (Costa 1977,
1980b). The number of carious lesions and abscesses were low in the Point Hope
sample. Although the number of carious lesions generally remains the same in all ages,
the number of abscesses increases with age. Costa attributes this phenomenon to either
worsening of existing carious lesions or heavy dental wear and trauma (Costa 1977,
1980a).
The dental wear pattern showed that although both sexes have a significant
amount of dental wear, women initially show less than men, but as age increases, women
overall display more wear (Costa 1977). Costa (1977) attributes this pattern to women
using their teeth in paramasticatory fashion for cultural practices, such as clamping and
holding animal hides. Clinical crown height, the measurement from the alveolar margin
to the tooth crown, was seen to decrease as wear increases in both sexes. Additionally,
alveolar bone recession increases with age in both sexes, but becomes exceedingly
problematic at approximately 40 years of age (Costa 1977). Lastly, periodontal disease
increased with age in both Point Hope populations, but the Tigara group had more acute
periodontal disease than the Ipiutak (Costa 1982). Tigara females showed more
periodontal disease than men, but in contrast, the Ipiutak males showed more periodontal
20
disease than the females (Costa 1982). Costa (1982) hypothesized that both the overall
mild and localized, severe forms of periodontal disease in these two populations could be
due to a high fat and protein diet. He proposed this in order to establish a foundation
concerning periodontal disease in societies where high sugar and carbohydrate diets did
not exist (Costa 1982).
Another important study has used the Ipiutak and Tigara collections for
comparison with fossil hominins, specifically, Neandertals. Several studies have
suggested that Neandertal populations showed a high level of linear enamel hypoplasias,
(LEH) which are broad signs of physiological stress. Guatelli-Steinberg et al. (2004)
wanted to compare the high level of LEH in Neandertals found in these studies with a
modern foraging group, the Point Hope skeletal sample, to determine any similarities.
Both populations showed approximately the same percentage of systemic LEH
(Neandertals, 38% and the Inuit, 33%) (Guatelli-Steinberg et al. 2004). Based on LEH
incidence, Neandertals were not more physiologically stressed than the Point Hope
skeletal sample (Guatelli-Steinberg et al. 2004).
Lastly, Sireen El-Zaatari (2005), has completed an occlusal molar microwear
study of the two prehistoric Point Hope communities. In her research, El-Zaatari (2005)
examined a "Phase II" facet ( crushing/grinding) and found that the Tigara molar samples
had more dental microwear features than the lpiutak (2005). Specifically, the Tigara
samples had a higher pitting incidence than that of their Ipiutak counterparts (2005). El
Zaatari attributes this to more sand in the Tigara diet due to possible differences in food
preparation. She also states that this difference in molar microwear signatures helps to
21
confirm Larsen and Rainey's archaeological interpretation that the Ipiutak and Tigara
communities relied on different dietary practices (2005).
Approaches to Dental Microwear Analysis
There are generally six reasons for the analysis of dental microwear: to determine
jaw movement patterns, tooth wear agents, rates of tooth wear, diet and wear correlations,
reconstruction of diet using archaeological specimens, and as evidence for handedness or
tool use in food processing (Walker and Teaford 1989). Dental microwear analysis using
the scanning electron microscope (SEM) began in the 1960s due to the instrument's
better resolving power and depth of field (Walker and Teaford 1989). Since this time,
many researchers have utilized different techniques, including the use of scanning
confocal and low-magnification stereoscopy (Scott et al. 2005; see Hillson (1996) for
review).
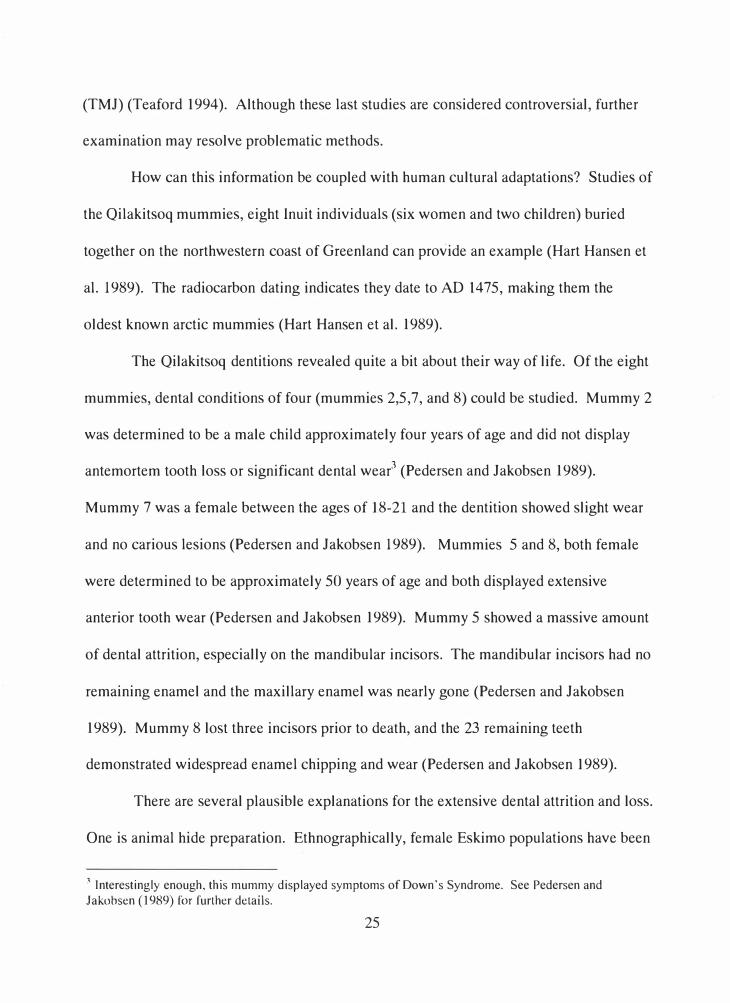
One of the most important aspects of dental microwear analysis is the
methodology. As outlined by Teaford (1994), past research has involved microscopic
analysis of high-quality casts of teeth, created through the use of impression materials
that either produce a thin varnish peel or a premixed base and catalyst that is applied
directly to the teeth. The mold is considered a negative of the original specimen. If a
positive replica of the original teeth is preferred, then a high-resolution cast is made.
Once the peel, cast, or specimen itself is acquired, the use of SEM is employed to locate
and measure the defects found, including pits, scratches, and polishes (Teaford 1994).
22
Some researchers, however, have noted difficulties with this procedure. For
example, microwear measurements can be erroneous in relation to working distance,
contrast differences, and the angle of the specimen (Teaford 1994). In addition,
microwear analysis can be time consuming, with each specimen taking hours to complete
(Teaford 1994). Additionally, innovative techniques involving the use of confocal
microscopes to produce surface topography diagrams of enamel surfaces have nearly
replaced the use of SEM. In fact, some dental anthropologists now consider SEM
microwear studies to be obsolete (Dr. Peter Ungar, personal communication).
Initial studies of diet-related dental microwear examined nonhuman primates.
These studies indicated that the terrestrial monkey dentition had more striations than the
arboreal monkeys (Ungar 2002). It appears that the type of diet (siliceous material in the
food), feeding surface, and mechanical load of food breakdown all play a role in
microwear formation (ibid). Various studies throughout the last 20 years included
comparative microwear studies using extant primates with known diet and microwear
analysis involving closely related monkeys (Teaford 1988). Other studies included
associations between extant primate diet and microwear in order to deduce diet in extinct
primates and incisor microwear in relation to diet (El-Zaatari et al. 2005; Rafferty et al.
2002; Teaford and Walker 1984 for primate studies and Ungar 1990, 1994, 1996; Ungar
and Grine 1991; Ungar and Spencer 1999 for incisor studies). Additional studies have
provided insights into hominid diet through dental microwear analysis (Gordon 1984;
Lalueza et al. 1996; Ryan and Johanson 1988; Ungar and Spencer 1999).
23
-

In addition, microwear defects undergo a turnover rate; that is, while old defects
heal, new ones are produced. Some researchers have suggested that seasonal diets can be
detected in accordance with this phenomenon (Walker et al. 1978). Others note that
seasonal changes can only be seen in specific environments (Walker and Teaford 1989).
Regardless, this turnover rate still only leads to the observation of microwear formations
of the past few months (Walker and Teaford 1989). In order to balance for this trend, a
large study sample must be utilized in order to record the variability within the species
(Walker and Teaford 1989).
Approaches to Cultural Impact on Dentition
Biology often leaves its marks on an individual's skeleton and dentition, but
culture is a noteworthy variable in this equation as well. The effect of culture upon
biology is an essential facet for any researcher, particularly in relation to dentition.
Teaford (1994) describes the use of teeth in behaviors other than food processing as
parafunctions, and explains three of them in regards to non-human primates. The first
parafunction is grooming. Those primates that use their anterior teeth (incisors and
canines) for grooming will present medially-situated microwear striations in SEM studies
(Teaford 1994). The second parafunction is chewing or gnawing on items other than
food. One study suggests that the chimpanzee production of termite probes creates
specifically oriented microwear scratches on their incisors (Teaford 1994). The last
parafunction is tooth-grinding. Research has been presented in which tooth-grinding was
identified with heavy microwear scratching, pits, and temporomandibular joint syndrome
24
(TMJ) (Teaford 1994). Although these last studies are considered controversial, further
examination may resolve problematic methods.
How can this information be coupled with human cultural adaptations? Studies of
the Qilakitsoq mummies, eight Inuit individuals (six women and two children) buried
together on the northwestern coast of Greenland can provide an example (Hart Hansen et
al. 1989). The radiocarbon dating indicates they date to AD 1475, making them the
oldest known arctic mummies (Hart Hansen et al. 1989).
The Qilakitsoq dentitions revealed quite a bit about their way of life. Of the eight
mummies, dental conditions of four (mummies 2,5,7, and 8) could be studied. Mummy 2
was determined to be a male child approximately four years of age and did not display
antemortem tooth loss or significant dental wear3 (Pedersen and Jakobsen 1989).
Mummy 7 was a female between the ages of 18-21 and the dentition showed slight wear
and no carious lesions (Pedersen and Jakobsen 1989). Mummies 5 and 8, both female
were determined to be approximately 50 years of age and both displayed extensive
anterior tooth wear (Pedersen and Jakobsen 1989). Mummy 5 showed a massive amount
of dental attrition, especially on the mandibular incisors. The mandibular incisors had no
remaining enamel and the maxillary enamel was nearly gone (Pedersen and Jakobsen
1989). Mummy 8 lost three incisors prior to death, and the 23 remaining teeth
demonstrated widespread enamel chipping and wear (Pedersen and Jakobsen 1989).
There are several plausible explanations for the extensive dental attrition and loss.
One is animal hide preparation. Ethnographically, female Eskimo populations have been
' Interestingly enough, this mummy displayed symptoms of Down's Syndrome. See Pedersen and Jakobsen (1989) for further details.
25
recorded using their teeth as a third hand when preparing and scraping animal hides
(Ammitzb0ll et al. l 99la,b; Foote 1992; Geffen 1930). Women clamped down on the
skin (usually seal or caribou skin ) with their anterior teeth in order to scrape the fat off
the skin using their traditional knives, known as ulus. Additionally, female Eskimos have
been documented scraping skins by using their lower incisors and chewing the edges to
prepare it for sewing (Ammitzb0ll et al. 1991 b; Foote 1992; Giffen 1930). These
practices would appear as "numerous fine, parallel scratches" in dental microwear
analysis of occlusal surfaces (Pedersen and Jakobsen 1989:123).
Another possible explanation for the dental damage, also related to sewing,
involves the preparation of sinew threads. The practice begins with the slicing of thick
sinew material with the ulu. Females would roll these slices across the cheek, then rub
the sinew back and forth between the incisors in order to make it soft and moist
(Ammitzb0ll et al. l 99la,b; Foote 1992; Giffen 1930; Pedersen and Jakobsen 1989).
This practice eventually created sinew grooves across the incisors; however, many
women lost their incisors antemortem, most likely from hide preparation, forcing them to
use their canines and premolars (Pedersen and Jakobsen 1989).
Although I have described here several examples of female paramasticatory
behaviors, men also were documented performing similar activities. Among these
behaviors include towing seals, untangling traces and softening lines (Giffen 1930). One
reference even referred to an Alaskan Eskimo man opening an oil drum with his teeth
(Chance 1990).
26

To summarize, arctic archaeology presents its own set of challenges, from harsh
weather conditions to artifact preservation; however, the inferences that can be made
from its research provide integral information concerning the survival practices utilized
by prehistoric arctic foragers. Specifically, the archaeological excavations at Point Hope,
Alaska, provided anthropologists with further data regarding subsistence strategies, but
also raised many more questions.
Another central question concerns the Ipiutak and Tigara dietary practices and
subsistence strategies. While the archaeological data are interpreted in one way, the
human skeletal remains can allow independent testing of hypotheses derived from
archaeological analysis. Therefore, if Larsen and Rainey's 1948 archaeological
interpretations were correct, one would expect to find incisal dental microwear signatures
within each group congruent with either land-based or coastal-based diet and
paramasticatory behaviors.
Thus, realizing the effect of cultural systems upon oral biology will be a crucial
component in this project. Understanding the technical aspects of microwear analysis is
only half the battle. As the preceding discussion makes clear, cultural practices must be
understood in order to obtain accurate and functional scientific data.
27
CHAPTER III
METHODOLOGY
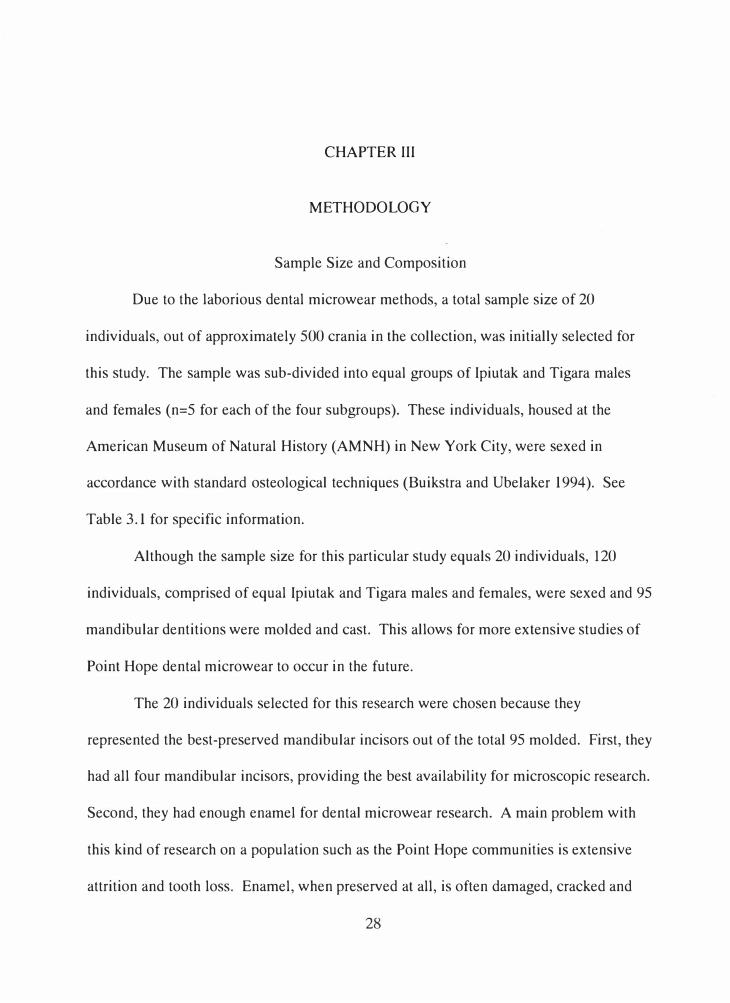
Sample Size and Composition
Due to the laborious dental microwear methods, a total sample size of 20
individuals, out of approximately 500 crania in the collection, was initially selected for
this study. The sample was sub-divided into equal groups of Ipiutak and Tigara males
and females (n=5 for each of the four subgroups). These individuals, housed at the
American Museum of Natural History (AMNH) in New York City, were sexed in
accordance with standard osteological techniques (Buikstra and Ubelaker 1994). See
Table 3.1 for specific information.
Although the sample size for this particular study equals 20 individuals, 120
individuals, comprised of equal Ipiutak and Tigara males and females, were sexed and 95
mandibular dentitions were molded and cast. This allows for more extensive studies of
Point Hope dental microwear to occur in the future.
The 20 individuals selected for this research were chosen because they
represented the best-preserved mandibular incisors out of the total 95 molded. First, they
had all four mandibular incisors, providing the best availability for microscopic research.
Second, they had enough enamel for dental microwear research. A main problem with
this kind of research on a population such as the Point Hope communities is extensive
attrition and tooth loss. Enamel, when preserved at all, is often damaged, cracked and
28

only present along the edge of the tooth. Consequently, although 95 casts were produced,
many of them will not provide adequate dental microwear data due to the aforementioned
problems.
While performing my dental microwear counts, I discovered one specimen with
an extraordinarily high incidence of feature counts. Consequently, this specimen, Ipiutak
99.1/196, a male, was removed from final analysis. Each sample group still had 5
individuals with the exception of the Ipiutak males, which had 4 individuals.
AMNH Ipiutak 99.1/75-A Male
AMNH Ipiutak 99.1/80 Male
AMNH Ipiutak 99.1/83-A Femtle
AMNH Ipiutak 99.1/88 Femtle
AMNH Ipiutak 99.1/89-B Male
AMNH lpiutak 99.1/92 Femtle
AMNH lpiutak 99.1/95 Femtle
AMNH lpiutak 99.1/105 Male
AMNH Ipiutak 99.1/181 Femtle
AMNH � 99.1,£196 Male
AMNH Tigara 99.1/234 Femtle
AMNH Tigara 99.1/237 Male
AMNH Tigara 99.1/268 Femtle
AMNH Tigara 99.1/283 Male
AMNH Tigara 99.1/300 Femtle
AMNH Tigara 99.1/304 Femtle
AMNH Tigara 99.1/319 Male
AMNH Tigara 99.1/330-A Male
AMNH Tigara 99.1/441 Male
AMNH Tigara 99.1/464 Femtle
Table 3.1 Ipiutak and Tigara specimens used.
29
Molding and Casting
I molded the dentition at the AMNH during May of 2005. I cleaned the
mandibular incisors, both central and lateral, with an undiluted solution of acetone and a
soft toothbrush prior to molding. When present, canines and premolars were also cleaned
and molded. The molding material used was President's Jet Plus, regular body (Coltene
Whaledent, Hudson, MA) a standard, silicone-based vinyl polysiloxane. The
approximate set time for the President's Jet Plus is five minutes. After the polysiloxane
was applied to the cleaned mandibular dentition, I waited three minutes before pressing a
cake spatula onto the occlusal surfaces. This allowed air bubbles to be eliminated from
the mold and also assisted in capturing as much dental microwear as possible. After
approximately ten minutes, I gently removed the molds from the teeth, placed each mold
in a labeled paper bag, and removed any remaining President's Jet Plus from the
mandible. This procedure produced 95 molds comprised of 19 Ipiutak females, 16
Ipiutak males, 30 Tigara females and 30 Tigara males.
High-resolution epoxy resin casts were made during the summer and fall of 2005.
These casts were made from an industrial marine, automotive and aircraft epoxy resin
(Eastpointe Fiberglass Sales, Inc, Eastpointe, Ml). A 4: 1 mixture of F-82 Super Epoxy
resin and TP-41 epoxy hardener was produced for approximately five casts at a time. In
addition, white epoxy pigment (#ED-1018, Plasticolors, Ashtabula, OH) was added to
30
this mixture (2% based on volume) in order to maximize reflectance under an
interference and light microscope.
Once the epoxy mixture was produced, it was poured into each dental mold. Each
mold was then centrifuged. Medical centrifuges typically operate at too high a speed,
causing the epoxy mixture to spill out from the dental mold entirely. Therefore, a heavy
duty line metering machine (Berkley and Company, Spirit Lake, IA), used to measure the
amount of fishing line you put on a reel, was modified for use. This machine, commonly
found in sporting goods stores, was ideal for this project as it allowed me to control the
spinning speed. A few molds with the epoxy mixture were placed in a small plastic
container and secured where the spool of the fishing reel would be placed before it was
threaded. The molds were then spun for approximately one minute to remove air
bubbles. After the 95 casts were produced, 20 were selected for microscopic
examination.
Microscopy Techniques
Although scanning electron microscopes (SEM) are most often used in this type
of study, researchers are turning to other microscopes, including surface topography
microscopes, for refined microwear data. This study utilized a SMZ-U stereomicroscope
from Nikon (Tokyo, Japan). The benefit of a light microscope is its freedom from strict
measurements (Semprebon et al. 2004). Instead, dental microwear features are identified
31
through their light refractiveness and are more quickly documented (Semprebon et al.
2004).
Once the 20 casts were selected, they were evaluated under the light microscope
using a fiber optic light source. It was determined that gold sputtering the white casts
would aid in the appearance of dental microwear features. Consequently, these casts
were sputtered with approximately 200 A of gold using an SEM autocoating unit
(Polaron Equipment, Ltd.). I recommend gold sputtering any casts prior to any future
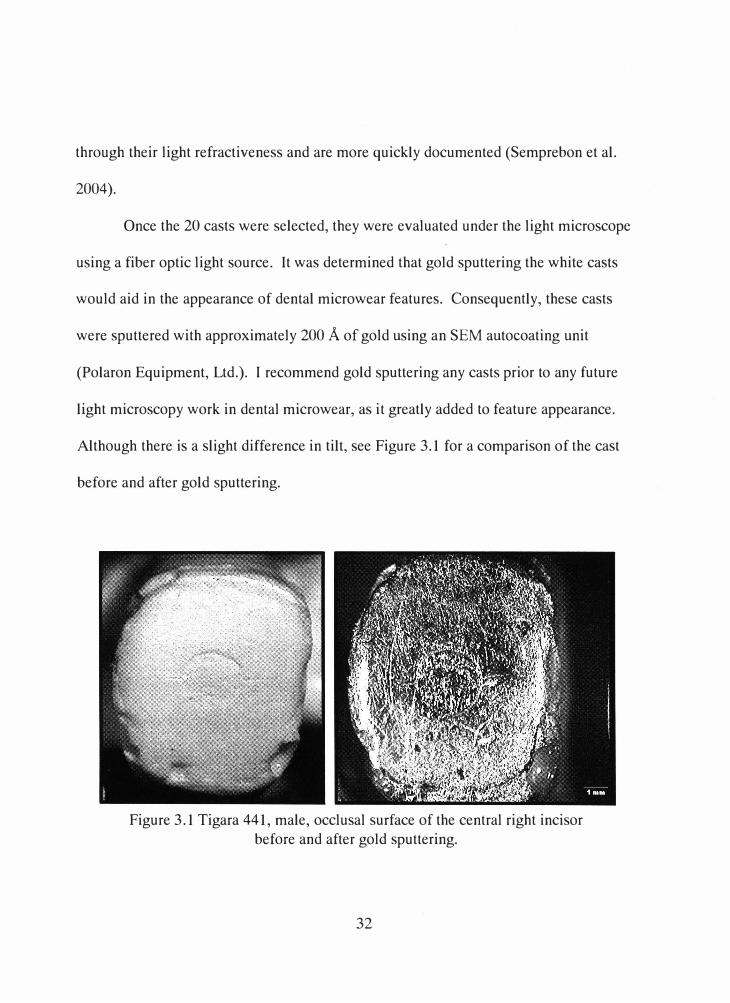
light microscopy work in dental microwear, as it greatly added to feature appearance.
Although there is a slight difference in tilt, see Figure 3.1 for a comparison of the cast
before and after gold sputtering.
Figure 3.1 Tigara 441, male, occlusal surface of the central right incisor before and after gold sputtering.
32
A TIFF-formatted, digitized photograph was taken of each specimen using the
MetaMorph computer software (Molecular Devices Corp, Downingtown, PA).
Measurements and analysis of feature lengths and widths were collected also by using the
MetaMorph image analysis software.
Dental Microwear Descriptions and Scoring
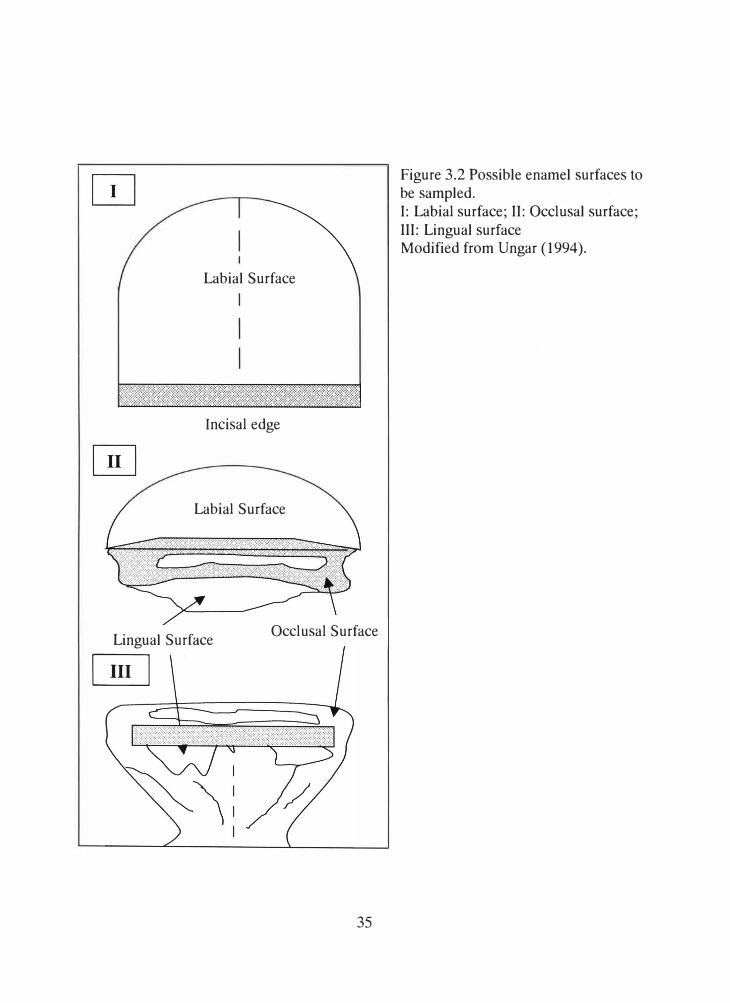
Due to the extensive occlusal wear, the labial, incisal and lingual aspects of the
central mandibular incisors were considered for this study (Ungar 1994; See Figure 3.2).
This ensured that the most pristine enamel surfaces be utilized (Dr. Peter Ungar, personal
communication). Additionally, it is imperative to describe the characteristics of each
microwear feature, as to facilitate reproducible and comparable results. Table 3.2
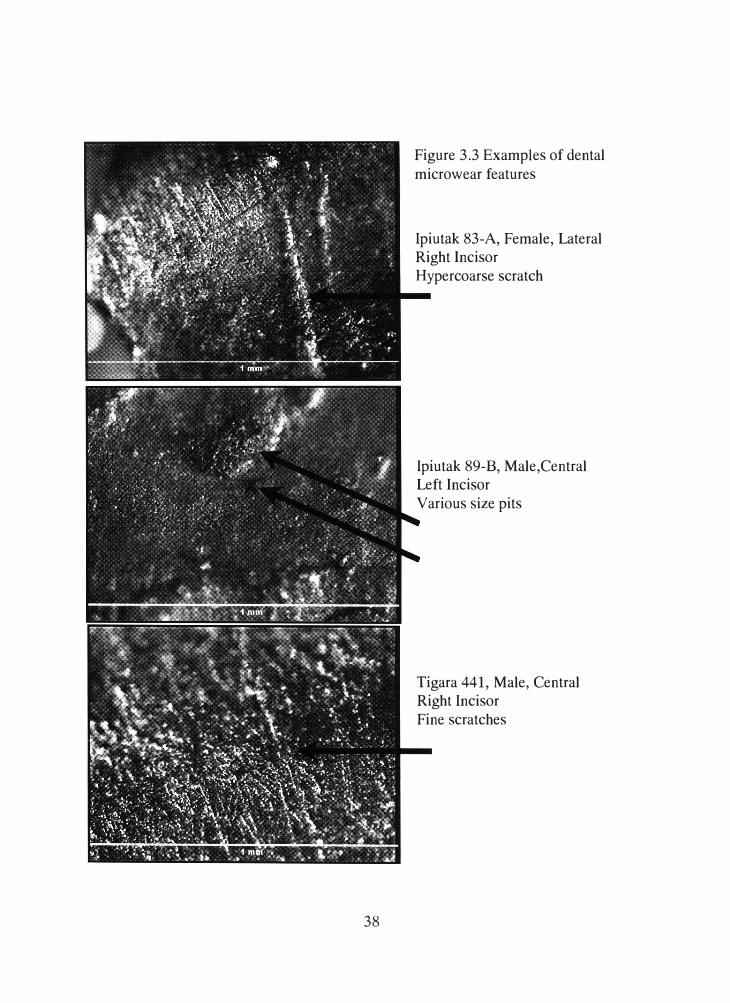
provides a description of each feature considered in this study while Figure 3.3 provides
pictures.
The dental microwear scoring proceeded as follows: the TIFF image was
changed to a BMP format to allow it to be downloaded into a semi-automated image
analysis software program called Microware 4.02 (Dr. Peter Ungar, Fayetteville, AR).
The software allows for a grid to be placed on top of the image. Each microwear feature
was counted in each box of the grid, producing a total number of microwear features per
digital image.
33
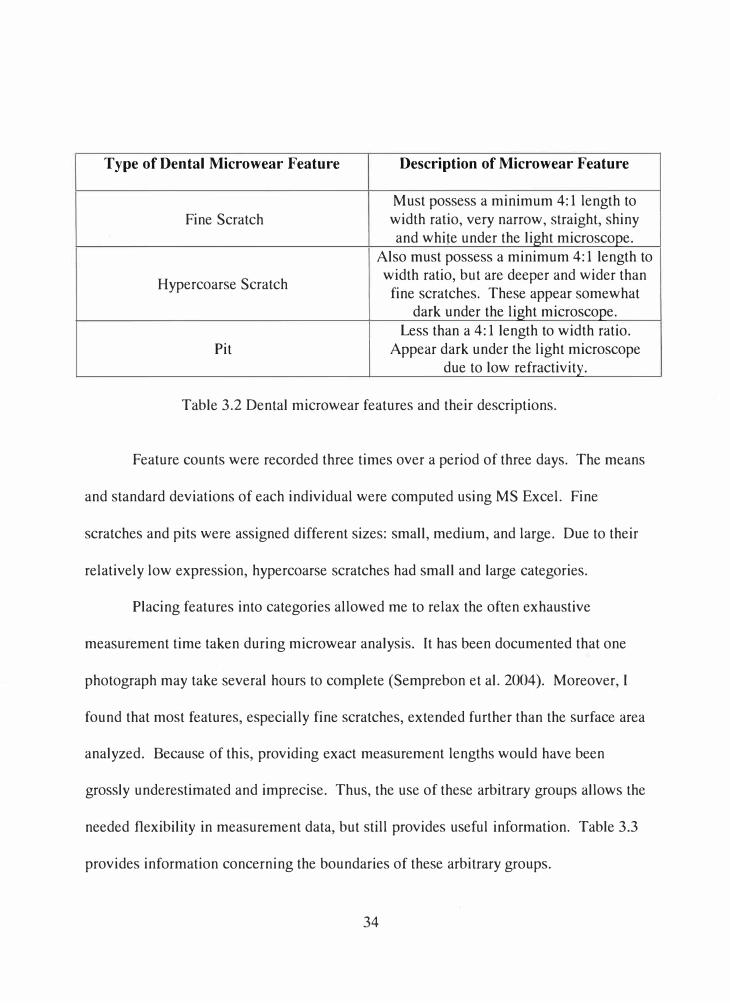
Type of Dental Microwear Feature Description of Microwear Feature
Must possess a minimum 4:1 length to Fine Scratch width ratio, very narrow, straight, shiny
and white under the light microscope. Also must possess a minimum 4: 1 length to
Hypercoarse Scratch width ratio, but are deeper and wider than fine scratches. These appear somewhat
dark under the light microscope. Less than a 4:1 length to width ratio.
Pit Appear dark under the light microscope due to low refractivity.
Table 3.2 Dental microwear features and their descriptions.
Feature counts were recorded three times over a period of three days. The means
and standard deviations of each individual were computed using MS Excel. Fine
scratches and pits were assigned different sizes: small, medium, and large. Due to their
relatively low expression, hypercoarse scratches had small and large categories.
Placing features into categories allowed me to relax the often exhaustive
measurement time taken during microwear analysis. It has been documented that one
photograph may take several hours to complete (Semprebon et al. 2004). Moreover, I
found that most features, especially fine scratches, extended further than the surface area
analyzed. Because of this, providing exact measurement lengths would have been
grossly underestimated and imprecise. Thus, the use of these arbitrary groups allows the
needed flexibility in measurement data, but still provides useful information. Table 3.3
provides information concerning the boundaries of these arbitrary groups.
34
Labial Surface
lncisal edge
Labial Surface
Lingual Surface Occlusal Surface
�
35
Figure 3.2 Possible enamel surfaces to be sampled. I: Labial surface; II: Occlusal surface; III: Lingual surface Modified from Ungar (1994).
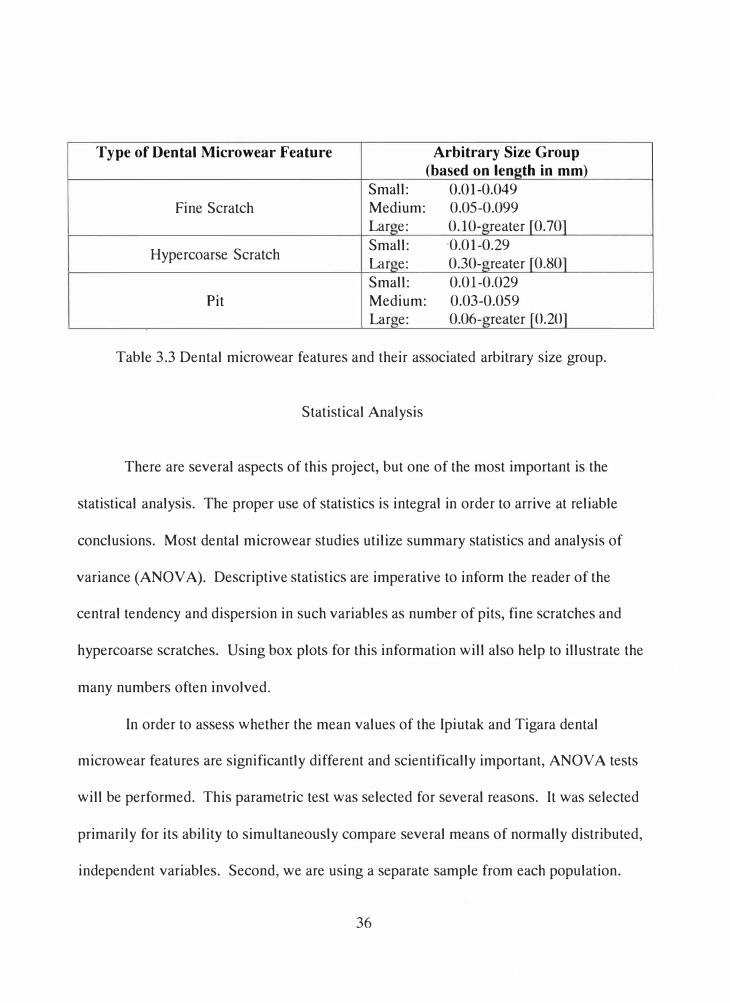
Type of Dental Microwear Feature Arbitrary Size Group
(based on len th in mm)
Small: 0.01-0.049
Fine Scratch Medium: 0.05-0.099 Lar e: 0.10- reater 0.70
Hypercoarse Scratch Small: 0.01-0.29
Lar e: 0.30- reater 0.80
Small: 0.01-0.029
Pit Medium: 0.03-0.059 Lar e: 0.06- reater 0.20
Table 3.3 Dental microwear features and their associated arbitrary size group.
Statistical Analysis
There are several aspects of this project, but one of the most important is the
statistical analysis. The proper use of statistics is integral in order to arrive at reliable
conclusions. Most dental microwear studies utilize summary statistics and analysis of
variance (ANOV A). Descriptive statistics are imperative to inform the reader of the
central tendency and dispersion in such variables as number of pits, fine scratches and
hypercoarse scratches. Using box plots for this information will also help to illustrate the
many numbers often involved.
In order to assess whether the mean values of the Ipiutak and Tigara dental
microwear features are significantly different and scientifically important, ANOV A tests
will be performed. This parametric test was selected for several reasons. It was selected
primarily for its ability to simultaneously compare several means of normally distributed,
independent variables. Second, we are using a separate sample from each population.
36
g
g g r l
g g r l
g g r l
Using ANOV A allow me to assess whether any group was exposed to different
treatments (in this case, different diets and paramasticatory behaviors). Third, they
provide more robust conclusions in the chance of a skewed distribution. Lastly, using
ANOV A greatly reduced the possibility of a Type I error, a phenomenon that can occur
with multiple two-tailed t tests (Dr. Charles Hilton, personal communication).
The descriptive statistics were calculated using the data analysis feature of Excel.
Each individual's mean for a particular microwear defect (i.e. small pits for individual
99.1/75-A) was combined with other individuals' means for the same particular defect in
order to calculate a group mean. This group mean could be any of the following groups:
Ipiutak (n = 9), Tigara (n = 10), Females (n = 10), Males (n = 9), Ipiutak females (n = 5),
Ipiutak males (n = 4), Tigara females (n = 5) and Tigara males (n = 5). Therefore, only
an indivudal 's mean was used to calculate any of the group means.
The Cv, coefficient of variation, was calculated in order to give a relative measure
of data dispersion compared to the mean. When the Cv is large/small compared to the
mean, the amount of variation is large/small. The equation for the coefficient of
variation the standard deviation divided by the mean, multiplied by 100. Small sample
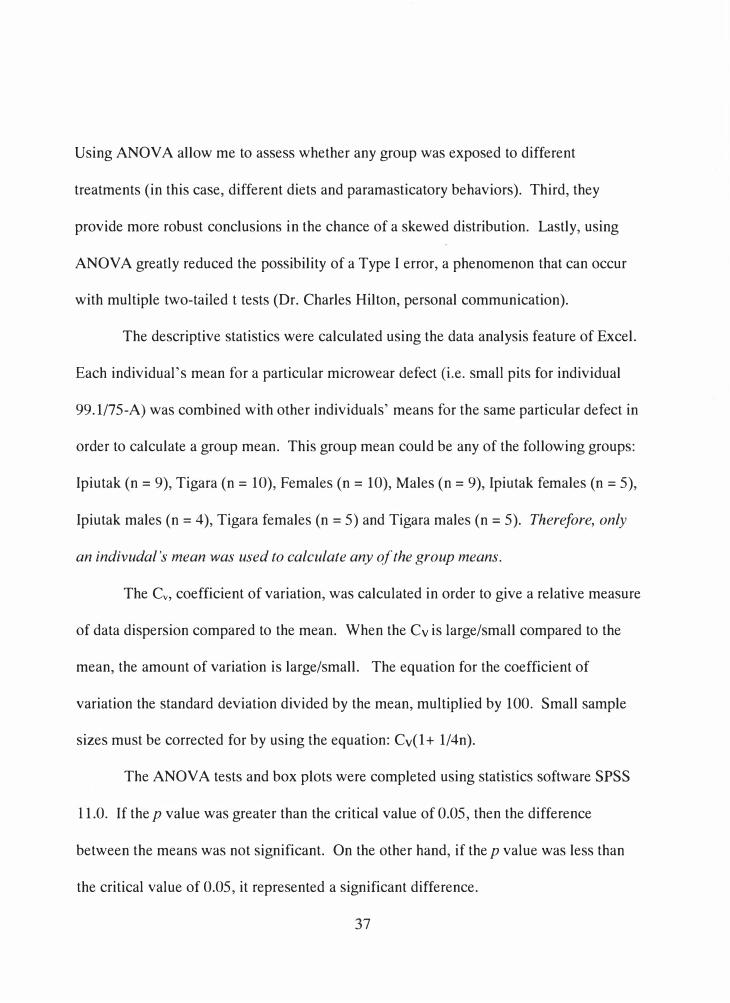
sizes must be corrected for by using the equation: Cv(l + 1/4n).
The ANOV A tests and box plots were completed using statistics software SPSS
11.0. If the p value was greater than the critical value of 0.05, then the difference
between the means was not significant. On the other hand, if the p value was less than
the critical value of 0.05, it represented a significant difference.
37
38
Figure 3.3 Examples of dental
microwear features
Ipiutak 83-A, Female, Lateral Right Incisor
H ypercoarse scratch
Ipiutak 89-B, Male,Central Left Incisor
Various size pits
Tigara 441, Male, Central Right Incisor
Fine scratches
Hypotheses
Mandibular incisor microwear data collected from the Ipiutak and Tigara skeletal
remains from Point Hope, Alaska, will be used to test the-following hypotheses:
HO: There are no differences between the Ipiutak dental microwear and the
Tigara dental microwear.
Hl: There are differences between the Ipiutak dental microwear and the
Tigara dental microwear.
Both coastal groups relied on land and sea mammals. Caribou, most likely obtained from
the primary breeding grounds northeast of Point Hope, was necessary for adequate
clothing, whether obtained directly through hunting or indirectly through trade (Gerlach
1989). The Ipiutak population utilized both land mammals (caribou) and sea mammals,
(seals and walruses), but it is hypothesized the Tigara population relied more on sea
mammals including whales (Larsen and Rainey 1948, Rainey 1971). Therefore, a
decrease in dental microwear is predicted from the Ipiutak to Tigara populations due to
the decrease in caribou reliance and an increase in sea mammal (whale) reliance.
HO: There are no dental microwear differences between the Point Hope
males and females.
Hl: There are dental microwear differences between the Point Hope males
and females.
According to several historical sources, Eskimo women used their teeth for dressing and
softening skins, preparing sinew threads, and extracting blubber (Ammitzb0ll et al.
1991b; Foote 1992, Giffen 1930, Pedersen and Jakobsen 1989). Eskimo men are
recorded using their teeth for working with hard materials, crushing bird heads, holding
39
the rope to which a hunted animal is attached, and even opening up an oil drum (Giffen
1930; Chance 1990). Due to distinctions in historical paramasticatory behaviors, it is
predicted that the prehistoric Point Hope females will have different types of dental
microwear than the prehistoric Point Hope men.
HO: There are no dental microwear differences between the Ipiutak and Tigara females. Hl: There are dental microwear differences between the lpiutak and Tigara females.
HO: There are no dental microwear differences between the lpiutak and Tigara males. Hl: There are dental microwear differences between the Ipiutak and Tigara males.
These final two hypotheses are challenging, as both groups are prehistoric. In
spite of this dilemma, it is predicted the Ipiutak females used their teeth and mouth more
often than the Tigara females. Additionally, it is predicted the Ipiutak males used their
teeth and mouth more often than the Tigara males. I make these predictions only
assuming that paramasticatory behaviors would decrease through time as technology and
contact with other groups increased.
40

CHAPTER IV
RESULTS
Feature Count Data
It is evident that the Point Hope residents relied on paramasticatory functions in
their daily life, although there are some distinct differences, which may have resulted
from diet. Tables 4.1-4.4 provide mean anterior dental microwear (ADM) data with the
standard deviations, while Figure 4.1 displays the data in a bar chart. Figures 4.2 -
When the number of pits, fine scratches and hypercoarse scratches for both the
Ipiutak and Tigara groups are summed, the Ipiutak have a greater number. Second, males
as a group had more ADM than females. Ipiutak females had slightly more ADM than
the Tigara females while the Ipiutak males had considerably more ADM than Tigara
males. See below for more specific data.
Group Sample
Pits Cv Fine
Cv Hypercoarse
Cv Sizes Scratches Scratches
lpiutak n=5 65.6 ± 35.0 56.0 29.0 ± I 1.8 42.7 2.6 ± 2.2 88.8
Females
lpiutak Males n=4 96.9 ± 43.5 47.7 24.1 ± 6.4 28.2 1.8± 2.2 133.6
Tigara n=5 48.4 ± 21.9 47.5 35.4 ± 19.0 55.4 0.4 ± 0.55 144.4
Females
Tigara Males n=5 68.4 ± 28.8 44.2 46.8 ± 19.3 43.3 0.8 ± 1.3 170.6
Table 4.1 Mean group dental microwear feature counts with standard deviation. See Chapter 3 for an in-depth description of how these figures were calculated. There were no statistically significant differences.
41
I ! i
I
� N
100.0
00.0
00.0
-
m.oj
0
� �.O � j -
� w� �
� �
�-0
0
M.0 u
�
W.0
10�
0.0
lpiutak
Females•
Pits
Summary Chart of Mean Dental Microwear by Size and Point Hope Sample Group
lpiutak Tigara Tigara lpiutak lpiutak Tigara Tigara lpiutak lpiutak Tigara
Males- Females- Males- Females Males- Females Males- Females• Males- Females
Pits Pits Pits Fine Fine Fine Fine HCS HCS HCS
Scratches Scratches Scratches Scratches
Point Hope Group and Microwear Defect
Tigara
Males•
HCS
□ Large ! ■ Mediuml■ small I
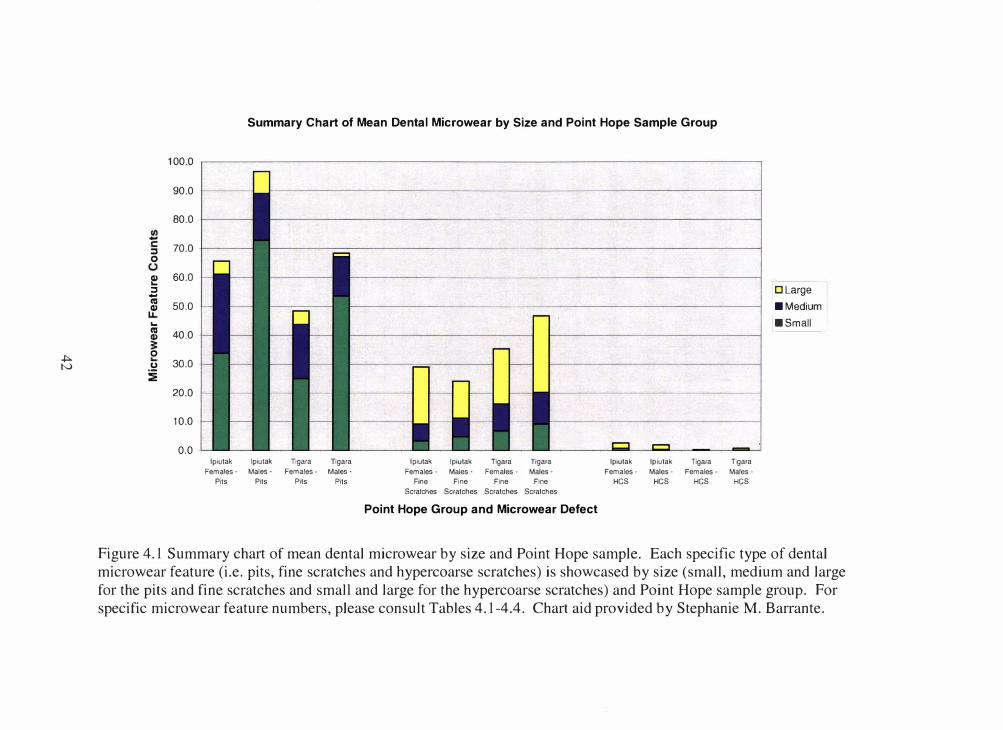
Figure 4.1 Summary chart of mean dental microwear by size and Point Hope sample. Each specific type of dental
microwear feature (i.e. pits, fine scratches and hypercoarse scratches) is showcased by size (small, medium and large
for the pits and fine scratches and small and large for the hypercoarse scratches) and Point Hope sample group. For
specific microwear feature numbers, please consult Tables 4.1-4.4. Chart aid provided by Stephanie M. Barrante.
Ill C
0
LI.
...
•
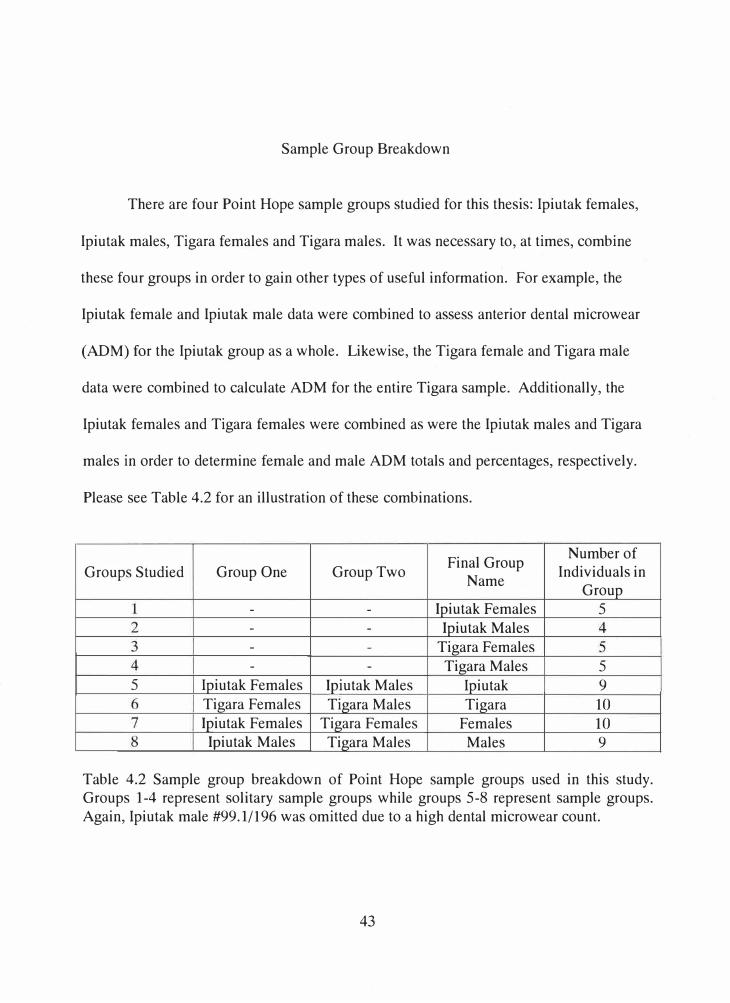
Sample Group Breakdown
There are four Point Hope sample groups studied for this thesis: Ipiutak females,
Ipiutak males, Tigara females and Tigara males. It was necessary to, at times, combine
these four groups in order to gain other types of useful information. For example, the
Ipiutak female and Ipiutak male data were combined to assess anterior dental microwear
(ADM) for the Ipiutak group as a whole. Likewise, the Tigara female and Tigara male
data were combined to calculate ADM for the entire Tigara sample. Additionally, the
Ipiutak females and Tigara females were combined as were the Ipiutak males and Tigara
males in order to determine female and male ADM totals and percentages, respectively.
Please see Table 4.2 for an illustration of these combinations.
Final Group Number of
Groups Studied Group One Group Two Individuals in Name
Group - - lpiutak Females 5 - - lpiutak Males - - Tigara Females - - Tigara Males 5
5 Ipiutak Females lpiutak Males Ipiutak 9 Tigara Females Tigara Males Tigara 10
lpiutak Females Tigara Females Females 10
lpiutak Males Tigara Males Males 9
Table 4.2 Sample group breakdown of Point Hope sample groups used in this study. Groups 1-4 represent solitary sample groups while groups 5-8 represent sample groups. Again, Ipiutak male #99.1/196 was omitted due to a high dental microwear count.
43
1 2 4 3 5 4
6 7 8
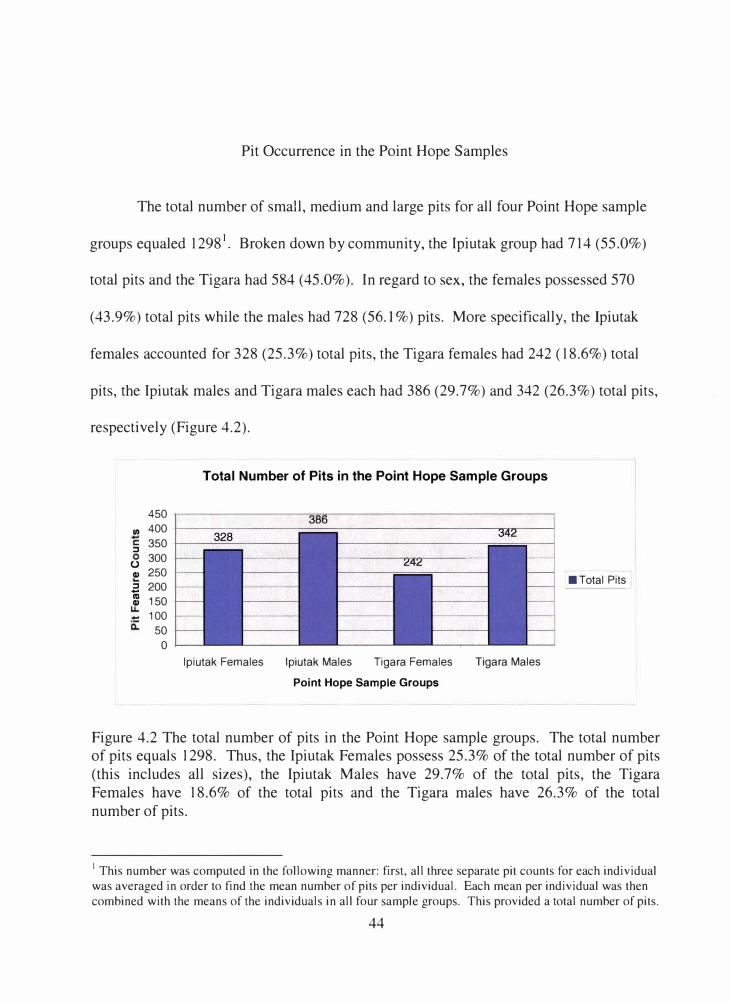
Pit Occurrence in the Point Hope Samples
The total number of small, medium and large pits for all four Point Hope sample
groups equaled 12981• Broken down by community, the Ipiutak group had 714 (55.0%)
total pits and the Tigara had 584 (45.0%). In regard to sex, the females possessed 570
( 43.9%) total pits while the males had 728 (56.1 % ) pits. More specifically, the Ipiutak
females accounted for 328 (25.3%) total pits, the Tigara females had 242 (18.6%) total
pits, the Ipiutak males and Tigara males each had 386 (29.7%) and 342 (26.3%) total pits,
respectively (Figure 4.2).
Total Number of Pits in the Point Hope Sample Groups
450 386
Ill 400
350 ::::,
300 0
Q) 250
::::, 200 1ii
150Q)
L■Total Pits
100
50
0
lpiutak Females lpiutak Males Tigara Females Tigara Males
Point Hope Sample Groups
Figure 4.2 The total number of pits in the Point Hope sample groups. The total number of pits equals 1298. Thus, the Ipiutak Females possess 25.3% of the total number of pits (this includes all sizes), the Ipiutak Males have 29.7% of the total pits, the Tigara Females have 18.6% of the total pits and the Tigara males have 26.3% of the total number of pits.
1 This number was computed in the following manner: first, all three separate pit counts for each individual
was averaged in order to find the mean number of pits per individual. Each mean per individual was then
combined with the means of the individuals in all four sample groups. This provided a total number of pits.
44
i: 0
LI. -ii:
The total number of pits is somewhat similar between all of these sample groups,
with the Ipiutak males having the most. The Ipiutak group has 460, 202 and 52 small,
medium and large pits respectively, while the Tigara group has 393, 162 and 29 small,
medium and large pits respectively. Broken down, this would give the Ipiutak group an
average number of 51.1 small, 22.4 medium and 5.8 large pits per Ipiutak individual. It
would also give the Tigara group an average number of 39.3 small, 16.2 medium and 2.9
large pits per Tigara individual. See Figure 4.3 for an illustration.
The Ipiutak group as a whole had more small, medium and large pits than the
Tigara group as a whole. All ANOV A tests performed between the Ipiutak and Tigara pit
totals showed no significant difference (see Appendix C). That is, the ANOVA test
performed between Ipiutak small pits vs. Tigara small pits, between Ipiutak medium pits
vs. Tigara medium pits and between Ipiutak large pits vs. Tigara large pits showed no
significant differences.
Bisected by sex, the females had 294, 231 and 45 small, medium and large pits
respectively, while the males had 559, 133 and 36 small, medium and large pits
respectively. This would give each individual female an average of 29.4 small, 23.1
medium and 4.5 large pits. It would also give each individual male an average of 62.1
small, 14.8 medium and 4.0 large pits. Please refer to Figure 4.4.
45
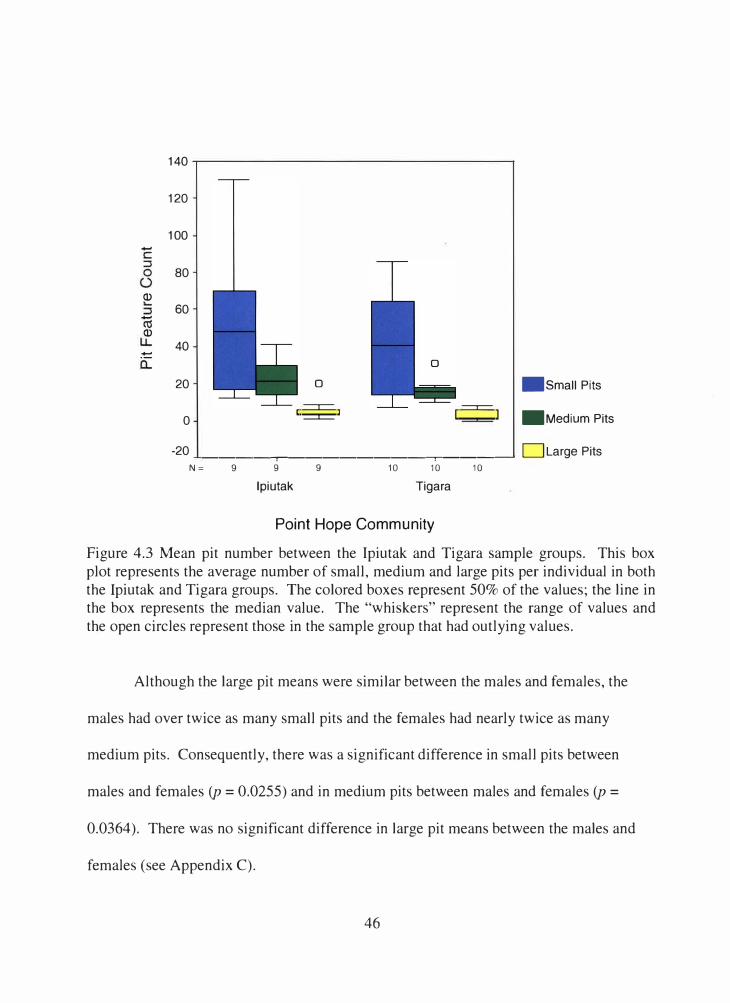
-
Q)
-Q)
.-!:=
140
120
100
80
60
40
20 0 •small Pits
0 ·==·
=
I I -Medium Pits
-20 -------------�---� □ Large PitsN= 9 9
lpiutak 9 10 10
Tigara
Point Hope Community
10
Figure 4.3 Mean pit number between the lpiutak and Tigara sample groups. This box plot represents the average number of small, medium and large pits per individual in both the Ipiutak and Tigara groups. The colored boxes represent 50% of the values; the line in the box represents the median value. The "whiskers" represent the range of values and the open circles represent those in the sample group that had outlying values.
Although the large pit means were similar between the males and females, the
males had over twice as many small pits and the females had nearly twice as many
medium pits. Consequently, there was a significant difference in small pits between
males and females (p = 0.0255) and in medium pits between males and females (p =
0.0364). There was no significant difference in large pit means between the males and
females (see Appendix C).
46
C ::J 0
0 .... ::J (1j
LL
a.
-
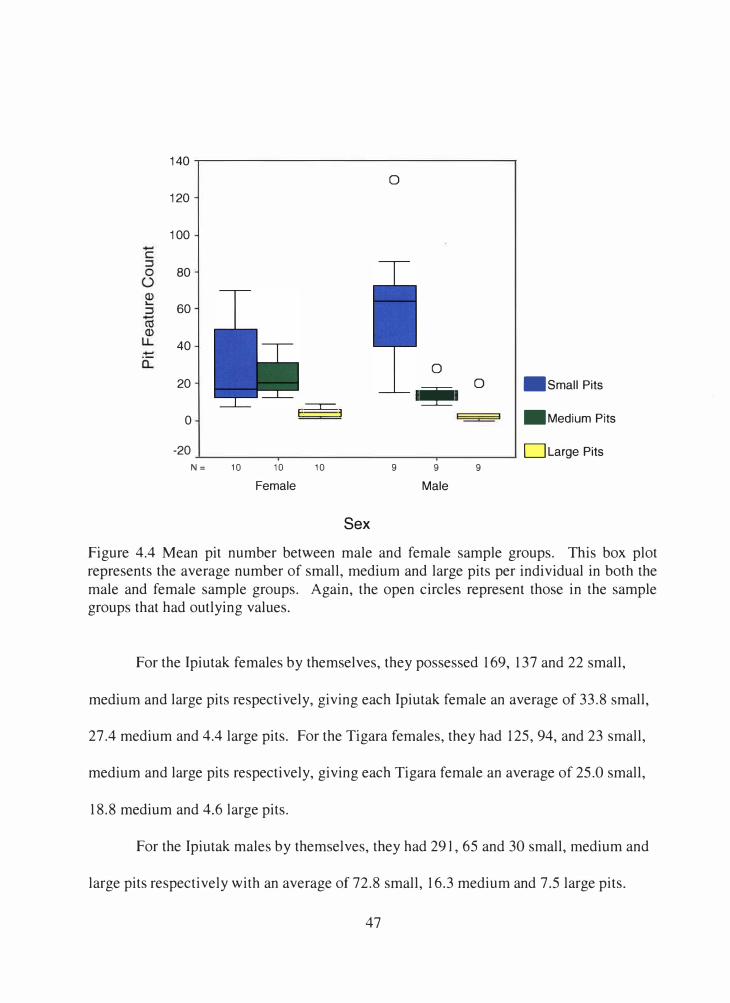
140
120
100
80
60
40
20
0
-20
N= 10 10
Female
::::::r::::: I I
10
0
9
Sex
0
SE 0 •small Pits
-Medium Pits
DLarge Pits 9 9
Male
Figure 4.4 Mean pit number between male and female sample groups. This box plot
represents the average number of small, medium and large pits per individual in both the
male and female sample groups. Again, the open circles represent those in the sample groups that had outlying values.
For the Ipiutak females by themselves, they possessed 169, 137 and 22 small,
medium and large pits respectively, giving each Ipiutak female an average of 33.8 small,
27.4 medium and 4.4 large pits. For the Tigara females, they had 125, 94, and 23 small,
medium and large pits respectively, giving each Tigara female an average of 25.0 small,
18.8 medium and 4.6 large pits.
For the Ipiutak males by themselves, they had 291, 65 and 30 small, medium and
large pits respectively with an average of 72.8 small, 16.3 medium and 7.5 large pits.
47
-C: ::} 0 ()
CD .... ::} -(il CD
LL -i:L
I I
-

The Tigara males contributed 268, 68 and 6 small, medium and large pits respectively,
giving each Tigara male an average of 53.6 small, 13.6 medium and 1.2 large pits (see
Table 4.3). For an illustration of the Ipiutak females, Tigara females, Ipiutak males and
Tigara males, please refer to Figure 4.5.
As shown in Table 4.3, the small and large pit means for the Ipiutak females and
Tigara females are similar and there is a small difference in medium pits. All ANOVA
tests performed among the small, medium and large pits between the Ipiutak females and
Tigara females showed no significant difference between them (see Appendix C).
On the other hand, the Ipiutak males and the Tigara males have similar small and
medium pit means. Although there was a difference in large pits means, all ANOV A
tests performed among all sizes of pits between the two male groups showed no
significant differences (see Appendix C).
Group Small Pits Cv Medium Pits Cv Large Pits Cv
lpiutak Females 33.8 ± 26.4 82.0 27.4 ± 10.3 39.5 4.4 ± 3.1 74.0
lpiutak Males 72.8 ± 40.7 59.4 16.3 ± 8.5 55.4 7.5± 8.4 , 119.0
Tigara Females 25.0 ± 20.7 86.9 18.8 ± 7.3 40.8 4.6 ± 3.0 68.5
Tigara Males 53.6 ± 28.3 55.4 13.6 ± 3.2 24.7 1.2 ± 1.6 140.0
Table 4.3 Mean pit feature counts, broken down by size, with standard deviation. There
was a statistically significant difference in small and medium pit means between the
males (lpiutak males and Tigara males) and females (lpiutak females and Tigara males). Small pit p value = 0.0235, medium pit p value = 0.0364.
48
I I l ] I [ l l
j I 1 '
I I I
' I I I I
i I I I I
'
i
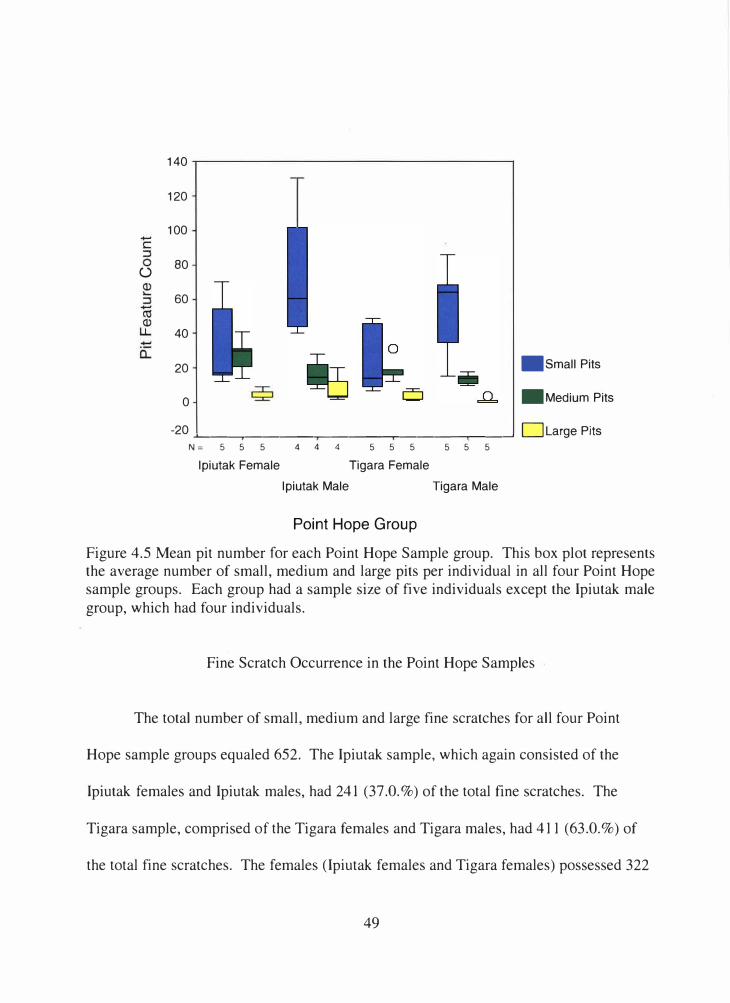
()
140
120
100
80
60
40
20
0
-20
•small Pits
- Medium Pits
-'----�----�---�---��---' 0Large Pits N= 5 5 5 4 4 4 5 5 5 5 5 5
lpiutak Female Tigara Female lpiutak Male Tigara Male
Point Hope Group
Figure 4.5 Mean pit number for each Point Hope Sample group. This box plot represents the average number of small, medium and large pits per individual in all four Point Hope sample groups. Each group had a sample size of five individuals except the Ipiutak male
group, which had four individuals.
Fine Scratch Occurrence in the Point Hope Samples
The total number of small, medium and large fine scratches for all four Point
Hope sample groups equaled 652. The Ipiutak sample, which again consisted of the
Ipiutak females and Ipiutak males, had 241 (37 .0. % ) of the total fine scratches. The
Tigara sample, comprised of the Tigara females and Tigara males, had 411 (63.0. % ) of
the total fine scratches. The females (Ipiutak females and Tigara females) possessed 322
49
-C :::, 0
Q) .... :::, -CCI Q)
LL
-
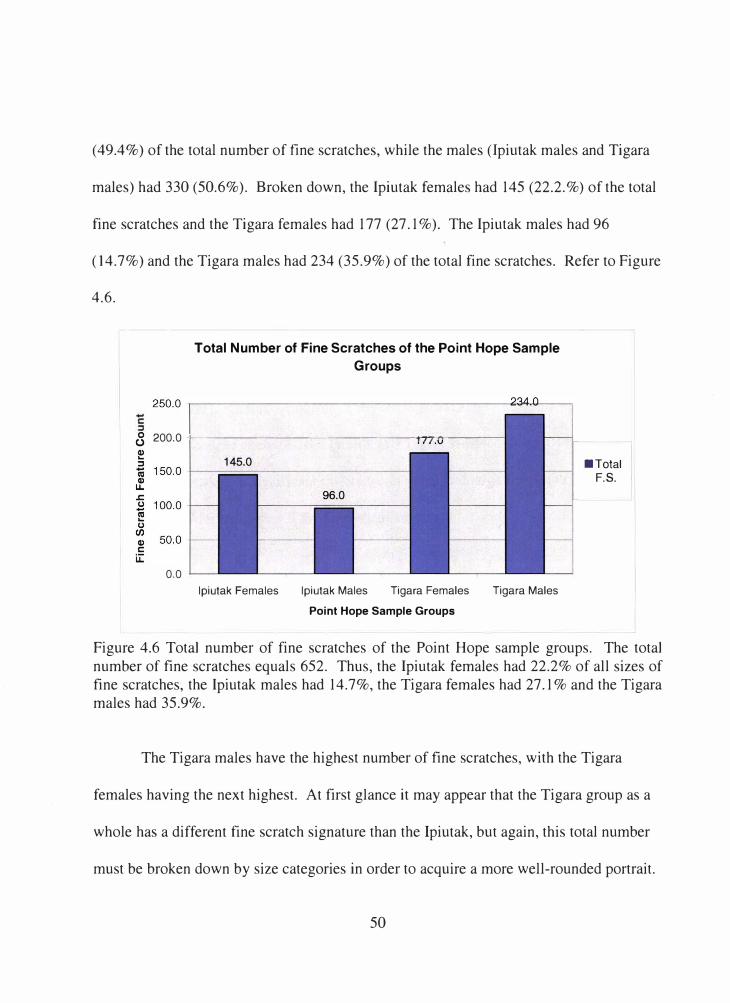
( 49.4%) of the total number of fine scratches, while the males (lpiutak males and Tigara
males) had 330 (50.6% ). Broken down, the Ipiutak females had 145 (22.2. % ) of the total
fine scratches and the Tigara females had 177 (27 .1 % ). The Ipiutak males had 96
(14.7%) and the Tigara males had 234 (35.9%) of the total fine scratches. Refer to Figure
4.6.
Total Number of Fine Scratches of the Point Hope Sample
Groups
8 200.0 1-------------- .......... 7-l"r----
0.0
lpiutak Females lpiutak Males Tigara Females Tigara Males
Point Hope Sample Groups
■TotalF.S.
Figure 4.6 Total number of fine scratches of the Point Hope sample groups. The total
number of fine scratches equals 652. Thus, the Ipiutak females had 22.2% of all sizes of
fine scratches, the Ipiutak males had 14.7%, the Tigara females had 27.1 % and the Tigara
males had 35.9%.
The Tigara males have the highest number of fine scratches, with the Tigara
females having the next highest. At first glance it may appear that the Tigara group as a
whole has a different fine scratch signature than the Ipiutak, but again, this total number
must be broken down by size categories in order to acquire a more well-rounded portrait.
50
250.0 E :,
QI ... :, 1v 150.0 if .i::. u 100.0 1v ... u en QI 50.0 C
u:::
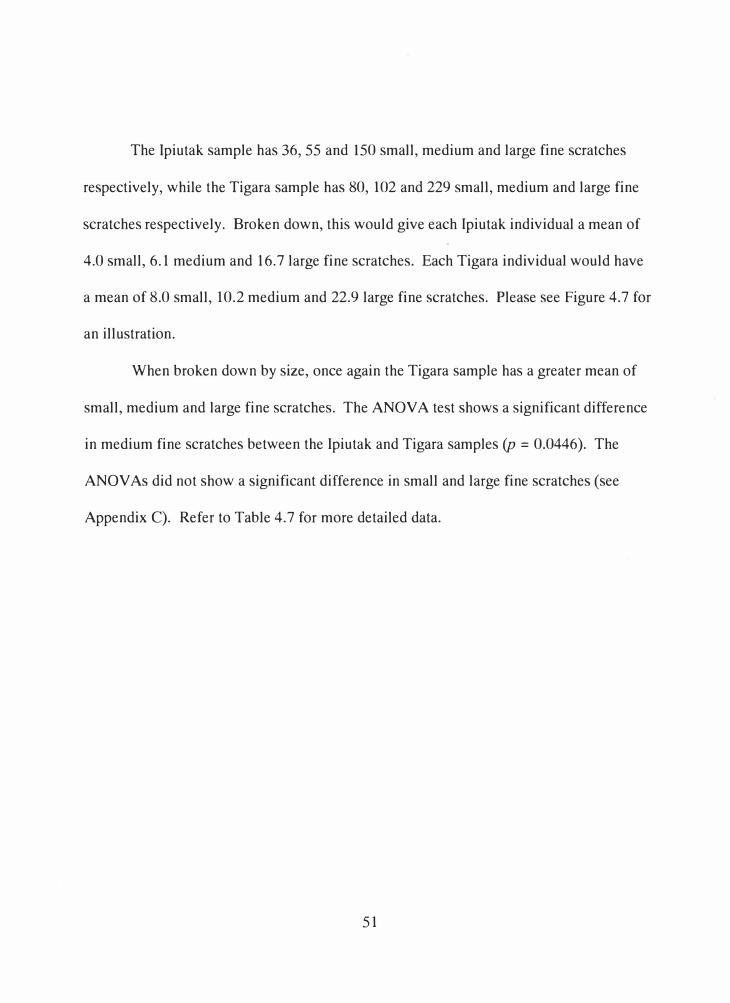
The Ipiutak sample has 36, 55 and 150 small, medium and large fine scratches
respectively, while the Tigara sample has 80, 102 and 229 small, medium and large fine
scratches respectively. Broken down, this would give each lpiutak individual a mean of
4.0 small, 6.1 medium and 16.7 large fine scratches. Each Tigara individual would have
a mean of 8.0 small, 10.2 medium and 22.9 large fine scratches. Please see Figure 4.7 for
an illustration.
When broken down by size, once again the Tigara sample has a greater mean of
small, medium and large fine scratches. The ANOVA test shows a significant difference
in medium fine scratches between the Ipiutak and Tigara samples (p = 0.0446). The
ANOVAs did not show a significant difference in small and large fine scratches (see
Appendix C). Refer to Table 4.7 for more detailed data.
51
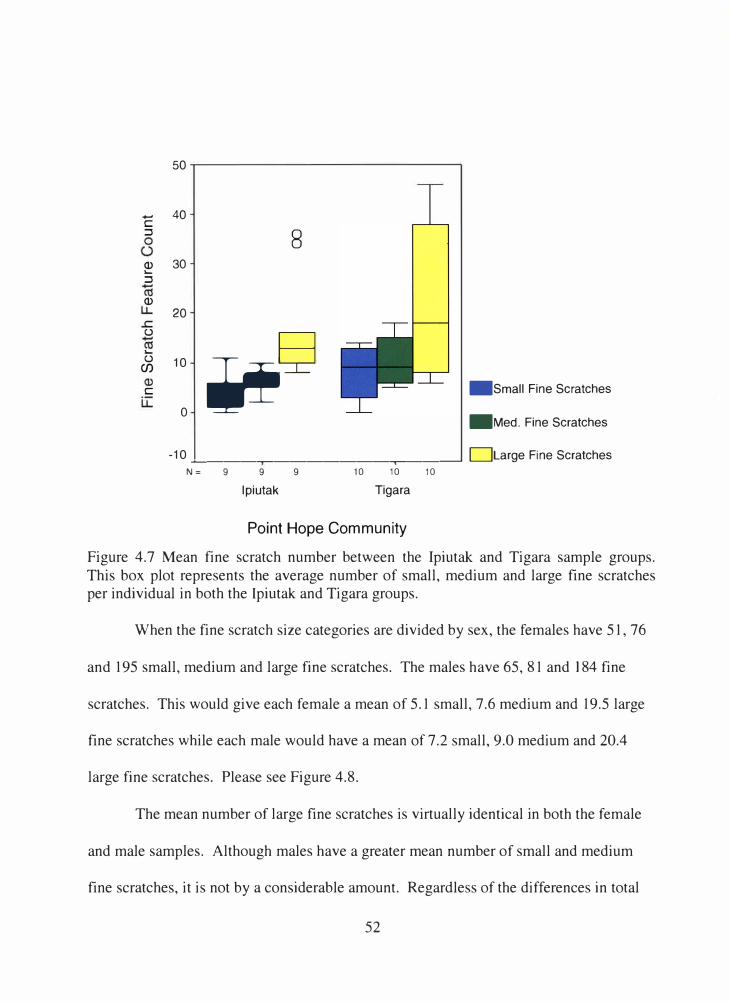
-
C
::::,
Q) ....
::::,
Q)
(.)
....
(.)
Cf)
C
50
40
8 30
20
.+g 10
0
-Small Fine Scratches
-Med. Fine Scratches
-10 �---�-------�--� 0Large Fine ScratchesN= 9 9 9
lpiutak 10 10
Tigara
Point Hope Community
10
Figure 4.7 Mean fine scratch number between the Ipiutak and Tigara sample groups.
This box plot represents the average number of small, medium and large fine scratches per individual in both the Ipiutak and Tigara groups.
When the fine scratch size categories are divided by sex, the females have 51, 76
and 195 small, medium and large fine scratches. The males have 65, 81 and 184 fine
scratches. This would give each female a mean of 5.1 small, 7.6 medium and 19.5 large
fine scratches while each male would have a mean of 7.2 small, 9.0 medium and 20.4
large fine scratches. Please see Figure 4.8.
The mean number of large fine scratches is virtually identical in both the female
and male samples. Although males have a greater mean number of small and medium
fine scratches, it is not by a considerable amount. Regardless of the differences in total
52
0 0
-ctl LL ..c
cii
Q)
LI
-

mean numbers of fine scratches of all size categories, all ANOV A tests showed no
significant differences among size categories between the female and male samples (see
Appendix C).
50-r----------------,
c 40 ::,
� 30
Q)
LL 20 u
u
Cf)
Q) C
u:::
10
0
0
-Small Fine Scratches
-Med. Fine Scratches
-10 �----------�--� 0Large Fine ScratchesN = 10 10 10
Female
Sex
9 9
Male 9
Figure 4.8 Mean fine scratch number between male and female sample groups. This box
plot represents the average number of small, medium and large fine scratches per
individual in both the male and female sample groups. Again, the sample size for the males equaled 10 (Ipiutak males and Tigara males) and the sample size for females also equaled 10 (Ipiutak females and Tigara females).
For the Ipiutak females alone, they possessed 17 small, 29 medium and 99 large
fine scratches while the Tigara females had 34 small, 47 medium and 96 large fine
scratches. This gave each Ipiutak female a mean number of 3.4 small, 5.8 medium and
53
0 u
.c
-
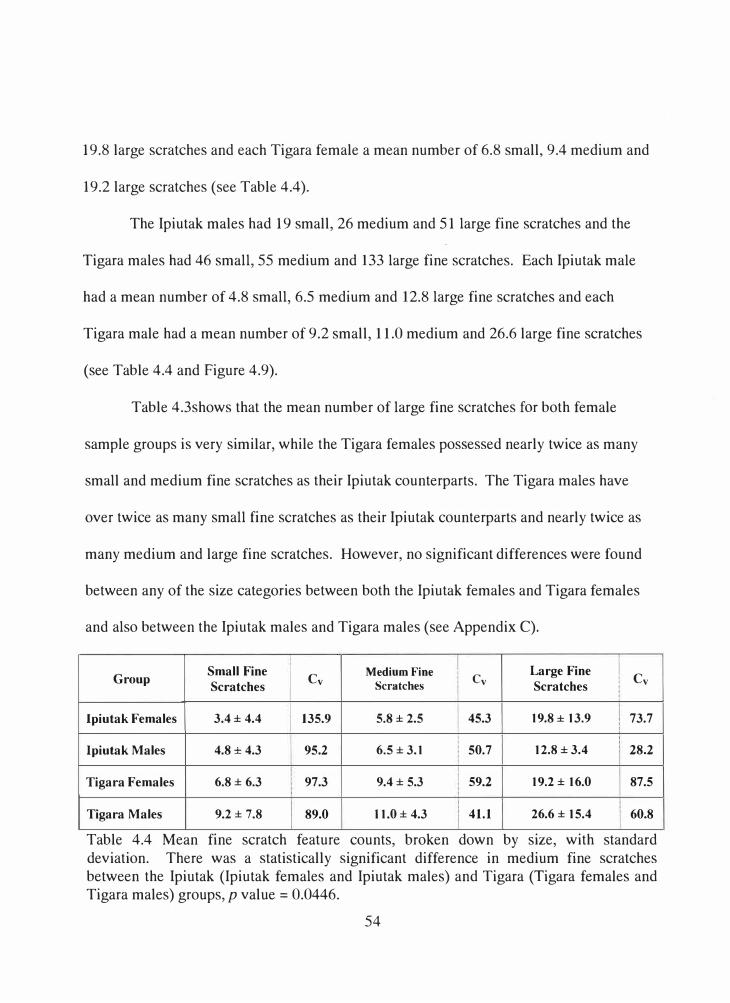
19.8 large scratches and each Tigara female a mean number of 6.8 small, 9.4 medium and
19.2 large scratches (see Table 4.4).
The Ipiutak males had 19 small, 26 medium and 51 large fine scratches and the
Tigara males had 46 small, 55 medium and 133 large fine scratches. Each Ipiutak male
had a mean number of 4.8 small, 6.5 medium and 12.8 large fine scratches and each
Tigara male had a mean number of 9.2 small, 11.0 medium and 26.6 large fine scratches
(see Table 4.4 and Figure 4.9).
Table 4.3shows that the mean number of large fine scratches for both female
sample groups is very similar, while the Tigara females possessed nearly twice as many
small and medium fine scratches as their Ipiutak counterparts. The Tigara males have
over twice as many small fine scratches as their Ipiutak counterparts and nearly twice as
many medium and large fine scratches. However, no significant differences were found
between any of the size categories between both the Ipiutak females and Tigara females
and also between the Ipiutak males and Tigara males (see Appendix C).
Group Small Fine
Cv Medium Fine
Cv Large Fine
Cv Scratches Scratches Scratches
lpiutak Females 3.4 ± 4.4 135.9 5.8 ± 2.5 45.3 19.8± 13.9 73.7
lpiutak Males 4.8± 4.3 95.2 6.5 ± 3.1 50.7 12.8 ± 3.4 28.2
Tigara Females 6.8 ± 6.3 97.3 9.4 ± 5.3 59.2 19.2 ± 16.0 87.5
Tigara Males 9.2 ± 7.8 89.0 I 1.0 ± 4.3 41.1 26.6 ± 15.4 60.8
Table 4.4 Mean fine scratch feature counts, broken down by size, with standard deviation. There was a statistically significant difference in medium fine scratches between the Ipiutak (Ipiutak females and Ipiutak males) and Tigara (Tigara females and Tigara males) groups, p value= 0.0446.
54

.....
C
Q) ,._
� Q)
� ,._
(.)
Cf)
C
50
40
30
20
10
0 .. f:} 0
�'!
0
.SMFS
-MEDFS
-10 ...__--.-------�------.------.----' 0 LGFSN= 5 5 5 4 4 4 5 5 5 5 5 5
lpiutak Female Tigara Female
lpiutak Male Tigara Male
Point Hope Sample Group
Figure 4.9 Mean fine scratch number for each Point Hope sample group. This box plot represents the average number of small, medium and large fine scratches per individual in all four Point Hope sample groups. Each group had a sample size of five individuals.
Hypercoarse Scratch Occurrence in the Point Hope Samples
The total number of hypercoarse scratches (HCS) in the four Point Hope samples
groups totaled 27. This includes small and large HCS, as medium HCS were not found
during the course of this research. The Ipiutak sample as a whole had 21 (77 .8%) of the
total number of HCS and the Tigara sample as a whole had the remaining six (22.2% ).
Divided by sex, the female sample as a whole had 15 (55.6%) of the total number of HCS
and the male sample as a whole had 12 (44.4%). Broken down further, the Ipiutak
55
::::, 0
(.)
::::,
LL .c
• t) ....
Cl)
u::: -

females had 13 (48.2%) of the total number of HCS, the Tigara females had two (7.4%),
the Ipiutak males had eight (29.6%) and the Tigara males had four (14.8%). See Figure
4.10 for an illustration.
.S 12
u 10 en -Cl> C 8 Ill ::S ... 0
� (.) 6
� 4
!;: 2
Total Number of Hypercoarse Scratches (HCS) in the Point
Hope Sample Groups
lpiutak Females lpiutak Males Tigara Females Tigara Males Point Hope Sample Groups
l■TOTALH�l
Figure 4.10 The total number of HCS in the Point Hope sample groups. The total number of HCS equals 27. Thus, the Ipiutak Females possess 48.2% of the total number of HCS (this includes aJJ sizes), the Ipiutak Males have 29.6% of the total HCS, the Tigara Females have 7.4% of the total HCS and the Tigara males have 14.8% of the total number of HCS.
It is evident from Figure 4.10 that the Ipiutak group as a whole possessed the
majority of HCS, with the Ipiutak females having more HCS than any other sample
group. The Ipiutak group as a whole had six small and 15 large HCS and the Tigara
group had one small and five large HCS. This gives each individual Ipiutak sample a
mean of 0.7 small and 1.7 large and each individual Tigara sample a mean of 0.1 and 0.5
large HCS (Figure 4.11 ).
56

The Ipiutak group, on average, has more small and large HCS than the Tigara. In
fact, the Ipiutak have six times as many small HCS and three times as many large HCS.
Consequently, the ANOV A tests showed a significant difference between the Ipiutak and
Tigara sample groups in the small size category (p = 0.0479). There was no significant
difference in large HCS between the two communities (see Appendix C).
6
+-'
C ::::,
5 0 0
(.)
(I) ,._
::::, +-'
4
a, (I)
LL
.c 3 0 (.)
a,
(.) 2 Cf)
(I) en ,._
a, 0 0
,._
(I) 0..
0 •smallHCS>, I
-1 □ Large HCSN= 9 9 10 10
lpiutak Tigara
Point Hope Community
Figure 4.11 Mean HCS number between the Ipiutak and Tigara sample groups. This box plot represents the average number of small and large HCS per individual in the Ipiutak
and Tigara groups.
When divided by sex, the female sample had four small HCS and 11 large HCS
while the males had three small HCS and nine large HCS. Broken down, it would give
57
+-'
....
(.)
each female a mean of 0.4 small and 1.1 large HCS and each male would have a mean of
0.3 small and 1.0 large HCS. Please refer to Figure 4.12.
The mean number of small and large HCS is nearly identical between males and
females, with females having a slightly higher mean in both size categories.
Accordingly, all ANOVA tests performed between the males and females and each size
category provided no significant differences (see Appendix C).
6 -
C
::::, 5 0 0
()
Q) ,_ ::::, -
4
� Q)
LL
..c 3 0 (.) -
�,_ (.)
2 (/)
Q) (/) ,_ � 0 (.) ,_ Q) a.
0 -SmallHCS>, I
-1 □ Large HCSN= 10 10 9 9
Female Male
Sex
Figure 4.12 Mean HCS number between male and female sample groups. This box plot
represents the average number of small and large HCS per individual in both the male and female sample groups.
When broken down even further, the Ipiutak females had four small and nine
large HCS and the Tigara females had zero small and only two large HCS. This would
58
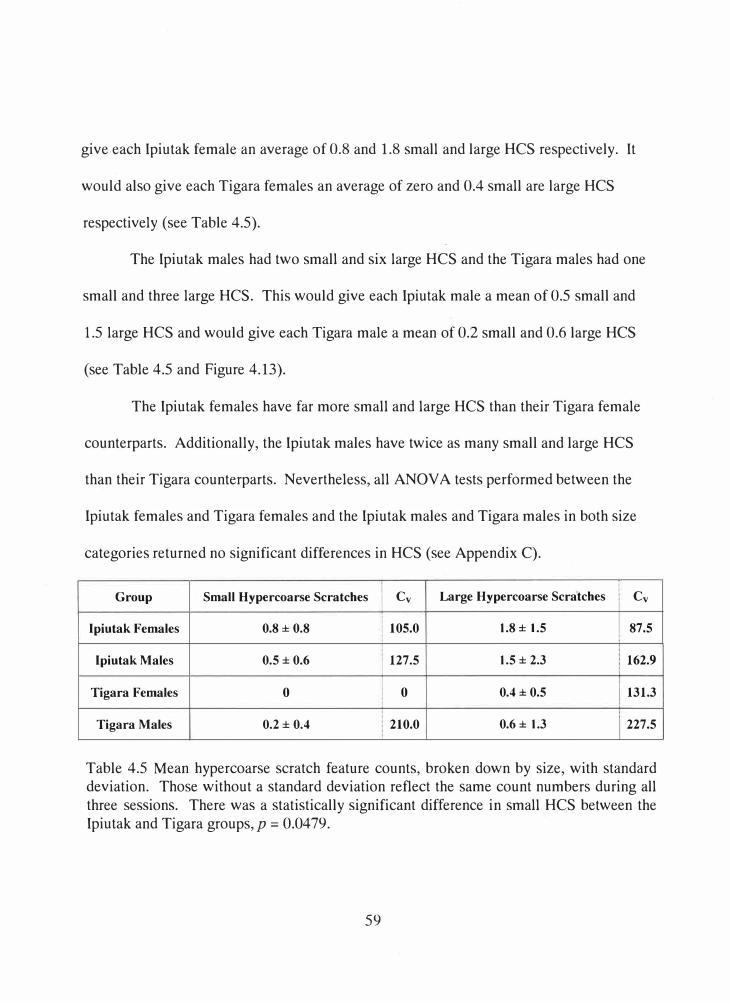
give each Ipiutak female an average of 0.8 and 1.8 small and large HCS respectively. It
would also give each Tigara females an average of zero and 0.4 small are large HCS
respectively (see Table 4.5).
The Ipiutak males had two small and six large HCS and the Tigara males had one
small and three large HCS. This would give each Ipiutak male a mean of 0.5 small and
1.5 large HCS and would give each Tigara male a mean of 0.2 small and 0.6 large HCS
(see Table 4.5 and Figure 4.13).
The Ipiutak females have far more small and large HCS than their Tigara female
counterparts. Additionally, the Ipiutak males have twice as many small and large HCS
than their Tigara counterparts. Nevertheless, all ANOV A tests performed between the
Ipiutak females and Tigara females and the Ipiutak males and Tigara males in both size
categories returned no significant differences in HCS (see Appendix C).
Group Small Hypercoarse Scratches Cv Large Hypercoarse Scra'tches Cv
lpiutak Females 0.8 ± 0.8 105.0 1.8± 1.5 87.5
lpiutak Males 0.5± 0.6 127.5 1.5± 2.3 162.9
Tigara Females 0 0 0.4 ± 0.5 131.3
Tigara Males 0.2± 0.4 210.0 0.6 ± 1.3 227.5
Table 4.5 Mean hypercoarse scratch feature counts, broken down by size, with standard deviation. Those without a standard deviation reflect the same count numbers during all
three sessions. There was a statistically significant difference in small HCS between the Ipiutak and Tigara groups,p = 0.0479.
59
I

+-'
0
(.)
(1)
::::, +-'
(1j (1)
..c
+-'
(1j
Cf)
(1)
(1j 0
(1)
6
5
4 0
0
2
1
0 _[] 0
•small HCS
-1 �---.------------,.-------,-------.-----' D Large HCSN= 5 5 4 4 5 5 5 5
lpiutak Female Tigara Female
lpiutak Male Tigara Male
Point Hope Sample Group
Figure 4.13 Mean HCS number for each Point Hope sample group. This box plot represents the average number of small and large HCS per individual in all four Point Hope sample groups.
Summary
To summarize, there were four statistically significant differences: small pits
between females and males, medium pits between females and males, medium fine
scratches between Ipiutak and Tigara and small hypercoarse scratches between lpiutak
and Tigara.
Regarding pit occurrence, the Ipiutak sample as a whole possessed more pits than
their Tigara counterparts. When bisected by sex, males had a greater number of small
60
C :::::l
....
LL 3
(..)
.... (..)
(/) .... (..) .... c.. >, I -

and large pits, while the females had a greater number of medium pits. Consequently, the
small and medium pit means were significantly different between males and females.
Ipiutak females and Tigara females had similar pit occurrences in all three size categories
and Ipiutak males and Tigara males also had similar pit occurrences.
Fine scratch incidence between Ipiutak and Tigara samples provided a significant
difference in medium fine scratches, with the Tigara group having a greater number.
Males and females had similar fine scratch occurrences. The Ipiutak female and Tigara
female samples exhibited a similar large fine scratch occurrence, with the Tigara females
possessing a greater (but not significantly greater) number of small and medium fine
scratches than their Ipiutak female counterparts. The Tigara males had more small,
medium and large fine scratches than the Ipiutak males, although they were not
significantly different.
The Ipiutak group as a whole possessed the majority of hypercoarse scratches
(HCS). In fact, there was a significant difference in small HCS between the two sample
groups. When broken down by sex, males and females exhibited a similar incidence of
HCS in both size categories. The Ipiutak females had a higher incidence of both small
and large HCS than their Tigara female counterparts, although they were not statistically
significant. The HCS incidence between Ipiutak males and Tigara males was similar.
61
CHAPTER V
DISCUSSION
The incisal microwear data presented in Chapter 4 provides some evidence for
what archaeologists have hypothesized about the Ipiutak and Tigara communities. That
is, their subsistence strategies were distinct based on four significant differences: small
pits by sex, medium pits by sex, medium fine scratches by group and small HCS by
group. In addition to dietary analysis, perhaps comments can also be made about the
heavy reliance on paramasticatory behaviors, which were most likely in daily use by both
communities.
It is important to note that interpretations made from this discussion relate
strongly to the two particular sample groups being compared. For example, the
comparisons made between Point Hope populations (i.e. between lpiutak and Tigara) in
this study are important for their underlying implications regarding the hypothesized
difference in diet between the two groups. Likewise, the comparisons between females
and males in this study are also important as they have a core implication for the sexual
division of labor in Alaskan Eskimo communities.
For example, the lpiutak sample group had considerably more hypercoarse
scratches (HCS) than the Tigara (21 vs. six), which could support the argument for
dietary differences; however, a completely distinct picture is highlighted when the
samples are evaluated by sex. When female and male total HCS are compared, the
62
difference is very minimal (15 vs. 12). This may offer evidence for similar
paramasticatory behaviors or paramasticatory behaviors that differ by sex, but produce
the same incisal microwear signature.
When the samples groups are broken down by Point Hope community and by sex,
the interpretations become quite complex. Are we to attribute a certain dental microwear
signature to diet or to paramasticatory behaviors? How are we do know that the
microwear signature is not due to a combination of both these factors? The challenge is
to isolate important variables such as community, sex, diet and paramasticatory
behaviors, especially with skeletal remains with no documented ethnographic record.
In addition to these questions, it is important to remember the type of teeth being
analyzed. Although the majority of dental microwear studies examine molars, this study
does not, and while using incisors for dental microwear research can provide information
that molar research cannot, the opposite is also true. In this instance, incisal microwear
research can provide inferences on diet and paramasticatory behaviors, but its usefulness
in diet may be quite limited. Incisors are not used for mastication as molars are; instead,
they are primarily used for biting and tearing food. Thus, making concrete statements
concerning diet in incisal microwear research is approximate.
63
Pits
The total number of pits for the Ipiutak as a whole equaled 714 while the Tigara
had 584. When broken down into three size categories, small, medium and large, the
Ipiutak had more than the Tigara in all three. Although the ANOV A tests showed these
differences to be statistically insignificant, the question arises as to why the Ipiutak had
more pits than the Tigara community. There are several possible answers related to both
diet and the sexual division of labor.
It is well documented that early 20th century Alaskan Eskimo groups prepared
meat, their staple subsistence source, on open racks or stored them underground (Larsen
and Rainey 1948). The Point Hope coast, and the location of the sites, is made up of
sand. Without doubt, sand in their diet had to have contributed to the amount of small
pits found in both groups, with the Ipiutak perhaps having more sand in their food. This
increase in sand intake could be due to differences in the location of butchering meat,
location of food preparation or the location in which the food was eaten. All of these
factors could have contributed to an increase in grit in their diet and thus, an increase in
small pits.
As for medium and large pits, it could be suggested that the Ipiutak group as a
whole ate more bone than their Tigara counterparts. Small bones, such as fish and bird
bones, could have produced the medium and large pits. Large bones, such as those from
seal or caribou, most likely would not account for the medium- and large-sized pits, as
64

even these sizes are quite small in relation to what a large bone could produce if it made
contact with an incisor.
When the data is examined in relation to sex, additional inferences arise. As a
whole, males had a total number of 728 pits and females had a total of 570. More
specifically, the males had a total of 559 small pits while the females had a total of 294
small pits. The males had a total of 133 medium pits and the females had a total of 231.
The ANOV A tests showed the differences in small and medium pits between males and
females to be statistically significant.
Why do males have a greater number of small pits than females? Since I have
attributed small pits to sand or grit in the diet, perhaps males had better access to meat
than females. Males hunted sea or land mammals and at times butchered the animal
themselves (Giffen 1930). In the course of butchering, the males most likely consumed a
portion of the animal prior to bringing it home. One source even noted a situation where
an Alaskan Eskimo man killed a caribou, gorged himself and brought nothing home to
his family (Giddings 1967).
Why do females have a statistically significant number of medium pits than
males? Perhaps the reasoning once again combines both diet and the sexual division of
labor. In both coastal and interior Alaskan Eskimo groups, females were recorded
catching fish and small birds for their families to eat and for the materials to prepare
clothing (Giddings 1967; Gubser 1965). Since females are primarily responsible for
obtaining these types of food and clothing products, it stands to reason that they would be
65
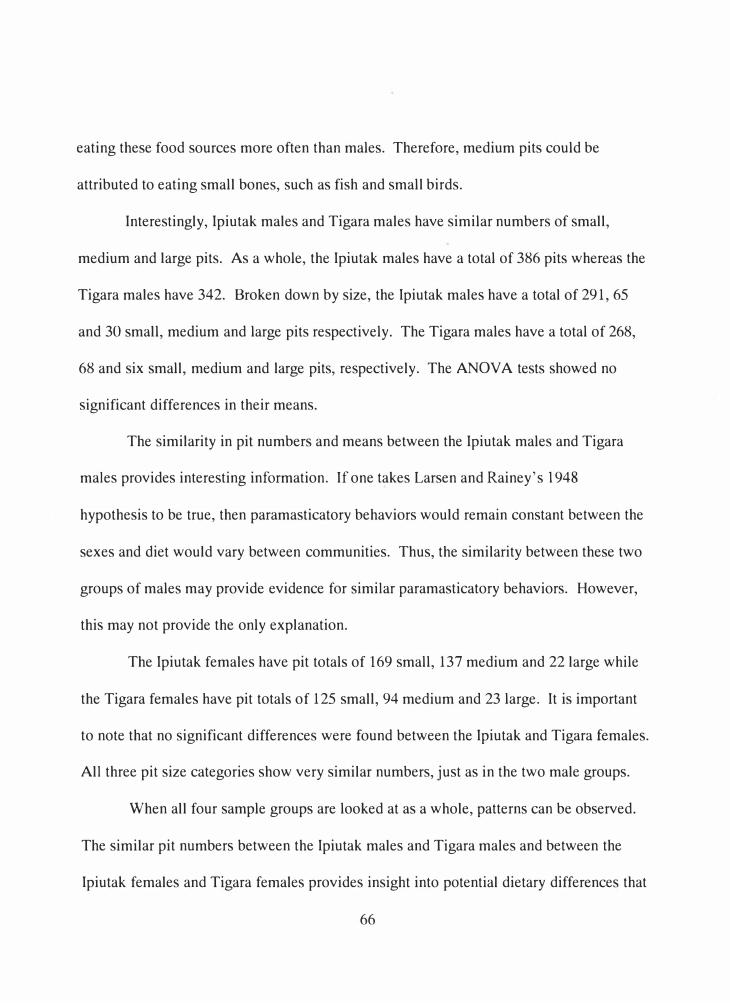
eating these food sources more often than males. Therefore, medium pits could be
attributed to eating small bones, such as fish and small birds.
Interestingly, Ipiutak males and Tigara males have similar numbers of small,
medium and large pits. As a whole, the Ipiutak males have a total of 386 pits whereas the
Tigara males have 342. Broken down by size, the Ipiutak males have a total of 291, 65
and 30 small, medium and large pits respectively. The Tigara males have a total of 268,
68 and six small, medium and large pits, respectively. The ANOVA tests showed no
significant differences in their means.
The similarity in pit numbers and means between the Ipiutak males and Tigara
males provides interesting information. If one takes Larsen and Rainey's 1948
hypothesis to be true, then paramasticatory behaviors would remain constant between the
sexes and diet would vary between communities. Thus, the similarity between these two
groups of males may provide evidence for similar paramasticatory behaviors. However,
this may not provide the only explanation.
The Ipiutak females have pit totals of 169 small, 137 medium and 22 large while
the Tigara females have pit totals of 125 small, 94 medium and 23 large. It is important
to note that no significant differences were found between the Ipiutak and Tigara females.
All three pit size categories show very similar numbers, just as in the two male groups.
When all four sample groups are looked at as a whole, patterns can be observed.
The similar pit numbers between the Ipiutak males and Tigara males and between the
Ipiutak females and Tigara females provides insight into potential dietary differences that
66
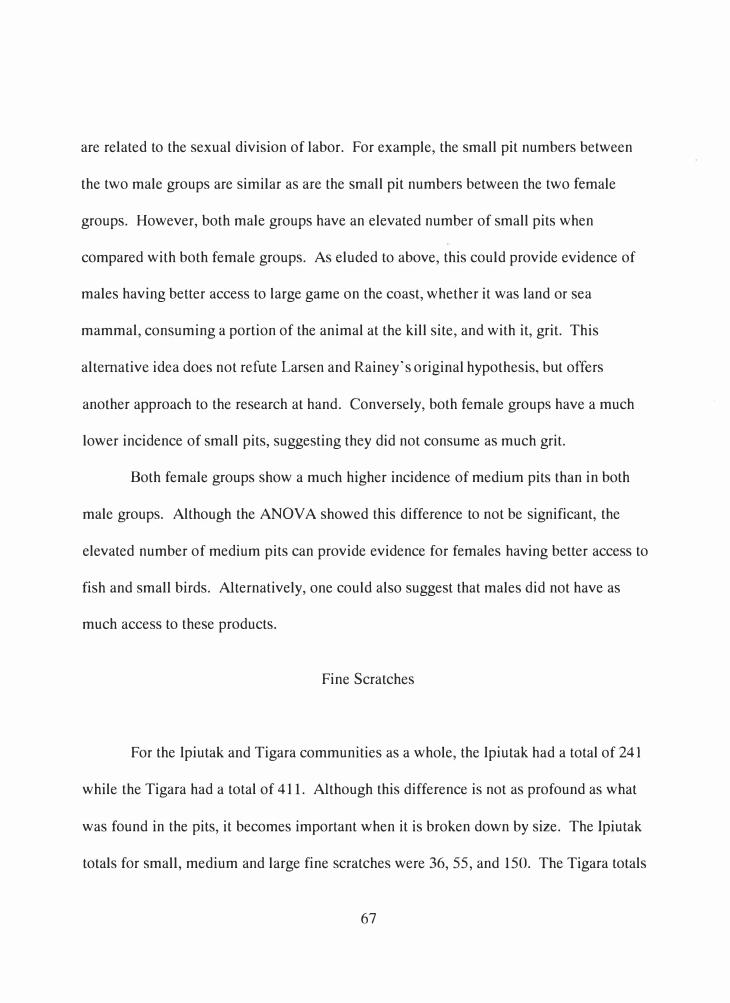
are related to the sexual division of labor. For example, the small pit numbers between
the two male groups are similar as are the small pit numbers between the two female
groups. However, both male groups have an elevated number of small pits when
compared with both female groups. As eluded to above, this could provide evidence of
males having better access to large game on the coast, whether it was land or sea
mammal, consuming a portion of the animal at the kill site, and with it, grit. This
alternative idea does not refute Larsen and Rainey's original hypothesis, but offers
another approach to the research at hand. Conversely, both female groups have a much
lower incidence of small pits, suggesting they did not consume as much grit.
Both female groups show a much higher incidence of medium pits than in both
male groups. Although the ANOVA showed this difference to not be significant, the
elevated number of medium pits can provide evidence for females having better access to
fish and small birds. Alternatively, one could also suggest that males did not have as
much access to these products.
Fine Scratches
For the Ipiutak and Tigara communities as a whole, the Ipiutak had a total of 241
while the Tigara had a total of 411. Although this difference is not as profound as what
was found in the pits, it becomes important when it is broken down by size. The Ipiutak
totals for small, medium and large fine scratches were 36, 55, and 150. The Tigara totals
67

for small, medium and large fine scratches were 80, 102 and 229. Although there is not a
significant difference in small and large fine scratches according to the ANOV A, there is
an important distinction in the medium fine scratch category.
The question arises as to why there is an increase in fine scratches in the Tigara
sample generally and why is there a significant difference in medium fine scratches
between the Ipiutak and Tigara samples specifically. One idea is that biting and tearing
food was creating the fine scratches, but this action would most likely create a more
severe type of microwear. Instead, paramasticatory behaviors that have been documented
in other Eskimo and Inuit groups may provide a more comprehensive explanation.
As described in Chapter 2, women are documented using their teeth extensively
for animal hide preparation and sinew thread production (Ammitzb0ll et al. l 99l a,b;
Foote 1992; Giffen 1930). The mandibular incisors would particularly bear the brunt of
these activities as the hides are pushed and pulled along them, creating labial-lingual
rounding macroscopically and fine, parallel scratches microscopically (Pedersen and
Jakobsen 1989). This could certainly explain the presence of all sizes of fine scratches on
the female mandibular incisors; however, what can explain the presence of these fine
scratches on male mandibular incisors?
Men have never been associated with hide preparation or sewing activities, so the
occurrence of fine scratches cannot be explained by these tasks. Instead, men are also
documented using paramasticatory behaviors, by using their teeth to tow seals, soften
lines and untangle traces (Giffen 1930). Perhaps one of these behaviors, or another
68

unrecorded behavior, created the abundance of fine scratches on the Point Hope male
incisors.
It is interesting to note that although fine, parallel scratches are associated with
female hide preparation, which is a year-round, time-consuming activity, males have
slightly more small and medium fine scratches than females. Perhaps large fine scratches
are more apt to occur during female hide preparation than small and medium fine
scratches.
When broken down by group and sex, the Ipiutak females had more small and
medium fine scratches than their Tigara female counterparts. The large fine scratch
numbers between the two females groups were very similar, providing evidence to
support these types of fine scratches as being associated with animal hide preparation.
The two male groups, alternatively, had differences in their fine scratch numbers.
Although not statistically significant, the Tigara male sample had more small, medium
and large fine scratches than their Ipiutak male counterparts. Since males are not
associated with sewing, the fine scratches would have been created by another behavior
that produced fine scratches.
Hypercoarse Scratches
The final dental microwear feature is hypercoarse scratches (HCS). The HCS
total for the Ipiutak sample totaled 21 while the Tigara sample totaled six. Broken
69

down, the small HCS total for the Ipiutak and Tigara was six and one respectively and the
large HCS total for Ipiutak and Tigara was 15 and five correspondingly. There was not a
statistically significant difference in large HCS between the two communities, but there
was a statistically significant difference in small HCS. Tentatively speaking, it may be
tempting to state that the marked increase in HCS in the Ipiutak group is related to diet.
One idea is that HCS are caused from tearing an amount of food from a larger piece. A
second idea is scraping one's incisors against a bone in order to consume a piece of meat.
Broken down by sex, there is not a statistically significant difference in small and
large HCS between males and females. In fact, their numbers are nearly identical. This
may suggest that the HCS are not due to the sexual division of labor. Moreover, there is
also not a statistically significant difference in HCS between the Ipiutak males and Tigara
males, but Ipiutak males did have a higher incidence of both small and large HCS.
However, the similarity in HCS incidence in both size categories implies that males did
not often partake in dietary or paramasticatory behaviors that produced HCS.
However, the Ipiutak female and Tigara female sample groups did illustrate
marked differences, although they were not statistically significant. The Ipiutak female
HCS count totaled 13 while the Tigara females had two. The Ipiutak female small and
large HCS totals were four and nine respectively and the Tigara female small and large
HCS totals were zero and two respectively. Thus, the differences in HCS in the two
female groups explain the disparity between the Ipiutak and Tigara samples as a whole
70

and the males and females as a whole. However, this still does not clarify what caused
small and large HCS in the first place.
The marked incidence of both small and large HCS in the lpiutak female sample
could be attributed to sewing generally and sinew thread production specifically. That is,
sinew thread is produced by a back-and-forth motion across the teeth, eventually
producing sinew grooves. Perhaps HCS, with their deep, wide and somewhat parallel
furrows, are the precursor to sinew grooves.
Perhaps the lpiutak group, being primarily an interior group, utilized a different
type of sinew altogether than the Tigara. A second idea is that the Ipiutak used a certain
type of sinew more often than the Tigara. One possibility that comes to mind is that of
caribou. If Larsen and Rainey are correct, conceivably the Ipiutak utilized caribou sinew
much more often than the Tigara. This sinew thread explanation would also explain why
small and large HCS appear on male incisors as well, as women would be producing the
sinew thread, but men certainly were using it for everyday tasks.
Research Comparisons
Interesting results arise when this data is coupled with an occlusal molar
microwear analysis of the two Point Hope communities. In her research, El-Zaatari
(2006) found more pitting and narrower scratches in the Tigara sample than in the
lpiutak. The higher incidence of pitting is attributed to an increase of sand in the Tigara
71

diet (2006). No cause is given for the narrower scratches. The detection of narrower
scratches in the Tigara sample coincides with my research of an increase of hypercoarse
scratches in my research, although this is difficult to evaluate since El-Zaatari does not
divide the dental microwear into size categories.
The difference in pitting incidence between my research and that of El-Zaatari
could have occurred due to several reasons. First, the differences could be accounted for
in the type of teeth studied. As mentioned before, molar analysis would better indicate
diet whereas anterior dental microwear analysis would provide insight into
paramasticatory behaviors as well as diet. Secondly, we used very different
methodologies in our research. El-Zaatari used an SEM in converted backscattered
electron mode with a magnification of approximately 500X while I used a SMZ-U
stereomicroscope with a magnification of approximately 125-150X. Unfortunately, a
standard protocol in dental microwear research is yet to be established, making
comparisons between studies difficult at best.
Summary
In summary, four of the ANOVA analyses provided statistically significant
results. There was a statistically significant difference in small and medium pits between
the male and female groups, in medium fine scratches between the Ipiutak and Tigara
groups and in small hypercoarse scratches between the Ipiutak and Tigara groups.
72
.

By applying data between females and males, one may begin to establish
connections between post-contact sexual divisions of labor in Alaskan Eskimo
populations and the prehistoric Ipiutak and Tigara communities of Point Hope. Finally,
by breaking down these two broad categories into females and males of each community,
patterns can emerge, which lead to even more detailed and comprehensive research.
Using data between the Ipiutak and Tigara sample groups, one may be able to
either refute or confirm prior archaeological evidence suggesting a difference in
subsistence strategies. The course of this research provides no evidence to counter
Larsen and Rainey's original premise that the Ipiutak and Tigara communities relied on
different subsistence strategies. That being said, I think there are other possibilities to
explain not only the archaeological data, but also the dental microwear data provided
here. Did Larsen and Rainey consider the extensive trade between interior and coastal
Alaskan Eskimo groups? Did they think about human migration patterns to and from
Point Hope? Did they also think about caribou migration patterns to Point Hope and
whether it was sufficient to provide the necessary number of caribou for an entire
community to not only live on, but also clothe themselves on?
To be brief, did the Ipiutak population rely mainly on land mammals while at
Point Hope? Perhaps, but probably not. Did the Tigara population rely chiefly on sea
mammals? Almost certainly. After all, Point Hope has been called one of the best
whaling locations in the world, and the abundance of what Larsen and Rainey have called
"land mammal hunting implements" could be explained in other ways, such as warfare.
73
,

The use of teeth in an archaeological context has opened up new avenues for
anthropology in general and physical anthropologists specifically. Dental microwear has
allowed us to recreate past environments and with them, past behaviors. These data have
proven useful in the dietary and paramasticatory behavior reconstruction of the Point
Hope communities. Although many ideas have been posited here, a compilation of
dental microwear studies, along with experimental archaeology, is imperative in order to
confirm or refute them.
74

CHAPTER VI
CONCLUSION
There are several valuable conclusions this project has brought to the forefront.
The most important is the sometimes cloudy relationship between powerful statistical
analysis and the tangible numbers. Four of the ANOV A tests performed in this study
showed a significant difference between the various means tested; however, analyzing the
numbers themselves does provide valuable information.
A second conclusion, and the purpose of this whole study, is that it is evident
from the dental microwear signatures that there are differences in the subsistence
strategies and paramasticatory behaviors of the two Point Hope communities. With that
being said, it is important to consider not only the significant differences between the two
groups being compared, but also the similarities as well. The marked number of
similarities between sample groups also suggests the differences between them were not
as distinct as originally thought.
The exact causes of the dental microwear signatures require additional research,
both within the spheres of experimental archaeology in order to pair behaviors and diet to
types of dental microwear and in further dental studies combining anterior and posterior
dentitions. Incisors provide us one piece of the puzzle, the molars another. Specifically,
a molar and incisor microwear study using the same methodology could possibly offer
75

data that better distinguishes microwear signatures between diet and paramasticatory
behaviors.
Additionally, the canines, from my observation, would greatly benefit dental
microwear studies in general and would provide additional collaboration for Point Hope
researchers. Another potential study would examine the linear enamel hypoplasia
incidence of the Point Hope communities. This would better indicate the level of success
these specific arctic foragers maintained and would also provide insight into non-specific
stress duration.
It is important to encourage additional research on the Point Hope skeletal
remains for several reasons. First, alluded to above, it helps anthropologists understand
the level of success that these arctic foragers reached in such a harsh environment. In
connection to this, it helps us better recognize the biological adaptations that arise in
long-term cold stress. A second reason to promote Point Hope research is the impending
repatriation issues surrounding the skeletal remains. Once the opportunity to study the
Point Hope communities has disappeared, we will have lost integral evidence of
successful arctic forager lifeways.
Lastly, I hope this study has opened up new opportunities to students and
professionals alike who are interested in new techniques for dental microwear.
Traditional dental microwear studies can be tedious and the methodology can be
confusing, especially to the novice anthropologist. Light microscopy offers great
possibilities and is much more affordable and accessible than a scanning electron
76

microscope. I recommend testing new techniques that have not been previously
explored. Speaking with microscopists and engineers, who can provide access to
instruments and machinery unknown to anthropologists, can offer valuable information
relating to a project similar to this one.
The results of these collaborations have produced interesting results. The first is
the use of light microscopy at a magnification of approximately 125-150X. The
microscope used in this study provided better results than that of the scanning electron
microscope available to me at Western Michigan University. The second result is the use
of gold sputtering when using light microscopy. The dental microwear features were
much more distinguishable when gold sputtering was completed. The third and final
result of these collaborations is perhaps the most notable: interference microscopy. An
interference microscope is traditionally used in mechanical engineering to analyze the
wear on mechanical seals, but its use has transcended this original function. It provides
surface topography from a field of view ranging from 8.2 by 6.3 mm to 150 by 100 µm.
The new technique in dental microwear is confocal microscopy, which also provides
surface topography; however, I believe interference microscopy could provide even
better data. See Figures 6.1 and 6.2 below for examples of the Veeco NT-1100 system.
In conclusion, I challenge dental anthropologists and graduate students to think
beyond the standard methodologies. Although it may require more hours behind a
computer screen, at the microscope or introducing yourself to others in departments other
than your own, it is well worth the effort.
77

2.5
2.0
1.5
=
-
-
-
Figure 6.1 Tigara 359, female, central
left incisor. The top photo shows the
occlusal surface under a light
microscope; the second photo is the
surface data; the third photo shows a 3-
dimensional display. These bottom
two photos were taken with the
interference microscope.
102
50
0
-50
78

2.0
1.5
1.0
0.5
0.0
0.0 0.5 1.0 1.5 2.0 2.5 3.0 3.5 u
um
79
--
-
-
-
Figure 6.2 Ipiutak 96-A, male,
central left incisor. See Figure 6.1
for a description of each photo.
110
50
0
-50
- -100
- -150
- -200
- -250
- -295
- 110
- 50
- 0
- ·50
- -100
- -1SCI
- -200
- -250
- -295

REFERENCES
Ammitzb0ll, T., S.R. Andersen, H.P. Andersson, J. Bodenhoff, M. Eiken, B. Eriksen, N. Foged, M. Ghisler, A. Gotfredsen, H.E. Hansen, J.P. Hart Hansen, J. Jakobsen, J.B. forgensen, T. Kobayasi, N. Kromann, K.J. Lyberth, L. Lyneborg, F. Mikkelsen, J. M0hl, R. M0ller, J. Myhre, P.O. Pedersen, J.U. Prause, 0. Sebbesen, E. Svejgaard, D.D.Thompson, V. F. Thomsen, and L. Vanggaard. (1991a). "The people," in The GreenlandMummies. Edited by J.P. Hart Hansen, J. Meldgaard, and"J. Nordqvist, pp. 64-101.Washington DC: Smithsonian Institution Press.
Ammitzb0ll, T., M. Bencard, J. Bodenhoff, R. Gilberg, A. Johansson, J. Meldgaard, G. M0ller, R. M0ller, E. Svejgaard, and L. Vanggaard. ( 1991 b ). "Clothing," in The Greenland Mummies. Edited by J.P. Hart Hansen, J. Meldgaard, and J. Nordqvist, pp. 64-101. Washington DC: Smithsonian Institution Press.
Anderson, D.D. (1984). "Prehistory of North Alaska," in Handbook of North American Indians, Vol. 5: Arctic. Edited by D. Damas, pp. 8-16. Washington DC: Smithsonian Institution Press.
Andrews, C.L. (1939). The Eskimo and His Reindeer in Alaska. Caldwell: Caxton Printers, Ltd.
Bandi, H.G. (1969). Eskimo Prehistory. College: University of Alaska Press.
Beechey, F.W. (1831). Narrative of a Voyage to the Pacific and Beering's Strait. London: H. Colburn and R. Bentley.
Buikstra J.E. and D.H. Ubelaker (1994) Standards for Data Collection From Human Skeletal Remains. Arkansas: Arkansas Archaeological Survey.
Burch, E.S. 1981. The Traditional Eskimo Hunters of Point Hope, Alaska: 1800-1875. Barrow Alaska: North Slope Borough.
Cederquist, R. (1979). "Age changes in facial morphology of an Alaskan Eskimo population." OSSA: 6:(39-67).
Cederquist, R. and A.A. Dahlberg. (1977). "Craniofacial description of Wainwright Alaskan Eskimos," in Orofacial Growth and Development. Edited by A.A. Dahlberg and T.M. Graber, pp. 263-267. Chicago:The Hague.
Chance, N.A. 1990. The Ifiupiat and Arctic Alaska: an Ethnography of Development. New York: Wadsworth Thomson Learning.
80

Collins, H.B. ( 1984 ). "History of research before 1945," in Handbook of North American Indians, Vol. 5: Arctic. Edited by D. Damas, pp. 8-16. Washington DC: Smithsonian Institution Press.
Costa, R.L. (1977). Dental pathology and related factors in archeological Eskimo skeletal samples from Point Hope and Kodiak Island, Alaska. Ph.D. diss. University of Pennsylvania.
Costa, R.L. (1980a). "Incidence of caries and abscesses iri archeological Eskimo skeletal samples from Point Hope and Kodiak Island, Alaska. American Journal of Physical Anthropology 52:501-514.
Costa, R.L. (1980b). "Age, sex, and antemortem loss of teeth in prehistoric Eskimo samples from Point Hope and Kodiak Island, Alaska." American Journal of Physical Anthropology 53:579-587.
Costa, R.L. (1982). "Periodontal disease in the prehistoric Ipiutak and Tigara skeletal remains from Point Hope, Alaska." American Journal of Physical Anthropology 59:97-110.
Dahlberg, A.A., R. Cederquist, J. Mayhall and D. Owen. (1978). "Eskimo Craniofacial studies," in Eskimos of Northwestern Alaska: A Biological Perspective." Edited by P.L. Jameson, S.L. Zegura, and F.A. Milan, pp. 94-113. Stroudsburg: Dowden, Hutchinson and Ross, Inc.
Delkin, A.A. (1978). Arctic Archaeology: A Bibliography and History. New York: Garland Publishing.
Dumond, D.E. (1977). The Eskimos and Aleuts. London: Thames and Hudson.
El-Zaatari, S., F.E. Grine, M.F. Teaford, and H.F. Smith. (2005). "Molar microwear and dietary reconstructions of fossil Cercopithecoidea from the Plio-Pleistocene deposits of South Africa." Journal of Human Evolution 49: 180-205.
El-Zaatari, S. (2006) "Dietary habits of the lpiutak and Tigara populations from Point Hope: an occlusal molar microwear analysis." Paper presented at the 75th annual meeting of the American Association of Physical Anthropologists, March 9,2006, Anchorage, Alaska.
Foote, B.A. (1992). The Tigara Eskimos and Their Environment. Point Hope: North Slope Borough, Commission on lfiupiat History, Language, and Culture.
Gerlach, S.C. (1989). Models of Caribou Exploitation, Butchery, and Processing at the Croxton Site, Tukuto Lake, Alaska. Ph.D. dissertation, Brown University.
81
Giddings, J.L. (1967). Ancient Men of the Arctic. New York: Alfred A. Knopf.
Giffen, N.M. (1930). The Roles of Men and Women in Eskimo Culture. Chicago: University of Chicago Press.
Gordon, K.D. (1984). "Hominoid dental microwear: complications in the use of microwear analysis to detect diet." Journal of Dental Research 63:1043-1046.
Guatelli-Steinberg, D., C.S. Larsen, and D.L. Hutchinson. (2004). "Prevalence and the duration of linear enamel hypoplasia: a comparative study of Neadertals and Inuit foragers." Journal of Human Evolution 47(65-84).
Gubser, N.J. (1965). The Nunamiut Eskimos: Hunters of Caribou. New Haven: Yale University Press.
Hart Hansen, J.P., J. Meldgaard, and C. Andreasen. (1989). "Introduction," in The Mummies From Qilakitsoq - Eskimos in the 15th Century. Edited by J.P. Hart Hansen and H.C. Gul10v, pp. 5-7. Meddelelser om Gr0nland.
Hillson, S. (1996). Dental Anthropology. Cambridge: Cambridge University Press.
Lalueza, C., A. Perez-Perez, and D. Turb6n. ( 1996). "Dietary inferences through buccal microwear analysis of middle and upper Pleistocene human fossils." American Journal of Physical Anthropology 100:367-387.
Larsen, H. and F. Rainey. (1948). "lpiutak and the Arctic whale hunting culture." Anthropological Papers of the American Museum of Natural History 42:1-478. New York: Order of the Trustees.
Larsen, H. (1954). "The position oflpiutak in Eskimo culture." American Antiquity 20(1):74-79.
Larsen, H. (1961). "Archaeology in the Arctic: 1935-1960." American Antiquity 27(1):7-15.
Mason, O.K. (2005). "Ipiutak Remains Mysterious: A Focal Place Still Out of Focus." Dynamics of Northern Societies. Edited by the Danish National Museum. Copenhagen.
Mayhall, J.T., A.A. Dahlberg, and D.G. Owen. (1970). "Torus mandibularis in an Alaskan Eskimo population." American Journal of Physical Anthropology 33:57-60.
Newton, J.I.M. (2002). "About Time: Chronological Variation as Seen in the Burial Features at lpiutak, Point Hope." Master's Thesis, University of Alaska Fairbanks.
82
Oswalt, W.H. (1967). Alaskan Eskimos. San Francisco: Chandler Publishing Company.
Oswalt, W.H. (1999). Eskimos and Explorers, 2nd Ed. Lincoln: University of Nebraska Press.
Pedersen, P.O. and J. Jakobsen. (1989). "Teeth and jaws of the Qilakitsoq mummies," in The Mummies From Oilakitsoq - Eskimos in the 15th Century. Edited by J.P. Hart Hansen and H.C. Gull0v, pp. 5-7. Meddelelser om Grnnland.
Rafferty, K.L., M.F. Teaford, and W.L. Jungers. (2002). "Molar microwear of subfossil lemurs: improving the resolution of dietary inferences." Journal of Human Evolution 43:645-657.
Rainey, F. (1941 ). "The Ipiutak culture at Point Hope, Alaska." American Anthropologist 43(3):364-375.
Rainey, F. (1947). "The whale hunters ofTigara." Anthropological Papers of the American Museum of Natural History 42(2):231-283.
Rainey, F. (1971). "The Ipiutak culture: excavations at Point Hope, Alaska." AddisonWesley Modular Publications 7:1-32.
Ray, P.H. (1885). Report of the International Polar Expedition to Point Barrow, Alaska. Washington: U.S. Government Printing Office.
Royal Geographical Society. (1875). "John Simpson; Observations on the Western Eskimo and the Country They Inhabit, from Notes Taken During Two Years at Point Barrow," in Arctic Geography and Ethnology: A Selection of Papers on Arctic Geography and Ethnology, pp. 233-275. London: J. Murray.
Ryan, A.S. and D.C. Johanson. (1989). "Anterior dental microwear in Australopithecus
afarensis: comparisons with human and nonhuman primates." Journal of Human Evolution 18:235-268.
Scott, R.S., P.S. Ungar, T.S. Bergstrom, C.A. Brown, F.E. Grine, M.F. Teaford, and A. Walker. (2005). "Dental microwear texture analysis shows within-species diet variability in fossil hominins." Nature 436(4):693-695.
Simpson, J. (1875). Oberservations on the Western Eskimo and the Country They Inhabit. London: J. Murray.
83
Stager, J .K. and R.J. McSkimming. ( 1984 ). "Physical environment," in Handbook of North American Indians, Vol. 5: Arctic. Edited by D. Damas, pp. 8-16. Washington DC: Smithsonian Institution Press.
Teaford, M.F. (1988). "A review of dental microwear and diet in modem mammals." Scanning Microscopy International 2:1149-1166.
Teaford, M.F. (1994). "Dental microwear and dental function." Evolutionary Anthropology 3(1): 17-30.
Teaford, M.F. and A. Walker. (1984). "Quantitative differences in dental microwear between primate species with different diets and a comment on the presumed diet of Sivapithecus." American Journal of Physical Anthropology 64: 191-200.
Ungar, P.S. (1990). "Incisor microwear and feeding behavior inAlouatta seniculus and Cebus olivaceus." American Journal of Primatology 20(1 ):43-50.
Ungar, P.S. (1994). "Incisor microwear of Sumatran anthropoid primates." American Journal of Physical Anthropology 94:339-363.
Ungar, P.S. (1996). "Relationship of incisor size to diet and anterior tooth use in sympatric Sumantran anthropoids." American Journal of Primatology 38(2):145-156. Ungar, P.S. (2002). "Reconstructing the diets of fossil primates," in Reconstructing Behavior in the Primate Fossil Record. Edited by Plavcan et al. pp. 261-296. New York: Kluwer Academic/Plenum Publishers.
Ungar, P.S. and F.E. Grine. (1991). "Incisor size and wear in Australopithecus africanus and Paranthropus robustus." Journal of Human Evolution 20:313-340.
Ungar, P.S. and M.A. Spencer. (1999). "Incisor microwear, diet, and tooth use in three Amerindian populations." American Journal of Physical Anthropology 109:387-396.
Walker, A.C., H.N. Hoeck, L. Perez. (1978). "Microwear of mammalian teeth as an indicator of diet." Science 201 :908-910.
Walker, A. and M. Teaford. (1989). "Inferences from quantitative analysis of dental microwear." Folia Primatol 53:177-189.
84

Appendix A
Sex Determination Data
85
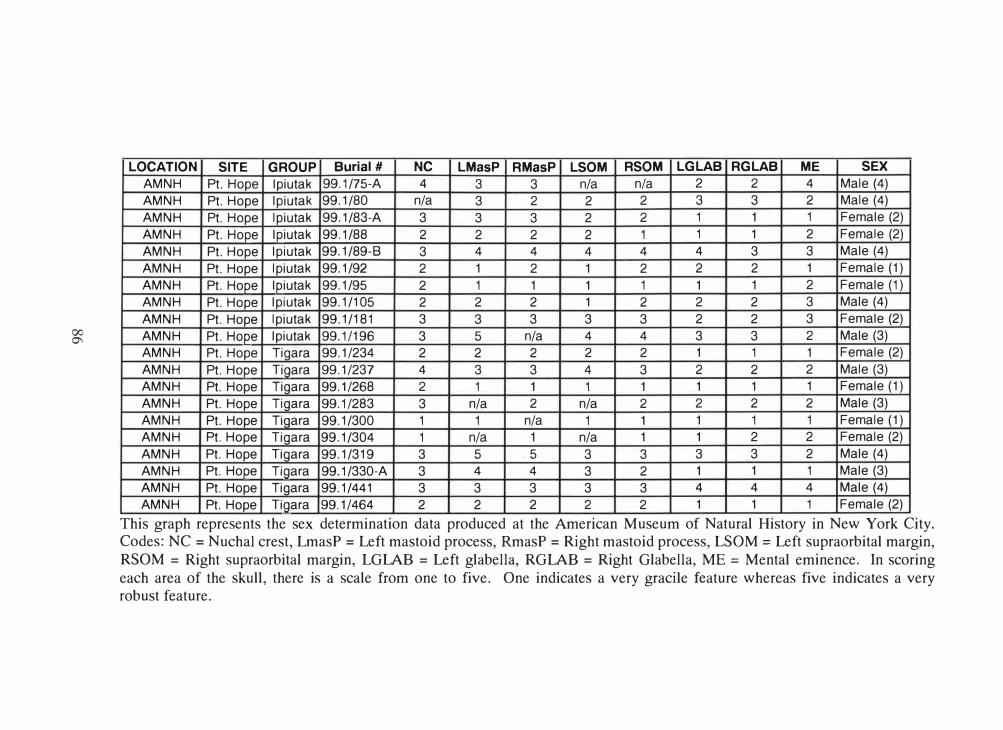
00 °'
LOCATION SITE GROUP Burial# NC LMasP RMasP LSOM RSOM LGLAB RGLAB ME SEX
AMNH Pt. Hope lpiutak 99.1/75-A 4 3 3 n/a n/a 2 2 4 Male (4) AMNH Pt. Hope lpiutak 99.1/80 n/a 3 2 2 2 3 3 2 Male (4)
AMNH Pt. Hope lpiutak 99.1/83-A 3 3 3 2 2 1 1 1 Female (2)
AMNH Pt. Hope lpiutak 99.1/88 2 2 2 2 1 1 1 2 Female (2)
AMNH Pt. Hope lpiutak 99.1/89-8 3 4 4 4 4 4 3 3 Male (4)
AMNH Pt. Hope lpiutak 99.1/92 2 1 2 1 2 2 2 1 Female (1)
AMNH Pt. Hope lpiutak 99.1/95 2 1 1 1 1 1 1 2 Female (1) AMNH Pt. Hope lpiutak 99.1/105 2 2 2 1 2 2 2 3 Male (4)
AMNH Pt. Hope lpiutak 99.1/181 3 3 3 3 3 2 2 3 Female (2)
AMNH Pt. Hope lpiutak 99.1/196 3 5 n/a 4 4 3 3 2 Male (3) AMNH Pt. Hope Tigara 99.1/234 2 2 2 2 2 1 1 1 Female (2)
AMNH Pt. Hope Tigara 99.1/237 4 3 3 4 3 2 2 2 Male (3) AMNH Pt. Hope Tigara 99.1/268 2 1 1 1 1 1 1 1 Female (1)
AMNH Pt. Hope Tigara 99.1/283 3 n/a 2 n/a 2 2 2 2 Male (3) AMNH Pt. Hope Tiqara 99.1/300 1 1 n/a 1 1 1 1 1 Female (1) AMNH Pt. Hope Tigara 99.1/304 1 n/a 1 n/a 1 1 2 2 Female (2)
AMNH Pt. Hope Tigara 99.1/319 3 5 5 3 3 3 3 2 Male (4)
AMNH Pt. Hope Tigara 99.1/330-A 3 4 4 3 2 1 1 1 Male (3) AMNH Pt. Hope Tigara 99.1/441 3 3 3 3 3 4 4 4 Male (4) AMNH Pt. Hope Tigara 99.1/464 2 2 2 2 2 1 1 1 Female (2)
This graph represents the sex determination data produced at the American Museum of Natural History in New York City. Codes: NC= Nuchal crest, LmasP = Left mastoid process, RmasP = Right mastoid process, LSOM = Left supraorbital margin, RSOM = Right supraorbital margin, LGLAB = Left glabella, RGLAB = Right Glabella, ME= Mental eminence. In scoring each area of the skull, there is a scale from one to five. One indicates a very gracile feature whereas five indicates a very robust feature.

Appendix B
Individual Dental Microwear Data
87
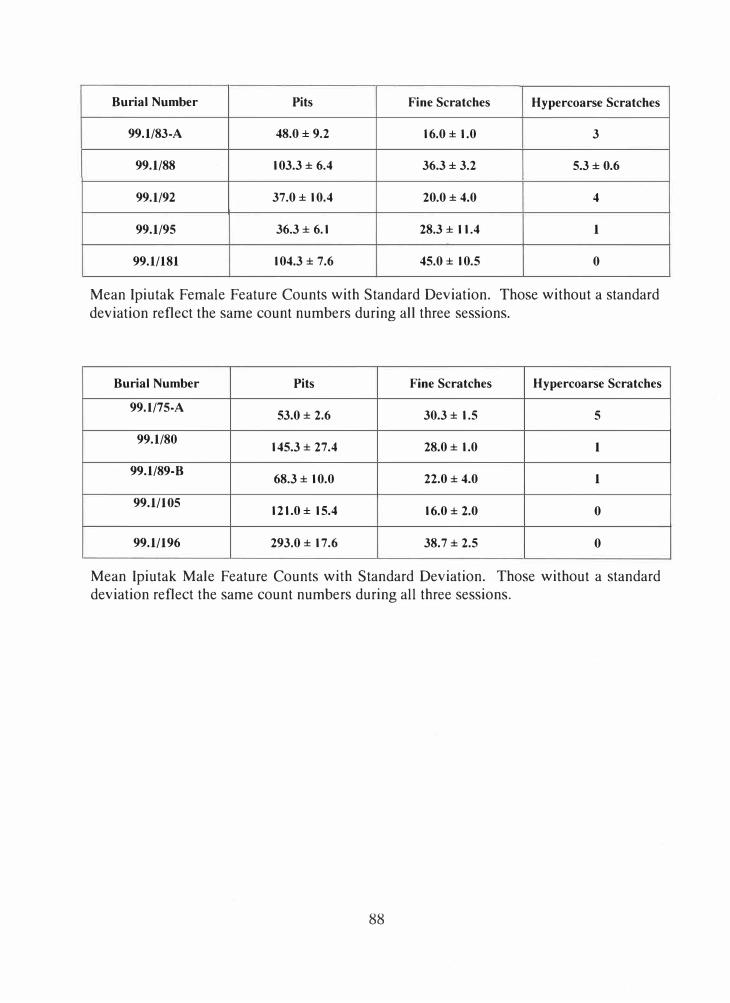
Burial Number Pits Fine Scratches Hypercoarse Scratches
99.1/83-A 48.0 ± 9.2 16.0 ± 1.0 3
99.1/88 103.3 ± 6.4 36.3 ± 3.2 5.3± 0.6
99.1/92 37.0 ± 10.4 20.0 ± 4.0 4
99.1/95 36.3 ± 6.1 28.3 ± 11.4 1
99.1/181 104.3 ± 7.6 45.0 ± 10.5 0
Mean Ipiutak Female Feature Counts with Standard Deviation. Those without a standard
deviation reflect the same count numbers during all three sessions.
Burial Number Pits Fine Scratches Hypercoarse Scratches
99.1/75-A 53.0 ± 2.6 30.3 ± 1.5 5
99.1/80 145.3 ± 27.4 28.0± 1.0 1
99.1/89-B 68.3 ± 10.0 22.0 ± 4.0 1
99.1/105 121.0 ± 15.4 16.0 ± 2.0 0
99.1/196 293.0 ± 17.6 38.7 ± 2.5 0
Mean Ipiutak Male Feature Counts with Standard Deviation. Those without a standard deviation reflect the same count numbers during all three sessions.
88

Burial Number Pits Fine Scratches Hypercoarse Scratches
99.1/234 46.3 ± 10.4 16.0 ± 2.0 0
99.1/268 27.0 ± 6.0 28.7 ± 1.2 0
99.1/300 27.7 ± 2.5 57.7 ± 7.5 1
99.1/304 71.3 ± 4.0 22.0 ± 8.7 0
99.1/464 71.0 ± 5.6 54.0"± 1.0 1
Mean Tigara Female Feature Counts with Standard Deviation. Those without a standard deviation reflect the same count numbers during all three sessions.
Burial Number Pits Fine Scratches Hypercoarse Scratches
99.1/237 29.3 ± 2.5 32.0 ± 6.1 1
99.1/283 51.7 ± 10.6 64.7 ± 12.7 0
99.1/319 82.0 ± 14.7 22.7 ± 9.0 3
99.1/330-A 76.7 ± 13.8 51.0± 15.7 0
99.1/441 104.0 ± 5.2 65.7 ± 4.7 0
Mean Tigara Male Feature Counts with Standard Deviation. Those without a standard
deviation reflect the same count numbers during all three sessions.
89
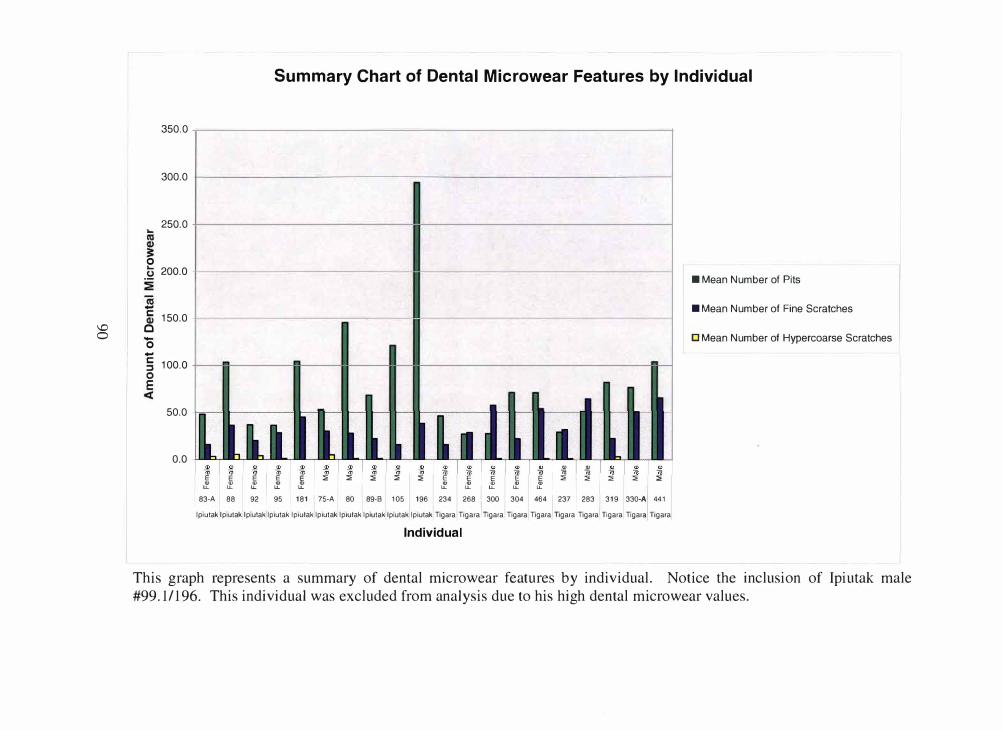
'-D 0
350.0
300.0
.._ 250.0
0
.2 200.0
-
C: CII 150 0 C
0 -
C: 5 100.0
50.0
0.0
Summary Chart of Dental Microwear Features by Individual
2 I 2 EE E
I
E El:. ::.1::. ::;; ::;; E EjE E El� �1::.::;;::;; Q) a> Q) (l) (I) Q) Q) (l) (l) Q)
I � � � � � � � � � �
83-A 88 92 95 181 75-A 80 89-B 105 196 234 268 300 304 464 237 283 319 330-A 441
llp1utak lp,utak lp,utak lp1utakllp1utakllp1utak lp1utak
llp1utak lp,utak lp1utak T1gara T1garalngara T1gara T1gara T1gara T1gara Tigara T,ga,.I T,gara
Individual
■ Mean Number of Pits
■ Mean Number of Fine Scratches
D Mean Number of Hypercoarse Scratches
This graph represents a summary of dental microwear features by individual. Notice the inclusion of Ipiutak male
#99.1/196. This individual was excluded from analysis due to his high dental microwear values.
Am
f
al M
w
ea
•
Appendix C
Results of Two-way Analysis of Variance
91
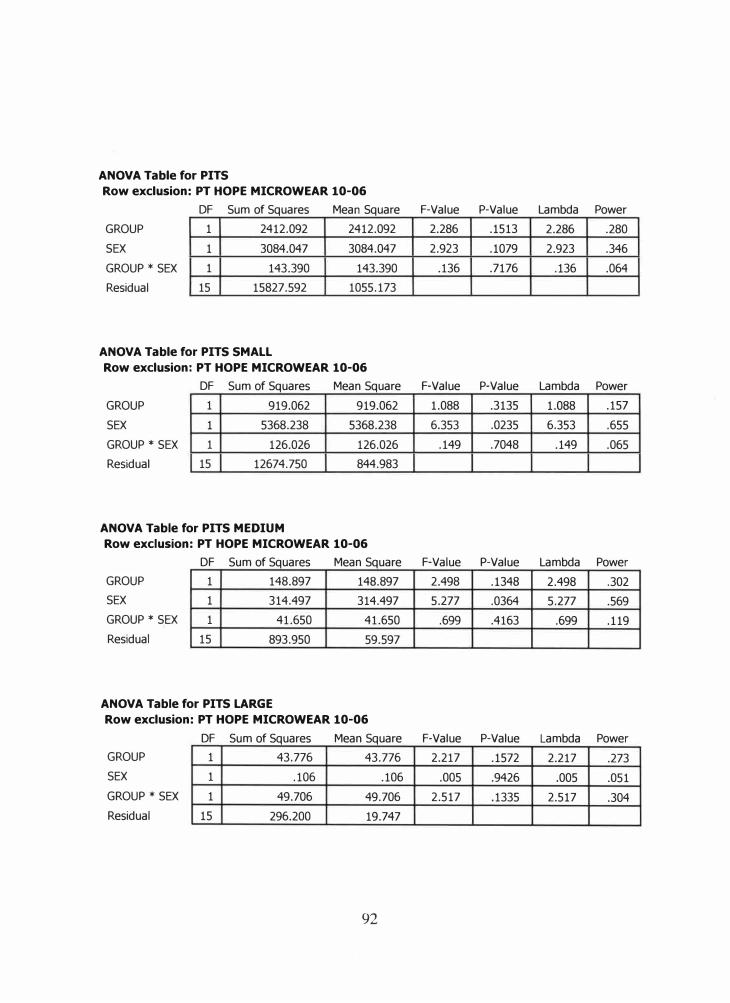
ANOVA Table for PITS
Row exclusion: PT HOPE MICROWEAR 10-06
DF Sum of Squares Mean Square F-Value P-Value Lambda Power
GROUP
SEX
GROUP* SEX
Residual
1
1
1
15
2412.092
3084.047
143.390
15827.592
ANOVA Table for PITS SMALL
2412.092
3084.047
143.390
1055.173
Row exclusion: PT HOPE MICROWEAR 10-06
2.286 .1513 2.286 .280
2.923 .1079 2.923 .346
.136 .7176 .136 .064
DF Sum of Squares Mean Square F-Value P-Value Lambda Power
GROUP
SEX
GROUP* SEX
Residual
1
1
1
15
919.062
5368.238
126.026
12674.750
ANOVA Table for PITS MEDIUM
919.062
5368.238
126.026
844.983
Row exclusion: PT HOPE MICROWEAR 10-06
1.088 .3135 1.088 .157
6.353 .0235 6.353 .655
.149 .7048 .149 .065
DF Sum of Squares Mean Square F-Value P-Value Lambda Power
GROUP
SEX
GROUP* SEX
Residual
1
1
1
15
148.897
314.497
41.650
893.950
ANOVA Table for PITS LARGE
148.897
314.497
41.650
59.597
Row exclusion: PT HOPE MICROWEAR 10-06
2.498 .1348 2.498 .302
5.277 .0364 5.277 .569
.699 .4163 .699 .119
DF Sum of Squares Mean Square F-Value P-Value Lambda Power
GROUP
SEX
GROUP* SEX
Residual
1
1
1
15
43.776 43.776
.106 .106
49.706 49.706
296.200 19.747
92
2.217 .1572 2.217 .273
.005 .9426 .005 .051
2.517 .1335 2.517 .304
11 I I I I I
11 I I I I I
11 I I I I I
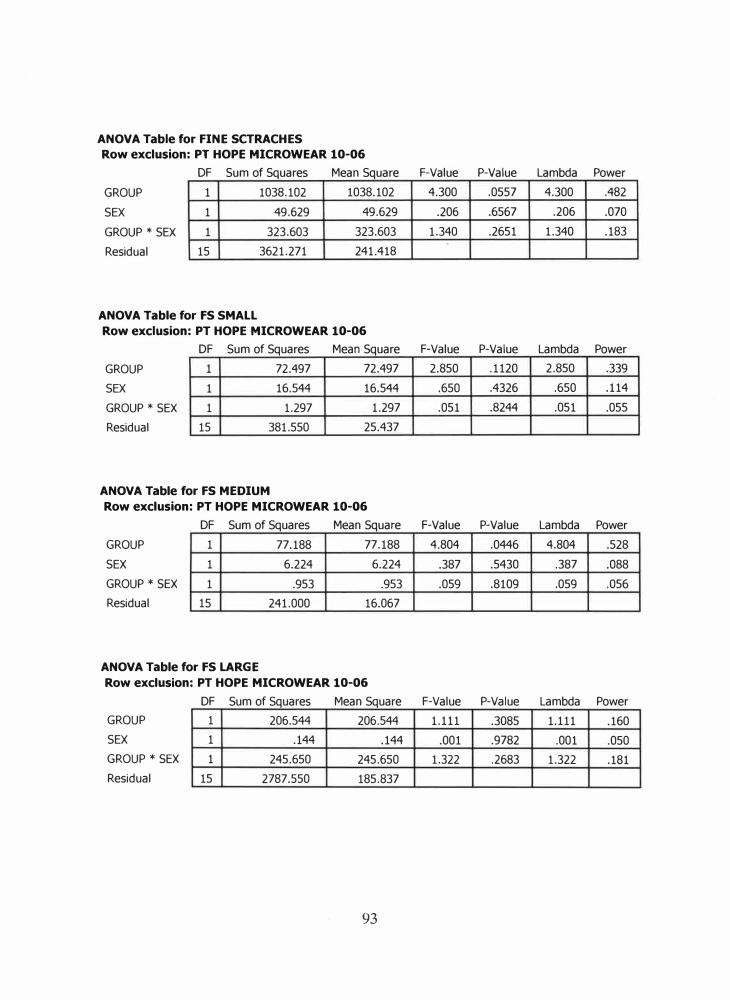
ANOVA Table for FINE SCTRACHES
Row exclusion: PT HOPE MICROWEAR 10-06
DF Sum of Squares Mean Square F-Value P-Value Lambda Power
GROUP
SEX
GROUP* SEX
Residual
1
1
1
15
ANOVA Table for FS SMALL
1038.102 1038.102
49.629 49.629
323.603 323.603
3621.271 241.418
Row exclusion: PT HOPE MICROWEAR 10-06
4.300 .0557 4.300 .482
.206 .6567 .206 .070
1.340 .2651 1.340 .183
DF Sum of Squares Mean Square F-Value P-Value Lambda Power
GROUP
SEX
GROUP* SEX
Residual
1
1
1
15
72.497
16.544
1.297
381.550
ANOVA Table for FS MEDIUM
72.497
16.544
1.297
25.437
Row exclusion: PT HOPE MICROWEAR 10-06
2.850 .1120 2.850 .339
.650 .4326 .650 .114
.051 .8244 .051 .055
DF Sum of Squares Mean Square F-Value P-Value Lambda Power
GROUP
SEX
GROUP* SEX
Residual
1
1
1
15
ANOVA Table for FS LARGE
77.188 77.188
6.224 6.224
.953 .953
241.000 16.067
Row exclusion: PT HOPE MICROWEAR 10-06
4.804 .0446 4.804 .528
.387 .5430 .387 .088
.059 .8109 .059 .056
DF Sum of Squares Mean Square F-Value P-Value Lambda Power
GROUP
SEX
GROUP* SEX
Residual
1
1
1
15
206.544 206.544
.144 .144
245.650 245.650
2787.550 185.837
93
1.111 .3085 1.111 .160
.001 .9782 .001 .050
1.322 .2683 1.322 .181
11 I I I I I
I I I I I I I
11 I I I I I
11 I I I I I

ANOVA Table for HYPERCOARSE SCRATCHES
Row exclusion: PT HOPE MICROWEAR 10-06
DF Sum of Squares Mean Square F-Value P-Value Lambda Power
GROUP
SEX
GROUP* SEX
Residual
1
1
1
15
ANOVA Table for HCS SMALL
12.122 12.122
.306 .306
2.019 2.019
41.462 2.764
Row exclusion: PT HOPE MICROWEAR 10-06
4.386 .0536 4.386 .490
.111 .7439 .111 .061
.730 .4062 .730 .122
DF Sum of Squares Mean Square F-Value P-Value Lambda Power
GROUP
SEX
GROUP* SEX
Residual
1
1
1
15
ANOVA Table for HCS LARGE
1.424
.012
.294
4.600
Row exclusion: PT HOPE MICROWEAR 10-06
1.424 4.642 .0479 4.642 .514
.012 .038 .8473 .038 .054
.294 .959 .3430 .959 .144
.307
DF Sum of Squares Mean Square F-Value P-Value Lambda Power
GROUP
SEX
GROUP* SEX
Residual
1
1
1
15
6.224
.012
.294
34.200
6.224
.012
.294
2.280
94
2.730 .1193 2.730 .326
.005 .9437 .005 .051
.129 .7245 .129 .063
11 I I I I I
11 I I I I I
11 I I I I I