Integumental amino acid uptake in a carnivorous predator mollusc ( Sepia officinalis, Cephalopoda
Upload
independentCategory
view
4download
0
ORIGINAL PAPER
Influence of multi-scale landscape structureon the occurrence of carnivorous mammalsin a human-modified savanna, Brazil
Maria Carolina Lyra-Jorge & Milton Cezar Ribeiro &
Giordano Ciocheti & Leandro Reverberi Tambosi &Vânia Regina Pivello
Received: 24 January 2009 /Revised: 6 August 2009 /Accepted: 17 September 2009# Springer-Verlag 2009
Abstract São Paulo is the most developed state in Braziland contains few fragments of native ecosystems, generallysurrounded by intensive agriculture lands. Despite this,some areas still shelter large native animals. We aimed atunderstanding how medium and large carnivores use amosaic landscape of forest/savanna and agroecosystems,and how the species respond to different landscapeparameters (percentage of landcover and edge density), ina multi-scale perspective. The response variables were:species richness, carnivore frequency and frequency for thethree most recorded species (Puma concolor, Chrysocyonbrachyurus and Leopardus pardalis). We compared 11competing models using Akaike's information criterion(AIC) and assessed model support using weight of AIC.Concurrent models were combinations of landcover types(native vegetation, “cerrado” formations, “cerradão” andeucalypt plantation), landscape feature (percentage of land-cover and edge density) and spatial scale. Herein, spatialscale refers to the radius around a sampling point defining acircular landscape. The scales analyzed were 250 (fine),1,000 (medium) and 2,000 m (coarse). The shape of curvesfor response variables (linear, exponential and power) wasalso assessed. Our results indicate that species with highmobility, P. concolor and C. brachyurus, were best explainedby edge density of the native vegetation at a coarse scale(2,000 m). The relationship between P. concolor and C.
brachyurus frequency had a negative power-shaped responseto explanatory variables. This general trend was alsoobserved for species richness and carnivore frequency.Species richness and P. concolor frequency were also wellexplained by a second concurrent model: edge density ofcerradão at the fine (250 m) scale. A different response wasrecorded for L. pardalis, as the frequency was best explainedfor the amount of cerradão at the fine (250 m) scale. Thecurve of response was linearly positive. The contrastingresults (P. concolor and C. brachyurus vs L. pardalis) maybe due to the much higher mobility of the two first species,in comparison with the third. Still, L. pardalis requireshabitat with higher quality when compared with other twospecies. This study highlights the importance of consideringmultiple spatial scales when evaluating species responses todifferent habitats. An important and new finding was theprevalence of edge density over the habitat extension toexplain overall carnivore distribution, a key information forplanning and management of protected areas.
Keywords Brazilian savanna .Mammal distribution .
Habitat use . Landscape ecology . Habitat heterogeneity
Introduction
The threatening of several biological taxa facing the currentprocess of habitat loss and fragmentation of the naturalenvironments is a common reality worldwide. The way andintensity that native fauna use the remaining native habitats,as well as those altered or created by human, are a relevantmatter to propose actions for biodiversity conservation.
Habitat loss and fragmentation are two importantinteracting processes that play negative impact on biodi-
Communicated by H. Kierdorf
M. C. Lyra-Jorge (*) :M. C. Ribeiro :G. Ciocheti :L. R. Tambosi :V. R. PivelloDepartamento de Ecologia, Universidade de São Paulo,Rua do Matão, Travessa 14, Cidade Universitária,São Paulo, SP, Brazil CEP 05508-900e-mail: [email protected]
Eur J Wildl ResDOI 10.1007/s10344-009-0324-x
versity (Fahrig 2003). Habitat cover and configuration mustbe considered in landscape planning and management forbiodiversity conservation, mainly when natural habitats arehighly fragmented or degraded (Williams et al. 2002;Lindenmayer et al. 2008). Among landscape configurationparameters, connectivity, which measures the capacity ofthe landscape, facilitate or impede biological fluxes (Tayloret al. 1993) is a key issue to understand species flow. Severalstudies have addressed to understand the effect of habitatamount and connectivity on species persistence (Fahrig andMerrian 1994), bird species richness and abundance onfragmented landscapes (Martensen et al. 2008), smallmammals diversity (Umetsu and Pardini 2007), geneticdiversity of toad populations (Dixo et al. 2008) and multi-taxon (trees, birds, mammals and frogs) time-laggedresponse to landscape structure dynamic (Metzger et al.2009). But few efforts have been done to understand howlandscape structure influences medium- and large-sizedmammal's distribution on heterogeneous landscape.
Habitat use by carnivorous mammals in fragmentedlandscapes is quite a well-studied issue, as this group of toppredator species is responsible for important ecologicalprocesses and community regulation (Miller et al. 2001).These species can be used as surrogate on consumer-resource modelling to aid reserve selection design (Rayfieldet al. 2009). Most of these studies concentrate on analyzingthe effects of remaining natural areas (patch size and/orquality) on carnivore populations or the use of such areas asecological corridors (Crooks 2002; Tigas et al. 2002; Hiltyand Merenlender 2004; Michalski and Peres 2005; Miottoet al. 2007). However, few studies have reported hownatural and human-modified landcover/land uses influencethese animals at multiple scales.
The most common landscape pattern typically found inBrazil is composed of remnant native vegetation patchesimmersed in anthropogenic lands (e.g. urban, exurban andagricultural) which comprises the landscape matrix. Theanthropogenic matrix usually acts as a filter to speciesmovement among native habitat patches (Boscolo et al.2008; Hansbauer et al. 2008), thus, the persistence of nativepopulations in fragmented environments greatly depends onthe permeability of such matrices (Antongiovanni andMetzger 2005; Castellon and Sieving 2005; Umetsu andPardini 2007; Boscolo et al. 2008; Uezu et al. 2008).Besides affecting the movement of individuals amonghabitat patches, the quality of the anthropogenic matrix—according to the vital resources it offers—may alsodetermine the individuals permanence time in the landscape(Aberg et al. 1995; Ricketts 2001; Bender and Fahrig 2005;Berry et al. 2005). For instance, high-resource matrices mayperform as habitat for some species, and not only aspassageways connecting habitat patches (Smallwood andFitzhugh 1995; Downes et al. 1997; Vandermeer and
Carvajal 2001; Uezu et al. 2005). As high-quality habitatsare expected to be more intensely used than the poor ones(Garshelis 2000), the intensity of habitat use may indirectlyindicate its environmental quality. Considering the matrix,its intense use may indicate high permeability and therefore,low contrast in terms of resources with the surroundinghabitat.
The spatial scale of the species responses to differentland uses and vegetation types is strongly related to someecological attributes of the community, such as individual'sfrequency, species richness and local diversity, as well as todispersal processes, movement patterns, intensities ofhabitat use and gene flows. The understanding of suchrelationships is fundamental to understand the ecosystemdynamics (Fortin and Dale 2005; Zurlini and Girardin2008; Boscolo and Metzger 2009). Multi-scale effects havebeen explored in aquatic systems (Cassandra et al. 2008),landscape changing patterns (Walz 2008), impact assess-ment on preserved areas (Zaccarelli et al. 2008), birdincidence in fragmented landscapes (Boscolo and Metzger2009) and chironomid taxon associations in neotropicalstreams (Roque et al. (in press)), however has hardly beenaddressed relative to medium and large mammals distribu-tion (but see Comiskey et al. 2002).
In this study, we examined the use of native habitats andcultivated eucalypt forest by the carnivorous species. Weconducted a multiple-model comparison in order to identifyrelationships between the landscape structure (amount andedge density of different landcover category) and speciesdistribution. A multiple-scale approach was applied toidentify the response scales of carnivorous mammals in aregion that at the same time includes one of the largestprotected areas in São Paulo State (Southeastern of Brazil)and a highly fragmented and anthropogenic agriculturalmatrix. Some of these carnivorous species are locallythreatened to extinction (Lyra-Jorge et al. 2008). Theseinformation would be useful for planning and managementactions. More specifically, we pursued the following threeobjectives: (1) to understand the relationship betweenresponse variables (species richness, carnivore frequencyand frequency of Puma concolor, Chrysocyon brachyurusand Leopardus pardalis) and the landscape structure and (2)to assess the effect of different scales (fine=250 m, medium=1,000 m and coarse=2,000 m) on fauna response patterns.
Materials and methods
Study area
This study was conducted in an area of about 47,265 ha, inthe Northeast of São Paulo State, Brazil (Santa Rita doPassa-Quatro and Luiz Antônio municipalities: 21°31′15″S–
Eur J Wildl Res
47°34′42″W; 21°44′24″S–47°52′01″W), limited to the Eastby the Anhangüera highway, and to the South by theMogi-Guaçu River (Fig. 1).
Native vegetation in the region was formerly composedof a natural mosaic of semideciduous forest (interiorAtlantic Forest) and savanna physiognomies (i.e. Cerrado;Shida 2005). Among savanna physiognomies, most of theregion was dominated by the cerradão, a sclerophyllouswoodland, and the cerrado, sensu stricto, a typical savanna(sensu; Coutinho 1978; Oliveira and Marquis 2002).However, due to intense land exploitation, the region haslost most of its original landcover to intensive monospecificplantations, especially of eucalypt, sugarcane and citrus(Brannstrom 2001; Shida 2005; Durigan et al. 2007). Theregion is located at the boundary of Interior Atlantic Forestand Cerrado regions.
According to Ribeiro et al. (2009), only 7.1% of theoriginal forest cover remains on interior forest, with 86% ofpatches smaller than 50 ha. Almost half of the remainingforest is <100 m from its edges and only 0.48% of originalcover of the interior forest are protected as preserves (seeRibeiro et al. 2009 and supplementary material therein).
Two discontinuous reserves exist in the study area whichshelter native vegetation fragments: (1) Jataí Ecological
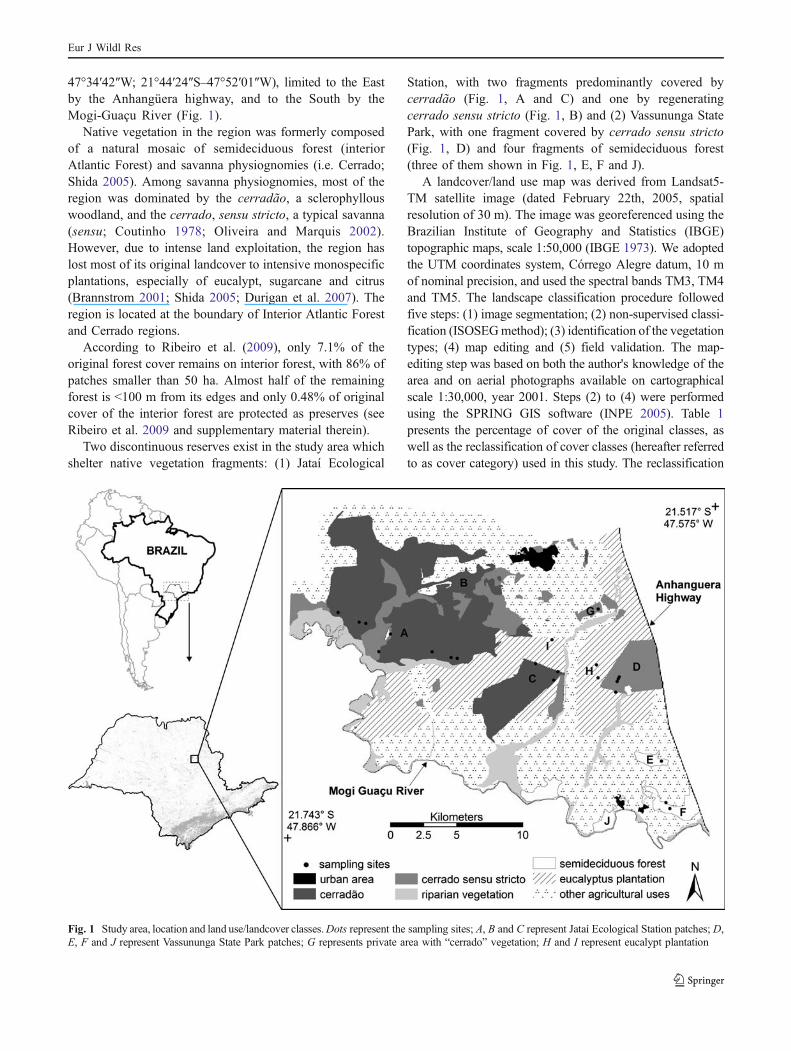
Station, with two fragments predominantly covered bycerradão (Fig. 1, A and C) and one by regeneratingcerrado sensu stricto (Fig. 1, B) and (2) Vassununga StatePark, with one fragment covered by cerrado sensu stricto(Fig. 1, D) and four fragments of semideciduous forest(three of them shown in Fig. 1, E, F and J).
A landcover/land use map was derived from Landsat5-TM satellite image (dated February 22th, 2005, spatialresolution of 30 m). The image was georeferenced using theBrazilian Institute of Geography and Statistics (IBGE)topographic maps, scale 1:50,000 (IBGE 1973). We adoptedthe UTM coordinates system, Córrego Alegre datum, 10 mof nominal precision, and used the spectral bands TM3, TM4and TM5. The landscape classification procedure followedfive steps: (1) image segmentation; (2) non-supervised classi-fication (ISOSEGmethod); (3) identification of the vegetationtypes; (4) map editing and (5) field validation. The map-editing step was based on both the author's knowledge of thearea and on aerial photographs available on cartographicalscale 1:30,000, year 2001. Steps (2) to (4) were performedusing the SPRING GIS software (INPE 2005). Table 1presents the percentage of cover of the original classes, aswell as the reclassification of cover classes (hereafter referredto as cover category) used in this study. The reclassification
Fig. 1 Study area, location and land use/landcover classes.Dots represent the sampling sites; A, B and C represent Jataí Ecological Station patches; D,E, F and J represent Vassununga State Park patches; G represents private area with “cerrado” vegetation; H and I represent eucalypt plantation
Eur J Wildl Res
was performed to generate a new landcover map suitable forthe objectives of this study. Some cover categories take partin more than one concurrent model, as cerradão which wasincluded on models that consider native vegetation, cerradoformations and cerradão per se.
Mammal's survey and species description
We recorded occurrence of carnivore species on 21 pointsdistributed in eight fragments of native vegetation (threeof cerradão, three of cerrado sensu stricto and two ofsemideciduous forest) and two stands of homogenousEucalyptus spp. plantation (Fig. 1).
To estimate habitat use intensity by carnivores, thenumber of species records (hereafter as frequency) wasregistered by camera traps during 18 months (August 2004to January 2006), totalling 12,960 hours of exposure for allsampling points. We randomly selected the sampling sitesconsidering the following pre-requisites: (1) placed alongpre-existing trails or dirt roads, (2) with previously recordedmammals footprints on the ground and (3) protected fromdirect sunshine (as the cameras would set off if exposed tointense heat). Nine cameras were placed in cerradãopatches, six in cerrado sensu stricto patches, two insemideciduous forest patches and four in eucalypt planta-tions (Fig. 1). The cameras were triggered by animal heatand/or movement and remained activated in the fieldthrough the whole sampling period; once a month theywere checked to replace films and batteries.
We chose the three most abundant species (see below) astarget species, as they are on the top of the food web andmust be fundamental to maintain tropic chains (Miller et al.2001; Crooks 2002). Still, these species are included on SãoPaulo State's red list (São Paulo State Decree n.53,494 ofOctober 2nd, 2008).
Selected species
Puma concolor (PUMA, i.e. Cougar): is the second largestfeline within the Americas, and the largest species in the
study region. It may occur in all Brazilian biomes (Oliveiraand Cassaro 1999). This species has a large home rangeand a very high ability to move around (hundreds ofkilometres), especially when dispersing. According tofeeding behaviour, it is a generalist, consuming the mostavailable food items (Moreno et al. 2006).
Chrysocyon brachyurus (CHRYS, i.e Manned wolf) isthe largest South American canid. The individuals aresolitary most of the year except when mating. This is ageneralist species in terms of both food consumptionand habitat usage. Similar to P. concolor, C. brachyurusalso has large home range and is a highly vagile species(Dietz 1984).
Leopardus pardalis (LEOP, i.e. Ocelot) is a medium-sized feline common in the interior (e.g. deciduous andsemi deciduous) forests which feeds mainly on smallmammals and marsupials (Moreno et al. 2006). Thisspecies is very sensitive to habitat loss (Bietti et al. 2006)and generally avoids open areas.
Multi-scaled landscape metrics
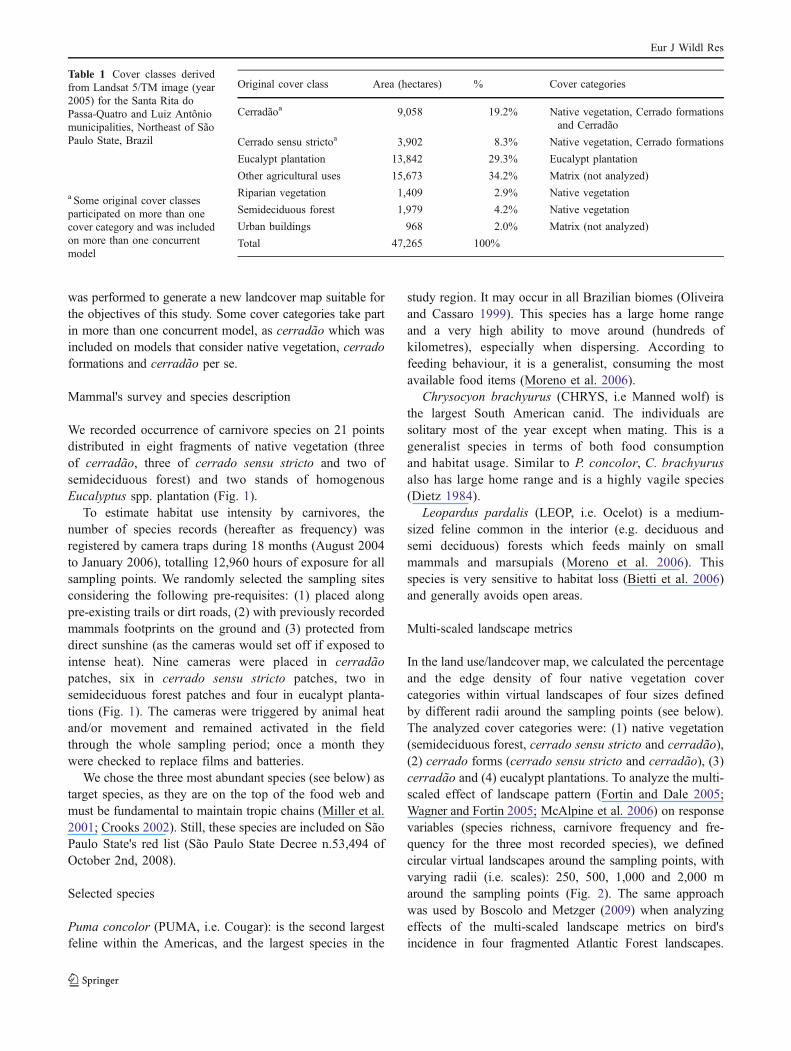
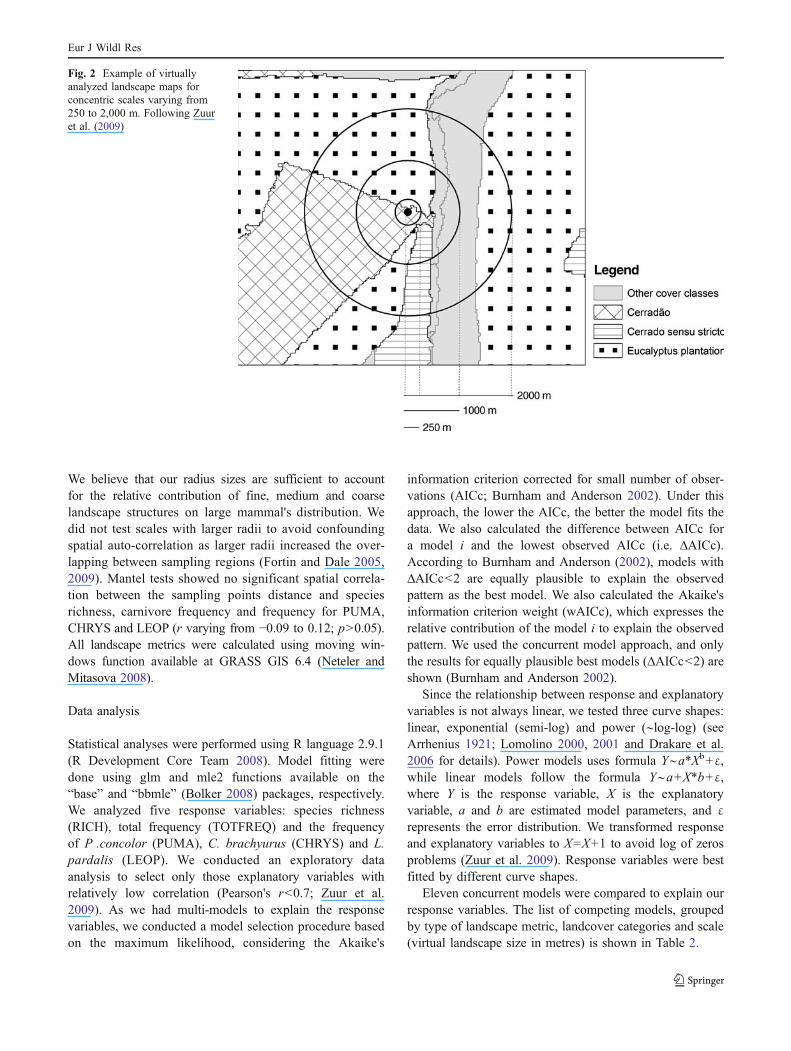
In the land use/landcover map, we calculated the percentageand the edge density of four native vegetation covercategories within virtual landscapes of four sizes definedby different radii around the sampling points (see below).The analyzed cover categories were: (1) native vegetation(semideciduous forest, cerrado sensu stricto and cerradão),(2) cerrado forms (cerrado sensu stricto and cerradão), (3)cerradão and (4) eucalypt plantations. To analyze the multi-scaled effect of landscape pattern (Fortin and Dale 2005;Wagner and Fortin 2005; McAlpine et al. 2006) on responsevariables (species richness, carnivore frequency and fre-quency for the three most recorded species), we definedcircular virtual landscapes around the sampling points, withvarying radii (i.e. scales): 250, 500, 1,000 and 2,000 maround the sampling points (Fig. 2). The same approachwas used by Boscolo and Metzger (2009) when analyzingeffects of the multi-scaled landscape metrics on bird'sincidence in four fragmented Atlantic Forest landscapes.
Original cover class Area (hectares) % Cover categories
Cerradãoa 9,058 19.2% Native vegetation, Cerrado formationsand Cerradão
Cerrado sensu strictoa 3,902 8.3% Native vegetation, Cerrado formations
Eucalypt plantation 13,842 29.3% Eucalypt plantation
Other agricultural uses 15,673 34.2% Matrix (not analyzed)
Riparian vegetation 1,409 2.9% Native vegetation
Semideciduous forest 1,979 4.2% Native vegetation
Urban buildings 968 2.0% Matrix (not analyzed)
Total 47,265 100%
Table 1 Cover classes derivedfrom Landsat 5/TM image (year2005) for the Santa Rita doPassa-Quatro and Luiz Antôniomunicipalities, Northeast of SãoPaulo State, Brazil
a Some original cover classesparticipated on more than onecover category and was includedon more than one concurrentmodel
Eur J Wildl Res
We believe that our radius sizes are sufficient to accountfor the relative contribution of fine, medium and coarselandscape structures on large mammal's distribution. Wedid not test scales with larger radii to avoid confoundingspatial auto-correlation as larger radii increased the over-lapping between sampling regions (Fortin and Dale 2005,2009). Mantel tests showed no significant spatial correla-tion between the sampling points distance and speciesrichness, carnivore frequency and frequency for PUMA,CHRYS and LEOP (r varying from −0.09 to 0.12; p>0.05).All landscape metrics were calculated using moving win-dows function available at GRASS GIS 6.4 (Neteler andMitasova 2008).
Data analysis
Statistical analyses were performed using R language 2.9.1(R Development Core Team 2008). Model fitting weredone using glm and mle2 functions available on the“base” and “bbmle” (Bolker 2008) packages, respectively.We analyzed five response variables: species richness(RICH), total frequency (TOTFREQ) and the frequencyof P .concolor (PUMA), C. brachyurus (CHRYS) and L.pardalis (LEOP). We conducted an exploratory dataanalysis to select only those explanatory variables withrelatively low correlation (Pearson's r<0.7; Zuur et al.2009). As we had multi-models to explain the responsevariables, we conducted a model selection procedure basedon the maximum likelihood, considering the Akaike's
information criterion corrected for small number of obser-vations (AICc; Burnham and Anderson 2002). Under thisapproach, the lower the AICc, the better the model fits thedata. We also calculated the difference between AICc fora model i and the lowest observed AICc (i.e. ∆AICc).According to Burnham and Anderson (2002), models with∆AICc<2 are equally plausible to explain the observedpattern as the best model. We also calculated the Akaike'sinformation criterion weight (wAICc), which expresses therelative contribution of the model i to explain the observedpattern. We used the concurrent model approach, and onlythe results for equally plausible best models (∆AICc<2) areshown (Burnham and Anderson 2002).
Since the relationship between response and explanatoryvariables is not always linear, we tested three curve shapes:linear, exponential (semi-log) and power (∼log-log) (seeArrhenius 1921; Lomolino 2000, 2001 and Drakare et al.2006 for details). Power models uses formula Y∼a*Xb+ε,while linear models follow the formula Y∼a+X*b+ε,where Y is the response variable, X is the explanatoryvariable, a and b are estimated model parameters, and εrepresents the error distribution. We transformed responseand explanatory variables to X=X+1 to avoid log of zerosproblems (Zuur et al. 2009). Response variables were bestfitted by different curve shapes.
Eleven concurrent models were compared to explain ourresponse variables. The list of competing models, groupedby type of landscape metric, landcover categories and scale(virtual landscape size in metres) is shown in Table 2.
Fig. 2 Example of virtuallyanalyzed landscape maps forconcentric scales varying from250 to 2,000 m. Following Zuuret al. (2009)
Eur J Wildl Res
Results
Landcover and species frequencies
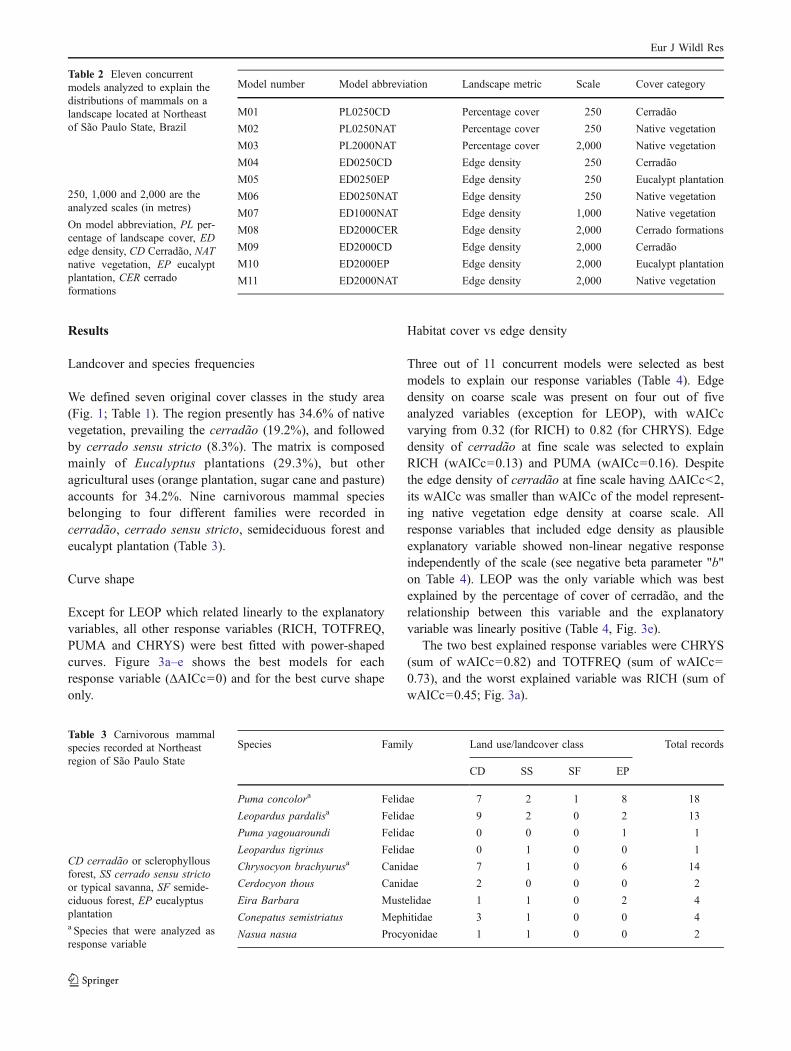
We defined seven original cover classes in the study area(Fig. 1; Table 1). The region presently has 34.6% of nativevegetation, prevailing the cerradão (19.2%), and followedby cerrado sensu stricto (8.3%). The matrix is composedmainly of Eucalyptus plantations (29.3%), but otheragricultural uses (orange plantation, sugar cane and pasture)accounts for 34.2%. Nine carnivorous mammal speciesbelonging to four different families were recorded incerradão, cerrado sensu stricto, semideciduous forest andeucalypt plantation (Table 3).
Curve shape
Except for LEOP which related linearly to the explanatoryvariables, all other response variables (RICH, TOTFREQ,PUMA and CHRYS) were best fitted with power-shapedcurves. Figure 3a–e shows the best models for eachresponse variable (∆AICc=0) and for the best curve shapeonly.
Habitat cover vs edge density
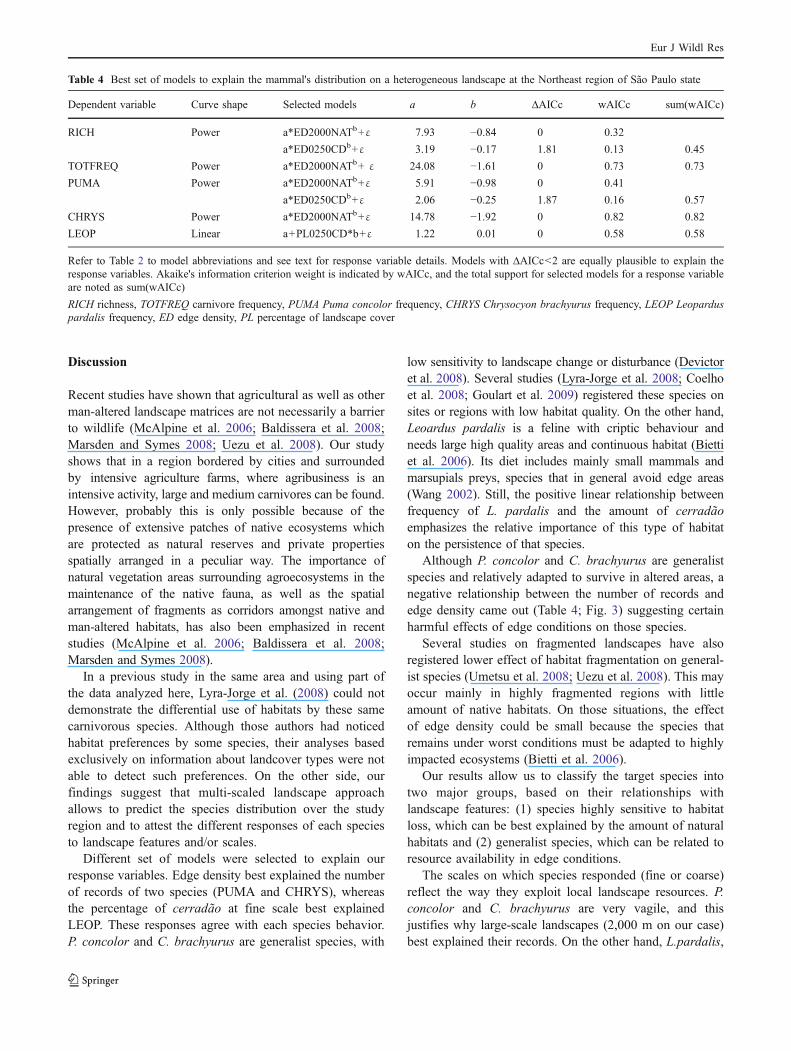
Three out of 11 concurrent models were selected as bestmodels to explain our response variables (Table 4). Edgedensity on coarse scale was present on four out of fiveanalyzed variables (exception for LEOP), with wAICcvarying from 0.32 (for RICH) to 0.82 (for CHRYS). Edgedensity of cerradão at fine scale was selected to explainRICH (wAICc=0.13) and PUMA (wAICc=0.16). Despitethe edge density of cerradão at fine scale having ∆AICc<2,its wAICc was smaller than wAICc of the model represent-ing native vegetation edge density at coarse scale. Allresponse variables that included edge density as plausibleexplanatory variable showed non-linear negative responseindependently of the scale (see negative beta parameter "b"on Table 4). LEOP was the only variable which was bestexplained by the percentage of cover of cerradão, and therelationship between this variable and the explanatoryvariable was linearly positive (Table 4, Fig. 3e).
The two best explained response variables were CHRYS(sum of wAICc=0.82) and TOTFREQ (sum of wAICc=0.73), and the worst explained variable was RICH (sum ofwAICc=0.45; Fig. 3a).
Model number Model abbreviation Landscape metric Scale Cover category
M01 PL0250CD Percentage cover 250 Cerradão
M02 PL0250NAT Percentage cover 250 Native vegetation
M03 PL2000NAT Percentage cover 2,000 Native vegetation
M04 ED0250CD Edge density 250 Cerradão
M05 ED0250EP Edge density 250 Eucalypt plantation
M06 ED0250NAT Edge density 250 Native vegetation
M07 ED1000NAT Edge density 1,000 Native vegetation
M08 ED2000CER Edge density 2,000 Cerrado formations
M09 ED2000CD Edge density 2,000 Cerradão
M10 ED2000EP Edge density 2,000 Eucalypt plantation
M11 ED2000NAT Edge density 2,000 Native vegetation
Table 2 Eleven concurrentmodels analyzed to explain thedistributions of mammals on alandscape located at Northeastof São Paulo State, Brazil
250, 1,000 and 2,000 are theanalyzed scales (in metres)
On model abbreviation, PL per-centage of landscape cover, EDedge density, CD Cerradão, NATnative vegetation, EP eucalyptplantation, CER cerradoformations
Species Family Land use/landcover class Total records
CD SS SF EP
Puma concolora Felidae 7 2 1 8 18
Leopardus pardalisa Felidae 9 2 0 2 13
Puma yagouaroundi Felidae 0 0 0 1 1
Leopardus tigrinus Felidae 0 1 0 0 1
Chrysocyon brachyurusa Canidae 7 1 0 6 14
Cerdocyon thous Canidae 2 0 0 0 2
Eira Barbara Mustelidae 1 1 0 2 4
Conepatus semistriatus Mephitidae 3 1 0 0 4
Nasua nasua Procyonidae 1 1 0 0 2
Table 3 Carnivorous mammalspecies recorded at Northeastregion of São Paulo State
CD cerradão or sclerophyllousforest, SS cerrado sensu strictoor typical savanna, SF semide-ciduous forest, EP eucalyptusplantationa Species that were analyzed asresponse variable
Eur J Wildl Res
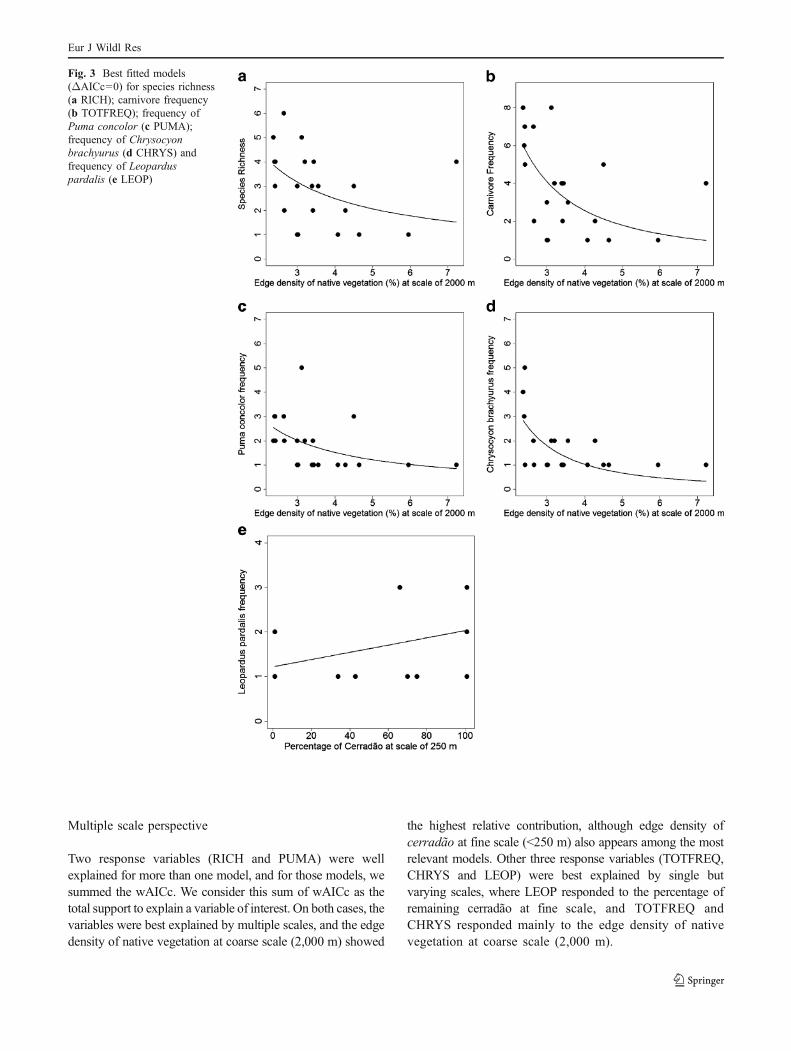
Multiple scale perspective
Two response variables (RICH and PUMA) were wellexplained for more than one model, and for those models, wesummed the wAICc. We consider this sum of wAICc as thetotal support to explain a variable of interest. On both cases, thevariables were best explained by multiple scales, and the edgedensity of native vegetation at coarse scale (2,000 m) showed
the highest relative contribution, although edge density ofcerradão at fine scale (<250 m) also appears among the mostrelevant models. Other three response variables (TOTFREQ,CHRYS and LEOP) were best explained by single butvarying scales, where LEOP responded to the percentage ofremaining cerradão at fine scale, and TOTFREQ andCHRYS responded mainly to the edge density of nativevegetation at coarse scale (2,000 m).
Fig. 3 Best fitted models(ΔAICc=0) for species richness(a RICH); carnivore frequency(b TOTFREQ); frequency ofPuma concolor (c PUMA);frequency of Chrysocyonbrachyurus (d CHRYS) andfrequency of Leoparduspardalis (e LEOP)
Eur J Wildl Res
Discussion
Recent studies have shown that agricultural as well as otherman-altered landscape matrices are not necessarily a barrierto wildlife (McAlpine et al. 2006; Baldissera et al. 2008;Marsden and Symes 2008; Uezu et al. 2008). Our studyshows that in a region bordered by cities and surroundedby intensive agriculture farms, where agribusiness is anintensive activity, large and medium carnivores can be found.However, probably this is only possible because of thepresence of extensive patches of native ecosystems whichare protected as natural reserves and private propertiesspatially arranged in a peculiar way. The importance ofnatural vegetation areas surrounding agroecosystems in themaintenance of the native fauna, as well as the spatialarrangement of fragments as corridors amongst native andman-altered habitats, has also been emphasized in recentstudies (McAlpine et al. 2006; Baldissera et al. 2008;Marsden and Symes 2008).
In a previous study in the same area and using part ofthe data analyzed here, Lyra-Jorge et al. (2008) could notdemonstrate the differential use of habitats by these samecarnivorous species. Although those authors had noticedhabitat preferences by some species, their analyses basedexclusively on information about landcover types were notable to detect such preferences. On the other side, ourfindings suggest that multi-scaled landscape approachallows to predict the species distribution over the studyregion and to attest the different responses of each speciesto landscape features and/or scales.
Different set of models were selected to explain ourresponse variables. Edge density best explained the numberof records of two species (PUMA and CHRYS), whereasthe percentage of cerradão at fine scale best explainedLEOP. These responses agree with each species behavior.P. concolor and C. brachyurus are generalist species, with
low sensitivity to landscape change or disturbance (Devictoret al. 2008). Several studies (Lyra-Jorge et al. 2008; Coelhoet al. 2008; Goulart et al. 2009) registered these species onsites or regions with low habitat quality. On the other hand,Leoardus pardalis is a feline with criptic behaviour andneeds large high quality areas and continuous habitat (Biettiet al. 2006). Its diet includes mainly small mammals andmarsupials preys, species that in general avoid edge areas(Wang 2002). Still, the positive linear relationship betweenfrequency of L. pardalis and the amount of cerradãoemphasizes the relative importance of this type of habitaton the persistence of that species.
Although P. concolor and C. brachyurus are generalistspecies and relatively adapted to survive in altered areas, anegative relationship between the number of records andedge density came out (Table 4; Fig. 3) suggesting certainharmful effects of edge conditions on those species.
Several studies on fragmented landscapes have alsoregistered lower effect of habitat fragmentation on general-ist species (Umetsu et al. 2008; Uezu et al. 2008). This mayoccur mainly in highly fragmented regions with littleamount of native habitats. On those situations, the effectof edge density could be small because the species thatremains under worst conditions must be adapted to highlyimpacted ecosystems (Bietti et al. 2006).
Our results allow us to classify the target species intotwo major groups, based on their relationships withlandscape features: (1) species highly sensitive to habitatloss, which can be best explained by the amount of naturalhabitats and (2) generalist species, which can be related toresource availability in edge conditions.
The scales on which species responded (fine or coarse)reflect the way they exploit local landscape resources. P.concolor and C. brachyurus are very vagile, and thisjustifies why large-scale landscapes (2,000 m on our case)best explained their records. On the other hand, L.pardalis,
Table 4 Best set of models to explain the mammal's distribution on a heterogeneous landscape at the Northeast region of São Paulo state
Dependent variable Curve shape Selected models a b ∆AICc wAICc sum(wAICc)
RICH Power a*ED2000NATb+ε 7.93 −0.84 0 0.32
a*ED0250CDb+ε 3.19 −0.17 1.81 0.13 0.45
TOTFREQ Power a*ED2000NATb+ ε 24.08 −1.61 0 0.73 0.73
PUMA Power a*ED2000NATb+ε 5.91 −0.98 0 0.41
a*ED0250CDb+ε 2.06 −0.25 1.87 0.16 0.57
CHRYS Power a*ED2000NATb+ε 14.78 −1.92 0 0.82 0.82
LEOP Linear a+PL0250CD*b+ε 1.22 0.01 0 0.58 0.58
Refer to Table 2 to model abbreviations and see text for response variable details. Models with ∆AICc<2 are equally plausible to explain theresponse variables. Akaike's information criterion weight is indicated by wAICc, and the total support for selected models for a response variableare noted as sum(wAICc)
RICH richness, TOTFREQ carnivore frequency, PUMA Puma concolor frequency, CHRYS Chrysocyon brachyurus frequency, LEOP Leoparduspardalis frequency, ED edge density, PL percentage of landscape cover
Eur J Wildl Res
which has movement capability five folder less than P.concolor or C. brachyurus (Aragona and Setz 2001), wasbest explained by fine-scale features (250 m). We highlightthat the movement ability of a species can influence itspersistence in the landscape because it is related to foodsearch, resting places finding and escaping from humans.
In conclusion, this study shows the importance ofincluding landscape spatial parameters when consideringthe use of habitats by fauna. Since large and mediumcarnivores are usually territorial animals, the understandingof how species interact with different landscape structures atdifferent scales can drive both conservation and restorationprogrammes. Although the amount of remaining habitatplays an important role for highly sensitive species (likeL. pardalis), our results suggest that the density of edgesmay prevail over habitat quantity in favour of generalistspecies frequency. Finally, our results emphasize theimportance of considering multi-species (or multi-taxa) astarget when planning landscape management actions, andhighlight the importance of multiple-scale perspective forunderstanding the ecological patterns and processes rela-tionship in the natural systems (Fortin and Dale 2005;Boscolo and Metzger 2009).
Acknowledgments The authors are thankful to Dr. Carlos AlbertoVettorazzi for his suggestions on a previous phase of this study and toNeotropical Grassland Conservancy and CNPQ for financial support.We are also very thankful to Patrick James, Danilo Boscolo and TadeuSiqueira for their contributions in a later version of the paper. MCRthanks to Jean Paul Metzger's and Marie-Josee Fortin's researchgroups for all valuable discussions on landscape ecology andbiodiversity conservation fields.
References
Aberg J, Jansson G, Swenson JE, Angelstam P (1995) The effect ofmatrix on the occurrence of hazel grouse in isolated habitatfragments. Oecologia 103:265–269
Antongiovanni M, Metzger JP (2005) Influence of matrix habitats onthe occurrence of insectivorous bird species in Amazonian forestfragments. Biol Conserv 122:441–451
Aragona M, Setz EZ (2001) Diet of the maned wolf, during wetand dry seasons at Ibitipoca state park. Brazil J Zool 254(1):131–136
Arrhenius O (1921) Species and area. J Ecol 9:95–99Baldissera R, Ganade G, Brescovit AD, Hartz SM (2008) Landscape
mosaic of Araucaria forest and forest monocultures influencingunderstorey spider assemblages in southern Brazil. Austral Ecol33:45–54
Bender DJ, Fahrig L (2005) Matrix structure obscures the relationshipbetween interpatch movement and patch size and isolation.Ecology 86:1023–1033
Berry O, Mandy T, Gleeson DM, Sarres D (2005) Effect of vegetationmatrix on animal dispersal: genetic evidence from a study ofendangered skinks. Conserv Biol 19:855–864
Bietti MS, Paviolo A, Ângelo D (2006) Density, habitat use andactivity patterns of ocelots in the Atlantic Forest of Missiones,Argentina. J Zool 270(1):153–163
Bolker B (2008) Ecological Models and Data in R, 516p availableat http://www.zoo.ufl.edu/bolker/emdbook. Accessed 22 April2008
Boscolo D, Metzger JP (2009) Is bird incidence in Atlantic forestfragments influenced by landscape patterns at multiple scales?Landscape Ecology. doi:10.1007/s10980-009-9370-8, 12p
Boscolo D, Candia-Gallardo C, Awade M, Metzger JP (2008)Importance of inter-habitat gaps and stepping-stones for a birdspecies in the Atlantic Forest, Brazil. Biotropica 40:273–276
Brannstrom C (2001) Conservation-with-development models inBrazil's agro-pastoral landscapes. World Dev 29:1345–1359
Burnham KP, Anderson DR (2002) Model selection and multimodelinference. A practical information—theoretical approach. Springer,New York
Cassandra LT, Zhang L, Mitsch WJ (2008) Aquatic metabolism as anindicator on the ecological effects of hydrologic pulsing in flow-through wetlands. Ecol Indic (2008). doi:10.1016/j.ecolind.2007.09.005
Castellon TD, Sieving KE (2005) An experimental test of matrixpermeability and corridor use by and endemic understory bird.Conserv Biol 20:135–145
Coelho CM, Melo FB, Sábato AL, Magni EMV, Hirsch A, Young RJ(2008) Habitat use by wild maned wolves (Chrysocyon brachyurus)in a transition zone environment. J Mammal 89:97–104
Comiskey EJ, Bass Jr OL, Gross LJ, McBride RT, Salinas R (2002)Panthers and Forests in South Florida: an Ecological Perspective.Conservation Ecology 6(1): 18. Available at http://www.consecol.org/vol6/iss1/art18. Accessed 1 August 2009
Coutinho LM (1978) O conceito de cerrado. Rev Bras Bot 1:17–23Crooks K (2002) Relative sensitivities of mammalian carnivores to
habitat fragmentation. Conserv Biol 16:488–502Devictor V, Julliard R, Jiguet F (2008) Distribution of specialist and
generalist species along spatial gradients of habitat disturbanceand fragmentation. Oikos 117(4):507–514
Dietz JM (1984) Ecology and social organization of the maned wolf(Chrysocyon brachyurus). Smithson Contrib Zool 392:1–51
Dixo M, Metzger J, Morgante J, Zamudio K (2008) Habitatfragmentation reduces genetic diversity and connectivity amongtoad populations in the Brazilian Atlantic Coastal Forest. BiolConserv 142:1560–1569
Downes SJ, Handasyde KA, Elgar MA (1997) The use of corridors bymammals in fragmented Australian eucalypt forests. ConservBiol 11:718–726
Drakare S, Lennon JJ, Hillebrand H (2006) The imprint of thegeographical, evolutionary and ecological context on species-arearelationships. Ecol Lett 9(2):215–227
Durigan G, Siqueira MF, Franco GADC (2007) Threats to thecerrado remnants of the state of São Paulo, Brazil. Sci Agric64:366–363
Fahrig L (2003) Effects of habitat fragmentation on biodiversity. AnnRev Ecol Evol Syst 34:487–515
Fahrig L, Merriam G (1994) Conservation of fragmented populations.Conserv Biol 8:50–59
Fortin MJ, Dale MRT (2005) Spatial analysis: a guide for ecologists.Cambridge University Press, Cambridge
Fortin MJ, Dale MRT (2009) Spatial autocorrelation in ecological studies—a legacy of solutions and myths. Geogr Anal 41:392–396
Garshelis DL (2000) Delusions in habitat evaluation: measuring use,selection and importance. Research techniques in animal ecology:controversies and consequences. Columbia University Press, NewYork, pp 111–164
Goulart FVB, Cáceres NC, Graipel ME, Tortato MA, Ghizoni IR,Oliveira-Santos LGR (2009) Habitat selection by large mammals ina southern Brazilian atlantic forest. Mamm Biol 74(3):182–190
Hansbauer MM, Storch I, Leu S, Nieto-Holguin J-P, PimentelRG KF,Metzger JP (2008) Movements of neotropical understory passerines
Eur J Wildl Res
affected by anthropogenic forest edges in the Brazilian AtlanticRainforest. Biol Conserv 141:782–791
Hilty JA, Merenlender AM (2004) Use of riparian Corridors andvineyards by mammalian predators in Northern California.Conserv Biol 18:126–135
IBGE-Instituto Brasileiro de Geografia e Estatística (1973) CartasTopográficas Luis Pulador (folha SF-22-Z-B-IV-3). IBGE, Rio deJaneiro
INPE—Instituto Nacional de Pesquisas Espaciais (2005) SPRING—Sistema de Processamento de Informações Georreferenciadas, version4.1. Available at <www.dpi.inpr.br/spring>. Accessed 01 June 2005
Lindenmayer D, Hobbs RJ, Montague-Drake R, Alexandra J, Bennett A,Burgman M, Cale P, Calhoun A, Cramer V, Cullen P, Driscoll D,Fahrig L, Fischer J, Franklin J, Haila Y, Hunter M, Gibbons P, LakeS, Luck G, MacGregor C, McIntyre S, Mac Nally R, Manning A,Miller J, Mooney H, Noss R, Possingham H, Saunders D,Schmiegelow F, Scott M, Simberloff D, Sisk T, Tabor G, WalkerB,Wiens J,Woinarski J, Zavaleta E (2008) A checklist for ecologicalmanagement of landscape for conservation. Ecol Lett 11:78–91
Lomolino MV (2000) Ecology's most general, yet protean pattern: thespecies–area relationship. J Biogeogr 27(1):17–26
Lomolino MV (2001) The species–area relationship: new challengesfor an old pattern. Progr Phys Geogr 25(1):1–21
Lyra-Jorge MC, Ciocheti G, Pivello VR (2008) Carnivore mammals ina fragmented landscape in northeast of São Paulo State, Brazil.Biodivers Conserv 17:1573–1580
Marsden SJ, Symes CT (2008) Bird richness and composition along anagricultural gradient in New Guinea: the influence of land use, habitatheterogeneity and proximity to intact forest. Austral Ecol 33:784–793
Martensen AC, Pimentel RG, Metzger JP (2008) Relative effects offragment size and connectivity on bird community in the AtlanticRain Forest: implications for conservation. Biol Conserv141:2184–2192
McAlpine CA, Bowen ME, Callaghan JG, Lunney D, Rhodes JR,Mitchell DL, Pullar DV, Poszingham HP (2006) Testingalternative models for the conservation of Koalas in fragmentedrural–urban landscapes. Austral Ecol 31:529–544
Metzger JP, Martensen AC, Dixo M, Bernacci LC, Ribeiro MC,Teixeira AMG, Pardini R (2009) Time-lag in biologicalresponses to landscape changes in a highly dynamic Atlanticforest region. Biol Conserv 142:1180–1191
Michalski F, Peres CA (2005) Anthropogenic determinants of primateand carnivore local extinctions in a fragmented forest landscapeof southern Amazonia. Biol Conserv 124:383–396
Miller B, Dugelby B, Foreman D, Del Rio CM, Noss R, Phillips M,Readding R, Soulé ME, Terborgh J, Willcox L (2001) Theimportance of large carnivores to healthy ecosystems. EndangSpec UPDATE 18:202–210
Miotto RA, Pacheco FR, Ciocheti G, Galetti PM Jr (2007)Determination of the minimum population size of pumas (Pumaconcolor) through faecal DNA analysis in two protected cerradoareas in the Brazilian Southeast. Biotropica 39:647–654
Moreno RS, Kays RW, Samudio R Jr (2006) Competitive release indiets of ocelot (Leopardus pardalis) and puma (Puma concolor)after jaguar (Panthera onca) decline. J Mammal 84:808–816
NetelerM,MitasovaH (2008) Open SourceGIS: a GRASSGIS approach.Springer, LLC, 3rd edn, p 406. Springer Science+Business Media,LCC, 233 Spring Street, New York, NY 10013, USA
Oliveira TG, Cassaro K (1999) Guia de identificação dos felinosbrasileiros, 2nd edn. Sociedade dos Zoológicos do Brasil, SãoPaulo, p 60
Oliveira PS, Marquis RJ (2002) The cerrados os Brazil. Ecology andNatural history of a neotropical Savanna. Columbia UniversityPress, New York
R Development Core Team (2008) R: a language and environmentalfor statistical computing. R Foundation for Statistical Computing,Vienna, Austria. ISBN 3- 900051-07-0. Available at <http://www.r-project.org>. Accessed 1 August 2009
Rayfield B, Moilanen A, Fortin M-J (2009) Incorporating consumer-resource spatial interactions in reserve design. Ecol Modell220:725–733
Ribeiro MC, Metzger JP, Ponzoni F, Martensen AC, Hirota M (2009)Brazilian Atlantic forest: how much is left and how the remainingforest is distributed? Implications for conservation. Biol Conserv142:1141–1153
Ricketts TH (2001) The matrix matters: effective isolation infragmented landscapes. Am Nat 158:87–99
Roque FO, Siqueira T, Bini LM, Ribeiro MC, Tambosi LR, CiochetiG, Trivino-Strixino S Untangling chironomid taxon associationsin Neotropical streams using local and landscape filters.Freshwater Biology (in press)
Shida CN (2005) Evolução do uso da terras na região. In: Pivello VR,Varanda E (eds) O Cerrado Pé-de-Gigante. Parque Estadual deVassununga—Ecologia e Conservação. Secretaria de Estado doMeio Ambiente, São Paulo, pp 30–42
Smallwood KS, Fitzhugh EL (1995) A track count for estimatingmountain lion Felis concolor californica population trend. BiolConserv 71:251–259
Taylor PD, Fahrig L, Henein K, Merriam G (1993) Connectivity is avital element of landscape structure. Oikos 68:571–573
Tigas LA, Van Vuren DH, Sauvajot RM (2002) Behavioral responsesof bobcats and coyotes to habitat fragmentation and corridors inan urban environment. Biol Conserv 108:299–306
Uezu A, Metzger JP, Vielliard JM (2005) Effects of structural andfunctional connectivity and patch size on the abundance of sevenAtlantic forest bird species. Biol Conserv 123:507–519
Uezu A, Beyer DD, Metzger JP (2008) Can agroforest woodlots workas stepping stones for birds in the Atlantic forest region? BiodivConserv 17:1907–1922
Umetsu F, Pardini R (2007) Small mammals in a mosaic of forestremnants and anthropogenic habitats—evaluating matrix qualityin an Atlantic forest landscape. Landsc Ecol 22:517–530
Umetsu F, Metzger JP, Pardini R (2008) Importance of estimatingmatrix quality for modeling species distribution in complextropical landscapes: a test with Atlantic forest small mammals.Ecography 31:359–370
Vandermeer J, Carvajal R (2001) Metapopulation dynamics and thequality of the matrix. Am Nat 158:211–220
Wang E (2002) Diets of acelots, margays and oncillas in the Atlanticrainforest in southeast Brazil. Stud Neotrop Faun Environ 37(3):207–212
Wagner HH, Fortin MJ (2005) Spatial analysis of landscape: conceptsand statistics. Ecology 86:1975–1987
Walz U (2008) Monitoring landscape change and functions in Saxony(Eastern Germany)—methods and indicators. Ecol Indic (2008).doi:10.1016/j.ecolind.2006.12.002
Williams PH, Margules CR, Wilbert DW (2002) Data requirementsand data sources for biodiversity priority area selection. Journalof Bioscience 27:327–338
Zaccarelli N, Riiters KH, Petrosillo I, Zurlini G (2008) Indicatingdisturbance contend and context for preserved areas. Ecol Indic(2008). doi:10.1016/j.ecolind.2007.01.010
Zurlini G, Girardin P (2008) Introduction of the special issue on“Ecological Indicators at multiple scales”. Ecol Indic (2008),doi.10.1016/j.ecolind.2007.12.003
Zuur AG, Ieno EN, Walker NJ, Savaliev AA, Smith GM (2009)Mixed effects models and extensions in ecology with r. Springer,New York, USA, p 574
Eur J Wildl Res
Copyright © 2022 FDOKUMEN