Experimental study on the fracture of lightly reinforced concrete elements subjected to eccentric...
16
1 23 Materials and Structures ISSN 1359-5997 Mater Struct DOI 10.1617/s11527-014-0476-3 Experimental study on the fracture of lightly reinforced concrete elements subjected to eccentric compression Rocío Porras, Jacinto R. Carmona, Rena C. Yu & Gonzalo Ruiz
Transcript of Experimental study on the fracture of lightly reinforced concrete elements subjected to eccentric...
1 23
Materials and Structures ISSN 1359-5997 Mater StructDOI 10.1617/s11527-014-0476-3
Experimental study on the fracture oflightly reinforced concrete elementssubjected to eccentric compression
Rocío Porras, Jacinto R. Carmona, RenaC. Yu & Gonzalo Ruiz

1 23
Your article is protected by copyright and all
rights are held exclusively by RILEM. This e-
offprint is for personal use only and shall not
be self-archived in electronic repositories. If
you wish to self-archive your article, please
use the accepted manuscript version for
posting on your own website. You may
further deposit the accepted manuscript
version in any repository, provided it is only
made publicly available 12 months after
official publication or later and provided
acknowledgement is given to the original
source of publication and a link is inserted
to the published article on Springer's
website. The link must be accompanied by
the following text: "The final publication is
available at link.springer.com”.
ORIGINAL ARTICLE
Experimental study on the fracture of lightly reinforcedconcrete elements subjected to eccentric compression
Rocıo Porras • Jacinto R. Carmona •
Rena C. Yu • Gonzalo Ruiz
Received: 29 December 2013 / Accepted: 24 November 2014
� RILEM 2014
Abstract The objective of this work is to study the
structural response of lightly reinforced concrete
elements under eccentric compression from an exper-
imental perspective. Given the difficulty of testing
elements of a large slenderness ratio, an experimental
campaign was carried out on columns of reduced size
to facilitate material control and specimen handling, as
well as to minimize the data scattering. Fifty-four
micro-concrete specimens were tested to study the
influence of reinforcement amount, slenderness ratio
and load eccentricity. The applied load and the
horizontal displacement at mid-span of the specimen
(the additional eccentricity) were measured during the
entire loading process, including the post-peak stage.
At the same time, independent coupon tests were
conducted for material characterization. Based on this
study, a brittle–ductile classification according to the
slenderness ratio and the initial load eccentricity is
proposed. Meanwhile a methodology to evaluate the
minimum reinforcement amount for reinforced con-
crete elements subjected to eccentric compression is
formulated. In addition, the experimental results
provide a valid source for modeling the behavior of
lightly reinforced concrete elements subjected to
eccentric compression.
Keywords Lightly reinforced concrete �Slenderness ratio � Brittle–ductile transition �Additional eccentricity
List of symbols
A Cross-section area, A ¼ bh
As Cross-section area of the steel bars
b Cross-section width (dimension in z-axis)
d Loading point displacement
ea Additional eccentricity at the midspan of the
specimen
e0 Initial load eccentricity
eT Total load eccentricity, eT ¼ e0 þ ea
eal Eccentricity at the linearity limit
E Elastic modulus of concrete
Es Nominal elastic modulus of steel rebar
fc Concrete compressive strength
ft Tensile strength of concrete
fR Flexural strength of the element section
fy Steel yield strength
GF Specific fracture energy
h Specimen thickness (cross-section depth,
dimension in y-axis)
H Specimen height (dimension in the longitudinal
direction, x-axis)
Iy Moment of inertia of the section with respect to
the y-axis
‘ch Characteristic length ‘ch ¼ EGF
f 2t
Lp Effective length for calculating the slenderness
ratio, k
R. Porras � J. R. Carmona � R. C. Yu (&) � G. Ruiz
Universidad de Castilla-La Mancha (UCLM), Avda.
Camilo Jose Cela s/n, 13071 Ciudad Real, Spain
e-mail: [email protected]
Materials and Structures
DOI 10.1617/s11527-014-0476-3
Author's personal copy
m Slope of the straight line of ea=e0 as a function
of qp Perimeter of the steel bars
P Applied load
P� External load normalized by the section
capacity for compression PAfc
W Section elastic modulus Iy=ðh=2Þz Mechanical arm of the section
bH Hillerborg’s brittleness number, bH ¼ H‘ch
eu Steel ultimate strain
g Non-dimensional bond strength of the concrete-
steel interface
k Slenderness ratio
kinf Lower limit of the slenderness ratio, beyond
which secondary effects need to be taken into
account
q Reinforcement ratio q ¼ As
A
r0:2 0.2 % Offset yield strength
ru Steel ultimate strength
sc Bond strength of the concrete-steel interface
1 Introduction
The failure of reinforced concrete (RC) slender
elements, such as columns or panels, is a complex
phenomenon. This is due to the material and geomet-
rical nonlinearities involved [1], the bond deteriora-
tion between the concrete bulk and the steel rebar [2],
the effect of creep [3–5] as well as the cracking and
compressive damage in concrete [6]. All the men-
tioned factors can lead to stiffness reduction of the
column, which in turn exerts a great influence on its
buckling failure due to second-order effects [1, 7, 8].
Compressive failure in structural concrete elements
has been addressed experimentally in the literature by
several authors from different perspectives. In 1994,
Bazant and Kwon [9] studied the size effect in the
failure of columns. Shortly after that, in 1997, Kim and
Yang [10] tested 30 columns made of reinforced high
strength concrete (HSC). By changing the slenderness
ratio, concrete strength and reinforcement ratio, they
drew the main conclusion that the use of HSC improves
the capacity for more stocky columns but has almost no
influence on that of the slender ones. In the same year,
Foster and Attard [11] observed that the ductility of the
column is related to the transverse reinforcement, and
that the effectiveness of this reinforcement is strongly
influenced by the concrete strength.
All the mentioned studies have served to understand
the failure in slender RC elements and variables
involved in it. However, given the difficulty of testing
elements with a large slenderness ratio, experimental
campaigns measuring the entire loading process,
including the post-peak stage as well as independent
material characterization for concrete and steel proper-
ties, at least to the authors’s knowledge, are not available
in the literature. Thus a need was felt for a complete
experimental program in which all material character-
istics, including those related to the steel-concrete
interaction, should be measured through direct testing.
In this work, we present the results on the tests
carried out on elements of reduced size to facilitate
material control and specimen handling, as well as to
minimize the data dispersion [12]. All the specimens
are weakly reinforced, this entitles us to employ the
framework based on fracture mechanics of concrete
[13–15] for results interpretation. This research is an
extension of the previous work on the study of lightly
reinforced concrete elements [16, 12] subjected to
bending forces. By focusing on the effect of an
eccentric compressive force, we aim at complement-
ing the study of the fracture behavior of lightly
reinforced concrete elements. Preliminary results of
the current work, presented in a Spanish confer-
ence [17] have been employed in the author’s recent
numerical model [14] for validation. In this paper, we
concentrate on the experimental aspects of the LRC
elements subjected to eccentric compression.
The rest of the paper is structured as follows: a brief
overview of the experimental program is given in
Sect. 2. The materials and specimens are described in
Sect. 3. Section 4 summarizes the experimental pro-
cedures. The experimental results are presented and
discussed in Sect. 5. Finally, in Sect. 6 some conclu-
sions are extracted.
2 Overview of the experimental program
The experimental program was designed to study the
fracture behavior of lightly RC slender elements. In
particular, we want to determine whether the structural
responses of these elements are dependent on the
specimen slenderness ratio, the initial load eccentricity
and/or the reinforcement amount. In addition, the
Materials and Structures
Author's personal copy
program had to provide an exhaustive material charac-
terization to allow a complete interpretation of the test
results.
As mentioned before, we designed tests on panels
of reduced size. This is based on the size effect law
described through the Hillerborg’s brittleness number
(see [18] for details)
bH ¼H
‘ch
; ‘ch ¼EGF
f 2t
ð1Þ
where H is the specimen height, ‘ch is the character-
istic length; E, GF and ft are respectively the elastic
modulus, the fracture energy and the tensile strength
of the concrete. According to the size effect law, two
geometrically similar structures will display a similar
fracture behavior if their brittleness numbers are equal
[19, 20]. For instance, the behavior of specimens of
300, 600 and 1200 mm in height, made from a micro-
concrete with a ‘ch of 90 mm will represent that of
specimens of 1, 2 and 4 m made from an ordinary
concrete with a ‘ch of 300 mm.
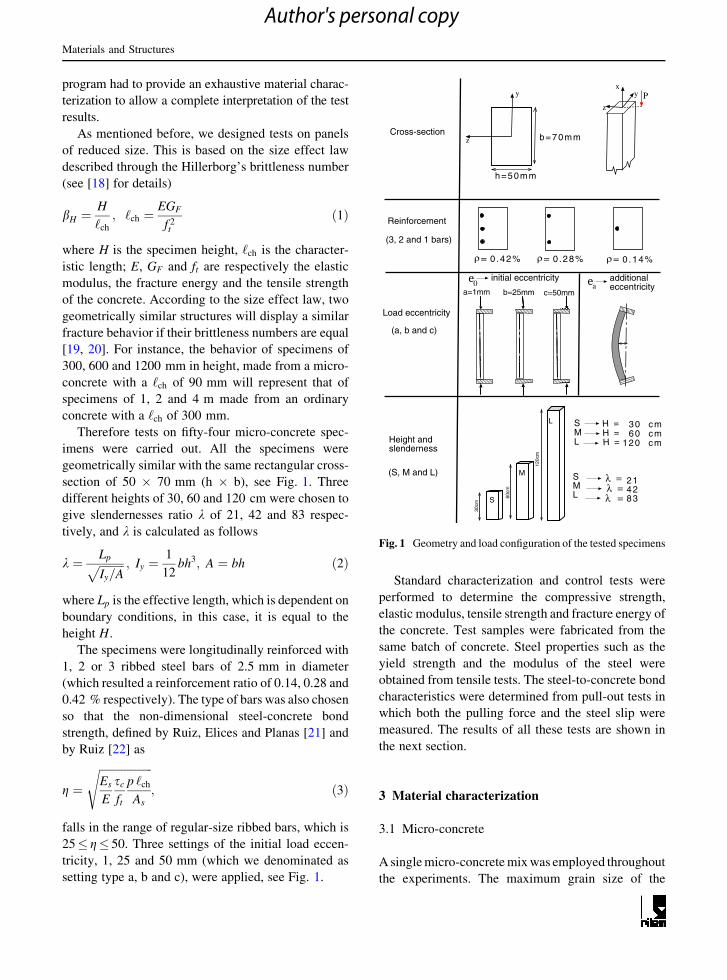
Therefore tests on fifty-four micro-concrete spec-
imens were carried out. All the specimens were
geometrically similar with the same rectangular cross-
section of 50 � 70 mm (h � b), see Fig. 1. Three
different heights of 30, 60 and 120 cm were chosen to
give slendernesses ratio k of 21, 42 and 83 respec-
tively, and k is calculated as follows
k ¼ Lpffiffiffiffiffiffiffiffiffi
Iy=Ap ; Iy ¼
1
12bh3; A ¼ bh ð2Þ
where Lp is the effective length, which is dependent on
boundary conditions, in this case, it is equal to the
height H.
The specimens were longitudinally reinforced with
1, 2 or 3 ribbed steel bars of 2.5 mm in diameter
(which resulted a reinforcement ratio of 0.14, 0.28 and
0.42 % respectively). The type of bars was also chosen
so that the non-dimensional steel-concrete bond
strength, defined by Ruiz, Elices and Planas [21] and
by Ruiz [22] as
g ¼
ffiffiffiffiffiffiffiffiffiffiffiffiffiffiffiffiffiffiffi
Es
E
sc
ft
p ‘ch
As
s
; ð3Þ
falls in the range of regular-size ribbed bars, which is
25� g� 50. Three settings of the initial load eccen-
tricity, 1, 25 and 50 mm (which we denominated as
setting type a, b and c), were applied, see Fig. 1.
Standard characterization and control tests were
performed to determine the compressive strength,
elastic modulus, tensile strength and fracture energy of
the concrete. Test samples were fabricated from the
same batch of concrete. Steel properties such as the
yield strength and the modulus of the steel were
obtained from tensile tests. The steel-to-concrete bond
characteristics were determined from pull-out tests in
which both the pulling force and the steel slip were
measured. The results of all these tests are shown in
the next section.
3 Material characterization
3.1 Micro-concrete
A single micro-concrete mix was employed throughout
the experiments. The maximum grain size of the
a=1mm b=25mm c=50mm
Reinforcement
Load eccentricity
Height andslenderness
e0initial eccentricity
eaadditionaleccentricity
L
M
S
120c
m
70mm
60c
m
30cm
50m
m
(3, 2 and 1 bars)
(a, b and c)
(S, M and L) λ λ λ
Cross-section
y
z b=70mm
h=50mm
ρ= 0 .42% ρ= 0 .28% ρ= 0 .14%
Py
z
x
SML
H =H =H =
30 cm 60 cm120 cm
SML
214283
Fig. 1 Geometry and load configuration of the tested specimens
Materials and Structures
Author's personal copy
siliceous sand was 4 mm and the portland cement was
of ASTM type II. All of the cement used was taken
from the same cement container and dry stored until
use. The mixing proportions by weight were 0.47:3.2:1
(water:aggregate:cement). The granulometric curve of
the aggregate follows the recommendations of ASTM
C33 and those of the Spanish Code EHE-08 [23].
Nine batches were necessary to cast all the panel
specimens plus the required characterization speci-
mens. The Abrams cone slump, measured immedi-
ately before casting, was of 1.8 cm in average. All the
specimens were cast in steel moulds, vibrated during
10 s while fastened to a vibrating table, wrap-cured for
24 h, de-moulded and stored in a moist chamber at
20� 2 �C until the test (about 1 month).
Material characterization was carried out on specimens
of the same age as the panel specimens. For each batch,
four compressive tests and four elastic modulus tests were
conducted according to ASTM C39 and ASTM C469
respectively, on cylinders of 75 mm in diameter and
150 mm in height to measure fc and Ec. Four Brazilian
tests were performed on cylinders of the same
dimension, following the procedures recommended
by ASTM C496 to characterize the tensile strength ft.
The specific fracture energy GF was measured
through three-point bending beams of 75 mm in depth,
50 mm in width and 300 mm in span. The testing
procedures followed were according to RILEM TC-50
[24] and with the improvements proposed by Elices,
Guinea and Planas [25–27]. Such tests were performed
in position control on notched beams resting on anti-
torsion supports. Three linear ramps at different
displacements rates were devised: 10 lm/min for the
first 25 min, 50 lm/min for the following 15 min and
250 lm/min until the end of the test.
The mechanical and fracture properties of the
micro-concrete measured are given in Table 1. The
characteristic length according to Eq. (1) is 93 mm. It
needs to be remarked that the mean values in Table 1
are the test results of 36 measurements (four from each
of the nine batches). The relative large scattering of the
compressive strength and elastic modulus is mainly
due to this fact.
3.2 Steel reinforcement
Since the tests were carried out in a reduced scale, in
order to achieve the desired reinforcement ratios, the
diameter of the steel bars had to be smaller than that of
standard ones. In this case, commercial ribbed wires
with a nominal diameter of 2.5 mm were used. The
measured characteristics of these wires, such as the
nominal elastic modulus, Es, the 0.2 % offset yield
strength, r0:2, the ultimate strength, ru, and the
ultimate strain, eu, are given in Table 2.
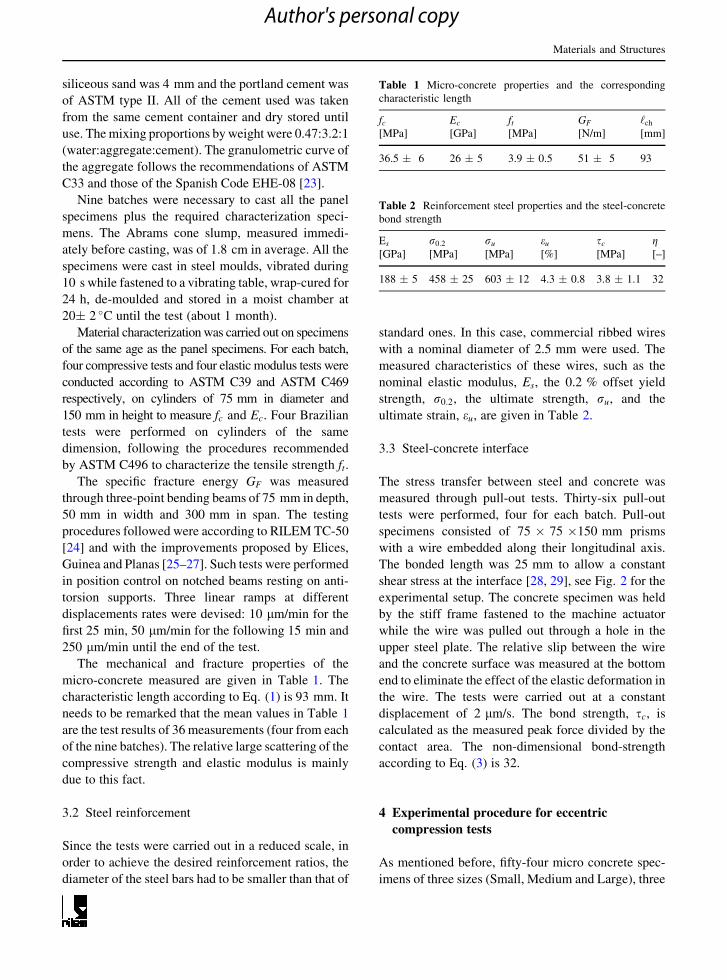
3.3 Steel-concrete interface
The stress transfer between steel and concrete was
measured through pull-out tests. Thirty-six pull-out
tests were performed, four for each batch. Pull-out
specimens consisted of 75 � 75 �150 mm prisms
with a wire embedded along their longitudinal axis.
The bonded length was 25 mm to allow a constant
shear stress at the interface [28, 29], see Fig. 2 for the
experimental setup. The concrete specimen was held
by the stiff frame fastened to the machine actuator
while the wire was pulled out through a hole in the
upper steel plate. The relative slip between the wire
and the concrete surface was measured at the bottom
end to eliminate the effect of the elastic deformation in
the wire. The tests were carried out at a constant
displacement of 2 lm/s. The bond strength, sc, is
calculated as the measured peak force divided by the
contact area. The non-dimensional bond-strength
according to Eq. (3) is 32.
4 Experimental procedure for eccentric
compression tests
As mentioned before, fifty-four micro concrete spec-
imens of three sizes (Small, Medium and Large), three
Table 1 Micro-concrete properties and the corresponding
characteristic length
fc Ec ft GF ‘ch
[MPa] [GPa] [MPa] [N/m] [mm]
36.5 � 6 26 � 5 3.9 � 0.5 51 � 5 93
Table 2 Reinforcement steel properties and the steel-concrete
bond strength
Es r0:2 ru eu sc g[GPa] [MPa] [MPa] [%] [MPa] [–]
188 � 5 458 � 25 603 � 12 4.3 � 0.8 3.8 � 1.1 32
Materials and Structures
Author's personal copy
reinforcement ratios (1, 2 and 3 rebars) and three
setting of initial eccentricities (a, b and c for 1, 25 and
50 mm respectively), two for each type, were tested.
We name each specimen according to this order, for
example, L2b-1 represents a large size specimen with
2 rebars, loaded with type b setting for the initial
eccentricity, and it is the first of the two columns
tested.
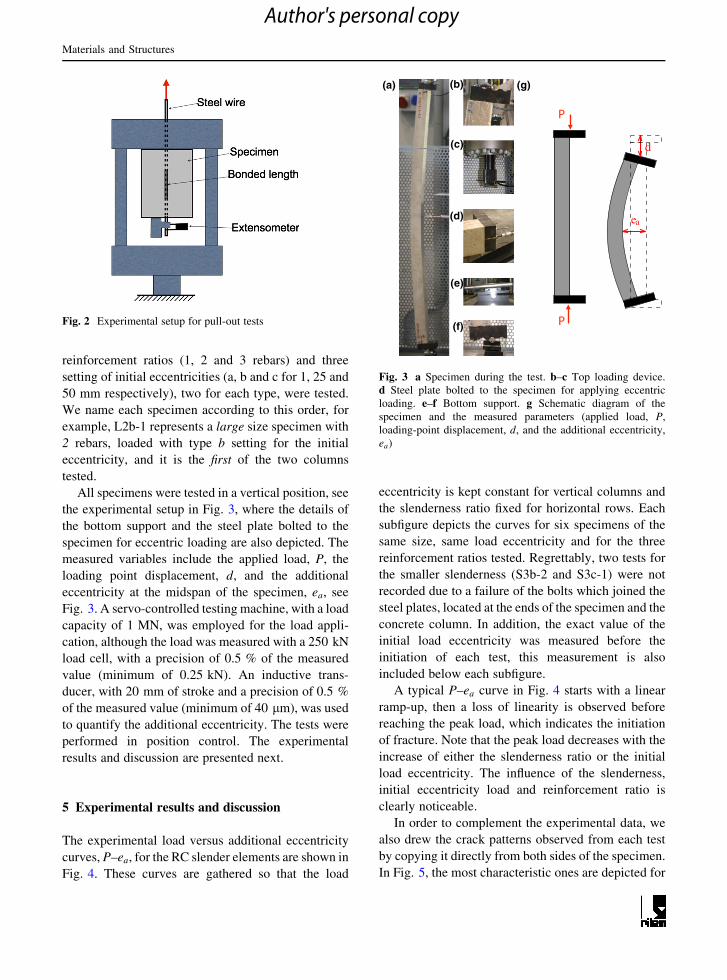
All specimens were tested in a vertical position, see
the experimental setup in Fig. 3, where the details of
the bottom support and the steel plate bolted to the
specimen for eccentric loading are also depicted. The
measured variables include the applied load, P, the
loading point displacement, d, and the additional
eccentricity at the midspan of the specimen, ea, see
Fig. 3. A servo-controlled testing machine, with a load
capacity of 1 MN, was employed for the load appli-
cation, although the load was measured with a 250 kN
load cell, with a precision of 0.5 % of the measured
value (minimum of 0.25 kN). An inductive trans-
ducer, with 20 mm of stroke and a precision of 0.5 %
of the measured value (minimum of 40 lm), was used
to quantify the additional eccentricity. The tests were
performed in position control. The experimental
results and discussion are presented next.
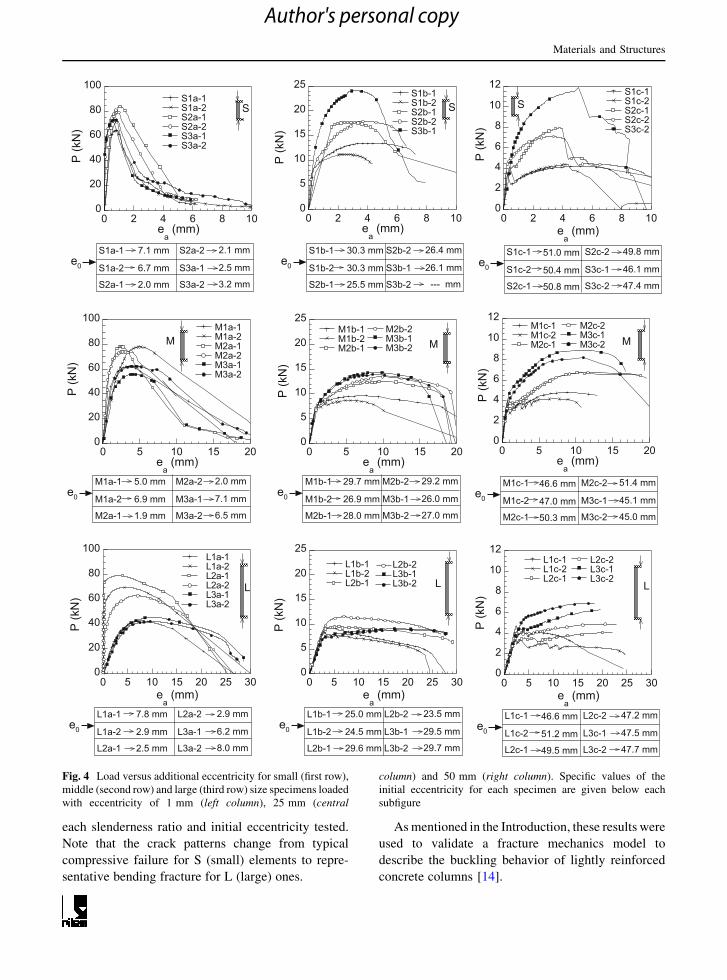
5 Experimental results and discussion
The experimental load versus additional eccentricity
curves, P–ea, for the RC slender elements are shown in
Fig. 4. These curves are gathered so that the load
eccentricity is kept constant for vertical columns and
the slenderness ratio fixed for horizontal rows. Each
subfigure depicts the curves for six specimens of the
same size, same load eccentricity and for the three
reinforcement ratios tested. Regrettably, two tests for
the smaller slenderness (S3b-2 and S3c-1) were not
recorded due to a failure of the bolts which joined the
steel plates, located at the ends of the specimen and the
concrete column. In addition, the exact value of the
initial load eccentricity was measured before the
initiation of each test, this measurement is also
included below each subfigure.
A typical P–ea curve in Fig. 4 starts with a linear
ramp-up, then a loss of linearity is observed before
reaching the peak load, which indicates the initiation
of fracture. Note that the peak load decreases with the
increase of either the slenderness ratio or the initial
load eccentricity. The influence of the slenderness,
initial eccentricity load and reinforcement ratio is
clearly noticeable.
In order to complement the experimental data, we
also drew the crack patterns observed from each test
by copying it directly from both sides of the specimen.
In Fig. 5, the most characteristic ones are depicted for
Fig. 2 Experimental setup for pull-out tests
d
ea
P
P
(a) (b) (g)
(c)
(d)
(e)
(f)
Fig. 3 a Specimen during the test. b–c Top loading device.
d Steel plate bolted to the specimen for applying eccentric
loading. e–f Bottom support. g Schematic diagram of the
specimen and the measured parameters (applied load, P,
loading-point displacement, d, and the additional eccentricity,
ea)
Materials and Structures
Author's personal copy
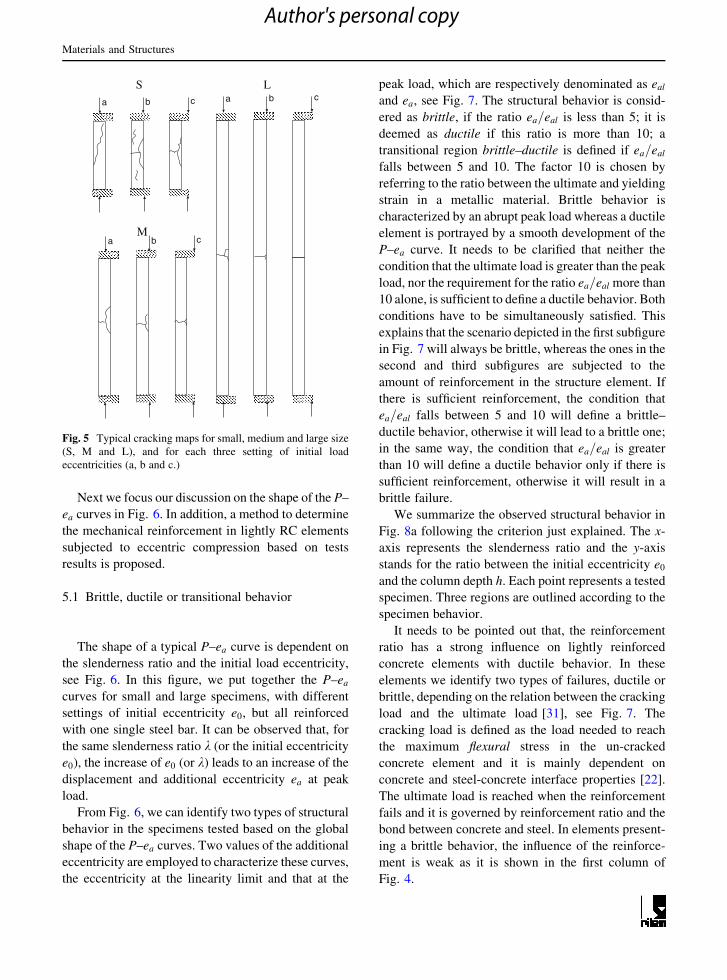
each slenderness ratio and initial eccentricity tested.
Note that the crack patterns change from typical
compressive failure for S (small) elements to repre-
sentative bending fracture for L (large) ones.
As mentioned in the Introduction, these results were
used to validate a fracture mechanics model to
describe the buckling behavior of lightly reinforced
concrete columns [14].
S1a-1S1a-2S2a-1S2a-2S3a-1S3a-2
S
S1b-1S1b-2S2b-1S2b-2S3b-1
S1c-1S1c-2S2c-1S2c-2S3c-2
S S
0
20
40
60
80
100
0 2 4 6 8 10
P (k
N)
ea (mm)
0
5
10
15
20
25
0 2 4 6 8 10
P (k
N)
ea (mm)
0
2
4
6
8
10
12
0 2 4 6 8 10
P (k
N)
ea (mm)
e0
S1a-1
S1a-2
S2a-1
S2a-2
S3a-1
S3a-2
7.1 mm
6.7 mm
2.0 mm
2.1 mm
2.5 mm
3.2 mm
e0
S1b-1
S1b-2
S2b-1
S2b-2
S3b-1
S3b-2
30.3 mm
30.3 mm
25.5 mm
26.4 mm
26.1 mm
--- mm
e0
S1c-1
S1c-2
S2c-1
S2c-2
S3c-1
S3c-2
51.0 mm
50.4 mm
50.8 mm
49.8 mm
46.1 mm
47.4 mm
M1a-1M1a-2M2a-1M2a-2M3a-1M3a-2
M M M
P (k
N)
P (k
N)
0
20
40
60
80
100
0 5 10 15 20
P (k
N)
ea (mm)
M1b-1M1b-2M2b-1
M2b-2M3b-1M3b-2
0
2
4
6
8
10
12
0 5 10 15 20e
a (mm)
M1c-1M1c-2M2c-1
M2c-2M3c-1M3c-2
0
5
10
15
20
25
0 5 10 15 20e
a (mm)
e0
M1a-1
M1a-2
M2a-1
M2a-2
M3a-1
M3a-2
5.0 mm
6.9 mm
1.9 mm
2.0 mm
7.1 mm
6.5 mm
e0
M1b-1
M1b-2
M2b-1
M2b-2
M3b-1
M3b-2
29.7 mm
26.9 mm
28.0 mm
29.2 mm
26.0 mm
27.0 mm
e0
M1c-1
M1c-2
M2c-1
M2c-2
M3c-1
M3c-2
46.6 mm
47.0 mm
50.3 mm
51.4 mm
45.1 mm
45.0 mm
LL
P (k
N)
P (k
N)
P (k
N)
L1a-1L1a-2L2a-1L2a-2L3a-1L3a-2
L
0
20
40
60
80
100
0 5 10 15 20 25 30e
a (mm)
L1b-1L1b-2L2b-1
L2b-2L3b-1L3b-2
0
2
4
6
8
10
12
0 5 10 15 20 25 30e
a (mm)
L1c-1L1c-2L2c-1
L2c-2L3c-1L3c-2
0
5
10
15
20
25
0 5 10 15 20 25 30e
a (mm)
e0
L1a-1
L1a-2
L2a-1
L2a-2
L3a-1
L3a-2
7.8 mm
2.9 mm
2.5 mm
2.9 mm
6.2 mm
8.0 mm
e0
L1b-1
L1b-2
L2b-1
L2b-2
L3b-1
L3b-2
25.0 mm
24.5 mm
29.6 mm
23.5 mm
29.5 mm
29.7 mm
e0
L1c-1
L1c-2
L2c-1
L2c-2
L3c-1
L3c-2
46.6 mm
51.2 mm
49.5 mm
47.2 mm
47.5 mm
47.7 mm
Fig. 4 Load versus additional eccentricity for small (first row),
middle (second row) and large (third row) size specimens loaded
with eccentricity of 1 mm (left column), 25 mm (central
column) and 50 mm (right column). Specific values of the
initial eccentricity for each specimen are given below each
subfigure
Materials and Structures
Author's personal copy
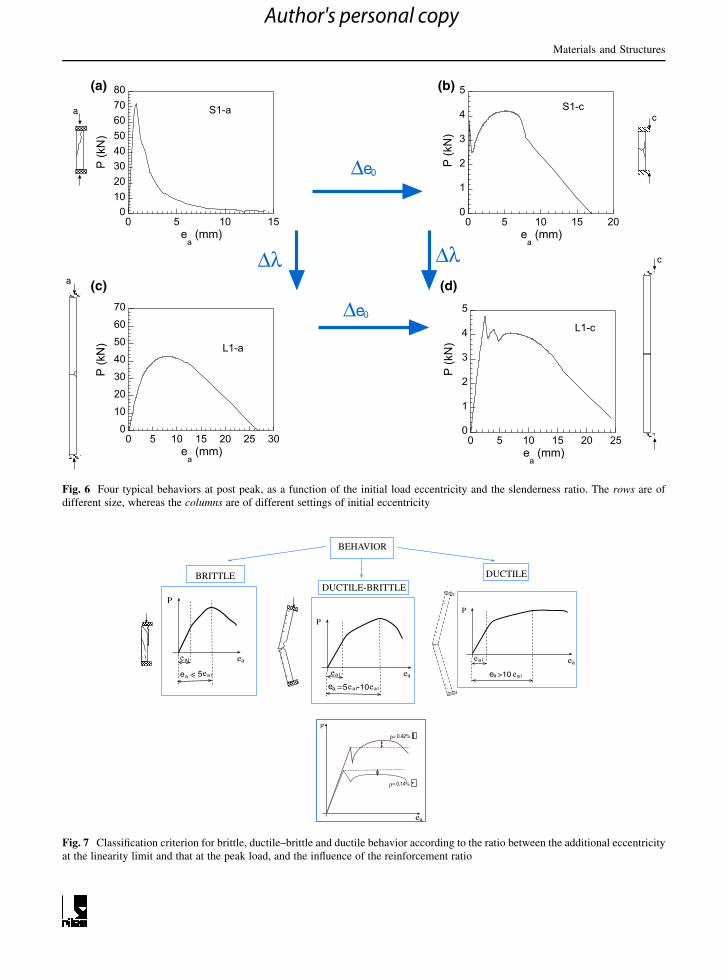
Next we focus our discussion on the shape of the P–
ea curves in Fig. 6. In addition, a method to determine
the mechanical reinforcement in lightly RC elements
subjected to eccentric compression based on tests
results is proposed.
5.1 Brittle, ductile or transitional behavior
The shape of a typical P–ea curve is dependent on
the slenderness ratio and the initial load eccentricity,
see Fig. 6. In this figure, we put together the P–ea
curves for small and large specimens, with different
settings of initial eccentricity e0, but all reinforced
with one single steel bar. It can be observed that, for
the same slenderness ratio k (or the initial eccentricity
e0), the increase of e0 (or k) leads to an increase of the
displacement and additional eccentricity ea at peak
load.
From Fig. 6, we can identify two types of structural
behavior in the specimens tested based on the global
shape of the P–ea curves. Two values of the additional
eccentricity are employed to characterize these curves,
the eccentricity at the linearity limit and that at the
peak load, which are respectively denominated as eal
and ea, see Fig. 7. The structural behavior is consid-
ered as brittle, if the ratio ea=eal is less than 5; it is
deemed as ductile if this ratio is more than 10; a
transitional region brittle–ductile is defined if ea=eal
falls between 5 and 10. The factor 10 is chosen by
referring to the ratio between the ultimate and yielding
strain in a metallic material. Brittle behavior is
characterized by an abrupt peak load whereas a ductile
element is portrayed by a smooth development of the
P–ea curve. It needs to be clarified that neither the
condition that the ultimate load is greater than the peak
load, nor the requirement for the ratio ea=eal more than
10 alone, is sufficient to define a ductile behavior. Both
conditions have to be simultaneously satisfied. This
explains that the scenario depicted in the first subfigure
in Fig. 7 will always be brittle, whereas the ones in the
second and third subfigures are subjected to the
amount of reinforcement in the structure element. If
there is sufficient reinforcement, the condition that
ea=eal falls between 5 and 10 will define a brittle–
ductile behavior, otherwise it will lead to a brittle one;
in the same way, the condition that ea=eal is greater
than 10 will define a ductile behavior only if there is
sufficient reinforcement, otherwise it will result in a
brittle failure.
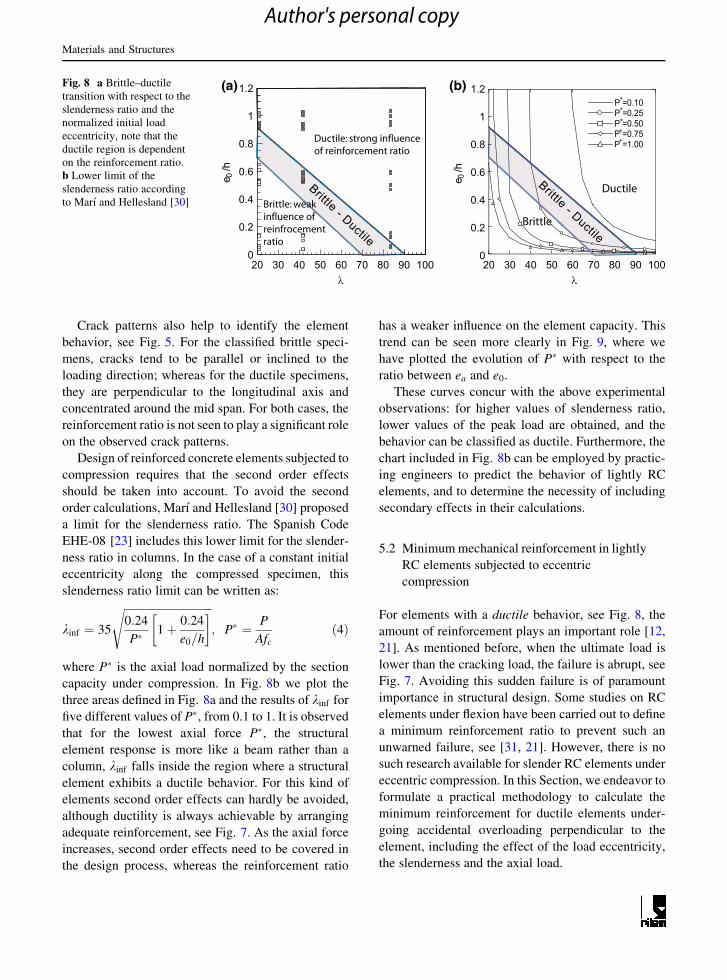
We summarize the observed structural behavior in
Fig. 8a following the criterion just explained. The x-
axis represents the slenderness ratio and the y-axis
stands for the ratio between the initial eccentricity e0
and the column depth h. Each point represents a tested
specimen. Three regions are outlined according to the
specimen behavior.
It needs to be pointed out that, the reinforcement
ratio has a strong influence on lightly reinforced
concrete elements with ductile behavior. In these
elements we identify two types of failures, ductile or
brittle, depending on the relation between the cracking
load and the ultimate load [31], see Fig. 7. The
cracking load is defined as the load needed to reach
the maximum flexural stress in the un-cracked
concrete element and it is mainly dependent on
concrete and steel-concrete interface properties [22].
The ultimate load is reached when the reinforcement
fails and it is governed by reinforcement ratio and the
bond between concrete and steel. In elements present-
ing a brittle behavior, the influence of the reinforce-
ment is weak as it is shown in the first column of
Fig. 4.
a b cL
a b cM
a b c
S
Fig. 5 Typical cracking maps for small, medium and large size
(S, M and L), and for each three setting of initial load
eccentricities (a, b and c.)
Materials and Structures
Author's personal copy
P (k
N)
P (k
N)
Δλ Δλ
e0Δ
ac
e0Δ
c
a
P (k
N)
P (k
N)
0
1
2
3
4
5
0 5 10 15 20
S1-c
ea (mm)
01020304050607080
0 5 10 15
S1-a
ea (mm)
0
10
20
30
40
50
60
70
0 5 10 15 20 25 30
L1-a
ea (mm)
0
1
2
3
4
5
0 5 10 15 20 25e
a (mm)
L1-c
(a) (b)
(c) (d)
Fig. 6 Four typical behaviors at post peak, as a function of the initial load eccentricity and the slenderness ratio. The rows are of
different size, whereas the columns are of different settings of initial eccentricity
BRITTLE
P
< 5e
BEHAVIOR
S
M
P
5 -10
Frágil-Dúctil
ea
e =
P
>10
Dúctil
e
DUCTILE
DUCTILE-BRITTLE
ea l
ea l ea l
a
ea ea
a ea l
ea l ea l
a ea l
P
ρ= 0.14%
ρ= 0.42%
ea
Fig. 7 Classification criterion for brittle, ductile–brittle and ductile behavior according to the ratio between the additional eccentricity
at the linearity limit and that at the peak load, and the influence of the reinforcement ratio
Materials and Structures
Author's personal copy
Crack patterns also help to identify the element
behavior, see Fig. 5. For the classified brittle speci-
mens, cracks tend to be parallel or inclined to the
loading direction; whereas for the ductile specimens,
they are perpendicular to the longitudinal axis and
concentrated around the mid span. For both cases, the
reinforcement ratio is not seen to play a significant role
on the observed crack patterns.
Design of reinforced concrete elements subjected to
compression requires that the second order effects
should be taken into account. To avoid the second
order calculations, Marı and Hellesland [30] proposed
a limit for the slenderness ratio. The Spanish Code
EHE-08 [23] includes this lower limit for the slender-
ness ratio in columns. In the case of a constant initial
eccentricity along the compressed specimen, this
slenderness ratio limit can be written as:
kinf ¼ 35
ffiffiffiffiffiffiffiffiffiffiffiffiffiffiffiffiffiffiffiffiffiffiffiffiffiffiffiffiffiffiffiffi
0:24
P�1þ 0:24
e0=h
� �
s
; P� ¼ P
Afc
ð4Þ
where P� is the axial load normalized by the section
capacity under compression. In Fig. 8b we plot the
three areas defined in Fig. 8a and the results of kinf for
five different values of P�, from 0.1 to 1. It is observed
that for the lowest axial force P�, the structural
element response is more like a beam rather than a
column, kinf falls inside the region where a structural
element exhibits a ductile behavior. For this kind of
elements second order effects can hardly be avoided,
although ductility is always achievable by arranging
adequate reinforcement, see Fig. 7. As the axial force
increases, second order effects need to be covered in
the design process, whereas the reinforcement ratio
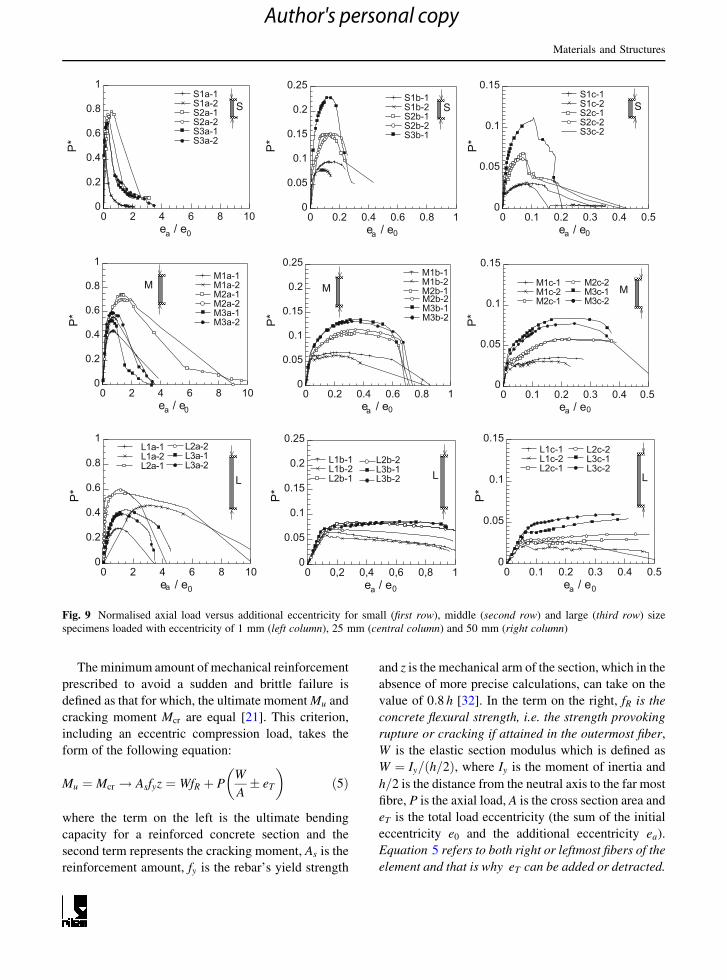
has a weaker influence on the element capacity. This
trend can be seen more clearly in Fig. 9, where we
have plotted the evolution of P� with respect to the
ratio between ea and e0.
These curves concur with the above experimental
observations: for higher values of slenderness ratio,
lower values of the peak load are obtained, and the
behavior can be classified as ductile. Furthermore, the
chart included in Fig. 8b can be employed by practic-
ing engineers to predict the behavior of lightly RC
elements, and to determine the necessity of including
secondary effects in their calculations.
5.2 Minimum mechanical reinforcement in lightly
RC elements subjected to eccentric
compression
For elements with a ductile behavior, see Fig. 8, the
amount of reinforcement plays an important role [12,
21]. As mentioned before, when the ultimate load is
lower than the cracking load, the failure is abrupt, see
Fig. 7. Avoiding this sudden failure is of paramount
importance in structural design. Some studies on RC
elements under flexion have been carried out to define
a minimum reinforcement ratio to prevent such an
unwarned failure, see [31, 21]. However, there is no
such research available for slender RC elements under
eccentric compression. In this Section, we endeavor to
formulate a practical methodology to calculate the
minimum reinforcement for ductile elements under-
going accidental overloading perpendicular to the
element, including the effect of the load eccentricity,
the slenderness and the axial load.
λ
1.2
0
0.2
0.4
0.6
0.8
1
20 30 40 50 60 70 80 90 100
e /h 0
Brittle - Ductile
P =0.10P =0.25P =0.50P =0.75P =1.00
1.2
0
0.2
0.4
0.6
0.8
1
e /h 0
λ20 30 40 50 60 70 80 90 100
Brittle - Ductile
**
***
(a) (b)Fig. 8 a Brittle–ductile
transition with respect to the
slenderness ratio and the
normalized initial load
eccentricity, note that the
ductile region is dependent
on the reinforcement ratio.
b Lower limit of the
slenderness ratio according
to Marı and Hellesland [30]
Materials and Structures
Author's personal copy
The minimum amount of mechanical reinforcement
prescribed to avoid a sudden and brittle failure is
defined as that for which, the ultimate moment Mu and
cracking moment Mcr are equal [21]. This criterion,
including an eccentric compression load, takes the
form of the following equation:
Mu ¼ Mcr ! Asfyz ¼ WfR þ PW
A� eT
� �
ð5Þ
where the term on the left is the ultimate bending
capacity for a reinforced concrete section and the
second term represents the cracking moment, As is the
reinforcement amount, fy is the rebar’s yield strength
and z is the mechanical arm of the section, which in the
absence of more precise calculations, can take on the
value of 0:8 h [32]. In the term on the right, fR is the
concrete flexural strength, i.e. the strength provoking
rupture or cracking if attained in the outermost fiber,
W is the elastic section modulus which is defined as
W ¼ Iy=ðh=2Þ, where Iy is the moment of inertia and
h=2 is the distance from the neutral axis to the far most
fibre, P is the axial load, A is the cross section area and
eT is the total load eccentricity (the sum of the initial
eccentricity e0 and the additional eccentricity ea).
Equation 5 refers to both right or leftmost fibers of the
element and that is why eT can be added or detracted.
S1a-1S1a-2S2a-1S2a-2S3a-1S3a-2
S1b-1S1b-2S2b-1S2b-2S3b-1
S1c-1S1c-2S2c-1S2c-2S3c-2
S S S
0
0.2
0.4
0.6
0.8
1
0 2 4 6 8 10e / e
0
0.05
0.1
0.15
0.2
0.25
0 0.2 0.4 0.6 0.8 1e / e
0
0.05
0.1
0.15
0 0.1 0.2 0.3 0.4 0.5e / e0 0 0a a a
P* P*
P*
M1a-1M1a-2M2a-1M2a-2M3a-1M3a-2
M M M
M1b-1M1b-2M2b-1M2b-2M3b-1M3b-2
M1c-1M1c-2M2c-1
M2c-2M3c-1M3c-2
0
0.2
0.4
0.6
0.8
1
0 2 4 6 8 10e / e
P*
0
0.05
0.1
0.15
0.2
0.25
0 0.2 0.4 0.6 0.8 1e / e
0
0.05
0.1
0.15
0 0.1 0.2 0.3 0.4 0.5e / ea 0 0 0a a
P*
P*
LL L
L1b-1L1b-2L2b-1
L2b-2L3b-1L3b-2
L1c-1L1c-2L2c-1
L2c-2L3c-1L3c-2
L1a-1L1a-2L2a-1
L2a-2L3a-1L3a-2
0
0.2
0.4
0.6
0.8
1
0 2 4 6 8 10e / e0
0
0.05
0.1
0.15
0.2
0.25
0 0,2 0,4 0,6 0,8 1e / e
0
0.05
0.1
0.15
0 0.1 0.2 0.3 0.4 0.5e / e0 0a a a
P* P*
P*
Fig. 9 Normalised axial load versus additional eccentricity for small (first row), middle (second row) and large (third row) size
specimens loaded with eccentricity of 1 mm (left column), 25 mm (central column) and 50 mm (right column)
Materials and Structures
Author's personal copy
Assuming that the reinforcement has to be symmetric
leads to consider only the positive sign.
The flexural strength fR in reinforced concrete
elements is a function of the percentage of reinforce-
ment, the bond strength and the bar diameter as well as
the concrete, steel and steel-concrete interface
mechanical properties. This fact has been demon-
strated in several research on lightly reinforced
concrete beams [31, 33, 22, 21]. The flexural strength
is also affected by size effect [13, 31, 22, 21]. Some
expressions to its evaluation have been proposed in the
cited references. In the absence of available informa-
tion, it also can be evaluated through the expressions
included in the Model Code-2010 [34], or in the
Eurocode-2 [35].
For a rectangular section b�h, Eq. 5 can be
rewritten as:
Asfy ¼5
24AcfR þ P 1þ 6eT
h
� �� �
ð6Þ
which can be used to determine the minimum amount
of reinforcement in slender RC elements previously
classified as ductile using the chart in Fig. 8. In this
equation only eT is unknown since the value of ea is
not a data of the problem. Next the calculation of ea is
explained.
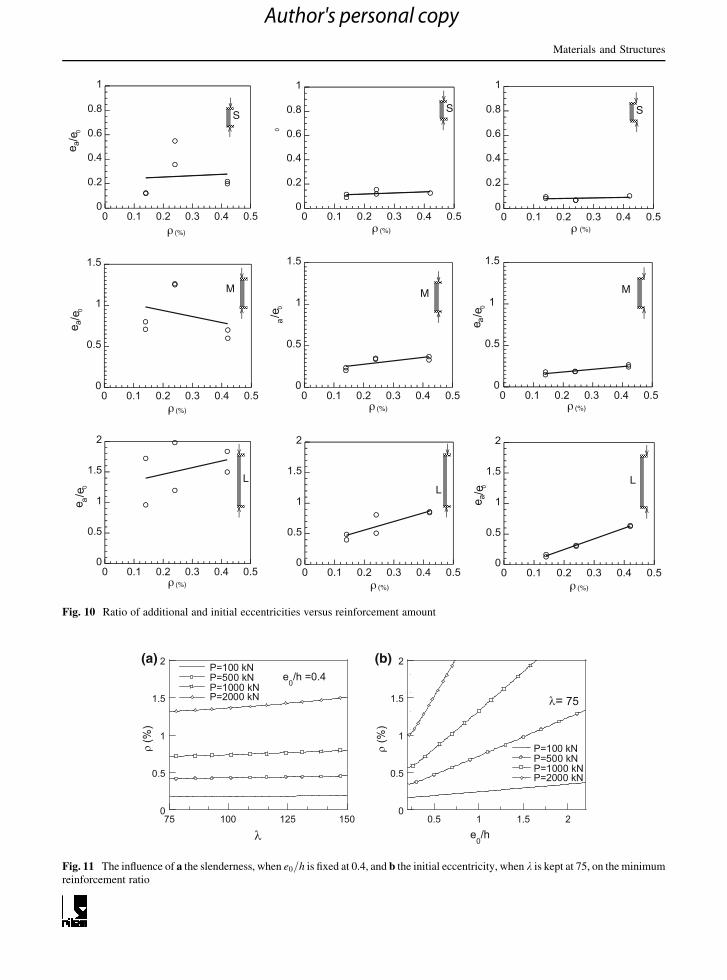
In Fig. 10, we present the observed dependence of
the ratio ea=e0 on the reinforcement ratio. These nine
graphs are ordered in the same manner as those in
Fig. 4. We approximate the straight lines which
followed by the experimental points as follows
ea
e0
¼ mqþ B ð7Þ
where m is the slope, B is the ratio ea=e0 corresponding
to that of a plain concrete element. When there is no
reinforcement, the structure fails at the point of
fracture initiation. Therefore the B coefficient in
Eq. 7 can be calculated as follows
B ¼ ea
e0
�
�
�
�
q¼0
¼ PH2
8EIy
¼ fc
8Ek2P� ð8Þ
where elastic beam theory has been employed to
obtain the maximum transversal displacement (in this
case ea) for a beam loaded with the bending moment
Pe0. Assuming the maximum ea for q ¼ 0 is the one
that the load P should reach the cracking moment Mcr,
we have
fR ¼ �P
Aþ Pe0
W) P ¼ fRAW
W � Ae0
�!A¼bh
P¼ bh2fR
6e0 � h
ð9Þ
Consequently the non-dimensional load for a rectan-
gular section b� h is
P� ¼ P
bhfc
¼ fR
½6e0=h� 1fc
ð10Þ
Insert the above equation to the expression for B in
Eq. 8,
B ¼ ea
e0
�
�
�
�
q¼0
¼ fR
8E
k2
½6e0=h� 1 ð11Þ
It needs to be pointed out that, in Eqs. 9–11, the
condition e0=h 1=6 is assumed a priori; otherwise,
the section is under compression, it will not make
sense to talk about minimum reinforcement. In
addition, it can easily be shown that if
e0
h\
1
6
fc þ fR
fc � fRð12Þ
the plain element reaches failure in compression
before failing in bending and, so, the condition in
Eq. 12 has to be fulfilled.
Moreover, with the experimental data obtained, we
carry out numerical approximation and non-linear
optimisation to obtain the slope as follows
m ¼ 4:3� 10�5 k2:4e0hð Þ
0:012
ð13Þ
Consequently, the additional eccentricity for lightly
reinforcement elements, normalized by the initial
eccentricity e0, can be written as:
ea
e0
¼ q 4:3� 10�5 k2:4e0hð Þ
0:012h i
þ fR
8E
k2
½6e0=h� 1ð14Þ
Therefore, our proposal for the minimum reinforce-
ment for concrete elements under eccentric compres-
sion is to employ Eqs. 6 and 14. The system of these
two equations could be simply solved in a spreadsheet.
In Fig. 11, we illustrate the influence of the
slenderness and the initial eccentricity on the mini-
mum reinforcement in a reinforced column of rectan-
gular section. The assumed material properties and
cross-section dimension are given in Table 3. In
Fig. 11a, the x-axis represents the slenderness, the
Materials and Structures
Author's personal copy
L
e a/e 0
(%)
0
0.5
1
1.5
2
0 0.1 0.2 0.3 0.4 0.5
e a/e
0
(%)
0
0.2
0.4
0.6
0.8
1
0 0.1 0.2 0.3 0.4 0.5
S
0
(%)
0
0.2
0.4
0.6
0.8
1
0 0.1 0.2 0.3 0.4 0.5
S
(%)
0
0.2
0.4
0.6
0.8
1
0 0.1 0.2 0.3 0.4 0.5
M
e a/e
0
(%)
0
0.5
1
1.5
0 0.1 0.2 0.3 0.4 0.5
Ma/
e 0
(%)
0
0.5
1
1.5
0 0.1 0.2 0.3 0.4 0.5
M
e a/e
0
(%)
0
0.5
1
1.5
0 0.1 0.2 0.3 0.4 0.5
L
(%)
0
0.5
1
1.5
2
0 0.1 0.2 0.3 0.4 0.5
Le a
/e 0
(%)
0
0.5
1
1.5
2
0 0.1 0.2 0.3 0.4 0.5
S
Fig. 10 Ratio of additional and initial eccentricities versus reinforcement amount
P=100 kNP=500 kNP=1000 kNP=2000 kN
P=100 kNP=500 kNP=1000 kNP=2000 kN
0
0.5
1
1.5
2
75 100 125 150
(%)
0
0.5
1
1.5
2
0.5 1 1.5 2e
0/h
(%)
e0/h =0.4
= 75
(a) (b)
Fig. 11 The influence of a the slenderness, when e0=h is fixed at 0.4, and b the initial eccentricity, when k is kept at 75, on the minimum
reinforcement ratio
Materials and Structures
Author's personal copy
y-axis is the minimum reinforcement ratio, whereas
the initial ratio e0=h is kept constant at 0.4. For the
lowest axial force, the reinforcement ratio is around
0.2 % which is a normal value for beams. A larger
slenderness requires more minimum reinforcement as
load increases. In Fig. 11b the effect of the initial
eccentricity is demonstrated for several axial forces.
The x-axis stands for the initial eccentricity e0, again
normalized by the column depth h, the y-axis is same
as that of Fig. 11a, whereas the slenderness is kept
fixed as 75. As the initial eccentricity increases
minimum reinforced ratio also increases. The influ-
ence of axial force is represented clearly again, as
larger values of reinforcement are required for higher
values of the axial load.
This example illustrates the importance of defining
the minimum reinforcement percentage for slender
columns or panels with a high initial eccentricity.
6 Summary and conclusions
We have presented experimental results on lightly
reinforced concrete slender elements under eccentric
compressive load. Geometrically similar specimens
and characterizing coupons were cast from a single
micro-concrete. Tests were carried out for 54 speci-
mens of three heights, with three reinforcement ratios
and three positions of initial load eccentricity. Mate-
rial (concrete and steel rebars) and interface properties
were measured through independent tests. Concrete-
making and testing procedures were strictly controlled
to reduce experimental scatter. The following conclu-
sions can be drawn from the study:
– Through analyzing the load versus additional-
eccentricity curves, we have classified the struc-
tural behavior of the tested elements according to
their slenderness ratio and initial load eccentricity.
– The classification chart obtained provides a guide-
line to predict the structural behavior for lightly
reinforced slender elements.
– It has been observed that the reinforcement ratio
plays an important role on the failure, when the
behavior of the element is considered ductile, but it
barely influences the observed crack patterns.
– An expression to evaluate the additional eccen-
tricity and another to estimate the minimum
reinforcement amount for reinforced concrete
elements subjected to eccentric compression are
proposed.
– These experimental results can be used effectively for
modeling the behavior of lightly reinforced concrete
elements subjected to eccentric compression.
Acknowledgments The authors acknowledge the financial
support from the Ministerio de Economıa y Competitividad,
MAT2012-35416, and INDAGSA, Spain.
References
1. Bazant ZP, Cedolin L (2003) Stability of structures. Dover,
Mineola, New York
2. Yalcin C, Saatcioglu M (1995) Inelastic analysis of rein-
forced concrete columns. Computers and Structures
77(5):539–555
3. Kwak HG, Kim JK (2004) Ultimate resisting capacity of
slender RC column. Comput Struct 82:901–915
4. Kwak HG, Kim JK (2006) Nonlinear behaviour of slender
RC columns(1). Numerical formulation. Constr Build Mater
20:527–537
5. Kwak HG, Kim JK (2006) Nonlinear behaviour of slender
RC columns(2). Introduction of desing formula. Constr
Build Mater 20:538–553
6. Majewski T, Bobinski J, Tejchman J (2008) FE analysis of
failure behaviour of reinforced concrete columns under
eccentric compression. Eng Struct 30(2):300–317
7. Furlong RW (1993) Slenderness of columns in braced
frames. J Struct Div ASCE 119(11):3405–3415
8. McGregor JG, Breen JE, Pfrang EO (1970) Design of
slender concrete columns. ACI J 67(1):6–28
9. Bazant ZP, Kwon YW (1994) Failure of slender and stocky
reinforced-concrete columns, test of size effect. Mater
Struct 27(166):79–90
10. Kim KD, Yang JK (1997) Buckling behaviour of slender
high-strength concrete colums. Eng Struct 17:39–51
11. Foster SJ, Attard MM (1993) Experimental test on eccen-
trically loaded high-strength concrete colums. ACI Struct J
94:295–303
12. Ruiz G, Elices M, Planas J (1998) Experimental study of
fracture of lightly reinforced concrete beams. Mater Struct
31:683–691
13. Bazant ZP, Planas J (1998) Fracture size effect in concrete
and other quasibrittle materials. CRC Press, Boca Raton
14. Carmona JR, Porras R, Yu RC, Ruiz G (2013) A fracture
mechanics model to describe the buckling behavior of
lightly reinforced concrete columns. Eng Struct 49:588–599
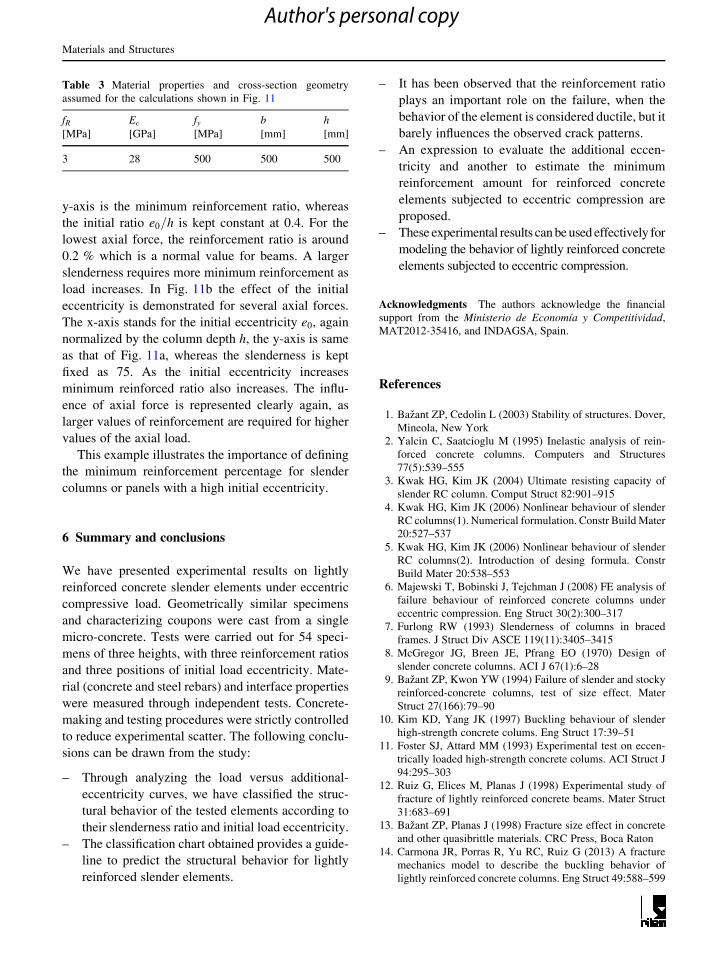
Table 3 Material properties and cross-section geometry
assumed for the calculations shown in Fig. 11
fR Ec fy b h
[MPa] [GPa] [MPa] [mm] [mm]
3 28 500 500 500
Materials and Structures
Author's personal copy
15. Carmona JR, Ruiz G, del Viso JR (2007) Mixed-mode crack
propagation through reinforced concrete. Eng Fract Mech
74:2788–2809
16. Ruiz G, Carmona JR (2006) Experimental study on the
influence of the shape of the cross-section and of the rebar
arrangement on the fracture of lightly reinforced beams.
Mater Struct 39:343–352
17. Porras-Soriano R, Ruiz G, Carmona J, Yu R (2009) Estudio
experimental de paneles esbeltos de hormigon debilmente
armados. Anales de Mecanica de la Fractura 26(2):627–632
18. Hillerborg A, Modeer M, Petersson P (1976) Analysis of
crack formation and crack growth in concrete by means of
fracture mechanics and finite elements. Cem Concr Res
6(6):773–782
19. Elfgren L, Shah SP (eds) (1989): Analysis of concrete
structures by fracture mechanics. Proceedings of the inter-
national RILEM workshop dedicated to Professor Arne
Hillerborg. RILEM Committee on Fractures Mechanics of
Concrete, Abisko
20. Petersson PE (1981) Crack growth and development of
fracture zone in plain concrete and similar materials. Report
No. TVBM-1006, Division of Building Materials, Lund
Institute of Technology, Lund
21. Ruiz G, Elices M, Planas J (1999) Size effect and bond-slip
dependence of lightly reinforced concrete beams. In:
Carpinteri A (ed) Minimum reinforcement in concrete
members. Elsevier, London, pp 67–97
22. Ruiz G (2001) Propagation of a cohesive crack crossing a
reinforcement layer. Int J Fract 111:265–282
23. Ministerio de Fomento: EHE Instruccion del Hormigon
Estructural. Ministerio de Fomento (2008)
24. RILEM (1985) Determination of the fracture energy of
mortar and concrete by means of the three-point bend tests
on notched beams. Mater Struct 18:285–290
25. Elices M, Guinea GV, Planas J (1992) Measurement of the
fracture energy using three point bend test 3. Influence of
cutting the P-d tail. Mater Struct 25:327–334
26. Guinea GV, Planas J, Elices M (1992) Measurement of the
fracture energy using three point bend test 1. Influence of
experimental procedures. Mater Struct 25:121–128
27. Planas J, Elices M, Guinea GV (1992) Measurement of the
fracture energy using three point bend test 2. Influence of
bulk energy dissipation. Mater Struct 25:305–312
28. Losberg A, Olsson PA (1979) Bond failure of deformed
reinforcing bars based on the longitudinal splitting effect of
the bars. ACI J 76(1):5–17
29. RILEM/CEB/FIP (1970) Test and specifications of rein-
forcement for reinforced and prestressed concrete: four
recomendations of the RILEM/CEB/FIB,2: Pullout tes.
Mater Struct 3(15):175–178
30. Marı A, Hellesland J (2005) Lower slenderness limits for
rectangular reinforced concrete columns. J Struct Eng
131(1):85–95
31. Fantilli A, Ferretti D, Iori I, Vallini P (1999) Behavior of R/C
elements in bending and tension: the problem of minumum
reinforcement ratio. In: Carpinteri A (ed) Minimum rein-
forcement in concrete members. Elsevier, London, pp 99–125
32. Calavera J (2008) Proyecto y Calculo de Estructuras de
hormigon. Intemac, Madrid
33. Fantilli AP, Ferretti D, Rosati G (2005) Effect of bar
diameter on the behavior of lightly reinforced concrete
beams. J Mater Civil Eng 17(1):10–18
34. Federation Internationale du Beton (FIB) (2012) Model
Code 2010—Final draft, Vols 1,2. Bulletins 65 and 66,
Lausanne
35. Eurocode 2, design of concrete structures, Part 1–1: general
rules and rules for buildings (EN1992-1-1). European
Committee for Standardization, Brussels (2004)
Materials and Structures
Author's personal copy