Experimental study of intelligent controllers under uncertainty using type-1 and type-2 fuzzy logic
7
Exploring confusion in product ciphers through regression analysis Vasilios Katos a, * , Bernard Doherty b a School of Computing, University of Portsmouth, Buckingham Building, Lion Terrace, Portsmouth PO1 3HE, UK b School of Engineering and Applied Science, Aston University, Aston Triangle, Birmingham B4 7ET, UK Received 24 May 2006; received in revised form 27 September 2006; accepted 29 September 2006 Abstract This paper investigates the modelling of confusion in product encryption by statistical means, to support understanding of the avalanche effect of the continuous application of an encryption step or round. To facilitate the modelling, a metric for confusion is proposed and its appropriateness and properties verified against broadly accepted theoretical assumptions. The regression analysis showed that confusion can be approximated by well-known econometrics functions. Ó 2006 Elsevier Inc. All rights reserved. Keywords: Statistical cryptography; Confusion metric 1. Introduction The majority of symmetric ciphers are based on the product encryption [1] concept, i.e. the cascaded arrangement of weak encryption transformations, in order to attain a strong cipher. Research on the analysis and assessment of the cryptographic strength of a product cipher has followed both theoretical and empirical avenues. Theoretical approaches on cipher design include the provable security paradigm [2] and the random oracle model [3,4] which mainly focus on the study of the computational indistinguishability aspects of a cryp- tographic primitive [5]. On the other hand, empirical or statistical approaches mainly stem from the concepts of the confusion and diffusion, as originally defined by Shannon [1]. Statistical tests in particular relate to assessing the randomness capabilities of cryptographic random bit generators [6–11]. Both approaches exhibit advantages and limitations [12]. The main strength of a theoretic approach is its contribution to formal and sound design principles which is vital to the discipline of information security on the long term. However, the theoretic approach may not be applicable in analysing certain proposed cryp- tographic primitives. An indicative case is that of the non-linear feedback shift registers, used to generate 0020-0255/$ - see front matter Ó 2006 Elsevier Inc. All rights reserved. doi:10.1016/j.ins.2006.09.017 * Corresponding author. E-mail address: [email protected] (V. Katos). Information Sciences 177 (2007) 1789–1795 www.elsevier.com/locate/ins
-
Upload
independent -
Category
Documents
-
view
4 -
download
0
Transcript of Experimental study of intelligent controllers under uncertainty using type-1 and type-2 fuzzy logic

Information Sciences 177 (2007) 1789–1795
www.elsevier.com/locate/ins
Exploring confusion in product ciphers throughregression analysis
Vasilios Katos a,*, Bernard Doherty b
a School of Computing, University of Portsmouth, Buckingham Building, Lion Terrace, Portsmouth PO1 3HE, UKb School of Engineering and Applied Science, Aston University, Aston Triangle, Birmingham B4 7ET, UK
Received 24 May 2006; received in revised form 27 September 2006; accepted 29 September 2006
Abstract
This paper investigates the modelling of confusion in product encryption by statistical means, to support understandingof the avalanche effect of the continuous application of an encryption step or round. To facilitate the modelling, a metricfor confusion is proposed and its appropriateness and properties verified against broadly accepted theoretical assumptions.The regression analysis showed that confusion can be approximated by well-known econometrics functions.� 2006 Elsevier Inc. All rights reserved.
Keywords: Statistical cryptography; Confusion metric
1. Introduction
The majority of symmetric ciphers are based on the product encryption [1] concept, i.e. the cascadedarrangement of weak encryption transformations, in order to attain a strong cipher. Research on the analysisand assessment of the cryptographic strength of a product cipher has followed both theoretical and empiricalavenues. Theoretical approaches on cipher design include the provable security paradigm [2] and the randomoracle model [3,4] which mainly focus on the study of the computational indistinguishability aspects of a cryp-tographic primitive [5].
On the other hand, empirical or statistical approaches mainly stem from the concepts of the confusion anddiffusion, as originally defined by Shannon [1]. Statistical tests in particular relate to assessing the randomnesscapabilities of cryptographic random bit generators [6–11].
Both approaches exhibit advantages and limitations [12]. The main strength of a theoretic approach is itscontribution to formal and sound design principles which is vital to the discipline of information security onthe long term. However, the theoretic approach may not be applicable in analysing certain proposed cryp-tographic primitives. An indicative case is that of the non-linear feedback shift registers, used to generate
0020-0255/$ - see front matter � 2006 Elsevier Inc. All rights reserved.
doi:10.1016/j.ins.2006.09.017
* Corresponding author.E-mail address: [email protected] (V. Katos).

1790 V. Katos, B. Doherty / Information Sciences 177 (2007) 1789–1795
pseudorandom sequences [13]. The empirical approach in this case would be much faster than the theoretic inproviding an insight on the cryptographic strength of a primitive. Furthermore, a theoretical approach con-tinuously challenges the soundness of the formulations and the definitions of cryptographic tasks (see forexample [14]), whereas the empirical approach is mainly concerned in offering practical security. It is there-fore apparent from the above that a synergetic approach between theoretical and empirical analysis couldcontribute to a more effective research, as one analysis facilitates the other: the theoretical formulates andprovides the necessary sound foundations for empirical research, whereas empirical analysis strengthensintuitiveness.
The purpose of this paper is to propose a framework for analysing the behaviour of cryptographic trans-formations participating in product encryption by modelling the confusion capability of the resulting cipher.Published theoretical findings allow evaluation of the framework’s soundness against widely acceptedprinciples.
This paper is structured as follows. In Section 2 a metric for confusion is presented. In Section 3 a regres-sion analysis for modelling confusion is presented, applied to a weak and a strong primitive. The strength of aprimitive in this context refers to whether the underlying nonlinear transformation behaves in a pseudoran-dom manner. Finally Section 4 presents the conclusions.
2. A measure for confusion
Given an encryption step and a pair of input and output bits, high confusion essentially means that invert-ing an input bit will cause inversion of the output bit with a probability of 0.5. Following common practices inmeasurement theory [15] and practices of adopting software metrics in various domains other than softwaredesign [16], we select the following desirable properties for such a confusion metric mC():
• normalisation: the values of mC() should be in the range [0, 1];• mC() should be equal to 1 in the case of an indistinguishable pseudorandom function primitive. This prop-
erty would yield a more meaningful measurement, by satisfying the representation condition [17], whichrequires that empirical relations which are true in the real world must also hold in the formal world ofthe metric;
• non-coarseness: mC should be less than one in the case of a non-pseudorandom function;• mC() should be zero for a transposition primitive. Again, this relates to satisfying the representation con-
dition, as transposition is a one-to-one mapping between input and output bits, with no inversion of bits,and therefore does not support confusion. However, as a transposition primitive primarily operates on thestructure of a cipher construction, its purpose is to facilitate the application of a strong non-linear primitiveand result to high confusion. That is because the non-linear transformation is applied to a subset of the dataat a time, the transposition would need to re-arrange the subsets in order to give the whole data set theopportunity to accept the non-linear transformation.
In block ciphers there is an input block and an output block of a certain length in bits, so in order to defineone single numerical value to represent confusion, we define the confusion matrix to capture the confusionbetween all input and output bit pairs. The confusion matrix captures the probability of an output bit chang-ing, given that an input bit changes, for all pairs of input and output bits. Furthermore, it is assumed that theinput and output blocks are of the same size, say n bits.
The process for constructing the confusion matrix of an encryption primitive ek() under key k, involvesoperations similar to the bitwise calculations used for the strict avalanche criterion (SAC) investigation[18,19], widely used in s-box design [20]. Given a random plaintext p0 2 UGF(2)n and a nonzero vectora = (100 � � � 0), we compute
wj ¼ ekðp0Þ � ekðp0 � ða� jÞÞ; 0 6 j 6 n� 1 ð1Þ
where (a� j) represents the right shift of a by j bits, ek() is the encryption primitive with key k, p0 is the ran-dom plaintext, n is the size of the input in bits, and � denotes the XOR operation.
V. Katos, B. Doherty / Information Sciences 177 (2007) 1789–1795 1791
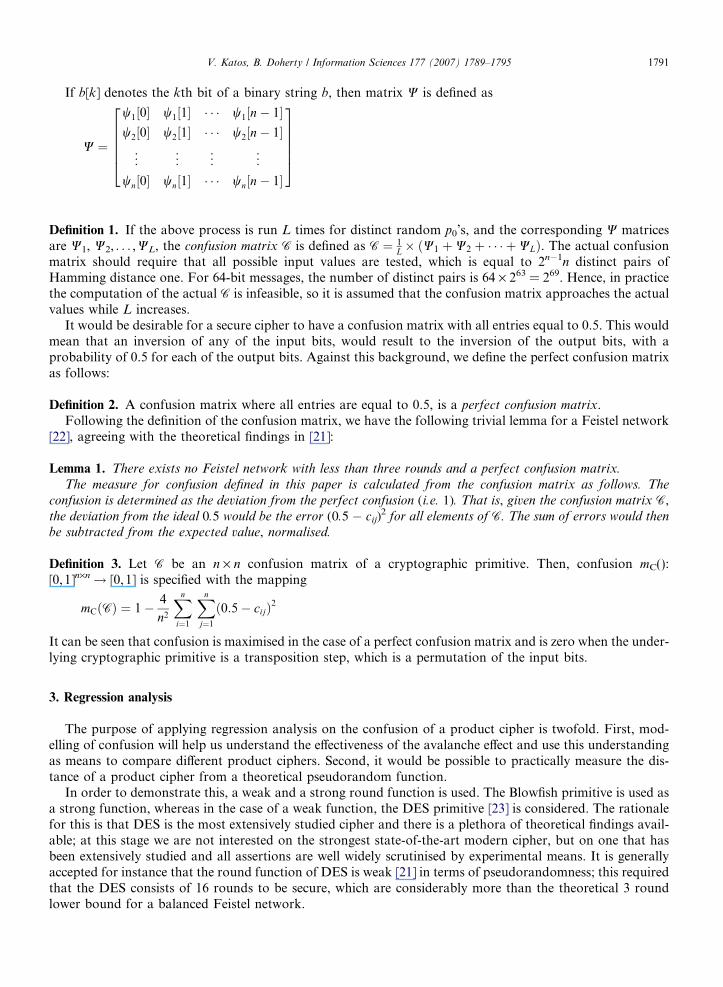
If b[k] denotes the kth bit of a binary string b, then matrix W is defined as
W ¼
w1½0� w1½1� � � � w1½n� 1�w2½0� w2½1� � � � w2½n� 1�
..
. ... ..
. ...
wn½0� wn½1� � � � wn½n� 1�
266664
377775
Definition 1. If the above process is run L times for distinct random p0’s, and the corresponding W matricesare W1, W2, . . . ,WL, the confusion matrix C is defined as C ¼ 1
L� ðW1 þW2 þ � � � þWLÞ. The actual confusionmatrix should require that all possible input values are tested, which is equal to 2n�1n distinct pairs ofHamming distance one. For 64-bit messages, the number of distinct pairs is 64 · 263 = 269. Hence, in practicethe computation of the actual C is infeasible, so it is assumed that the confusion matrix approaches the actualvalues while L increases.
It would be desirable for a secure cipher to have a confusion matrix with all entries equal to 0.5. This wouldmean that an inversion of any of the input bits, would result to the inversion of the output bits, with aprobability of 0.5 for each of the output bits. Against this background, we define the perfect confusion matrixas follows:
Definition 2. A confusion matrix where all entries are equal to 0.5, is a perfect confusion matrix.Following the definition of the confusion matrix, we have the following trivial lemma for a Feistel network
[22], agreeing with the theoretical findings in [21]:
Lemma 1. There exists no Feistel network with less than three rounds and a perfect confusion matrix.
The measure for confusion defined in this paper is calculated from the confusion matrix as follows. The
confusion is determined as the deviation from the perfect confusion (i.e. 1). That is, given the confusion matrix C,
the deviation from the ideal 0.5 would be the error (0.5 � cij)2 for all elements of C. The sum of errors would then
be subtracted from the expected value, normalised.
Definition 3. Let C be an n · n confusion matrix of a cryptographic primitive. Then, confusion mC():[0,1]n·n! [0,1] is specified with the mapping
mCðCÞ ¼ 1� 4
n2
Xn
i¼1
Xn
j¼1
ð0:5� cijÞ2
It can be seen that confusion is maximised in the case of a perfect confusion matrix and is zero when the under-lying cryptographic primitive is a transposition step, which is a permutation of the input bits.
3. Regression analysis
The purpose of applying regression analysis on the confusion of a product cipher is twofold. First, mod-elling of confusion will help us understand the effectiveness of the avalanche effect and use this understandingas means to compare different product ciphers. Second, it would be possible to practically measure the dis-tance of a product cipher from a theoretical pseudorandom function.
In order to demonstrate this, a weak and a strong round function is used. The Blowfish primitive is used asa strong function, whereas in the case of a weak function, the DES primitive [23] is considered. The rationalefor this is that DES is the most extensively studied cipher and there is a plethora of theoretical findings avail-able; at this stage we are not interested on the strongest state-of-the-art modern cipher, but on one that hasbeen extensively studied and all assertions are well widely scrutinised by experimental means. It is generallyaccepted for instance that the round function of DES is weak [21] in terms of pseudorandomness; this requiredthat the DES consists of 16 rounds to be secure, which are considerably more than the theoretical 3 roundlower bound for a balanced Feistel network.

1792 V. Katos, B. Doherty / Information Sciences 177 (2007) 1789–1795
It is expected that in a product cipher every round contributes to the confusion by taking the value from theprevious block and increasing the confusion toward one by its characteristic elasticity [24]. The increment ofconfusion is due to cryptographic composition and the slope of its increment is related to the round functionand the topology of the blocks of bits (elasticity) in which they are combined with the round function. For thecase of the DES encryption step, if yt denotes the confusion after t DES steps, a scatter plot between yt andyt�1 is as shown in Fig. 1. The data set used as well as the process for generating it can be found in [25]. Thedata set involved 8000 samples of DES blocks and the variance ranged from 1.9790 e�6 (for the case of a one-round block) to 8.5010 e�5, indicating that the sample number was adequately high and that the confusionmetric presented is an objective metric, i.e. one could independently perform the operation with an even smal-ler sample and obtain the same values. Nevertheless, the relatively small amount of DES computationsrequired to measure confusion shows that the measurement can be completed in a trivial amount of time.
From the superimposed curve, it can be seen that the relation is not linear. Yet a standard assumption inregression analysis is that a model describing the data is linear [24]. Therefore it is required to apply transfor-mations in order to linearise the data. A number of transformations are available in the literature and could betested against the experimental data in order to establish which of the functions fits better to these data. Thesetransformations are used extensively in econometrics [24]; several alternatives are presented in Table 1, wherefor each function, the transformation which linearises it is also shown.
An ordinary least squares estimation was performed for all functions of Table 1 using the confusion valuesfor different number of steps and the results are summarised in Table 2. It should be noted that all logarithmswere on base e and that y = yt and x = yt�1.
The quantity R2 is the coefficient of determination, which is a measure of ‘‘goodness of fit’’ and measuresthe proportion or percentage of the total variation in the dependent variable explained by the regression model[26].
0
0.1
0.4
0.5
0.6
0.7
0.8
0.9
1.0
0.2
0.3
0.1 0.2 0.3 0.4 0.5 0.6 0.7 0.8 0.9 1.0
yt–1
yt
Fig. 1. Scatter plot of yt against yt�1 for 1 6 t 6 16 for the DES encryption step.
Table 1Linearisable functions with corresponding transformations (source: [24])
Function Transformation Linear form
y = axb y0 = logy, x 0 = logx y0 = loga + bx 0
y = aebx y0 = lny y0 = lna + bx
y = a + blogx x 0 = logx y = a + bx 0
y ¼ xax�b y0 ¼ 1
y ; x0 ¼ 1
x y0 = a � bx 0
y ¼ eaþbx
1þeaþbx y0 ¼ lnð y1�yÞ y0 = a + bx
Note: y 0 denotes the linear transformation of y.

Table 2Ordinary least squares estimation of the DES encryption step
Function a b R2a Probability
a b
yt ¼ aybt�1 1.01 0.37675 0.98588 0.290 0.000
yt ¼ aebyt�1 2.62 0.98756 0.82209 0.000 0.000yt = a + blogyt�1 1.0022 0.22471 0.99705 0.000 0.000yt ¼
yt�1
ayt�1�b 0.90405 �0.10593 0.99581 0.000 0.000
yt ¼ eaþbyt�1
1þeaþbyt�1�2.2721 11.2593 0.94863 0.005 0.000
a Coefficient of determination.
V. Katos, B. Doherty / Information Sciences 177 (2007) 1789–1795 1793
The probabilities presented on the last two columns of the table were also calculated as part of the linearregression run and present the significance in which the independent variable influences the dependent vari-able. More analytically, for every coefficient the probability presents whether the underlying coefficient passedthe hypothesis test of being equal to zero (t test):
H0: b = 0: the corresponding independent variable does not explain some of the variation of the dependentvariable [p > 0.05].Ha: b 5 0: the corresponding independent variable explains some of the variation of the dependent variable[p < 0.05].
In terms of interpretation, if the probability is less than 0.05, the coefficient of the underlying independentvariable is not zero and thus influences the dependent variable. In the opposite case, when the probability isgreater than 0.05, the independent variable does not influence the dependent variable and should be excludedfrom the model. Therefore the objective in a regression analysis is to obtain high R2 and zero – or less than0.05 – probabilities.
From the above results it could be seen that yt = a + blogyt�1 provided the best fit, since this model wouldbe capable of explaining 99.7% of the experimental data. The remaining functions were also good candidatesfor modelling the confusion, since the probabilities were low or zero. Although the probability for the firstequation (yt ¼ ayb
t�1) was high (29%), it remains a good candidate since that probability refers to the constant.The relations derived for DES and general Feistel networks show ability to estimate confusion. Being able
to do so, we can determine that the elasticity of the DES transformation is higher than that from a pseudo-random function, which was expected, as the latter would be able to reach maximum confusion with only threerounds. More specifically, assuming that a strong function of one, two and three rounds would yield a confu-sion of 0.25, 0.75 and 1 respectively, a regression run would give b = 0.175 resulting to a steeper curve that theone in Fig. 1. For a weaker function, this coefficient would be higher, suggesting that more rounds are neededto reach maximum confusion.
The same process is repeated for a strong round function, the Blowfish encryption step [27] and the resultsare summarised in Table 3. The same sample size as in the case of the DES encryption step was used and thevariance was maintained at a low level (order of e�5). Indeed the b coefficient of the logarithmic model is closer
Table 3Ordinary least squares estimation of the Blowfish encryption step
Function a b R2 Probability
a b
yt ¼ aybt�1 1.00 0.20568 0.96150 0.458 0.000
yt ¼ aebyt�1 0.70 0.35949 0.90098 0.000 0.000yt = a + blogyt�1 1.0027 0.17826 0.96227 0.000 0.000yt ¼
yt�1
ayt�1�b 0.88499 �0.11286 0.98964 0.000 0.000
yt ¼ eaþbyt�1
1þeaþbyt�1�1.9548 11.0766 0.98428 0.000 0.000

1794 V. Katos, B. Doherty / Information Sciences 177 (2007) 1789–1795
to 0.175. However, yt ¼yt�1
ayt�1�b is a better fit, since this function has R2 = 0.98964. A regression analysis per-formed on the theoretical pseudorandom function described above, gave b = �0.111, confirming that Blow-fish is consistently close to a pseudorandom function (with b = �0.11286) from a statistical perspective.
4. Conclusions and areas for further research
We described a method on modelling confusion by running regression analysis on a confusion metric alsoproposed in this paper. The regression analysis approach described in this paper was limited in the study ofhomogeneous product ciphers, i.e. where the encryption step remained the same. Although the describedapproach could be extended in modelling the confusion of product ciphers with different encryption steps,it is expected that the coefficient of determination R2 would not be as high and therefore the inclusion of addi-tional metrics in the modelling functions is an area of investigation.
The main advantage of modelling of confusion by statistical means is that it can be applied to any blockcipher-based encryption primitive, without requiring any formal proof. In turn, this would allow investigationof the behaviour of a bigger family of product ciphers, including heterogeneous product ciphers. In addition,provably secure constructions could also be considered to act as reference points or benchmarks for assessingthe strength of the primitive(s) in question in the context of confusion. Conversely, the practical behaviour ofnew theoretical paradigms (such as the integral encryption step introduced in [28]) could also be validated withthe proposed method.
The mapping involved in the definition of the metric involves extraction from the confusion matrix alsodescribed in this paper. The confusion matrix contains further information which is not maintained in the met-ric. For example, the diffusion ability of the encryption step can be easily extracted from the confusion matrix.This could help in further improving the regression analysis results mentioned above.
References
[1] C.E. Shannon, Communication theory of secrecy systems, Bell System Technical Journal 28 (4) (1949) 656–715.[2] L. Kissner, D. Molnar, Provably Secure Subsitution of Cryptographic Tools, Cryptology ePrint Archive: Report 2006/004, IACR
(2006).[3] M. Bellare, P. Rogaway, random oracles are practical: a paradigm for designing efficient protocols, in: Proceedings 1st Conference on
Computer and Communications Security, ACM, 1992, pp. 62–73.[4] R. Canetti, O. Goldreich, S. Halevi, The random oracle methodology, revisited, Journal of the ACM 51 (4) (2004) 557–594.[5] O. Goldreich, Modern Cryptography, Probabilistic Proofs and Pseudorandomness, Springer-Verlag, Berlin, 1999.[6] D. Knuth, The Art of Computer Programming II: Seminumerical Algorithms, third ed., Addison Wesley, Reading Massachusets,
1997.[7] M. Maurer, A universal statistical test for random bit generators, Journal of Cryptology 5 (2) (1992) 89–105.[8] A. Rukhin, A statistical test suite for the validation of random number generators and pseudo random number generators for
cryptographic applications, NIST Special Publication (2001) 800–822.[9] A. Brands, R. Gill, Cryptography, statistics and pseudo-randomness, II, Probability and Mathematical Statistics 16 (1996) 1–17.
[10] G. Marsaglia, A. Zaman, A new class of random number generators, Annals of Applied Probability 1 (1991) 462–480.[11] R. Gennaro, Randomness in cryptography, IEEE Security and Privacy 4 (2) (2006) 64–67.[12] A. Dent, Fundamental Problems in Provable Security and Cryptography, Cryptology ePrint Archive: Report 2006/278, IACR,
2006.[13] A. Menezes, P. van Oorschot, S. Vanstone, Handbook of Applied Cryptography, CRC Press, 1996.[14] A. Joux, S. Kunz-Jacques, F. Muller, P.M. Ricordel, Cryptanalysis of the Tractable Rational Map Cryptosystem, in: Lecture Notes in
Computer Science, LNCS, vol. 3386, Springer, Berlin, 2005, pp. 258–274.[15] S.R. Chidamber, C.F. Kemerer, A metrics suite for object oriented design, IEEE Transactions on Software Engineering 20 (6) (1994)
476–493.[16] A. Janesa, M. Scottob, W. Pedryczc, B. Russoa, M. Stefanovicc, G. Succi, Identification of defect-prone classes in telecommunication
software systems using design metrics, Information Sciences 176 (24) (2006) 3711–3734.[17] N. Fenton, S.N. Pfleger, Software Metrics: A Rigorous and Practical Approach, 2nd ed., International Thomson Computer Press,
1997.[18] A. Webster, S. Tavares, in: H. Williams (Ed.), On the design of S-boxes, Crypto’85 LNCS, vol. 218, Springer, Berlin Heidelberg New
York, 1986, pp. 523–534.[19] T. Cusick, Y. Li, k-th Order symmetric sac boolean functions and bisecting binomial coefficients, Discrete Applied Mathematics 149
(2005) 73–86.

V. Katos, B. Doherty / Information Sciences 177 (2007) 1789–1795 1795
[20] C. Adams, Designing Against the Overdefined System of Equations Attack, Cryptology ePrint Archive: Report 2004/110, 2004.[21] M. Luby, C. Rackoff, Pseudo-random permutation generators and cryptographic composition, Proceedings 18th Annual Symposium
on Theory of Computing 28–30 (1986) 356–363.[22] H. Feistel, W. Notz, J. Smith, Some cryptographic techniques for machine-to-machine data communications, Proceedings of the
IEEE 63 (11) (1975) 1545–1554.[23] Federal Information Processing Standards, The Data Encryption Standard, FIPS Publication 46-2, 1993.[24] S. Chatterjee, B. Price, Regression Analysis by Example, Wiley, 1977.[25] V. Katos, Product cipher negotiation with on-line evaluation for private communication over computer networks, Ph.D. Thesis,
Aston University, 2000.[26] D. Gujarati, Basic Econometrics, McGraw-Hill.[27] B. Schneier, Description of a new variable-length key, 64-bit block cipher (blowfish), Fast Software Encryption (1993) 191–204.[28] S. Li, Y. Wang, Exploiting randomness on continuous sets, Information Sciences (2006), doi:10.1016/j.ins.2006.07.020.