Effect of Fractured Aggregate Particles on Linear Stress Ratio ...
Upload
independentCategory
view
1download
0
1
PAPER 2004-229
Experimental and Simulation Analysis of Fractured Reservoir Experiencing Different
Stress Conditions V. Muralidharan, E. Putra, D. S. Schechter
Texas A&M University, USA
This paper is to be presented at the Petroleum Society’s 5th Canadian International Petroleum Conference (55th Annual Technical Meeting), Calgary, Alberta, Canada, June 8 – 10, 2004. Discussion of this paper is invited and may be presented at the meeting if filed in writing with the technical program chairman prior to the conclusion of the meeting. This paper and any discussion filed will be considered for publication in Petroleum Society journals. Publication rights are reserved. This is a pre-print and subject to correction.
ABSTRACT
Flow through the fracture is usually estimated by cubic law,
which assumes flow to occur between two parallel plates. The
cubic law is valid to represent the flow through the fracture
system if the matrix permeability is very low to provide any
significant flow contribution. However, in high permeability
rocks, the flow occurs through both fracture and matrix
systems. Flow through matrix may sometimes exceed that
through the fractures under increased stress acting on the
reservoirs. Under these circumstances, the cubic law should be
modified by combining the weighted average of the
permeabilities in order to account for flow through matrix. In
this paper we present the amount of flow through fracture and
matrix system based on modified cubic law equations by
conducting a series of laboratory experiments on fractured
cores under different stress conditions. The flow rate through
fracture and matrix system and the pressure drop were matched
using simulation. X-ray CT was used to determine the fracture
aperture and saturation distributions. In addition, the
saturation distributions from simulation results were compared
to X-ray CT Scan results.
INTRODUCTION
The first comprehensive work on flow through open
fractures was done by Lomize1, in which he used parallel glass
plates and demonstrated the validity of cubic law for laminar
flow. He modeled fluid flow with different fracture shapes and
investigated the effects of changing the fracture walls from
smooth to rough. Later, comprehensive fluid flow studies were
conducted through a single fracture to investigate the validity of
cubic law2,3. Idealized fracture models were constructed by
PETROLEUM SOCIETY �������������������� ������� ��������������� �

2
assuming that the fracture planes had contact area and
roughness.
The flow in a fracture is usually characterized by the
classical cubic law equation4
���
�
���
� ∆×=
µL
PwdQ
361011.5 ..................................................................(1)
This equation neglects the matrix permeability compared to the
fracture permeability. As a result, the classical cubic law does
not account for any flow occurring through the matrix and
assumes that the flow occurs entirely through the fracture. This
assumption holds for low permeability reservoirs. However, in
high permeability reservoirs the classical cubic law is no longer
valid and has to be modified by considering the effect of matrix
permeability5. Flow might also be diverted from the fracture to
matrix due to the decrease in the fracture aperture size with the
increase in the stress conditions6.
The cubic law equation is valid only for steady-state
laminar flow between two parallel plates. This equation
assumes that the walls of the fracture are smooth. Witherspoon
et al.4 conducted laboratory experiments to validate parallel
plate theory and they showed that the parallel plate
approximation tends to break down at higher normal stress (>10
MPa) across the fracture. Alfred5 also confirmed that parallel
plate assumption is not valid to adequately model the fluid flow
experiments when overburden pressure is significant. The flow
in a single fracture does not progress uniformly as assumed by
parallel plate theory; rather, it flows through a limited number
of channels7,8,9. Several authors7,9,10 measured fracture aperture
directly without any applied stresses and found that fracture
apertures follow log-normal distribution. Muralidharan11 et al.
extended the previous work12,13 by measuring fracture aperture
under different stresses using X-ray CT scanner and found that
the fracture apertures still follow lognormal distribution for all
stress conditions.
In this study, we performed fluid flow experiments on
homogeneous and fractured cores with different overburden
pressures and injection rates. The objectives are to obtain mean
fracture aperture and to measure fluid flow through matrix and
fracture under different overburden pressures. In order to obtain
fracture apertures from these experiments, we derived analytical
equations by combining cubic law and weighted average of the
permeabilities. Once the mean fracture apertures were obtained,
we then used them to calculate the fluid flow through matrix
and fracture. The mean fracture apertures were distributed for
each overburden pressure using log normal distributions
following our previous results11. These aperture distributions
and the matrix permeability calculated from the experiments
were used as input data while, the pressure drop measured from
the experiments and the flow rates through matrix and fracture
calculated from the experiments were used as observed data for
our simulation modeling.
Once a match between simulation result and experimental
data was obtained, we also compared the simulation result with
parallel plate model to prove that the parallel plate model is not
valid for modeling fluid flow through rough surface. The
parallel plate model has only mean fracture aperture without
distributing the apertures on the fracture surface. In addition we
validated our approach using our distributed aperture model on
gravity drainage experiments. We used a fourth generation X-
ray CT scanner to obtain saturation distribution during fluid
flow in the core and matched the fluid flow profile and average
water saturations.
EXPERIMENTAL PROCEDURE
Synthetic brine was used in the experiments. The brine
contains NaCl and CaCl2.H2O mixed with distilled water. The
clean core was saturated with brine then it was inserted into a
Hassler-type core holder using a confining pressure of 500 psia.
Then, core flooding was performed with different injection
rates. After running set of injection rates at this pressure, we
changed to other confining pressures and performed with
different injection rates again. Similar procedure was performed
using fractured core. The experimental set up is shown in Fig. 1.
Berea core was used during the core flooding experiments.
The core properties are given in Table 1. Injection rates ranging
from 5 cm3/min to 20 cm3/min were performed at each
overburden pressure. Three different overburden pressures (500
to 1500 psia) were applied for both unfractured and fractured
core. The core was cut using a hydraulic cutter to generate
fracture horizontally along the axis of the core.
ANALYTICAL EQUATIONS
When water was injected through homogeneous core at
fully water saturated matrix and at steady state conditions, we
obtained pressure difference between injecting and producing

3
ends. According to Darcy’s law, matrix permeability can be
calculated by:
PA
QL
mk
∆=
µ.......................................................................................(2)
When water was injected through the fractured core, we
obtained the average pressure difference due to the presence of
fracture. According to Darcy’s law, average permeability in the
fractured core can be calculated by:
avgPA
QL
avgk
∆=
µ...............................................................................(3)
Tables 2 and 3 show the results obtained from experiments
with unfractured and fractured cores and the calculated
permeability values. Fig. 2 shows that the effect of varying
overburden pressures on unfractured core is not significant in
contrast with that effect on fractured core. The average
permeability of fractured core reduces significantly and is
almost similar to permeability of unfractured core at 1500 psia.
The result suggests that the effect of stresses may be most
pronounced in fractured reservoirs where large pressure changes
can cause significant changes in fracture aperture and the
related changes in conductivity within a reservoir.
From experimental analysis, we obtained matrix and
average permeabilities as discussed previously. The fracture
permeability, kf, obtained from the parallel plate model is given
below4,
291045.8 w
fk ×= ......................................................................... (4)
Fracture width is a function of fracture permeability, but
both parameters are unknown. To obtain those parameters,
another equation is needed. By the concept of parallel flow, we
obtained the equation for total flow rate (or injection rate) as
follows:
mQ
fQQ += .................................................................................. (5)
Since the flow rates were measured at steady state conditions,
the pressure drop in the matrix and fracture would be the same.
Thus, the above equation can be simplified to weighted average
permeabilities as follows,
mA
mk
fA
fkA
avgk += ............................................................. (6)
In this equation A represents total area of the core, f
A
represents area of the fracture which is equal to wd , and m
A
represents area of the matrix which is equal to wdA − . In the
parallel plate assumption, km is assumed to be zero; therefore
the fracture permeability is the same as the average permeability
in a fractured core. But, due to high matrix permeability the
weighted average permeabilities should be combined with cubic
law equation to represent the fluid flow in a fractured reservoir.
By rearranging the above equation we obtain an expression for
calculating fracture permeability, kf as given below:
wd
wdAm
kAavg
k
fk
)( −−= .......................................................... (7)
Now, we have two equations and two unknowns. So, combining
Eqs. 4 and 7, we arrive at an equation as given below:
0)(39
1045.8 =−+−× wdAm
kAavg
kdw ............................... (8)
The above equation can be solved iteratively to obtain fracture
width. Once the fracture width is obtained, the fracture
permeability can be calculated either using Eqs. 4 or 7.
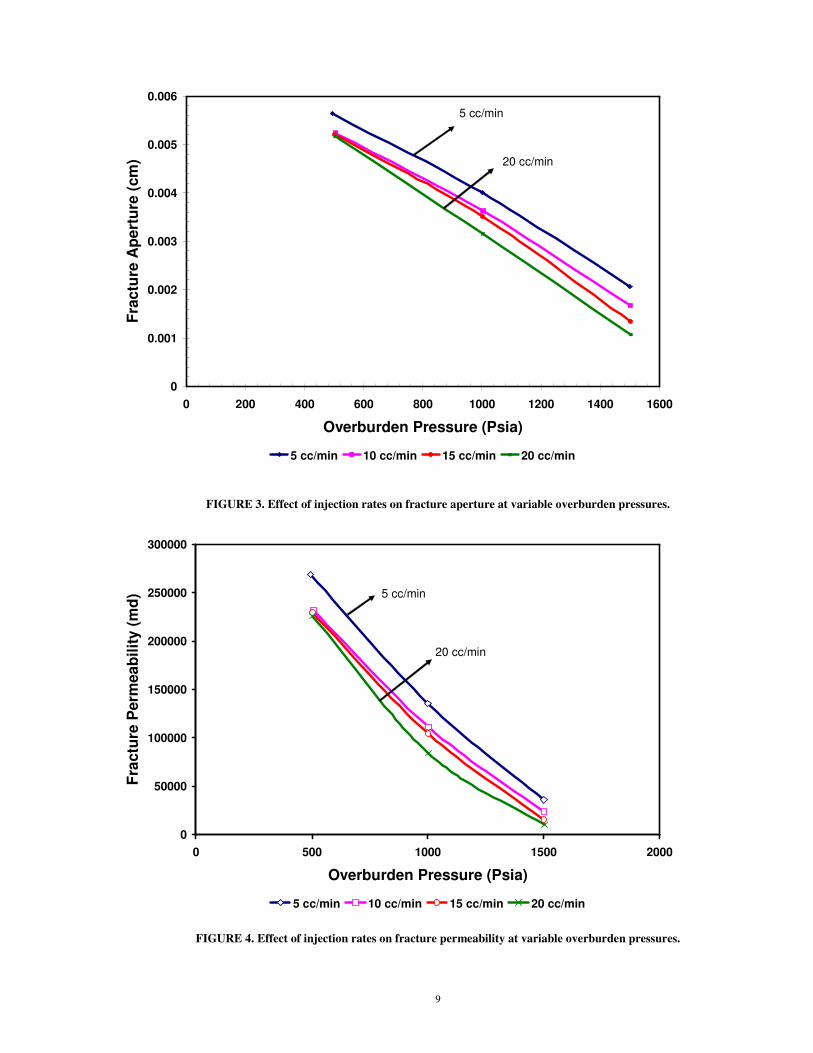
Fig. 3 shows the variation of mean aperture size with
various overburden pressures and injection rates. The effect of
several injection rates on the matrix permeability is not
significant, in contrast with the effect of overburden pressures
on mean fracture aperture. The average mean fracture aperture
decreases about 71% from its original value when the
overburden pressure changes from 500 psia to 1500 psia. We
can see the effect of hysteresis on fracture aperture for various
injection rates. At higher injection rates, the pressure drop
becomes higher through the matrix and increases the tendency
to squeeze the fracture aperture. Hence, the fracture aperture
becomes smaller at higher injection rates. Fig. 4 shows the
variation of mean fracture permeability with various overburden
pressures and injection rates. During the constant injection rates
of 5 to 20 cm3/min, the average fracture permeability decreases
about 91% at the overburden pressure of 1,500 psia from its

4
original value at 500 psia. The trend of fracture permeability
with overburden pressure is the same for all injection rates.
It is also important to determine the flow rate through
matrix (Qm) and fracture (Qf). We determine the flowrate from
each zone by applying Darcy’s equations. The equation for flow
rate in the matrix is given below:
L
avgPA
mk
mQ
µ
∆= ............................................................................(9)
The flow through a smooth conduit can be expressed by
involving the fracture width (w) and the pressure gradient
( avgp∆ ) as given below:
L
avgpdw
fqµ12
3
91086.9
1 ∆
−×
= ��
�
� .............................. (10)
Fig. 5 shows the trend of fracture flowrate with the change
in overburden pressure. The fracture flowrate decreases with the
increase in overburden pressure. For example, the fracture
flowrate at 500 psi overburden pressure and at 5 cm3/min
injection rate is about 4 cm3/min. This means around 80% of the
flow is through the fractures due to its high permeability. The
amount of flow at different injection rates through the fracture
drops dramatically and they flow almost at similar rate at
confining pressure of 1,500 psi (about 1 cm3/min). This means
that most of the water flows through the matrix, diverting from
the fracture path (Fig. 6). Even though the fracture permeability
is still very high (10 to 40 Darcy), the volumetric rate of
fracture becomes limited. Most of the water flows through the
matrix rock of less permeability (200 md). The reduction of the
fracture permeability clearly has significant effects on reservoir
productivity.
PARALLEL PLATE SIMULATION MODEL
A numerical model utilizing a commercial simulator
(CMGTM) was used to study the fluid flow through fracture at
different overburden pressures. The laboratory process in which
the water was injected through the fracture was duplicated in
this modeling effort using the parallel plate assumption.
Rectangular grid block was applied to overcome the difficulty
of modeling a cylindrical core shape14. The mean fracture
aperture and mean fracture permeability obtained from
analytical solution were treated as constant value in all the grid
blocks. 10x10x15 grid blocks were used for the simulation
model as shown in Fig. 7. An injector was placed in the fracture
block from which water was injected and producers are placed
in fracture and matrix blocks from where the water was
produced (Fig. 8).
Fig. 9 shows the fluid movement through fracture surface
using parallel plate model for 5 cm3/min injection rate under
various overburden pressures. The fluid flows uniformly in each
grid blocks. As a result the flowrate through matrix and fracture
(Fig. 10) and pressure drop were different between observed
data and simulation results (Fig. 11). The simulated fracture rate
is higher compared to the observed fracture flowrate due to
constant fracture permeability in the grid blocks simulation
model.
DISTRIBUTED SIMULATION MODEL
The distributed simulation model was constructed with the
same number of grid blocks and sizes. The fracture apertures in
the fracture layer were distributed in a lognormal distribution
for various stress conditions found in our earlier study11. The
frequency of the log-normal distribution is written as follows15:
]22
2)(ln
exp[2
2
1)(
β
α
πβ
−−=
x
xxf ..........................................(11)
where,
)2
21ln(
2
δ
σβ += ............................................................................(12)
and
2
2ln
βδα −= ................................................................................(13)
The fracture apertures were then converted to fracture
permeability using the relation between aperture and
permeability (Eq. 4). The aperture maps for the fracture layer
were then constructed for each overburden pressure by
generating lognormal fracture apertures using the mean fracture
aperture obtained from analytical solution.
The relationship between mean and variance of apertures
was derived from the previous paper11. The values of mean
apertures obtained from analytical solution were 56.15, 40.4 and
20.57 microns for 500, 1000 and 1500 psi, respectively. The

5
corresponding values of variance were 9417.8, 5934.8 and
1296.9. We can see that the variance decreases as the mean
aperture decreases. The variance in the parallel plate model is
zero; therefore there is no preferential path for the fluid. The
fluid flows in a block type pattern resulting in more flow that
what was observed. If the fracture apertures are distributed then
variable apertures control the fluid flow in the fracture. The
fluid flows to the path of least resistance and interconnected
large apertures. The smaller apertures has less volumetric rate,
which cause barrier for fluid flow through fracture. Thus, the
fluid diverts to the matrix blocks. Since the fluid flow follows
the preferred path following the actual flow through the rough
surfaces then the rate of fluid through fracture and matrix
blocks (Fig. 12) and the pressure drop can be matched
adequately with the experimental results Fig. 13.
GRAVITY DRAINAGE EXPERIMENT
Gravity drainage experiment was performed using a fourth
generation X-ray CT scanner to differentiate the fluid flow
through parallel plate and distributed aperture models. Water
was injected on top of a fractured core at a rate of 0.5 cm3/min.
Cross-sectional scans were taken from 0 to 12 minutes as shown
in Fig. 14. The first five scans were taken at 0.5 min interval,
next four scans at 1 min interval and the last three scans at 2
min interval.
Using parallel plate simulation model the fluid flow
profiles were not able to match the profile from CT scan results
(Fig. 14). The fluid in this model falls rapidly due to high single
fracture permeability. As a result, average water saturation also
did not adequately represent the CT result (Fig. 15). Using
distributed aperture model in which the apertures were
distributed in a lognormal distribution using Eq. 11, the fluid
flow profiles match the CT scan profiles (Fig. 16). A good
agreement of average water saturation was also shown between
observed data and simulated results (Fig. 17).
CONCLUSION
1. Cubic law has to be modified by combining with the
weighted average of permeabilities to account for the
flow through the matrix for high permeability
fractured reservoirs.
2. Parallel plate assumption with a single fracture
aperture is no valid for modeling fluid flow through
fractured reservoirs.
3. Distributed fracture aperture model adequately
represents the fluid flow behavior in fractured
reservoirs.
ACKNOWLEDGEMENT
The authors wish to thank U. S. Department of Energy (US
DOE) for sponsoring this project.
NOMENCLATURE
A = Area of core, cm2 A f = Area of fracture, cm2 A m = Area of matrix, cm2 d = Core diameter, cm
)(xf = Frequency of apertures
avgk = Average permeability in fractured core, md
mk = Matrix permeability, md
fk = Fracture permeability, md
L = Core length, cm Q = Injection rate, cm3/min
fQ = Flowrate through fracture, cm3/min
mQ = Flowrate through matrix, cm3/min
w = Mean fracture aperture, cm x = Fracture aperture
P∆ = Pressure drop, psia
avgP∆ = Av. pressure drop in fractured core, psia
Greek Letters
α = Lognormal mean
β = Lognormal standard deviation
δ = Mean of the aperture sizes
µ = Viscosity of Brine, cp σ = Standard deviation
REFERENCES
1. Lomize, G. M., Seepage in Fissured Rocks; State Press, Moskow-Leningrad, 1951.
2. Iwai, K., Fundamental Studies of Fluid Flow Through a Single Fracture; Ph. D. Thesis, Univ. of Calif. Berkeley, 1976.
6
3. Neuzil, C. E., and Tracy. J. V., Flow Through Fractures; Water Resources Research, 16 (6), 1016-1024, 1980.
4. Witherspoon, P. A., Wang, J. S. Y., Iwai, K., and Gale, J. E., Validity of Cubic Law for Fluid Flow in a Deformable Rock Fracture; Water Resources Research, 16(6), 1016-1024, 1980.
5. Alfred, D., Modeling Fluid Flow Through a Single Fracture Using Experimental, Stochastic and Simulation Approaches; master’s thesis, Texas A&M University, 2003.
6. Putra, E., Muralidharan, V., and Schechter, D.S., Overburden Pressure Affects Fracture Aperture and Fracture Permeability in a Fracture Reservoir; Saudi Aramco Journal of Technology, Fall 2003.
7. Pyrak, L. R., Myer, L. R., and Cook, N. G. W., Determination of Fracture Void Geometry and Contact Area at Different Effective Stress; Eos Trans. AGU (abstract), 66(46), 903, 1985.
8. Tsang, Y. W., The Effect of Tortuosity on Fluid Flow Through a Single Fracture; Water Resources Research, 20(9), 1209-1215, 1984.
9. Tsang, Y. W., and Witherspoon, P. A., The Dependence of Fracture Mechanical and Fluid Properties on Fracture Roughness and Sample Size; J. Geophys. Res., 88(B3), 2359-2366, 1983.
10. Tsang, Y. W. and Tsang, C. F., Hydrological Characterization of Variable-Aperture Fractures; Rock Joints, Barton & Stephansson (eds), Balkema, Rotterdam, 1990.
11. Muralidharan, V., Putra, E., and Schechter, D.S., Investigating Fracture Aperture Distributions under Various Stress Conditions Using X-Ray CT Scanner; Canadian International Petroleum Conference to be held in Calgary, Canada, June 2004.
12. Keller, A. A., Single and multiphase flow and transport in fractured porous media; PhD thesis, Stanford University (1996).
13. Keller, A.A., High Resolution CAT Imaging of Fractures in Consolidated Materials; Int. J. Rock Mech. Min. Sci. (1997), 34 (3/4), 358-375.
14. Putra, E., Fidra, Y., and Schechter, D.S., Study of Waterflooding Process in Naturally Fractured Reservoirs from Static and Dynamic Imbibition Experiments; paper SCA 9910 presented at the 1999 International Symposium of the Society of Core Analysts, Colorado, 1-4 August.
15. Alfred, D., Putra, E., and Schechter, D.S., Modeling Fluid Flow through Single Fractures Using Experimental, Stochastic and Simulation Approaches; paper SPE/DOE 89442 will be presented at 2004 Improved Oil Recovery Symposium, OK, Tulsa, 17–21April.

7
20216.522.71502.3
1521317.31501.3
10219.411.21501
5223.45.51500.3
20222.422.11503.1
15224.716.41500.7
10236.310.41500
5240.85.11500
20255.9619.21004.1
15254.214.51002.7
10253.39.71003.5
5255.94.81000.2
2027018.21000.5
1526913.71000.5
1027391002.4
52734.51000.4
20289.117502
1528313501
102898.5504.9
5292.54.2501
20297.8516.5504.4
15297.212.4502.9
10303.48.1506.4
5299.74.1485.7
Cm3/mmdpsiapsia
QkmDpPob
TABLE 2. Experimental observations for unfractured core.
Length 4.9784 Cm Diameter 2.5146 CmViscosity 1.0 CpArea 10.9637 Cm2
Porosity 23.58%
Berea Core Properties
TABLE 1. Berea core properties.
20218.422.51509.6
15211.817.41509.6
10225.410.91506
5245.751500.7
20229.621.41504.8
15244.115.11507.9
10268.29.31504.6
5292.54.21500.3
20353.613.91002.7
154059.11009.7
10423.65.81002.2
55342.31000.8
20434.911.31016.7
154857.61001
10511.94.81000.5
5558.42.2970.5
20847.35.8509.6
15877.64.2508.8
10945.12.6509.4
51228.71494.8
209105.4503.3
15898.94.1503.3
10877.62.8500.2
5877.51.4501.3
Cm3/minmdpsiapsia
QkavDpPob
TABLE 3. Experimental observations for fractured core.

8
CORE HOLDER
PERMEAMETER
HYDRAULIC JACK
Matrix L=4.98 Cm
A=4.96
Fracture
Graduated Cylinder
Accumulator 1 Accumulator 2
PUMP 1 PUMP 1
Graduated Cylinder
BLACK
RED
FIGURE 1. Schematic diagram of the core flooding experiment.
0
200
400
600
800
1000
1200
1400
0 200 400 600 800 1000 1200 1400 1600 1800 2000
Overburden Pressure (Psia)
Per
mea
bilit
y (m
d)
Unfractured Core Fractured Core Expon. (Fractured Core) Expon. (Unfractured Core)
FIGURE 2. Comparison permeability reduction between unfractured and fractured cores due to increasing overburden pressures.
9
FIGURE 3. Effect of injection rates on fracture aperture at variable overburden pressures.
FIGURE 4. Effect of injection rates on fracture permeability at variable overburden pressures.
0
50000
100000
150000
200000
250000
300000
0 500 1000 1500 2000
Overburden Pressure (Psia)
Frac
ture
Per
mea
bilit
y (m
d)
5 cc/min 10 cc/min 15 cc/min 20 cc/min
5 cc/min
20 cc/min
0
0.001
0.002
0.003
0.004
0.005
0.006
0 200 400 600 800 1000 1200 1400 1600
Overburden Pressure (Psia)
Frac
ture
Ape
rtur
e (c
m)
5 cc/min 10 cc/min 15 cc/min 20 cc/min
5 cc/min
20 cc/min

10
FIGURE 5. Effect of overburden pressures on fracture flowrates.
FIGURE 6. Effect of overburden pressures on matrix flowrates.
0
5
10
15
20
25
0 200 400 600 800 1000 1200 1400 1600
Overburden Pressure (Psia)
Mat
rix
Flow
Rat
e (c
c/m
in)
5 cc/min 10 cc/min 15 cc/min 20 cc/min
5 cc/min
20 cc/min
0.00
2.00
4.00
6.00
8.00
10.00
12.00
14.00
16.00
0 200 400 600 800 1000 1200 1400 1600
Overburden Pressure (Psia)
Frac
ture
Flo
w R
ate
(cc/
min
)
5 cc/min 10 cc/min 15 cc/min 20 cc/min
5 cc/min
20 cc/min

11
FIGURE 7. Water saturation change in matrix and fracture at transient flow condition.
FIGURE 8. Simulation model showing injector and producers.
FIGURE 9. Flow through fracture surface in parallel plate model.

12
�����������
��� ���
�����������
� �����
FIGURE 10. The simulation results of matrix and fracture flowrate at 5 cc/min injection rate under various overburden pressures.
FIGURE 11. The simulation results of matrix and fracture flowrate at 5 cc/min injection rate under various overburden
pressures.

13
�����������
��� ���
�����������
� �����
FIGURE 12. The simulation results of matrix and fracture flowrate at 5 cc/min injection rate under various overburden
pressures using distributed simulation model.
FIGURE 13. The simulation results of observed and simulated pressure drop using distributed model at 5 cc/min injection rate
under various overburden pressures.

14
FIGURE 14. Modeling the water saturation profile using parallel plate simulation model.
FIGURE 15. Match of average water saturation using parallel plate simulation model.

15
FIGURE 16. Modeling the water saturation profile using distributed simulation model.
FIGURE 17. Match of average water saturation using distributed simulation model.
Copyright © 2022 FDOKUMEN